face recognition performance: role of demographic...
TRANSCRIPT

To appear: IEEE Transactions on Information Forensics and Security
Face Recognition Performance: Role ofDemographic Information
Brendan F. Klare, Member, IEEE, Mark J. Burge, Senior Member, IEEE, Joshua C. Klontz,Richard W. Vorder Bruegge, Member, IEEE, and Anil K. Jain, Fellow, IEEE
Abstract—This paper studies the influence of demographicson the performance of face recognition algorithms. The recog-nition accuracies of six different face recognition algorithms(three commercial, two non-trainable, and one trainable) arecomputed on a large scale gallery that is partitioned so thateach partition consists entirely of specific demographic cohorts.Eight total cohorts are isolated based on gender (male andfemale), race/ethnicity (Black, White, and Hispanic), and agegroup (18 to 30, 30 to 50, and 50 to 70 years old). Experimentalresults demonstrate that both commercial and the non-trainablealgorithms consistently have matching accuracies on the samecohorts (females, Blacks, and age group 18 to 30) than the remain-ing cohorts within their demographic. Additional experimentsinvestigate the impact of the demographic distribution in thetraining set on the performance of a trainable face recognitionalgorithm. We show that the matching accuracy for race/ethnicityand age cohorts can be improved by training exclusively on thatspecific cohort. Operationally, this leads to a scenario, calleddynamic face matcher selection, where multiple face recognitionalgorithms (each trained on different demographic cohorts), areavailable for a biometric system operator to select based on thedemographic information extracted from a probe image. Thisprocedure should lead to improved face recognition accuracy inmany intelligence and law enforcement face recognition scenarios.Finally, we show that an alternative to dynamic face matcherselection is to train face recognition algorithms on datasets thatare evenly distributed across demographics, as this approachoffers consistently high accuracy across all cohorts.
Index Terms—face recognition, demographics, race/ethnicity,gender, age, training, dynamic face matcher selection
I. INTRODUCTION
Sources of errors in automated face recognition algorithmsare generally attributed to the well studied variations inpose, illumination, and expression [1], collectively known asPIE. Other factors such as image quality (e.g., resolution,compression, blur), time lapse (facial aging), and occlusionalso contribute to face recognition errors [2]. Previous studieshave also shown within a specific demographic group (e.g.,race/ethnicity, gender, age) that certain cohorts are moresusceptible to errors in the face matching process [3], [4].
Copyright (c) 2012 IEEE. Personal use of this material is permitted.However, permission to use this material for any other purposes must beobtained from the IEEE by sending a request to [email protected].
B.F. Klare is with Noblis, Falls Church, VA, U.S.A.M.J. Burge, and J. Klontz are with The MITRE Corporation, McLean, VA,
U.S.A.R.W. Vorder Bruegge is with the Science and Technology Branch, Federal
Bureau of Investigation, Quantico, VA, U.S.A.A.K. Jain is with the Dept. of Computer Science and Engineering, Michigan
State University, East Lansing, MI, U.S.A., and the Dept. of Brain andCognitive Engineering, Korea University, Seoul, Korea
Approved for Public Release: 11-4962. Distribution Unlimited.
However, there has yet to be a comprehensive study thatinvestigates whether or not we can train face recognitionalgorithms to exploit knowledge regarding the demographiccohort of a probe subject.
This study presents a large scale analysis of face recognitionperformance on three different demographics (see Figure 1):(i) race/ethnicity, (ii) gender, and (iii) age. For each of thesedemographics, we study the performance of six face recogni-tion algorithms belonging to three different types of systems:(i) three commercial off the shelf (COTS) face recognitionsystems (FRS), (ii) face recognition algorithms that do notutilize training data, and (iii) a trainable face recognitionalgorithm. While the COTS FRS algorithms leverage trainingdata, we are not able to re-train these algorithms; instead theyare black box systems that output a measure of similarity be-tween a pair of face images. The non-trainable algorithms usecommon feature representations to characterize face images,and similarities are measured within these feature spaces. Thetrainable face recognition algorithm used in this study alsooutputs a measure of similarity between a pair of face images.However, different versions of this algorithm can be generatedby training it with different sets of face images, where the setshave been separated based on demographics. Both the trainablealgorithms, and (presumably) the COTS FRS, initially usesome variant of the non-trainable representations.
The study of COTS FRS performance on each of thedemographics considered is intended to augment previousexperiments [3], [4] on whether these algorithms, as used ingovernment and other applications, exhibit biases. Such biaseswould cause the performance of commercial algorithms tovary across demographic cohorts. In evaluating three differentCOTS FRS, we confirmed that not only do these algorithmsperform worse on certain demographic cohorts, they consis-tently perform worse on the same cohorts (females, Blacks,and younger subjects).
Even though biases of COTS FRS on various cohorts wereobserved in this study, these algorithms are black boxes thatoffer little insight into to why such errors manifest on specificdemographic cohorts. To understand this, we also study theperformance of non-commercial trainable and non-trainableface recognition algorithms, and whether statistical learningmethods can leverage this phenomenon.
By studying non-trainable face recognition algorithms, wegain an understanding of whether or not the errors are inherentto the specific demographics. This is because non-trainablealgorithms operate by measuring the (dis)similarity of faceimages based on a specific feature representation that, ideally,
1
2
Age Gender Race/EthnicityYoung Middle-Aged Old
(a) (b) (c)
Female Male
(d) (e)
Black White Hispanic
(f) (g) (h)
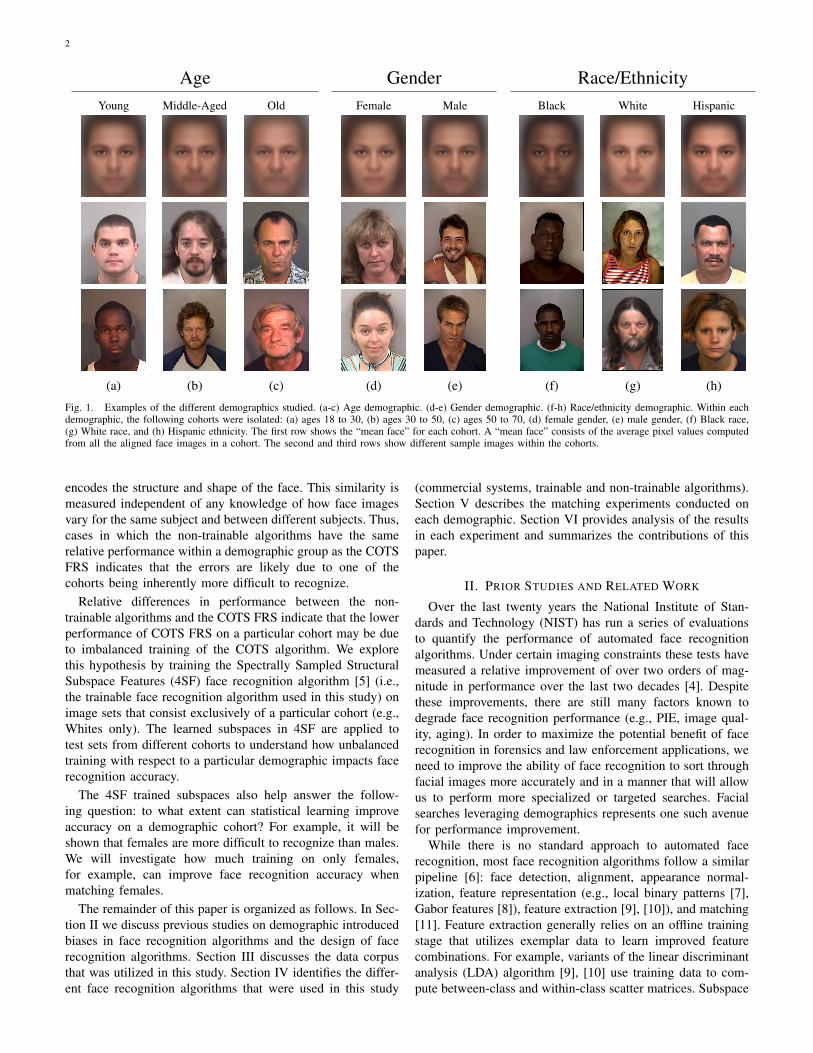
Fig. 1. Examples of the different demographics studied. (a-c) Age demographic. (d-e) Gender demographic. (f-h) Race/ethnicity demographic. Within eachdemographic, the following cohorts were isolated: (a) ages 18 to 30, (b) ages 30 to 50, (c) ages 50 to 70, (d) female gender, (e) male gender, (f) Black race,(g) White race, and (h) Hispanic ethnicity. The first row shows the “mean face” for each cohort. A “mean face” consists of the average pixel values computedfrom all the aligned face images in a cohort. The second and third rows show different sample images within the cohorts.
encodes the structure and shape of the face. This similarity ismeasured independent of any knowledge of how face imagesvary for the same subject and between different subjects. Thus,cases in which the non-trainable algorithms have the samerelative performance within a demographic group as the COTSFRS indicates that the errors are likely due to one of thecohorts being inherently more difficult to recognize.
Relative differences in performance between the non-trainable algorithms and the COTS FRS indicate that the lowerperformance of COTS FRS on a particular cohort may be dueto imbalanced training of the COTS algorithm. We explorethis hypothesis by training the Spectrally Sampled StructuralSubspace Features (4SF) face recognition algorithm [5] (i.e.,the trainable face recognition algorithm used in this study) onimage sets that consist exclusively of a particular cohort (e.g.,Whites only). The learned subspaces in 4SF are applied totest sets from different cohorts to understand how unbalancedtraining with respect to a particular demographic impacts facerecognition accuracy.
The 4SF trained subspaces also help answer the follow-ing question: to what extent can statistical learning improveaccuracy on a demographic cohort? For example, it will beshown that females are more difficult to recognize than males.We will investigate how much training on only females,for example, can improve face recognition accuracy whenmatching females.
The remainder of this paper is organized as follows. In Sec-tion II we discuss previous studies on demographic introducedbiases in face recognition algorithms and the design of facerecognition algorithms. Section III discusses the data corpusthat was utilized in this study. Section IV identifies the differ-ent face recognition algorithms that were used in this study
(commercial systems, trainable and non-trainable algorithms).Section V describes the matching experiments conducted oneach demographic. Section VI provides analysis of the resultsin each experiment and summarizes the contributions of thispaper.
II. PRIOR STUDIES AND RELATED WORK
Over the last twenty years the National Institute of Stan-dards and Technology (NIST) has run a series of evaluationsto quantify the performance of automated face recognitionalgorithms. Under certain imaging constraints these tests havemeasured a relative improvement of over two orders of mag-nitude in performance over the last two decades [4]. Despitethese improvements, there are still many factors known todegrade face recognition performance (e.g., PIE, image qual-ity, aging). In order to maximize the potential benefit of facerecognition in forensics and law enforcement applications, weneed to improve the ability of face recognition to sort throughfacial images more accurately and in a manner that will allowus to perform more specialized or targeted searches. Facialsearches leveraging demographics represents one such avenuefor performance improvement.
While there is no standard approach to automated facerecognition, most face recognition algorithms follow a similarpipeline [6]: face detection, alignment, appearance normal-ization, feature representation (e.g., local binary patterns [7],Gabor features [8]), feature extraction [9], [10]), and matching[11]. Feature extraction generally relies on an offline trainingstage that utilizes exemplar data to learn improved featurecombinations. For example, variants of the linear discriminantanalysis (LDA) algorithm [9], [10] use training data to com-pute between-class and within-class scatter matrices. Subspace
3
projections are then computed to maximize the separability ofsubjects based on these scatter matrices.
This study examines the impact of training on face recog-nition performance. Without leveraging training data, facerecognition algorithms are not able to discern between noisyfacial features and facial features which offer consistent cuesto a subject’s identity. As such, automated face recognitionalgorithms are ultimately based on statistical models of thevariance between individual faces. These algorithms seek tominimize the measured distance between facial images of thesame subject, while maximizing the distance between the sub-ject’s images and those of the rest of the population. However,the feature combinations discovered are functions of the dataused to train the recognition system. If the training set is notrepresentative of the population a face recognition algorithmwill be operating on, then the performance of the resultingsystem may deteriorate. For example, the most distinguishingfeatures for Black subjects may differ from White subjects. Assuch, if a system was predominantly trained on White faces,and later operated on Black faces, the learned representationmay discard information useful for discerning Black faces.
The observation that the performance of face recognitionalgorithms could suffer if the training data is not representativeof the population is not new. One of the earliest studies report-ing this phenomenon is not in the automated face recognitionliterature, but instead in the context of human face recogni-tion. Coined the “other-race effect”, humans have consistentlydemonstrated a decreased ability to recognize subjects fromraces different from their own [12], [13]. While there is nogenerally agreed upon explanation for this phenomenon, manyresearchers believe the decreased performance on other races isexplained by the “contact” hypothesis, which postulates thatthe lower performance on other races is due to a decreasedexposure [14]. While the validity of the contact hypothesishas been disputed [15], the presence of the “other-race effect”has not.
From the perspective of automated face recognition, the2002 NIST Face Recognition Vendor Test (FRVT) is believedto be the first study that showed that face recognition al-gorithms have different recognition accuracies depending ona subject’s demographic cohort [3]. Among other findings,this study demonstrated, for commercial face recognitionalgorithms on a dataset containing roughly 120,000 images,that (i) female subjects were more difficult to recognize thanmale subjects, and (ii) younger subjects were generally moredifficult to recognize than older subjects.
More recently, Grother et al. measured the performanceof seven commercial face recognition algorithms and threeacademic face recognition algorithms in the 2010 NIST Multi-Biometric Evaluation [4]. The results of their experiments alsoconcluded that females were more difficult to recognize thanmales. This study also measured the recognition accuracy ofdifferent races and ages.
Other studies have also investigated the impact of thedistribution of a training set on recognition accuracy. Furl etal. [16] and Phillips et al. [17] conducted studies to investigatethe impact of cross training and matching on White andAsian races. Similar training biases were investigated by Klare
and Jain [18], showing that aging-invariant face recognitionalgorithms suffer from decreased performance in non-agingscenarios.
The study in [17] was motivated by a rather surprisingresult in the 2006 NIST Face Recognition Vendor Test (FRVT)[19]. In this test, the various commercial and academic facerecognition algorithms tested exhibited a common character-istic: algorithms which originated in East Asia performedbetter on Asian subjects than did algorithms developed in theWestern hemisphere. The reverse was true for White subjects:algorithms developed in the western hemisphere performedbetter. O’Toole et al. suggested that this discrepancy was dueto the different racial distribution in the training sets for theWestern and Asian algorithms.
The impact of these training sets on face recognition algo-rithms cannot be overemphasized; face recognition algorithmsdo not generally rely upon explicit physiological models ofthe human face for determining match or non-match betweentwo faces. Instead, the measure of similarity between faceimages is based on statistical learning, generally in the featureextraction stage [10], [20], [21], [22], [23] or during thematching stage [11].
In this work, we expand on previous studies to betterdemonstrate and understand the impact of a training seton the performance of face recognition algorithms. Whileprevious studies [16], [17] only isolated the race variate, andonly considered two races (i.e., Asian and White), this studyexplores both the inherent biases and training biases acrossgender, race (three different races/ethnicities) and age. To ourknowledge, no studies have investigated the impact of genderor subject age for training face recognition algorithms.
III. FACE DATABASE
This study was enabled by a collection of over one millionmug shot face images from the Pinellas County Sheriff’sOffice (PCSO)1 (examples of these images can be found inFigure 1). Accompanying these images are complete subjectdemographics. The demographics provide the race/ethnicity,gender, and age of the subject in each image, as well as asubject ID number.
The images in this dataset have been acquired since theyear 1994 (when PCSO began capturing digital mug shots) tothe present. Images were acquired across different cameras atseveral stations (one camera at intake, two cameras at booking,and two cameras at release). For the images acquired between1994 to 2001 the specifications of the capture cameras are notknown. Starting in 2001, all images were acquired using SonyD100 cameras. The cameras are mounted vertically to captureat 480x600 resolution, and images adhere to the ANSI/NIST-ITL 1-2000 face image standard [24]. Despite being capturedin a controlled setting with subject cooperation, some face im-ages exhibit minor pose and expression variations. The imagesin Figure 1 are commensurate with the pose and expression
1The mug shot data used in this study was acquired in the public domainthrough Florida’s “Sunshine” laws. Subjects shown in this manuscript mayor may not have been convicted of a criminal charge, and thus should bepresumed innocent of any wrongdoing.

4
TABLE INUMBER OF SUBJECTS USED FOR TRAINING AND TESTING FOR EACHDEMOGRAPHIC CATEGORY. TWO IMAGES PER SUBJECT WERE USED.
TRAINING AND TEST SETS WERE DISJOINT. A TOTAL OF 102,942 FACEIMAGES WERE USED IN THIS STUDY.
Demographic Cohort # Training # Testing
Gender Female 7995 7996Male 7996 7998
Race Black 7993 7992White 7997 8000Hispanic 1384 1425
Age 18 to 30 7998 799930 to 50 7995 799750 to 70 2801 2853
variations in this dataset. Illumination was controlled usingthree point lighting and the background was set to 18% gray.
Given this large corpus of face images, we were able touse the metadata provided to control the three demograph-ics studied: race/ethnicity, gender, and age. For gender, wepartitioned image sets into cohorts of (i) male only, and (ii)female only. For age, we partitioned the sets into three cohorts:(i) young (18 to 30 years old), (ii) middle-age (30 to 50years old), and (iii) old (50 to 70 years old). There were veryfew individuals in this database with age less than 18 andolder than 70. For race/ethnicity2, we partitioned the sets intocohorts of (i) White, (ii) Black, and (iii) Hispanic3. A summaryof these cohorts and the number of subjects available for eachcohort can be found in Table I. Asian, Indian, and Unknownrace/ethnicities were not considered because an insufficientnumber of samples were available.
For each of the eight cohorts (i.e., male, female, young,middle-aged, old, White, Black, and Hispanic), we createdindependent training and test sets of face images. Each setcontains a maximum of 8,000 subjects, with two images (oneprobe and one gallery) for each subject. Table I lists thenumber of subjects included for each set. Cohorts far less than8,000 subjects (i.e., Hispanic and older) reflect a lack of dataavailable to us. Cases with cohorts containing only slightlyfewer than 8,000 subjects are the result of removing a fewimages that could not be successfully enrolled in the COTSFRS.
For each demographic that was controlled (e.g. gender),the other demographics were uncontrolled so that they haveroughly the same distribution (following the findings in [25]).For example, the percentage of black subjects and whitesubjects is roughly the same for both the female and malecontrolled datasets. Thus, the relative recognition betweencohorts within a controlled demographic is not a function ofsome other demographic being distributed differently. From arandom sample of 150,000 subjects in the PCSO dataset, we
2Racial identifiers (i.e. White, Black, and Hispanic) follow the FBI’sNational Crime Information Center code manual.
3Hispanic is not technically a race, but instead an ethnic category.
have the following distribution for each cohort: 78.6% male,21.4% female, 67.7% White, 28.0% Black, 3.7% Hispanic,44.8% young, 47.5% middle-aged, and 7.7% old.
The dataset of mug shot images did not contain a largeenough number of Asian subjects to measure that particularrace/ethnicity cohort. However, studies by Furl et al. [16] andO’Toole et al. [17] investigated the impact of the Whites andEast Asians. As previously discussed, these studies concludedthat algorithms developed in the Western Hemisphere didbetter on White subjects and Asian algorithms did better onAsian subjects.
IV. FACE RECOGNITION ALGORITHMS
In this section we will discuss each of the six face recog-nition algorithms used in this study. We have organizedthese algorithms into commercial algorithms (Sec. IV-A), non-trainable algorithms (Sec. IV-B), and trainable algorithms(Sec. IV-C).
A. Commercial Face Recognition Algorithms
Three commercial face recognition algorithms were evalu-ated in this study: (i) Cognitec’s FaceVACS v8.2, (ii) PittPattv5.2.2, and (iii) Neurotechnology’s MegaMatcher v3.1. Theresults in this study obfuscate the names of the three commer-cial matchers.
These commercial algorithms are three of the ten algorithmsevaluated in the NIST sponsored Multi-Biometrics Evaluation(MBE) [4]. As such, these algorithms are representative of thestate of the art performance in face recognition technology.
B. Non-Trainable Face Recognition Algorithms
Two non-trainable face recognition algorithms were usedin this study: (i) local binary patterns (LBP), and (ii) Gaborfeatures. Both of these methods operate by representing theface with Level 2 facial features (LBP and Gabor), whereLevel 2 facial features are features that encode the structureand shape of the face, and are critical to face recognitionalgorithms [26].
These non-trainable algorithms perform an initial geometricnormalization step (also referred to as alignment) by usingthe automatically detected eye coordinates (eyes were detectedusing FaceVACS SDK) to scale, rotate, and crop a face image.After this step, the face image has a height and width of 128pixels. Both algorithms are custom implementations by theauthors.
1) Local Binary Patterns: A seminal method in face recog-nition is the use of local binary patterns [7] (LBP) to representthe face [27]. Local Binary Patterns represent small patchesacross the face with histograms of binary patterns that encodethe structure and texture of the face.
Local binary patterns describe each pixel using a p-bitbinary number. Each bit is determined by sampling p pixelvalues at uniformly spaced locations along a circle of radiusr, centered at the pixel being described. For each samplinglocation, the corresponding bit receives the value 1 if it isgreater than or equal to the center pixel, and 0 otherwise.

5
A special case of LBP, called the uniform LBP [7], is gen-erally used in face recognition. Uniform LBP assigns any non-uniform binary number to the same value, where uniformityis defined by whether more than u transitions between thevalues 0 and 1 occur in the binary number. For p = 8 andu = 2, the uniform LBP has 58 uniform binary numbers, andthe 59th value is reserved for the remaining 256 − 58 = 198non-uniform binary numbers. Thus, each pixel will take on avalue ranging from 1 to 59. Two different radii are used (r = 1and r = 2), resulting in two different local binary patternrepresentations that are subsequently concatenated together(called Multi-scale Local Binary Patterns, or MLBP).
In the context of face recognition, LBP values are firstcomputed at each pixel in the (normalized) face image aspreviously described. The image is tessellated into patcheswith a height and width of 12 pixels. For each patch i, ahistogram of the LBP values S′i ∈ Zds is computed (whereds = 59). This feature vector is then normalized to the featurevector Si ∈ Rds by Si =
S′i∑ds
i S′i
. Finally, we concatenate theN vectors into a single vector x of dimensionality ds ·N .
In our implementation, the illumination filter proposed byTan and Triggs [28] is used prior to computing the LBP codesin order to suppress non-uniform illumination variations. Thisfilter resulted in improved recognition performance.
2) Gabor Features: Gabor features are one of the facial fea-tures [26] to have been used with wide success in representingfacial images [8], [20], [29]. One reason Gabor features arepopular for representing both facial and natural images is theirsimilarity with human neurological receptor fields [30], [31].
A Gabor image representation is computed by convolving aset of Gabor filters with an image (in this case, a face image).The Gabor filters are defined as
G(x, y, θ, η, γ, f) =f2
πγηe−(f2
γ2x′2+ f2
γ2y′2)e(j2πfx
′) (1)
x′ = x cos θ + ysinθ (2)y′ = −xsinθ + y cos θ (3)
where f sets the filter scale (or frequency), θ is the filterorientation along the major axis, γ controls the filter sharpnessalong the major axis, and η controls the sharpness alongthe minor axis. Typically, combinations across the followingvalues for the scale f and orientation θ are used: f ={0, 1, . . . , 4} and θ = {π/8, π/4, 3π/8, . . . , π}. This creates aset (or bank) of filters with different scales and orientations.Given the bank of Gabor filters, the input image is convolvedwith each filter, which results in a Gabor image for each filter.The combination of these scale and orientation values resultsin 40 different Gabor filters, which in turn results in 40 Gaborimages (for example).
In this paper, the recognition experiments using a Gaborimage representation involve: (i) performing illumination cor-rection using the method proposed by Tan and Triggs [28],(ii) computing the phase response of the Gabor images withf = {1, 2}, and θ = 0, π/4, π/2, 3π/4, (iii) tessellating theGabor image(s) into patches of size 12x12, (iv) quantizingthe phase response (which ranges from 0 to 2π) into 24
values and computing the histogram within each patch, and(v) concatenating the histogram vectors into a single featurevector. Given two (aligned) face images, the distance betweentheir corresponding Gabor feature vectors is used to measurethe dissimilarity between the two face images.
C. Trainable Face Recognition Algorithm
The trainable algorithm used in this study is the SpectrallySampled Structural Subspace Features algorithm [5], which isabbreviated as 4SF. This algorithm (which was developed inhouse) uses multiple discriminative subspaces to perform facerecognition. After geometric normalization of a face imageusing the automatically detected eye coordinates (eyes weredetected using FaceVACS SDK), illumination correction isperformed using the illumination correction filter presentedby Tan and Triggs [28]. Face images are then representedusing histograms of local binary patterns at densely sampledface patches [27] (to this point, 4SF is the same as the non-trainable LBP algorithm described in Sec. IV-B1). For eachface patch, principal component analysis (PCA) is performedso that 98.0% of the variance is retained. Given a training setof subjects, multiple stages of weighted random sampling isperformed, where the spectral densities (i.e., the eigenvalues)from each face patch are used for weighting. The randomlysampled subspaces are based on Ho’s original method [32],however the proposed approach is unique in that the samplingis weighted based on the spectral densities. For each stage ofrandom sampling, LDA [10] is performed on the randomlysampled components. The LDA subspaces are learned usingsubjects randomly sampled from the training set (i.e., bagging[33]). Finally, distance-based recognition is performed byprojecting the LBP representation of face images into theper-patch PCA subspaces, and then into each of the learnedLDA subspaces. The sum of the Euclidean distance in eachsubspace is the dissimilarity between two face images. The4SF algorithm is summarized in Figure 2.
As shown in the experiments conducted in this study, the4SF algorithm performs on par with several commercial facerecognition algorithms. Because 4SF initially uses the sameapproach as the non-trainable LBP matcher, the improvementin recognition accuracies (in this study) between the non-trainable LBP matcher and the 4SF algorithm clearly demon-strates the ability of 4SF to leverage training data. Thus, ahigh matching accuracy and the ability to leverage trainingdata make 4SF an ideal face recognition algorithm to studythe effects of training data on face recognition performance.
While 4SF is intended to be representative of learning-based methods in face recognition, it could be the case thatother learning-based algorithms (such as [20], [21], [22], [23])exhibit different amounts of sensitivity to the demographicdistribution of the training data. However, unlike most patternclassification tasks which train on samples from the sameclasses (i.e. subjects) that the algorithms are being tested on,the recognition scenarios in this study (and face recognition ingeneral) operate in a transfer learning scenario. Thus, becausewe are training on different classes/subjects than those beingtested, the relative performance of 4SF’s training-based results

6
Training ImagesPCA Decomposition
Linear Discriminant
AnalysisLocal Binary Patterns Random Spectral
Training ImagesPCA Decomposition
(per LBP histogram)Analysis
(per Spectral Sample)
Local Binary Patterns
(Densely Sampled)
Random Spectral
Sampling
Fig. 2. Overview of the Spectrally Sampled Structural Subspace Features (4SF) algorithm. This custom algorithm is representative of state of the art methodsin face recognition. By changing the demographic distribution of the training sets input into the 4SF algorithm, we are able to analyze the impact the trainingdistribution has on various demographic cohorts.
in this study are generally considered to be a function of thedata and not the 4SF algorithm itself.
V. EXPERIMENTAL RESULTS
For each demographic (gender, race/ethnicity, and age),three separate matching experiments are conducted. The re-sults of these experiments are presented per demographic.Figure 3 delineates the results for all the experiments onthe gender demographic. Figure 4 delineates the results forall experiments on the race/ethnicity demographic. Finally,Figure 5 delineates the results for all experiments on the agedemographic. The true accept rate at a fixed false accept rateof 0.1% for all the plots in Figures 3 to 5 are summarized inTable II.
The first experiment conducted on each demographic mea-sures the relative performance within the demographic cohortfor each COTS FRS. That is, for a particular commercialmatcher (e.g., COTS-A), we compare it’s matching accuracyon each cohort within that demographic. For example, onthe gender demographic, this experiment will measure thedifference in recognition accuracy for commercial matchers onmales versus females. The results from this set of experimentscan be found in Figures 3 (a-c) for the gender demographic,Figures 4 (a-c) for the race/ethnicity demographic, and Fig-ures 5 (a-c) for the age demographic.
The second experiment conducted on each demographiccohort measures the relative performance within the cohortfor non-trainable face recognition algorithms. Because thenon-trainable algorithms do not leverage statistical variabilityin faces, they are not susceptible to training biases. Instead,they reflect the inherent (or a priori) difficulty in recognizingcohorts of subjects within a specific demographic group. Theresults from this set of experiments can be found in Figures 3(d-e) for the gender demographic, Figures 4 (d-e) for therace/ethnicity demographic, and Figures 5 (d-e) for the agedemographic.
The final experiment investigates the influence of the train-ing set on recognition performance. Within each demographiccohort, we train several versions of the 4SF algorithm (onefor each cohort). These differently trained versions of the4SF algorithm are then applied to separate testing sets fromeach cohort within the particular demographic. This enables usto understand within the gender demographic (for example),how much training exclusively on females (i) improves perfor-mance on females, and (ii) decreases performance on males.
In addition to training 4SF exclusively on each cohort, wealso use a version of 4SF trained on an equal representation ofspecific demographic cohorts (referred to as “Trained on All”).For example, in the gender demographic, this would mean thatfor “All”, 4SF was trained on 4,000 male subjects and 4,000female subjects. The results from this set of experiments can befound in Figures 3 (f-h) for the gender demographic, Figures 4(f-i) for the race/ethnicity demographic, and Figures 5 (f-i) forthe age demographic.
VI. ANALYSIS
In this section we provide an analysis of the findings of theexperiments described in Section V.
A. Gender
Each of the three commercial face recognition algorithmsperformed significantly worse on the female cohort than themale cohort (see Figures 3 (a-c)). Additionally, both non-trainable algorithms (LBP and Gabor) performed significantlyworse on females (see Figures 3 (d-e)).
The agreement in relative accuracies of the COTS FRS andthe non-trainable LBP method on the gender demographicsuggests that the female cohort is more difficult to recognizethan the male cohort. That is, if the results in the COTSalgorithms were due to imbalanced training sets (i.e., train-ing on more males than females), then the LBP matchershould have yielded similar matching accuracies on males andfemales. Instead, the non-trained LBP and Gabor matchersperformed worse on the female cohort. When training on malesand females equally (Figure 3(h)), the 4SF algorithm alsodid significantly worse on the female cohort. Together, theseresults strongly suggest that the female cohort is inherentlymore difficult to recognize.
The results of the 4SF algorithm on the female cohort(Figure 3 (f)) offer additional evidence about the nature ofthe discrepancy. The performance of training on only femalesis not higher than the performance of training on a mix ofmales and females (labeled “All”).
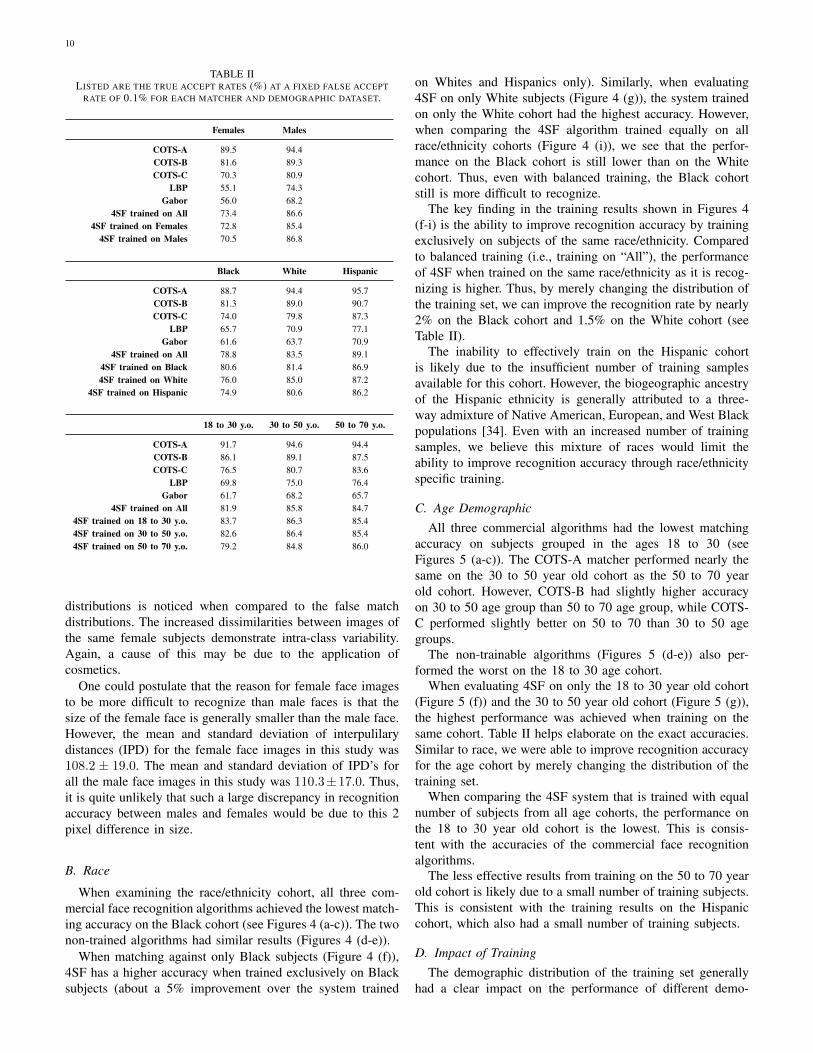
Different factors may explain why females are more difficultto recognize than males. One explanation may be the use ofcosmetics by females (i.e., makeup), which results in a higherwithin-class variance for females than males. This hypothesisis supported by the match score distributions for males andfemales (see Figure 6). A greater difference in the true match

7
0.5
0.6
0.7
0.8
0.9
1.0
●
●
●
0.001 0.100False Accept Rate
True
Acc
ept R
ate
Dataset
● FemalesMales
COTS−A
0.5
0.6
0.7
0.8
0.9
1.0
●
●
●
0.001 0.100False Accept Rate
True
Acc
ept R
ate
Dataset
● FemalesMales
COTS−B
0.5
0.6
0.7
0.8
0.9
1.0
●
●
●
●
●
0.001 0.100False Accept Rate
True
Acc
ept R
ate
Dataset
● FemalesMales
COTS−C
(a) (b) (c)
0.5
0.6
0.7
0.8
0.9
1.0
●
●
●
●
0.001 0.100False Accept Rate
True
Acc
ept R
ate
Dataset
● FemalesMales
LBP
0.5
0.6
0.7
0.8
0.9
1.0
●
●
●
●
●
0.001 0.100False Accept Rate
True
Acc
ept R
ate
Dataset
● FemalesMales
Gabor
0.5
0.6
0.7
0.8
0.9
1.0
●
●
●
●
0.001 0.100False Accept Rate
True
Acc
ept R
ate
Dataset
● FemalesMales
4SF trained on all cohorts equally
(d) (e) (f)
0.5
0.6
0.7
0.8
0.9
1.0
●
●
0.001 0.100False Accept Rate
True
Acc
ept R
ate
Dataset
● Trained on FemalesTrained on MalesTrained on All
4SF evaluated on Females
0.5
0.6
0.7
0.8
0.9
1.0
●
●
0.001 0.100False Accept Rate
True
Acc
ept R
ate
Dataset
● Trained on FemalesTrained on MalesTrained on All
4SF evaluated on Males
(g) (h)
Fig. 3. Performance of the six face recognition systems on datasets seperated by cohorts within the gender demographic. (a) COTS-A, (b) COTS-B, (c)COTS-C, (d) Local binary patterns (non-trainable), (e) Gabor (non-trainable), (f) 4SF trained on equal number of samples from each gender, (g) 4SF algorirthm(trainable) on the Females cohort, (h) 4SF algorirthm (trainable) on the Males cohort.

8
0.5
0.6
0.7
0.8
0.9
1.0
●
●
●
0.001 0.100False Accept Rate
True
Acc
ept R
ate
Dataset
● BlackWhiteHispanic
COTS−A
0.5
0.6
0.7
0.8
0.9
1.0
●
●
0.001 0.100False Accept Rate
True
Acc
ept R
ate
Dataset
● BlackWhiteHispanic
COTS−B
0.5
0.6
0.7
0.8
0.9
1.0
●
●
●
●
0.001 0.100False Accept Rate
True
Acc
ept R
ate
Dataset
● BlackWhiteHispanic
COTS−C
(a) (b) (c)
0.5
0.6
0.7
0.8
0.9
1.0
●
●
●
0.001 0.100False Accept Rate
True
Acc
ept R
ate
Dataset
● BlackWhiteHispanic
LBP
0.5
0.6
0.7
0.8
0.9
1.0
●
●
●
0.001 0.100False Accept Rate
True
Acc
ept R
ate
Dataset
● BlackWhiteHispanic
Gabor
0.5
0.6
0.7
0.8
0.9
1.0
●
●
0.001 0.100False Accept Rate
True
Acc
ept R
ate
Dataset
● BlackWhiteHispanic
4SF trained on all cohorts equally
(d) (e) (f)
0.5
0.6
0.7
0.8
0.9
1.0
●
0.001 0.100False Accept Rate
True
Acc
ept R
ate
Dataset
● Trained on BlackTrained on WhiteTrained on HispanicTrained on All
4SF evaluated on Black
0.5
0.6
0.7
0.8
0.9
1.0
●
0.001 0.100False Accept Rate
True
Acc
ept R
ate
Dataset
● Trained on BlackTrained on WhiteTrained on HispanicTrained on All
4SF evaluated on White
0.5
0.6
0.7
0.8
0.9
1.0
●
0.001 0.100False Accept Rate
True
Acc
ept R
ate
Dataset
● Trained on BlackTrained on WhiteTrained on HispanicTrained on All
4SF evaluated on Hispanic
(g) (h) (i)
Fig. 4. Performance of the six face recognition systems on datasets seperated by cohorts within the race demographic. (a) COTS-A, (b) COTS-B, (c) COTS-C,(d) Local binary patterns (non-trainable), (e) Gabor (non-trainable), (f) 4SF trained on equal number of samples from each race, (g) 4SF algorirthm (trainable)on the Black cohort, (h) 4SF algorirthm (trainable) on the White cohort, (i) 4SF algorirthm (trainable) on the Hispanic cohort.

9
0.5
0.6
0.7
0.8
0.9
1.0
●
●
0.001 0.100False Accept Rate
True
Acc
ept R
ate
Dataset
● Ages 18 to 30Ages 30 to 50Ages 50 to 70
COTS−A
0.5
0.6
0.7
0.8
0.9
1.0
●
0.001 0.100False Accept Rate
True
Acc
ept R
ate
Dataset
● Ages 18 to 30Ages 30 to 50Ages 50 to 70
COTS−B
0.5
0.6
0.7
0.8
0.9
1.0
●
●
●
0.001 0.100False Accept Rate
True
Acc
ept R
ate
Dataset
● Ages 18 to 30Ages 30 to 50Ages 50 to 70
COTS−C
(a) (b) (c)
0.5
0.6
0.7
0.8
0.9
1.0
●
●
●
0.001 0.100False Accept Rate
True
Acc
ept R
ate
Dataset
● Ages 18 to 30Ages 30 to 50Ages 50 to 70
LBP
0.5
0.6
0.7
0.8
0.9
1.0
●
●
●
0.001 0.100False Accept Rate
True
Acc
ept R
ate
Dataset
● Ages 18 to 30Ages 30 to 50Ages 50 to 70
Gabor
0.5
0.6
0.7
0.8
0.9
1.0
●
●
0.001 0.100False Accept Rate
True
Acc
ept R
ate
Dataset
● Ages 18 to 30Ages 30 to 50Ages 50 to 70
4SF trained on all cohorts equally
(d) (e) (f)
0.5
0.6
0.7
0.8
0.9
1.0
●
0.001 0.100False Accept Rate
True
Acc
ept R
ate
Dataset
● Trained on Ages 18 to 30Trained on Ages 30 to 50Trained on Ages 50 to 70Trained on All
4SF evaluated on Ages 18 to 30
0.5
0.6
0.7
0.8
0.9
1.0
●
0.001 0.100False Accept Rate
True
Acc
ept R
ate
Dataset
● Trained on Ages 18 to 30Trained on Ages 30 to 50Trained on Ages 50 to 70Trained on All
4SF evaluated on Ages 30 to 50
0.5
0.6
0.7
0.8
0.9
1.0
●
0.001 0.100False Accept Rate
True
Acc
ept R
ate
Dataset
● Trained on Ages 18 to 30Trained on Ages 30 to 50Trained on Ages 50 to 70Trained on All
4SF evaluated on Ages 50 to 70
(g) (h) (i)
Fig. 5. Performance of the six face recognition systems on datasets seperated by cohorts within the age demographic. (a) COTS-A, (b) COTS-B, (c) COTS-C,(d) Local binary patterns (non-trainable), (e) Gabor (non-trainable), (f) 4SF trained on equal number of samples from each age, (g) 4SF algorirthm (trainable)on the Ages 18 to 30 cohort, (h) 4SF algorirthm (trainable) on the Ages 30 to 50 cohort, (i) 4SF algorirthm (trainable) on the Ages 50 to 70 cohort.
10
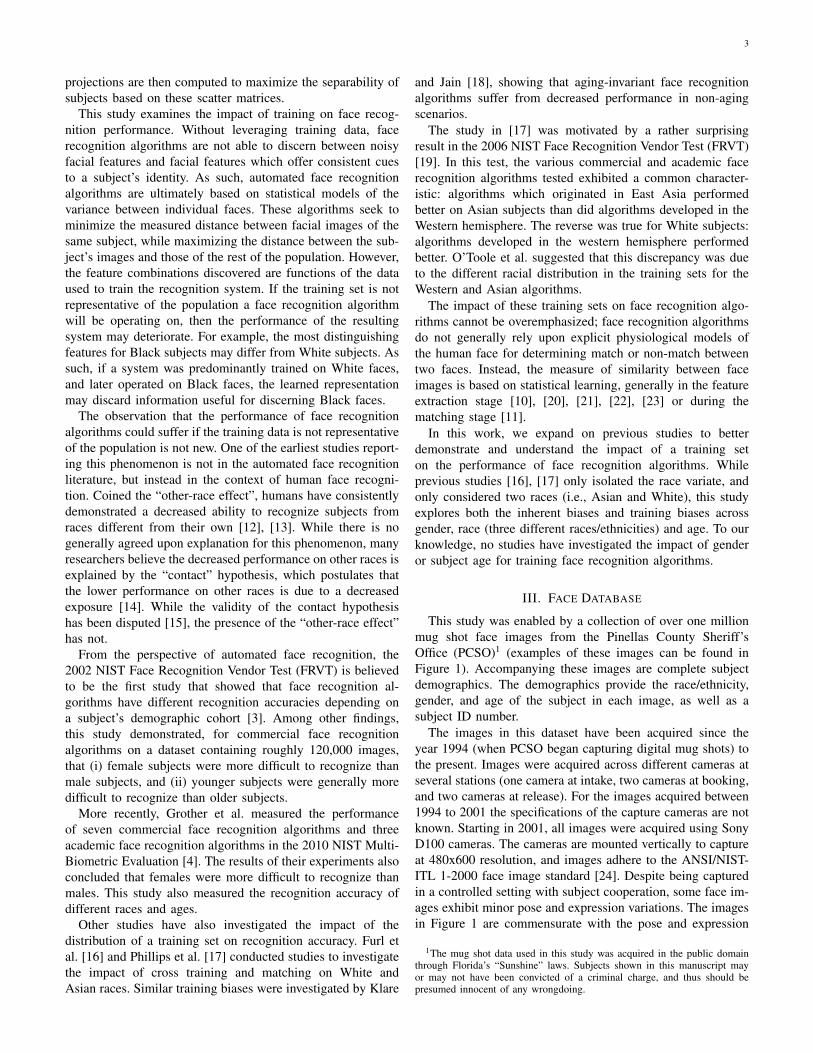
TABLE IILISTED ARE THE TRUE ACCEPT RATES (%) AT A FIXED FALSE ACCEPT
RATE OF 0.1% FOR EACH MATCHER AND DEMOGRAPHIC DATASET.
Females Males
COTS-A 89.5 94.4COTS-B 81.6 89.3COTS-C 70.3 80.9
LBP 55.1 74.3Gabor 56.0 68.2
4SF trained on All 73.4 86.64SF trained on Females 72.8 85.4
4SF trained on Males 70.5 86.8
Black White Hispanic
COTS-A 88.7 94.4 95.7COTS-B 81.3 89.0 90.7COTS-C 74.0 79.8 87.3
LBP 65.7 70.9 77.1Gabor 61.6 63.7 70.9
4SF trained on All 78.8 83.5 89.14SF trained on Black 80.6 81.4 86.94SF trained on White 76.0 85.0 87.2
4SF trained on Hispanic 74.9 80.6 86.2
18 to 30 y.o. 30 to 50 y.o. 50 to 70 y.o.
COTS-A 91.7 94.6 94.4COTS-B 86.1 89.1 87.5COTS-C 76.5 80.7 83.6
LBP 69.8 75.0 76.4Gabor 61.7 68.2 65.7
4SF trained on All 81.9 85.8 84.74SF trained on 18 to 30 y.o. 83.7 86.3 85.44SF trained on 30 to 50 y.o. 82.6 86.4 85.44SF trained on 50 to 70 y.o. 79.2 84.8 86.0
distributions is noticed when compared to the false matchdistributions. The increased dissimilarities between images ofthe same female subjects demonstrate intra-class variability.Again, a cause of this may be due to the application ofcosmetics.
One could postulate that the reason for female face imagesto be more difficult to recognize than male faces is that thesize of the female face is generally smaller than the male face.However, the mean and standard deviation of interpulilarydistances (IPD) for the female face images in this study was108.2 ± 19.0. The mean and standard deviation of IPD’s forall the male face images in this study was 110.3±17.0. Thus,it is quite unlikely that such a large discrepancy in recognitionaccuracy between males and females would be due to this 2pixel difference in size.
B. Race
When examining the race/ethnicity cohort, all three com-mercial face recognition algorithms achieved the lowest match-ing accuracy on the Black cohort (see Figures 4 (a-c)). The twonon-trained algorithms had similar results (Figures 4 (d-e)).
When matching against only Black subjects (Figure 4 (f)),4SF has a higher accuracy when trained exclusively on Blacksubjects (about a 5% improvement over the system trained
on Whites and Hispanics only). Similarly, when evaluating4SF on only White subjects (Figure 4 (g)), the system trainedon only the White cohort had the highest accuracy. However,when comparing the 4SF algorithm trained equally on allrace/ethnicity cohorts (Figure 4 (i)), we see that the perfor-mance on the Black cohort is still lower than on the Whitecohort. Thus, even with balanced training, the Black cohortstill is more difficult to recognize.
The key finding in the training results shown in Figures 4(f-i) is the ability to improve recognition accuracy by trainingexclusively on subjects of the same race/ethnicity. Comparedto balanced training (i.e., training on “All”), the performanceof 4SF when trained on the same race/ethnicity as it is recog-nizing is higher. Thus, by merely changing the distribution ofthe training set, we can improve the recognition rate by nearly2% on the Black cohort and 1.5% on the White cohort (seeTable II).
The inability to effectively train on the Hispanic cohortis likely due to the insufficient number of training samplesavailable for this cohort. However, the biogeographic ancestryof the Hispanic ethnicity is generally attributed to a three-way admixture of Native American, European, and West Blackpopulations [34]. Even with an increased number of trainingsamples, we believe this mixture of races would limit theability to improve recognition accuracy through race/ethnicityspecific training.
C. Age DemographicAll three commercial algorithms had the lowest matching
accuracy on subjects grouped in the ages 18 to 30 (seeFigures 5 (a-c)). The COTS-A matcher performed nearly thesame on the 30 to 50 year old cohort as the 50 to 70 yearold cohort. However, COTS-B had slightly higher accuracyon 30 to 50 age group than 50 to 70 age group, while COTS-C performed slightly better on 50 to 70 than 30 to 50 agegroups.
The non-trainable algorithms (Figures 5 (d-e)) also per-formed the worst on the 18 to 30 age cohort.
When evaluating 4SF on only the 18 to 30 year old cohort(Figure 5 (f)) and the 30 to 50 year old cohort (Figure 5 (g)),the highest performance was achieved when training on thesame cohort. Table II helps elaborate on the exact accuracies.Similar to race, we were able to improve recognition accuracyfor the age cohort by merely changing the distribution of thetraining set.
When comparing the 4SF system that is trained with equalnumber of subjects from all age cohorts, the performance onthe 18 to 30 year old cohort is the lowest. This is consis-tent with the accuracies of the commercial face recognitionalgorithms.
The less effective results from training on the 50 to 70 yearold cohort is likely due to a small number of training subjects.This is consistent with the training results on the Hispaniccohort, which also had a small number of training subjects.
D. Impact of TrainingThe demographic distribution of the training set generally
had a clear impact on the performance of different demo-
11
600 700 800 900 1000 1100 1200 1300 1400 1500 16000
1
2
3
4x 10
9 Male Match Scores
Dissimilarity
Fre
quen
cy(s
cale
d)
False PositiveTrue Positive
(a)
600 700 800 900 1000 1100 1200 1300 1400 1500 16000
1
2
3
4
5x 10
9 Female Match Scores
Dissimilarity
Fre
quen
cy(s
cale
d)
False PositiveTrue Positive
(b)
600 700 800 900 1000 1100 1200 1300 1400 1500 16000
1
2
3
4
5x 10
5 True Match Scores
Dissimilarity
Fre
quen
cy(s
cale
d)
MaleFemale
(c)
600 700 800 900 1000 1100 1200 1300 1400 1500 16000
2
4
6x 10
9 False Match Scores
Dissimilarity
Fre
quen
cy(s
cale
d)
MaleFemale
(d)
Fig. 6. Match score distributions for the male and female genders usingthe 4SF system trained with an equal number of male and female subjects.The increased distances (dissimilarities) for the true match comparisons in thefemale cohort suggest increased within-class variance in the female cohort.All histograms are aligned on the same horizontal axis.
graphic groups. Particularly in the case of race/ethnicity,we see that training on a set of subjects from the samedemographic cohort as being matched offers an increasein the True Accept Rate (TAR). This finding on the 4SFalgorithm is particularly important because in most operationalscenarios, particularly those dealing with forensics and lawenforcement, the use of face recognition is not being done ina fully automated, “lights out” mode. Instead, an operator isusually interacting with a face recognition system, performinga one-to-one verification task, or exploring the gallery togroup together candidates for further exploitation. Providedsuch results generalize to other learning algorithms (as wepostulate), each of these scenarios can benefit from the useof demographic-enhanced matching algorithms, as describedbelow.
Gallery
Database
Biometric System
Operator
Probe Image
Subject Demographic:
White, Male, 18-30 y.o.
Suite of Face Recognition Systems Trained
Exclusively on Different Demographics
White
Male
Black
Female
Black
Male
White
Female
1:N
Match
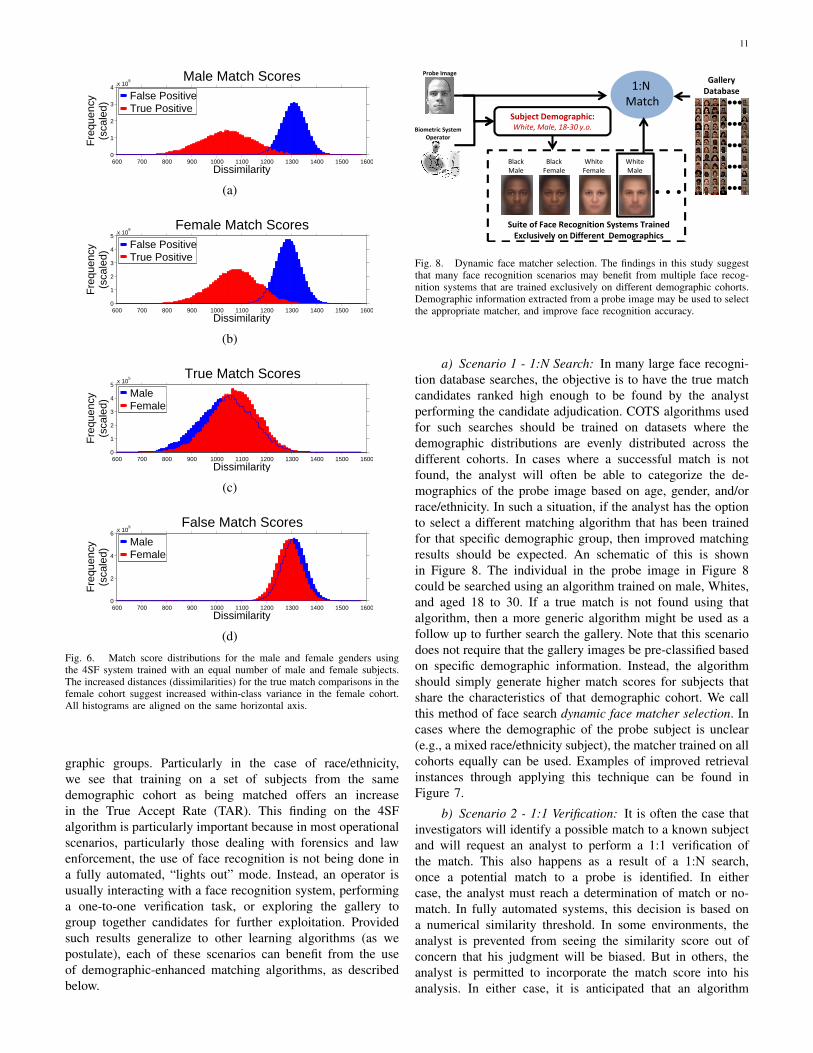
Fig. 8. Dynamic face matcher selection. The findings in this study suggestthat many face recognition scenarios may benefit from multiple face recog-nition systems that are trained exclusively on different demographic cohorts.Demographic information extracted from a probe image may be used to selectthe appropriate matcher, and improve face recognition accuracy.
a) Scenario 1 - 1:N Search: In many large face recogni-tion database searches, the objective is to have the true matchcandidates ranked high enough to be found by the analystperforming the candidate adjudication. COTS algorithms usedfor such searches should be trained on datasets where thedemographic distributions are evenly distributed across thedifferent cohorts. In cases where a successful match is notfound, the analyst will often be able to categorize the de-mographics of the probe image based on age, gender, and/orrace/ethnicity. In such a situation, if the analyst has the optionto select a different matching algorithm that has been trainedfor that specific demographic group, then improved matchingresults should be expected. An schematic of this is shownin Figure 8. The individual in the probe image in Figure 8could be searched using an algorithm trained on male, Whites,and aged 18 to 30. If a true match is not found using thatalgorithm, then a more generic algorithm might be used as afollow up to further search the gallery. Note that this scenariodoes not require that the gallery images be pre-classified basedon specific demographic information. Instead, the algorithmshould simply generate higher match scores for subjects thatshare the characteristics of that demographic cohort. We callthis method of face search dynamic face matcher selection. Incases where the demographic of the probe subject is unclear(e.g., a mixed race/ethnicity subject), the matcher trained on allcohorts equally can be used. Examples of improved retrievalinstances through applying this technique can be found inFigure 7.
b) Scenario 2 - 1:1 Verification: It is often the case thatinvestigators will identify a possible match to a known subjectand will request an analyst to perform a 1:1 verification ofthe match. This also happens as a result of a 1:N search,once a potential match to a probe is identified. In eithercase, the analyst must reach a determination of match or no-match. In fully automated systems, this decision is based ona numerical similarity threshold. In some environments, theanalyst is prevented from seeing the similarity score out ofconcern that his judgment will be biased. But in others, theanalyst is permitted to incorporate the match score into hisanalysis. In either case, it is anticipated that an algorithm

12
Probe Images:
Gallery Mates:
Retrieval Rank for 4SF Trained on all cohorts equally:873 866 763 679 628 608 5 3
Retrieval Rank for 4SF Trained on White cohort exclusivly:10 42 48 20 10 16 48 42
(a)
Probe Images:
Gallery Mates:
Retrieval Rank for 4SF Trained on all cohorts equally:820 811 730 640 574 547 7 6
Retrieval Rank for 4SF Trained on Black cohort exclusively:20 34 43 9 43 18 42 41
(b)
Fig. 7. Shown are examples where dynamic face matcher selection improved the retrieval accuracy. The last two columns show the less frequent cases wheresuch a technique reduced the retrieval accuracy. Retrieval ranks are out of 8,000 gallery subjects for the White cohort (a), and 7,992 for the Black cohort(b). Leveraging demographic information (such as race/ethnicity in this example) allows a face recognition system to perform the matching using statisticalmodels that are tuned to the differences within the specific cohort.
trained on a specific demographic group will return highermatch scores for true matches than one that was more generic.As a result, the analyst is more likely to get a hit and the 1:1matching results process will be improved.
c) Scenario 3 - Verification at Border Crossings: Theresults presented here provide support for further testing ofadditional demographic groups, potentially including specificcountry or geographic-region of origin. Assuming such de-mographics proved effective at improving match scores, thenuse of dynamic face matcher selection could be extended toimmigration or border checks on entering subjects to verifythat their passport or other documents accurately reflects their
true demographic.d) Scenario 4 - Face Clustering: Another analyst-driven
application involves the exploitation of large sets of uncon-trolled face imagery. Images encountered in intelligence orinvestigative applications often include large sets of videosor arbitrary photographs taken with no intention of enrollingthem in a face recognition environment. Such image sets offera great potential for development of intelligence leads bylocating multiple pictures of specific individuals and givinganalysts an opportunity to link subjects who may be foundwithin the same photographs. Clustering methods are nowbeing used on these datasets to group faces that appear to

13
represent the same subject. Implementations of such clusteringmethods today usually rely upon a single algorithm to performthe grouping and an analyst must perform the quality controlstep to determine if a particular cluster contains only a singleindividual. By combining multiple demographic-based algo-rithms into a sequential analysis, it may be possible to improvethe clustering of large sets of face images and thereby reducethe time required for the analyst to perform the adjudicationof individual clusters.
VII. CONCLUSIONS
This paper examined face recognition performance on dif-ferent demographic cohorts on a large operational databaseof 102,942 face images. Three demographics were analyzed:gender (male and female), race/ethnicity (White, Black, andHispanic), and age (18 to 30 years old, 30 to 50 years old,and 50 to 70 years old).
For each demographic cohort, the performances of threecommercial face recognition algorithms were measured. Theperformances of all three commercial algorithms were consis-tent in that they all exhibited lower recognition accuracies onthe following cohorts: females, Blacks, and younger subjects(18 to 30 years old).
Additional experiments were conducted to measure theperformance of non-trainable face recognition algorithms (lo-cal binary pattern-based and Gabor-based), and a trainablesubspace method (the Spectrally Sampled Structural SubspaceFeatures (4SF) algorithm). The results of these experimentsoffered additional evidence to form hypotheses about theobserved discrepancies between certain demographic cohorts.
Some of the key findings in this study are:• The female, Black, and younger cohorts are more difficult
to recognize for all matchers used in this study (commer-cial, non-trainable, and trainable).
• Training face recognition systems on datasets well dis-tributed across all demographics is critical to reduce facematcher vulnerabilities on specific demographic cohorts.
• Face recognition performance on race/ethnicity and agecohorts generally improves when training exclusively onthat same cohort.
• In forensic scenarios, the above findings suggest the useof dynamic face matcher selection, where multiple facerecognition systems, trained on different demographiccohorts, are available as a suite of systems for operatorsto select based on the demographic information of a givenquery image (see Figure 8).
Finally, as with any empirical study, additional ways toexploit the findings of this research are likely to be found.Of particular interest is the observation that women appear tobe more difficult to identify through facial recognition thanmen. If we can determine the cause of this difference, it maybe possible to use that information to improve the overallmatching performance.
The experiments conducted in this paper should have asignificant impact on the design of face recognition algo-rithms. Similar to the large body of research on algorithmsthat improve face recognition performance in the presence
of other variates known to compromise recognition accuracy(e.g., pose, illumination, and aging), the results in this studyshould motivate the design of algorithms that specificallytarget different demographic cohorts within the race/ethnicity,gender and age demographics. By focusing on improvingthe recognition accuracy on such confounding cohorts (i.e.,females, Blacks, and younger subjects), researchers should beable to further reduce the error rates of state of the art facerecognition algorithms and reduce the vulnerabilities of suchsystems used in operational environments.
Future studies will seek to confirm the training-based resultsin this work on other learning algorithms (such as [20],[21], [22], [23]), as well as study cohorts from multipledemographics (such as White males, Black females, etc.).
ACKNOWLEDGEMENTS
We would like to thank Scott McCallum and the PinellasCounty Sheriff’s Office for providing a large database of faceimages. This study would not have been possible withouttheir invaluable support. Feedback provided by Nick Orlanswas instrumental in the completion this paper. We appreciatePatrick Grother’s insightful comments on this study. This re-search was supported by the Office of the Director of NationalIntelligence (ODNI). Richard Vorder Bruegge’s research ispartially supported by the Director of National Intelligence(DNI) Science and Technology (S&T) Fellows program. Partof Anil Jain’s research was supported by the WCU (WorldClass University) program funded by the Ministry of Educa-tion, Science and Technology through the National ResearchFoundation of Korea (R31-10008).
REFERENCES
[1] P.J. Phillips et al., “An introduction to the good, the bad, & the uglyface recognition challenge problem,” in Proc. of Automatic Face GestureRecognition, 2011.
[2] A. K. Jain, B. Klare, and U. Park, “Face matching and retrieval:Applications in forensics,” IEEE Multimedia (to appear), 2011.
[3] P. J. Phillips, P. J. Grother, R. J. Micheals, D. Blackburn, E. Tabassi,and J. M. Bone, “Face recognition vendor test 2002: evaluation report,”National Institute of Standards and Technology, NISTIR, vol. 6965, 2003.
[4] P. J. Grother, G. W. Quinn, and P. J. Phillips, “MBE 2010: Report onthe evaluation of 2D still-image face recognition algorithms,” NationalInstitute of Standards and Technology, NISTIR, vol. 7709, 2010.
[5] B. Klare, “Spectrally sampled structural subspace features (4SF),” inMichigan State University Technical Report, MSU-CSE-11-16, 2011.
[6] S. Z. Li and A. K. Jain, Eds., Handbook of Face Recognition, 2nd ed.Springer, 2011.
[7] T. Ojala, M. Pietikainen, and T. Maenpaa, “Multiresolution gray-scaleand rotation invariant texture classification with local binary patterns,”IEEE Trans. Pattern Anal. Mach. Intell., vol. 24, no. 7, pp. 971–987,2002.
[8] L. Wiskott, J. Fellous, N. Kuiger, and C. von der Malsburg, “Facerecognition by elastic bunch graph matching,” IEEE Trans. Pattern Anal.Mach. Intell., vol. 19, no. 7, pp. 775–779, 1997.
[9] X. Wang and X. Tang, “Random sampling for subspace face recogni-tion,” Int. Journal of Computer Vision, vol. 70, no. 1, pp. 91–104, 2006.
[10] P. Belhumeur, J. Hespanda, and D. Kriegman, “Eigenfaces vs. Fisher-faces: Recognition using class specific linear projection,” IEEE Trans.Pattern Anal. Mach. Intell., vol. 19, no. 7, pp. 711–720, 1997.
[11] B. Moghaddam, T. Jebara, and A. Pentland, “Bayesian face recognition,”Pattern Recognition, vol. 33, no. 11, pp. 1771–1782, 2000.
[12] R. K. Bothwell et al. , “Cross-racial identification,” Personality & SocialPsychology Bulletin, vol. 15, pp. 19–25, 1989.
[13] P. N. Shapiro and S. D. Penrod, “Meta-analysis of face identificationstudies,” Psychological Bulletin, vol. 100, pp. 139–156, 1986.

14
[14] P. Chiroro and T. Valentine, “An investigation of the contact hypoth-esis of the own-race bias in face recognition,” Quarterly Journal ofExperimental Psychology, Human Experimental Psychology, vol. 48A,pp. 879–894, 1995.
[15] W. Ng and R. C. Lindsay, “Cross-race facial recognition: Failure of thecontact hypothesis,” Journal of Cross-Cultural Psychology, vol. 25, pp.217–232, 1994.
[16] N. Furl, P. J. Phillips, and A. J. O’Toole, “Face recognition algorithmsand the other-race effect: computational mechanisms for a developmentalcontact hypothesis,” Cognitive Science, vol. 26, no. 6, pp. 797–815,2002.
[17] P. Phillips, A. Narvekar, F. Jiang, and A. OToole, “An other-race effectfor face recognition algorithms,” ACM Trans. on Applied Perception,vol. 8, no. 2, 2010.
[18] B. Klare and A. K. Jain, “Face recognition across time lapse: On learningfeature subspaces,” in Int. Joint Conference on Biometrics, 2011.
[19] P.J. Phillips et al., “FRVT 2006 and ICE 2006 large-scale experimentalresults,” IEEE Trans. Pattern Anal. Mach. Intell., vol. 32, no. 5, pp.831–846, 2010.
[20] C. Liu and H. Wechsler, “Gabor feature based classification using theenhanced fisher linear discriminant model for face recognition,” IEEETrans. Image Process., vol. 11, no. 4, pp. 467–476, 2002.
[21] X. Jiang, B. Mandal, and A. Kot, “Eigenfeature regularization andextraction in face recognition,” IEEE Trans. Pattern Anal. Mach. Intell.,vol. 30, no. 3, pp. 383 –394, 2008.
[22] X. Jiang, “Linear subspace learning-based dimensionality reduction,”IEEE Signal Processing, vol. 28, no. 2, pp. 16 –26, march 2011.
[23] X. Wang and X. Tang, “A unified framework for subspace face recogni-tion,” IEEE Trans. Pattern Anal. Mach. Intell., vol. 26, no. 9, pp. 1222–1228, 2004.
[24] R. McCabe, “Data format for the interchange of fingerprint, facial, scarmark & tattoo (SMT) information,” in ANSI/NIST-ITL 1-2000, 2000.
[25] A. J. O’Toole, P. J. Phillips, X. An, and J. Dunlop, “Demographic effectson estimates of automatic face recognition performance,” Image andVision Computing, vol. 30, no. 3, pp. 169 – 176, 2012.
[26] B. Klare and A. Jain, “On a taxonomy of facial features,” in Proc.of IEEE Conference on Biometrics: Theory, Applications and Systems,2010.
[27] T. Ahonen, A. Hadid, and M. Pietikainen, “Face description with localbinary patterns: Application to face recognition,” IEEE Trans. PatternAnal. Mach. Intell., vol. 28, no. 12, pp. 2037–2041, 2006.
[28] X. Tan and B. Triggs, “Enhanced local texture feature sets for facerecognition under difficult lighting conditions,” IEEE Trans. ImageProcess., vol. 19, no. 6, pp. 1635–1650, 2010.
[29] L. Shen and L. Bai, “A review on Gabor wavelets for face recognition,”Pattern Analysis & Applications, vol. 9, pp. 273–292, 2006.
[30] M. Riesenhuber and T. Poggio, “Hierarchical models of object recog-nition in cortex,” Nature Neuroscience, vol. 2, no. 11, pp. 1019–1025,1999.
[31] E. Meyers and L. Wolf, “Using biologically inspired features for faceprocessing,” Int. Journal of Computer Vision, vol. 76, no. 1, pp. 93–104,2008.
[32] T. K. Ho, “The random subspace method for constructing decisionforests,” IEEE Trans. Pattern Anal. Mach. Intell., vol. 20, no. 8, pp.832–844, 1998.
[33] L. Breiman, “Bagging predictors,” Machine Learning, vol. 24, pp. 123–140, 1996.
[34] X. Mao et al., “A genomewide admixture mapping panel for his-panic/latino populations,” The American Journal of Human Genetics,vol. 80, no. 6, pp. 1171–1178, 2007.
Brendan F. Klare received the B.S. and M.S.degrees in Computer Science from the Universityof South Florida in 2007 and 2008, and the Ph.D.degree in Computer Science from Michigan StateUniversity in 2012. From 2001 to 2005 he served asan airborne ranger infantryman in the 75th RangerRegiment. Brendan has authored several papers onthe topic of face recognition, and he recieved theHoneywell Best Student Paper Award at the 2010IEEE Conference on Biometrics: Theory, Appli-cations and Systems (BTAS). His other research
interests include pattern recognition, image processsing, and computer vision.
Mark J. Burge is a scientist with The MITRECorporation, McLean, Virgina. Dr. Burge’s researchinterests include image processing, pattern recog-nition, and biometric authentication. He served asa Program Director at the National Science Foun-dation, a research scientist at the Swiss FederalInstitute of Science (ETH) in Zurich, Switzerland,and the TUWien in Vienna, Austria. While a tenuredcomputer science professor, he co-authored the threevolume set, “Principles of Digital Image Processing”which has been translated into both German and
Chinese. He holds patents in multispectral iris recognition and is the coeditorof Springer Verlag’s forthcoming “Handbook of Iris Recognition”.
Joshua C. Klontz is a scientist with The MITRECorporation, McLean, Virgina. He recieved a B.S.in Computer Science from Harvey Mudd College in2010. His research interests include pattern recogni-tion and cross-platform C++ software development.Josh also has an academic interest in epidemiologyand is recently published in the Journal of FoodProtection.
Richard W. Vorder Bruegge is a Senior LevelPhotographic Technologist for the Federal Bureau ofInvestigation. In this role, he is responsible for over-seeing FBI science and technology developments inthe imaging sciences. He serves as the FBI’s subjectmatter expert for face recognition and is the currentchair of the Facial Identification Scientific WorkingGroup. He has multiple publications on forensicimage analysis and biometrics and he was co-editorof Computer-Aided Forensic Facial Identification(2010). He has testified as an expert witness over
sixty times in criminal cases in the United States and abroad. Dr. VorderBruegge is a fellow of the American Academy of Forensic Sciences and wasnamed a Director of National Intelligence Science and Technology Fellow inJanuary 2010.
Anil K. Jain is a university distinguished professorin the Department of Computer Science and Engi-neering at Michigan State University. His researchinterests include pattern recognition and biometricauthentication. He served as the editor-in-chief ofthe IEEE Trans. on Pattern Analysis and MachineIntelligence (1991-1994). The holder of six patentsin the area of fingerprints, he is the author of anumber of books, including Introduction to Biomet-rics (2011), Handbook of Fingerprint Recognition(2009), Handbook of Biometrics (2007), Handbook
of Multibiometrics (2006), Handbook of Face Recognition (2005), Biometrics:Personal Identification in Networked Society (1999), and Algorithms forClustering Data (1988). He served as a member of the Defense ScienceBoard and The National Academies committees on Whither Biometrics andImprovised Explosive Devices. Dr. Jain received the 1996 IEEE Trans. onNeural Networks Outstanding Paper Award and the Pattern RecognitionSociety best paper awards in 1987, 1991, and 2005. He is a fellow of theAAAS, ACM, IAPR, and SPIE. He has received Fulbright, Guggenheim,Alexander von Humboldt, IEEE Computer Society Technical Achievement,IEEE Wallace McDowell, ICDM Research Contributions, and IAPR King-Sun Fu awards. ISI has designated him a highly cited researcher. Accordingto Citeseer, his book Algorithms for Clustering Data (Englewood Cliffs, NJ:Prentice-Hall, 1988) is ranked #93 in most cited articles in computer science.