fabrication and characterization of … and characterization of functionalized polymer systems using...
TRANSCRIPT

FABRICATION AND CHARACTERIZATION OF FUNCTIONALIZED POLYMER
SYSTEMS USING DIP-PEN NANOLITHOGRAPHY
by
CARRIE ELLEN SCHINDLER
DERRICK R. DEAN, CHAIR
SHANE AARON CATLEDGE
NITIN CHOPRA
VINOY THOMAS
YOGESH VOHRA
A DISSERTATION
Submitted to the graduate faculty of The University of Alabama at Birmingham,
in partial fulfillment of the requirements for the degree of
Doctor of Philosophy
BIRMINGHAM, ALABAMA
2014

Copyright by
CARRIE ELLEN SCHINDLER
2014

iii
FABRICATION AND CHARACTERIZATION OF FUNCTIONALIZED POLYMER
SYSTEMS USING DIP-PEN NANOLITHOGRAPHY
CARRIE ELLEN SCHINDLER
MATERIALS ENGINEERING
ABSTRACT
As more technology shifts from the microscale to the nanoscale, the demand for
new fabrication and characterization methods to investigate material properties on the
nanoscale significantly increases. Dip-pen nanolithography is an innovative printing
technique with the precision to deposit a multitude of inks with nanoscale dimensions on
a variety of substrates. This bottom-up approach of high-throughput printing has enabled
the study of nanomaterials spanning the gamut of disciplines from nanoelectronics to
single-cell interactions to drug delivery. However, the scalability and reproducibility of
the dip-pen nanolithography platform has yet to reach full potential in terms of large-
scale material production. Specifically, the dip-pen nanolithography platform can address
some of the challenges that hinder the development of two polymer systems, tissue
engineering polymer systems and electroactive polymer systems. This work utilizes dip-
pen nanolithography as a basis for creating nanocomposites for tissue engineering and
‘smart’ materials by the functionalization and characterization of novel polymer blend
scaffolds and electroactive polymer systems. Additionally, this work enhances the
application areas of the dip-pen nanolithography system with specific impacts on
nanotechnology and the advancement of unique polymer systems.
The work begins with electrospinning polymer blends of polycaprolactone and
polyglyconate for the first time. The mechanical, rheological, thermal and morphological
behaviors of the electrospun blends provide guidance for the design and optimization of

iv
hybrid scaffold systems. This provided a matrix for dip-pen nanolithography patterning
with hydroxyapatite inks. Nanoparticle based inks of hydroxyapatite were designed for
specific use with dip-pen nanolithography. The inks were tested in terms of stability,
dispersion, and accuracy of patterning to determine the optimal formulation for high
throughput printing onto electrospun scaffolds.
In addition to tissue engineering applications, this work also focused on
developing new techniques to pattern carbon nanotubes on electroactive polymer films in
the nanoregime. Carbon nanotubes inks were formulated as a nanoparticle-based ink for
dip-pen nanolithography patterning. These formulations led to the first reported direct
deposition of multi-walled carbon nanotubes by dip-pen nanolithography with printed
features ranging from 400 nm to 4 μm. These carbon nanotube features were printed onto
polymer films as ongoing work to develop electroactive polymer composites using dip-
pen nanolithography.
Keywords: Electrospun polyglyconate, electroactive polymer composites, dip-pen
nanolithography, carbon nanotube inks, nanohydroxyapatite inks.

v
DEDICATION
To all my family and friends who have loved and supported me,
thank you.

vi
ACKNOWLEDGEMENTS
My mentor and friend, Dr. Derrick Dean for allowing me to express my creativity
and scientific curiosity while supporting my research endeavors with his deep
compassion. I couldn’t have found a mentor for my personality and work ethic to
drive me to better myself. He is truly a remarkable person that has shaped me into
a better person throughout my time at UAB.
The UAB REU Physics program and Dr. Vohra for giving me an opportunity to
conduct research as an undergraduate in 2008. Without this opportunity, I would
not have the passion for my research nor the insight into what UAB offers.
My family, my fiancé, and my friends who have supported me blindly through
this process. Even though I may get frustrated with the million times they asked
me when I was going to graduate, they have been there for me.
My UAB colleagues who have helped me when I was struggling, brought me a
cherry coke, and gave me access to the instruments I needed to complete my
dissertation. Thank you to the polymer lab group members past, present, and
honorary.
The Department of Materials Science and Engineering, especially Vernon
Merchant, Cynthia Barham, and Robin Mize, whose help does not go unnoticed.
My committee and other mentors along the way who have offered me valuable
guidance.

vii
TABLE OF CONTENTS
Page
ABSTRACT ....................................................................................................................... iii
DEDICATION .....................................................................................................................v
ACKNOWLEDGMENTS ................................................................................................. vi
LIST OF TABLES ............................................................................................................. ix
LIST OF FIGURES .............................................................................................................x
LIST OF ABBREVIATIONS .......................................................................................... xiv
1. INTRODUCTION ...................................................................................................1
2. LITERATURE REVIEW ........................................................................................3
2.1 Tissue engineering polymer systems ...............................................3
2.2 Hydroxyapatite .................................................................................5
2.3 Electroactive polymer systems ........................................................6
2.4 Carbon nanotubes.............................................................................7
2.5 Dip-pen nanolithography .................................................................8
3. SPECIFIC AIMS ...................................................................................................11
3.1 Electrospun polycaprolactone/polyglyconate blends:
Miscibility, mechanical behavior, and degradation ......................11
3.2 Controlled patterning of nano-hydroxyapatite by dip-pen
nanolithography .............................................................................11
3.3 Carbon nanotube inks for direct patterning by dip-pen
nanolithography .............................................................................12
4. MATERIALS AND EXPERIMENTAL METHODS ...........................................12
4.1 Biodegradable polymers ................................................................12
4.2 Nano-Hydroxyapatite ink formulation ...........................................12
4.3 Carbon nanotube ink formulation ..................................................13
4.4 Electrospinning ..............................................................................13
4.5 Microscopy ....................................................................................14
4.6 Thermal Analysis ...........................................................................15
4.7 Mechanical Testing ........................................................................15

viii
4.8 In-vitro degradation .......................................................................16
4.9 Spectroscopy ..................................................................................17
4.10 Rheology ........................................................................................18
4.11 Nanoparticle ink stability ...............................................................18
4.12 DPN printing ..................................................................................19
5. ELECTROSPUN POLYCAPROLACTONE/POLYGLYCONATE BLENDS:
MISCIBILITY, MECHANICAL BEHAVIOR, AND DEGRADATION ............20
6. CONTROLLED PATTERNING OF NANO-HYDROXYAPATITE BY DIP-
PEN LITHOGRAPHY...........................................................................................55
7. CARBON NANOTUBE INKS FOR DIRECT PATTERNING BY DIP-PEN
NANOLITHOGRAPHY........................................................................................75
8. FUTURE DIRECTIONS .......................................................................................99
9. CONCLUSIONS..................................................................................................101
10. REFERENCES ....................................................................................................103

ix
LIST OF TABLES
Tables Page
ELECTROSPUN POLYCAPROLACTONE/POLYGLYCONATE BLENDS:
MISCIBILITY, MECHANICAL BEHAVIOR, AND DEGRADATION
1 Comparison of thermal properties of PCL and Maxon electrospun
blends to pure components obtained by first scan of DSC ....................................34
2 Tensile properties of electrospun Maxon and PCL blends (n=5) ..........................40
3 Modulus of elasticity as a function of aging time ..................................................49
CONTROLLED PATTERNING OF NANO-HYDROXYAPATITE BY
DIP-PEN LITHOGRAPHY
1 Average particle diameter measurements of nanoHA solutions by
dynamic-light scattering and SEM analysis ...........................................................64
CARBON NANOTUBE INKS FOR DIRECT PATTERNING BY DIP-PEN
NANOLITHOGRAPHY
1 Zeta potential measurements (n=3) for MWCNT solutions
as a function of concentrations and viscosities ......................................................88

x
LIST OF FIGURES
Figures Page
LITERATURE REVIEW
1 Schematic of electrospinning set-up to obtain randomly aligned polymer
fibers. .......................................................................................................................4
2 The profiles of an electroactive polymer film indicating the change from
A) a flat orientation to B) a deformed state as a result of applying electrical
stimulus. (Adapted from Ouyang et al.) ...................................................................6
3 Schematic of the transport of molecular inks to a substrate through the water
meniscus. (Adapted from Piner et al.) .....................................................................9
ELECTROSPUN POLYCAPROLACTONE/POLYGLYCONATE BLENDS:
MISCIBILITY, MECHANICAL BEHAVIOR, AND DEGRADATION
1 SEM images electrospun 3:1 PCL/Maxon (left) and 3:1 Maxon/PCL (right)
blend scaffolds. (Scale bar is 50 microns) .............................................................30
2 Fiber diameter distribution of electrospun nanofiber scaffolds consisting
of neat PCL, neat Maxon, 3:1 PCL/Maxon, and 3:1 Maxon/PCL.
100 measurements were recorded for each sample. ...............................................31
3 DSC first heat scans of the Maxon and PCL blends in comparison to the
neat components. The changes in enthalpies of melting indicate the partial
miscibility of the blends. ........................................................................................34
4 DSC first heat scans of 3:1 Maxon/PCL samples indicating the complete
etching of the PCL component after 5 hour in DCM .............................................36
5 Representative SEM images showing the effect on fiber morphology
before (left) and after (right) etching the PCL with DCM on the
3:1 Maxon/PCL scaffolds. (Scale bar is 5 microns) ..............................................36
6 DSC thermograms of the 3:1 Maxon/PCL blend after annealing at the
indicated temperatures and quenching. The arrow indicates increased
phase separation with increasing annealing temperature .......................................38

xi
7 Uniaxial stress-strain curves of the Maxon and PCL blends. The modulus
of elasticity, percent elongation to failure, and tensile strength increases
as the Maxon is added to PCL ...............................................................................39
8 Viscoelastic properties of PCL/Maxon blends shown as storage modulus
as a function of frequency of loading obtained by DMA master curve
time-temperature-superposition .............................................................................41
9 Representative SEM images showing the hydrolytic degradation effect
on electrospun PCL, Maxon, 3:1 PCL/Maxon, and 3:1 Maxon/PCL,
respectively at 0 day exposure (A-D) and 42 days exposure (E-H) in
phosphate buffered saline at 37°C. (Scale bar is 20 microns) ...............................44
10 FT-IR ATR spectra of A) the comparison of neat PCL, neat Maxon,
and the blended scaffolds at 0 days aging. The effects of aging on the
B) Maxon, C) 3:1 PCL/Maxon, and D) 3:1 Maxon/PCL scaffolds showing
hydrolytic degradation from exposure to phosphate buffered saline for
0 days, 21 days, and 42 days. (The asterisks indicate the wavenumbers
signifying the breakdown of amorphous PGA units in the Maxon) ......................47
11 Degradation effects on enthalpy of fusion as a function of aging time in
PBS at 37°C. Solid lines represent the PCL component and dashed lines
represent the Maxon component of enthalpy .........................................................51
CONTROLLED PATTERNING OF NANO-HYDROXYAPATITE BY
DIP-PEN LITHOGRAPHY
1 Average viscosity measurements at 25°C as a function of glycerol content
for nanoHA inks, showing the target viscosity range for DPN printing
(n=6) .......................................................................................................................62
2 Dynamic light-scattering particle size distributions of nanoHA solutions
as a function of increasing glycerol content from 0 – 90% glycerol .....................63
3 SEM images showing the changes in nanoHA distribution of A) as received
powder and nanoHA solutions with B) 0% glycerol C) 30% glycerol and
D) 50% glycerol. (Scale bar is 1 micron) ..............................................................65
4 Turbidity measurements as a function of time after sonication showing the
stability of the nanoHA inks with increasing glycerol content ..............................66
5 Measurements of dot diameter and z-height from AFM topography images
averaged over 3 x 3 DPN printed arrays (n=5) as a function of dwell time ..........68
6 AFM phase images of DPN printed dots with increasing dwell times of
A) 1 second B) 3 seconds and C) 5 seconds indicating the presence of
nanoHA particles within each dot. (Scale bar is 1 micron) ...................................69
xii
7 SEM images of A-B) electrospun fibers on a SiO2 substrate indicating
the presence of nanoHA particles printed by DPN. (Scale bar is 10 microns)
The nanoHA particles were confirmed with C) the EDS spectrum of
the printed features. ................................................................................................70
8 SEM images of aligned electrospun scaffolds A) before and B) after
DPN printing, indicating the presence of nanoHA particles along a single
fiber. (Scale bar is 5 microns) The nanoHA particles were confirmed
with C) the EDS spectrum of the printed features. ................................................71
CARBON NANOTUBE INKS FOR DIRECT PATTERNING BY DIP-PEN
NANOLITHOGRAPHY
1 Viscosity measurements at 25°C as a function of glycerol content
for 1 wt% Triton X-100 in isopropyl alcohol, showing the target
viscosity range for DPN printing (n=6) .................................................................82
2 A) Absorbance and emission spectra of the 0.01 mg/mL MWCNT
solutions indicating the Stokes shift and deconvolution of absorbance
peaks. B) The effect of Triton X-100 surfactant on fluorescence
spectra of the MWCNT solutions ..........................................................................84
3 Evaluation of dispersion based on the comparison of MWCNT solution
concentrations on fluorescence intensity with increasing viscosities by
adding 30 – 50 w/v glycerol. SEM images at 3000X magnification show
visual bundling at lower intensities........................................................................85
4 Turbidity measurements as a function of times after sonication showing
the stability of A) 0.01 mg/mL, B) 0.05 mg/mL, and C) 0.1 mg/mL
MWCNT solutions with increasing amounts of 0, 30, 40, and 50 w/v
glycerol ..................................................................................................................86
5 AFM topography images of arrays printed with A) 3 second dwell times
and B) 5 second dwell times. Measurements of dot diameter and z-height
are shown for each corresponding dwell time .......................................................89
6 AFM phase images of the 5 second dwell individual dots printed with
a) a control solution without MWCNTs b) 30 w/v glycerol c) 40 w/v
glycerol and d) 50 w/v glycerol showing the presence of MWCNTs within
the dots ...................................................................................................................91
7 Raman spectra for individual DPN printed dots using a 3 second dwell
time with the 0.05 mg/mL MWCNT solutions of a) 30 w/v glycerol
b) 40 w/v glycerol and c) 50 w/v glycerol .............................................................92

xiii
8 Raman spectra for a) bulk MWCNTs compared to individual DPN printed
dots using a 5 second dwell time with the 0.05 mg/mL MWCNT solutions
of b) 30 w/v glycerol c) 40 w/v glycerol and d) 50 w/v glycerol .........................94
FUTURE DIRECTIONS
1 Electrostatic force microscopy images showing the topographic changes
in the PVDF/CNT film by applying a) 2 V and b) 10 V stimulus. ......................100

xiv
LIST OF ABBREVIATIONS
Abbreviations
AFM Atomic force microscopy
ATR Attenuated total reflection
CNTs Carbon nanotubes
DCM Dichloromethane
DMA Dynamic mechanical analysis
DPN Dip-Pen Nanolithography
DSC Differential scanning calorimetry
EAPs Electroactive polymers
EDS Energy dispersive spectroscopy
FT-IR Fourier transform infrared spectroscopy
HA Hydroxyapatite
HFP 1,1,1,3,3,3-hexafluoro-2-propanol
IPA Isopropyl alcohol
Maxon Polyglyconate
MWCNTs Multi-walled carbon nanotubes
NanoHA Nanohydroxyapatite
PBS Phosphate buffered saline
PCL Poly(caprolactone)
PGA Poly(glycolic acid)
PLA Poly(lactic acid)
PLGA Poly(lactic-co-glycolic acid)

xv
PVB Polyvinyl butyral
PVDF Poly(vinylidene fluoride)
SEM Scanning electron microscopy
Tg Glass transition temperature
Tm Melting temperature
TMC Trimethylene carbonate
TX-100 Triton X-100

1
1. INTRODUCTION
Tissue engineering is an emergent field of research aimed at providing alternative
solutions to combat diseases. The main areas of research involve the treatment of heart
disease, diabetes, and complications from cancer [1]. Most recently, novel synthetic
polymers or nature-derived materials have been proposed in combination with
nanotechnology to create composite structures for specific tissues in the body [1-5].
These materials, often constructed on the nanoscale, serve as scaffolding for cell growth
[2], drug delivery vehicles [6], and supplements to existing treatments [5]. The growing
interests in polymer systems for tissue engineering does come with major challenges to
achieve functional bioactive scaffolds for commercial use. The translation of research
laboratory concepts to reproducible, industrial scale productions is one of the main
challenges hindering the integration of polymer systems into medical treatment. In
addition, the process of FDA approval and mechanical testing verification for materials is
expensive and time-consuming. Recent efforts in tissue engineering aims to develop
techniques that can be easily scaled-up for industrial applications as well as material
selection of FDA approved polymers to speed the lag between development and product
introduction [7].
Another attractive area of polymer systems is the incorporation of electroactive
polymers (EAPs) into ‘smart’ devices [8, 9]. EAPs have been gaining attention for their
unique mechanical and electrical properties. This class of polymers is emerging due to its
lightweight, ease of processing, durability, fracture tolerance, and mechanical flexibility
which are attractive for aerospace applications such as NASA’s Space Launch System
(SLS). However, there are several hindrances to the integration of EAPs into innovative

2
disciplines. An inability to consistently characterize EAPs has posed a roadblock for the
creation of a reliable database of electro-mechanical properties [8]. In addition, a limited
availability of inherent EAPs creates a lack of supply for mass production products. The
development of electro-mechanically enhanced nanocomposites provides an alternative to
inherent EAPs but requires small-scale investigations of properties for an accurate
comparison [10-14]. For these reasons, it is imperative nano-scale fabrication techniques
are thoroughly explored for the advancement of EAPs in aerospace applications. This
would offer insight for the progression of electro-mechanically enhanced
nanocomposites.
The innovative nanofabrication technique of dip-pen nanolithography (DPN) is an
exceptional candidate for combating the challenges posed by tissue engineering polymer
systems and EAP systems. This high-throughput, reproducible, multifunctional device is
viable for the scale-up of polymer systems for tissue engineering but also offers a method
for the functionalization of inherent EAPs. Not only can the DPN system contribute to
the advancement of these specific systems, but can easily be translated to a wide range of
applications.

3
2. LITERATURE REVIEW
2.1 Tissue engineering polymer systems
A wide range of biodegradable polymers have been explored for use to replace
damaged tissues without relying on the availability of transplants or grafting [15]. The
ultimate goal of these polymer systems is to create a biocompatible, biomimetic, and
bioactive scaffold to support cell growth without inducing an inflammatory response [1,
15]. In attempts to fulfill these requirements, research has focused on the use of novel
synthetic and nature-derived polymers, cutting-edge fabrication techniques, and precision
functionalization techniques to design tissue scaffolds. Biocompatible, FDA approved
synthetic polymers such as PLA poly(lactic acid), PGA poly(glycolic acid), and PCL
poly(caprolactone) possess inert properties allowing these materials to be used in-vivo
without causing an immune response [5]. Copolymers and polymer blends are also an
exciting group of tissue engineering biomaterials that can be tailored for individual tissue
systems to match morphological, mechanical, and degradation properties [5]. Polymer
blends are a physical mixture of two polymers that can result in synergistic properties
inherent to the pure components [16]. These polymer blends can result in a miscible,
partially miscible, or immicible system which is determined by the basic thermodynamic
relationship shown in Eq. 1 [16].
ΔGm = ΔHm - T ΔSm (Eq. 1)
The mixing of two polymers is an enthalpy driven process that results in a miscible blend
when the enthalpy of mixing is negative. Miscible or partially miscible polymer blends
offer the ability to control mechanical properties for tissue scaffolds that cannot be

4
achieved by one single polymer system. Blends can also be utilized to achieve a specific
degradation profile, which is crucial to the regeneration of tissues [15, 17].
Several scaffold fabrication methods have been developed to mimick the natural
structure of the extracellular matrix of cells. The extracellular matrix (ECM) functions as
a support for cell adhesion, proliferation, migration, and differentiation [1]. Current
fabrication methods to mimic the porous network of the ECM in the nanoregime involve
electrospinning, particulate leaching, and rapid prototyping [5]. Electrospinning is a
common technique for achieving the nanoscale fibrous nature of the ECM with a
relatively simple set-up [5]. Figure 1 shows a typical electrospinning set-up for obtaining
randomly aligned fibers.
This set-up utilizes a high power source, typically in the kilovolt range, attached to a
syringe with polymer solution pumped out at a low rate of 1-5mL/hr. During the
extrusion process, the high voltage applied to the tip of the syringe evaporates the solvent
and fibers are drawn towards a grounded collector. Fibers collected on the grounded plate
are in the nanometer range as controlled by the parameters of voltage, syringe pump rate,
and distance of the syringe tip to the collector plate [5]. This technique can be used to
Figure 1. Schematic of electrospinning set-up to obtain randomly aligned polymer
fibers.

5
produce nanofiber scaffolds in various configurations to not only control the morphology
but also mechanical properties [5, 18].
2.2 Hydroxyapatite
Efforts to enhance the biocompatibility and bioactivity of polymer scaffolds have
resulted in the development of techniques to modify tissue scaffolds with bioactive
components. Various growth factors can be incorporated into polymer scaffolds via
electrophorectic deposition [3, 19], microcontact printing [20], ink-jet molecular printing
[6, 21], and DPN [22]. The functionalization of polymer scaffolds with bone
morphogenetic proteins, fibroblast growth factors, and vascular endothelial growth
factors facilitates cell communication by excretion upon implantation in-vivo [1, 2]. This
vital communication increases the success of tissue scaffolds by promoting cell growth
and differentiation [1]. Other nature-derived additives such as hydroxyapatite or collagen
can be incorporated in scaffolds to enhance bioactivity. Hydroxyapatite (HA), a major
component of bone, has been investigated in tissue engineering scaffolds due to the
osteoinductive properties and the exceptional bonding affinity to bone and growth factors
[1]. Recent studies suggest that incorporating nanoparticles of hydroxyapatite (nanoHA)
in the scaffold matrix helps sustain the release of bone growth factors for 2-8 weeks,
achieving the ultimate goal of bone reformation [2]. There is evidence that the surface
properties of these scaffolds determines the cellular response; for instance, the cellular
response and growth can altered by different nanoscale patterns of nanoHA on the
scaffold surface [23, 24].

6
2.3 Electroactive polymer systems
Electroactive polymers (EAPs) are an emerging class of polymers which can be
stimulated to change size and shape [8]. Typical modes of stimulation include electrical,
magnetic, optical, chemical, and pneumatic [8]. EAPs typically require highly
electronegative crystalline groups with a flexible backbone to reorient in the presence of
electrical stimulation [25]. Figure 2 is an example of the resultant deformation induced by
applying an electrical stimulus to an electroactive polymer.
Figure 2. The profiles of an electroactive polymer film indicating the change from A) a
flat orientation to B) a deformed state as a result of applying electrical stimulus. (Adapted
from Ouyang et al. [13])
There are two main classes of EAPs based on the activation mechanism, ionic or electric.
Examples of electronic EAPs include piezoelectric polymers such as polyvinylidene
fluoride (PVDF). In comparison to electronic EAPs, the ionic class of EAPs requires a

7
much lower activation of typically 1-2 volts [8]. The high mechanical energy density of
these ionic EAPs coupled with the low activation has the potential to replace
cumbersome power supplies for lightweight energy efficiency [8]. In addition to energy-
harvesting sources, other applications of EAPs include tunable actuators in robotics,
medical devices, and sensors for controlled active components [8].
Due to the limited supply of inherent EAPs, attention has turned to the
development of electro-mechanically enhanced nanocomposites (EENCs) with improved
mechanical properties. Several systems have been investigated which include embedding
magnetic nanoparticles and carbon nanotubes (CNTs) into a polymer matrix [10-12, 26].
Previously, TiO2 nanoparticles have been embedded into PDMS to produce a grating
pattern under stimulation; however, poor dispersion and control of placement posed
disadvantages to the uniformity of EENCs [13]. In addition, CNTs have been
incorporated with EAPs to improve the mechanical and electrical properties [10-12].
2.4 Carbon nanotubes
Carbon nanotubes (CNTs) have been incorporated in composites for many years
due to their exceptional electrical and mechanical properties. In particular, CNTs boast
enhancements to electroactive polymer composites such as increased strength, stiffness,
robustness [27], sensitivity in actuating response, and energy efficiency [11]. The high
aspect ratio of CNTs allows the addition of low volumes of CNTs for percolation to
occur in a polymer matrix [28, 29]. However, integration into the polymer matrix and
control of the dispersion or orientation of the CNTs remains challenging to achieve the
desired electronic properties with minimal loading. Advances that have been made to
prevent the bundling of CNTs include chemically functionalizing the sidewalls with

8
carboxyl or fluorine groups and utilizing surfactants to overcome the strong van der
Waals attractions between tubes [30, 31]. Both single-walled CNTs (SWCNTs) and
multi-walled CNTs (MWCNTs) have been explored for deposition [32, 33]. Stable
solutions of carboxylated CNTs with concentrations as high as 10 mg/mL dispersed in
water have been achieved [34].
The advent of “smart” materials incorporating multifunctional, tunable properties
demands the need for a high-throughput fabrication method to produce materials with
nanoscale properties. The development of dense network patterns of CNTs are of
particular interest to applications such as sensors [35, 36], flexible electronics [37], and
electroactive polymer composites [8, 10].
2.6 Dip-pen nanolithography
Dip-pen nanolithography (DPN) is the modernized fountain pen of the
nanotechnology era. The deposition process of DPN relies on a water meniscus to
transport molecules from a sharp cantilever tip to the substrate. Figure 3 is a schematic of
molecular ink transport to a substrate by DPN.

9
Figure 3. Schematic of the transport of molecular inks to a substrate through the water
meniscus. (Adapted from Piner et al. [38])
NanoInk Inc. has commercialized the DPN platform as a direct write patterning technique
capable of producing features ranging from 50 nm to 10 µm [38]. Additionally, DPN is a
fast technique capable of producing 88 million dots in five minutes with an array of
55,000 pens depositing in parallel patterns [39]. This technique has the potential to be
utilized on a large scale to mass produce deposited patterns quickly and efficiently for
commercial products. The possibilities of using DPN for patterning a single monolayer
are virtually endless due to the nature of chemisorption or electrostatic interactions
between the “ink” and substrate [39]. Consequently, the current applications of DPN span
a wide variety of disciplines ranging from nanoelectronics [40, 41] to encryption [42] to
drug delivery [22, 43].
The DPN platform (Nscriptor) of the DPN 5000 System functions under the same
principles as atomic force microscopy (AFM). A laser diode is directed into a
piezoelectric scanner that adjusts the x, y, and z components of the AFM cantilever. The
resulting laser beam is adjusted by a series of mirrors to enter a force sensor. A silicon-

10
nitride cantilever with a pyramidal tip is attached to the force sensor, which scans the
material in various modes and signals the force-feedback controller for output [44]. There
are two different modes in which the AFM cantilever can operate. During contact mode,
force is held constant and the cantilever tip is maintained at a constant deflection while
scanning the surface of a material [44]. This mode is useful for robust substrates since the
tip is in continual contact. Non-contacting mode is an alternative for more fragile
substrates. During non-contact mode, the tip is oscillated slightly above resonance
frequency at an amplitude of around 10 nm and lessens the damage to the substrate [44].
Previous methods of modifying nanofiber scaffolds and electroactive polymer
composites involve direct adsorption [45], electrophoretic deposition [3], microcontact
printing [20], and ink-jet printing [32]. These techniques all pose limitations for the
control and reproducibility of the patterned substrates. Although direct adsorption and
electrophorectic deposition are non-contact methods, the precise control of deposition is
not regulated or well-suited for industrial production. Ink-jet printing is the most suitable
choice for many applications; however, the delivery of inks to the substrate through a
small nozzle poses a significant challenge with nanoparticle inks. Particle agglomeration
in solution may occur causing clogging of the nozzle. The direct transport of molecules to
a substrate is unique to DPN because nanoparticles in solution only rely on a water-
meniscus to directly transfer to the substrate, instead of traveling through an orifice. In
addition, ink-jet printing does not accommodate the nanoscale resolution that DPN can
achieve.

11
3. SPECIFIC AIMS
3.1 Electrospun polycaprolactone/polyglyconate blends: Miscibility, mechanical
behavior, and degradation
This aim involves the development of new polymer blends of polyglyconate and
polycaprolactone using the electrospinning process for physical mixing. The tunable
mechanical properties achievable by polymer blends allow unique properties to be
tailored for individual tissue engineering applications. The thermal, morphological, and
mechanical properties will be studied to gain insight on how the polymers interact to
produce the properties of the electrospun blend. In addition, an in-vitro degradation study
of the blends over a 6 week study will determine any improvements in the hydrolytic
stability of the scaffold. The electrospun blend will be used as a substrate for subsequent
functionalization.
3.2 Controlled patterning of nano-hydroxyapatite by dip-pen nanolithography
This aim involves the development of a nanoparticle-based ink for dip-pen
nanolithography, specifically, nano-hydroxyapatite. Several formulations will be studied
to determine the optimal formulation for patterning. The dispersion of nano-
hydroxyapatite, stability of the suspension, and accuracy of printing will determine the
optical formulation. The development of a nano-hydroxyapatite ink for dip-pen
nanolithography patterning will enable cellular interactions to nanoscale patterning on
many surfaces, including electrospun scaffolds.

12
3.3 Carbon nanotube inks for direct patterning by dip-pen nanolithography
This aim involves the formulation of carrier inks to deposit maximum loading of
carbon nanotubes by dip-pen nanolithography. The effect of viscosity and concentration
of carbon nanotubes will be studied as a function of dispersion, stability, and accuracy of
printing to determine the optimal formulation for patterning. This work represents the
first direct deposition of carbon nanotubes onto a surface in the nanoregime. Potential
applications of these carbon nanotube inks impact methods for fabricating electroactive
polymer composites, gas sensors, and transparent circuits.
4. MATERIALS AND EXPERIMENTAL METHODS
4.1 Biodegradable polymers
Poly(caprolactone) with an inherent viscosity of 1.15 dL/g in chloroform (CHCl3)
was purchased from LACTEL Absorbable Polymers, Birmingham, AL. Poly(glycolide-
co-trimethylene carbonate) was purchased in the form of surgical suture packets under
the trade name Maxon® from Advanced Inventory Management, Mokena, IL.
4.2 Nano-Hydroxyapatite ink formulation
Commercial nanoHA powder was purchased from Nanocerox Inc. (Ann Arbor,
MI) with an average particle diameter of 100 nm. The nanoHA powder was loaded into a
carrier solution which consisted of 99% isopropyl alcohol, polyvinyl butyral (PVB), and
glycerol. The concentration of nanoHA and PVB were held constant at 3 w/v % and 0.03
w/v %, respectively, based on previously established stable suspensions of nanoHA [3].
The viscosity of the carrier solution was altered by the addition of 0 – 90% (by weight)
glycerol in 20% increments.

13
4.3 Carbon nanotube ink formulation
MWCNTs with an average diameter of 110 nm were purchased from the
Materials and Electrochemical Research (MER) Corporation and fluorinated adapting the
procedure from Abdalla et al. with 4-fluoroaniline in 2-methoxyethyl ether [46]. The
MWCNTs were dispersed in solutions of 99% isopropyl alcohol (Fisher Scientific), 99%
glycerol (ACROS), and Triton® X-100 (ACROS). The concentration of MWCNTs was
varied with a high loading of 0.1 mg/mL, medium loading of 0.05 mg/mL, and 0.01
mg/mL as the lowest concentration. Based on Vaisman et al. and Rastogi et al., the
optimal concentration of Triton X-100 for effective dispersion of CNTs was chosen to
remain constant at 1 wt % for all solutions [31, 47]. Glycerol was added as a rheological
modifier to tune the viscosity of the solutions in the range of 5 – 15 cP for DPN printing.
Glycerol content was varied in increments of 10 w/v from 0 – 70 w/v for each of the
solutions.
4.4 Electrospinning
The solvent used for electrospinning was 1,1,1,3,3,3-hexafluoro-2-propanol
(HFP), purchased from Oakwood Products Inc., West Columbia, SC. Four
electrospinning solutions were prepared which included a 3:1 PCL/Maxon blend and a
3:1 Maxon/PCL blend, respectively, in comparison to neat Maxon and neat PCL as
controls. The blend solutions consisted of a 3:1 mixture of 20% wt/vol PCL to 15%
wt/vol Maxon in HFP for a total concentration of 18.75% wt/vol and the 3:1 mixture of
15% wt/vol Maxon to 20% wt/vol PCL in HFP for a total concentration of 16.25%

14
wt/vol. The neat PCL solution was a 20% wt/vol in HFP. The neat Maxon solution was
prepared as a 15% wt/vol in HFP by pelletizing the surgical sutures.
An electrospinning setup to obtain a randomly aligned nanofiber scaffold was
used to pump 2 mL of polymer solution with a 5 mL syringe at a rate of 0.2 mL/h through
a 25G needle. The average distance from the needle tip to the grounded collector plate
was 20 cm. A high voltage source (M826, Gamma High-Voltage Research, Ormond
Beach, FL) of 12-15 kV was chosen to produce an average fiber diameter of 500 nm for
each of the polymer solutions. The scaffolds were collected onto a solid sheet of
aluminum until a thickness of 0.1-0.3 mm was achieved. This thickness was achieved by
1.5-3 mL of polymer solution electrospun onto a 10 mm x 10 mm collector.
In addition to the randomly aligned scaffolds, aligned electrospun substrates for
DPN were prepared using rotating mandrel electrospinning. Approximately 1.5 mL of
polymer solution was loaded into a syringe with a 25G needle and pumped at an infusion
rate of 0.5 mL/h. The average distance from the needle tip to the grounded rotating
mandrel (3000 rpm) was 20 cm. A high voltage source (M826, Gamma High-Voltage
Research, Ormond Beach, FL) of 12-15 kV was chosen to produce an average fiber
diameter of 1 μm. The scaffolds were collected both onto a cleaned SiO2 substrate and
the mandrel to obtain a layer of single fibers and a 0.3 mm thick sheet of nanofibers.
Following electrospinning, all samples were placed in a desiccant environment for seven
days to allow for the residual HFP to evaporate from the samples.
4.5 Microscopy
Scanning electron microscopy (SEM) was conducted on a field emission SEM
(Quanta FEG 650 from FEI, Hillsboro, OR). Unless noted otherwise, all samples were

15
sputter coated with Au-Pd prior to imaging. ImageJ software was used for all analysis of
SEM images.
Close-contact atomic force microscopy (AFM) was performed on the NanoInk
DPN 5000 (Nanoink Inc.) to measure the topographic dimensions and phase changes of
the DPN printed dots. The average dot diameter and z-height of each printing condition
were averaged over 3 printed arrays.
4.6 Thermal Analysis
Differential scanning calorimetry (DSC) (Q100 TA Instruments, New Castle, DE)
was performed on the electrospun polymer blends using approximately 5 mg in a sealed
aluminum pan to analyze the shifts in glass transition temperature, melt behavior, and
enthalpy of fusion from the physical mixing of the two polymers. Each of the samples
were subjected to a single temperature ramp heating from -80 °C to 250 °C at a rate of 10
°C/min.
In addition, DSC was employed to study the phase separation processes of the
blends with an annealing procedure of first heating the samples to 250 °C at a rate of 10
°C/min and cooling to -80 °C to erase thermal history, followed by cyclic annealing-
quenching steps holding at 80 °C -150 °C for 10 minutes and quenching at 20 °C/min to -
80 °C. The heating thermograms from -80 °C to 250 °C at a rate of 10 °C/min after each
annealing-quenching cycle were recorded to observe phase separation.
4.7 Mechanical Testing
Uniaxial tensile testing (n=5) was performed on the dry electrospun scaffolds at
ambient conditions with a minimat tensile tester (Rheometric Scientific Inc.) to determine

16
the modulus of elasticity, percent elongation to failure, and yield strength from the
generated stress-strain curves. The samples were sectioned into rectangular strips
measuring 5 mm in width, 25 mm in length, and 0.1-0.2 mm in thickness, in accordance
with ASTM standard D882 for tensile testing of thin film plastics. A 20 N load cell was
applied with a strain rate of 5 mm/min until failure.
Dynamic mechanical analysis (DMA) was used to investigate the viscoelastic
properties of the electrospun scaffolds under cyclic loading over a temperature range
from -100 °C to 70 °C with 5° increments. Samples were sectioned to 5 mm x 15 mm
rectangular strips for testing in a 2980 DMA (TA Instruments) over a frequency range
from 0.1 to 1 Hz with load cell of 18 N. A time temperature superposition master curve
was constructed for each sample to display the modulus as a function of the frequency of
loading using reference temperatures of 20°C for the blends, 10°C for neat Maxon, and -
60°C for neat PCL which corresponded to a temperature near the glass transition
temperature for each material [48].
4.8 In-vitro Degradation
The electrospun scaffolds were sectioned into 1 cm x 1 cm squares and measured
for initial mass and thickness. The samples (n=3) were immersed in 5 mL of phosphate
buffered saline (PBS) at pH 7.3. Each set of samples was incubated at 37 °C and removed
for testing at time points of 6 hours, 12 hours, 1 day, 3 days, 7 days, 21 days, 28 days,
and 42 days. The samples were dried in a desiccant environment for a minimum of 24
hours before initiating mass loss studies. A period of 24 hours was determined to be
sufficient time in a dry environment to effectively remove the PBS through a process of
drying and reweighing each sample until consistent results were achieved.

17
4.9 Spectroscopy
Fourier-Transform Infrared (FT-IR) spectra were obtained for the electrospun
scaffolds using a Thermo Nicolet Nexus 4700, employing 64 scans per sample, ranging
from 4000 to 400 cm-1
in attenuated total reflection (ATR) mode using an infrared
spectrophotometer (Thermo Fisher Scientific Inc., Waltham, MA).
UV–vis spectroscopy (Cary 300 spectrophotometer) with a scan range of 200 –
800 nm was used as a preliminary tool to identify the absorption spectra for the MWCNT
inks. Fluorescence spectroscopy was performed (Cary Eclipse Fluorescence
spectrophotometer) on each of the MWCNT solutions and corresponding set of control
samples not containing MWCNTs. An excitation wavelength of 250 nm and scan range
of 260 – 800 nm was used to identify the emission spectra (n = 3).
The size distribution of the nanoHA particles in solution were measured using
dynamic light-scattering on a Zetasizer Nano ZS (Malvern Instruments) with an
irradiation of 633 nm He-Ne laser. Control solutions without nanoHA were also
measured to confirm the absence of nanoparticles in the carrier solution. All
measurements were performed using the measured viscosity and refractive index of each
solution as the dispersant. The size distribution was calculated by applying the Stokes-
Einstein equation.
Energy dispersive spectroscopy (EDS by TEAMTM
EDAX) was employed to
visually verify and identify the presence of nanoHA within each array of dots. Micro-
Raman spectroscopy was performed to verify the presence of MWCNTs within each dot
using a 300 mW Nd:YAG solid state laser with an exciting wavelength of 532 nm. A

18
100X objective with a spot size of roughly 4 μm was used to focus on individual dots in
each DPN printed array.
4.10 Rheology
A Brookfield viscometer (DV-II+Pro) at 25 °C using the CP40 spindle for low
viscosity solutions was used to measure the viscosity of the inks for DPN printing. An
average viscosity for each solution was obtained by calculating the average viscosity of
six measurements over a shear rate range from 75 – 300 s-1
. The solutions with an
average viscosity in the range of 5 – 15 cP were used for DPN printing.
4.11 Nanoparticle ink stability
Ultrasonication using a probe (Sonics Ultrasonic processor Model GE 750)
operating at 20 kHz for three minutes was used to disperse both the nanoHA and
MWCNTs in each ink to obtain well-dispersed solutions for testing and DPN printing.
Turbidity measurements (Hach 2100N Turbidimeter) were performed versus time to
evaluate the sedimentation of MWCNTs and nanoHA particles in the solutions at time
points of 1, 2, 4, 6, 24, 36, and 72 hours following sonication (n = 3). The turbidity value
of each condition was recorded when the instantaneous turbidity remained constant for at
least 3 s.
The zeta potential of both the MWCNT and nanoHA solutions were measured
using a Zetasizer Nano ZS (Malvern Instruments) with an irradiation of 633 nm He-Ne
laser and at least 180 scans (n = 3). Control samples of the solutions without MWCNTs
or nanoHA particles were also measured to confirm the neutrality of the solvent. All
measurements were performed using the standard values of isopropyl alcohol as the

19
dispersant. The zeta potential was calculated by applying the Helmholtz-Smoluchowski
equation to evaluate the stability of the solutions.
4.12 DPN printing
All printing of MWCNT and nanoHA inks was carried out in an environmental
chamber with a Nanoink DPN 5000 and contact M-type pen arrays purchased from
Nanoink Inc. Unless noted otherwise, the temperature and relative humidity of the
environmental chamber was set to 22 °C and 30%, respectively. SiO2 substrates with pre-
marked labels (Advanced Creative Solutions Technology) were used for both the
nanoHA and MWCNT printing. Single electrospun fibers and an electrospun scaffold
were additional substrates for the nanoHA ink study. InkCAD software was used to print
the desired arrays of either a 5 x 5 array of dots or a 3 x 3 array of dots. The dwell time
was varied at either 1, 3, or 5 seconds to study the dot diameter and z-height dependency
on dwell time.

20
5. ELECTROSPUN POLYCAPROLACTONE/POLYGLYCONATE BLENDS:
MISCIBILITY, MECHANICAL BEHAVIOR, AND DEGRADATION
by
CARRIE SCHINDLER, BRANDON L. WILLIAMS, HARSH N. PATEL, VINOY
THOMAS, DERRICK R. DEAN
Polymer, Volume 54, Issue 25, Pages 6824–6833
Copyright
2013
by
Carrie Schindler
Used by permission
Format adapted for dissertation
21
ABSTRACT
Electrospun blends of polycaprolactone and polyglyconate were prepared for the first
time to evaluate the synergistic properties. The morphology and thermal properties of the
blends were used to determine the degree of miscibility. Dynamic mechanical analysis
was used to evaluate the mechanical performance and viscoelastic properties of the
blends. In vitro degradation studies in phosphate buffered saline (pH of 7.3) were carried
out to investigate the hydrolytic degradation of the polymer system. FT-IR and SEM
analysis, DSC, and mechanical testing were performed to evaluate the degradation
profiles of the blends. A 3:1 ratio of polyglyconate to polycaprolactone was concluded to
be a partially miscible blend with enhancements in tensile strength, flexibility, and
percent elongation to failure over neat polyglyconate. In addition, the 3:1 ratio of
polyglyconate to polycaprolactone scaffold exhibited a stable morphology, modulus of
elasticity, and mass up to 6 weeks in vitro.

22
INTRODUCTION
Biodegradable polymer blends are an exciting class of tissue engineering
biomaterials that can be tailored for individual tissue systems to match the
morphological, mechanical, and degradation properties [1-4]. The goal of these polymer
systems is to create a biocompatible and structurally biomimetic scaffold to support cell
growth without inducing severe inflammatory responses [3]. In attempts to fulfill these
requirements, researchers have focused on the use of novel synthetic and nature-derived
polymers. Biocompatible synthetic polymers such as poly(lactic acid) (PLA),
poly(glycolic acid) (PGA), and poly(caprolactone) (PCL) have been studied in part
because they inert; this allows these materials to be used in-vivo without causing an
immune response [5]. Various compositions of copolymers such as poly(lactic-co-
glycolic acid) (PLGA) have been studied to combine the properties of PGA and PLA for
tunable mechanical and degradation properties by altering the molecular weight or ratio
of PGA to PLA [6]. PLGA is FDA approved for drug delivery and clinical applications
including tissue engineering [7]. The unique morphologies of copolymers and blends
have been utilized to achieve specific degradation profiles and vehicles for drug delivery
systems [8-13].
Several fabrication methods have been employed to utilize the attractive
properties of bioresorbable polymer blends to structurally mimic specific tissue systems
[1, 14]. Electrospinning is a common technique for achieving a nanoscale fibrous
network that mimics various native tissue structures [15]. This set-up utilizes a high
power source, typically in the kilovolt range, attached to a syringe with polymer solution
pumped out at a low rate, in the range of 1-5 mL/h. During the extrusion process, the high

23
voltage applied to the tip of the syringe evaporates the solvent and fibers are drawn
towards a grounded collector due to the electric field overcoming the surface tension of
the polymer solution [16, 17]. Fibers collected on the grounded collector plate can be
tuned to the nanometer range as controlled by the parameters of voltage, syringe pump
rate, and distance of the syringe tip to the collector [15]. This technique can be used to
produce nanofiber scaffolds in various configurations to not only control the morphology
but also mechanical properties by spatially aligning the fibers [18].
PCL is a commonly used absorbable polymer for biomaterials mainly because of
the favorable degradation time of 24 months in vitro as an electrospun scaffold for long-
term tissue regeneration [1, 19]. Current applications of PCL include the major
components in sutures under the trade name Monocryl® and dental root canal fillings
under the trade name Resilon®. These applications rely on the long degradation time of
PCL to maintain structural integrity. The structure of PCL and overall hydrophobicity
hinders water uptake which delays hydrolytic degradation of the ester bonds [19].
Mechanical properties of PCL as a randomly oriented electrospun scaffold include a
relatively low modulus and tensile strength which limits structural applications requiring
high tensile strength [3]. However, PCL scaffolds exhibit high porosity of up to 70%,
which aids in cell migration into the scaffold [20].
Polyglyconate is a copolymer of glycolic acid (PGA) and trimethylene carbonate
(TMC) currently used for absorbable sutures under the trade name Maxon®. The
monofilament suture form of Maxon is an A-B-A triblock copolymer consisting of a
random copolymer of glycolic acid and trimethylene carbonate as the middle block (B)
and glycolic acid as the ends (A) of the random copolymer [21]. The beneficial properties

24
such as high elasticity, high tensile strength, a reported 67% porosity as an electrospun
scaffold, and ability to complex with other biomolecules are attractive for many
applications including tissue scaffolds [18]. However, the degradation for Maxon is 4-6
weeks as a monofilament suture, which poses challenges for long term reconstructive use
such as tissue engineering applications [22]. The high percentage of glycolic acid in
Maxon contributes to a hydrophilic nature with subsequent fast degradation due to water
uptake and the breakdown of ester linkages [23, 24]. Maxon is currently used in
temporary structures such as surgical sutures and bioabsorbable screws [25].
Neat PCL and Maxon offer both opportunities and challenges in terms of
mechanical performance and degradation stability as a biomaterial for long term
applications for tissue regeneration. For these reasons, PCL is of interest to blend with
Maxon to achieve improved degradation times and dimensional stability of Maxon. In
addition, the chemical homogeneity of PCL and Maxon, which both contain PCL
components, may favor high miscibility in the blends and permit the formation of an
ordered structure without phase separation. This article evaluates the miscibility of two
compositions of blends with Maxon and PCL to determine the effect on mechanical
behavior and degradation.

25
EXPERIMENTAL SECTION
Materials
Poly(caprolactone) with an inherent viscosity of 1.15 dL/g in chloroform (CHCl3)
was purchased from LACTEL Absorbable Polymers, Birmingham, AL. Poly(glycolide-
co-trimethylene carbonate) was purchased in the form of surgical suture packets under
the trade name Maxon® from Advanced Inventory Management, Mokena, IL. The
solvent used for electrospinning was 1,1,1,3,3,3-hexafluoro-2-propanol (HFP), purchased
from Oakwood Products Inc., West Columbia, SC.
Fabrication of scaffolds
Four electrospinning solutions were prepared which included a 3:1 PCL/Maxon
blend and a 3:1 Maxon/PCL blend, respectively, in comparison to neat Maxon and neat
PCL as controls. The blend solutions consisted of a 3:1 mixture of 20% wt/vol PCL to
15% wt/vol Maxon in HFP for a total concentration of 18.75% wt/vol and the 3:1 mixture
of 15% wt/vol Maxon to 20% wt/vol PCL in HFP for a total concentration of 16.25%
wt/vol. The neat PCL solution was a 20% wt/vol in HFP. The neat Maxon solution was
prepared as a 15% wt/vol in HFP by pelletizing the surgical sutures. An electrospinning
setup to obtain a randomly aligned nanofiber scaffold was used to pump 2 mL of polymer
solution with a 5 mL syringe at a rate of 0.2 mL/h through a 25G needle. The average
distance from the needle tip to the grounded collector plate was 20 cm. A high voltage
source (M826, Gamma High-Voltage Research, Ormond Beach, FL) of 12-15 kV was
chosen to produce an average fiber diameter of 500 nm for each of the polymer solutions.
The scaffolds were collected onto a solid sheet of aluminum until a thickness of 0.1-0.3

26
mm was achieved. This thickness was achieved by 1.5-3 mL of polymer solution
electrospun onto a 10 mm x 10 mm collector. Following electrospinning, the samples
were placed in a desiccant environment for seven days to allow for the residual HFP to
evaporate from the samples. Scanning electron microscopy (SEM) was used to determine
a fiber distribution and verify an average diameter of 500 nm using ImageJ software
analysis. The scaffolds were sputter coated with Au-Pd and imaged with an accelerating
voltage of 10 kV by a field emission SEM (Quanta FEG 650 from FEI, Hillsboro, OR).
Miscibility studies
The blended samples (~5 mg) were sealed in an aluminum pan and loaded into a
differential scanning calorimeter (DSC) (Q100 TA Instruments, New Castle, DE) to
analyze the shifts in glass transition temperature, melt behavior, and enthalpy of fusion
from the physical mixing of the two polymers. The neat PCL and Maxon samples were
tested as controls. Each of the samples were subjected to a single temperature ramp
heating from -80 °C to 250 °C at a rate of 10 °C/min.
Etching was also used to investigate the miscibility of the two polymers. Samples
with similar thickness and dimensions of 1 cm by 1 cm of the 3:1 Maxon/PCL and 3:1
PCL/Maxon blends were agitated in 5 mL of dichloromethane (DCM) to etch away the
PCL component. Samples of neat Maxon and PCL were also used as controls; Maxon
does not readily dissolve in DCM. Soaking times of 1hr, 3 hrs, and 5 hrs were used to
determine the proper amount of soaking to thoroughly dissolve the PCL component.
Samples were removed from the DCM followed by rinsing with DCM to remove any
dissolved polymer from the surface of the scaffold and dried overnight in a desiccant

27
environment. The resultant scaffolds were imaged by SEM to determine morphological
changes. The 3:1 Maxon/PCL etched samples were also analyzed by DSC to examine
shifts in melting temperatures and enthalpies as a function of etching time. A single
temperature ramp heating from -80 °C to 250 °C at a rate of 10 °C/min was employed to
verify the removal of the PCL component in the 3:1 Maxon/PCL blends after etching in
DCM.
Phase separation processes of the blends were investigated by DSC with an
annealing procedure of first heating the samples to 250 °C at a rate of 10 °C/min and
cooling to -80 °C to erase thermal history, followed by cyclic annealing-quenching steps
holding at 80 °C -150 °C for 10 minutes and quenching at 20 °C/min to -80 °C. The
heating thermograms from -80 °C to 250 °C at a rate of 10 °C/min after each annealing-
quenching cycle were recorded to observe phase separation.
Mechanical properties evaluation
The scaffolds were sectioned into rectangular strips measuring 5 mm in width, 25
mm in length, and 0.1-0.2 mm in thickness, in accordance with ASTM standard D882 for
tensile testing of thin film plastics. Uniaxial tensile testing (n=5) was performed with dry
samples at ambient conditions with a minimat tensile tester (Rheometric Scientific Inc.)
to determine the modulus of elasticity, percent elongation to failure, and yield strength
from the generated stress-strain curves. The scaffolds were tested using a 20 N load cell
and a strain rate of 5 mm/min until failure.
Dynamic mechanical analysis (DMA) was used to investigate the viscoelastic
properties of the neat and blended samples under cyclic loading over a temperature range

28
from -100 °C to 70 °C with 5° increments. Samples were sectioned to 5 mm x 15 mm
rectangular strips for testing in a 2980 DMA (TA Instruments) over a frequency range
from 0.1 to 1 Hz with load cell of 18 N. A time temperature superposition master curve
was constructed for each sample to display the modulus as a function of the frequency of
loading using reference temperatures of 20°C for the blends, 10°C for neat Maxon, and -
60°C for neat PCL which corresponded to a temperature near the glass transition
temperature for each material [26].
In vitro degradation studies
The neat and blended electrospun scaffolds were sectioned into 1 cm x 1 cm
squares and measured for initial mass and thickness. The samples (n=3) were immersed
in 5 mL of phosphate buffered saline (PBS) at pH 7.3. Each set of samples was incubated
at 37 °C and removed for testing at time points of 6 hours, 12 hours, 1 day, 3 days, 7
days, 21 days, 28 days, and 42 days. The samples were dried in a desiccant environment
for a minimum of 24 hours before initiating mass loss studies. A period of 24 hours was
determined to be sufficient time in a dry environment to effectively remove the PBS
through a process of drying and reweighing each sample until consistent results were
achieved.
SEM images of aged samples from each degradation time point were examined
for changes in morphology due to hydrolytic degradation. Fourier-Transform Infrared
(FT-IR) spectra were obtained for the neat and blend scaffolds using a Thermo Nicolet
Nexus 4700, employing 64 scans per sample, ranging from 4000 to 400 cm-1
in
attenuated total reflection (ATR) mode using an infrared spectrophotometer (Thermo

29
Fisher Scientific Inc., Waltham, MA). FT-IR spectra of the aged samples were obtained
for each representative degradation time point to identify the presence or absence of
specific characteristic bonds after degradation.
Mechanical analysis was performed in the DMA under a controlled force mode
with a film tension fixture. Samples (n=3) from each degradation point were loaded for
uniaxial tensile testing to measure the modulus of elasticity from the initial linear portion
of the generated stress-strain curve. A ramp force procedure of 1.0 N/min with a load cell
of 18 N was used. DSC was carried out on 0 day, 1 day, 7 days, 21 days, and 42 days of
aging samples with a single temperature ramp from -80 °C to 250 °C at a rate of 10
°C/min. The enthalpies of melting corresponding to the Maxon and PCL component were
compared as a function of aging time.
RESULTS AND DISCUSSION
Fabrication of scaffolds
Non-woven, randomly aligned scaffolds consisting of two compositions of
polyglyconate and polycaprolactone were prepared by the electrospinning process. A
ratio of 3:1 polyglyconate to polycaprolactone was coded as 3:1 Maxon/PCL and the
other composition, a ratio of 3:1 polycaprolactone to polyglyconate was coded 3:1
PCL/Maxon. The incorporation of Maxon with PCL was chosen to increase the
mechanical properties of the neat PCL in respect to modulus of elasticity, tensile strength,
and elongation to failure. The PCL was chosen not only because of its extensive use as a
biomaterial in tissue engineering, but also because of the hydrophobic nature contributing
to significantly longer degradation time in vitro than neat Maxon [1, 5, 22]. The

30
compositions of Maxon and PCL blends were chosen to represent a ratio above and
below a 1:1 ratio to avoid phase separation [27]. The SEM images of the Maxon and PCL
electrospun blends given in Figure 1 indicate a porous nanofiber network with even fiber
diameters. This type of morphology is desirable for tissue engineering biomaterials where
high porosity favors cell integration [1]. Measurements of individual fibers indicated the
average fiber diameter of the 3:1 PCL/Maxon scaffolds was 683 ± 134 nm and that of the
3:1 Maxon/PCL scaffolds was 541 ± 109 nm. The 3:1 PCL/Maxon scaffolds exhibited
similar behavior as the neat scaffolds of Maxon and PCL with a broad range of fiber
diameters in the 300 nm to 800 nm range (Figure 2).
Figure 3. SEM images electrospun 3:1 PCL/Maxon (left) and 3:1 Maxon/PCL (right)
blend scaffolds. (Scale bar is 50 microns)
However, the 3:1 Maxon/PCL scaffolds showed a more Gaussian distribution of fiber
diameters with most fibers in the 400 nm to 500 nm range. In general, the scaffolds
composed of higher concentrations of Maxon exhibited a lower average fiber diameter
[18]. This can be attributed to the ability of the Maxon to elongate more easily. During

31
the electrospinning process, the fibers were drawn towards the grounded collector; the
high elasticity of Maxon may have contributed to a higher draw ratio in comparison to
PCL during fiber formation.
Figure 2. Fiber diameter distribution of electrospun nanofiber scaffolds consisting of neat
PCL, neat Maxon, 3:1 PCL/Maxon, and 3:1 Maxon/PCL. 100 measurements were
recorded for each sample.
Miscibility Studies
The level of mixing in a polymer blend can range from miscible, to partially
miscible, or completely immiscible, and this is governed by the basic thermodynamic
relationship shown in Equation 1 [27].
ΔGm = ΔHm - T ΔSm (Equation 1)

32
The physical mixing of two polymers is an enthalpy driven process that results in
a miscible blend when the enthalpy of mixing is negative or the entropy is large. For
amorphous polymers, the degree of miscibility can be determined by the shifting or
coalescence of glass transition temperatures after mixing [27]. Semi-crystalline blends
involve a more complex relationship due to the interactions of both crystalline and
amorphous regions of the two polymers. The level of miscibility of the Maxon and PCL
blends was assessed using differential scanning calorimetry and scanning electron
microscopy.
Thermal analysis was completed for a quantitative evaluation of the degree of
miscibility for the Maxon and PCL blends. Glass transition temperatures (Tg) of the
blends were not clearly distinguishable for each component of the blends due to the
complexity of the system. Maxon is a copolymer with two distinctive glass transition
temperatures at around 15 °C, attributed to motion of the TMC units and 50 °C, attributed
to motion of the PGA units. In the DSC scan for the blends, the melting endotherm of
PCL dominated the heat flow at 50°C therefore the Tg for Maxon was not visible. In
addition, the Tg of PCL at -60 °C was evident only as a very slight baseline shift for neat
PCL and was absent in the blends. Modulated DSC scans were conducted during cooling
in an attempt to separate the crystallization of the PCL component (a non-reversing
phenomenon) from the Tg of the Maxon (a reversing phenomenon); however, the results
were still inconclusive due to the large enthalpy of melt of the PCL component. An
evaluation of the melting temperatures (Tm) and enthalpies of melting was completed to
further characterize the miscibility with the blends. Although two distinct melting points
were observed (Figure 3), broadening and shifting of the peaks confirmed partial

33
miscibility. This slight shifting of melting temperatures in crystalline blends has been
previously shown to indicate partially miscibility [28, 29]. Table 1 shows the thermal
properties for the blends in comparison to the neat polymers. The melting peak for the
PCL component of the 3:1 Maxon/PCL samples showed significant broadening, with a
noticeably lower onset temperature of melting for both the PCL and Maxon component.
This suggested the melting of less crystalline species, presumably caused by the presence
of the Maxon component. The presence of Maxon components incorporated into the PCL
melt suggest a partial miscibility of the polymer blends; a totally miscible system would
exhibit one melting temperature, intermediate between that of the two pure components.
The onset of melting for the PCL and Maxon components exhibited only a slight decrease
for the 3:1 PCL/Maxon blend, which suggested the 3:1 Maxon/PCL blends were more
miscible than the 3:1 PCL/Maxon composition. These results were correlated by the
respective decreases in crystallinity for the two components in the blends, as inferred
from the enthalpy of melting values in Table 1. The decrease in enthalpies upon mixing
suggested that the blends were partially miscible due to the decrease in Gibb’s free
energy, according to Equation 1. The 3:1 Maxon/PCL blend resulted in a higher total
decrease in enthalpy of melting than the 3:1 PCL/Maxon, which suggested a higher
interaction between the two components in the 3:1 Maxon/PCL blend.

34
l l l l l l l l
l
l
l
l
l
l
l
l
l
l
l
l
l
l
l
l l l l l l l l l l l l l l l l l l l l l l
n n n n n n n n n n n n n n n n n n n n n n n nn
n
n
n
n
n
nn
n
n
n
n n n n
£ £ £ £ £ £ £
£
£
£
£
£
£
£
£
£
£
£
£
££ £ £ £ £ £ £ £ £ £ £ £ £ £ £ £ £
££
£ £ £ £
p p p p p p p p
pp
p p p p p p p p p p p p p p p pp
p
p
p
p
p p p p
He
at F
low
(W
/g)
-10 40 90 140 190 240Temperature (°C)
l PCL–––––––n Maxon–––––––£ 3:1 PCL/Maxon–––––––p 3:1 Maxon/PCL–––––––
Exo Up
Figure 3. DSC first heat scans of the Maxon and PCL blends in comparison to the neat
components. The changes in enthalpies of melting indicate the partial miscibility of the
blends.
Table 1.
Comparison of thermal properties of PCL and Maxon electrospun blends to pure
components obtained by first scan of DSC.
Onset Tm (°C) Tm (°C) ΔH (J/g)
PCL 54.7 59.9 85.6
Maxon 203.5 205.6 56.7
3:1 PCL/Maxon 53.2 (PCL)
201.2 (Maxon)
58.1 (PCL)
205.2 (Maxon)
62.3 (PCL)
11.6 (Maxon)
3:1 Maxon/PCL 42.4 (PCL)
186.4 (Maxon)
56.7 (PCL)
204.9 (Maxon)
14.7 (PCL)
36.4 (Maxon)
Etched samples were analyzed by DSC and SEM to further investigate
miscibility. The electrospun PCL scaffolds readily dissolve at room temperature when
immersed in DCM. However, Maxon scaffolds do not dissolve or swell in DCM at room

35
temperature given by average fiber diameter measurements 979 ± 190 nm before etching
and 969 ± 202 nm after etching. This permitted etching of the PCL component. The
blend scaffolds were immersed in DCM and agitated for up to 5 hours in DCM to remove
the dissolved PCL. The 3:1 PCL/Maxon scaffold was completely dissolved by the
washing process after 1 hour since the majority component, PCL, is readily dissolved by
DCM. Therefore, only the 3:1 Maxon/PCL blend was examined further. DSC was
performed on the 3:1 Maxon/PCL blend after 5 hours of etching, which showed the
absence of a melting peak from PCL or the complete removal of the PCL component
(Figure 4). The DSC scan of the etched 3:1 Maxon/PCL scaffold also showed an increase
in crystallinity of the Maxon component and broadening of the melting peak. This
suggested the incorporation of PCL crystalline units disrupted the crystallinity of Maxon,
which further implied partially miscibility of the 3:1 Maxon/PCL blend. The
morphology of the 3:1 Maxon/PCL blend after washing was examined by SEM analysis
for changes in nanofiber morphology. Figure 5 shows the 3:1 Maxon/PCL blend with the
presence of small eroded sections on individual fibers after etching away the PCL.
Immiscible polymer blends typically exhibit easily discernible morphologies in which the
domains are well defined with sharp interfaces [12]. The presence of eroded fibers
suggested phase separation of Maxon and PCL; however, the absence of sharp interfaces
such as large sections of fibers missing suggested a degree of miscibility between the two
polymers.

36
ll
ll
ll
l
l
l
l
l l l l l l l l l l l l l ll
l
l
l
l
l
l
l
l
l l l l
££
£
££
££
£ £ £ £ £ £ £ £ £ £ £ ££
££
££
£
£
£
£
£
£
£
£
£ £ £ £ £
56.7°C
42.4°C14.7J/g
204.9°C
186.4°C36.4J/g
205.1°C
179.8°C47.6J/g
-1.5
-1.0
-0.5
0.0
0.5
He
at F
low
(W
/g)
0 50 100 150 200 250Temperature (°C)
l Neat–––––––£ 5 hrs Etching–––––––
Exo Up
Figure 4. DSC first heat scans of 3:1 Maxon/PCL samples indicating the complete
etching of the PCL component after 5 hour in DCM.
Figure 5. Representative SEM images showing the effect on fiber morphology before
(left) and after (right) etching the PCL with DCM on the 3:1 Maxon/PCL scaffolds.
(Scale bar is 5 microns)

37
An annealing study was completed to further investigate the miscibility and phase
stability of the blends. DSC was employed to anneal the 3:1 Maxon/PCL blend above the
glass transition temperature of both components then quench below -60 °C (the Tg of
PCL) to observe the onset of phase separation upon heating. Figure 6 shows the resulting
thermograms of annealing at temperatures ranging from 80 °C to 150 °C. A small
endotherm located near the melting temperature of PCL developed after annealing at
80 °C and gradually shifted towards the melting temperature of Maxon as the annealing
temperature increased. As the small endotherm converged with the melting of the Maxon
component, the melting peak broadened as evidenced by a decrease in the onset
temperature near 180 °C. This broad melting peak compared more similarly to the
previous DSC scan (Figure 4) in which complete phase separation was achieved. The
shifting of the small peak with annealing temperature suggested an evolution of structure.
A small amount of imperfect crystallites reorganized to a more perfect structure with
annealing temperature. As a result, the melting temperature continually shifted upward
toward the melting temperature of Maxon. This peak is presumably due to partial mixing
of the PGA units of the Maxon, which typically have a melting temperature near
220-230 °C in the crystalline form, with PCL. The intersegmental mixing was promoted
by the electrospinning process.

38
Figure 6. DSC thermograms of the 3:1 Maxon/PCL blend after annealing at the indicated
temperatures and quenching. The arrow indicates increased phase separation with
increasing annealing temperature.
Mechanical Properties Evaluation
Tensile testing was conducted to determine the effect of interactions between
Maxon and PCL on mechanical properties. Figure 7 shows the stress-strain curves for the
Maxon and PCL blends in comparison to the neat components. The 3:1 Maxon/PCL
scaffolds exhibited a higher percent elongation and tensile strength than the neat Maxon,
which may be attributed to synergistic interactions at this composition. In general, the
mechanical properties of the blends improved from the neat components in all aspects.
150°C
120°C
100°C
90°C
80°C
Hea
t F
low
(W
/g)
-50 0 50 100 150 200 250Temperature (°C)Exo Up

39
Figure 7. Uniaxial stress-strain curves of the Maxon and PCL blends. The modulus of
elasticity, percent elongation to failure, and tensile strength increases as the Maxon is
added to PCL.
Table 2 gives the tensile data for the samples tested. The modulus of the 3:1
PCL/Maxon scaffolds was more similar to neat Maxon rather than the lower modulus of
neat PCL. The percent elongation at failure of the 3:1 PCL/Maxon scaffolds remained
similar to the neat PCL. Overall, the 3:1 Maxon/PCL scaffolds showed a more significant
improvement in properties than the 3:1 PCL/Maxon scaffolds. The tensile strength of the
3:1 Maxon/PCL scaffolds improved by a factor of nearly 1.45, in comparison to the neat
Maxon scaffolds. The most significant change in the blended systems was the
improvement in the percent elongation at failure of the 3:1 Maxon/PCL scaffolds. This
was correlated to the thermal analysis studies that showed the larger decrease in melting
temperatures and enthalpy in the 3:1 Maxon/PCL scaffolds, which suggested a higher

40
miscibility. As a result, a larger synergistic effect in mechanical properties was observed
in the 3:1 Maxon/PCL scaffolds.
Table 2.
Tensile properties of electrospun Maxon and PCL blends (n=5).
Modulus
(MPa)
Tensile Strength
(MPa)
Elongation to Failure
(%)
PCL 8.7 ± 1.6 1.8 ± 0.7 180 ± 48
Maxon 22.0 ± 2.2 6.9 ± 0.4 288 ± 107
3:1 PCL/Maxon 20.3 ± 2.0 2.9 ± 0.6 200 ± 82
3:1 Maxon/PCL 19.5 ± 1.7 10.1 ± 1.3 467 ± 23
Dynamic mechanical analysis was used to characterize the viscoelastic properties
of the blends over a wide range of deformation frequency. Understanding the shifts in
mechanical properties with frequency of loading is important in tissue engineering, to
match the mechanical properties of a synthetic graft with the types of mechanical loading
experienced by the native tissue. Figure 8 shows the master curves constructed for the
blends using time-temperature-superposition. Similarities can be observed with the neat
PCL and 3:1 PCL/Maxon blend. In general, the PCL dominant scaffolds did not exhibit a
large variation in storage modulus with frequencies of loading, while the Maxon
dominant scaffolds showed greater frequency dependence. Further insight into the
behavior can be obtained by comparing the dynamic mechanical behavior at the higher
frequencies to the behavior at the lower frequencies. Similarities between the neat PCL
and 3:1 PCL/Maxon samples were observed at frequencies between 103-10
8 rad/s, while
the neat Maxon and the 3:1 Maxon/PCL blends exhibited similar behavior. It is
interesting to note that the neat Maxon showed the highest modulus in this frequency
range. The lowest frequencies, from 10-1
-103 rad/s, were useful in discerning differences
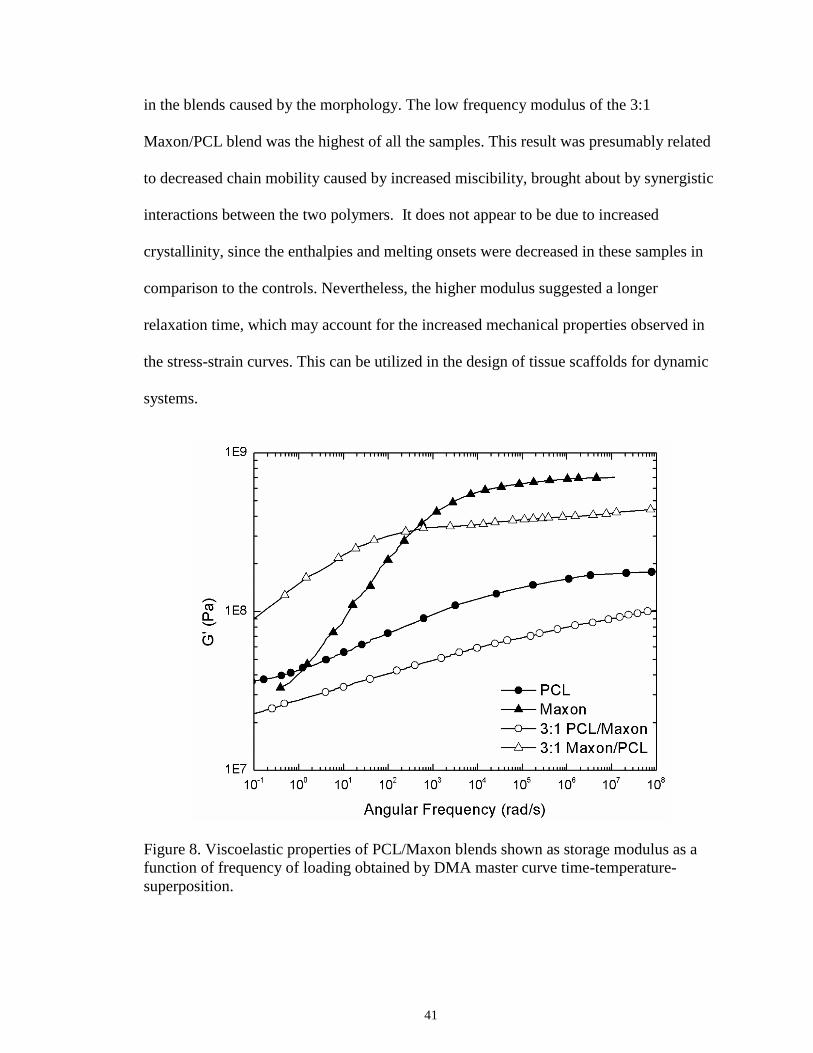
41
in the blends caused by the morphology. The low frequency modulus of the 3:1
Maxon/PCL blend was the highest of all the samples. This result was presumably related
to decreased chain mobility caused by increased miscibility, brought about by synergistic
interactions between the two polymers. It does not appear to be due to increased
crystallinity, since the enthalpies and melting onsets were decreased in these samples in
comparison to the controls. Nevertheless, the higher modulus suggested a longer
relaxation time, which may account for the increased mechanical properties observed in
the stress-strain curves. This can be utilized in the design of tissue scaffolds for dynamic
systems.
Figure 8. Viscoelastic properties of PCL/Maxon blends shown as storage modulus as a
function of frequency of loading obtained by DMA master curve time-temperature-
superposition.

42
In Vitro Degradation Studies
Polymer blends offer the ability to tune the degradation profiles of polymers to
achieve a degradation time that cannot be achieved by the individual components of the
blend. This is desirable in applications such as tissue regeneration and drug delivery to
retain the mechanical integrity of polymer during reconstruction or tailoring the release of
a drug in vivo. The blend scaffolds and control neat components were subjected to 42
days of aging in a static condition of phosphate buffered saline (PBS) at 37 °C to mimic
the degradation in vitro. Mass loss was measured over time to evaluate the degradation of
the polymer blends. After 42 days, there was minimal change in the neat PCL scaffolds,
with a net loss of 1.87% ± 0.06%. This result was predicted by the 24 month degradation
time for electrospun PCL [19]. The blended scaffolds experienced mass loss up to
11.05% ± 0.07% for the 3:1 PCL/Maxon scaffolds and 6.14% ± 0.03% for the 3:1
Maxon/PCL scaffolds. Phase separation in the 3:1 PCL/Maxon scaffolds may be the
cause of the higher mass loss after 42 days in comparison to the 3:1 Maxon/PCL
scaffolds. However, the neat Maxon scaffolds also showed a minimal percentage weight
change of 4.89% ± 0.04% after 42 days of aging. This result contradicted previous results
showing the mass loss of electrospun Maxon and protein blends which experienced a
mass loss of 30-50% over 30 days exposure in PBS [30]. The absence of mass loss
suggested a sustainability of the neat Maxon scaffolds up to 6 weeks in vitro, which
contradicts the extensively studied degradation profiles of Maxon sutures that degrade in
4 to 6 weeks in vitro [22].
SEM images of the scaffolds were analyzed from 0 days to 42 days aging to
explain the adverse results from mass loss measurements. Figure 9 shows the
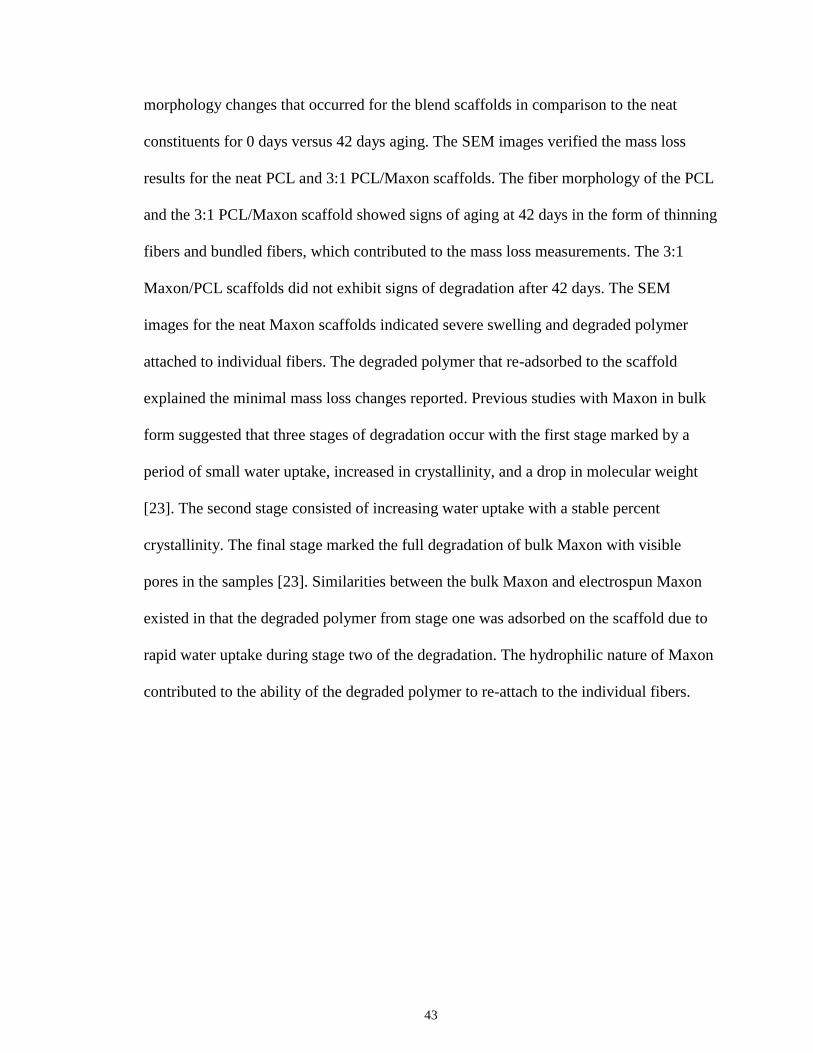
43
morphology changes that occurred for the blend scaffolds in comparison to the neat
constituents for 0 days versus 42 days aging. The SEM images verified the mass loss
results for the neat PCL and 3:1 PCL/Maxon scaffolds. The fiber morphology of the PCL
and the 3:1 PCL/Maxon scaffold showed signs of aging at 42 days in the form of thinning
fibers and bundled fibers, which contributed to the mass loss measurements. The 3:1
Maxon/PCL scaffolds did not exhibit signs of degradation after 42 days. The SEM
images for the neat Maxon scaffolds indicated severe swelling and degraded polymer
attached to individual fibers. The degraded polymer that re-adsorbed to the scaffold
explained the minimal mass loss changes reported. Previous studies with Maxon in bulk
form suggested that three stages of degradation occur with the first stage marked by a
period of small water uptake, increased in crystallinity, and a drop in molecular weight
[23]. The second stage consisted of increasing water uptake with a stable percent
crystallinity. The final stage marked the full degradation of bulk Maxon with visible
pores in the samples [23]. Similarities between the bulk Maxon and electrospun Maxon
existed in that the degraded polymer from stage one was adsorbed on the scaffold due to
rapid water uptake during stage two of the degradation. The hydrophilic nature of Maxon
contributed to the ability of the degraded polymer to re-attach to the individual fibers.

44
Figure 9. Representative SEM images showing the hydrolytic degradation effect on
electrospun PCL, Maxon, 3:1 PCL/Maxon, and 3:1 Maxon/PCL, respectively at 0 day
exposure (A-D) and 42 days exposure (E-H) in phosphate buffered saline at 37°C. (Scale
bar is 20 microns)
H F
G E
D B
C A

45
Furthermore, FT-IR analysis was completed to determine the changes in bonding
due to degradation from aging in PBS. Figure 10A shows the different ATR spectra for
neat PCL and neat Maxon in comparison to the blended scaffolds. A typical spectra for
neat PCL shows prominent characteristic bands for CH2 stretching at 2949 cm-1
and 2865
cm-1
and ester carbonyl stretch at 1727 cm-1
[31, 32]. Additional bands include C-O and
C-C backbone stretching due to the amorphous phase at 1157 cm-1
and the crystalline
phase at 1293 cm-1
[31]. Less prominent peaks at 1240 cm-1
and 1170 cm-1
can be
assigned to C-O-C stretching and the peak at 1190 cm-1
represents the OC-O stretching
[31, 32]. The typical spectra for Maxon represent a combination of characteristic peaks
from the PGA units and TMC units. Stretching of the amorphous phases of the PGA units
appear at 1143, 846, and 716 cm-1
[33]. The crystalline units of PGA appear at 973, 902,
787, 627, and 592 cm-1
[33]. Additional peaks from PGA include C-C-O stretching of the
ester at 1185 cm-1
[33]. Characteristics peaks contributed from the TMC units include the
asymmetrical CH2 stretching at 2964 cm-1
and ester carbonyl stretch at 1729 cm-1
. The
overlapping peaks of C-O ester linkages from both TMC and PGA appear at 1084 cm-1
[30, 33]. The spectra of the dominate polymer in the blended scaffolds contributed to the
3:1 PCL/Maxon scaffold resembling the neat PCL spectrum and the 3:1 Maxon/PCL
scaffold resembling that of the neat Maxon. Slight shifting of peaks occurred with the
most obvious difference occurring in the 3:1 Maxon/PCL with a more prominent peak
from the symmetrically CH2 stretching with the addition of PCL to Maxon. Figure 10B-D
compares the ATR spectra of the blended scaffolds and neat Maxon from 0 to 42 days
aging in PBS. The neat Maxon showed the largest shifts in the spectra in connection to
the degradation of the amorphous PGA units 1143 cm-1
and the breakdown PGA ester

46
linkages at 1185 cm-1
. The decrease in intensity and broadening of the peaks associated
with amorphous PGA units suggested degradation occurring from 21- 42 days of aging.
In general, the intensity of the carbonate carbonyl peak remains relatively constant with a
minor decrease. This result supported the previous reports that Maxon primarily degrades
via the ester linkages and instability of the hydrophilic PGA units [24]. Spectra for the
3:1 PCL/Maxon scaffolds showed minimal differences over 42 days of aging. However,
the characteristic peaks of the amorphous PGA units were overlapped by the OC-O
stretching in PCL. The small amount of degradation reported from the mass loss
measurements and SEM analysis may have been present but not distinguishable in the
FT-IR spectra. Similarly, the 3:1 Maxon/PCL spectra did not show significant breakdown
of the PGA units. This result suggested that the addition of PCL to the Maxon dominate
scaffold prolonged the breakdown of PGA which typically degrades Maxon after 21 days
of aging.

47
Figure 10. FT-IR ATR spectra of A) the comparison of neat PCL, neat Maxon, and the
blended scaffolds at 0 days aging. The effects of aging on the B) Maxon, C) 3:1
PCL/Maxon, and D) 3:1 Maxon/PCL scaffolds showing hydrolytic degradation from
exposure to phosphate buffered saline for 0 days, 21 days, and 42 days. (The asterisks
indicate the wavenumbers signifying the breakdown of amorphous PGA units in the
Maxon)

48
Since these polymer blends are expected to be used in future applications for
tissue engineering, tensile testing was employed to evaluate the mechanical integrity of
the scaffold blends after aging 42 days. Table 3 reports the modulus of elasticity of the
scaffolds as a function of aging time. The modulus of the neat PCL scaffolds remained
fairly constant which was consistent with the known 24 month degradation of PCL. The
neat Maxon scaffolds showed a marked increase in modulus at 7 days which led to an
eventual brittle failure at 42 days. This result was consistent with the stage 1 to stage 2
transition of the bulk degradation of Maxon, which is marked by an increase in
crystallinity, and thus an increase in modulus. Physical cracking of electrospun scaffolds
has also been reported at 30 days in vitro studies in PBS [30]. In addition, the re-
adsorption of polymer onto the scaffold may have contributed to the increase in modulus
making the nanofiber scaffold behave more like a sheet of polymer. The 3:1 PCL/Maxon
scaffold exhibited a marked decrease in modulus from 7-21 days with an increasing trend
at 42 days. This result was consistent with the SEM images in Figure 7 which showed
signs of minimal degradation. The slight decline in modulus may be attributed to the
degradation of the Maxon component and re-adsorption to the scaffold at 42 days. The
3:1 Maxon/PCL scaffolds showed an increase in modulus at 7 days, consistent with the
neat Maxon scaffolds due to the increase in crystallinity and water uptake. However, the
modulus at 21 to 42 days held at a constant 21 MPa which suggested that the addition of
PCL prolonged the degradation of Maxon to at least 6 weeks. The segmental
reorganization of the TMC and PGA units in Maxon due to cleavage-induced
crystallization may account for the variation in modulus of elasticity at 7 days followed
by stabilization thereafter [34].

49
Table 3.
Modulus of elasticity as a function of aging time.
Aging time (days)
0 7 21 42
PCL 8.7 ± 1.6 8.7 ± 2.3 10.1 ± 3.1 10.0 ± 1.6
Maxon 22.0 ± 2.2 34.6 ± 4.8 34.3 ± 8.4 Too Brittle
3:1 PCL/Maxon 20.3 ± 2.0 11.8 ± 0.4 13.5 ± 3.9 18.0 ± 0.5
3:1 Maxon/PCL 19.5 ± 1.7 32.6 ± 6.3 21.2 ± 3.6 21.8 ± 4.3
Thermal analysis of the blends was carried out after aging in phosphate buffered
saline to further characterize the mechanisms of degradation. Single DSC heat scans were
performed at each time point from 0 to 42 days as a comparison of the enthalpy
contributions from both PCL and Maxon. Figure 11 shows the summary of changes in
enthalpy for each component as a function of aging time. The Maxon control scaffolds
exhibited a marked increase in enthalpy or crystallinity from 0 to 14 days which was
consistent with previous studies depicting the first stage of degradation marked by an
increase in crystallinity from the segmental reorganization of PGA and TMC units [23,
34]. The more dramatic increase in crystallinity from 21 to 42 days was also consistent
with the third stage of degradation, marked by large water uptake that contributes to
physical cracking of the samples. The PCL control scaffolds also exhibited a gradual
increase in crystallinity over the 42 day aging time period. While the increase in
crystallinity of Maxon favors degradation, the increase in crystallinity of PCL in vitro
was largely due to effects of polymer recrystallization [35]. The recrystallization of PCL
in vitro increases the hydrophobicity of PCL which provides resistance to degradation
[35]. This result can be related to the increase in modulus from 21 to 42 days observed in

50
the tensile data. The 3:1 PCL/Maxon blend maintained relatively constant enthalpies of
fusion over the aging period which suggested the blend was a stable structure with no
degradation. However, the SEM images from Figure 9 showed signs of degradation. The
interactions between Maxon and PCL components in the 3:1 PCL/Maxon blend favored
degradation. This is due to the miscible components preventing the recrystallization of
PCL. As a result, no additional crystallites formed to protect the hydrophilic segments of
Maxon. The 3:1 Maxon/PCL blend exhibited characteristics from both the PCL
component with a gradual increase in crystallinity and an initial increase in crystallinity
from Maxon. However, the stabilized enthalpy of fusion after 7 days of the Maxon
component suggested a resistance to water uptake that prolonged degradation. This result
corresponded to the partial miscibility in the 3:1 Maxon/PCL blend as well as the
constant modulus from 14 to 42 days in the tensile data.

51
Figure 11. Degradation effects on enthalpy of fusion as a function of aging time in PBS
at 37°C. Solid lines represent the PCL component and dashed lines represent the Maxon
component of enthalpy.

52
CONCLUSIONS
Blends of electrospun polycaprolactone (PCL) and polyglyconate (Maxon) were
reported for the first time. The scaffolds were prepared with two compositions, a 3:1 ratio
of Maxon to PCL and a 3:1 ratio of PCL to Maxon. The studies reported aimed to provide
a comprehensive evaluation of the two blends studied in terms of the degree of
miscibility, mechanical performance, and degradation profiles. The 3:1 Maxon/PCL
showed the highest miscibility in the comparison of the two blends. In addition, the
miscibility contributed to synergistic mechanical properties. The tensile strength of the
3:1 Maxon/PCL scaffolds (10.0 ± 1.3 MPa) improved from the neat Maxon (6.9 ± 0.4
MPa). The 3:1 Maxon/PCL scaffold also improved in the percent elongation to failure,
which increased from the neat Maxon (288 ± 107 %) to 467 ± 23 % for the blend. In
general, the blending of Maxon with PCL resulted in an increase from the inherent
properties of PCL. These are presumably due to synergistic interactions between the
polymers. The degradation of Maxon as an electrospun scaffold was extended up to 6
weeks by the blending with PCL. SEM images, FT-IR spectra, and DSC confirmed little
to no degradation in the blended scaffolds after 42 days in vitro studies in phosphate
buffered saline.
ACKNOWLEDGEMENTS
The authors acknowledge the funding sources for this work from the UAB Ireland
Tuition. We also acknowledge the help from the UAB Polymers Research Group
including John Tipton, for the support of this work.

53
REFERENCES
1. Ma PX. Materials Today 2004;7(5):30-40.
2. Liu X, Holzwarth JM, and Ma PX. Macromolecular Bioscience 2012;12(7):911-
919.
3. Jagur-Grodzinski J. Polymers for Advanced Technologies 2006;17(6):395-418.
4. Hutmacher DW. Biomaterials 2000;21(24):2529-2543.
5. Phipps MC, Clem WC, Catledge SA, Xu Y, Hennessy KM, Thomas V, Jablonsky
MJ, Chowdhury S, Stanishevsky AV, Vohra YK, and Bellis SL. PLoS ONE
2011;6(2):e16813.
6. Makadia H and Siegel S. Polymers 2011;3(3):1377-1397.
7. Lü J-M, Wang X, Marin-Muller C, Wang H, Lin PH, Yao Q, and Chen C. Expert
Rev Mol Diagn 2009;9(4):325-341.
8. Cleek RL, Ting KC, G. Eskin S, and Mikos AG. Journal of Controlled Release
1997;48(2–3):259-268.
9. Sokolsky-Papkov M, Agashi K, Olaye A, Shakesheff K, and Domb AJ. Advanced
Drug Delivery Reviews 2007;59(4–5):187-206.
10. Allen C, Maysinger D, and Eisenberg A. Colloids and Surfaces B: Biointerfaces
1999;16(1–4):3-27.
11. Jeong B, Choi YK, Bae YH, Zentner G, and Kim SW. Journal of Controlled
Release 1999;62(1–2):109-114.
12. Dell'Erba R, Groeninckx G, Maglio G, Malinconico M, and Migliozzi A. Polymer
2001;42(18):7831-7840.
13. Jose MV, Thomas V, Dean DR, and Nyairo E. Polymer 2009;50(15):3778-3785.
14. Chen W, Tabata Y, and Wah Tong Y. Current Pharmaceutical Design
2010;16(21):2388-2394.
15. Huang Z-M, Zhang YZ, Kotaki M, and Ramakrishna S. Composites Science and
Technology 2003;63(15):2223-2253.
16. Doshi J and Reneker DH. Journal of Electrostatics 1995;35(2–3):151-160.
17. Reneker DH and Yarin AL. Polymer 2008;49(10):2387-2425.
18. Thomas V, Zhang X, Catledge SA, and Vohra YK. Biomed Mater 2007;2(4):224-
232.
19. Thomas V, Dean DR, and Vohra YK. Current Nanoscience 2006;2(3):155-177.
20. Lee S-H and Shin H. Advanced Drug Delivery Reviews 2007;59(4–5):339-359.
21. Casey DJ and Roby MS. U.S. Patent 4,429,080 1984.
22. Kangas J, Paasimaa S, Mäkelä P, Leppilahti J, Törmälä P, Waris T, and
Ashammakhi N. Journal of Biomedical Materials Research 2001;58(1):121-126.
23. Noorsal K, Mantle MD, Gladden LF, and Cameron RE. Journal of Applied
Polymer Science 2005;95(3):475-486.
24. Zurita R, Franco L, Puiggalí J, and Rodríguez-Galán A. Polymer Degradation and
Stability 2007;92(6):975-985.
25. Middleton JC and Tipton AJ. Biomaterials 2000;21(23):2335-2346.
26. Sperling LH. Introduction to Physical Polymer Science, 4th ed.: John Wiley and
Sons Inc., 2006.
27. Young RJ and Lovell PPA. Introduction to Polymers: Taylor and Francis, 2011.
28. Cho JW, Tasaka S, and Miyata S. Polym J 1993;25(12):1267-1274.

54
29. Aubin M, Bédard Y, Morrissette M-F, and Prud'homme RE. Journal of Polymer
Science: Polymer Physics Edition 1983;21(2):233-240.
30. Zhang X, Thomas V, and Vohra YK. Journal of Biomedical Materials Research
Part B: Applied Biomaterials 2009;89B(1):135-147.
31. Coleman MM, Varnell DF, and Runt JP. Fourier Transform Infared Studies of
Polymer Blends: IV. Poly (ɛ-Caprolactone) — Poly(Bis-Phenol A-Carbonate)
System. In: Bailey W and Tsuruta T, editors. Contemporary Topics in Polymer
Science: Springer New York, 1984. pp. 807-828.
32. Elzein T, Nasser-Eddine M, Delaite C, Bistac S, and Dumas P. Journal of Colloid
and Interface Science 2004;273(2):381-387.
33. Chu CC, Zhang L, and Coyne LD. Journal of Applied Polymer Science
1995;56(10):1275-1294.
34. Shalaby SW and Burg KJL. Absorbable and Biodegradable Polymers: Taylor &
Francis, 2003.
35. Lam CXF, Hutmacher DW, Schantz J-T, Woodruff MA, and Teoh SH. Journal of
Biomedical Materials Research Part A 2009;90A(3):906-919.
55
6. CONTROLLED PATTERNING OF NANO-HYDROXYAPATITE BY DIP-
PEN NANOLITHOGRAPHY
by
CARRIE SCHINDLER, SONAL SINGH, SHANE A. CATLEDGE, VINOY THOMAS,
DERRICK R. DEAN
In preparation for submission to Biofabrication
Format adapted for dissertation

56
ABSTRACT
Nanoparticle based inks of nano-hydroxyapatite were designed for specific use with dip-
pen nanolithography. The effect of ink viscosity was studied in terms of dispersion,
stability, and accuracy of patterning to determine the optimal formulation for high
throughput printing onto electrospun scaffolds. Dynamic light scattering and scanning
electron microscopy were used to determine the dispersion of nano-hydroxyapatite in
solution. The stability of the inks was evaluated by zeta potential measurements and the
tendency for nanoHA sedimentation overtime, which resulted in better stability with the
higher viscosity inks. Atomic force microscopy and scanning electron microscopy were
utilized to image the dip-pen nanolithography patterns on a SiO2 substrate and
electrospun polymer scaffold following printing. The optimal ink consisted of 30%
glycerol and 3 w/v % nano-hydroxyapatite with printed features ranging from 745 – 1175
nm on a SiO2 substrate. Additionally, nano-hydroxyapatite was patterned onto both single
electrospun fibers and an electrospun scaffold without fiber damage.

57
INTRODUCTION
Efforts to enhance the biocompatibility and bioactivity of polymer scaffolds have
resulted in the development of many techniques to modify tissue scaffolds with bioactive
components. In particular, hydroxyapatite (HA) has been widely used for functionalizing
bone regenerative biomaterials [1-3]. HA is a mineral consisting of calcium and
phosphates Ca5(PO4)3(OH), naturally present in bone tissue [4, 5]. The attractive
properties of HA for tissue engineering biomaterials include the osteoinductive properties
and the exceptional bonding affinity to bone and growth factors [5, 6]. HA has been
incorporated in polymer scaffolds in many forms including nano-hydroxyapatite
(nanoHA) particles [7-9]. Studies suggest that depositing nanoHA onto electrospun
polymer scaffolds improves the biocompatibility and facilitates cell communication by
excretion upon implantation in-vivo [4, 10, 11]. Additionally, tissue scaffolds
incorporating nanoHA in combination with bone growth factors helps sustain the release
of the bone growth factors for 2-8 weeks, achieving the ultimate goal of bone reformation
[11]. There is evidence that the surface properties of these scaffolds determines the
cellular response; for instance, the cellular response and growth can altered by different
nanoscale patterns of nanoHA on the scaffold surface [12, 13].
Several methods of incorporating nanoHA onto biomaterials exist, including 3D
bio-printing/ink-jet printing [14], electrophoretic deposition [10], electrospraying [7], and
microcontact printing [15]. Each of these techniques comes with limitations on either the
resolution of printing, scalability, or the accuracy of printing [16]. Dip-pen
nanolithography (DPN) offers the ability to print nanoparticle-based inks with nanoscale
resolution and precise control of placement on the substrate [17]. The deposition process

58
of DPN relies on the water meniscus formed between a sharp tip and the substrate [18].
This direct-write technique utilizes electrostatic interactions and chemisorption to transfer
nanoparticles to a variety of substrates [18]. Advantages over similar fabrication methods
such as ink-jet printing include higher resolution and direct transport of ink to the
substrate rather than through a nozzle. NanoHA can be dispersed by ultrasonication prior
to printing and patterned onto a substrate with nanoscale precision. This work presents
the formulation of a nanoHA ink for DPN patterning on many surfaces, including
electrospun scaffolds. The dispersion, stability, and accuracy of printing were
investigated to tune the viscosity of the inks for nanoscale printing.
EXPERIMENTAL SECTION
Ink formulation
Commercial nanoHA powder was purchased from Nanocerox Inc. (Ann Arbor,
MI) with an average particle diameter of 100 nm. Ultrasonication using a probe (Sonics
Ultrasonic processor Model GE 750) operating at 20 kHz for three minutes was used to
disperse the nanoHA powder into a carrier solution which consisted of 99% isopropyl
alcohol, polyvinyl butyral (PVB), and glycerol. The concentration of nanoHA and PVB
were held constant at 3 w/v % and 0.03 w/v %, respectively, based on previously
established stable suspensions of nanoHA [10]. The viscosity of the carrier solution was
altered by the addition of 0 – 90% (by weight) glycerol in 20% increments. A Brookfield
viscometer (DV-II+Pro) at 25 °C using the CP40 spindle was used to measure the
resultant changes in viscosity with the addition of glycerol. An average viscosity for each
solution was obtained by averaging six measurements over a shear rate range from 75 –

59
300 s-1
. The solutions with an average viscosity in the range for DPN printing or 5 – 15
cP were used for further experimentation.
Dispersion of nanoHA
The size distribution of the nanoHA particles in solution were measured using
dynamic light-scattering on a Zetasizer Nano ZS (Malvern Instruments) with an
irradiation of 633 nm He-Ne laser. Control solutions without nanoHA were also
measured to confirm the absence of nanoparticles in the carrier solution. All
measurements were performed using the measured viscosity and refractive index of each
solution as the dispersant. The size distribution was calculated by applying the Stokes-
Einstein equation.
Scanning electron microscopy (SEM) was also employed by a field emission
SEM (Quanta FEG 650 from FEI, Hillsboro, OR) to compare the calculated average
diameter of nanoHA in solution to the particle size by image analysis. Approximately 5
μL of each solution was loaded onto an SEM stub and allowed to dry in a vacuum oven
for at least 24 hours at an elevated temperature of 60 °C. The samples were sputter coated
with Au-Pd and imaged. ImageJ software was used to measure the average particle size
of nanoHA with 50 measurements over 3 frames.
Stability of the inks
Turbidity measurements using a turbidimeter (Hach 2100N) were performed
versus time to evaluate the sedimentation of nanoHA in solution following sonication

60
over a time period of 72 hours. The turbidity value at time points of 1, 2, 4, 6, 24, 36, and
72 was recorded when the instantaneous turbidity remained constant for at least 3 s.
The zeta potential of the nanoHA solutions were measured using a Zetasizer Nano
ZS (Malvern Instruments) with an irradiation of 633 nm He-Ne laser and at least 180
scans (n = 3). Control samples of solutions without nanoHA were also measured to
confirm the neutrality of the solvent. All measurements were performed using the
standard values of isopropyl alcohol as the dispersant. The zeta potential was calculated
by applying the Helmholtz-Smoluchowski equation to evaluate the stability of the
nanoHA solutions.
DPN printing on SiO2 substrates
All printing of nanoHA inks was carried out in an environmental chamber with a
Nanoink DPN 5000 with contact M-type pen arrays purchased from Nanoink Inc. Unless
noted otherwise, the temperature and relative humidity of the environmental chamber was
set to 22 °C and 30%. SiO2 substrates with pre-marked labels (Advanced Creative
Solutions Technology) were used for printing in site specific locations. InkCAD software
was used to print a 3 x 3 array of dots with a dwell time of 1, 3, and 5 seconds for each of
the well-dispersed nanoHA inks.
The arrays were imaged using close-contact atomic force microscopy on the
Nanoink DPN 5000 to measure the topographic dimensions and phase images of the dots.
The average dot diameter and z-height of each printing condition was averaged over 5
arrays. SEM analysis with energy dispersive spectroscopy (EDS by TEAMTM
EDAX)
was used to visually verify and identify the presence of nanoHA within each dot.
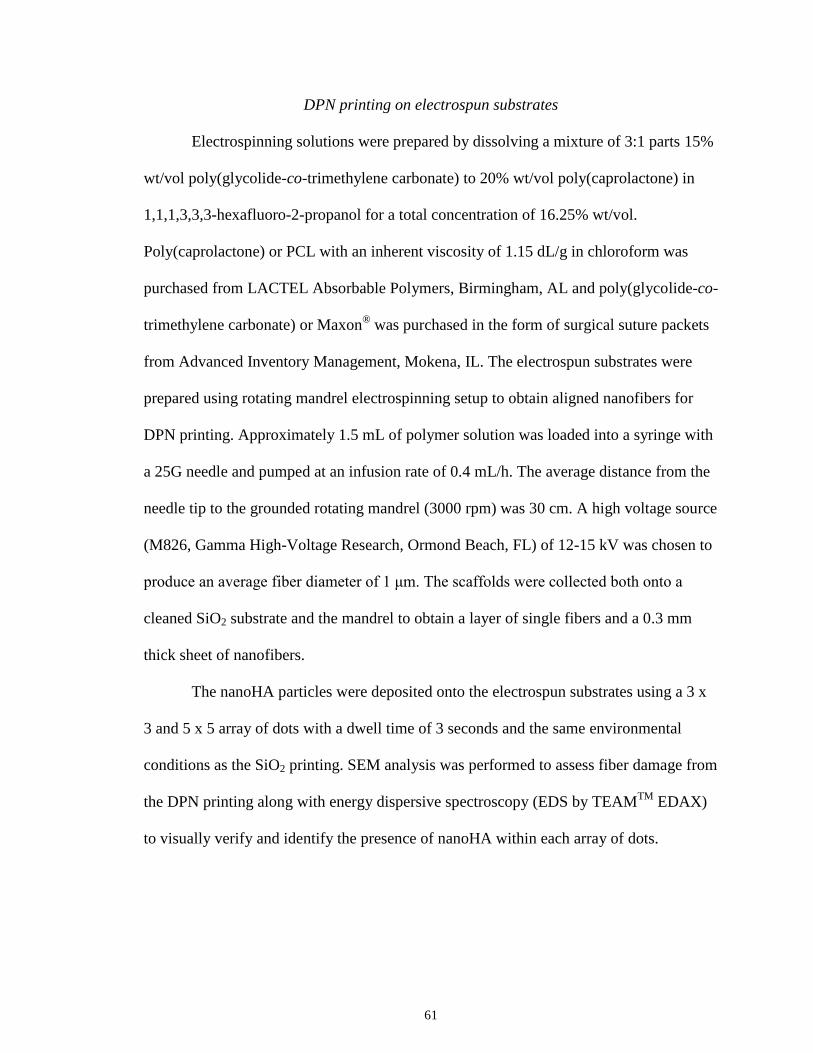
61
DPN printing on electrospun substrates
Electrospinning solutions were prepared by dissolving a mixture of 3:1 parts 15%
wt/vol poly(glycolide-co-trimethylene carbonate) to 20% wt/vol poly(caprolactone) in
1,1,1,3,3,3-hexafluoro-2-propanol for a total concentration of 16.25% wt/vol.
Poly(caprolactone) or PCL with an inherent viscosity of 1.15 dL/g in chloroform was
purchased from LACTEL Absorbable Polymers, Birmingham, AL and poly(glycolide-co-
trimethylene carbonate) or Maxon® was purchased in the form of surgical suture packets
from Advanced Inventory Management, Mokena, IL. The electrospun substrates were
prepared using rotating mandrel electrospinning setup to obtain aligned nanofibers for
DPN printing. Approximately 1.5 mL of polymer solution was loaded into a syringe with
a 25G needle and pumped at an infusion rate of 0.4 mL/h. The average distance from the
needle tip to the grounded rotating mandrel (3000 rpm) was 30 cm. A high voltage source
(M826, Gamma High-Voltage Research, Ormond Beach, FL) of 12-15 kV was chosen to
produce an average fiber diameter of 1 μm. The scaffolds were collected both onto a
cleaned SiO2 substrate and the mandrel to obtain a layer of single fibers and a 0.3 mm
thick sheet of nanofibers.
The nanoHA particles were deposited onto the electrospun substrates using a 3 x
3 and 5 x 5 array of dots with a dwell time of 3 seconds and the same environmental
conditions as the SiO2 printing. SEM analysis was performed to assess fiber damage from
the DPN printing along with energy dispersive spectroscopy (EDS by TEAMTM
EDAX)
to visually verify and identify the presence of nanoHA within each array of dots.

62
RESULTS AND DISCUSSION
Ink formulation
NanoHA inks were formulated with multiple components including a surfactant,
PVB, to aid in the dispersion and stability of the nanoparticle suspension. The main
component of the inks consisted of 60 – 90% (by volume) isopropyl alcohol which was
selected for the weak bond strength to aid in evaporation after DPN printing. The
concentration of nanoHA particles in the solutions remained constant whereas the
viscosity was varied using glycerol as a rheological modifier. Figure 1 shows the
viscosity dependence on glycerol concentration of the nanoHA inks and the targeted
range for DPN printing.
Figure 4. Average viscosity measurements at 25°C as a function of glycerol content for
nanoHA inks, showing the target viscosity range for DPN printing (n = 6).
Typically, nanoparticle-based DPN ink viscosities in the range from 5 – 15 cP have been
shown to effectively transfer nanoparticles to the substrate [17]. Two glycerol

63
concentrations were chosen within the targeted range, including 30% and 50%, for future
study as compared to a control solution of 0% glycerol.
Dispersion of nanoHA
The dispersion of the nanoHA inks was evaluated to determine the optimal
viscosity to achieve a well-dispersed suspension for DPN printing. The solutions were
sonicated with ultrasonication and immediately analyzed for average particle size using
DLS. Figure 2 shows the nanoHA particle size distribution as a function of viscosity.
Figure 5. Dynamic light-scattering particle size distributions of nanoHA solutions as a
function of increasing glycerol content from 0 – 90 % glycerol.
The inks within the targeted viscosity range exhibited an average particle size of
approximately 195 nm, whereas the 0% glycerol solution showed a much broader size
distribution with an average particle size of 287 nm. These values were compared to the

64
average particle diameter of the nanoHA powder as received commercially, which was
approximately 100 nm. This confirmed that the 30% and 50% glycerol solutions
demonstrated good dispersion of the nanoHA particles. In addition to DLS, SEM image
analysis was performed to directly measure the average particle size of the nanoHA
solutions in the dried state. Table 1 summarizes the comparison of nanoHA diameter
measurements by DLS and SEM.
Table 1. Average particle diameter measurements of nanoHA solutions by
dynamic light-scattering and SEM analysis.
Glycerol Content
(%)
Dynamic Light-Scattering
(nm)
SEM
(nm)
0 286.9 ± 93.3 129.8 ± 64.8
30 197.9 ± 41.5 120.6 ± 65.2
50 192.0 ± 37.1 131.1 ± 79.3
The size increase when comparing direct SEM measurements to the DLS measurements
was attributed to the hydrodynamic diameter of the nanoHA particles in solution
approximated by the Brownian motion of particles in solution. The 77% average increase
in particle diameter may account for the PVB surfactant surrounding the nanoHA that
aided in dispersion. In general, both measurements supported that the 30% and 50%
glycerol solutions were well-dispersed by ultrasonication. However, differences in
evaporation rates showed drying effects as a result of increasing glycerol content. Figure
3 demonstrates the drying effects present in SEM images of the nanoHA solutions in
comparison to the as received powder.

65
Figure 6. SEM images showing the changes in nanoHA distribution of A) as received
powder and nanoHA solutions with B) 0% glycerol C) 30% glycerol and D) 50%
glycerol. (Scale bar is 1 micron)
The nanoHA particles tended to merge into larger domains as the viscosity of the solution
increased. Although the particles become denser in the dried solutions, individual
particles remain present throughout instead of agglomerated particles of that of the as
received powder (Figure 3A).
Stability of the inks
In addition to achieving a well-dispersed nanoHA solution, the stability of the
solutions was analyzed overtime to determine the optimal solution for nanoHA printing.
Figure 4 shows the local changes in turbidity as a function of sonication time.

66
`
Figure 4. Turbidity measurements as a function of time after sonication showing the
stability of the nanoHA inks with increasing glycerol content.
In general, the higher viscosity inks in the 5 – 15 cP range exhibited better stability with
less than 6% decrease in turbidity over a 72 hour time period. The control solution of 0%
glycerol showed a 11.1% decrease in turbidity as compared to the 30% and 50% glycerol
solutions. The increased stability of the higher viscosity inks can be related to the
increase in drag forces on the nanoHA particles in solution, which tended to delay the
agglomeration of particles overtime.
Zeta potential measurements were also recorded directly following ultrasonication
of the nanoHA inks. Typically, a zeta potential at or above ± 25 mV indicates a highly
stable nanosuspension. The 30% and 50% glycerol solutions showed zeta potential values
of 17.0 ± 3.2 mV and 15.3 ± 2.2 mV, respectively. These values were consistent with the
stable nanosuspensions (less than 6% changes in turbidity) over a time period of 72
hours. The control solution measured significantly lower than the 30% and 50% glycerol

67
solutions, with a zeta potential of 8.2 ± 1.6 mV. This confirmed the increased stability of
the higher viscosity inks. The 30% and 50% glycerol solutions were used for all
subsequent DPN printing.
DPN printing on SiO2 substrates
The 30% and 50% glycerol nanoHA inks were first patterned onto a gridded SiO2
substrate to determine the accuracy of printing. Dwell times of 1, 3, and 5 seconds were
used to achieve a range of dot dimensions and study the effects of dwell time on ink
formulation. The temperature and humidity of the environmental chamber was held at
22°C and 30%, respectively as the 3 x 3 arrays of each dwell time were printed. The 50%
glycerol solution behaved quite differently than the 30% glycerol solution. The
microchannels of the DPN tips clogged during the printing process which stopped the
flow of ink to the substrate. As a result, patterns were not printed with the 1 and 3 second
dwell times. The viscosity of the 50% glycerol solution was too high to accommodate the
concentration of nanoHA. Therefore, the 30% glycerol solution was used for all printing
to examine the effect of dwell time on the size of features. Close-contact AFM was used
to measure the dot diameter and z-height of each dot in 5 arrays. Figure 5 shows the
measurements from topographic AFM images of the DPN printed arrays.

68
Figure 5. Measurements of dot diameter and z-height from AFM topography images
averaged over 3 x 3 DPN printed arrays (n=5) as a function of dwell time.
In general, the dot diameter and z-height increase as the DPN tip contacts the substrate
for a longer period of time. A larger volume of ink transfers to the substrate with
increasing dwell time. These results were trivial and consistent with previous literature
[19]. More importantly, the patterned nanoHA measured in the sub-micron to micron
range. The dot diameters of the 1, 3, and 5 second dwell times were 745 ± 97 nm, 1157 ±
122 nm, and 1175 ± 114 nm, respectively. This resolution of patterning improves upon
the achievable size of features printed by microcontact printing or ink-jet printing [15,
20].
In addition to examining the dot dimensions, AFM phase images were used to
assess the transfer of nanoHA particles to the substrate. Figure 6 shows the AFM phase
images for each dwell time of the 30% glycerol ink.

69
Figure 6. AFM phase images of DPN printed dots with increasing dwell times of A) 1
second B) 3 seconds and C) 5 seconds indicating the presence of nanoHA particles within
each dot. (Scale bar is 1 micron)
NanoHA particles were present in each of the dwell times; however, less nanoHA
particles were transferred with the 1 second dwell time than the 3 and 5 second dwell
times. The 3 and 5 second dwell times produced maximal loading of nanoHA within each
dot with little particles agglomeration. The DPN printed dots did not show the same
drying effects as the SEM images from Figure 3. This result may be related to the faster
drying time of the smaller volume of nanoHA ink with the printed features as opposed to
the larger volume of ink imaged by SEM. A 3 second dwell time was determined as the
optimal dwell time to minimize dot diameter with maximal loading of nanoHA.
DPN printing on electrospun substrates
Electrospun polymer substrates were also functionalized with the 30% glycerol
nanoHA ink by dip-pen nanolithography. Single fibers were collected on a SiO2 substrate
by briefly collecting a small layer of fibers using a rotating mandrel set-up. An
electrospun scaffold approximately 0.3 mm in thickness with aligned fibers was also
produced as a substrate for DPN printing. The average fiber diameter of the samples was
674 ± 176 nm as measured by several SEM images. The single layer of fibers was first

70
functionalized with DPN using a 3 x 3 and 5 x 5 array of dots with a 3 second dwell time.
This was performed to study the interactions of the nanoHA ink with the individual
fibers. Figure 7 shows SEM images of the printed arrays on single electrospun fibers,
indicating the presence of nanoHA particles.
Figure 7. SEM images of A-B) electrospun fibers on a SiO2 substrate indicating the
presence of nanoHA particles printed by DPN. (Scale bar is 10 microns) The nanoHA
particles were confirmed with C) the EDS spectrum of the printed features.
The SEM images (Figure 7A-B) not only showed the patterns of nanoHA on the surface
of the SiO2 substrate and electrospun fibers, but also appeared to bond to the fibers after
the carrier solution evaporated. In addition, no fiber damage was observed from the
contact of the DPN tips. The presence of nanoHA particles was also verified by EDS

71
(Figure 7C). The EDS spectrum from the indicated features detected x-rays characteristic
of multiple inner shell transitions of calcium and phosphorous. This was consistent with
nanoHA, which is comprised of calcium and phosphates. The presence of gold was a
result of sputter coating the samples prior to imaging.
Finally, the nanoHA ink was printed onto an electrospun scaffold with a 5 x 5
array and 3 second dwell time. Figure 8 shows the SEM images of the electrospun
scaffold before and after printing to examine effects of DPN printing.
Figure 8. SEM images of aligned electrospun scaffolds A) before and B) after DPN
printing, indicating the presence of nanoHA particles along a single fiber. (Scale bar is 5
microns) The nanoHA particles were confirmed with C) the EDS spectrum of the printed
features.

72
Similar results were found with the electrospun scaffolds as there was no evidence of
fiber damage from the sharp tips used for DPN printing. The spherical nanoHA particles
were present in well-defined areas along the length of a bundle of fibers. Additionally,
some particles were found embedded further into the scaffold, which cannot be avoided
by depositing a liquid ink onto the surface. However, the presence of nanoHA particles
within the scaffold may offer the benefits of recruiting cells into the scaffold to aid in the
regenerative process. An EDS spectrum of the printed features was also performed to
verify that the spherical particles were nanoHA. Several x-rays consistent with inner shell
transitions of calcium were detected along with the expected elements of carbon, oxygen,
and gold from the polymer scaffold and sputter coating.
CONCLUSIONS

73
NanoHA inks were formulated for controlled patterning by dip-pen
nanolithography. The optimal ink viscosity was determined by evaluating the degree of
dispersion, stability, and accuracy of printing. Formulations with viscosities in the range
of 5 – 15 cP or 30% and 50% glycerol were chosen for DPN printing. Dynamic light
scattering and SEM analysis showed that all viscosities indicated a well-dispersed
solution. Zeta potential and turbidity measurements studied the effect of glycerol content
over time to evaluate the stability of the inks. Higher glycerol content increased the drag
forces of the nanoHA particles in solution to achieve stable solutions. AFM imaging
showed that the 3 w/v % nanoHA solution with 30% glycerol accurately transferred
features from 745 – 1175 nm on a SiO2 substrate. Additionally, electrospun polymer
scaffolds were functionalized by DPN for the first time. SEM with EDS confirmed the
transfer of nanoHA particles in controlled patterns on the fibers. In general, little or no
negative effects of the carrier solution or DPN tips was present which indicated DPN was
a viable option for depositing nanoscale patterns of nanoHA onto electrospun polymer
scaffolds.
ACKNOWLEDGEMENTS
The authors acknowledge the Alabama Space Grant Consortium and NASA Training
Grant NNX10AJ80H for funding the work. We also acknowledge the Dr.
Kharlampieva’s UAB Polymers Research Group, the UAB SEM facility, and Jason Kirby
for use of the turbidimeter.

74
REFERENCES
1. Hutmacher DW. Biomaterials 2000;21(24):2529-2543.
2. Petite H, Viateau V, Bensaid W, de Pollak C, Bourgignon M, Oudina K, Sedel L,
and Guillemin G. Nat Biotech 2000;18(9):959-963.
3. Michna S, Wu W, and Lewis JA. Biomaterials 2005;26(28):5632-5639.
4. Burg KJL, Porter S, and Kellam JF. Biomaterials 2000;21(23):2347-2359.
5. Suchanek W and Yoshimura M. Journal of Materials Research 1998;13(01):94-
117.
6. Tsiridis E, Bhalla A, Ali Z, Gurav N, Heliotis M, Deb S, and DiSilvio L. Injury
2006;37(3, Supplement):S25-S32.
7. Huang J, Jayasinghe SN, Best SM, Edirisinghe MJ, Brooks RA, and Bonfield W.
Electrospraying of a nano-hydroxyapatite suspension. vol. 39: Kluwer Academic
Publishers, 2004. pp. 1029-1032.
8. Wei G and Ma PX. Biomaterials 2004;25(19):4749-4757.
9. Thomas V, Dean DR, and Vohra YK. Current Nanoscience 2006;2(3):155-177.
10. Deshpande H, Schindler C, Dean D, Clem W, Bellis SL, Nyairo E, Mishra M, and
Thomas V. Journal of Biomaterials and Tissue Engineering 2011;1(2):177-184.
11. Phipps MC, Clem WC, Catledge SA, Xu Y, Hennessy KM, Thomas V, Jablonsky
MJ, Chowdhury S, Stanishevsky AV, Vohra YK, and Bellis SL. PLoS ONE
2011;6(2):e16813.
12. Dalby MJ, Gadegaard N, Tare R, Andar A, Riehle MO, Herzyk P, Wilkinson
CDW, and Oreffo ROC. Nat Mater 2007;6(12).
13. Norman J and Desai T. Annals of Biomedical Engineering 2006;34(1):89-101.
14. Mironov V, Prestwich G, and Forgacs G. Journal of Materials Chemistry
2007;17(20):2054-2060.
15. Giannitelli SM, Abbruzzese F, Mozetic P, De Ninno A, Businaro L, Gerardino A,
and Rainer A. 2014.
16. Liu X, Holzwarth JM, and Ma PX. Macromolecular Bioscience 2012;12(7):911-
919.
17. Singh S, Thomas V, Martyshkin D, Kozlovskaya V, Kharlampieva E, and
Catledge SA. Nanotechnology 2014;25(4).
18. Piner RD, Zhu J, Xu F, Hong S, and Mirkin CA. Science 1999;283(5402):661-
663.
19. Liu G, Zhou Y, Banga RS, Boya R, Brown KA, Chipre AJ, Nguyen ST, and
Mirkin CA. Chemical Science 2013;4(5):2093-2099.
20. Li X, Koller G, Huang J, Di Silvio L, Renton T, Esat M, Bonfield W, Edirisinghe
M, Li X, Koller G, Huang J, Di Silvio L, Renton T, Esat M, Bonfield W, and
Edirisinghe M. Journal Of The Royal Society Interface 2010;7(42):189-197.

75
7. CARBON NANOTUBE INKS FOR DIRECT PATTERNING BY DIP-PEN
NANOLITHOGRAPHY
by
CARRIE SCHINDLER, ALLISON GOINS, SONAL SINGH, SHANE A. CATLEDGE,
DERRICK R. DEAN
Submitted to Carbon
Format adapted for dissertation

76
ABSTRACT
This work reports the formulation of carbon nanotube inks for dip-pen nanolithography
patterning for a wide range of applications from gas sensors to electroactive composites.
The viscosity of carbon nanotube inks with concentrations of 0.01, 0.05, and 0.1 mg/mL
was studied to determine the degree of dispersion, stability, and reproducibility of
patterning. Scanning electron microscopy and atomic force microscopy were used to
determine the dispersion of the solutions as well as to characterize the transfer of ink to
substrate. The stability of the inks was determined by changes in turbidity following
ultra-sonication, which resulted in higher viscosity inks that promoted the suspension of
carbon nanotubes in solution. The optimal formulation of 0.05 mg/mL MWCNTs with 30
w/v glycerol was chosen to achieve DPN printed features for the first time with accurate
CNT transfer in the diameter range of 750 nm to 4 μm.

77
INTRODUCTION
Carbon nanotubes (CNTs) have been incorporated in composites for many years
due to their exceptional electrical and mechanical properties. In particular, CNTs boast
enhancements to electroactive polymer composites such as increased strength, stiffness,
robustness [1], sensitivity in actuating response, and energy efficiency [2]. The high
aspect ratio of CNTs allows the addition of low volumes of CNTs for percolation to
occur in a polymer matrix [3, 4]. However, integration into the polymer matrix and
control of the dispersion or orientation of the CNTs remains challenging to achieve the
desired electronic properties with minimal loading. Advances that have been made to
prevent the bundling of CNTs include chemically functionalizing the sidewalls with
carboxyl or fluorine groups and utilizing surfactants to overcome the strong van der
Waals attractions between tubes [5, 6]. Stable solutions of carboxylated CNTs with
concentrations as high as 10 mg/mL dispersed in water have been achieved [7].
Several methods have been explored to incorporate CNTs into composites such as
solution casting [2, 8], physical mixing [9], electrophoretic deposition [10], micro-contact
printing [11], and most recently, inkjet printing [12]. While inkjet printing offers the
advantages of a low-cost high-throughput deposition onto virtually any substrate, the ink
formulation required to stabilize dispersed CNTs in cartridges for long periods of time
poses a significant challenge. Additionally, the transfer of CNT ink through the cartridge
nozzle provides another mode for agglomeration over time. Dip-pen nanolithography
(DPN) is a direct write technique capable of printing on a variety of substrates by
anchoring molecules through chemisorption or electrostatic interactions [13]. The direct
transport of molecules to a substrate is unique to DPN because nanoparticles in solution

78
only rely on a water-meniscus to directly transfer to the substrate, instead of traveling
through an orifice. With this method, CNTs can be dispersed in solution and directly
patterned onto a surface with nanoscale precision.
The advent of “smart” materials incorporating multifunctional, tunable properties
demands the need for a high-throughput fabrication method such as DPN to produce
materials with nanoscale properties. The development of dense network patterns of CNTs
are of particular interest to applications such as sensors [14, 15], flexible electronics [16],
and electroactive polymer composites [8, 17]. This work presents the formulation of
relatively stable fluorinated multiwall carbon nanotube (MWCNT) inks dispersed in
solution for dip-pen nanolithography patterning. The dispersion, stability, and accuracy
of printing were investigated for the first time to tune the viscosity of MWCNT inks for
direct DPN printing while maintaining a stable suspension and preventing bundling of
CNTs.
EXPERIMENTAL SECTION
Ink formulation
MWCNTs with an average diameter of 110 nm were purchased from the
Materials and Electrochemical Research (MER) Corporation and fluorinated adapting the
procedure from Abdalla et al. with 4-fluoroaniline in 2-methoxyethyl ether [18].
Ultrasonication using a probe (Sonics Ultrasonic processor Model GE 750) operating at
20 kHz for three minutes was used to disperse the fluorinated MWCNTs in solutions of
99% isopropyl alcohol (Fisher Scientific), 99% glycerol (ACROS), and Triton® X-100

79
(ACROS). The concentration of MWCNTs was varied with a high loading of 0.1 mg/mL,
medium loading of 0.05 mg/mL, and 0.01 mg/mL as the lowest concentration. Based on
Vaisman et al. and Rastogi et al., the optimal concentration of Triton X-100 for effective
dispersion of CNTs was chosen to remain constant at 1 wt % for all solutions [6, 19].
Glycerol was added as a rheological modifier to tune the viscosity of the solutions
in the range of 5 – 15 cP for DPN printing. Glycerol content was varied in increments of
10 w/v from 0 – 70 w/v for each of the solutions, and the corresponding viscosity
increase from glycerol was measured using a Brookfield viscometer (DV-II+Pro) at 25
°C using the CP40 spindle for low viscosity solutions. An average viscosity for each
solution was obtained by calculating the average viscosity of six measurements over a
shear rate range from 75 – 300 s-1
. The solutions with an average viscosity in the range of
5 – 15 cP were used for further experimentation.
Dispersion of the MWCNTs
UV–vis spectroscopy (Cary 300 spectrophotometer) with a scan range of 200 –
800 nm was used as a preliminary tool to identify the absorption spectra for the MWCNT
inks. Reference cells were loaded with control solutions containing the corresponding
amounts of surfactant, isopropyl alcohol, and glycerol. Fluorescence spectroscopy was
performed (Cary Eclipse Fluorescence spectrophotometer) on each of the MWCNT
solutions and corresponding set of control samples not containing MWCNTs. An
excitation wavelength of 250 nm and scan range of 260 – 800 nm was used to identify the
emission spectra (n = 3).

80
Scanning electron microscopy (SEM) was used to visually evaluate the degree of
dispersion of the MWCNT solutions in a dried state. Three microliters of solution was
applied to a silicon substrate on an SEM stub and allowed to dry for at least 24 hours in a
desiccant environment. Samples were sputter coated with Au-Pd and imaged with an
accelerating voltage of 20 – 30 kV by a field emission SEM (Quanta FEG 650 from FEI).
Stability of the inks
Turbidity measurements (Hach 2100N Turbidimeter) were performed versus time
to evaluate the sedimentation of MWCNTs in solution at time points of 1, 2, 4, 6, 24, 36,
and 72 hours following sonication (n = 3). The turbidity value of each condition was
recorded when the instantaneous turbidity remained constant for at least 3 s.
The zeta potential of the MWCNT solutions were measured using a Zetasizer
Nano ZS (Malvern Instruments) with an irradiation of 633 nm He-Ne laser and at least
180 scans (n = 3). Control samples of the solutions without MWCNTs were also
measured to confirm the neutrality of the solvent. All measurements were performed
using the standard values of isopropyl alcohol as the dispersant. The zeta potential was
calculated by applying the Helmholtz-Smoluchowski equation to evaluate the stability of
the MWCNT solutions.
Accuracy of printing
All printing of MWCNT inks was carried out in an environmental chamber with a
Nanoink DPN 5000 and contact M-type pen arrays purchased from Nanoink Inc. Unless
noted otherwise, the temperature and relative humidity of the environmental chamber was

81
set to 22 °C and 30%, respectively. SiO2 substrates with pre-marked labels (Advanced
Creative Solutions Technology) were used for all printing. InkCAD software was used to
print a 5 x 5 array of dots with a dwell time of 3 seconds and a 3 x 3 array of dots with a
dwell time of 5 seconds for each of the well-dispersed MWCNT inks. Solutions of Triton
X-100 and isopropyl alcohol were printed with the same dwell times as control samples.
Following DPN, the arrays were imaged using close-contact atomic force
microscopy on the Nanoink DPN 5000 to measure the topographic dimensions and phase
changes of the dots. The average dot diameter and z-height of each printing condition
were averaged over 3 arrays. Micro-Raman spectroscopy was performed to verify the
presence of MWCNTs within each dot using a 300 mW Nd:YAG solid state laser with an
exciting wavelength of 532 nm. A 100X objective with a spot size of roughly 4 μm was
used to focus on individual dots in each DPN printed array.
RESULTS AND DISCUSSION
Ink formulation
Multiple components including a surfactant, humectant, and rheological modifier
were selected along with a carrier solution for the MWCNT inks. The main component,
comprising 60 – 90% of the inks, was isopropyl alcohol (IPA). The weak bond strength
of IPA was utilized to aid in evaporation after DPN printing. Triton X-100 (TX-100) was
selected as the surfactant to promote the dispersion and stability of MWCNTs in solution.
The high viscosity of TX-100 was also used to help achieve the required viscosity for
DPN. Additionally, glycerol was added as a rheological modifier to tune the viscosity of

82
the inks in the range of 5 – 15 cP. Fig. 1 shows the viscosity dependence on glycerol
concentration of the IPA inks with the targeted range indicated.
Fig. 1. Viscosity measurements at 25°C as a function of glycerol content for 1 wt%
Triton X-100 in isopropyl alcohol, showing the target viscosity range for DPN printing
(n = 6).
Three concentrations of glycerol were chosen within the targeted viscosity range
including 30, 40, and 50 w/v for further study. The three ink viscosities were studied as a
function of MWCNT concentration with a loading of 0.01 mg/mL, 0.05 mg/mL, and 0.1
mg/mL.
Dispersion of the MWCNTs
The fluorescent properties of CNTs were utilized to evaluate the degree of
dispersion. Based on the electronic theory of CNTs, the intensity of fluorescence

83
corresponds to the state of dispersion, with highest intensities of emission characteristic
of single nanotubes dispersed in solution. When CNTs align in a bundle the emission
energy is transferred to neighboring nanotubes rather than emitted in the form of light;
this results in much lower fluorescent intensities [20, 21]. UV-vis spectroscopy was used
to identify the wavelength of maximum absorption in the MWCNT solutions. Three
peaks were observed in the UV region occurring at 240, 250, and 295 nm. The multiple
peaks were attributed to the activity of TX-100 in the UV region, with known absorbance
peaks of 223 and 275 in aqueous solutions [22]. The overlap in absorbance peaks from
TX-100 and the MWCNTs in the 240 – 250 nm range posed a challenge to identify and
relate local changes in absorbance intensity to nanotube bundling. Thus, fluorescence
spectroscopy was employed to distinguish the intensities of the individual peaks. The
absorption peak at 250 nm was chosen as the excitation wavelength for fluorescence
studies. Fig. 2A shows the combined absorbance and emission spectra for a MWCNT
solution from UV-vis and fluorescence spectroscopy. The Stokes shift resulted in the
deconvolution of the two overlapping absorption peaks, which aided in identifying the
corresponding peak for MWCNT absorption/fluorescence. Fig. 2B shows the comparison
of MWCNT solutions with and without TX-100 surfactant. Three fluorescent peaks were
identified at 300, 500, and 600 nm with the solutions containing surfactant; however,
only a single peak at 500 nm was observed without surfactant. Quenching effects were
observed with the addition of surfactant which can be attributed to the effectiveness of
TX-100 coating the outer walls of the MWCNTs.

84
Fig. 2. A) Absorbance and emission spectra of the 0.01 mg/mL MWCNT solutions
indicating the Stokes shift and deconvolution of absorbance peaks. B) The effect of
Triton X-100 surfactant on fluorescence spectra of the MWCNT solutions.
The fluorescent peak at 500 nm was used for all MWCNTs solutions to relate the
intensity to the degree of bundling aggregation. Fig. 3 shows the comparison of
normalized peak intensity with variations in viscosity and concentration of MWCNTs.
The intensity of the peak at 500 nm was normalized by the concentration of MWCNTs
due to quenching effects from TX-100.
(B)
(A)

85
Fig. 3. Evaluation of dispersion based on the comparison of MWCNT solution
concentrations on fluorescence intensity with increasing viscosities by adding 30 – 50
w/v glycerol. SEM images at 3000X magnification show visual bundling at lower
intensities.
The control solution with 0 w/v glycerol demonstrated the dependence of CNT
concentration on bundling; the highest concentration of 0.1 mg/mL showed significant
saturation in which the surfactant was not effective at dispersing the MWCNTs.
However, increasing the viscosity of the solutions aided in dispersion at the higher
concentrations due to the increase in drag force on the particles in solution. The 40 w/v
and 50 w/v solutions with medium and high MWCNT concentrations showed the best
dispersion in terms of fluorescence intensity. SEM images of the 30 w/v glycerol
solutions shown in Fig. 3 confirmed that lower intensities of fluorescence were indicative
of more MWCNT bundling.

86
Stability of the inks
Once the solutions with the highest MWCNT dispersion were identified, the
stability of the inks was evaluated using turbidity and zeta potential measurements. The
turbidity of each solution was measured at several time points up to 72 hours following
sonication. Fig. 4 shows the local changes in turbidity as a function of time. The local
changes in turbidity were related to the sedimentation of MWCNTs in solution, where
highly unstable solutions experience rapid changes in turbidity.
Fig. 4. Turbidity measurements as a function of time after sonication showing the
stability of A) 0.01 mg/mL, B) 0.05 mg/mL, and C) 0.1 mg/mL MWCNT solutions with
increasing amounts of 0, 30, 40, and 50 w/v glycerol.

87
The lowest concentration exhibited the best overall stability with an average of 32.1%
decrease in turbidity. In general, the higher concentrations of MWCNTs led to less
stability with an average of 46.9% decrease for the 0.05 mg/mL concentration and 65.0%
decrease for the 0.1 mg/mL concentration. However, clear trends in all concentrations
showed that increasing viscosity corresponded to higher stability. The exception in this
trend was in the solutions with 40 w/v glycerol which showed higher instability. This
may be related to the viscosity curve in Fig. 1 that shows the departure from the trend for
the 40 w/v glycerol solutions. Further studies focused solely on the viscosity relationship
of the MWCNT inks with respect to stability and DPN printing are necessary to
determine the departure from expected results with the 40 w/v glycerol solutions.
However, the 30 w/v and 50 w/v glycerol solutions of all concentrations behaved
similarly; less than 40% local change was observed. This can be related to the increase in
drag forces on the MWCNTs in solution which was a result of the optimal viscosity.
In addition to turbidity measurements, the stability of the solutions was also
evaluated by zeta potential measurements. Zeta potential measurements were recorded
directly following ultrasonication. Typically, a zeta potential measurement at or above ±
25 mV indicates a highly stable nanosuspension. Table 1 shows the effects of viscosity
and MWCNT concentration on zeta potential for all of the ink formulations.

88
Table 1.
Zeta potential measurements (n=3) for MWCNT solutions as a function of
concentrations and viscosities.
MWCNT Concentration
(mg/mL)
Glycerol Content
(w/v)
Zeta Potential
(mV)
0.01 30 -11.4 ± 0.7
40 -11.5 ± 2.0
50 -7.1 ± 1.1
0.05 30 -9.3 ± 0.6
40 -7.9 ± 0.4
50 -7.6 ± 0.6
0.1 30 -13.2 ± 0.5
40 -16.3 ± 1.2
50 -8.1 ± 0.7
Although the values for the solutions fall below the highly stable classification, the nature
of DPN printing only requires a few hours of stability for printing. The solutions can be
directly sonicated before printing and re-sonicated each time prior to printing. In general,
the zeta potential for all solutions averaged around -10.3 mV. This value was consistent
with the turbidity data that showed the tendency for MWCNT sedimentation after 6
hours. The negative zeta potential also indicated that the MWCNTs remained fluorinated
through the modifications in solution with TX-100. To maximize the efficiency of
MWCNT transfer to the surface, dispersion, and stability, the 0.05 mg/mL and 0.1
mg/mL concentrations were used for the subsequent DPN printing.
Accuracy of printing
The 0.05 mg/mL and 0.1 mg/mL MWCNT solutions of 30, 40, and 50 w/v
glycerol were printed onto a gridded SiO2 substrate to determine the accuracy of printing.
Two dwell times were used to achieve a range of dot sizes. A dwell time of 3 seconds
was used to print 5 x 5 arrays with a spacing of 5 μm and a dwell time of 5 seconds was

89
used to print 3 x 3 arrays with a spacing of 10 μm. The temperature and humidity were
held constant at 22 °C and 30%, respectively. The highest concentration of 0.1 mg/mL
was too saturated for DPN printing as the MWCNTs blocked the microchannels of the
inked tips. This resulted in poor transfer to the substrate with all viscosities tested. The
inked tips were imaged by optical microscopy after printing to examine the
microchannels for residual MWCNTs. The 0.05 mg/mL concentration did not show
blockages after printing and was used for all subsequent printing. Fig. 5 summarizes the
dot dimensions of each printing condition obtained by AFM topography image analysis
averaged over 3 arrays for the 0.05 mg/mL concentration.
Fig. 5. AFM topography images of arrays printed with A) 3 second dwell times and B) 5
second dwell times. Measurements of dot diameter and z-height are shown for each
corresponding dwell time.

90
The 3 second dwell time resulted in dot diameters ranging from 396 ± 57 nm to 749 ± 69
nm with an average diameter of 534 ± 58 nm. The 5 second dwell time resulted in larger
dot diameters ranging from 1938 ± 229 nm to 4010 ± 412 nm with an average diameter
of 3105 ± 339 nm. Fig. 5 shows that both the diameter and height of dots decreased
linearly with increased viscosity, consistent with previous literature [23]. A larger
volume of MWCNT solution transfers to the substrate with longer dwell times and lower
ink viscosity.
In addition to examining the resultant dot dimensions, the individual dots were
analyzed by AFM phase images and Raman spectroscopy to verify the transfer of
MWCNTs to the substrate. Fig. 6 shows the AFM phase image comparison of individual
DPN printed dots as a function of glycerol content for the 0.05 mg/mL MWCNT
solutions.
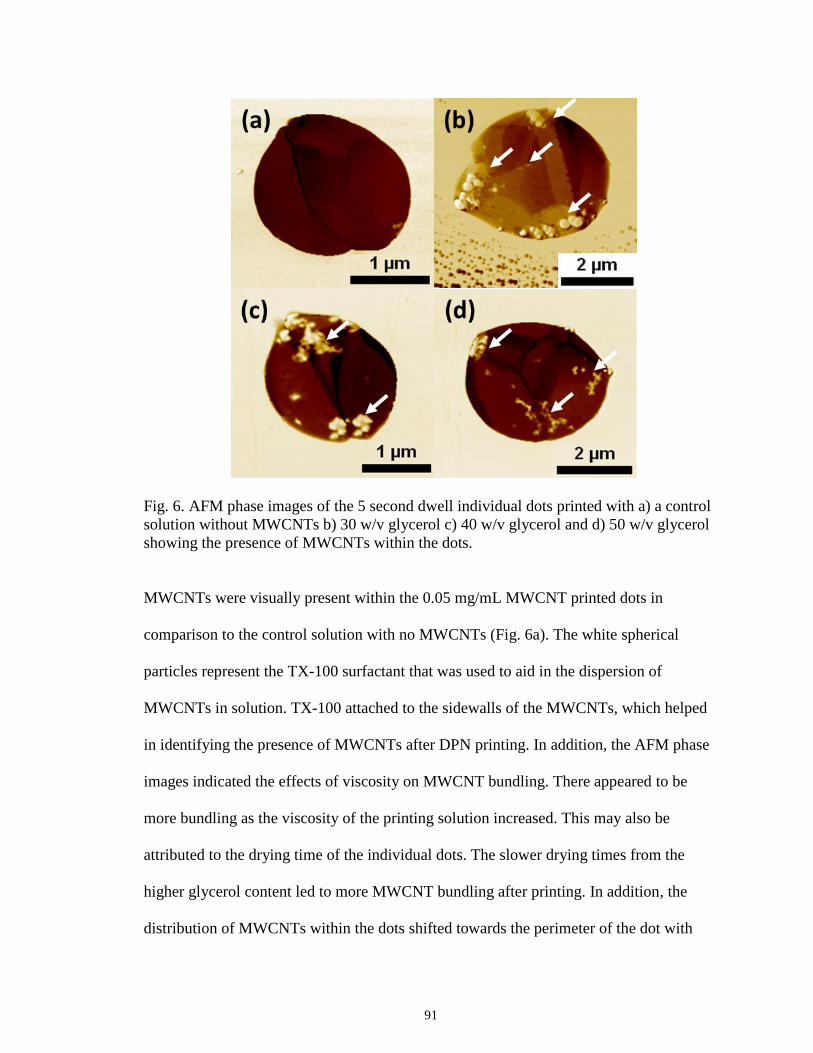
91
Fig. 6. AFM phase images of the 5 second dwell individual dots printed with a) a control
solution without MWCNTs b) 30 w/v glycerol c) 40 w/v glycerol and d) 50 w/v glycerol
showing the presence of MWCNTs within the dots.
MWCNTs were visually present within the 0.05 mg/mL MWCNT printed dots in
comparison to the control solution with no MWCNTs (Fig. 6a). The white spherical
particles represent the TX-100 surfactant that was used to aid in the dispersion of
MWCNTs in solution. TX-100 attached to the sidewalls of the MWCNTs, which helped
in identifying the presence of MWCNTs after DPN printing. In addition, the AFM phase
images indicated the effects of viscosity on MWCNT bundling. There appeared to be
more bundling as the viscosity of the printing solution increased. This may also be
attributed to the drying time of the individual dots. The slower drying times from the
higher glycerol content led to more MWCNT bundling after printing. In addition, the
distribution of MWCNTs within the dots shifted towards the perimeter of the dot with

92
longer drying times. This was consistent with the ‘coffee stain’ phenomenon of droplets
of carbon nanotubes drying in ring stains on a surface [24].
Micro-Raman spectroscopy was performed to further investigate the effects of
viscosity on the transfer of MWCNTs to the substrate. Fig. 7 shows the Raman spectra
for the 3 second dwell DPN printed dots for the 0.05 mg/mL MWCNT solution with
varying viscosities.
Fig. 7. Raman spectra for individual DPN printed dots using a 3 second dwell time with
the 0.05 mg/mL MWCNT solutions of a) 30 w/v glycerol b) 40 w/v glycerol and c) 50
w/v glycerol.
The 30 w/v and 40 w/v glycerol solutions showed similar behavior which indicated the
presence of the two characteristic MWCNT bands at 1341 – 1347 cm-1
and 1596 – 1597
cm-1
, both vibrational modes of sp2 bonding. The lower band corresponded to the D-band
of CNTs or the ‘disordered-induced peak’ in graphite [25]. The lower intensity of this

93
peak compared to the higher band indicated a low degree of defects in the MWCNT
structure [25]. The higher band at 1596 – 1597 cm-1
corresponded to the G-band of CNTs
or the circumferential lattice vibrations of sp2 bonding. The absence of G-band splitting
indicated the presence of MWCNTs rather than single-walled carbon nanotubes. The 50
w/v glycerol solution did not show the presence of MWCNTs, but indicated the presence
of the carrier solution of glycerol and isopropyl alcohol along with the SiO2 substrate.
The carrier solution contributed to bands at 1295, 1379, and 1447 cm-1
which indicated
the presence of CH2 wagging, OH plane bending, and δ C-H bending, respectively [26,
27]. This was more prominent in the 50 w/v glycerol solution due to drying effects that
produced more bundling of MWCNTs and agglomerations near the perimeter of the dots.
The Raman spectra of the 3 second dwell time features were also compared to the
5 second dwell DPN printed dots. Fig. 8 shows the comparison of the Raman spectra for
bulk MWCNTs to the 5 second dwell DPN printed dots for the 0.05 mg/mL MWCNT
solution with varying viscosities.

94
Fig. 8. Raman spectra for a) bulk MWCNTs compared to individual DPN printed dots
using a 5 second dwell time with the 0.05 mg/mL MWCNT solutions of b) 30 w/v
glycerol c) 40 w/v glycerol and d) 50 w/v glycerol.
The D-band and G-band peaks were clearly defined in the bulk MWCNT spectrum which
resembled the 30 w/v and 40 w/v glycerol solutions of the 3 second dwell spectra (Fig.
7). However, peaks from the carrier solution and SiO2 substrate were also present in each
of the 5 second dwell DPN printed dots. This was attributed to the larger volume of
carrier solution deposited onto the substrate with the longer dwell time. The carrier
solution present in the 1300 – 1450 cm-1
region overlapped the D-band but produced no
effect on the G-band. The G-band was present in all viscosities tested but with varying
intensities and shifting in wavenumber. Shifting towards higher wavenumbers and
smearing of the G-band as the viscosity of the solution increased indicated a larger
distribution of MWCNT diameter [25]. MWCNT bundling was more prevalent as the
viscosity increased as seen in Fig. 6, which corresponds to a higher average MWCNT

95
size or larger distribution of MWCNT diameters within each dot. The increase in Raman
shift due to larger MWCNT diameters represents the higher energy required for sp2
lattice vibrations to occur. When comparing the Raman spectra for the 3 and 5 second
dwell times, the optimal formulation of 0.05 mg/mL MWCNTs with 30 w/v glycerol was
chosen to achieve DPN printed features with accurate CNT transfer in the diameter range
of 750 nm to 4 μm.

96
CONCLUSIONS
Formulations of MWCNT inks were investigated to determine the optimal ink for
accurate printing in the nanoregime by dip-pen nanolithography. MWCNTs were
patterned by dip-pen nanolithography for the first time using the formulations
investigated. The viscosity and concentration of MWCNTs were adjusted to prepare the
highest loading concentration of MWCNTs while maintaining accurate transfer to the
substrate. The dispersion and stability of the inks were tested using fluorescence
spectroscopy and tubidity measurements, with the higher viscosity and medium loading
concentration of 0.05 mg/mL MWCNT performing the best in both categories. The
accuracy of printing was determined by AFM imaging and micro-Raman spectroscopy,
both of which indicated the presence of MWCNTs within DPN printed dots. AFM phase
images showed the visual presence of MWCNTs within each printed dot while Raman
spectroscopy determined the changes in MWCNT diameter distribution with changes in
viscosity. The optimal formulation of 0.05 mg/mL MWCNTs with 30 w/v glycerol was
chosen to achieve DPN printed features with accurate CNT transfer in the diameter range
of 750 nm to 4 μm.
ACKNOWLEDGEMENTS
The authors acknowledge the Alabama Space Grant Consortium and NASA Training
Grant NNX10AJ80H for funding the work. We also acknowledge the Dr.
Kharlampieva’s UAB Polymers Research Group, Michael Jabolonsky for his expertise
with spectroscopy, the UAB Cryo-EM Core Facility Center for Structural Biology, the
UAB SEM facility, and Jason Kirby for use of the turbidimeter.

97
REFERENCES
1. Coleman JN, Khan U, and Gun'ko YK. Advanced Materials 2006;18(6):689-706.
2. Sugino T, Kiyohara K, Takeuchi I, Mukai K, and Asaka K. Carbon
2011;49(11):3560-3570.
3. Li J, Ma PC, Chow WS, To CK, Tang BZ, and Kim JK. Advanced Functional
Materials 2007;17(16):3207-3215.
4. Breuer O and Sundararaj U. Polymer Composites 2004;25(6):630-645.
5. Balasubramanian K and Burghard M. Small 2005;1(2):180-192.
6. Rastogi R, Kaushal R, Tripathi SK, Sharma AL, Kaur I, and Bharadwaj LM.
Journal of Colloid and Interface Science 2008;328(2):421-428.
7. Wang Y, Iqbal Z, and Mitra S. Journal of the American Chemical Society
2005;128(1):95-99.
8. Dang ZM, Wang L, Yin Y, Zhang Q, and Lei QQ. Advanced Materials
2007;19(6):852-857.
9. Pötschke P, Abdel-Goad M, Alig I, Dudkin S, and Lellinger D. Polymer
2004;45(26):8863-8870.
10. Boccaccini AR, Cho J, Roether JA, Thomas BJC, Jane Minay E, and Shaffer
MSP. Carbon 2006;44(15):3149-3160.
11. Meitl MA, Zhou Y, Gaur A, Jeon S, Usrey ML, Strano MS, and Rogers JA. Nano
Letters 2004;4(9):1643-1647.
12. Kordás K, Mustonen T, Tóth G, Jantunen H, Lajunen M, Soldano C, Talapatra S,
Kar S, Vajtai R, and Ajayan PM. Small 2006;2(8-9):1021-1025.
13. Piner RD, Zhu J, Xu F, Hong S, and Mirkin CA. Science 1999;283(5402):661-
663.
14. Chopra S, McGuire K, Gothard N, Rao AM, and Pham A. Applied Physics
Letters 2003;83(11):2280-2282.
15. Cement and Concrete Composites 2013.
16. van de Lagemaat J, Barnes TM, Rumbles G, Shaheen SE, Coutts TJ, Weeks C,
Levitsky I, Peltola J, and Glatkowski P. Applied Physics Letters 2006;88(23):-.
17. Yoseph B-C, Kwang JK, Hyouk Ryeol C, and John DWM. Smart Materials and
Structures 2007;16(2).
18. Abdalla M, Dean D, Adibempe D, Nyairo E, Robinson P, and Thompson G.
Polymer 2007;48(19):5662-5670.
19. Vaisman L, Marom G, and Wagner HD. Advanced Functional Materials
2006;16(3):357-363.
20. Strano MS, Dyke CA, Usrey ML, Barone PW, Allen MJ, Shan H, Kittrell C,
Hauge RH, Tour JM, and Smalley RE. Science 2003;301(5639):1519-1522.
21. Strano MS, Moore VC, Miller MK, Allen MJ, Haroz EH, Kittrell C, Hauge RH,
and Smalley RE. Journal of Nanoscience and Nanotechnology 2003;3(1-1):81-86.
22. Yu D, Huang F, and Xu H. Analytical Methods 2012;4(1):47-49.
23. Liu G, Zhou Y, Banga RS, Boya R, Brown KA, Chipre AJ, Nguyen ST, and
Mirkin CA. Chemical Science 2013;4(5):2093-2099.
24. Robert DD, Olgica B, Todd FD, Greb H, Sidney RN, and Thomas AW. Nature
1997;389(6653):827-829.

98
25. Dresselhaus MS, Dresselhaus G, Saito R, and Jorio A. Physics Reports
2005;409(2):47-99.
26. Krishnan K. Proceedings of the Indian Academy of Sciences - Section A
1961;53(3):151-167.
27. Saksena B. Proceedings of the Indian Academy of Sciences - Section A
1939;10(5):333-340.

99
8. FUTURE DIRECTIONS
The development of nanoHA and MWCNT inks for DPN facilitates new
applications of the relatively new DPN technique. Cellular interactions with nanoscale
patterns of nanoHA on various substrates are now possible for further research.
Additionally, the specific polymer blend studied in this work provides a scaffold for
further research into tissue engineering scaffolds for cartilage regeneration. The
mechanical properties and hydrolytic degradation of the 3:1 ratio of polyglyconate to
polycaprolactone was tailored to the properties of native cartilage through the partial
miscibility of the polymer blend. The controlled patterning of the polymer blend by
nanoHA should add in the biocompatibility and bioactivity of the scaffolds; however,
further cell studies are needed to study the effect of patterning on the nanoscale.
Furthermore, the development and study of nanoparticle-based DPN inks gives
information on how to formulate other inks such as single-walled CNTs or growth factors
for tissue engineering.
The study of patterning CNTs onto electroactive polymers to control the actuation
properties is still ongoing. In addition to patterning MWCNTs onto a SiO2 substrate, a
PVDF substrate with randomly dispersed MWCNTs was optimized for electroactive
performance. The electroactive response was evaluated by performing electrostatic force
microscopy (EFM) which applied 2 V to 10 V of stimulus to the CNT composite film.
Figure 1 shows the induced deformation with 10 V on a PVDF film with 1% MWCNTs.

100
Figure 1. Electrostatic force microscopy images showing the topographic changes in the
PVDF/CNT film by applying a) 2 V and b) 10 V stimulus.
The changes in surface roughness of the films were evaluated to determine the largest
deformation possible with randomly dispersed CNTs. Results showed that the PVDF film
with 1% MWCNTs exhibited a 52.2% change in surface roughness as a result of
electroactive deformation. Future work will compare the actuating properties of PVDF
composites with randomly dispersed CNTs to PVDF composites with patterns of CNTs
printed by DPN.

101
9. CONCLUSIONS
The advent of new nanofabrication techniques, such as dip-pen nanolithography,
supplies researchers with the tools to explore nanoscale material properties, create new
complex structures with bottom-up precision, and study the interactions of nanoscale
patterns. The ultimate goal for future technology would be incorporating these
nanofabrication techniques into manufacturing for new commercial devices. However,
presently there is a lack of nanoparticle-based inks to study with DPN printing. The
overall goal of this work is to broaden the applications of the relatively new DPN
technique through the development of polymer systems for tissue engineering
applications and ‘smart’ material devices.
This work reported the study of novel electrospun polymer blends based on
polycaprolactone and polyglyconate. This specific system not only offered a unique
substrate for DPN printing, but contributed to the knowledge of how to create customized
blends with synergistic properties for specific human tissues. A 3:1 ratio of polyglyconate
to polycaprolactone was concluded to be a partially miscible blend with enhancements in
tensile strength, flexibility, and percent elongation to failure over neat polyglyconate. In
addition, the 3:1 ratio of polyglyconate to polycaprolactone scaffold exhibited a stable
morphology, modulus of elasticity, and mass up to 6 weeks in vitro. The electrospun
blend was then functionalized with nanoHA by DPN to aid in control of cell growth and
regeneration for tissue engineering applications. A nanoHA ink was formulated for
controlled patterning of electrospun scaffolds and created nanoscale features without
damaging the nanofiber morphology. The effect of ink viscosity was studied in terms of

102
dispersion, stability, and accuracy of patterning to determine the optimal formulation for
high throughput printing.
Additionally, this work reported the formulation of CNT inks for dip-pen
nanolithography patterning for a wide range of applications from gas sensors to
electroactive composites. The development of nanoparticle inks such as CNTs and
nanoHA particles provided insight into the methods for ideal suspension and ink transfer
for nanoscale patterning on many surfaces. The effect of viscosity and concentration of
CNTs was studied as a function of dispersion, stability, and accuracy of printing and a
CNT ink was optimized for DPN patterning. This work reported the first direct deposition
of carbon nanotubes onto a surface in the nanoregime. DPN printed features were
patterned onto SiO2 substrates with accurate CNT transfer in the diameter range of 750
nm to 4 μm, whereas previous direct-write techniques did not achieve sub-micron
features. Future work with printing this CNT ink onto polymer films aims to enhance the
control of actuating properties of electroactive polymer composites.

103
10. REFERENCES
1. Burg KJL, Porter S, and Kellam JF. Biomaterials 2000;21(23):2347-2359.
2. Phipps MC, Clem WC, Catledge SA, Xu Y, Hennessy KM, Thomas V, Jablonsky
MJ, Chowdhury S, Stanishevsky AV, Vohra YK, and Bellis SL. PLoS ONE
2011;6(2):e16813.
3. Deshpande H, Schindler C, Dean D, Clem W, Bellis SL, Nyairo E, Mishra M, and
Thomas V. Journal of Biomaterials and Tissue Engineering 2011;1(2):177-184.
4. Zhang X, Reagan MR, and Kaplan DL. Advanced Drug Delivery Reviews
2009;61(12):988-1006.
5. Ma PX. Materials Today 2004;7(5):30-40.
6. Mooney DJ and Vandenburgh H. Cell Stem Cell 2008;2(3):205-213.
7. Liu X, Holzwarth JM, and Ma PX. Macromolecular Bioscience 2012;12(7):911-
919.
8. Yoseph B-C, Kwang JK, Hyouk Ryeol C, and John DWM. Smart Materials and
Structures 2007;16(2).
9. Dargaville T, Celina M, Elliott J, Mowery D, and Assink R. Characterization,
Performance and Optimization of PVDF as a Piezoelectric Film for Advanced
Space Mirror Concepts. Sandia National Labs, 2005. pp. 54.
10. Dang ZM, Wang L, Yin Y, Zhang Q, and Lei QQ. Advanced Materials
2007;19(6):852-857.
11. Sugino T, Kiyohara K, Takeuchi I, Mukai K, and Asaka K. Carbon
2011;49(11):3560-3570.
12. Akle BJ and Leo DJ. Journal of Intelligent Material Systems and Structures
2008;19(8):905-915.
13. Ouyang GM, Wang KY, and Chen XY. Enhanced electro-mechanical
performance of TiO<inf>2</inf> nano-particle modified polydimethylsiloxane
(PDMS) as electroactive polymers. Solid-State Sensors, Actuators and
Microsystems Conference (TRANSDUCERS), 2011 16th International, 2011. pp.
614-617.
14. Lopes AC, Caparros C, Gómez Ribelles JL, Neves IC, and Lanceros-Mendez S.
Microporous and Mesoporous Materials 2012;161(0):98-105.
15. Venugopal J and Ramakrishna S. Applied Biochemistry and Biotechnology
2005;125(3):147-157.
16. Young RJ and Lovell PPA. Introduction to Polymers: Taylor and Francis, 2011.
17. Jose MV, Thomas V, Dean DR, and Nyairo E. Polymer 2009;50(15):3778-3785.
18. Thomas V, Zhang X, Catledge SA, and Vohra YK. Biomed Mater 2007;2(4):224-
232.
19. Huang J, Jayasinghe SN, Best SM, Edirisinghe MJ, Brooks RA, and Bonfield W.
Electrospraying of a nano-hydroxyapatite suspension. vol. 39: Kluwer Academic
Publishers, 2004. pp. 1029-1032.
20. Giannitelli SM, Abbruzzese F, Mozetic P, De Ninno A, Businaro L, Gerardino A,
and Rainer A. 2014.
21. Simon JL, Michna S, Lewis JA, Rekow ED, Thompson VP, Smay JE, Yampolsky
A, Parsons JR, and Ricci JL. Journal of Biomedical Materials Research - Part A
2007;83(3):747-758.

104
22. Lee K-B, Park S-J, Mirkin CA, Smith JC, and Mrksich M. Science
2002;295(5560):1702-1705.
23. Dalby MJ, Gadegaard N, Tare R, Andar A, Riehle MO, Herzyk P, Wilkinson
CDW, and Oreffo ROC. Nat Mater 2007;6(12).
24. Norman J and Desai T. Annals of Biomedical Engineering 2006;34(1):89-101.
25. Youqi W, Changjie S, Eric Z, and Ji S. Smart Materials and Structures
2004;13(6):1407.
26. Mohsen S and Kwang JK. Smart Materials and Structures 2001;10(4):819.
27. Coleman JN, Khan U, and Gun'ko YK. Advanced Materials 2006;18(6):689-706.
28. Li J, Ma PC, Chow WS, To CK, Tang BZ, and Kim JK. Advanced Functional
Materials 2007;17(16):3207-3215.
29. Breuer O and Sundararaj U. Polymer Composites 2004;25(6):630-645.
30. Balasubramanian K and Burghard M. Small 2005;1(2):180-192.
31. Rastogi R, Kaushal R, Tripathi SK, Sharma AL, Kaur I, and Bharadwaj LM.
Journal of Colloid and Interface Science 2008;328(2):421-428.
32. Kordás K, Mustonen T, Tóth G, Jantunen H, Lajunen M, Soldano C, Talapatra S,
Kar S, Vajtai R, and Ajayan PM. Small 2006;2(8-9):1021-1025.
33. Fan Z, Wei T, Luo G, and Wei F. Journal of Materials Science 2005;40(18):5075-
5077.
34. Wang Y, Iqbal Z, and Mitra S. Journal of the American Chemical Society
2005;128(1):95-99.
35. Chopra S, McGuire K, Gothard N, Rao AM, and Pham A. Applied Physics
Letters 2003;83(11):2280-2282.
36. Cement and Concrete Composites 2013.
37. van de Lagemaat J, Barnes TM, Rumbles G, Shaheen SE, Coutts TJ, Weeks C,
Levitsky I, Peltola J, and Glatkowski P. Applied Physics Letters 2006;88(23):-.
38. Piner RD, Zhu J, Xu F, Hong S, and Mirkin CA. Science 1999;283(5402):661-
663.
39. Adam BB, Fengwei H, and Chad AM. Nature Chemistry 2009;1(5):353-358.
40. Wang WM, LeMieux MC, Selvarasah S, Dokmeci MR, and Bao Z. ACS Nano
2009;3(11):3543-3551.
41. Pradeep M, Kan-Sheng C, Khaled A, Goran M, Yun CS, Mark F, Gerard JS,
Geoffrey FS, Chase PB, Stephan von M, and Peng X. Nanotechnology
2009;20(35):355501.
42. Park S-M, Liang X, Harteneck BD, Pick TE, Hiroshiba N, Wu Y, Helms BA, and
Olynick DL. ACS Nano 2011;5(11):8523-8531.
43. Nam J-M, Han SW, Lee K-B, Liu X, Ratner MA, and Mirkin CA. Angewandte
Chemie 2004;116(10):1266-1269.
44. Hornyak GL, Dutta J, Tibbals HF, and Rao A. Introduction to Nanoscience, 1 ed.:
Taylor & Francis, 2008.
45. Yang D, Jin Y, Zhou Y, Ma G, Chen X, Lu F, and Nie J. Macromolecular
Bioscience 2008;8(3):239-246.
46. Abdalla M, Dean D, Adibempe D, Nyairo E, Robinson P, and Thompson G.
Polymer 2007;48(19):5662-5670.
47. Vaisman L, Marom G, and Wagner HD. Advanced Functional Materials
2006;16(3):357-363.

105
48. Sperling LH. Introduction to Physical Polymer Science, 4th ed.: John Wiley and
Sons Inc., 2006.