fabricación, optimización y caracterización «in vitro» e
TRANSCRIPT
Fabricación, optimización y caracterización «in vitro» e «in vivo» de biosensores amperométricos
enzimáticos para determinar metabolitos energéticos (glucosa y lactato) en el sistema nervioso central
DirectoresJOSÉ LUIS GONZÁLEZ MORA
ROBERT D. O’NEILL
Curso 2012/13CIENCIAS Y TECNOLOGÍAS/8
I.S.B.N.: 978-84-15910-66-4
SOPORTES AUDIOVISUALES E INFORMÁTICOSSerie Tesis Doctorales
PEDRO ÁNGEL SALAZAR CARBALLO
ciencias 08 (Pedro Ángel Salazar Carballo).indd 1 14/02/2014 9:16:36

A mi familia y amigos por darme su amistad y cariño.
Gracias a Miriam por abrirme la puerta.
Gracias a José Luis por dejarme entrar.
Gracias a Aydam y Nayma por haber nacido.

Agradecimientos:
Ahora, que reviso mi andadura y el trabajo realizado en los últimos años, me considero
un hombre afortunado al haber dedicado todo este tiempo a la investigación, una de mis grandes
pasiones. Sin duda, el afán por descubrir lo desconocido y el espíritu de superación me han
ayudado en el desarrollo de la presente tesis. No siempre fue fácil, especialmente durante los
primeros años, cuando todo era nuevo y la experiencia práctica y las publicaciones eran escasas.
No imaginaba lo duro que era empezar un proyecto desde cero, donde el ensayo y error eran una
tónica diaria. Me costó empezar y coger el impulso. Yo que estaba acostumbrado a trabajar con
unidades bastante grandes: kg m-2 d -1, Km2, etc., me vi de repente trabajando con fibras de
carbono de poco más de unas micras y haciendo craneotomías. Todavía recuerdo las
conversaciones con José Luis cuando le mostré algunas publicaciones sobre un tinte (Azul de
Prusia) que podía ayudarnos a detectar el peróxido de hidrógeno a potenciales inferiores a los
empleados en el ámbito neuroquímico, y que podía sacarnos del punto muerto en el que nos
encontrábamos hacía un tiempo. Sin duda, fue un acierto seguir por este camino, y fruto de esta
idea loca hoy puedo presentar la presente memoria para obtener el grado de Doctor. Sin
embargo, el tiempo dirá si hemos acertado, y si nuestros colegas creen oportuno utilizar los
protocolos y aproximaciones aquí descritas.
Durante este período he podido cumplimentar mi formación como químico. Los
conocimientos adquiridos en el ámbito de los biosensores, así como, la profundización en áreas
tan diversas como la electroanalítica, neuroquímica y la fisiología me han ayudado a desarrollar
la presente tesis, y sin duda son el fruto más preciado de estos años.
Sin duda alguna la curiosidad, las ganas de a prender y el espíritu de superación han sido
las principales herramientas para finalizar la presente tesis. Sin embargo, parafraseando a uno
de los mejores científicos de la historia (Sir Isaac Newton):”si he llegado tan lejos, es porque me
he subido a hombros de gigantes”. Han sido innumerables los artículos y revisiones leídas
durante este tiempo, muchas más de las que aparecen en la bibliografía. Siempre ha habido un
hueco para un “paper” en el coche, en la cama, en la cocina, en el salón, dando biberones
(muchas veces rozando lo enfermizo). Muchos han sido los autores, si bien, le tengo especial
cariño a algunos (Wang, Palleschi, Ricci, Moscone, Karyakin, Lowry, O’Neill, Pingarrón y
colaboradores, Senthil-Kumar, Vittal). Gracias a todos ellos, sin su ayuda nunca habría podido
realizar la presente tesis.

Gracias también a todos los contribuyentes, porque parte de la financiación de esta tesis
ha salido de sus bolsillos.
Gracias a Informática y Equipamientos Médicos de Canarias S.L. por su apoyo a la
investigación y por darme la oportunidad de poner en práctica los conocimientos adquiridos
durante la elaboración de la presente tesis.
Gracias a Miriam por estar a mi lado y ayudarme a dar el salto, sé que los primeros años
fueron difíciles, pero sin duda ha valido la pena. Gracias también por cederme parte de tu motivo
de tesis.
Gracias a José Luis por acogerme en su laboratorio y por tratarme como a uno más desde
el principio. Gracias también por darme carta blanca en la dirección que ha tomado la presente
tesis y por poner a mi alcance los medios necesarios para finalizarla con éxito. He aprendido
mucho estos años a su lado, y me ha brindado la oportunidad de aplicar mis conocimientos y mi
entusiasmo a un área tan apasionante como la neuroquímica.
Thanks Robert, what started as a simple contact to resolve technical issues it became a
fruitful collaboration. I've learned a lot over during these years and you've been my confidant
scientist. Thanks for hundreds of mails and manuscript corrections (many of them during the
holidays or during weekends). Your lessons and advice have always been very valuable. Now I
know that I have a friend in the Emerald Island.
Gracias a Rossany, Meli, Ingrid, Francisco, Carlos, Óscar, Antonio y Cristian por su
amistad y ayuda durante estos años.
Gracias a Pedro por sus numerosas conversaciones, consejos y palabras de ánimo.
Gracias a Bea, Pablo y Adrián (Departamento de Inorgánica) por ayudarme con los
espectros de infrarrojos.
Gracias a José Luis y a Jonathan (Departamento de Química-Física) por dejarme utilizar
la espectroscopía de impedancia.
Gracias a Tere y a María Jesús (Departamento de Analítica) por ser mis directoras de
DEA y de Máster respectivamente.

Gracias a Jose Salazar, por tu amistad y por ser un ejemplo a seguir, tanto en el aspecto
científico como en lo personal.
Gracias a Nemesio Pérez y Pedro Hernández por darme la oportunidad de hacer ciencia
desde el segundo año de carrera y acogerme en su grupo al finalizar la misma.
Gracias también a mis antiguos compañeros del ITER (Gladys, Dácil, Noemi, Inés, Pablo,
Rayco, Pepe, David, Eleazar…) con quienes compartí tan buenos momentos.
Gracias (Miriam, Rossany, José Luis y Pedro) por los consejos y revisiones de la presente
tesis.
Muchas veces uno mismo es su peor crítico pensando que podía haber hecho más. Si bien
es verdad que todo tiene un principio y un fin, y me he hecho de rogar hasta tener las
publicaciones que he considerado suficientes para presentar esta humilde tesis. Ha llegado la
hora de seguir el consejo que llevan dándome hace algún tiempo y cerrar este capítulo en mi
vida.
Espero que en un futuro cercano pueda concluir las publicaciones que se han quedado en
el tintero, y que los nuevos proyectos en los que estamos trabajando en el grupo den su fruto. Si
algo he aprendido durante estos años es que nada cae del cielo, y que lo que obtienes está ligado
al esfuerzo, a la astucia y al trabajo realizado, bueno algo de suerte siempre hay que tener.
Nuevamente, gracias a todos los que me han ayudado durante esta etapa. Espero que la
presente tesis y las publicaciones que contienen puedan ayudar a otras personas que como yo
disfrutan haciendo ciencia y no se quede en una estantería cogiendo polvo.
psalazar

i
Glosario de abreviaturas
13C-NMR ………………………… resonancia magnética nuclear de C-13
1H-NMR ………………………… resonancia magnética nuclear de protón
5-HT ………………………… serotonina
A/P ………………………… antero/posterior
AA ………………………… ácido ascórbico
ADN ………………………… ácido desoxirribonucleico
AFM ………………………… microscopía de fuerzas atómica
ANLS ………………………… Astrocyte-Neuron Lactate Shuttle
ATP ………………………… adenosín trifosfato
AU ………………………… ácido úrico
BHE ………………………… barrera hematoencefálica
BSA ………………………… serum de albumina bovina
Cdl ………………………… capacidad de la doble capa
CFE ………………………… electrodo de fibra de carbono
CMC ………………………… concentración miscelar crítica
CNT ………………………… nanotubos de carbono
CPA ………………………… Amperometría a Potencial Constante
CPEs ………………………… electrodos de pasta de carbono
CTA+ ………………………… catión cetiltrimetilamonio
CTAB ………………………… bromuro de cetiltrimetilamonio
CV ………………………… Voltametría Cíclica
D/ V ………………………… dorsal/ventral
DA ………………………… dopamina
DOPAC ………………………… ácido 3,4-dihidroxifenilacético
DPV ………………………… Voltamperometría Pulsada Diferencial
EIS ………………………… espectroscopía de impedancia
ES ………………………… complejo enzima-sustrato
FAD ………………………… flavín adenín dinucleótido oxidado
FADH2 ………………………… flavín adenín dinucleótido reducido
FCV ………………………… Voltametría Cíclica Rápida
FIA ………………………… Análisis por Inyección de Flujo
FMN ………………………… flavín mononucleótido oxidado
FMNH2 ………………………… flavín mononucleótido reducido
fMRI ………………………… resonancia magnética funcional
FSC ………………………… flujo sanguíneo cerebral
GADPDH ………………………… gliceraldehído-3-fosfato deshidrogenasa
GLAST (EAAT1) ………………………… transportador de glutamato (tipo 1)
GLT-1 (EAAT2) ………………………… transportador de glutamato (tipo 2)
ii
GLUT1 ………………………… transportadores de glucosa (tipo 1)
GLUT3 ………………………… transportadores de glucosa (tipo 3)
GLUTs ………………………… transportadores de glucosa
Gox ………………………… glucosa oxidasa
h ………………………… parámetro de Hill
H1000 ………………………… clorotrifluoroetileno (1000 cSt)
H200 ………………………… clorotrifluoroetileno (200 cSt)
H700 ………………………… clorotrifluoroetileno (700 cSt)
HV ………………………… ácido homovanílico
i ………………………… corriente
IUPAC ………………………… Internacional Union of Pure and Applied Chemistry
J ………………………… densidad de corriente
Jmax ………………………… densidad de corriente máxima
Kel-F ………………………… policlorotrifluoroetileno
KM ………………………… constante de Michaelis-Menten
KM(gluc) ………………………… constante de Michaelis-Menten para la glucosa
KM(O2) ………………………… constante de Michaelis-Menten para el oxígeno
Kps ………………………… constante del producto de solubilidad
LDH1 ………………………… lactato deshidrogenasa (tipo 1)
LDH5 ………………………… lactato deshidrogenasa (tipo 5)
Lox ………………………… lactato oxidasa
M/L ………………………… medio/lateral
MCT ………………………… transportador de monocarboxilatos
MCT1 ………………………… transportador de monocarboxilatos (tipo 1)
MCT2 ………………………… transportador de monocarboxilatos (tipo 2)
MCT4 ………………………… transportador de monocarboxilatos (tipo 4)
m-LDH ………………………… lactato deshidrogenasa (mitocondrial)
m-PD ………………………… meta-fenilendiamina
NAD+ ………………………… nicotinamida adenín dinucleótido (oxidado)
NADH ………………………… nicotinamida adenín dinucleótido (reducida)
NADPH ………………………… nicotinamida adenina dinucleótido fosfato (reducida)
NE ………………………… norepinefrina
NIRs ………………………… Infrarrojo cercano
NO ………………………… óxido nítrico
NPV ………………………… voltametría normal pulsada
o-PD ………………………… orto-fenilendiamina
PANI ………………………… polianilina
PB ………………………… Azul de Prusia
PBS ………………………… tampón fosfato (0.1M NaCl;0.027M KCL; pH=7.4)
PCTFE ………………………… policlorotrifluoroetileno
PDMS ………………………… polidimetilsiloxanos

iii
PEI ………………………… polietilenimina
PET ………………………… tomografía por emisión de positrones
PG ………………………… Verde de Prusia
PIM ………………………… polímeroi de impresión molecular
PLL ………………………… polilisina
PmPD ………………………… meta-polifenilendiamina
PNA ………………………… ácido nucleico peptídico
PoPD ………………………… orto-polifenilendiamina
p-PD ………………………… para-fenilendiamina
PpPD ………………………… para-polifenilendiamina
PPY ………………………… popipirrol
PW ………………………… Blanco de Prusia
Rct ………………………… resistencia a la transferencia de carga
RL ………………………… rango lineal
RS ………………………… resistencia de la disolución
S ………………………… sensibilidad analítica
SCE ………………………… electrodo de calomelano saturado
SEGAI ………………………… Servicio General de Apoyo a la Investigación
SEM ………………………… microscopía electrónica de barrido
SGLTs ………………………… co-transportadoras de Na+ y glucosa
SNC ………………………… sistema nervioso central
SPCE ………………………… electrodos serigrafiados de pasta de carbono
TCA ………………………… ciclo de los ácidos tricarboxílicos (ciclo de Krebs)
TCNQ ………………………… tetracianoquinodimetano
TTF ………………………… tetratiofulvaleno
ULL ………………………… Universidad de La Laguna
VIS ………………………… visible
VIS-Uv ………………………… visible-ultravioleta
Vmax ………………………… velocidad máxima de reacción
XRD ………………………… difracción de rayos X
YSI ………………………… Yellow Spring Instruments
Zim ………………………… impedancia imaginaria
Zre ………………………… Impedancia real
Zw ………………………… impedancia de Warburg
iv
Índice de tablas de figuras Tabla 2.1.- Criterios de clasificación de los biosensores…………….………………….....31
Figura 1.1- Acoplamiento neurovascular. La posición intermedia de los astrocitos entre
los vasos sanguíneos y las neuronas, evidencia la importancia que tienen dichos
astrocitos en la regulación neurometabólica, permitiendo el suministro adecuado de
nutrientes en función de la actividad neuronal (fuente:
http://www.genomasur.com/BCH/BCH_libro/capitulo_09.htm)..…...............……......6
Figura 1.2.- Distribución de los transportadores de glucosa (GLUTs) y
monocarboxilatos (MCT) en el cerebro. El alto grado de compartimentación cerebral
favorece la expresión diferenciada de dichos transportadores (adaptada de Simpson et
al., 2007)………………………………………………………………….…………………........8
Figura 1.3.- Modelo metabólico clásico: la glucosa y el oxígeno son liberados desde el
vaso sanguíneo. El oxígeno difunde libremente a través de los tejidos, sin embargo, la
glucosa debe atravesar cada uno de los compartimentos mediante transporte GLUTs
específicos. En este modelo la glucosa es el combustible primario, tanto para las
neuronas como para los astrocitos, siendo el lactato un mero subproducto metabólico
que es desechado al intersticio. Se asume que las neuronas son capaces de controlar el
suministro metabólico en función de su estado..…………………......................................10
Figura 1.4.- La glucosa posee múltiples facetas metabólicas: puede ser almacenada
como glucógeno para actuar de reserva energética, puede ser usada directamente para
producir energía vía glicólisis o mediante el TCA, además, está conectada vía TCA en
la síntesis de algunos neurotransmisores y sus intermediaros, también puede ser
empleada en la biosíntesis de nucleótidos y NAPDH……………....………………….....11
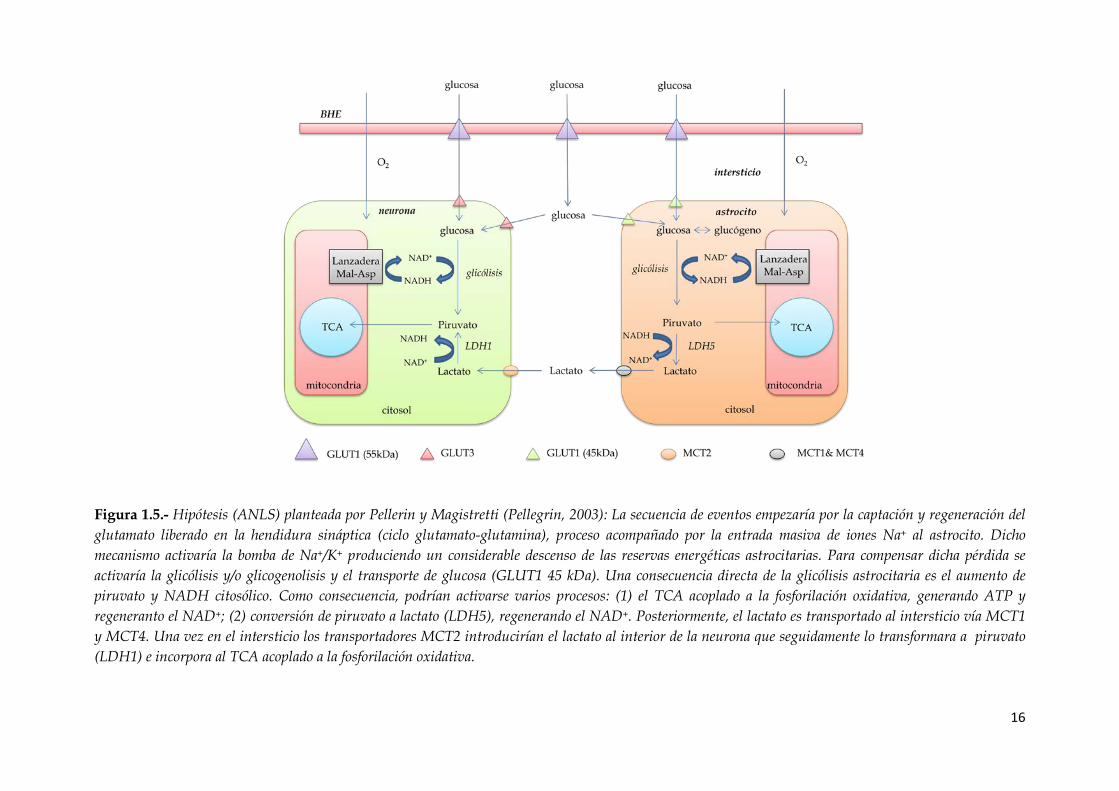
Figura 1.5.- Hipótesis (ANLS) planteada por Pellerin y Magistretti (Pellegrin, 2003): La
secuencia de eventos empezaría por la captación y regeneración del glutamato liberado
en la hendidura sináptica (ciclo glutamato-glutamina), proceso acompañado por la
entrada masiva de iones Na+ al astrocito. Dicho mecanismo activaría la bomba de
Na+/K+ produciendo un considerable descenso de las reservas energéticas
astrocitarias. Para compensar dicha pérdida se activaría la glicólisis y/o glicogenolisis
y el transporte de glucosa (GLUT1 45 kDa). Una consecuencia directa de la glicólisis
astrocitaria es el aumento de piruvato y NADH citosólico. Como consecuencia podrían
activarse varios procesos: (1) el TCA acoplado a la fosforilación oxidativa, generando
ATP y regeneranto el NAD+; (2) conversión de piruvato a lactato (LDH5), regenerando
el NAD+. Posteriormente, el lactato es transportado al intersticio vía MCT1 y MCT4.
Una vez en el intersticio los transportadores MCT2 introducirían el lactato al interior
de la neurona que seguidamente lo transformara a piruvato (LDH1) e incorpora al
TCA acoplado a la fosforilación oxidativa…………………………...…………………......16

v
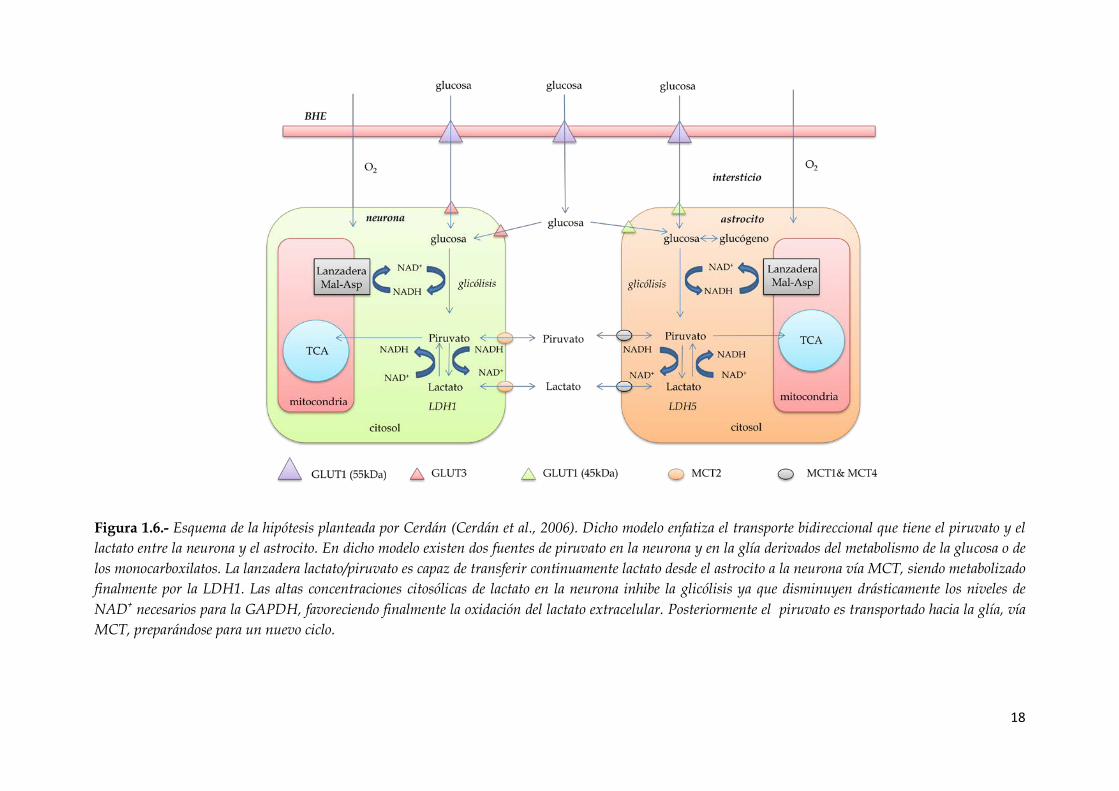
Figura 1.6.- Esquema de la hipótesis planteada por Cerdán (Cerdán et al., 2006). Dicho
modelo enfatiza el transporte bidireccional que tiene el piruvato y el lactato entre la
neurona y el astrocito. En dicho modelo existen dos fuentes de piruvato en la neurona
y en la glía derivados del metabolismo de la glucosa o de los monocarboxilatos. La
lanzadera lactato/piruvato es capaz de transferir continuamente lactato desde el
astrocito a la neurona vía MCT, siendo metabolizado finalmente por la LDH1. Las altas
concentraciones citosólicas de lactato en la neurona inhibe la glicólisis ya que
disminuyen drásticamente los niveles de NAD+ necesarios para la GAPDH,
favoreciendo finalmente la oxidación del lactato extracelular. Posteriormente el
piruvato es transportado hacia la glía, vía MCT, preparándose para un nuevo ciclo.
………………………………………………………………………………………….……….18
Figura 1.7.- Esquema de la hipótesis planteada por Schurr (Schurr, 2006): La glicólisis
citosólica produce piruvato, que posteriormente es reducido a lactato regenerando los
niveles de NAD+ citosólico. Posteriormente, dicho lactato es transportado, vía MCT, a
la mitocondria donde es convertido en piruvato y entra en el TCA…………………......20
Figura 1.8.- Comparación de las dimensiones de los electrodos de fibra de carbono
(CFE), sonda de microdiálisis y el rango de tamaño de las neuronas. ………….………26
Figura 2.1.- Esquema de las partes fundamentales de un biosensor, así como el
acoplamiento entre distintos sistemas de reconocimiento y sistemas de
transducción…………………………………………………………………………………...29
Figura 2.2.- Fenómeno de la resonancia del plasmón de superficie. La resonancia del
plasmón de superficie se produce por la reflexión total del haz de luz incidente al
interaccionar con los plasmones por lo que se observa una reducción de la intensidad
de la luz (fuente: Pérez, 2007)………………………………………….………………….....35
Figura 2.4.- Esquema de las reacciones que ocurren en un biosensor de 1ª generación,
basado en la detección amperométrica del H2O2 generado enzimáticamente………....38
Figura 2.5.- Esquema de las reacciones que ocurren en un biosensor de 2ª
generación………………………………………………………………………………….......39
Figura 2.6.- Esquema de las reacciones que ocurren en un biosensor de 3ª
generación………………………………………………………………………………....…...40
Figura 2.7- Métodos de inmovilización empleados en el desarrollo de biosensores,
(adaptada de Sassolas et al., 2012)………………………………….....……………..……....41
Figura 2.8- Enlaces covalentes empleados sobre una superficie previamente aminada
por acoplamiento mediante: (A) carboiimida (B) glutaraldehido (adaptada de Sassolas
et al., 2012)…..……………………………………………………………………...……….....44
Figura 3.1- Estructura zeolítica (cúbica centrada en las caras) propuesta para el PB
(adapta a partir de: http://mslab.polymer.pusan.ac.kr/english/research.html).
..………………….………………………………………………………..……………….…....48

vi
Figura 3.2.- Esquema de reacciones acopladas en un biosensor de 1ª generación de
glucosa, basado en la detección amperométrica del H2O2 con Azul de
Prusia...……………………………...…………………………………………………...…......54
Figura 3.3.- Histograma de publicaciones científicas referidas a las palabras claves:
Prusian Blue y Prussian Blue-biosensors (fuente: http://www.sciencedirect.com).
………………………………………………………………………….....……………….…....55
Figura 5.1.- Fórmula (fuente: Wikipedia) y estructura del Nafion donde se observan
los canales iónicos por donde existe libre flujo de moléculas de agua y cationes (fuente:
http://www.intellectualism.org/questions/QOTD/dec03/20031209.php).….............63
Figura 5.2.- Posibles estructuras propuestas para el PoPD……………...……..................66
Figura 5.3.- a) Representación gráfica de la ecuación de Michaelis-Menten. b)
Linearización de la ecuación de Michaelis-Menten por el método propuesto por
Lineweaver-Burk…………………………………………...………………………….……...73
Figura 5.4.- Esquema de un biosensor amperométrico enzimático de glucosa construido a partir de un microelectrodo de fibra de carbono de 8 µm de diámetro: PB (Azul de Prusia), Gox (glucosa oxidasa). La última capa de PoPD (poli-o-fenilendiamida), así como el PEI y el Nafion no han sido dibujados para facilitar la visualización del esquema….....…………………………………………….…………..…....79
Figura 5.5.- a) Variación del potencial aplicado durante CV b) Voltamperograma cíclico
obtenido al ciclar un electrodo en presencia de un par redox…..…………………..........92
Figura 5.6.-a) Circuito de Randles, equivalente a una celda electroquímica
convencional. b) Diagrama de Nyquist………..…………………..…………………..…....97
vii
Índice
0.-Motivación…………………………………………………………………….. 2
1.-Metabolismo cerebral………………………………………………………….. 4
1.1-Zona de estudio: el sistema nervioso central………………………….. 4
1.2.-Metabolismo cerebral: Glucosa……………………………………….... 6
1.3.-Metabolismo cerebral: Lactato…………………………………............. 12 1.3.1.-Lanzadera de lactato: Astrocite-Neuron-Lactate Shuttle Hypotesis………………………………………………………………….. 12
1.3.2.-Nuevas hipótesis sobre el uso neuronal del lactato…………... 17 1.3.2.1.-Acoplamiento redox y actividad metabólica: The redox-switch/redox-coupling hypothesis………………………………………… 17
1.3.2.2.-Transporte mitocondrial del lactato………………………...... 19
1.4.- Metabolismo cerebral: técnicas instrumentales……………………… 21
1.4.1.-Microdiálisis………………………………………………………. 22
1.4.2.-Voltametría in vivo………………………………………………... 22
1.4.3.-Voltamperometría vs. Microdiálisis…………………………….. 24 2.- Biosensores……………………………………………………………………... 28
2.1.-Definición……………………………………………………………….... 28
2.2.-Los orígenes……………………………………………………………... 29
2.3.-Clasificación de los biosensores……………………………………….. 31
2.3.1.-Clasificación en función del elemento de reconocimiento…... 32
2.3.1.1.-Biosensores biocatalíticos……………………………………... 32
2.3.1.2.-Biosensores de bioafinidad……………………………………. 33
2.3.2.-Clasificación en función del tipo de transductor……………… 33
2.3.2.1.-Electroquímicos………………………………………………… 34
2.3.2.2.-Másicos, piezoeléctrico o acústicos…………………………... 34
2.3.2.3.-Térmicos………………………………………………………... 34
2.3.2.4.-Ópticos………………………………………………………….. 35
2.4.-Biosensores electroquímicos…………………………………………… 35
2.4.1.-Potenciométricos………………………………………………… 36
2.4.2.-Conductimétricos……….……………………………………….. 37
2.4.3.-Amperométricos…………………………………………………. 37
2.4.3.1.-Clasificación de los biosensores amperométricos………….. 37
2.4.3.1.1.-Biosensores de 1ª generación……………………………….. 37
2.4.3.1.2.-Biosensores de 2ª generación……………………………...... 39
2.4.3.1.3.-Biosensores de 3ª generación………………………………. 40
2.5.-Técnicas de inmovilización enzimática.………………………………. 41
2.5.1.-Métodos de inmovilización física………………………............ 42
2.5.1.1.-Adsorción…………………………………………………......... 42
2.5.1.2.-Atrapamiento……………………………………………............ 42
2.5.2.-Métodos de inmovilización química……………………........... 44

viii
2.5.2.1.-Enlace covalente………………………………………….......... 44
2.5.2.2.-Capa intermedia…………………………………….................. 45
2.5.2.3.-Entrecruzamiento……………………………………………… 45 3.-El Azul de Prusia………………………………………………………………. 46
3.1.-Deposición de Azul de Prusia…………………………………………. 50
3.2.-Estabilidad de Azul de Prusia frente al pH………………………….. 51
3.3.-Electrodeposición de PB en presencia de surfactantes catiónicos…. 52
3.4.-Biosensores basados en Azul de Prusia……………………………….. 54 4.-Objetivos………………………………………………………………………... 58 5.-Materiales y métodos……………………………………………………….... 61
5.1.-Reactivos………………………………………………………………….. 61
5.1.1.-Microelectrodos de fibra de carbono…………………………… 61
5.1.2.-Nafion………………………………………………………........... 62
5.1.3.-Polietilenimina…………………………………………………… 63
5.1.4.-Poli-o-fenilendiamina…………………………………………….. 64
5.1.5.-Glucosa oxidasa (Gox)…………………………………………..... 66
5.1.6.-Lactato oxidasa (Lox)…………………… ………………………. 67 5.1.7.-Interferencias: El ácido ascórbico como prototipo de interferente endógeno…………………………………………………... 68
5.2.- Enzimas y mecánica enzimática………………………………………. 69
5.2.1.-Cálculo de los parámetros cinéticos enzimáticos……………... 74
5.2.2.-Déficit de oxígeno………………………………………………... 75
5.3.-Fabricación de los microbiosensores………………………………… 78
5.3.1.-Fabricación de los microelectrodos de fibra de carbono…….. 78
5.3.2.-Modificación de los microelectrodos de fibra de carbono.….. 78
5.3.2.1.-Disminución del potencial de detección del H2O2…………. 80
5.3.2.2.-Reducción del déficit de oxígeno…………………………….. 80
5.3.2.3.-Incremento de la carga enzimática…………………............... 83
5.3.2.4.-Mejora de la selectividad frente a los interferentes……........ 83
5.3.2.5.-Optimización de las propiedades de biocompatibilidad…... 84
5.3.3.-Microelectrodos centinela………………………………………. 86
5.3.4.-Microelectrodos sensibles a oxígeno………………………....... 87
5.4.-Voltamperometría………………………………………………………. 87
5.4.1.-Procesos farádicos y no farádicos……………………………… 87
5.4.2.-Fenómenos de transporte……………………………………….. 89
5.4.3.-Transferencia electrónica………………………………………... 90
5.4.4.- Técnicas voltamperométricas…………………………………... 91
5.4.4.1.-Voltamperometría a potencial constante……………………. 91
5.4.4.2.-Voltamperometría cíclica.…………………………………....... 92
5.5.- Otras técnicas instrumentales…………………………………………. 94

ix
5.5.1.-Microscopía electrónica de barrido…………………………….. 95
5.5.2.-Espectroscopía de impedancia…………………………………. 96
5.6.-Calibrado in vitro……………………………………………………….. 98
5.7.-Animales y método quirúrgico……………………………………….. 99
5.8.-Registro in vivo ………………………………………………………… 100
5.8.1.-Implantación del sistema electroquímico……………………... 100
5.8.2.-Estudio farmacológico…………………………………………... 101
5.8.3.-Estimulación eléctrica…………………………………………… 101
5.9.-Instrumentación electroquímica y tratamiento de datos…………… 102 6.-Resultados y discusiones……………………………………………………… 104
6.1.-Desarrollo de un microelectrodo de fibra de carbono modificado con PB como transductor selectivo para biosensores de 1ª generación, aplicaciones en el ámbito neuroquímico…………………………………… 104 6.2.-Microbiosensores sensibles a glucosa, basados en microelectrodos de carbono modificados con PB: Aplicaciones in vivo en el sistema nervioso central………………………………………………………………. 108 6.3.-Aplicaciones fisiológicas de microbiosensores sensibles a glucosa basados en microelectrodos de carbonos modificados con PB…………... 112 6.4.-Electrodeposición de PB sobre electrodos de carbono mediada por surfactantes: mejoras en la estabilidad, en las propiedades electroquímicas y aplicación en microbiosensores sensibles a lactato…. 117 6.5.-Optimización y caracterización de electrodos serigrafiados de carbono modificados con PB en presencia de surfactantes: detección de H2O2 a bajos potenciales……………………………………………………... 122 6.6.-Desarrollo de un microbiosensor basado en fibras de carbono modificado con PB para medir lactato en el espacio extracelular del tejido cerebral…………………………………………………………………. 127
7.-Conclusiones…………………………………………………………………… 133
8.-Trabajo futuro…………………………………………………………………... 136
9.-Anexo I: Publicaciones………………………………………………………... 138
10.-Anexo II: Otras publicaciones……....…………………………………...... 203
11.-Bibliografía…………………………………………………………………… 223

1
INTRODUCCIÓN

2
0.- Motivación
Durante la última década se ha generado un importante debate sobre la
regulación de la respuesta metabólica del cerebro frente a la actividad neuronal. Las
células cerebrales son altamente dependientes y necesitan un suministro continuo de
energía. Todos los datos disponibles sugieren que la glucosa, bajo condiciones
fisiológicas normales, es el principal combustible energético. Debido a que el cerebro
tiene muy pocas reservas, necesita un suministro vascular continuo de glucosa y
oxígeno. Así, a los 20 segundos de ausencia de flujo sanguíneo cerebral (FSC) se pierde
el conocimiento; la glucosa, el glucógeno y el ATP existentes en el medio son
consumidos entre 3 y 5 minutos, pudiéndose producir lesiones neuronales irreversibles
en el caso de no revertir el proceso.
Históricamente, el lactato se había considerado un subproducto metabólico
derivado de la glucólisis o un signo de hipoxia (derivado del metabolismo anaeróbico
celular). Sin embargo, en los últimos 20 años se han publicado una gran cantidad de
trabajos que indican que el lactato puede ser producido en muchos tejidos bajo
condiciones aeróbicas. Así, algunos autores señalan que el lactato podría ser utilizado
como combustible complementario, e incluso, han sugerido que puede ser el substrato
energético preferido por las neuronas durante estados de activación. Basándose en
estos resultados, se han planteado nuevas hipótesis sobre el metabolismo neuronal, el
acoplamiento neurovascular, etc. Pellerin y Magistretti (1994) han propuesto una
hipótesis “Astrocyte-Neuron Lactate Shuttle” (ANLS) según la cual la activación neuronal
producida por el glutamato (principal neurotransmisor y responsable del 90% de las
sinapsis) conduce a la captación de glucosa por parte de los astrocitos, posteriormente
su glucólisis genera lactato que es exportado al compartimiento extracelular donde es
captado por las neuronas. Esta idea ha dividido a la comunidad científica en dos

3
escuelas y ha generado un intenso debate durante los últimos 20 años. La mayor parte
de las evidencias de ANLS se basan en experimentos in vitro, en la disposición espacial
de la glía entre los vasos sanguíneos y las neuronas, en la presencia de algunas enzimas
y en la expresión de ciertos transportadores específicos.
El desarrollo de nuevos métodos para cuantificar y estudiar la evolución de
glucosa y lactato de forma más precisa y localizada, así como, su relación con el
consumo de oxígeno y el FSC podría ayudarnos a entender mejor dichos procesos
neurometabólicos, teniendo en cuenta que todos los mecanismos que acompañan a la
sinapsis ocurren en una escala temporal muy corta, milisegundos.
En las últimas décadas, los microbiosensores han resultado ser un instrumento
con un gran potencial en la investigación biomédica y en aplicaciones
neurometabólicas. Su reducido tamaño, así como, su alta resolución temporal y
espacial los convierten en una alternativa a otras técnicas más costosas y con un alto
grado de especialización.
Es por ello, que la presente memoria está orientada hacia la construcción y
caracterización de microbiosensores amperométricos sensibles a la glucosa y al lactato.
Dispositivos lo suficiente pequeños, sensibles y selectivos para ser empleados en
animales de experimentación para cuantificar concentraciones basales del analito de
interés en el espacicio extracelular. Y que a posteriori, puedan ser empleados en
estudios neurometabólicos, farmacológicos, etc., tanto a nivel de experimentación
animal como humana.
4
1.-Metabolismo cerebral
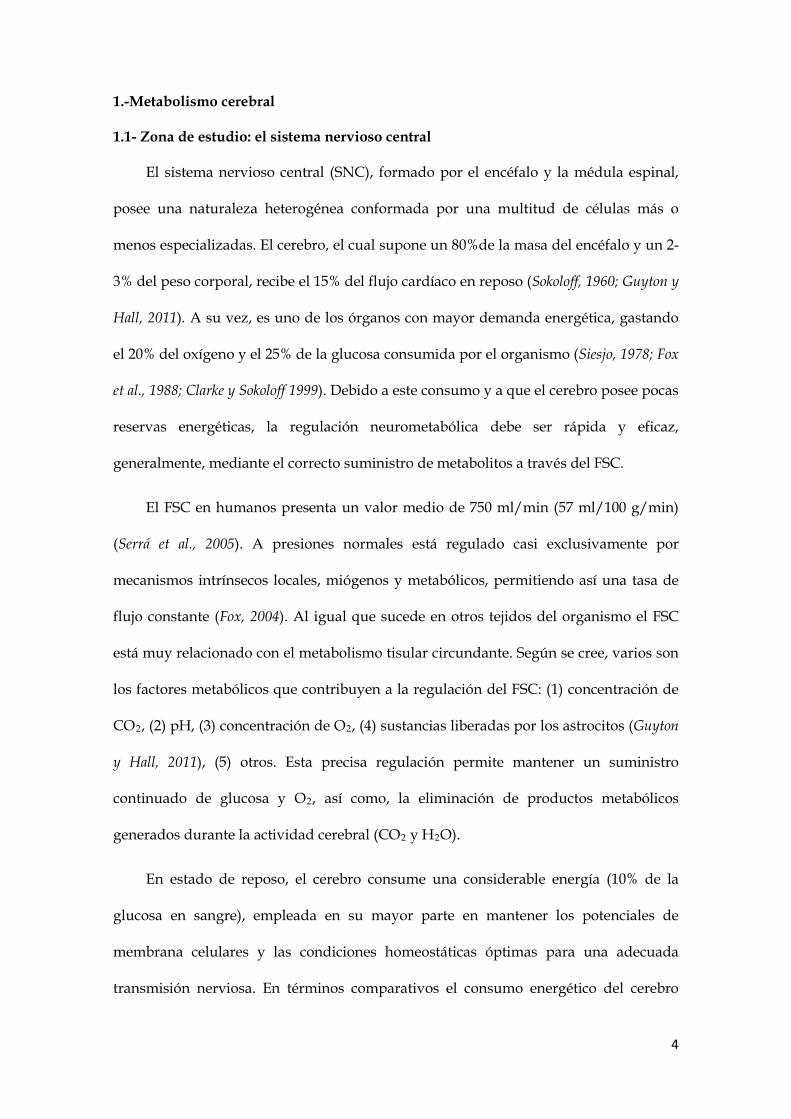
1.1- Zona de estudio: el sistema nervioso central
El sistema nervioso central (SNC), formado por el encéfalo y la médula espinal,
posee una naturaleza heterogénea conformada por una multitud de células más o
menos especializadas. El cerebro, el cual supone un 80%de la masa del encéfalo y un 2-
3% del peso corporal, recibe el 15% del flujo cardíaco en reposo (Sokoloff, 1960; Guyton y
Hall, 2011). A su vez, es uno de los órganos con mayor demanda energética, gastando
el 20% del oxígeno y el 25% de la glucosa consumida por el organismo (Siesjo, 1978; Fox
et al., 1988; Clarke y Sokoloff 1999). Debido a este consumo y a que el cerebro posee pocas
reservas energéticas, la regulación neurometabólica debe ser rápida y eficaz,
generalmente, mediante el correcto suministro de metabolitos a través del FSC.
El FSC en humanos presenta un valor medio de 750 ml/min (57 ml/100 g/min)
(Serrá et al., 2005). A presiones normales está regulado casi exclusivamente por
mecanismos intrínsecos locales, miógenos y metabólicos, permitiendo así una tasa de
flujo constante (Fox, 2004). Al igual que sucede en otros tejidos del organismo el FSC
está muy relacionado con el metabolismo tisular circundante. Según se cree, varios son
los factores metabólicos que contribuyen a la regulación del FSC: (1) concentración de
CO2, (2) pH, (3) concentración de O2, (4) sustancias liberadas por los astrocitos (Guyton
y Hall, 2011), (5) otros. Esta precisa regulación permite mantener un suministro
continuado de glucosa y O2, así como, la eliminación de productos metabólicos
generados durante la actividad cerebral (CO2 y H2O).
En estado de reposo, el cerebro consume una considerable energía (10% de la
glucosa en sangre), empleada en su mayor parte en mantener los potenciales de
membrana celulares y las condiciones homeostáticas óptimas para una adecuada
transmisión nerviosa. En términos comparativos el consumo energético del cerebro

5
podría ser comparado con el de una bombilla de 20 W (McKenna et al., 2006).
Aproximadamente el 75% de dicha energía es consumida en procesos relacionados con
la transmisión nerviosa (ciclo glutamato-glutamina, potencial de acción, receptores
postsinápticos, etc.), mientras que el 25% restante es empleada en funciones esenciales
tales como: síntesis y degradación proteica, estabilización de los gradientes eléctricos e iónicos
transmembrana, transporte axoplasmático, intercambio de nucleótidos y lípidos. (McKenna et
al., 2006).
Cuando se estudia el funcionamiento del cerebro se suele enfocar desde una
óptica neuronal. Las neuronas (~1011) son células altamente excitables que permiten el
procesamiento de información en el cerebro mediante la transmisión de señales
eléctricas complejas, siendo así, la unidad funcional por excelencia. No obstante, más
de la mitad del volumen cerebral está ocupado por células muy poco excitables, que
pese a su elevado número, solo consumen entre un 15 y un 30% del balance energético
total. Menospreciadas durante varias décadas, la neuroglía constituye la población
mayoritaria, destacando en este grupo los astrocitos o astroglía. Su localización
estratégica entre los vasos sanguíneos y las neuronas (Figura 1.1), así como, la
expresión de receptores y transportadores específicos frente a ciertos
neurotransmisores, ha llevado a postular su participación en la función metabólica y
sináptica de las neuronas. Hoy en día, a parte de su papel homeostático se considera
que son células que se comunican entre sí y con las neuronas de una manera dinámica
y cooperativa (Lòpez-Bayghen et al., 2007 Lòpez-Bayghen y Ortega, 2010).
6
1.2.- Metabolismo cerebral: Glucosa
Años de investigación en el campo del metabolismo cerebral han culminado con
la aceptación de algunas ideas que actualmente son difícilmente cuestionables, y que
sin duda, han generado un gran debate dentro de la comunidad científica. Dichas ideas
se resumen a continuación: (1) La glucosa es inequívocamente el combustible
energético y el único substrato disponible para sustentar la actividad neuronal (Siesjo,
1978). (2) Además, se asume que la mayor parte de la glucosa empleada se consume
por vía oxidativa, tanto en condiciones basales como en estados activados (Sokoloff et al,
1977). (3) El consumo energético es predominantemente debido a la actividad neuronal
(80-95%) frente a la actividad de otras células como la glía (5-20%) (McKenna et al.,
2006). (4) El consumo y suministro de glucosa está perfectamente acoplado a la
actividad sináptica (Sokoloff et al, 1977; Barret et al., 2003; McKenna et al., 2006).
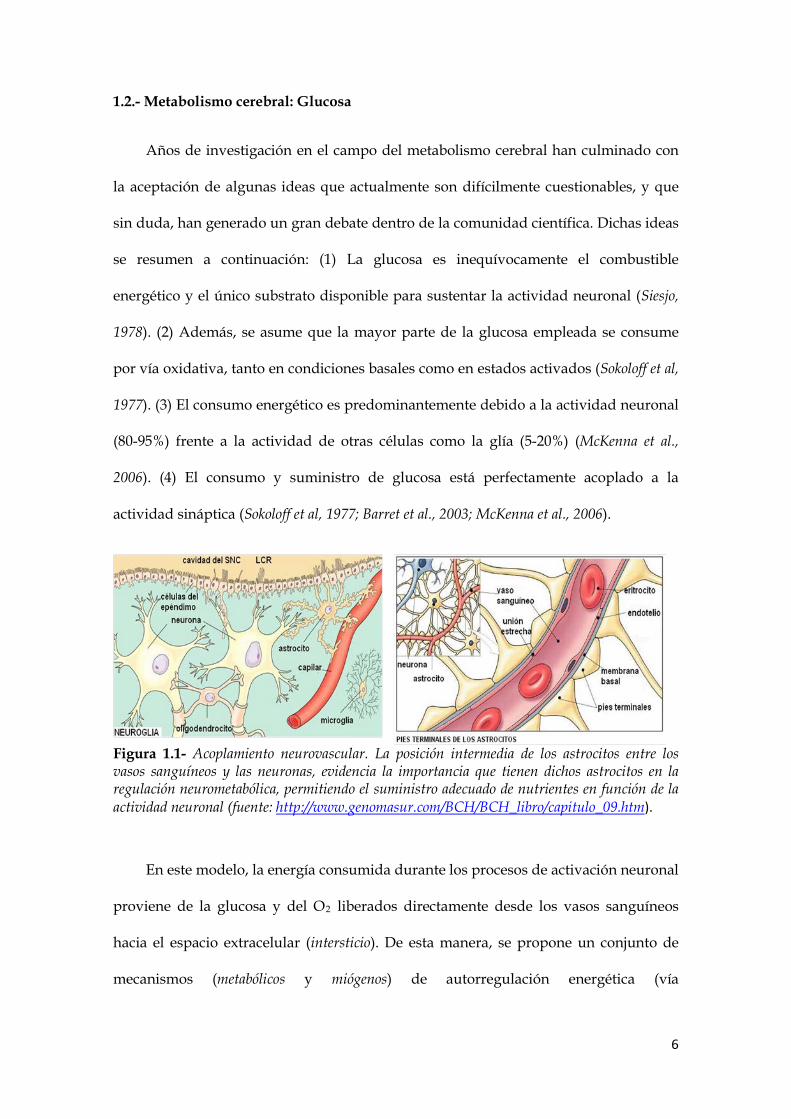
Figura 1.1- Acoplamiento neurovascular. La posición intermedia de los astrocitos entre los vasos sanguíneos y las neuronas, evidencia la importancia que tienen dichos astrocitos en la regulación neurometabólica, permitiendo el suministro adecuado de nutrientes en función de la actividad neuronal (fuente: http://www.genomasur.com/BCH/BCH_libro/capitulo_09.htm).
En este modelo, la energía consumida durante los procesos de activación neuronal
proviene de la glucosa y del O2 liberados directamente desde los vasos sanguíneos
hacia el espacio extracelular (intersticio). De esta manera, se propone un conjunto de
mecanismos (metabólicos y miógenos) de autorregulación energética (vía

7
neurotransmisores y vasodilatadores) que permiten a las neuronas disponer de un
suministro energético acorde a sus necesidades funcionales. Un aumento de la
actividad neuronal produce y libera neurotransmisores y sustancias vasoactivas que
conducen finalmente a un incremento del FSC, y por ende, a un incremento en la
concentración y liberación de metabolitos energéticos. Es decir, existe un acoplamiento
dinámico entre la actividad neural y el FSC.
Si bien, el transporte de O2 es por simple difusión a través de los tejidos y de las
membranas celulares, el transporte de glucosa en las células de los mamíferos está
facilitado por dos familias de proteínas: (1) transportadores de glucosa, GLUTs (Joost y
Thorens, 2001; Joost et al., 2002) y (2) co-transportadores de Na+ y glucosa, SGLTs (Wood
y Trayhurn, 2003). Los GLUTs son principalmente expresados en: (1) el SNC (vaso,
células gliares, neuronas) y (2) los eritrocitos, favoreciendo el paso de glucosa por
transporte pasivo, sin consumo de energía y a favor del gradiente de concentración
(Joost y Thorens, 2001; Joost et al., 2002; Bermúdez et al., 2007). Dicho mecanismo
imposibilita la acumulación celular de glucosa, y en el caso de acumularla debe hacerse
en su forma polimérica (glucógeno), únicamente en los astrocitos.
En la actualidad se conocen 13 transportadores GLUTs (Joost y Thorens, 2001; Wood
y Trayhurn, 2003), sin embargo, los transportadores GLUT1 y GLUT3 son expresados
mayoritariamente en el SNC (Figura 1.2) (Rayner et al., 1994; Vannucci et al., 1997;
Vannucci et al., 1998). La capacidad de transportar glucosa de los GLUTs depende de
varios factores, principalmente: (1) expresión y concentración en los distintos tejidos y
(2) propiedades cinéticas intrínsecas.

8
Figura 1.2.- Distribución de los transportadores de glucosa (GLUTs) y monocarboxilatos (MCT) en el cerebro. El alto grado de compartimentación cerebral favorece la expresión diferenciada de dichos transportadores (adaptada de Simpson et al., 2007).
Para acceder al parénquima cerebral la glucosa requiere atravesar las membranas
celulares del endotelio, que en el SNC constituyen la barrera hematoencefálica (BHE)
(Cremer et al., 1979; Bradbury, 1993), siendo en última instancia el transporte mediado
por los GLUTs (Figura 1.3). Cada una de las diferentes isoformas de los GLUTs tienen
expresión y características cinéticas propias, adaptadas a las necesidades metabólicas
de los distintos tejidos del organismo (Doege et al., 2000). La isomorfa GLUT1 presenta
dos conformaciones proteicas diferentes. Ambas son glicoproteínas de 45 o 55 kDa con
doce dominios transmembrana en estructura α hélice (Baldwin y Lienhard, 1989). La
GLUT1 (55 kDa), altamente glicosilada, se encuentra en las células endoteliales que
conforman la BHE (Harik et al, 1990; Farrell y Pardridge, 1991; Maher et at., 1993),
mientras que la isoforma de GLUT1 (45 kDa) parece estar asociada a las células gliales
o astrocitos (Bondy et al., 1992; Maher et al, 1993). Por último, el GLUT3 se encuentra
mayoritariamente expresado en las neuronas (Maher et al. 1993; Nagamatsu et al., 1993).

9
Ambos transportadores GLUT1 y GLUT3, poseen una alta afinidad por la glucosa
(Bermúdez et al., 2007), con una KM = 1-2 mM, muy por debajo de la concentración de
glucosa sanguínea (~ 5 mM). Dichos transportadores son capaces de transportar
glucosa al interior de las células de una manera estable y continua. Siendo de gran
importancia en células con una alta dependencia energética como: tejido nervioso y
eritrocitos (Bermúdez et al., 2007). Las concentraciones cerebrales para dichos
transportadores (GLUTs) estimadas por varios autores son: GLUT1 (45 kDa): 6.9-7.7
pmol mg-1 de proteína; GLUT1 (55 kDa): 2.3-2.5 pmol mg-1 de proteína; GLUT3: 8-11
pmol mg-1 de proteína (Maher y Simpson, 1994; Vannucci et al., 1997; Choeri et al 2005;
Simpson et al 2007). A su vez, se ha demostrado que la constante catalítica (kcat) para
GLUT3 es unas 6-7 veces mayor que para GLUT1, lo que pone de manifiesto que los
transportadores neuronales son muchos más rápidos y efectivos que los gliares (Lowe y
Walmsley, 1986; Maher et al., 1996). Por otro lado, estudios recientes realizados con
microscopía confocal revelan que el glutamato (principal neurotransmisor cerebral y
responsable del 80-90% de las sinapsis) inhibe los transportadores neuronales GLUT3,
mientras que estimula el transporte de glucosa en los GLUT1 (45 kDa) astrocitarios
(Loaiza et al., 2003; Porras et al., 2004). Otro dato interesante, es el desacoplamiento
temporal observado entre el consumo de O2, el flujo sanguíneo local y el consumo de
glucosa durante periodos de activación descrito por algunos autores (Fox y Raichle
1986; Fox et al., 1988).

10
Figura 1.3.- Modelo metabólico clásico: la glucosa y el oxígeno son liberados desde el vaso sanguíneo. El oxígeno difunde libremente a través de los tejidos, sin embargo, la glucosa debe atravesar cada uno de los compartimentos mediante transportadores GLUTs específicos. En este modelo la glucosa es el combustible primario, tanto para las neuronas como para los astrocitos, siendo el lactato un mero subproducto metabólico que es desechado al intersticio. Se asume que las neuronas son capaces de controlar el suministro metabólico en función de su estado.

11
Por último, es importante matizar que la glucosa en el cerebro no funciona únicamente
como sustrato energético [vía ciclo de los ácidos tricarboxílicos (TCA)], sino que cumple
varias funciones (Figura 1.4), como pueden ser la de sustrato para la biosíntesis de inositol y
glucógeno. Además, su esqueleto de carbono puede ser incorporado a la acetilcolina, lactato,
glutamato, glutamina, aspartato y alanina. En el cerebro desarrollado, el metabolismo a
través del ciclo de la pentosa fosfato es particularmente importante ya que proporciona
ribosa-5-fosfato para la síntesis de nucleótidos y la NADPH necesarios para la biosíntesis de
lípidos (Tabernero et al., 1996).
Figura 1.4.- La glucosa posee múltiples facetas metabólicas: puede ser almacenada como glucógeno para actuar de reserva energética, puede ser usada directamente para producir energía vía glicólisis o mediante el TCA, además, está conectada vía TCA en la síntesis de algunos neurotransmisores y sus intermediaros, también puede ser empleada en la biosíntesis de nucleótidos y NAPDH.

12
1.3.- Metabolismo cerebral: Lactato
Recientemente, se ha demostrado que el lactato podría ser algo más que un mero
subproducto energético, y que éste, puede ser utilizado como fuente de energía por las
células de la retina (Poitry-Yamate, 1995), en neuronas en el cerebro adulto (Larrabee, 1995; Hu
y Wilson, 1997; Schurr et al., 1999) y en general por cualquier tejido en condiciones fisiológicas
normales (Brooks, 1987; Haljamae, 1987). Incluso, dicho consumo puede ser preferencial frente
a la glucosa en determinadas condiciones (Pellerin y Magistretti, 1994).
Por otro lado, es bien conocido que la tasa de transporte y el metabolismo oxidativo de
la glucosa es muy bajo en el cerebro en desarrollo (período posnatal), y éste aumenta con la
madurez del SNC (Vannucci et al., 1997; Dwye et al., 2002; Vannucci y Simpson, 2003). Dicho
proceso está relacionado con el desarrollo progresivo de algunos transportadores y
lanzaderas específicas del TCA, necesarios para metabolizar la glucosa a nivel celular
(McKenna et al., 2006). Debido a esta inmadurez temporal del SNC, varios ácidos
monocarboxílicos, incluyendo el lactato y otros cuerpos cetónicos como el acetoacetato y el β-
hidroxibutirato, son empleados como sustratos energéticos. Estos compuestos también son
incorporados en los lípidos, aminoácidos y las proteínas en el cerebro en desarrollo (Cremer,
1982; Nehlig, 2004). Según estos datos, el lactato parece tener un papel importante durante el
período postnatal, tanto como fuente de energía, como sustrato primario para la biosíntesis
de intermediarios metabólicos (Medina, 1985), siendo este hecho consistente con la alta
concentración de grasas en la leche materna (Vannucci y Simpson, 2003).
1.3.1.- Lanzadera de lactato: Astrocite-Neuron-Lactate Shuttle Hypotesis
A partir de las observaciones citadas anteriormente y otros datos recogidos en la
bibliografía (Pellerin et al., 1998; Pellerin, 2003), Pellerin y Magistretti (Pellerin y Magistretti,
1994) han propuesto un modelo (Astrocite-Neuron-Lactate Shuttle, ANLS), mediante el cual el

13
lactato producido en el astrocito es usado como fuente de energía por las neuronas. Dicha
hipótesis supone una secuencia temporal de sucesos y mecanismos acoplados, que dan lugar
finalmente a la liberación de lactato en el espacio extracelular y a su recaptación por parte de
la neurona (Figura 1.5). Esta hipótesis ha sido avalada por un número importante de datos y
observaciones fisiológicas (Schurr et al. 1997a; Schurr et al. 1997b; Schurr et al. 1999; Pellerin
2003).
Los astrocitos desempeñan un papel fundamental en el flujo de sustratos energéticos a
las neuronas debido a su localización estratégica y a su versatilidad metabólica (Magistretti y
Pellerin, 1996; Lòpez-Bayghen et al., 2007; Lòpez-Bayghen y Ortega, 2010). La morfología
particular de los astrocitos, con sus terminaciones alrededor de los capilares sanguíneos,
hace que los astrocitos sean la primera barrera celular que la glucosa ha de atravesar para
penetrar en el SNC. Esta localización privilegiada, así como, la existencia de transportadores
específicos (GLUT1 (55 kDa) en las células endoteliales y GLUT1 (45 kDa) en los pies
astrocitarios), apoyan el papel que desempeñan los astrocitos en la distribución de nutrientes
desde la sangre hasta otras células cerebrales (Magistretti y Pellerin, 1999a; Magistretti y
Pellerin, 1999b)
Los astrocitos tienen la capacidad de detectar la actividad sináptica mediante receptores
y/o transportadores específicos en la hendidura sináptica (Pellerin y Magistretti, 1994). Por
otro lado, recientes investigaciones han demostrado que la captación de glutamato, vía
transportadores GLT-1 (EAAT2) y GLAST (EAAT1) (Araque et al., 1999; Pellerin, 2003),
estimula la glucólisis aeróbica astrocitaria (Pellerin y Magistretti, 1994; Takahashi et al., 1995;
Hamai et al., 1999).
El transporte de glutamato en los astrocitos está dirigido por un gradiente
electroquímico de Na+: una molécula de glutamato es cotransportada con tres iones Na+

14
hacia el interior celular y como consecuencia, un ión K+ sale al exterior. Esto genera un
incremento en la concentración intracelular de Na+, que es equilibrado a través de la Na+/K+-
ATPasa. Este proceso consume ATP e implica la activación de la glicólisis y la producción de
lactato (Pellerin y Magistretti, 1994;, Takahashi et al., 1995; Pellerin y Magistretti, 1997; Magistretti
y Pellerin, 1999a; Magistretti y Pellerin, 1999b). Un gran número de evidencias experimentales
apoyan que dicho mecanismo no es activado por los receptores glutamatérgicos, sino por los
transportadores EAAT1 y EAAT2 (Pellerin y Magistretti, 1994; Takahashi et al., 1995; Pellerin y
Magistretti, 1997). Teniendo en cuenta que la oxidación de piruvato por el TCA es la vía más
eficiente para obtener ATP, la razón por la cual los astrocitos favorecen la formación de
lactato no ha sido entendida completamente (Pellerin, 2005).
Durante un proceso glicolítico continuado los niveles elevados de NAD+ citosólico,
esenciales durante la reacción catalizada por la gliceraldehído-3-fosfato deshidrogenasa
(GADPDH) en la glucólisis (segunda fosforilación), se reducen drásticamente (ver Figura
1.5). Pellerin y colaboradores han propuesto que dicha reserva citosólica de NAD+ podría ser
regenerada de forma eficiente por la conversión (reducción) piruvato-lactato mediante la
lactato deshidrogenasa astrocitaria (LDH5) (Pellerin, 2005). Recientemente, han sido
presentados argumentos adicionales que sugieren que los astrocitos poseen una reducida
capacidad de regenerar los niveles de NAD+ a partir del NADH citosólico mediante la
lanzadera malato-aspartato (Ramos et al., 2003). De esta manera, todo parece indicar que la
conversión piruvato-lactato podría tener un papel adicional, no solo de suministro
metabólico, sino también regenerando los niveles de NAD+ citosólicos indispensables en la
glucólisis astrocitaria.
Una vez generado el lactato en el citosol astrocitario, es necesario su transporte
mediante transportadores especializados. En este caso, Pellerin y colaboradores se apoyan en
las diferentes propiedades cinéticas de dichos transportadores, así como, en la distribución

15
diferenciada de los mismo en el SNC (Pellerin y Magistretti, 1999a; Pellerin 2003; Pellerin;
2005). Los astrocitos expresan en su membrana celular transportadores monocarboxilatos
(MCT1 y MCT4) que favorecen el transporte de lactato al intersticio. Por otro lado, las
neuronas expresan transportadores monocarboxilatos tipo MCT2 que favorecen la captación
neuronal de lactato. Finalmente, la presencia de isomorfas de lactato deshidrogenasa (LDH1)
en el citosol neuronal favorecen la conversión (oxidación) lactato-piruvato, siendo este
último, transportado al interior de las mitocondrias (vía transportadores monocarboxilatos)
donde continúa el TCA acoplado a la fosforilación oxidativa (Pellerin y Magistretti, 1999a;
Pellerin 2003; Pellerin; 2005).
Sin duda, dicho hipótesis y su evolución a lo largo del tiempo han generado un intenso
debate entre partidarios y detractores (Hertz, 1999; Bliss et al., 2001; Bouzier-Sore et al., 2002;
Bouzier-Sore et al., 2003; Chih y Roberts, 2003; Bergersen, 2007). En 2011 Pellerin ha presentado
una nueva revisión con el sugerente título “Sweet sixteen for ANLS” donde se hace una nueva
revisión de los conceptos e ideas fundamentales (Pellerin y Magistretti; 2011).
16
Figura 1.5.- Hipótesis (ANLS) planteada por Pellerin y Magistretti (Pellegrin, 2003): La secuencia de eventos empezaría por la captación y regeneración del glutamato liberado en la hendidura sináptica (ciclo glutamato-glutamina), proceso acompañado por la entrada masiva de iones Na+ al astrocito. Dicho mecanismo activaría la bomba de Na+/K+ produciendo un considerable descenso de las reservas energéticas astrocitarias. Para compensar dicha pérdida se activaría la glicólisis y/o glicogenolisis y el transporte de glucosa (GLUT1 45 kDa). Una consecuencia directa de la glicólisis astrocitaria es el aumento de piruvato y NADH citosólico. Como consecuencia, podrían activarse varios procesos: (1) el TCA acoplado a la fosforilación oxidativa, generando ATP y regeneranto el NAD+; (2) conversión de piruvato a lactato (LDH5), regenerando el NAD+. Posteriormente, el lactato es transportado al intersticio vía MCT1 y MCT4. Una vez en el intersticio los transportadores MCT2 introducirían el lactato al interior de la neurona que seguidamente lo transformara a piruvato (LDH1) e incorpora al TCA acoplado a la fosforilación oxidativa.

17
1.3.2.- Nuevas hipótesis sobre el uso neuronal del lactato
1.3.2.1.- Acoplamiento redox y actividad metabólica: The redox-switch/redox-coupling
hypothesis
Recientemente, se han postulado nuevos mecanismos para describir el acoplamiento
neurona-astrocito (Cerdán et al., 2006, Rodrigues et al., 2009). Dichos autores proponen que las
neuronas y los astrocitos pueden intercambiar reversiblemente lactato y piruvato vía MCT
(Figura 1.6). Dicho mecanismo se basa en la inhibición de la glicólisis vía GADPDH en
condiciones reductoras (bajas concentraciones de NAD+ citosólico) así como, en la
compartimentación subcelular del piruvato y el intercambio reversible de monocarboxilatos
entre la neurona y la glía. Dicha compartimentación permite a la neurona y la glía elegir su
sustrato metabólico (glucosa o lactato) en función de: (1) el estado redox citosólico (“redox
switch”, relación NAD+/NADH), (2) de las concentraciones extracelulares relativas de lactato
y glucosa.
Cerdán y colaboradores sugieren que durante la captación de glutamato por la glía se
incrementa su actividad glicolítica y la actividad del TCA, produciendo una importante
reducción de la relación NAD+/NADH citosólica en la glía (Cerdán et al., 2006).
Posteriormente se transfieren equivalentes reductores a la neurona reduciendo los niveles de
NAD+/NADH y provocando la inhibición (switch off) de la glicólisis neuronal y favoreciendo
el transporte (vía MCT) y oxidación del lactato extracelular (vía LDH1 y TCA) para generar
piruvato (recuperando los niveles de NAD+ citosólico). Finalmente, este piruvato acumulado
en exceso en el citosol neuronal, podría entrar al TCA o volver al espacio extracelular.
Posteriormente el piruvato podría entrar en la glía (vía MCT), recuperando así los niveles
redox basales (Ramírez et al., 2007) y comenzar un nuevo ciclo lactato/piruvato entre la
neurona y la glía.
18
Figura 1.6.- Esquema de la hipótesis planteada por Cerdán (Cerdán et al., 2006). Dicho modelo enfatiza el transporte bidireccional que tiene el piruvato y el lactato entre la neurona y el astrocito. En dicho modelo existen dos fuentes de piruvato en la neurona y en la glía derivados del metabolismo de la glucosa o de los monocarboxilatos. La lanzadera lactato/piruvato es capaz de transferir continuamente lactato desde el astrocito a la neurona vía MCT, siendo metabolizado finalmente por la LDH1. Las altas concentraciones citosólicas de lactato en la neurona inhibe la glicólisis ya que disminuyen drásticamente los niveles de NAD+ necesarios para la GAPDH, favoreciendo finalmente la oxidación del lactato extracelular. Posteriormente el piruvato es transportado hacia la glía, vía MCT, preparándose para un nuevo ciclo.

19
1.3.2.2.- Transporte mitocondrial del lactato
Nuevas investigaciones han sugerido que el lactato puede ser metabolizado
directamente en el interior de la mitocondria y no necesariamente en el citoplasma
neuronal (Schurr, 2006). Este hecho parece ser confirmado por: (1) existencia de
transportadores MCT en la membrana mitocondrial, (2) presencia de formas isomorfas
LDH localizadas en la membrana interna mitocondrial de las neuronas (m-LDH) (Hashimoto
et al, 2008).
Esta hipótesis alternativa (Figura 1.7) sugiere que el lactato y no el piruvato, es el
producto final de la glicólisis en todos los tipos de tejidos y en cualquier condición: aeróbica
o anaeróbica (Schurr, 2006; Schurr y Payne, 2007). Bajo esta suposición, la glicólisis citosólica
siempre conduce a la formación de lactato, principalmente para regenerar el NAD+ que se
consume durante glicólisis. Finalmente, si la producción de lactato se produce en
condiciones aeróbicas, es transportado a través de la membrana mitocondrial vía
transportadores monocarboxilatos (MCT1 y MCT2) y convertido en piruvato (vía m-LDH).
Una vez en esta forma, entraría al TCA acoplado a la fosforilación oxidativa para obtener
ATP. Avalando dicha hipótesis se encuentran los estudios de Hashimoto y colaboradores
realizados en 2008, que demuestran la presencia de transportadores MCT1 y MCT2 en la
membrana mitocondrial, así como, la presencia de m-LDH en su interior (Hashimoto et al,
2008). Finalmente, ese mismo año estudios paralelos confirmaron la presencia de
transportadores MCTs mitocondriales no solo en las neuronas sino también en células
gliares (Lemire et al., 2008).

20
Figura 1.7.- Esquema de la hipótesis planteada por Schurr (Schurr, 2006): La glicólisis citosólica produce piruvato que posteriormente es reducido a lactato, regenerando los niveles de NAD+ citosólico. Seguidamente, dicho lactato es transportado, vía MCT, a la mitocondria donde es convertido en piruvato y entra en el TCA.
.

21
1.4.- Metabolismo cerebral: técnicas instrumentales
Actualmente, existe un gran interés por el estudio y conocimiento de las funciones
cerebrales (lenguaje, memoria, plasticidad, emociones), así como, su modificación en
procesos neurodegenerativos (Alzhéimer, Párkinson, Huntington), procesos adictivos,
etc. Ello ha propiciado que hoy en día existan un gran número de técnicas
instrumentales, empleadas en dilucidar aspectos concretos del comportamiento,
funcionamiento y metabolismo cerebral. Algunas de estas técnicas son costosas y
aparatosas como: resonancia magnética funcional (fMRI), tomografía por emisión de
positrones (PET), técnicas de fluorescencia, espectroscopía de protón (1H-NMR) y C-13
(13C-NMR); y otras más sencillas y económicas como: microdiálisis, técnicas
espectroscópicas en el infrarrojo cercano (NIRs) y en el visible (VIS), sensores,
biosensores etc.
El desarrollo de las modernas técnicas de análisis neuroquímico, ha dado lugar a
un avanzado grado de especialización, sin embargo cada técnica presenta sus propias
restricciones inherentes. Por ejemplo, las técnicas espectroscópicas como el NIRs
(infrarrojo cercano) dependen del poder de penetración de los fotones en los tejidos, la
resonancia magnética (1H-NMR y 13C-NMR) no permite una resolución (resolución del
vóxel) menor del cm2, llevando a una imprecisión en la localización (espacio intra y
extracelular) de los metabolitos estudiados, especialmente cuando los modelos
compartimentales han sido aceptados como doctrina (McKenna et al., 2006). Esto ha
llevado a que los métodos invasivos de análisis (microdiálisis, voltametría in vivo,
electroforesis capilar etc.), con una mayor resolución espacial, hayan sido usados más
frecuentemente en modelos animales.

22
1.4.1.- Microdiálisis
La microdiálisis cerebral es un método analítico que utiliza un sistema cerrado en
el cual una sonda de doble luz, con una membrana de diálisis (Ø~250-500 µm) en uno
de sus extremos, se inserta en una región determinada del cerebro. A través de dicha
membrana se produce una difusión pasiva y a favor del gradiente de concentración
de analitos y/o fármacos, entre el líquido de perfusión y el medio extracelular
(Benveniste et al., 1990). La técnica fue desarrollada en la década de los 60 y 70 por
varios grupos (Bito et al., 1966; Delgado et al., 1972) y empleada en el estudio de
distintos analitos en diversos tejidos, incluyendo el cerebro (Bito et al., 1966; Delgado et
al., 1972). Pese a que inicialmente presentaba ciertas limitaciones, la técnica fue
perfeccionada y aplicada a nivel cerebral por otros grupos de investigadores
(Ungerstedt y Pycock, 1974; Mas et al., 1995a; Mas et al., 1995b). Esta técnica permite
estimar in vivo la liberación de neurotransmisores y metabolitos, y a su vez, estudiar
los cambios inducidos en ellos por drogas y fármacos perfundidos a través de la
sonda de diálisis o administrados por vía sistémica (Ungersted, 1991).
1.4.2.- Voltametría in vivo
Aproximadamente cincuenta años después del nacimiento de las técnicas
voltamperométricas (1922) a cargo del premio Nobel Jaroslav Heyrovsky, apareció un
interés generalizado por el estudio de distintos compuestos electroactivos en el SNC.
Los primeros estudios que aparecen usando técnicas voltamperométricas se remontan
a los años 50, cuando Clark y colaboradores midieron O2 y ácido ascórbico en el
cerebro (Clark et al., 1958; Clark y Lyons, 1965). Sin embargo, Ralph Adams fue el
primero en aplicar dichas técnicas en el SNC de forma generalizada, y hoy en día es
23
considerado como el principal impulsor de las técnicas voltamperométricas en el
estudio del SNC (Kissinger et al., 1973).
En la década de los 70 y 80 se empezó a estudiar la electrooxidación de fenoles,
catecoles y catecolaminas en sistemas in vivo (Gonon et al., 1981; O’Neill et al., 1983;
Sharp et al., 1983; González-Mora et al., 1988; González-Mora et al., 1989). Varios grupos de
investigación sugirieron la posibilidad de implantar pequeños electrodos en el SNC y
estudiar diferentes neurotransmisores catecolaminérgicos [dopamina (DA,
norepinefrina (NE)] y sus metabolitos [ácido homovanílico (HV) y ácido 3,4-
dihidroxifenilacético (DOPAC)] (Gonon et al., 1981; O’Neill y Fillenz, 1985; González-Mora
et al., 1988; Wightman et al., 1988; González-Mora et al., 1989; González-Mora et al., 1990;
Mas et al., 1990; Louilot et al., 1991).
Los primeros electrodos utilizados en voltamperometría in vivo fueron electrodos
de pasta de carbono (CPEs) (O’Neill et al., 1982), aunque rápidamente Gonon y
colaboradores establecieron el uso de electrodos de fibra de carbono (CFEs), mucho
más versátiles y con reducidas dimensiones (~µm) (Gonon et al., 1981; Mas et al., 1989;
Mas et al., 1995a; Mas et al., 1995b).
Inicialmente, los problemas encontrados en dichos dispositivos fueron: (1) baja
selectividad frente a otros compuestos electroactivos presentes en el SNC (ácido
ascórbico (AA), ácido úrico (AU), (2) pasivación de la superficie del electrodo por agentes
floculantes (lípidos y proteínas), (3) agresividad del medio de trabajo (respuesta
inmunológica). Para solventar estos problemas se recurrió al empleo de dos estrategias
distintas: (1) Pretratamiento electroquímico de las fibras de carbono (Gonon et al., 1981),
dicho tratamiento alteraba la superficie del electrodo y permitía detectar a diferentes
potenciales AA y distintos catecoles. (2) Recubrimiento del electrodo con polímeros

24
polianiónicos como el Nafion (Gerhard et al., 1984). (3) Deconvolución matemática
mediante algoritmos no lineales (Mas et al., 1989; González-Mora et al., 1991).
Con el devenir de los tiempos se ha incrementado el interés por mejorar las
propiedades antiinterferentes y la sensibilidad de estos métodos electroquímicos. Sin
duda, gran parte del éxito actual se debe a la gran diversidad de las técnicas
voltamperométricas existentes [Voltametría Cíclica (CV), Amperometría a Potencial
Constante (CPA), Voltametría Cíclica Rápida (FCV), Voltamperometría Pulsada
Diferencial (DPV)] (Mas et al., 1990; Louilot et a., 1991; Guadalupe et al., 1992; Mas et al.,
1995a; Mas et al., 1995b) y a la utilización de nuevos materiales poliméricos y
electrocatalíticos, que permiten no solo mejorar la selectividad, sino proporcionar
mejores condiciones de trabajo (sensibilidad, estabilidad, potencial de trabajo, límite de
detección, etc.) (Lowry et al., 1998; Breccia et al., 2002; Li et al., 2002; Qian et al., 2004;
Killoran y O’Neill, 2008; O’Neill et al 2008; Rothwell et al., 2008).
Finalmente, el uso de los métodos voltamperométricos ha permitido el estudio de
una gran variedad de procesos y mecanismos neuroquímicos y neurofisiológicos
(Kozminski et al., 1998, Colliver et al., 2000, Pothos et, al 2000; Avshalumov et al., 2003;
Stuber et al., 2005a; Stuber et al., 2005b)
1.4.3.- Voltamperometría vs. Microdiálisis
Pese a que desde la década de los 60 se desarrollaban electrodos electroquímicos
para un número razonable de analitos, el salto tecnológico que permitió su adecuación
para realizar estudios en el cerebro fue, la miniaturización. En la décadas de los 80-90 se
introdujeron los CPEs (Ø~250 µm) (O’Neill et al., 1982) y los CFEs (Ø ~10µm) (Gonon et
al., 1981; González-Mora et al., 1988; Wightman et al., 1988; González-Mora et al., 1989;
González-Mora et al., 1990 ;Mas et al., 1990; Louilot et a., 1991; Mas et al., 1991; Guadalupe et

25
al., 1992; Mas et al., 1995a; Mas et al., 1995b), los cuales redujeron significativamente el
tamaño de tales dispositivos. Gracias a este reducido tamaño (~µm), sobre todo los
CFEs, ofrecían ventajas analíticas (gran resolución espacial y temporal) frente a otras
técnicas convencionales (microdiálisis, electroforesis capilar, etc.), Figura 1.8.
La inserción de la sonda de recogida de muestra (microdiálisis) produce
alteraciones del medio de estudio (cerebro), debidas principalmente, a sus grandes
dimensiones (Ø~250-500 µm). Como consecuencia, aparecen alteraciones fisiológicas y
anatómicas en la región de estudio (rotura de vasos sanguíneos, pérdida de la integridad de
la barrera hematoencefálica, cambios en la microcirculación local, edema, consumo extra de
glucosa, producción de citoquinas, eventual proliferación de células gliales, etc.) que se pueden
extender hasta 1 mm de la zona de implantación (Benveniste et al., 1987; O’Neill et al.,
1991; Fumero et al., 1994; Mas et al., 1995a Zhou et al., 2001; Khan y Michael, 2003).
Estudios recientes con FCV han demostrado alteraciones en la liberación y recaptación
de DA en el tejido próximo a la sonda de microdiálisis (Ø~220µm) (Borland et al., 2005).
Por otro lado, debido la dilución del analito en la disolución de perfusión, no se
mide la concentración real del espacio extracelular, sino una concentración menor que
depende de: (1) la tasa de reparto a través de la membrana de microdiálisis, (2) la
velocidad de perfusión, (3) tamaño de poro, (4) las características estructurales de la
molécula, etc. Esto hace difícil o al menos laboriosa la obtención del valor de fondo
(nivel basal) del analito (Zero Net Flux method) (Lönnroth et al., 1987). Dicha dilución
puede incluso enmascarar los cambios fisiológicos acontecidos cuando este se presenta
a bajas concentraciones como es el caso del glutamato (concentración basal ~ 20 µM
(Oldenziel et al., 2006; Oldenziel et al., 2007).

26
Figura 1.8.- Comparación de las dimensiones de los electrodos de fibra de carbono (CFE), sonda de microdiálisis y el rango de tamaño de las neuronas.
La principal ventaja de la microdiálisis es que puede determinar varios analitos
simultáneamente, especialmente cuando se combinan con técnicas cromatográficas y
sistemas de detección adecuados (Kaul et al., 2011). Sin embargo, ello lleva consigo el
aumento de la resolución temporal (velocidad de muestreo: 5-8 muestras/hora,
separación cromatográfica: 15-20 minutos). Una forma de disminuir dicho tiempo es
hacer pasar el líquido de perfusión con el analito por una celda de reacción donde se
pueda monitorizar los cambios del analito acoplando un sensor electroquímico o un
biosensor al sistema (Moscone y Mascini, 1992; Steinkuh et al., 1996; Ricci et al., 2007). Sin
embargo, dicha aproximación no disminuye el tiempo necesario de perfusión del
líquido a través de todo el sistema de muestreo, obteniéndose así, una resolución de 15-
20 muestras/hora (Yao y Yano, 2004).

27
Gracias al pequeño tamaño de los microelectrodos las lesiones ocasionadas por su
inserción son reducidas notablemente y además, aparecen nuevas característica
(pequeñas corrientes de medida, modificación de la técnica voltamperométrica, resolución
temporal, etc.), que hacen que los microelectrodos sean adecuados para realizar estudios
a nivel fisiológico. Sin duda, la mayor ventaja es que miden directamente en el espacio
extracelular, sin necesidad de utilizar métodos de extracción Por otro lado, la elevada
relación señal/ruido permite alcanzar bajos límites de detección y una elevada
resolución temporal.
Las pequeñas corrientes generadas en el microelectrodo (~pA), hacen que sea
posible medir en medios con una alta resistencia, como son los medios biológicos
(SNC). La resolución temporal es muy corta (<1s) (Robinson et al., 2003; Cheer et al.,
2004), debido principalmente a dos factores: (1) dinámico, al disminuir el tamaño del
electrodo disminuye también la capa difusiva circundante, incrementando así la
velocidad de transporte de masa desde y hacia el electrodo; y (2) eléctrico, al disminuir
la superficie del electrodo la corriente capacitiva decrece exponencialmente, mientras
que la corriente farádica disminuye linealmente, luego la razón ifar/icap aumenta al
disminuir las dimensiones, permitiendo reducir el tiempo necesario para alcanzar el
estado estacionario (Yáñez-Sedeño y Pigarrón, 2001).
Por último, la posibilidad de modificar dichos microelectrodos adecuadamente ha
permitido la determinación de metabolitos no electroactivos: glucosa (Moscone y
Mascini, 1992; Steinkuh et al., 1996; Fillenz y Lowry 1998; Lowry et al., 1998; Ricci et al.,
2007); lactato (Shram et al., 1998; Yao y Yano, 2004; Burmeister et al., 2005), glutamato
(Kulagina et al., 1999; Kasai et at., 2001; Kasai et at., 2002; Oldenziel et al., 2006; Oldenziel et
al., 2007), piruvato (Yao y Yano, 2004), etc., incrementando así su interés metodológico
en el ámbito neuroquímico.

28
2.- Biosensores
2.1.- Definición
La detección de especies electroactivas como el ácido ascórbico (O’Neill et al.,
1983), ácido úrico (O’Neill, 1990), ácido homovanílico (O’Neill y Fillenz, 1985) y oxígeno
(Lowry et al., 1996; Bolger y Lowry, 2005) han sido realizadas con éxito mediante
electrodos no modificados. Sin embargo, la detección de especies no electroactivas,
tales como aminoácidos (glutamato), metabolitos energéticos (glucosa, lactato,
piruvato), etc. requieren el empleo de biosensores (Moscone y Mascini, 1992; Steinkuh et
al., 1996; Shram et al., 1998; Yao y Yano, 2004; Burmeister et al., 2005; Oldenziel et al., 2006;
Oldenziel et al., 2007; Ricci et al., 2007).
De acuerdo con la definición que da la IUPAC (Internacional Union of Pure and
Applied Chemistry) (Thévenot et al., 1999; Thévenot et al., 2001), un biosensor es un
dispositivo analítico que incorpora un elemento biológico (ácido nucleico, enzima,
anticuerpo, receptor, tejido, célula), o biomimético (PIMs, aptámeros, PNAs),
íntimamente asociado a un transductor fisicoquímico (Figura 2.1), que en presencia del
analito, produce una señal discreta o de carácter continuo (pH, transferencia de
electrones, de calor, cambio de potencial, de masa, variación de las propiedades
ópticas, etc.), proporcional a la cantidad de analito presente en la matriz en la que se
encuentra.
Las características más importantes de los biosensores y que los convierten en
herramientas analíticas competitivas con las técnicas clásicas de análisis (microdiálisis,
electroforesis,…) son: especificidad, alta sensibilidad, corto tiempo de análisis, uso en sistemas
de Análisis por Inyección de Flujo (FIA), facilidad de automatización, capacidad de trabajar en
tiempo real, bajo coste de fabricación, etc. (Prodromidis y Karayannis, 2002; D'Orazio, 2003;
Mehrvar y Abadi, 2004; D'Orazio, 2011).

29
Figura 2.1.- Esquema de las partes fundamentales de un biosensor, así como, el acoplamiento entre distintos sistemas de reconocimiento y sistemas de transducción.
2.2.- Los orígenes
El nacimiento de los biosensores se puede atribuir a Leland C. Clark Jr. (Clark y
Lyons, 1962), quien sugirió por primera vez la posibilidad de modificar un electrodo de
oxígeno para estudiar una reacción enzimática que consumiera dicho reactivo. De esta
forma, la enzima (Glucosa oxidasa, Gox) fue retenida mediante una membrana
semipermeable de diálisis en la superficie de un electrodo de oxígeno. Clark observó
que la respuesta de este nuevo dispositivo era proporcional a la concentración de
glucosa: la enzima oxidaba la glucosa y como consecuencia, se producía un descenso
proporcional en la concentración de oxígeno en la superficie del electrodo. En estas
primeras publicaciones Clark y Lyons acuñaron el término “electrodo enzimático” a su
nuevo invento (Clark y Lyons, 1962).
Posteriormente, este diseño fue implementado (Updike y Hicks, 1967). Dichos
autores emplearon dos electrodos de oxígeno (uno recubierto con enzima y otro no).
Dicha modificación permitió corregir las variaciones de oxígeno en el medio (efecto
matriz). En 1973, Guilbault y Lubrano desarrollaron un electrodo enzimático para

30
determinar glucosa en sangre mediante la detección amperométrica (anódica) del
peróxido de hidrógeno generado durante la reacción enzimática (Guilbault y Lubrano,
1973). En 1975, empezó la comercialización de este dispositivo por la empresa Yellow
Spring Instruments (analizador YSI modelo 23) (Magner, 1998). Ese mismo año, Divis
desarrolló un dispositivo para determinar etanol que utilizaba microorganismos como
elemento de reconocimiento (Divis, 1975). A partir de este momento el término
“biosensor” empezó a ser usado.
En las últimas décadas, el diseño y las aplicaciones de los biosensores en distintos
campos de la química analítica han continuado creciendo. El desarrollo de los
biosensores ha estado centrado principalmente en el campo del diagnóstico clínico
(biosensores sensibles a glucosa) (Wang, 2001; D'Orazio, 2003; Wilson, 2005; D'Orazio,
2011). Sin embargo, han aparecido muchas aplicaciones en el ámbito medioambiental,
agroalimentario, químico, farmacéutico y militar (Mason, 1988; Kulys et al., 1989;
Ramsay, 1998; Castillo et al., 2004). El número de publicaciones científicas, revisiones y
patentes sobre biosensores desarrollados en los últimos años es muy elevado, lo que
refleja el gran interés que despiertan estos dispositivos en la comunidad científica
(Wang, 2001; Castillo et al., 2004; D'Orazio, 2011). A su vez, el empleo de nuevos
materiales (nanopartículas, nanotubos de carbono, grafenos, etc.) y elementos de
reconocimiento (anticuerpos, receptores iónicos, compuesto biomiméticos) han mejorado sus
características analíticas. Por último, los biosensores ofrecen una excelente versatilidad,
pudiéndose fabricar a la carta y con características específicas a su ámbito de
aplicación.

31
2.3.- Clasificación de los biosensores
Los biosensores pueden clasificarse atendiendo a diferentes criterios (Tabla 2.1).
Así, podemos clasificarlos según el tipo de interacción entre el analito y el material
biológico, el método de detección, la naturaleza del material biológico de reconocimiento o la
naturaleza del sistema de transducción empleado (Thévenot et al., 1999; Thévenot et al.,
2001).
Tipo de interacción
Detección de la interacción
Biocatalítico
Directo Bioafinidad
Indirecto
Elemento de reconocimiento
Sistema de transducción
Enzima
Electroquímicos Orgánulo, tejido
Ópticos
Receptor biológico
Piezoeléctricos Anticuerpo
Termométricos
Ácidos nucleicos
Nanomecánicos PIM (polímeros de impresión)
Aptámeros
Tabla 2.1.- Criterios de clasificación de los biosensores.
Sin duda, las clasificaciones más extendidas son: (1) en función del tipo de
interacción que existe entre el elemento de reconocimiento y el analito: biocatalítico
(enzimas, células, orgánulos) y bioanifidad (anticuerpo, lectinas, receptores biológicos,
ácidos nucleicos); (2) según el sistema de transducción empleado para seguir la
reacción de biorreconocimiento.

32
2.3.1.- Clasificación en función del elemento de reconocimiento
Las moléculas utilizadas en los biosensores como elementos de reconocimiento
deben cumplir ciertos requisitos fundamentales para poder ser empleadas como
unidades sensoras: (1) tienen que poseer afinidad hacia el elemento objeto del
reconocimiento; (2) dicho reconocimiento deberá ser lo suficientemente selectivo para
reconocer a este elemento en presencia de otros compuestos (interferentes); y (3)
deberá permanecer estable a lo largo del tiempo (Thévenot et al., 1999; Thévenot et al.,
2001).
El reconocimiento molecular puede dar lugar a un enlace entre el elemento
receptor y la molécula de interés (antígeno-anticuerpo), o bien, a una interacción de
naturaleza catalítica (enzima-sustrato-producto). Este es el principal criterio que se utiliza
para clasificar los biosensores como biocatalíticos o de bioafinidad
2.3.1.1.- Biosensores biocatalíticos
Se basan en la utilización de catalizadores biológicos que participan en una
reacción química (Mason, 1988; Kulys et al., 1989; Ramsay, 1998; Castillo et al., 2004). Una
vez finalizado el proceso, el biocatalizador se regenera y puede ser usado en un nuevo
ciclo catalítico.
Estos biocatalizadores pueden ser enzimas aisladas o en paquetes
multienzimáticos que actúan de modo encadenado en orgánulos celulares, células
completas y tejidos animales o vegetales. Entre las enzimas disponibles
comercialmente, las más utilizadas son las correspondientes a la familia de las óxido-
reductasas (glucosa oxidasa, xantina oxidasa, lactato oxidasa, glutamato oxidasa, etc.). Se
trata de enzimas muy estables que catalizan reacciones de oxido-reducción y que
pueden acoplarse a distintos sistemas de transducción.

33
Las principales ventajas del uso de enzimas en la construcción de biosensores son:
(1) elevada selectividad, (2) rápida respuesta, (3) simplicidad del método de detección,
(4) capacidad de autoregenerarse y (4) extensa disponibilidad comercial (Prodromidis y
Karayannis, 2002; D'Orazio, 2003; Mehrvar y Abdi, 2004; D'Orazio, 2011).
2.3.1.2.- Biosensores de bioafinidad
Los biosensores de bioafinidad se basan en la interacción del analito con el
elemento de reconocimiento sin que medie transformación catalítica alguna. La
interacción conlleva la aparición y/o modificación de un equilibrio analito-receptor.
Para cuantificar dicha interacción, puede recurrirse a métodos directos, de tipo:
sándwich, de desplazamiento y competitivos. Dado que en la interacción no se consumen
sustratos ni se generan productos de reacción, se recurre al marcaje del receptor
implicado en la interacción, o bien, al de un elemento que compita con el analito por la
unión al receptor. Como marcadores se utilizan compuestos fluorescentes,
nanopartículas o enzimas que intervengan en una reacción complementaria
transducible.
En la actualidad se emplean distintos receptores de bioafinidad como: anticuerpos
(Abad y Montoya, 1994; Abad et al., 1997; López y Ortega et al., 1998; López y Ortega, 2002;
Manclús et al, 2004; Yu et al., 2006), lectinas (Xi et al., 2001; Shao et al., 2010; Xue et al.,
2010), ácidos nucleicos (Loiza et al., 2007; Loiza et al., 2008, Martínez-Paredes et al., 2010;
Ortiz et al., 2011), etc.
2.3.2.-Clasificación en función del tipo de transductor
El sistema de transducción, o más conocido como transductor, es el elemento y
generalmente el soporte del material biológico. Transforma las variaciones de las
propiedades físico-químicas, que se producen debido a la interacción específica

34
analito-sistema de reconocimiento, en una señal que puede ser registrada, amplificada
y almacenada. Dicha señal proporciona información cuantitativa o semicuantitativa del
analito determinado. Para el adecuado funcionamiento del biosensor, el elemento de
reconocimiento y el sistema de transducción deben estar en contacto directo. En
función de la naturaleza del sistema de transducción podemos distinguir distintos
sistemas:
2.3.2.1.-Electroquímicos
Los transductores electroquímicos transforman la señal que se produce por la
interacción entre el sistema de reconocimiento y el analito en una señal eléctrica (Wang,
2001; Castillo et al., 2004; Grieshaber et al., 2008). Dicha señal nos proporciona
información analítica cuantitativa del analito que la origina..
2.3.2.2.- Másicos, piezoeléctrico o acústicos
Los sistemas de transducción piezoeléctrica, miden cambios directos de masa
inducidos por la formación del complejo receptor-analito sobre la superficie del
electrodo (cristal). Puesto que la frecuencia de oscilación del cristal viene determinada
por su masa, de acuerdo con la ecuación de Sauerbrey, esta frecuencia variará cuando
se produzca dicha interacción, pudiendo ser relacionada con la concentración de
analito (Skladal, 2003; Pohanka y Skladal, 2005; Kreutz, 2006; Pohanka et al., 2007;).
2.3.2.3.- Térmicos
Los transductores termométricos (generalmente termistores) son capaces de medir
cambios de calor originados por reacciones enzimáticas. Esta variación de temperatura
puede ser relacionada con la concentración de analito (Lammers y Scheper, 1999;
Ramanathan et al., 1999; Demchenko et al., 2007).

35
2.3.2.4.- Ópticos
Los transductores ópticos se basan en la medida de las variaciones de las
propiedades de la luz (absorción, fluorescencia, luminiscencia, dispersión o índice de
refracción) como consecuencia de la interacción física o química entre el analito y el
biosensor (Mansouri y Schultz, 1984; Marvin y Hellinga, 1998; Russell et al., 1999;
Ballerstadt y Schultz, 2000; Pickup et al., 2005). La introducción a principios de los 90 de
una nueva tecnología de biosensores basadas en el fenómeno de resonancia de
plasmón de superficie (SPR) ha permitido el estudio en tiempo real del proceso de
interacción entre biomoléculas.
Figura 2.2.- Fenómeno de la resonancia del plasmón de superficie. La resonancia del plasmón de superficie se produce por la reflexión total del haz de luz incidente al interaccionar con los plasmones por lo que se observa una reducción de la intensidad de la luz (fuente: Pérez, 2007).
2.4.- Biosensores electroquímicos
Los transductores electroquímicos transforman la señal que se produce por la
interacción entre el sistema de reconocimiento y el analito en una señal eléctrica (Wang,
2001; D’Orazio, 2003; Castillo et al., 2004; Grieshaber et al., 2008; D'Orazio, 2011). Las
técnicas electroanalíticas son capaces de proporcionar límites de detección
excepcionalmente bajos y abundante información sobre los sistemas estudiados:

36
estequiometría, velocidad de transferencia de carga, velocidad de transferencia de
masa, constante de velocidad y constante de equilibrio.
En el campo de los biosensores el uso de transductores electroquímicos presentan
numerosas ventajas: (1) se necesitan volúmenes pequeños, incluso del orden de
nanolitros; (2) la señal obtenida es eléctrica, (3) los límites de detección que se obtienen
normalmente son adecuados para la detección de muchos analitos interesantes, incluso
a nivel biológico; (4) son susceptibles a la miniturización; (5) relativa simplicidad en su
funcionamiento y bajo coste de la instrumentación analítica; (6) los dispositivos son
especialmente apropiados para la monitorización en tiempo real.
Atendiendo a como ocurra este proceso de transducción, existen tres tipos de
biosensores electroquímicos: potenciométricos, conductimétricos, y amperométricos
(Thévenot et al., 1999; Thévenot et al., 2001; D’Orazio, 2003; Grieshaber et al., 2008).
2.4.1.- Potenciométricos
Este método se basa en la medida de la diferencia de potencial eléctrico entre dos
electrodos (indicador y referencia) en ausencia de corriente. Las variaciones en la medida
del potencial de celda vienen determinadas por la ecuación de Nernst, siendo
proporcional a la concentración de algún ion generado durante la reacción enzimática
(Chumbimuni-Torres et al., 2006; Chumbimuni-Torres et al., 2009; Zhang et al., 2009a; Wang
et al., 2010). Un biosensor de este tipo podría ser un sensor selectivo a NH4+ modificado
con ureasa. Durante la reacción, dicha enzima descompone la urea (Ecuación 2.1) en
dos iones: amonio y carbonato (D’Orazio, 2003), siendo el primero cuantificado por
dicho electrodo.
−+ + →+ 2342 22 CONHOHUrea Ureasa Ecuación 2.1

37
2.4.2.- Conductimétricos
Este tipo de transductores mide los cambios de conductividad debida a la
interacción con el analito (Gallardo-Soto et al., 2001; Roach et al., 2003; Zhang et al., 2009b),
ya sea en la disolución de medida o en una membrana selectiva dispuesta en la
superficie del electrodo conductimétrico. El ejemplo más característico lo constituye el
biosensor de urea, donde la generación de iones carbonato y amonio (Ecuación 2.1)
produce un aumento en la conductividad del medio (D’Orazio, 2003).
2.4.3.- Amperométricos
Se basan en la medida de la corriente generada por el intercambio electrónico
entre el material de biorreconocimiento y el transductor (Garguilo, 1996; Ferri et al.,
2001; Fiorito y Córdoba de Torresi, 2001; D’Orazio, 2003; Mitala, 2006). La posibilidad de
poder incorporar en el transductor otros componentes, como mediadores redox,
cofactores y otras biomoléculas, confiere a este tipo de biosensores una gran
versatilidad de uso.
2.4.3.1.- Clasificación de los biosensores amperométricos
Durante las reacciones de oxidación-reducción se transfieren electrones entre
reactivos y productos. Desde el punto de vista enzimático, el resultado final es la
transferencia de uno o varios electrones desde la enzima a la superficie del transductor
(Habermüller et al., 2000). Teniendo en cuenta dicho proceso de transferencia electrónica
existen tres tipos o generaciones de biosensores:
2.4.3.1.1.- Biosensores de 1ª generación
Están basados en hacer reaccionar el analito con una enzima específica (Ecuación
2.2) y en la medida de un producto (Ecuación. 2.3) o de un cosustrato (Ecuación 2.4) de

38
la reacción enzimática (Karyakin et al., 2002; Li et al., 2008; Tseng et al., 2009). Fueron los
primeros que se desarrollaron, el electrodo de Clark modificado con Gox, antes
mencionado, pertenece a este grupo (Clark y Lyons, 1962).
El inconveniente de medir algunos cosustratos o productos de reacción es la
necesidad de aplicar sobrepotenciales muy elevados y la aparición de fenómeos de
interferencia. A su vez, a estos potenciales se puede producir la polimerización de los
productos de reacción, que suelen pasivar la superficie del electrodo. Todo ello ha
dado lugar a: (1) el empleo de membranas permeoselectivas que impiden la llegada de
interferentes a la superficie activa del transductor (Garjonyte et al., 1999a; Rothwell et al.,
2010), (2) detección catalítica de los intermedios de reacción (H2O2) (Karyakin et al.,
2002) y (3) uso de mediadores redox artificiales, que reducen el potencial aplicado
(dando lugar a la segunda generación de biosensores amperométricos).
Figura 2.4.- Esquema de las reacciones que ocurren en un biosensor de 1ª generación, basado en la detección amperométrica del H2O2 generado o el O2 consumido enzimáticamente.
glucosa + O2 𝐺𝑜𝑥 gluconolactona + H2O2 Ecuación 2.2
H2O2 ⇔ 2 H+ + O2 + 2e- (+0.7 V vs. SCE) Ecuación 2.3

39
O2 + 4 H+ + 4 e- ⇔ 2 H2O (-0.65 V vs. SCE)
Ecuación 2.4
2.4.3.1.2.- Biosensores de 2ª generación
Los biosensores de segunda generación utilizan un mediador que transfiere los
electrones puestos en juego en el centro activo enzimático hacia la superficie del
transductor (Schuhmann et al., 1990; Palmisano et al., 2000; Chaubey y Malhotra, 2002; Mao
et al., 2003). De esta manera, sustituyen al cosustrato natural empleado por la enzima.
El mediador debe poseer unas características determinadas para favorecer dicho
proceso: (1) debe transferir los electrones rápidamente para evitar la competencia de
los cosustratos naturales de la enzima; (2) debe tener un potencial redox próximo a
cero, para evitar la interacción con otros analitos que pueden actuar como interferentes.
Figura 2.5.- Esquema de las reacciones que ocurren en un biosensor de 2ª generación.
Los mediadores más usados, tanto libres como inmovilizados en un hidrogel, son
el par ferro/ferricianuro, ferroceno y sus derivados, 1,4-benzoquinonas, azul de
metileno, rojo neutro, y algunos complejos de osmio y rutenio (Ryabov et al., 1995;
Castillo, 2004). Los principales problemas asociados a dichos biosensores incluyen la
competencia de los cosustratos naturales y la pérdida de la estequiometría de la

40
reacción, así como, pérdida del mediador (potencialmente tóxico) por difusión y
contaminación de la muestra (Schumann et al., 1990).
2.4.3.1.3.- Biosensores de 3ª generación
En esta ocasión la enzima es conectada directamente con la superficie del
transductor (Ruzgas et al., 1996; Godet et al., 1999; Ryabova et al., 1999; Xiao et al., 2003;
Cano et al., 2008), evitando el uso de cualquier intermedio de reacción (cosustrato o
mediador redox). Este tipo de biosensores presenta una mayor selectividad, ya que
trabaja a potenciales próximos a los intrínsecos de la enzima. Según la teoría de Marcus,
la espontaneidad de que ocurra dicho proceso de transferencia electrónica entre la
enzima y el electrodo va a depender de lo accesible que sea el centro activo de la
enzima (Marcus y Sutin, 1985; Marcus, 1993).
Figura 2.6.- Esquema de las reacciones que ocurren en un biosensor de 3ª generación.
Una de las enzimas más viables para su utilización en este tipo de biosensores es
el HRP (peroxidasa de rábano), ya que su centro activo no se encuentra en el interior de
la enzima (Ruzgas et al., 1996). Sin embargo, la mayoría de enzimas son sistemas
muchos más complejos y poseen su centro activo mucho más protegido. Ejemplos
evidentes de esta aproximación son los biosensores que incluyen en su estructuración

41
sales orgánicas conductoras tales como: tetratiofulvaleno (TTF) y/o
tetracianoquinodimetano (TCNQ) (Cano et al., 2008).
2.5.- Técnicas de inmovilización enzimática
El buen funcionamiento de un biosensor depende de la adecuada inmovilización
del sistema de reconocimiento sobre el transductor. El objetivo de dicha inmovilización
es favorecer un íntimo contacto entre el biorreceptor y el transductor. El componente
biológico de un biosensor tiene que ser incorporado en el dispositivo de manera que no
se altere su actividad si posee propiedades catalíticas, o bien, que el sitio de unión en
el que se produce la interacción con el analito se encuentre accesible al mismo
(Hermanson et al., 1992; Cao et al., 2005; Mateo et al., 2007; Minteer et al., 2011).
La inmovilización puede realizarse mediante métodos físicos, fundamentalmente
por adsorción o por atrapamiento, y métodos químicos, mediante la formación de enlaces
covalentes, capas intermedias (afinidad) o por entrecruzamiento (crosslinking) (Choi,
2004; Choi et al., 2005; Andreescu y Marty, 2006; Arya et. al; 2008).

42
Figura 2.7- Métodos de inmovilización empleados en el desarrollo de biosensores, (adaptada de Sassolas et al., 2012).
Como ventajas del empleo de enzimas inmovilizadas se pueden destacar (1) el
aumento de la estabilidad de la enzima; (2) la posible reutilización del biosensor, por lo
que disminuye los costes del proceso y (3) la posibilidad de diseñar un reactor
enzimático de fácil manejo y control, adaptado a la aplicación de la enzima
inmovilizada (Sassolas et al., 2012). Por el contrario, los principales inconvenientes del
proceso de inmovilización son: (1) alteración de la conformación de la enzima respecto
a su estado nativo; (2) gran heterogeneidad del sistema enzima-soporte, donde pueden
existir distintas fracciones de proteínas inmovilizadas con un diferente número de
uniones al soporte; (3) pérdida de actividad enzimática durante la inmovilización
(Sassolas et al., 2012).
2.5.1.- Métodos de inmovilización física
2.5.1.1.- Adsorción
Representa el método más sencillo para la inmovilización de proteínas y otras
biomoléculas, por lo que suele resultar la alternativa más simple (Sassolas et al., 2012).
No obstante, presenta el inconveniente de su reversibilidad y variabilidad, que pueden
representar un problema cuando las condiciones ambientales fluctúan (pH, fuerza
iónica, disolventes empleados, etc.). Además, la densidad de moléculas inmovilizadas
sobre la superficie suele ser inferior a otros métodos de inmovilización alternativos. Sin
embargo, dada su simplicidad la inmovilización física goza todavía de gran
popularidad para la inmovilización de numerosas moléculas sobre superficies sensoras
(Chaubey et al., 2000; Liu et al., 2007; Xu et al., 2008; Wang et al., 2009).
2.5.1.2.- Atrapamiento

43
Consiste en la retención física del elemento de reconocimiento en las cavidades
interiores de una matriz sólida porosa, constituida generalmente por pasta de carbono
(Rubianes et al., 2003; Antiochia et al., 2007; Odaci et al., 2008), polímeros del tipo
poliuretano (Puig-Lleixa et al., 2001; Fritzen-García et al., 2009), poliacrilatos,
poliacrilamidas, polimetacrilatos, poliestireno, alcohol polivinílico, etc. (Sassolas et al.,
2012). En general, este método de inmovilización puede llevarse a cabo de maneras
distintas, como la polimerización interfacial, la simple evaporación del disolvente, el
atrapamiento en una matriz polimérica y la retención mediante membranas. Se han
utilizado distintas membranas semipermeables como medio de atrapamiento: acetato
de celulosa, policarbonatos, teflón, Nafion (Gogol et al., 2000) y poliuretano (Puig-Lleixa
et al., 2001; Fritzen-García et al., 2009). Estas membranas presentan la ventaja de
preservar la configuración y actividad de las moléculas inmovilizadas, aunque
introducen barreras difusionales que normalmente afectan a los tiempos de respuesta
de los sensores.
En los biosensores electroquímicos se emplean además otras alternativas, como el
atrapamiento mediante electropolimerización y generación de membranas poliméricas
(popipirrol PPY, polianilina PANI, orto-, meta- y para- polifenilendiamina PoPD, PmPD,
PpPD) (Mazeikiene y Malinauskas, 2002; Langer et al., 2004; Mathebe et al., 2004; Guerrieri et
al., 2006; Li et al., 2007). Se puede recurrir a polímeros conductores, como el PPY y la
PANI. Por otro lado, el o-PD, m-PD, p-PD pueden generar películas poliméricas (PoPD,
PmPD, PpPD) conductora o no, en función de las condiciones de trabajo (Li et al., 2002).
En el último caso, las propiedades aislantes dan lugar a un crecimiento limitado y
generan películas poliméricas extremadamente delgadas (~10-30 nm) con mejores
propiedades difusivas (Li et al., 2002; Killoran y O’Neill, 2008; O’Neill et al., 2008;
Rothwell et al., 2008). Durante el proceso de inmovilización enzimática se suele añadir

44
otra enzima sin actividad (ej: BSA) que evita que se produzca un alto grado de
compactación y en definitiva, pérdida de la actividad catalítica.
2.5.2.- Métodos de inmovilización química
2.5.2.1.- Enlace covalente
En las reacciones químicas utilizadas en la inmovilización covalente generalmente
intervienen los grupos nucleófilos de las moléculas como: grupos amina (-NH2) (Wu et
al., 1994; Ferreira et al., 2003), grupos carboxílicos (-COOH) (Delvaux M y Demoustier-
Champagne S, 2003), alcoholes (-OH) (Sassolas et al., 2012), tioles (-SH) y grupos imidazol
(Sassolas et al., 2012). Las vías principales de reacción son: (1) activación de ácidos
carboxílicos en ésteres mediante carbodiimida y N-hidroxisuccinimida, (2) formación
de una base de Schiff entre una amina nucleófila y un aldehído, (3) sustituciones
nucleofilicas entre aminas primarias o tioles y grupos electrófilos con un elemento
saliente, como un éster activado o un halogenuro de ácido (Sassolas et al., 2012).
Figura 2.8- Ejemplos de enlaces covalentes sobre una superficie previamente aminada por acoplamiento mediante: (A) carboiimida (B) glutaraldehido (adaptada de Sassolas et al., 2012).

45
2.5.2.2.- Capa intermedia
Otra vía de inmovilización consiste en generar un sedimento de moléculas que
formen un enlace selectivo de bioafinidad entre dicho sedimento (lectina, avidina,
quelatos metálico) (Andreescu et al., 2001) y las moléculas de reconocimiento (enzimas,
anticuerpos, DNA). Este método permite controlar la orientación de la biomolécula con
el fin de evitar la desactivación enzimática y/o bloqueo del centro activo. Las capas
intermedias más empleadas son: proteína A, concanavalina A (Bucur et al., 2004),
proteína G y avidina (Sassolas et al., 2012).
2.5.2.3.- Entrecruzamiento
El método de entrecruzamiento o cross-linking se basa en crear enlaces
intermoleculares irreversibles entre las enzimas (o material biológico de
reconocimiento) usando polímeros con grupos bi y multifuncionales (dialdehídos,
diiminoésteres, diisocianatos, sales de bisdiazonio) (Gogol et al., 2000; Berezhetskyy et al.,
2008; Luo et al., 2008; Kong et al., 2009; Sassolas et al., 2012). Este método es atractivo
debido a su simplicidad y a la fortaleza del enlace químico producido. El principal
inconveniente es la pérdida de actividad debido a distorsiones en la conformación
enzimática y/o a las alteraciones químicas del sitio activo durante la reticulación.
Proteínas sin actividad enzimática como el BSA, rico en residuos de lisina, suele ser
correticulada con el receptor biológico para disminuir dichos efectos disfuncionales
(Gogol et al., 2000; Pei et al. 2004; Berezhetskyy et al., 2008; Yonemori et al., 2009).

46
3.- El Azul de Prusia
El Azul de Prusia (Prussian Blue, PB), Fe4[Fe(CN)6]3, pertenece a la familia de los
hexacianometalatos metálicos, Xn[Y(CN)6]m, donde X e Y son sustituidos por átomos
de hierro (Karyakin, 2001; Abbaspour y Kamyabi, 2005; Giménez-Romero et al., 2007). Es el
compuesto de coordinación más antiguo conocido y utilizado como tinte desde el siglo
XVIII (Kraft, 2008). Sus propiedades electroquímicas se conocen desde la década de los
setenta, cuando Neff informó de la deposición de una fina capa de PB sobre una lámina
de platino (Neff, 1978). A partir de este momento, aparecieron un gran número de
publicaciones estudiando sus propiedades electrocrómicas (Ellis et al., 1981; Rajan et al.,
1982; Mortimer y Rosseinsky, 1983; Mortimer y Rosseinsky, 1984; Koncki et al., 2001; Koncki,
2002) y electroquímicas (Itaya et al., 1986; Feldman et al., 1987; Dostal et al., 1995). Desde
un punto de vista práctico, el PB ha sido empleado con éxito en el campo de los
biosensores (Garjonyte y Malinauskas, 2000a; Guan et al., 2004; Haghighi et al., 2004) e
inmunosensores (Jiang et al., 2010; Liu et al., 2010; Wang et al., 2011). A su vez, se han
descrito multitud de métodos para optimizar su deposición (química, fotoquímica o
electroquímica) y estabilidad (Ricci y Palleschi, 2005).
Hoy en día, su comportamiento electroquímico se entiende bastante bien. Los
electrodos modificados con PB muestran, mediante CV, dos picos característicos (Ellis
et al., 1981; Rajan et al., 1982; Itaya et al., 1984a; Itaya et al., 1984 b; Ohzuku et al., 1985;
Itaya et al., 1986). El primero corresponde a la interconversión entre el Blanco de Prusia
(Prussian White, PW) y el PB (Ecuación 3.1), mientras que el segundo, corresponde a la
transición entre PB y el Verde de Prusia (Prussian Green, PG), (Ecuación 3.2). Las

47
reacciones de transferencia de electrones en presencia de KCl como electrolito soporte
se pueden formular de la siguiente manera (ecuaciones 3.1 y 3.2):
(PB) FeIII4[FeII(CN)6]3 + 4e− +4K+→ (PW) K4FeII4[FeII(CN)6]3 Ecuación 3.1
(PB) FeIII4[FeII(CN)6]3 + 3Cl¯ → (PG) FeIII4[FeIII(CN)6]3Cl3 +3e− Ecuación 3.2
Donde los potenciales para dichas transiciones se sitúan a +0.1 y +0.9 V frente
SCE respectivamente (Ellis et al., 1981; Itaya et al., 1982a; Itaya et al., 1982b; Itaya et al.,
1982c; Rajan et al., 1982; Ohzuku et al., 1985; Karyakin, 2001). Sus propiedades
electroquímicas, tales como: potencial formal, sensibilidad, estabilidad y constantes de
velocidad de transferencia electrónica de las conversiones PB/PW y PB/PG dependen
del: método de deposición, pH, naturaleza y concentración de electrolito soporte, etc.
(Itaya et al., 1982a, Itaya et al., 1986; García-Jareño et al., 1998).
La estructura zeolítica del PB (Figura 3.1), cuya celda unitaria posee una estructura
tridimensional cúbica centrada en las caras con una celda unitaria de 10.2 Å y un
diámetro de canal aproximado de 1.6 Å (Ludi y Gudel, 1973; Herren et al., 1980), define
en gran medida las propiedades electrocatalíticas y electroquímicas del PB,
permitiendo así, la libre difusión a través de su estructura cristalina de moléculas de
bajo peso molecular (como el O2 y H2O2) y de ciertos iones (Itaya et al., 1986). Las
reacciones de oxido/reducción son acompañadas por la difusión de cationes (K+) y
aniones (Cl¯) que permiten compensar la carga de las distintos estados redox (Ecuación
3.1 y Ecuación 3.2). Por ello dichas interconversiones, PW/PB y PB/PG, son muy
influenciadas por el electrolito soporte, que debe difundir a través de su estructura
cristalina (Itaya et al., 1982a, Itaya et al., 1986; García-Jareño et al., 1998; Ricci y Palleschi,
2005).

48
Debido a este mecanismo (Ecuación 3.1), sólo cationes con radios hidratados
pequeños, tales como K+ (1.25 Å), NH4+ (1.25 Å), Rb+ (1.28 Å) y Cs+ (1.19 Å), pueden
difundir libremente por la estructura del PB y compensar las cargas durante la
interconversión PW/PB. Por otro lado, Na+ (1.35 Å), Ca2+ (1.56 Å), Mg2+ (1.61 Å),
debido a sus radios hidratados mayores no pueden difundir tan libremente en la
estructura tridimensional del PB, dificultando y/o inhibiendo la interconversión
PW/PB y viceversa.
Figura 3.1- Estructura zeolítica (cúbica centrada en las caras) propuesta para el PB (adapta a partir de: http://mslab.polymer.pusan.ac.kr/english/research.html ).
Durante muchos años, la estructura del PB y la relación con su comportamiento
electroquímico y sus propiedades electrocatalíticas ha sido fuente de controversia. Los
primeros intentos por resolver dicha estructura, o más bien su estequiometría se
remontan al siglo XVII y XIX, cuando químicos tan prestigiosos como: Priestley,
Scheele, Bertholet, Gay-Lussac y Berzelius intentaron elucidar la composición química
del PB (Kraft et al., 2008). En 1782 Scheele descubrió que se formaba cianuro de
hidrógeno al calentar el PB en una disolución diluida de ácido sulfúrico, mientras que
en 1811 la determinación estequiométrica de Gay-Lussac del cianuro de hidrógeno
concluyó con la hipótesis de que el PB contenía cianuros en su estructura (Kraft et al.,
49
2008). Debido a la falta de técnicas analíticas adecuadas, los detalles estructurales e
incluso su composición estequiométrica solo pudo ser resuelta parcialmente. En la
década de los 30 del siglo pasado, Keggin y Miles (Keggin y Miles, 1936) estudiaron su
estructura mediante rayos X. Dichos autores distinguieron dos formas diferentes de PB
que llamaron desafortunadamente: soluble e insoluble. Estos términos, usados en la
industria textil de la época no se refieren a la solubilidad en agua, sino más bien
indican la facilidad con la que los iones potasio se introducen en la estructura del PB.
La inadecuada aplicación de estos términos ha sido debatida por muchos autores,
siendo demostrado finalmente que ambas conformaciones son muy insoluble (Kps =
10-40) (Ellis et al., 1981; Mortimer y Rosseinsky, 1984).
De acuerdo con Keggin y Miles, la forma "soluble" del PB KFeIIIFeII (CN)6 tiene
una estructura cúbica en las que el hierro (II) y el hierro (III) se encuentran en una cara
cúbica centrada en las caras, donde el hierro (II) está rodeado por átomos de carbono y
el hierro (III) está rodeado por átomos de nitrógeno coordinados octaédricamente. Por
otro lado, la forma "insoluble" FeIII4[FeII(CN)6]3 presenta un exceso de iones férricos,
que remplazan a los iones potasio de la forma soluble en las posiciones intersticiales
(Keggin y Miles, 1936; Mortimer y Rosseinsky, 1984). Posteriores trabajos (Ludi y Gudel,
1973; Buser et al., 1977; Herren et al., 1980) mostraron algunas discrepancias con la forma
insoluble del PB propuesta por Keggin y Miles. Dichos autores encontraron una
estructura más desordenada, donde una cuarta parte de los sitios ocupados por el
anión ferrocianuro estaban desocupados, a su vez, encontraron la presencia de 14 a 16
moléculas de agua en cada celda unitaria. Una porción de estas moléculas de agua
estaban ocupando los sitios vacíos de nitrógeno del grupo ferrocianuro, mientras que el
resto ocupaba posiciones intersticiales en forma de agua no coordinada. Por otra parte,
dichos autores no encontraron hierro (III) en sitios intersticiales. Estos resultados

50
también han sido confirmados por espectroscopia Mossbauer e infrarrojo (Duncan y
Wrigley, 1963; Robin y Day, 1967).
Hay que destacar que la incertidumbre encontrada y las distintas estructuras
propuestas para el PB pueden atribuirse al hecho de que el PB es una designación
química genérica de un material mucho más complejo con estequiometría variable
(Itaya et al., 1986). Siendo la estructura definitiva función de los materiales de partida y
del procedimiento de cristalización, que podría generar estructuras con: iones
coprecipitados, distinto contenido en agua coordinada y no coordinada, distinto grado
de defectos y vacantes en el retículo cristalino, presencia de ferrocianuro hidrolizado,
etc.
3.1.- Deposición de Azul de Prusia
La mayoría de los depósitos de PB se obtienen mediante el empleo de técnicas
electroquímicas, ya que permiten un control exacto de la extensión de la deposición
(cantidad y espesor del depósito). Entre estas, destaca la técnica galvanostática en la que
el electrodo a modificar se introduce en una disolución que contiene iones ferricianuro
y cloruro férrico y se aplica un potencial adecuado y constante durante un tiempo
determinado (Karyakin et al., 1996; Karyakin et al., 1998; Garjonyte y Malinauskas, 1999b;
Karyakin et al., 2000; Garjonyte y Malinauskas, 2000b). La CV también ha sido usada con
éxito, donde la cantidad de PB depositado depende de la velocidad de barrido, los
límites del ciclado y el número de ciclos empleados (Garjonyte y Malinauskas, 1999b).
La electrodeposición es seguida generalmente por una etapa de activación
(transición de la forma insoluble a la soluble) del depósito mediante CV, donde los
electrodos modificados con PB son ciclados en la disolución electrolítica soporte hasta
que el CV permanece constante (30-50 ciclos). Posteriormente, el depósito es

51
estabilizado (pérdida del agua de solvatación) mediante una etapa de calentamiento
(100 ºC durante 1-1.5 h).
La deposición química ha demostrado ser una alternativa útil y cada vez es más
empleada, sobre todo para modificar tintas de impresión para electrodos serigrafiados
(Moscone et al., 2001; Ricci et al., 2003a; Ricci et al., 2003b). Dicha técnica consiste en hacer
reaccionar Fe3+ con FeII(CN)64− o Fe2+ con FeIII(CN)63− dando lugar a una suspensión
coloidal de color azul, que posteriormente se mezcla con los materiales empleados en
la construcción de electrodos serigrafiados.
3.2.- Estabilidad de Azul de Prusia frente al pH
La desventaja principal de PB es su solubilidad a pH neutro y básico. Dicha
solubilidad está relacionada con la formación de hidroxo-complejos de hierro y la
precipitación de Fe(OH)3 a partir de pH 6.4 (Feldman y Murray, 1987; Stilwell et al.,
1992), que en definitiva, producen la ruptura de los enlaces CN-Fe-CN (Karyakin y
Karyakina, 1999). Diferentes estudios de estabilidad indican que el depósito de PB
puede ser estabilizado en medio neutro y básico modificando el procedimiento de
deposición (Moscone et al., 2001; Ricci et al., 2003a), aunque existen numerosas
variaciones más o menos laboriosas, las etapas claves se pueden resumir en: (1)
electrodeposición en medio ácido 0.1 M de KCl y HCl, (2) activación por ciclado a
potencial controlado, (3) estabilización térmica.
Otros métodos propuestos consisten en modificar ligeramente su estructura
química, así como su estructura tridimensional para evitar la libre difusión de grupos
OHˉ a través del cristal (Moscone et al., 2001; Haghighi et al., 2004). Sin embargo, un
enfoque más práctico utiliza el recubrimiento y/o codeposición de PB con diversos
polímeros como: Nafion, PPY, PANI y PoPD, mejorando así, su estabilidad operativa y

52
selectividad frente diversas sustancias electroactivas (Karyakin y Chaplin, 1994; Chi y
Dong, 1995; Karyakin et al., 1995; García-Jareño et al., 1996; Karyakin et al., 1996; Garjonyte
y Malinauskas, 2000a; Garjonyte y Malinauskas, 2000b; Lukachova et al., 2002). Lukachova y
colaboradores han descrito un electrodo modificado con PB recubierto con PoPD con
una sensibilidad moderada H2O2 (0.3 A M-1 cm-2), una elevada selectividad (~600)
frente el AA y una excelente estabilidad operativa (~20 h) (Lukachova et al., 2003).
3.3.- Electrodeposición de PB en presencia de surfactantes catiónicos
Recientemente ha sido descrita la electrodeposición de PB y otros
hexacianoferratos en presencia de bromuro de cetiltrimetilamonio (CTAB) (Vittal et al.,
1999; Vittal et al., 2000; Vittal et al., 2001; Senthil-Kumar y Chandrasekara-Pillai, 2006a;
Vittal et al., 2006; Vittal et al., 2008). Según está recogido en la bibliografía, las reacciones
en condiciones normales de formación del PB son:
Fe3+ + e− Fe2+ Ecuación 3.3
Fe3+ + Fe2+ + [FeIII(CN)6 ]3− Fe1/33+ Fe3+ [FeII(CN)6 ]4− Ecuación 3.4
Donde Fe1/33+ Fe3+[FeII(CN)6 ]4− P
es la forma insoluble del PB (Senthil-Kumar y
Chandrasekara- Pillai, 2006b). De acuerdo con estos autores, la presencia de CTAB en la
disolución de trabajo durante la formación del PB puede facilitar la electrodeposición
sobre la superficie del electrodo al interactuar positivamente con los componentes de la
disolución y la superficie del transductor. Según el mecanismo propuesto, cuando el
catión CTA+ se encuentra en disolución a su CMC (Critical Miscellar Concentration), la
superficie del electrodo (interfase agua/electrodo) estaría totalmente recubierta por
iones CTA+ perfectamente orientados, favoreciendo así, la interacción electrostática
entre los grupos [FeIII(CN)6]3- y CTA+. De esta forma, no solo se incrementa el número
de grupos [FeIII(CN)6]3- en la superficie del electrodo (recordemos que las funciones -

53
COOH/COO¯ comunes en electrodos de carbono pueden dificultar la adsorción del
anión [FeIII(CN)6]3-), sino que también favorece una orientación adecuada del
ferricianuro que posteriormente reacciona con los iones Fe2+ y Fe3+ (Ecuación 3.4)
(Senthil-Kumar y Chandrasekara-Pillai, 2006b).
Por otro parte, si se emplea la CV como método de electrodeposición, a partir de
0.9 V vs. SCE el PB adquiere carga negativa, favorenciendo la formación de una nueva
capa de CTA+ sobre el depósito de PB recién formado, y favoreciendo la
electrodeposición de una nueva capa de PB. Mediante dicho proceso, se van alternando
capas de PB y CTA+ dando lugar a una estructura híbrida PB/CTAB (muy irregular y
porosa) que puede continuar creciendo virtualmente hasta que se agoten los reactivos
en la disolución de trabajo o se ralentice su aporte hacia superficie del electrodo
(Senthil-Kumar y Chandrasekara-Pillai, 2006b).
Con esta metodología se ha conseguido además del incremento significativo del
depósito y de la sensibilidad frente a H2O2, una mejora en la rapidez y eficacia del
transporte iónico (Vittal et al., 2006; Vittal et al., 2008). Por otro lado, y de suma
importancia para la aplicación del PB en biosensores que operan en condiciones
fisiológicas, se ha obtenido una muy buena estabilidad de los depósitos de PB a pH
neutro y ligeramente básico. Dicha estabilidad se puede atribuir a varios factores: (1) el
CTAB, así como otros surfactantes catiónicos, posee en su estructura amonios
cuaternarios con propiedades ácidas, creando un microentorno ligeramente ácido que
puede anular el efecto de los iones OH¯; (2) la estabilización electrostática entre capas
catiónicas (CTA+) y aniónicas (PB) ofrece una estabilización adicional y evita su
disolución (Senthil-Kumar y Chandrasekara-Pillai, 2006a).

54
3.4.- Biosensores basados en Azul de Prusia
Pese a que en 1984 Itaya y colaboradores (Itaya et al., 1984a; Itaya et al., 1984b)
demostraron que la forma reducida de la PB (PW) mostraba actividad catalítica frente a
la reducción selectiva de O2 y H2O2 a un potencial próximo a -0.250 y 0 V frente a SCE
respectivamente, no fue hasta 1994 cuando Karyakin y colaboradores (Karyakin et al,
1994) propusieron el primer biosensor de glucosa que aprovechaba dichas propiedades
para detectar el H2O2 generado enzimáticamente por la glucosa oxidasa (Figura 3.2). En
1995, dicho autor optimizó su diseño alcanzando un límite de detección de 10-6 M y un
rango lineal hasta una concentración de 5 mM (Karyakin et al., 1995). En ese mismo año
Chi y Dong, consiguieron depositar la Gox durante la electrodeposición del PB (Chi y
Dong, 1995), añadiendo posteriormente un recubrimiento con Nafion. Este biosensor
presentó una rápida respuesta, un límite de detección de 2·10-6 M y un rango de
concentración lineal de 0.01-3 mM.
Figura 3.2.- Esquema de reacciones acopladas en un biosensor de 1ª generación de glucosa, basado en la detección amperométrica del H2O2 con Azul de Prusia.

55
El interés de la comunidad científica por el PB ha ido creciendo, en especial
debido a sus propiedades electrocatalíticas y electrocrómicas. Este avance se muestra
en la figura 3.3, donde se observa un continuado aumento en el número de
publicaciones científicas, mostrando un incremento notable a partir de 2005, donde se
triplica el número de publicaciones anuales.
El ámbito más generalizado de aplicación ha sido el desarrollo de biosensores
sensibles a glucosa (Karyakin et al., 1994; Chi y Dong, 1995; Karyakin et al., 1995; Garjonyte
y Malinauskas, 2000a; Garjonyte y Malinauskas, 2000b; Li et al., 2008). Sin embargo,
muchas otras enzimas han sido empleadas: lactato oxidasa (Garjonyte et al., 2001; Ricci
et al., 2003c), colesterol oxidasa (Li et al, 2003; Vidal et al, 2004), aminoácido oxidasa (Chi
y Dong, 1995), etanol oxidasa (Karyakin et al, 1996), glutamato oxidasa (Karyakin y
Karyakina, 2000), lisina oxidasa (Ricci et al. 2003b) y oxalato oxidasa (Fiorito y Córdoba de
Torresi, 2004).

56
Figura 3.3.- Histograma de publicaciones científicas referidas a las palabras claves: Prusian Blue y Prussian Blue-biosensors (fuente: http://www.sciencedirect.com).
Pese al gran número de aplicaciones del PB en el ámbito de los biosensores (Ricci y
Palleschi, 2005), el desarrollo de microbiosensores modificados con PB y su aplicación
en el ámbito neuroquímicoy neurofisilógico no ha sido explorado hasta la presente
tesis. Fruto del presente trabajo se han publicado 7 artículos en revistas científicas
indexadas, así como numerosas presentaciones en congresos nacionales e
internacionales.

57
OBJETIVOS
58
4.-Objetivos
El objetivo de esta tesis es el diseño y caracterización (in vitro e in vivo) de
biosensores que puedan medir glucosa y lactato en el sistema nervioso central (SNC).
Debido a las restricciones espaciales inherentes a dicho estudio, como punto de partida
se han empleado electrodos de fibra de carbono de ~ 10 µm de diámetro. Estas
pequeñas dimensiones aseguran una perfecta resolución espacial y evita que se
produzcan alteraciones considerables del medio (espacio extracelular cerebral), tales
como: pérdida de integridad de la barrera hematoencefálica, rotura de vasos
sanguíneos, cambios en la microcirculación local, edemas etc.
El desarrollo de la presente memoria ha estado orientado hacia la elaboración de
biosensores electroquímicos que a posteriori puedan ser usados en resolver uno de los
debates más importantes que hoy en día se plantean en el área de la neurociencia: el
estudio del metabolismo energético cerebral. El enfoque electroquímico ha sido elegido por
ser una técnica versátil, económica, de fácil uso y una herramienta complementaria a
otras técnicas empleadas en el laboratorio de Neuroquímica y Neuroimagen de la
Universidad de La Laguna (RMN, microdiálisis, técnicas espectroscópicas, etc.).

59
Por otro lado, se ha modificado el enfoque convencional: empleo de transductores
de Pt, Pt/Ir (Φ ~ 100 µm) y detección amperométrica a + 0.70 V, por un nuevo sistema
de transducción basado en fibras de carbono modificadas con PB, capaz de seguir la
reacción enzimática a un potencial próximo a 0 V. Evitando así, el posible efecto que el
potencial aplicado pueda ejercer sobre la exitabilidad neuronal.
Dicha aproximación resulta novedosa, tanto por las propiedades electrocatalíticas
que ofrece el PB, como por el hecho de que hasta el momento no se han encontrado
evidencias bibliográficas del uso del PB en el diseño de microbiosensores para medir
glucosa y lactato en el SNC.
A continuación, se resumen los objetivos principales que se han marcado como
fundamentales en el desarrollo del presente trabajo:
1) Construción y modificación de microelectrodos de fibra de carbono con PB.
2) Optimización de la electrodeposición, estabilidad y sensibilidad del depósito
PB mediante el uso de surfactantes catiónicos.
3) Construcción de microbiosensores de glucosa y lactato con sensibilidad,
selectividad y resolución temporal y espacial adecuados para trabajar en el
SNC.
4) Empleo de una amplia gama de polímeros con el fin de optimizar: i) la
operatividad a bajas concentraciones de oxígeno ii) la sensibilidad analítica iii)
la biocompatibilidad y iv) la selectividad de los microbiosensores frente a los
interferentes biológicos más comunes.

60
5) Optimización de los protocolos de modificación enzimática con Gox y Lox para
adecuar la sensibilidad y selectividad de los microbiosensores desarrollados a
las condiciones del entorno de trabajo.
6) Diseño y elaboración de experimentos, in vitro e in vivo de validación que
demuestren la utilidad de los microbiosensores desarrollados en la presente
tesis en el ámbito neuroquímico y neurofisiológico.
MATERIALES Y MÉTODOS

61
5.-Materiales y métodos
5.1.-Reactivos
Todos los reactivos han sido suministrados por la compañía Sigma-Aldrich y
usados sin previa modificación y/o purificación. Cada reactivo ha sido almacenado en
las condiciones recomendadas por la casa comercial. Todas las disoluciones fueron
preparadas con agua ultrapura (Milli-Q/Millipore) y conservadas en nevera mientras no
eran usadas. Las disoluciones de reactivos poco estables (H2O2, o-PD, interferentes,
glutaraldehido, etc.) se prepararon previo uso. Las disoluciones enzimáticas y el
calibrado de los microbiosensores han sido realizadas en tampón fosfato salino 0.01M
(sigma [P4417]: 0.01 M tampón fosfato, 0.135 M NaCl, 0.027 M KCl, pH=7.4).
Las fibras de carbono y los capilares de vidrio usados en la construcción de los
microbiosensores fueron suministrados por la empresa World Precission Instrument y
Union Carbide, mientras que el alambre de cobre de 0.25 mm fue suministrado por RS.
La resina epoxi empleada para sellar los extremos de los microbiosensores ha sido
resina comercial de uso cotidiano. Los electrodos serigrafiados de pasta de carbono
(SPCE) modelo DRP-110 fueron suministrado por la empresa española Dropsens.
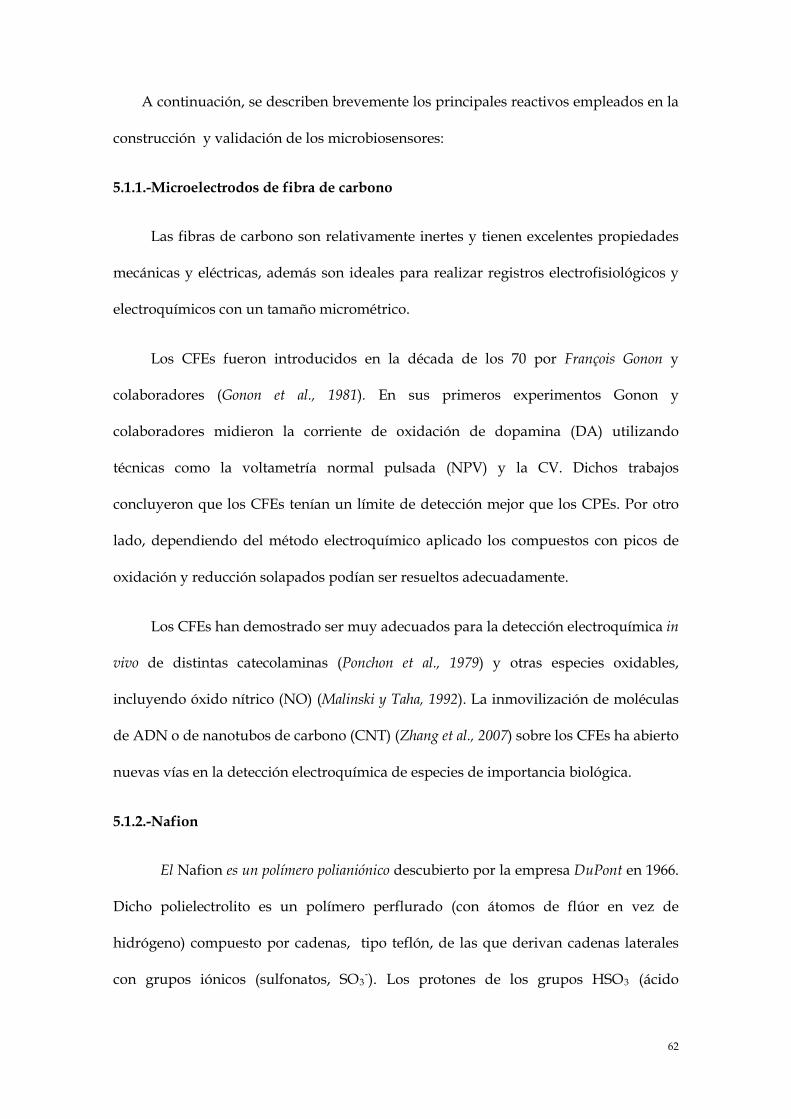
62
A continuación, se describen brevemente los principales reactivos empleados en la
construcción y validación de los microbiosensores:
5.1.1.-Microelectrodos de fibra de carbono
Las fibras de carbono son relativamente inertes y tienen excelentes propiedades
mecánicas y eléctricas, además son ideales para realizar registros electrofisiológicos y
electroquímicos con un tamaño micrométrico.
Los CFEs fueron introducidos en la década de los 70 por François Gonon y
colaboradores (Gonon et al., 1981). En sus primeros experimentos Gonon y
colaboradores midieron la corriente de oxidación de dopamina (DA) utilizando
técnicas como la voltametría normal pulsada (NPV) y la CV. Dichos trabajos
concluyeron que los CFEs tenían un límite de detección mejor que los CPEs. Por otro
lado, dependiendo del método electroquímico aplicado los compuestos con picos de
oxidación y reducción solapados podían ser resueltos adecuadamente.
Los CFEs han demostrado ser muy adecuados para la detección electroquímica in
vivo de distintas catecolaminas (Ponchon et al., 1979) y otras especies oxidables,
incluyendo óxido nítrico (NO) (Malinski y Taha, 1992). La inmovilización de moléculas
de ADN o de nanotubos de carbono (CNT) (Zhang et al., 2007) sobre los CFEs ha abierto
nuevas vías en la detección electroquímica de especies de importancia biológica.
5.1.2.-Nafion
El Nafion es un polímero polianiónico descubierto por la empresa DuPont en 1966.
Dicho polielectrolito es un polímero perflurado (con átomos de flúor en vez de
hidrógeno) compuesto por cadenas, tipo teflón, de las que derivan cadenas laterales
con grupos iónicos (sulfonatos, SO3-). Los protones de los grupos HSO3 (ácido
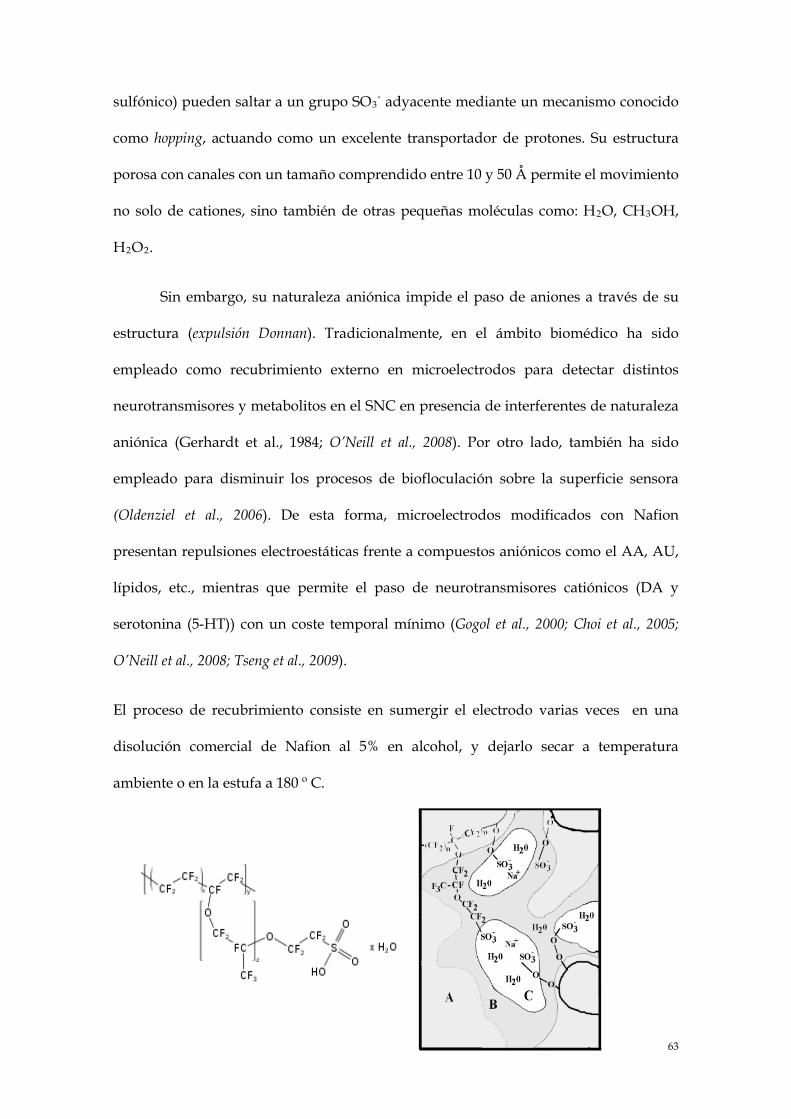
63
sulfónico) pueden saltar a un grupo SO3- adyacente mediante un mecanismo conocido
como hopping, actuando como un excelente transportador de protones. Su estructura
porosa con canales con un tamaño comprendido entre 10 y 50 Å permite el movimiento
no solo de cationes, sino también de otras pequeñas moléculas como: H2O, CH3OH,
H2O2.
Sin embargo, su naturaleza aniónica impide el paso de aniones a través de su
estructura (expulsión Donnan). Tradicionalmente, en el ámbito biomédico ha sido
empleado como recubrimiento externo en microelectrodos para detectar distintos
neurotransmisores y metabolitos en el SNC en presencia de interferentes de naturaleza
aniónica (Gerhardt et al., 1984; O’Neill et al., 2008). Por otro lado, también ha sido
empleado para disminuir los procesos de biofloculación sobre la superficie sensora
(Oldenziel et al., 2006). De esta forma, microelectrodos modificados con Nafion
presentan repulsiones electroestáticas frente a compuestos aniónicos como el AA, AU,
lípidos, etc., mientras que permite el paso de neurotransmisores catiónicos (DA y
serotonina (5-HT)) con un coste temporal mínimo (Gogol et al., 2000; Choi et al., 2005;
O’Neill et al., 2008; Tseng et al., 2009).
El proceso de recubrimiento consiste en sumergir el electrodo varias veces en una
disolución comercial de Nafion al 5% en alcohol, y dejarlo secar a temperatura
ambiente o en la estufa a 180 º C.

64
Figura 5.1.-Fórmula (fuente: Wikipedia) y estructura del Nafion donde se observan los canales iónicos por donde existe libre flujo de moléculas de agua y cationes (fuente: http://www.intellectualism.org/questions/QOTD/dec03/20031209.php).
5.1.3.- Polietilenimina
La Polietilenimina (PEI) es un polímero catiónico obtenido a partir de monómeros
de etilenimina. Según su estructura molecular, dicho polímero puede ser lineal o
ramificado. El PEI contiene una gran cantidad de grupos amino que pueden ser
primarios, secundarios o terciarios. Debido a su alto contenido en dichos grupos
funcionales, tanto la polietilenimina lineal como la ramificada han despertado un gran
interés en la industria aeronáutica para capturar y almacenar CO2.
Al igual que otros policationes (derivados de polilisina, PLL) es empleado en
terapia génica en procesos de transfección celular (Garnett, 1999), protegiendo al ADN de
la degradación en el compartimento endosomal, durante la maduración del endosoma
a lisosoma, y facilitando el tránsito intracelular del ADN hacia el núcleo celular.
Por otro lado, debido a su carácter policatiónico puede ser empleado para
acumular y estabilizar enzimas con punto isoeléctrico inferior al pH fisiológico sobre la
superficie del transductor. Incrementando la actividad y la carga enzimática en la
superficie del biosensor (Breccia et al 2002; Qian et al., 2004), y en consecuencia
aumentando la sensibilidad y disminuyendo el límite de detección del mismo (O’Neill
et al 2008).
5.1.4.- Poli-o-fenilendiamina
En los últimos años ha incrementado el interés de los polímeros no conductores,
en especial su aplicación en el desarrollo de sensores y biosensores electroquímicos. Su

65
limitado crecimiento debido a su naturaleza no conductora permite generar capas muy
delgadas (10-30 nm), con buenas propiedades difusivas, tiempos de respuesta rápidos
y con excelentes propiedades antiinterferentes (Li et al., 2002; Killoran y O’Neill, 2008;
O’Neill et al., 2008; Rothwell et al., 2008). Por otro lado, presentan buena
biocompatibilidad y permiten inmovilizar enzimas en su estructura (Lowry et al., 1998).
Otra ventaja importante, es que el proceso de autosellado permite que la
electropolimerización sea mucho más reproducible y con menores defectos
estructurales, obteniéndose un recubrimiento más homogéneo sin huecos o surcos
estructurales (pin-holes).
Los monómeros más comunes empleados en la síntesis de películas no
conductoras son derivados del benceno, tales como: fenol, o- y p-aminophenol, o-, m- y
p-diaminobenceno (fenilendiamina) y o- y p-dihidroxibenceno (Mazeikiene y Malinauskas,
2002; Langer et al., 2004; Mathebe et al., 2004; Guerrieri et al., 2006; Li et al., 2007). En los
últimos años el interés por la síntesis de membranas poliméricas basadas en la o-
fenilendiamina (o-PD) se ha incrementado, sobre todo en el ámbito fisiológico. En
condiciones de neutralidad el monómero se polimeriza en su forma no conductora,
formando una membrana químicamente inerte, extremadamente fina (10-30 nm) y
reproducible. Dicha membrana posee excelentes propiedades difusivas frente a
pequeñas moléculas como el H2O2 y el O2. Sin embargo, debido a su denso
empaquetamiento presenta excelentes propiedades antiinterferentes (impidiendo la
difusión de moléculas de mayor tamaño que el monómero).
Por otro lado, presenta pocos problemas frente a fenómenos de biofloculación
proteica e interacción con el sistema inmune, pudiendo ser mejorada al incorporar
heparina o BSA a la disolución de electropolimerización. La adición de BSA disminuye
el grado de compactación de la capa de PoPD y disminuye la pérdida de sensibilidad

66
debido a las nuevas restricciones difusivas de los analitos, cofactores y productos
enzimáticos a través dicha membrana. A su vez, disminuye el número de
desactivaciones de los centros activos enzimáticos debido a fenómenos estéricos.
Todavía no ha sido resuelta la estructura de la PoPD debido a que su limitado
grosor dificulta su estudio mediante técnicas instrumentales convencionales como el
microscopio de barrido electrónico. Sin embargo, existen diversos autores que sugieren
la existencia de dos estructuras plausibles: estructura tipo escalera (Chiba et al., 1987) y
estructura abierta (Yano, 1995).
Figura 5.2.- Posibles estructuras propuestas para el PoPD.
Las propiedades permeoselectivas de los derivados de la fenilendiamina (o-, m- y
p-) así como, las condiciones óptimas para su síntesis (CV, CPA, potencial de
deposición, fuerza iónica del medio, naturaleza iónica del medio, etc.) han sido
revisadas y discutidas ampliamente en publicaciones recientes (Killoran et al; 2007;
Rothwell et al 2009; Rothwell et al., 2010; Rothwell y O'Neill, 2011) justificando sin duda, el
empleo de la PoPD como membrana permeoselectiva en el desarrollo de la presente
tesis.

67
5.1.5.- Glucosa oxidasa (Gox)
La Glucosa oxidasa (Gox) es una flavoproteína que cataliza la oxidación de la β-D-
glucosa en ácido glucónico con la utilización del oxígeno como aceptor último de
electrones (Wang, 2008; Wang 2011). Durante la reacción se produce H2O2 como
subproducto. La Gox es una de las enzimas mejor estudiadas, puesto que presenta
numerosas ventajas con respecto a otras enzimas: alta constante de velocidad, excelente
selectividad, buena estabilidad térmica y con el pH, bajo coste de obtención, etc. La
enzima está constituida por dos subunidades idénticas y una única molécula de flavín
adenín dinucleótido (FAD) como grupo prostético. La Gox posee un peso molecular de
186,000 g/mol y unas dimensiones de 70 Ǻ x 55 Ǻ x 80 Ǻ.
El grupo prostético en su estado FAD se encuentra en la forma oxidada y para
pasar a su forma reducida (FADH2) necesita la adición de dos átomos de hidrógenos
que toma del sustrato (glucosa). Ambos pares son electroquímicamente reversibles en
presencia de cofactores como el O2. La estructura cristalina de la Gox ha revelado
recientemente que el tamaño de la hendidura enzimática presenta una apertura inicial
de 10 Ǻ x 10 Ǻ y que solo puede modificar su tamaño en unos pocos angstroms. Esto
permite que la glucosa entre al sitio activo y pueda ser oxidada de manera específica.
5.1.6.- Lactato oxidasa (Lox)
La enzima Lactato oxidasa (Lox) pertenece también al grupo de las flavoenzimas.
En este caso, el grupo prostético es el grupo flavín mononucleótido (FMN) (Chaubey et
al., 2000; Garjonyte et., 2001; Burmeister et al., 2005). La Lox y otras enzimas similares
catalizan la oxidación de α-hidroxoácidos sin generar intermedios de reacción. El
mecanismo de reacción de la Lox, así como la de otros miembros de la misma familia
(Glicolato oxidasa, Flavocitocromo B2), se produce mediante un proceso carbaniónico. El
proceso de oxidación comienza cuando un protón α del sustrato es abstraído por una

68
base del centro activo y los electrones resultantes del carbanión formado son
transferidos al grupo flavín. Se cree que la interacción (iónica) inicial ocurre entre un
grupo carboxilato y un residuo de arginina en la cara si del centro activo.
Pese la estructura cristalina de la Lox no ha sido resuelta todavía, la estructura de
enzimas de la misma familia es bien conocida. La secuencia de aminoácidos de dichas
enzimas presenta una estructura coherente entre ellas y coherentes con el mecanismo
carbaniónico propuesto anteriormente. La reacción de oxidación del lactato por la Lox
viene recogida en la ecuación 5.1, donde el grupo prostético, inicialmente en el estado
oxidado (FMN), reacciona con el lactato para dar piruvato y pasar a su forma reducida
(FMNH2). Posteriormente, en presencia de O2 molecular (cofactor), el FMNH2 se
reoxida a su forma original y queda preparado para reaccionar con otra molécula de
lactato, ecuación 5.2.
𝐿𝑎𝑐𝑡𝑎𝑡𝑜 + 𝐿𝑜𝑥(𝐹𝑀𝑁) ⇾ 𝑝𝑖𝑟𝑢𝑣𝑎𝑡𝑜 + 𝐿𝑜𝑥(𝐹𝑀𝑁𝐻2) Ecuación 5.1
𝐿𝑜𝑥(𝐹𝑀𝑁𝐻2) + 𝑂2 ⇾ 𝐿𝑜𝑥(𝐹𝑀𝑁) + 𝐻2𝑂2 Ecuación 5.2
5.1.7.- Interferencias: El ácido ascórbico como prototipo de interferente endógeno
Existen multitud de compuestos biológicos (neurotransmisores, metabolitos, etc.)
que pueden ser oxidados o reducidos en la superficie de un electrodo (compuestos
electroactivos). Dichos procesos de oxido-reducción generan corrientes eléctricas que se
suman o restan a la respuesta del biosensor y que puede producir errores en la
interpretación de los resultados, tanto en la corriente de fondo (concentración basal del
analito), como frente a la respuesta de estímulos fisiológicos y electrofisiológicos.
El ácido ascórbico (AA) es el mayor interferente en biosensores de 1ª generación,
debido principalmente a: (1) su alta concentración en el SNC de mamíferos: 200-400 µM
(en el mismo rango o superior que muchos analitos de interés), y (2) por el hecho de
69
que es oxidado en un amplio rango de potencial (E1/2 entre -100 y +400 mV frente a
SCE) (O’Neill et al., 1998). Es por ello que el AA ha sido usado como prototipo de
interferente endógeno en procesos de validación y en test de interferencias en el ámbito
de los biosensores. Por otro lado, en los estudio de validación frente a interferentes se
han empleado otras muchas sustancias que potencialmente podían actuar como
interferentes (ver artículos adjuntos).
5.2.- Enzimas y mecánica enzimática
Durante el desarrollo del presente trabajo el empleo de enzimas oxido-
reductasa (Gox, y Lox) ha sido fundamental, pues es el material biológico que permite la
detección y cuantificación de glucosa y lactato en el SNC. Con el fin de entender mejor el
funcionamiento de los microbiosensores (calibrado, sensibilidad, selectividad,
interferencias,...) se introducen a continuación algunos conceptos básicos. Sin embargo
para una lectura y estudio en profundidad del apartado 5.2 se recomienda consultar:
(Mathews et al., 1999; Lehninger et al., 2005)
Las enzimas son altamente selectivas al sustrato, su característica principal es que
incrementan la velocidad de la reacción sin que esta sea consumida, es decir, se regeneran
durante la misma reacción enzimática, quedando lista para reaccionar con otra
molécula de sustrato. Estas dos propiedades son las que hacen que las enzimas sean los
materiales biológicos más empleados en el desarrollo de biosensores.
La estructura tridimensional de la enzima es la responsable de la mayor parte
de las propiedades enzimáticas, incluida la selectividad al sustrato. Generalmente, son
estructuras que consisten en largas cadenas de aminoácidos unidas por enlaces
peptídicos empaquetadas en estructuras secundarias, terciarias y cuaternarias por

70
puentes de azufre, interacciones hidrofóbicas y puentes de hidrógenos. Esta
macroestructura tridimensional es la que da lugar a la aparición del centro activo de la
enzima, altamente selectivo al sustrato.
Los estudios sistemáticos sobre la actividad enzimática comenzaron a finales
del siglo XIX. Ya en 1882 se introdujo el concepto de complejo enzima-sustrato (ES) como
intermediario del proceso de catálisis enzimática. En 1913, Leonor Michaelis y Maud
Menten, desarrollaron esta teoría y propusieron una ecuación de velocidad que explica
el comportamiento cinético de las enzimas. Para explicar la relación observada entre la
velocidad inicial (v0) y la concentración inicial de sustrato ([S]0) Michaelis y Menten
propusieron que las reacciones catalizadas enzimáticamente ocurrían en dos etapas: En
la primera etapa ocurre la formación del complejo ES (etapa rápida, ecuación 5.3) y en la
segunda, el complejo ES da lugar a la formación del producto (P, paso lento de la
reacción), liberando así a la enzima para realizar un nuevo ciclo catalítico:
𝐸 + 𝑆 𝑘−1 ⎯
𝑘1 ⎯ 𝐸𝑆 𝑘2 ⎯ 𝐸 + 𝑃 Ecuación 5.3
En este esquema, k1, k-1 y k2 son las constantes cinéticas individuales de cada
proceso y reciben el nombre de constantes microscópicas de velocidad. Según esto, se
puede afirmar que:
𝑣1 = 𝑘1 [𝐸] [𝑆] Ecuación 5.4
𝑣−1 = 𝑘−1 [𝐸𝑆] Ecuación 5.5
𝑣2 = 𝑘2 [𝐸𝑆] Ecuación 5.6
Donde: [E], [S] y [ES] son las concentraciones de enzima libre, de sustrato y del
complejo enzima-sustrato respectivamente. La concentración total de enzima, [ET],
(que es constante a lo largo de la reacción) es:

71
[𝐸𝑇] = [𝐸] + [𝐸𝑆] Ecuación 5.7
Reordenando queda:
[𝐸] = [𝐸𝑇] – [𝐸𝑆] Ecuación 5.8
Sustituyendo 5.8 en 5.4 se puede expresar v1 de la siguiente forma:
𝑣1 = 𝑘1[𝑆][𝐸𝑇] − 𝑘 1[𝑆][𝐸𝑆] Ecuación 5.9
Adoptando la hipótesis del estado estacionario, según la cual la concentración del
complejo ES es pequeña y constante a lo largo de la reacción (d[ES]/dt =0), se tiene que:
𝑑[𝐸𝑆]𝑑𝑡
= 𝑣1 − 𝑣−1 − 𝑣2 = (𝑘1[𝑆][𝐸𝑇] − 𝑘1 [𝑆][𝐸𝑆]) − 𝑘−1[𝐸𝑆]− 𝑘2 [𝐸𝑆] = 0
Ecuación 5.10
Reordenando queda:
𝑘1[𝑆] [𝐸𝑇] − 𝑘1 [𝑆] [𝐸𝑆] = 𝑘−1 [𝐸𝑆] + 𝑘2 [𝐸𝑆] Ecuación 5.11
Despejando [ES] resulta:
[𝐸𝑆] = (𝑘1[𝑆] [𝐸𝑇]) / (𝑘1 [𝑆] + 𝑘−1 + 𝑘2) Ecuación 5.12
Operando:
[𝐸𝑆] = [𝑆] [𝐸𝑇] [𝑆]+[(𝑘−1 + 𝑘2) / 𝑘1 )]
Ecuación 5.13
Finalmente se obtiene:
[𝐸𝑆] = [𝑆] [𝐸𝑇] [𝑆]+𝐾𝑀
Ecuación 5.14

72
Donde KM es la constante de Michaelis-Menten:
[(𝑘−1 + 𝑘2) / 𝑘1 )] = 𝐾𝑀 Ecuación 5.15
Como [ES] es constante, y k2 es el paso lento de la reacción enzimática, la
velocidad de formación de los productos es constante, y dependerá tan solo de [ES],
luego la velocidad macroscópica del proceso es:
𝑣 = 𝑣 2 = 𝑘2 [𝐸𝑆] = 𝑐𝑡𝑒 Ecuación 5.16
Por lo tanto, en el estado estacionario, la velocidad de formación del producto es:
𝑣 = 𝑘2 [𝑆][𝐸𝑇][𝑆]+ 𝐾𝑀
Ecuación 5.17
Para cualquier reacción enzimática, [ET], k2 y KM son constantes. Considerando
dos casos extremos:
• A concentraciones de sustrato pequeñas ([S] << KM) v = (k2 [ET]/KM) [S]. Como los
términos entre paréntesis son constantes, pueden englobarse en una nueva
constante, kobs, de forma que la expresión queda reducida a: v = kobs [S], con lo
cual la reacción es un proceso cinético de primer orden.
• A concentraciones de sustrato elevadas ([S] >> KM), v = k2 [ET]. La velocidad de
reacción es independiente de la concentración del sustrato y por tanto, la
reacción es un proceso cinético de orden cero. Además, tanto k2 como [ET] son
constantes pudiéndose definir un nuevo parámetro, la velocidad máxima de la
reacción (Vmax), siendo Vmax = k2 [ET], que es la velocidad que se alcanzaría
cuando todo el enzima disponible se encuentra unida al sustrato (saturación
enzimática).

73
Introduciendo el parámetro Vmax en la ecuación general de la velocidad, se
obtiene la expresión más conocida de la ecuación de Michaelis-Menten:
𝑣 = [𝑆]𝐾𝑀+[𝑆]
· 𝑉𝑚𝑎𝑥 Ecuación 5.18
La representación gráfica de la ecuación de Michaelis-Menten (v frente a [S]) es
una curva hiperbólica (Figura 5.3a). Vmax corresponde al valor máximo al que tiende la
curva experimental y KM corresponde a la concentración de sustrato a la cual la
velocidad de la reacción es la mitad de la Vmax .
Figura 5.3.- a) Representación gráfica de la ecuación de Michaelis-Menten. b) Linealización de la ecuación de Michaelis-Menten por el método propuesto por Lineweaver-Burk.
KM es un parámetro cinético importante por varias razones:
1) La razón Vmax/KM ~ sensibilidad analítica en el tramo inicial.
2) El valor de KM da una idea de la afinidad del enzima por el sustrato:
1. a menor KM ⇾ mayor afinidad
2. a mayor KM ⇾ menor afinidad
a)
b)

74
Este hecho tiene fácil explicación si se tiene en cuenta la ecuación 5.3, donde el
complejo ES se forma y disocia en las reacciones [(1)] y [(2) y (-1)] respectivamente. Así,
si KM es grande, (𝑘−1 + 𝑘2) >> 𝑘1 (ver ecuación 5.15) predomina la disociación del
complejo ES (poca afinidad hacia el sustrato). En el otro extremo, se tiene que para
valores pequeños de KM, (𝑘−1 + 𝑘2) << 𝑘1 predomina la formación del complejo ES
(gran afinidad hacia el sustrato).
Hay enzimas que no obedecen la ecuación de Michaelis-Menten, siguiendo así,
una cinética no Michaeliana. Esto ocurre con las enzimas alostéricos, cuya gráfica vo
frente a [S] no es una hipérbola, sino una sigmoide. En la cinética sigmoidea, pequeñas
variaciones en la [S] en una zona crítica (cercana a la KM) se traducen en grandes
variaciones en la velocidad de reacción. Esta cinética, es característica de procesos
donde más de una molécula de sustrato reacciona con una molécula de enzima. Si cada
centro activo de la enzima es similar e independiente de la respuesta previa de un
centro activo cercano, aparece un comportamiento hiperbólico, si por el contrario,
existe un aumento en la afinidad por parte del centro activo vecino debido a la
presencia de una molécula de sustrato previo, aparece dicho comportamiento
sigmoideo, conocido como “efecto cooperativo”.
5.2.1.- Cálculo de los parámetros cinéticos enzimáticos
El cálculo de los parámetros cinéticos se realizó utilizando los datos de
intensidad de corriente (i) de los microbiosensores en el estado estacionario. Partiendo
de una disolución de PBS pH= 7.4, se añadieron distintos volúmenes de una disolución
de analito (glucosa y lactato) de concentración conocida y se construyó la curva de
calibrado i vs. [S].

75
Antes de calcular las constantes cinéticas y las características analíticas de la
curva de calibrado, es necesario verificar que la reacción enzimática que tiene lugar
sobre la superficie del transductor obedece a una cinética del tipo Michaelis-Menten.
Para ello, se calcula el parámetro “h” de la ecuación linealizada de Hill, que proporciona
una medida del grado de desviación de una cinética de Michaelis-Menten. Dicha
ecuación es:
𝑙𝑜𝑔 𝑖𝑚𝑎𝑥 𝑖 − 1 = 𝑙𝑜𝑔 𝐾𝑀 − ℎ 𝑙𝑜𝑔 [𝑆] Ecuación 5.19
Para reacciones enzimáticas con una cinética de Michaelis-Menten el valor de “h”
es próximo a 1, presentando así, una cinética hiperbólica. Valores de “h” próximos a 2
aparecen cuando existe una cinética sigmoidea.
Una vez calculado el parámetro “h”, se procedió al cálculo de los parámetros
cinéticos. Para determinar gráficamente los valores de KM y Vmax es más sencillo
utilizar la representación doble recíproca o Lineweaver-Burk (1/v frente a 1/[S]), ya que
muestra dependencia lineal (Figura 5.3b). Dicha recta posee las siguientes
características:
1. La pendiente es KM /Vmax
2. La abscisa en el origen (1/v = 0) es -1/KM
3. La ordenada en el origen (1/[S] = 0) es 1/Vmax
Desde el punto de vista analítico, a medida que se obtiene un biosensor con una
KM más elevada, la sensibilidad de dicho dispositivo disminuye, pero aumenta el
rango de linealidad de trabajo. Sin embargo, un biosensor con un valor menor de KM
daría lugar a un biosensor mucho más sensible al analito, pero con un menor rango
lineal.
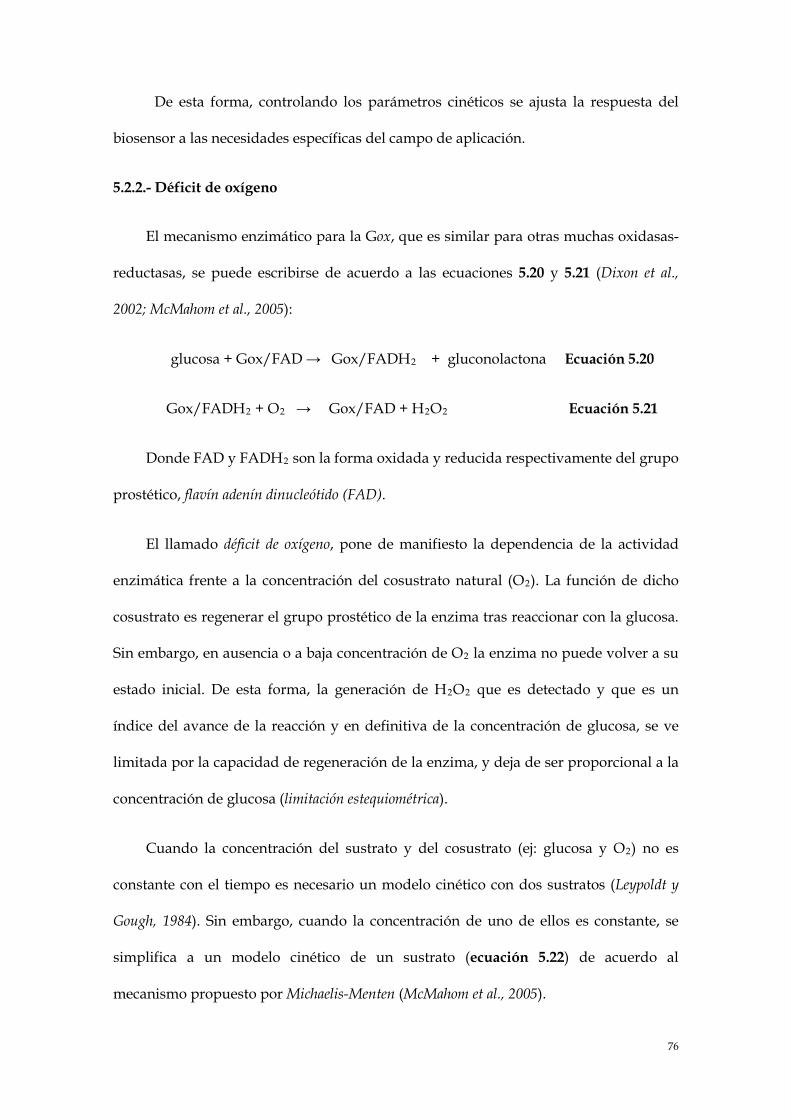
76
De esta forma, controlando los parámetros cinéticos se ajusta la respuesta del
biosensor a las necesidades específicas del campo de aplicación.
5.2.2.- Déficit de oxígeno
El mecanismo enzimático para la Gox, que es similar para otras muchas oxidasas-
reductasas, se puede escribirse de acuerdo a las ecuaciones 5.20 y 5.21 (Dixon et al.,
2002; McMahom et al., 2005):
glucosa + Gox/FAD → Gox/FADH2 + gluconolactona Ecuación 5.20
Gox/FADH2 + O2 → Gox/FAD + H2O2 Ecuación 5.21
Donde FAD y FADH2 son la forma oxidada y reducida respectivamente del grupo
prostético, flavín adenín dinucleótido (FAD).
El llamado déficit de oxígeno, pone de manifiesto la dependencia de la actividad
enzimática frente a la concentración del cosustrato natural (O2). La función de dicho
cosustrato es regenerar el grupo prostético de la enzima tras reaccionar con la glucosa.
Sin embargo, en ausencia o a baja concentración de O2 la enzima no puede volver a su
estado inicial. De esta forma, la generación de H2O2 que es detectado y que es un
índice del avance de la reacción y en definitiva de la concentración de glucosa, se ve
limitada por la capacidad de regeneración de la enzima, y deja de ser proporcional a la
concentración de glucosa (limitación estequiométrica).
Cuando la concentración del sustrato y del cosustrato (ej: glucosa y O2) no es
constante con el tiempo es necesario un modelo cinético con dos sustratos (Leypoldt y
Gough, 1984). Sin embargo, cuando la concentración de uno de ellos es constante, se
simplifica a un modelo cinético de un sustrato (ecuación 5.22) de acuerdo al
mecanismo propuesto por Michaelis-Menten (McMahom et al., 2005).

77
𝐽𝑔𝑙𝑢𝑐 = 𝐽𝑚𝑎𝑥 1 +𝐾𝑀(𝐺)
[𝐺] −1
𝐄𝐜𝐮𝐚𝐜𝐢ó𝐧 𝟓.𝟐𝟐
Donde la corriente o más correctamente la densidad de corriente (J), corriente
normalizada con respecto al área del electrodo, es una medida de la velocidad global
de la reacción enzimática y Jmax es el valor de J (Jgluc) cuando la enzima se encuentra
saturada con el sustrato, glucosa (G). De esta forma distintos valores de Jmax,
determinados en las mismas condiciones, reflejan diferencias en la actividad
enzimática y distintos valores para la constante de Michelis-Menten (KM) o más
correctamente, de la constante aparente de Michaelis-Menten [KM(G)].
Alternativamente, si la concentración de sustrato (glucosa) es fija y la concentración del
cosustrato (O2) es variable se puede modificar la ecuación general y escribirla acorde a:
𝐽𝑔𝑙𝑢𝑐 = 𝐽′𝑚𝑎𝑥 1 +𝐾𝑀(𝑂2)
[𝑂2] −1
𝐄𝐜𝐮𝐚𝐜𝐢ó𝐧 𝟓.𝟐𝟑
Esta nueva ecuación puede ser usada para evaluar la dependencia de Jgluc con
respecto a la concentración de O2 (Dixon et al., 2002), donde J'max es la respuesta
máxima para una concentración fija de glucosa, y KM(O2) es la constate aparente de
Michaelis-Menten para el O2. La opción de usar una única ecuación con dos sustratos
como han empleado otros autores (Leypoldt y Gough, 1984) y de la cual se puede derivar
la verdadera KM, no ha sido empleada en la presente tesis, debido a que la constante
aparente de Michaelis-Menten [KM(gluc) o KM(O2)] definida separadamente es
analíticamente más sencilla y útil para definir el rango lineal (RL) para ambos sustratos
individualmente [RL ~ 1/2KM] y para saber la influencia de los parámetros cinéticos en
la sensibilidad analítica (S), S ~ Jmax/KM ( McMahom et al., 2005).

78
5.3.- Fabricación de los microbiosensores
Previa elaboración de los microbiosensores es necesario fabricar un transductor
con las dimensiones y características adecuadas para trabajar en el SNC.
5.3.1.- Fabricación de los microelectrodos de fibra de carbono
La fabricación de los microelectrodos de fibra de carbono (CFEs) constituye ya
de por sí un trabajo laborioso y meticuloso, debido a que es necesario elaborar
microelectrodos con una gran reproducibilidad y tamaño adecuado. Las fibras de
carbono de 8 µm de diámetro se montan y fijan mediante una pintura conductora de
plata sobre un cable eléctrico de 0.25 mm de diámetro. Posteriormente, son secadas en
estufa a 60 ºC durante media hora e introducidas en un capilar de borosilicato
previamente estirado (estirador de pipetas Kopf 750). Una vez la fibra salga por el
orificio anterior, ésta es cortada a un tamaño de 250 µm de longitud. El dispositivo es
fijado por ambos extremos con una resina epoxi no conductora y secado en estufa
durante una hora. Finalmente, se suelda un pin chapado en oro al extremo del cable
con el fin de ofrecer un buen contacto eléctrico. Posteriormente, los electrodos pueden

79
ser sometidos a un proceso de limpieza sumergiendo la punta en distintas
disoluciones: acetona, agua, ácido sulfúrico, agua, y secado en estufa una hora.
5.3.2.- Modificación de los microelectrodos de fibra de carbono
Una vez construidos los CFEs, el siguiente paso es la modificación del
transductor con el material biológico de reconocimiento, en nuestro caso con Gox o Lox.
Con el fin de optimizar la respuesta de los microbiosensores se han empleado en el
diseño distintos compuestos (surfactantes, compuestos electrocatalíticos, polímeros,
etc.) que han permitido: (1) disminuir el potencial de detección del H2O2; (2) reducir el
déficit de oxígeno; (3) incrementar la carga enzimática y la sensibilidad, así como
reducir el límite de detección; (4) evitar los fenómenos de interferencia; (5) mejorar la
biocompatibilidad de la superficie del microbiosensor.
A continuación, se resumen las etapas de modificación de los microbiosensores
amperométricos acorde a los ítems anteriormente enumerados (ver figura 5.4 para
detalles de la configuración). Sin embargo, hay que tener en cuenta que dicho proceso
ha sido modificado a lo largo del desarrollo de la presente tesis con el fin de optimizar
los resultados (ver detalles en los artículos adjuntos).

80
Figura 5.4.- Esquema de un biosensor amperométrico enzimático de glucosa construido a partir de un microelectrodo de fibra de carbono de 8 µm de diámetro: PB (Azul de Prusia), Gox (glucosa oxidasa). La última capa de PoPD (poli-o-fenilendiamida), así como, el PEI y Nafion no han sido dibujados para facilitar la visualización del esquema.
5.3.2.1.- Disminución del potencial de detección del H2O2
Para disminuir el potencial de detección de H2O2 se ha electrodepositado una
capa de PB. Generalmente se ha empleado una etapa de electrodeposición mediante
CV, otra de activación ciclando en la disolución de electrolito soporte, y finalmente un
proceso de estabilización térmica (1h a 80-100ºC) para eliminar el agua de solvatación
de la estructura cristalina. Por otra parte las condiciones de electrodeposición: método
de electrodeposición, límites en los potenciales de ciclado, velocidad de barrido, pH de
la disolución de trabajo, adición de surfactante como mediador de la electrodeposición,

81
tratamiento térmico, han sido estudiadas en detalle y constituyen buena parte del
grueso de la presente tesis.
Con el fin de estudiar en detalle la optimización y la electrodeposición del PB,
sobre todo en presencia de distintitos surfactantes, se han empleado tarjetas
serigrafiadas de carbono (DRP-110) suministradas por la empresa española Dropsens.
La elección de dichos electrodos ha sido para simplificar y ahorrar tiempo en la tediosa
fabricación de un número ingente de microelectrodos, así como para asegurar la
reproducibilidad y el fácil manejo de los electrodos durante el estudio.
5.3.2.2.- Reducción del déficit de oxígeno
Las limitaciones estequimétricas derivadas de las fluctuaciones del cosustrato es
un problema importante en el ámbito de aplicación por tres razones primordiales: (1) la
concentración de O2 en el espacio extracelular en el cerebro es de aproximadamente 50
μM (cinco veces menor que en una disolución aireada) (Nair et al., 1987; Murr et al.,
1994, Zauner et al., 1995); (2) este nivel puede fluctuar de manera significativa en
condiciones fisiológicas y/o dependiendo de las condiciones experimentales (estrés,
efecto de algunos anestésicos, hipoxia inducida, acción farmacológica) (Dixon et al.,
2002; Bolger y Lowry, 2005; Bazzu et al., 2009); (3) la elevada concentración de algunos
metabolitos (glucosa ~0.5-1 mM (McNay et al., 2001; O’Neill et al., 2008), lactato ~ 0.4
mM (Goodman et al., 1996; Demestre et al., 1997; Shram et al., 1998) frente a la
concentración del O2 en el espacio extracelular.
Con el fin de superar dicha problemática y minimizar sus efectos se han aplicado
distintas estrategias, entre las que se incluyen: (1) el uso de distintas configuraciones
(Dixon et al., 2002; McMahom et al., 2006; McMahom et al., 2007) y transductores con
diferentes geometrías y tamaños que optimicen la llegada de O2 a la superficie del

82
biosensor (McMahom y O'Neill, 2005); (2) la inclusión de una barrera de difusión que
permita el libre paso del O2 y dificulte la llegada del sustrato, aumentando así la
relación O2/sustrato en la superficie del biosensor; (3) la optimización de la carga
enzimática (McMahom et al., 2007), para mejorar la sensibilidad y el rango lineal del
biosensor; (4) el uso de polímeros que presenten una gran solubilidad para el O2 y que
actúen de reservorio interno (Wang y Lu, 1998; Wang et al., 2000a; Wang et al., 2001;
Wang et al., 2002).
Si bien en la presente memoria se han empleado las aproximaciones (2) y (3),
también se ha estudiado el uso de diversas fuentes o reservorios de O2. Para ello se han
empleado distintos fluorocarbonos (Nafion, H700), debido a que dichos polímeros
poseen una notable solubilidad para el O2.
Durante los últimos años, los fluorocarbonos han sido empleados en electrodos de
pasta de carbono para desarrollar biosensores que pudiesen trabajar en ausencia o a
bajas concentraciones de O2 (Wang y Lu, 1998). Además, debido a su notable
solubilidad para el O2 han sido empleados como sustitutos sanguíneos y
transportadores de O2 en animales y humanos (Wang et al., 2000a). Algunos de estos
flurocarbonos son polímeros de bajo peso molecular, derivados del
clorotrifluoroetileno, -(CF2CFCl)n-, donde n varía entre 2 y 8. Compuestos como: (1)
H200, H700, H1000 (nombres comerciales) (Wang et al., 2000a), (2) Kel-F
(policlorotrifluoroetileno, PCTFE) (Wang y Lu, 1998; Wang et al., 2000a; Wang et al., 2001;
Wang et al., 2002) y (3) Nafion (derivado sulfonado del tetrafluoretileno) (Wang y Lu,
1998) han sido usados con éxito. Por otro lado, los polidimetilsiloxanos (PDMS) han
sido incorporados en biosensores de glucosa, manteniendo la reacción enzimática en
ausencia de O2 durante más de 15 horas (Wang et al., 2002).

83
Pese a que dicho enfoque ha sido empleado con éxito en macrobiosensores,
especialmente en electrodos de pasta de carbono, los estudios en microbiosensores y en
en aplicaciones fisiológicas han sido nulos o al menos muy limitados (no existe
constancia de referencias bibliográficas). Por ello, se han seleccionado dos de ellos: (1)
Nafion y (2) H700 para estudiar sus propiedades y la capacidad para mitigar los efectos
de trabajar a bajas concentraciones de O2.
El proceso de modificación ha consistido en la inmersión del transductor en una
disolución alcohólica de Nafion al 5% o H700. Dicho proceso se realiza sumergiendo
rápidamente 15 veces el CFE/PB y dejándolo secar a temperatura ambiente durante 30
minutos.
Resultados parciales de dicho estudio se han presentado durante la redacción de
la presente memoria en el 14th International Conference on In Vivo Methods organizado
por la Internationl Society for Monitoring Molecules in Neuroscience que tuvo lugar en
Londres entre el 16 y 20 de septiembre de 2012. A su vez, se está redactando una
publicación a falta de realizar los estudios en modelos animales (ver Anexo II: otras
publicaciones).
5.3.2.3.- Incremento de la carga enzimática
Con el fin de incrementar la cantidad de enzima retenida en la superficie del
microbiosensor se realizan 15 inmersiones rápidas en PEI (2.5% w/v) y se seca a
temperatura ambiente. Posteriormente, se realizan 30 inmersiones rápidas en la
disolución enzimática (Gox (300 U/mL) o Lox (100 U/mL)) y 5 minutos después se
sumergen 5 veces en una disolución de glutaraldehido en PBS [glutaraldehido (0.1%
w/v)/BSA (1% w/v)], dejando entrecruzar durante 1-2 horas a temperatura ambiente

84
al aire. Posteriormente, los microbiosensores son guardados en la nevera en seco hasta
el día siguiente.
El protocolo descrito anteriormente corresponde al método optimizado, sin
embargo, durante el proceso de optimización también se ha empleado PEI al 1 y al 5 %
w/v, se ha modificado el protocolo de inmersión alternándolo enzima y PEI, y se ha
estudiado como afecta el tiempo de secado (hidratación del PEI) en la carga enzimática
final.
5.3.2.4.- Mejora de la selectividad frente a los interferentes
Pese a que las interferencias son reducidas bastante debido al bajo potencial de
trabajo, se ha empleado una capa protectora (PoPD) que impide el acceso del AA y
otros interferentes al interior de microbiosensor. El protocolo empleado consistió en la
electrodeposición de una capa de PoPD mediante CPA durante aproximadamente 15-
20 minutos. La disolución (PBS) para la electrodeposición ha sido desoxigenada
previamente (20 minutos bajo burbujeo de N2). Posteriormente, se disolvió el
monómero (oPD) a una concentración de 300 mM sonicando durante 15 minutos y se
añadió BSA a una concentración de 5mg/mL para disminuir la desactivación
enzimática debido al alto grado de compactación del polímero.
Cuando la disolución de monómero está lista se introducen los electrodos
(biosensor, auxiliar y referencia) en la disolución y se aplica un potencial de ~ 0.7 V
durante 15-20 minutos. El PoPD (en su forma no conductora) presenta una alta
resistencia eléctrica, propiedad que hace que el crecimiento de la membrana polimérica
esté autolimitado. De esta manera, a medida que aumenta el grosor de dicha capa,
disminuye la intensidad de corriente (disminuye la electropolimerización) y aumenta
el grado de compactación del entramado polimérico (impidiendo así, la llegada de más

85
moléculas de monómero). Pasado un tiempo determinado (función de la concentración
de monómero, potencial aplicado, método de electro-deposición elegido, etc.), la
corriente se estabiliza, indicando la finalización del proceso de electropolimerización.
5.3.2.5.- Optimización de las propiedades de biocompatibilidad
Los biosensores usados en neuroquímica, especialmente en métodos in vivo,
tienen que solventar los problemas inherentes que aparecen en sistemas biológicos y
que surgen debido a la interacción electrodo-matriz, siendo los más significativos: (1)
respuesta a sustancias endógenas electroactivas, interferentes; (2) degradación de la
superficie del sensor como consecuencia de que el organismo reconoce al mismo como
un elemento externo (respuesta inflamatoria debida a problemas de inmunidad o de reacción a
un cuerpo extraño).
Las interacciones adversas entre la superficie del dispositivo implantado
(biosensor) y el medio biológico de implantación (SNC) no afectan solo al biosensor,
sino también al entorno de estudio (Wilson y Gifford, 2005). De esta forma se ha tener en
cuenta un enfoque más amplio a la hora de definir operacionalmente la
biocompatibilidad (Williams, 1989). Para los biosensores, esto se traduce en tres
consideraciones: (1) influencia de la respuesta inflamatoria inicial (debida a lesiones
durante la inserción), y adsorción de biomoléculas en la superficie del electrodo, (2)
modificación de las condiciones fisiológicas locales debido al implante del mismo, las
cuales pueden modificar la concentración y difusión del analito de interés y (3)
degradación de biosensor (Reichert y Sharkawy, 1999).
Las alteraciones más evidentes sobre el entorno son fisiológicas y anatómicas
debido al tamaño del dispositivo de medida (rotura de vasos sanguíneos, pérdida de la
integridad de la barrera hematoencefálica, cambios en la microcirculación local, edema, consumo

86
extra de glucosa, producción de citoquinas, eventual proliferación de células gliales, etc.) que se
pueden extender hasta 1 mm de la zona de implantación (Benveniste et al., 1987; O’Neill
et al, 1991; Zhou et al., 2001; Khan y Michael, 2003). Todo ello ha dado lugar a una
reducción de las dimensiones del dispositivo a implantar.
Por otro lado, un diseño adecuado de la superficie del biosensor puede reducir su
degradación paulatina, debido a la acción inflamatoria que ocurre a su alrededor. En
contanto con la sangre (por hemorragia o al introducir el biosensor en un catéter) la
principal fuente de complicación surge debido a la contaminación por depósito de la
superficie del electrodo por proteínas y compuestos de coagulación que finalmente
conducen a la formación de trombos, causando un importante riesgo para la salud. Es
por ello, que la implantación subcutánea de biosensores ha sido elegida como una
alternativa que reduce las complicaciones (interacción electrodo-proteínas) y riesgos
para la salud (Wang, 2008).
Una excelente descripción de la respuesta inflamatoria a los dispositivos
implantados es recogida por Anderson (Anderson, 1993). La respuesta aguda se inicia
inmediatamente después de que el biosensor se ha implantado. Durante la respuesta
inicial, las proteínas plasmáticas y células inflamatorias migran al sitio del cuerpo
extraño (biosensor). Las proteínas son adsorbidas inicialmente, y posteriormente las
células fagocitarias (neutrófilos, monocitos, y macrófagos) rodean el biosensor con el
fin de destruirlo mediante la liberación de especias reactivas de oxígeno (H2O2, O2-,
NO, OH-) y lisoenzimas. Sin embargo, debido a las dimensiones del biosensor esta
tarea es prácticamente imposible. El momento exacto, la acción y la intensidad del
proceso dependen de la naturaleza del cuerpo extraño (tamaño, forma, y propiedades
físicas y químicas de su superficie). Dicha respuesta aguda dura unos 3 días, después
de la cual comienza una respuesta inflamatoria en la cual el cuerpo extrañó es cubierto
87
por una cápsula fibrosa que lo aísla del entorno, y por ende, disminuye el flujo de
reactantes a la superficie del biosensor (Mas et al., 1995a).
Con el fin de mejorar la biocompatibilidad de los biosensores se ha estudiado
proteger su superficie externa con: (1) revestimientos poliméricos (acetato de celulosa,
poliuretano, derivados del polietilenglicol, óxidos de polietileno, Nafion,
electropolimerización de o-PD y compuestos análogos que presentan una baja
adsorción de proteínas (Moussy et al., 1993; Quinn et al., 1997; Chapman et al 2001); (2) co-
inmovilización de sustancias anticoagulantes como la heparina (Wang et al., 2000b); (3)
modificación de la superficie externa con sustancias que liberen NO, un eficaz
inhibidor de la adhesión plaquetaria y bacterianas (Shin et al., 2004; Gifford et al., 2005;
Oh et al., 2005; Frost y Meyerhoff, 2006).
En la presente memoria la metodología empleada ha sido aprovechar las buenas
propiedades de biocompatibilidad que presentan el PoPD.
5.3.3.- Microelectrodos centinela
Con el fin de comprobar el efecto de los interferentes y el origen de las respuestas
fisiológicas registradas se han construido microelectrodos centinelas. Su diseño ha sido
el mismo que rige la construcción de los microbiosensores, excluyendo la adición de la
enzima que actúa como receptor biológico. De esta forma, se puede evaluar la
contribución del entorno de trabajo a la respuesta total del sistema de medida
(contribución no farádica, interferentes, etc.).
5.3.4.- Microelectrodos sensibles a oxígeno
Los CFEs también han sido empleados para construir microelectrodos sensibles a
oxígeno. Su fabricación, mucho más sencilla, ha consistido en el recubrimiento de la

88
fibra de carbono con PoPD. Posteriormente se han polarizado a -0.65 V para medir el
O2 tanto en condiciones in vitro como in vivo.
5.4.- Voltamperometría
Las técnicas potenciostáticas o voltamperométricas estudian los procesos de
transferencia de carga entre el electrodo de trabajo y el analito que se encuentra en
disolución aplicando un potencial controlado. Abarcan un grupo de métodos
electroanalíticos en los que la información sobre el analito se deduce de la medida de la
intensidad de corriente en función del potencial aplicado, en condiciones que
favorezcan la polarización total de un electrodo indicador, o de trabajo. Para una
lectura más detallada tanto para el apartado 5.4 como el apartado 5.5 se recomienda:
(Wang, 2000c).
5.4.1.- Procesos farádicos y no farádicos
El objetivo de las técnicas con potencial controlado es obtener una corriente
relacionada con la concentración del analito de interés. Por esta razón, se mide la
transferencia electrónica durante el proceso redox que sufre dicho analito en la
superficie del electrodo de trabajo:
𝑂 + 𝑛 𝑒− ↔ 𝑅 Ecuación 5.24
Donde O es la forma oxidada del par redox, R es la forma reducida del par
redox y n es el números de electrones que son puestos en juego.
La corriente resultante del cambio de estado de oxidación del analito genera
una corriente eléctrica que por seguir las leyes de Faraday se denomina corriente
farádica (la oxidación o reducción de 1 mol de sustancia produce un cambio de 96.487
culombios). Sin embargo, cuando se aplica un potencial a un electrodo pueden

89
generarse otras corrientes de naturaleza diferente, no farádicas, debidas principalmente
a que en la interfaz electrodo-disolución se genera una doble capa eléctrica donde
aparecen fenómenos de adsorción y desorción asociados al trasporte de carga.
Por otra parte, las concentraciones de reactantes y productos existentes vendrán
especificados por la ecuación de Nernst:
𝐸 = 𝐸𝑜 + 𝑅𝑇𝑛𝐹𝑙𝑛 𝐶𝑂
𝐶𝑅 Ecuación 5.25
Donde E es el potencial aplicado, Eº es el potencial estándar, R es la constante
de los gases ideales, T es la temperatura en grados Kelvin, F es la constate de Faraday,
CO es la concentración de la especie oxidada, CR es la concentración de la especie
reducida.
La corriente (iz) registrada durante un experimento voltamperométrico
representa la velocidad (vz) de reacción a la cual el analito es oxidado/reducido en la
interfase electrododo-disolución y viene expresada como:
𝑣𝑧 = 𝑖𝑧𝑛𝐹
Ecuación 5.26
Generalmente dicha velocidad es normalizada con respecto a la superficie (A)
del electrodo de trabajo (mol s-1 cm-2) quedando:
𝐽𝑧 = 𝑖𝑧𝐴
= 𝑖𝑧𝑛𝐹𝐴
Ecuación 5.27
La corriente o velocidad de reacción está controlada por: (1) transferencia de masa
del analito y sus productos de reacción hacia y desde la superficie del electrodo, (2)
velocidad de transferencia electrónica sobre la superficie del electrodo. A continuación se
define brevemente cada uno de ellos.

90
5.4.2.- Fenómenos de transporte
Para que la sustancia electroactiva se oxide o reduzca en la superficie del
electrodo es necesario que el analito, que se encuentra en el seno de la disolución,
alcance de alguna manera dicha superficie. El transporte del analito en el seno de la
disolución se efectúa mediante tres mecanismos distintos de transporte de masa, los
cuales influyen de manera distinta en la velocidad con que los reactivos y productos
son transportados desde y hacia la superficie del electrodo. Tales procesos son: difusión,
migración y convección.
En sistemas fisiológicos, como el espacio extracelular del SNC, la contribución
del término convectivo se puede despreciar. Por otra parte, el líquido cefalorraquídeo
actúa como electrolito inerte o soporte ya que está compuesto por una gran cantidad de
especies iónicas electroquímicamente inertes (Na+, K+, Ca2+, HCO¯3). Estos electrolitos
no reactivos hacen que la corriente capacitiva no se vea alterada por la variación de la
concentración del analito, de tal forma que la contribución migratoria también puede
ser despreciada.
5.4.3.- Transferencia electrónica
El proceso de transferencia electrónica (ecuación 5.24) consiste en la transferencia
de n electrones entre la banda de conducción del electrodo de trabajo y un orbital
molecular de las especie oxidada o reducida (orbitales HOMO y LUMO
respectivamente). La expresión de la velocidad de reacción directa (reducción) vd
presenta una cinética de primer orden:
𝑣𝑑 = 𝑘𝑑 𝐶𝑂 Ecuación 5.28
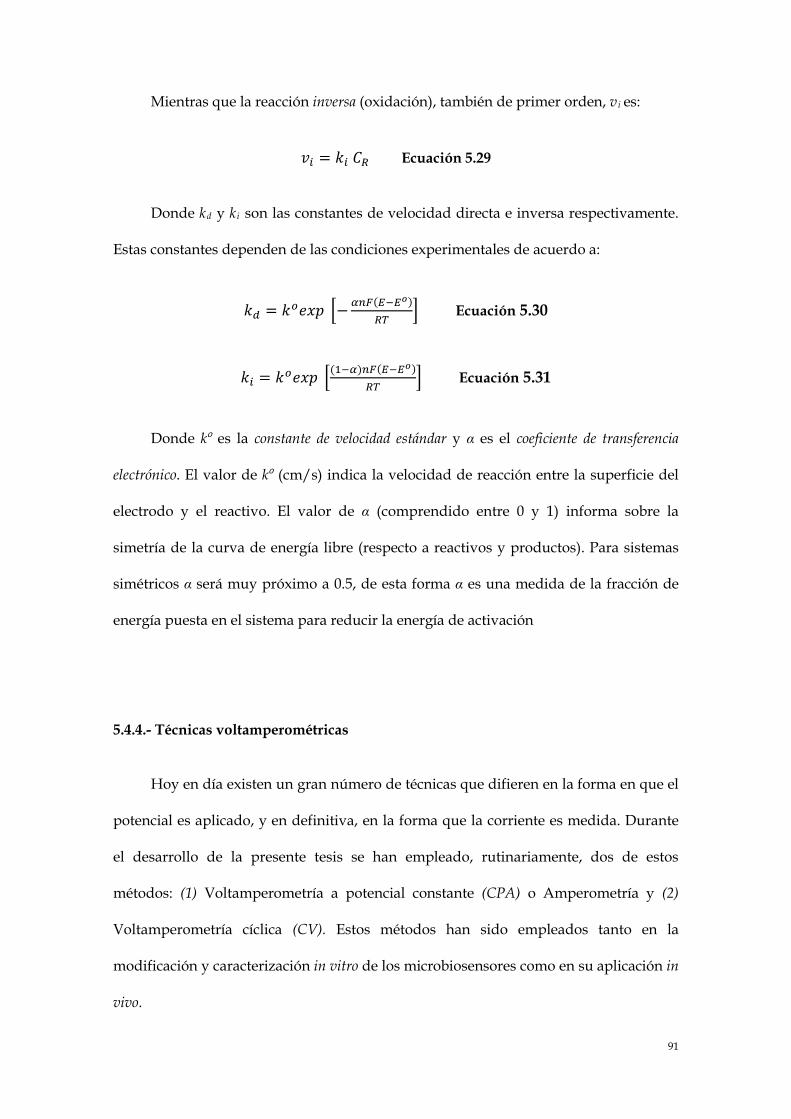
91
Mientras que la reacción inversa (oxidación), también de primer orden, vi es:
𝑣𝑖 = 𝑘𝑖 𝐶𝑅 Ecuación 5.29
Donde kd y ki son las constantes de velocidad directa e inversa respectivamente.
Estas constantes dependen de las condiciones experimentales de acuerdo a:
𝑘𝑑 = 𝑘𝑜𝑒𝑥𝑝 − 𝛼𝑛𝐹(𝐸−𝐸𝑜)𝑅𝑇
Ecuación 5.30
𝑘𝑖 = 𝑘𝑜𝑒𝑥𝑝 (1−𝛼)𝑛𝐹(𝐸−𝐸𝑜)𝑅𝑇
Ecuación 5.31
Donde ko es la constante de velocidad estándar y α es el coeficiente de transferencia
electrónico. El valor de ko (cm/s) indica la velocidad de reacción entre la superficie del
electrodo y el reactivo. El valor de α (comprendido entre 0 y 1) informa sobre la
simetría de la curva de energía libre (respecto a reactivos y productos). Para sistemas
simétricos α será muy próximo a 0.5, de esta forma α es una medida de la fracción de
energía puesta en el sistema para reducir la energía de activación
5.4.4.- Técnicas voltamperométricas
Hoy en día existen un gran número de técnicas que difieren en la forma en que el
potencial es aplicado, y en definitiva, en la forma que la corriente es medida. Durante
el desarrollo de la presente tesis se han empleado, rutinariamente, dos de estos
métodos: (1) Voltamperometría a potencial constante (CPA) o Amperometría y (2)
Voltamperometría cíclica (CV). Estos métodos han sido empleados tanto en la
modificación y caracterización in vitro de los microbiosensores como en su aplicación in
vivo.

92
5.4.4.1.- Voltamperometría a potencial constante
El potencial de trabajo se fija a un potencial donde ocurre la oxidación/reducción
del analito de interés en régimen difusivo (sin agitación mecánica y en presencia de una
gran concentración de electrolito inerte). Bajo estas condiciones, la corriente registrada
alcanza un valor máximo (corriente límite iL), proporcional a la concentración del
analito.
Al aplicar un potencial constante inicialmente aparece una contribución no
farádica que cae a cero rápidamente. Una vez pasado estos momentos iniciales la
corriente generada es función última de la concentración de analito. Admitiendo que la
iL es de origen difusivo y que poca cantidad de analito es consumida durante el
proceso de medida (concentración del analito constante), se puede asumir que se
alcanza el estado estacionario (steady-state). Este hecho y la excelente resolución
temporal hacen que esta técnica sea ideal para el estudio de sistemas “in vivo”.
Normalmente, esta técnica permite la detección de moléculas o iones a concentraciones
próximas a 10-9 M.
Bajo las condiciones de estado estacionario la iL es directamente proporcional al
coeficiente de difusión y concentración del sustrato:
𝑖𝐿 = 𝑛𝐹𝐴𝐶𝐷𝑟
𝐺 Ecuación 5.32
Donde C es la concentración de analito, D es el coeficiente de difusión, r es el radio del
electrodo y G es un factor geométrico
5.4.4.2.- Voltamperometría cíclica

93
En CV, el potencial aplicado varía linealmente (Figura 5a) con el tiempo desde un
valor inicial (Ei) hasta un valor final (Ef). Cuando se ha alcanzado este valor, el sentido
de barrido se invierte y el potencial vuelve generalmente a su valor original. El
intervalo de potenciales elegido para un experimento dado, es aquel en el que tiene
lugar la oxidación o reducción del analito de interés. Las condiciones de trabajo al igual
que en amperometría son las necesarias para que la llegada del analito a la superficie
del electrodo esté controlada por difusión. La dependencia entre la velocidad de
barrido y amplitud del pico explica el papel de la adsorción, difusión y reacciones químicas
acopladas dentro del proceso en estudio.
Figura 5.5.- a) Variación del potencial aplicado durante CV b) Voltamperograma cíclico obtenido al ciclar un electrodo en presencia de un par redox.
La figura 5.5b muestra la respuesta para un sistema reversible, en la cual se
indican distintos parámetros característicos: potencial del pico catódico (Epc), potencial
del pico anódico (Epa), intensidad del pico catódico (ipc) e intensidad del pico anódico
(ipa). Al comenzar la CV no se observa intensidad de corriente apreciable (A), ya que no
hay especies oxidables en esa zona de potencial. Cuando el potencial alcanza valores
próximos a Epa se desarrolla una intensidad anódica debida a la oxidación de R en la
superficie del electrodo. La intensidad del pico (ipa) es debida a dos componentes: (1) la

94
intensidad inicial necesaria para ajustar la concentración superficial de reactivo a su
concentración de equilibrio dada por la ecuación de Nernst y (2) la intensidad controlada
por difusión. La primera, disminuye rápidamente a medida que la capa de difusión se
extiende hacia el exterior de la superficie del electrodo. Por lo tanto, la altura de pico
viene determinada en última instancia por el proceso difusivo. Como este es incapaz
de suministrar reactivo suficiente, llegado un momento ocurre la caída de corriente
posterior a ipa, alcanzando así la región (C). La intensidad catódica (ipc) resultante de la
reducción de O que se ha acumulado cerca de la superficie del electrodo durante el
barrido directo y el potencial catódico (Epc), pueden explicarse del mismo modo para el
barrido inverso. De esta forma, la corriente catódica genera un pico y después
disminuye a medida que se consume la especie R acumulada en la superficie del
electrodo. Para un sistema reversible se tiene que Ipc/Ipa ~ 1.
Por otro lado, la separación entre dichos picos es función del número de
electrones que entran en juego en la reacción de óxido/reducción, de acuerdo a la
siguiente ecuación:
𝐸𝑝𝑎 − 𝐸𝑝𝑐 = 59/𝑛 (𝑚𝑉) Ecuación 5.33
La ecuación matemática que cuantifica la intensidad de pico (asumiendo difusión
plana), es la ecuación de Randles-Sevcik, que a 25 ºC se escribe como:
𝑖𝑝 = 2.69 · 105 𝑛3 2⁄ 𝐴 𝐶 𝐷1 2 ⁄ 𝑣1 2⁄ Ecuación 5.34
Donde ν es la velocidad de barrido. Como se puede observar, la intensidad del pico de
corriente es proporcional a la concentración de la especie electroactiva, a la raíz
cuadrada de la velocidad de barrido y del coeficiente de difusión de analito.

95
5.5.- Otras técnicas instrumentales
Durante el desarrollo de la presente memoria se han empleado diversas técnicas
instrumentales para caracterizar las modificaciones realizadas sobre el transductor.
Algunas de estas técnicas han sido usadas en el laboratorio de Neuroquímica y
Neuroimagen (CPA, CV, espectroscopía visible-ultravioleta), mientras que otras han
sido realizadas usando las infraestructuras del Departamento de Química Inorgánica
(espectroscopía de infrarrojo) y del Departamento de Química-Física (espectroscopía
de impedancia) de la ULL. A su vez, técnicas más específicas fueron sido realizadas en
el Servicio de Microscopía Electrónica (SEGAI).
A continuación, se describen brevemente las técnicas más relevantes y menos
conocidas: microscopía electrónica de barrido y espectroscopía de impedancia,
prestando especial atención a esta última puesto que es una herramienta muy útil en la
caracterización y estudio de superficies.
5.5.1.- Microscopía electrónica de barrido
La microscopía electrónica de barrido (SEM) proporciona información sobre la
morfología y topografía de la superficie de los sólidos, aunque también puede ser
empleada para estudiar la composición del material analizado. Tiene la ventaja de
tratarse de una técnica no destructiva que sirve de complemento en el análisis de la
muestra a través de otras técnicas como la difracción de rayos X (XRD) o la microscopía
de fuerzas atómica (AFM).

96
El funcionamiento del SEM se basa en el bombardeo de una superficie mediante
electrones a gran velocidad generados por un filamento de wolframio sometido a un
alto voltaje y a una temperatura elevada. Dicho haz de electrones se colima utilizando
diferentes lentes y bobinas magnéticas hasta hacerlo incidir en la muestra que se
encuentra bajo vacío. Finalmente, los electrones que interaccionan con la muestra se
recogen en diferentes sensores dependiendo del análisis a realizar. De todas las formas
de radiación resultantes de la interacción del haz incidente y la muestra, hay dos
realmente fundamentales en microscopía de barrido: los electrones secundarios y los
electrones retrodispersados. Los primeros son electrones de baja energía (decenas de
eV) que resultan de la emisión por parte de los átomos constituyentes de la muestra
(los más cercanos a la superficie) debido a la colisión con el haz incidente. Los
electrones retrodispersados, por otra parte, son electrones del haz incidente que han
interaccionado (colisionado) con los átomos de la muestra y han sido reflejados. La
intensidad de ambas emisiones varía en función del ángulo que forma el haz incidente
con la superficie del material, es decir, depende de la topografía de la muestra.
Finalmente, de la señal producida por los electrones secundarios se obtiene una
imagen tridimensional de la muestra.
5.5.2.- Espectroscopía de impedancia
La espectroscopía de impedancia (EIS) es una técnica electroquímica empleada
para medir la respuesta eléctrica de los materiales en función de la frecuencia de la
señal de excitación, generalmente sinousoidal. La impedancia de un material no es más
que la resistencia (R) de dicho material al paso de una corriente eléctrica (I) cuando se
trabaja en corriente alterna (CA). En un circuito en corriente continua (CC) la resistencia
(R) viene dada por la ley de Ohm:

97
𝑅 =𝐸𝐼
𝐄𝐜𝐮𝐚𝐜𝐢ó𝐧 𝟓.𝟑𝟓
Donde E se mide en voltios, I se mide en amperios y R se mide en ohmios.
En el caso de una señal alterna la expresión equivalente sería la siguiente:
𝑍 =𝐸𝐼
𝐄𝐜𝐮𝐚𝐜𝐢ó𝐧 𝟓.𝟑𝟔
Siendo Z la impedancia del circuito, también en ohmios.
La principal diferencia entre la resistencia de un circuito en CC y la impedancia
de un circuito en CA, es que esta última depende de la frecuencia (en Hz) de la señal de
excitación. Es una técnica relativamente nueva, pero muy útil, que permite caracterizar
muchas de las propiedades eléctricas y los procesos físico-químicos de los materiales y
su interfase. A través de este tipo de análisis electroquímico se puede obtener
información sobre la cinética, los mecanismos de formación y modificación de
superficies. Esta técnica tiene numerosas aplicaciones que van desde el estudio del
transporte de masa, velocidades medias de difusión, corrosión y propiedades eléctricas
hasta el estudio de defectos microestructurales. Se puede usar para el estudio de
sistemas tan variados como sensores químicos, biosensores, inmunosensores,
componentes de pilas de combustión, o para investigar el comportamiento de las
membranas en células vivas o tejidos.
Para poder estudiar el comportamiento de una célula electroquímica (en nuestro
caso constituida por un electrodo de referencia, un auxiliar y un electrodo de trabajo),
se representa el sistema en estudio mediante un modelo o circuito equivalente (circuito
de Randles). El circuito se describe como sigue: la resistencia Rct está en serie con un

98
elemento Zw y en paralelo con un condensador Cdl. A su vez, este conjunto está en
serie con una segunda resistencia RS, tal como se muestra en la figura 5.6a.
Figura 5.6.- a) Circuito de Randles, equivalente a una celda electroquímica convencional. b) Diagrama de Nyquist.
Los elementos RS y Zw representan las propiedades de la disolución del
electrolito y la difusión de la especie redox en la disolución respectivamente. Estos
parámetros no se ven afectados por las transformaciones químicas que ocurren en la
superficie del electrodo. Por otro lado, los elementos Cdl y Rct, dependen de las
características de la interfase electrodo/electrolito, proporcionando información sobre
la existencia de cambios en las propiedades de la superficie del electrodo al inmovilizar
o acoplar materiales sobre la interfase estudiada.
La representación más empleada en EIS es el diagrama de Nyquist, donde se
representa en el plano complejo las componentes imaginarias (Zim) frente a las
componentes reales (Zre) de la impedancia obtenida a varias frecuencias. En la figura
5.6b se muestra esta representación para el circuito de Randles. Dicho diagrama
presenta una zona semicircular a altas frecuencias, característica de un proceso
limitado por transferencia electrónica, mientras que a bajas frecuencias aparece un
tramo lineal de pendiente uno, asociado a un proceso puramente difusivo.

99
5.6.- Calibrado in vitro
Todos los calibrados se han realizado en un vaso de precipitado con 25 mL de
PBS a temperatura ambiente, utilizando como electrodo de referencia un electrodo de
calomelano saturado (SCE) comercial (Crison Instruments S.A.) y como auxiliar un
alambre de platino o de acero inoxidable. El potencial de detección en los estudios
amperométricos ha sido 0.0 V frente a SCE para los microelectrodos de fibra de
carbono y de -0.05 V frente al electrodo de pseudoreferencia interno de plata para las
tarjetas serigrafiadas.
Las calibraciones de glucosa y de lactato han sido realizadas en PBS, previa
estabilización de la corriente de fondo. Posteriormente, se han añadido distintos
volúmenes de disolución patrón (glucosa o lactato) y se ha agitado la disolución
durante 10 segundos. Finalmente, se ha dejado que la corriente alcance el estado
estacionario.
Las calibraciones con H2O2 se han realizado de forma análoga mediante
agitación constante utilizando el medio electrolítico empleado durante la
electrodeposición del PB. La disolución patrón de H2O2 (10 mM) ha sido preparada en
agua bidestilada antes de las calibraciones.
Los estudios relacionados con el déficit de oxígeno han sido realizados con
disoluciones previamente desoxigenadas con N2 durante 20 minutos. En los estudios
donde la concentración de O2 ha sido modificada durante la medida, se ha fijado la
concentración de glucosa (0.5, 1, 2, 5 mM) y se han modificado los niveles de O2
mediante el suministro de aire o N2 puro, todo ello en una celda de trabajo aislada.
Para correlacionar la respuesta del biosensor con la concentración de O2 se ha

100
monitorizado la concentración del mismo mediante el uso de un electrodo sensible a
O2 según se describe en el apartado 5.3.4.
5.7.- Animales y método quirúrgico
Los animales utilizados en la realización de la presente memoria han sido ratas
Sprargue-Dawley macho, con un peso aproximado de 350 gramos. Para los
experimentos in vivo los animales han sido anestesiados mediante inyección
intraperitoneal de uretano (1.25 g/Kg).
Una vez anestesiado, el animal se posiciona en un estereotáxico y es mantenido a
36.5-37 ºC. La fijación de la cabeza ha sido realizada por acoplamiento de los incisivos
en la cavidad anterior, quedando 3.3 mm por debajo del eje horizontal (Paxinos y
Watson, 1986). La fijación terminó mediante la introducción de las barras laterales en el
canal auditivo, de forma que la cabeza del animal quedó totalmente inmovilizada.
La operación quirúrgica comienza con una incisión cutánea longitudinal en
sentido anteroposterior en la línea media de la piel iniciada desde la línea ocular hasta
la base posterior del cráneo. A continuación se cortan los tejidos blandos de la
superficie del cráneo hasta dejar perfectamente visibles las suturas craneales y su unión
en los puntos Bregma y Lambda (puntos de corte entre suturas craneales). Una vez
preparada la superficie se procede a su perforación mediante el uso de un taladro
eléctrico que permite realizar un hueco de unos 10 mm de diámetro, siempre teniendo
cuidado en no dañar las membranas meníngeas ni los vasos sanguíneos circundantes.
Una vez terminado el orificio y limpio de restos y material óseo se procede a la retirada
con una aguja estéril y unas pinzas quirúrgicas de una porción de duramadre en la
zona de inserción para facilitar la introducción del microbiosensor. La zona de trabajo
se ha localizado siguiendo el atlas estereotáxico de Paxinos y Watson (Paxinos y Watson,

101
1986), seleccionando el cortex prefrontal como zona de estudio: A/P +2.7 de Bregma,
M/L +1.2 y D/ V -0.5 de Dura.
5.8.- Registro in vivo
Para poder medir analitos en el SNC de la rata es necesario contar con una celda
electroquímica completa en la zona de estudio. Para ello es necesario disponer de:
(1) un electrodo de trabajo (microbiosensor).
(2) un electrodo de referencia (alambre de plata clorurada, Ag/AgCl). Dicho
electrodo se fabricó utilizando hilo de plata de 0.2 mm de diámetro cubierto con teflón
y despojado de dicha cubierta por ambos extremos. A uno de los extremos se soldó un
conector chapado en oro y se conectó al potenciostato. El otro extremo se modificó
mediante un tratamiento de cloración en una cubeta de HCl 1M aplicando un potencial
de +0.8 V hasta que adquiere una tonalidad oscura (AgCl).
(3) un electrodo auxiliar (acero inoxidable o alambre de platino).
5.8.1.- Implantación del sistema electroquímico
Los electrodos de referencia y auxiliar son colocados en la superficie del cráneo
(cerca de la zona de trabajo). Para facilitar una buena conducción eléctrica con el
líquido extracelular ambos electrodos son envueltos en una tira de gelatina purificada
y esterilizada, Espongostán®, e impregnados con PBS. Esta zona es humedecida
continuamente con PBS para mantener una buena conducción. De esta forma, se
mantiene el contacto eléctrico con el microbiosensor implantado en el córtex prefrontal
y el resto de componentes de la celda electroquímica. Alternativamente, también se ha
optado por el recubrimiento del sistema con agar, siendo este último una opción más
cómoda y segura, debido a que mantiene la zona húmeda durante más tiempo.
5.8.2.- Estudio farmacológico

102
Los estudios farmacológicos se han diseñado con el objeto de caracterizar y
comprender la respuesta de los microbiosensores y no para investigar los procesos
fisiológicos que acontecen en detalle. En estos estudios se han empleado distintas
aproximaciones: (1) inyección local e (2) inyección intraperitoneal, (3) administración
de gases, etc.
Para realizar las inyecciones locales se ha diseñado un sistema de inyección que
proporciona un volumen controlado en el entorno de acción del microbiosensor. Este
dispositivo consiste en un soporte de aluminio modificado. El microbioensor se
introduce en dicho soporte que actúa como cánula guía. Por el lateral de la cánula se
colocó una aguja de acero unida al exterior del soporte con cemento dental y por cuyo
interior se hace pasar un tubo de polimicro de 76 µm de diámetro interno que termina
en el entorno de la punta del microbiosensor (200 µm de la fibra de carbono).
5.8.3.- Estimulación eléctrica
La estimulación eléctrica local ha sido empleada con el objetivo de estudiar el
consumo y liberación de glucosa y lactato durante los procesos de activación neuronal.
Dicha estimulación ha sido generada por un estimulador bipolar Grass, modelo S-8800
conectado un electrodo bipolar. Este electrodo consiste en 2 fibras de carbono de 30
micras de diámetro o dos alambres de tungsteno de aproximadamente 150 µm
(afilados por corrosión electroquímica hasta presentar unas pocas micras de diámetro
en la punta) y separados una distancia de 500 µm. El estimulador ha sido colocado en
las proximidades del microbiosensor, aproximadamente a 100 µm. La corriente
aplicada ha sido de 400 a 1500 µA y se ha modificado tanto la duración (0.1-5 s) como
la frecuencia (5-60 Hz) de la misma.
5.9.- Instrumentación electroquímica y tratamiento de datos
103
Todas las medidas in vitro e in vivo, así como las modificaciones y la
caracterización electroquímica de las distintas etapas de construcción han sido
realizadas con un potenciostato Quadstad 164 (EDAQ). Los datos han sido
almacenados y tratados mediante una unidad e-corder 401 de la misma casa comercial
usando el software: Echem v 2.0 o Chart v 5.0, en función de las necesidades de cada
momento. Las tarjetas serigrafiadas fueron modificadas y caracterizadas con un
potenciostato DRP-STAT200 y el software DropView (Dropsens).
Los datos experimentales han sido tratados con los softwares específicos de cada
casa comercial, permitiendo obtener los parámetros electroquímicos necesarios para el
análisis posterior: carga acumulada, potenciales de oxidación y reducción, altura de los
picos catódicos y anódicos, intensidad de corriente, etc.
Por otro lado, las representaciones gráficas y el cálculo de los parámetros
cinéticos, analíticos y enzimáticos han sido calculados con el programa GraphPad
Prism v 5.0.

104
RESULTADOS Y DISCUSIONES
6.-Resultados y discusiones

105
6.1.- Desarrollo de un microelectrodo de fibra de carbono modificado con PB como
transductor selectivo para biosensores de 1ª generación, aplicaciones en el
ámbito neuroquímico
Extraído de:
Salazar P, Martín M, Roche R, O'Neill RD, González Mora JL. Prussian Blue-modified microelectrodes for selective transduction in enzyme-based amperometric microbiosensors for in vivo neurochemical monitoring. Electrochimica Acta 55 (2010) 6476-6484.
Índice de impacto: 4.039 (5 últimos años)
En la presente publicación hemos desarrollado y demostrado la idoneidad de un
microelectrodo de fibra de carbono modificado previamente con PB para detectar
H2O2. Las principales ventajas del diseño han sido sus pequeñas dimensiones (Φ ~ 10
µm) y el bajo potencial de detección del H2O2 (0 V frente a SCE). La electrodeposición
ha sido realizada mediante CV en un rango de potencial entre -0.2 y +0.4 V frente
Ag/AgClsat (v= 0.1 V/s). Durante el ciclado del microelectrodo se observa un

106
crecimiento paulatino en la intensidad del pico anódico y catódico, correspondiente a
la transición PW/PB, demostrándose así la satisfactoria electrodeposición del PB sobre
la fibra de carbono. Posteriormente, dichos electrodos fueron activados ciclándolos 50
veces en la disolución electrolítica soporte y sometidos a tratamiento térmico (80 ºC, 1
h). Los depósitos fueron caracterizados mediantes espectroscopía IR y Vis-UV. Los
datos del IR mostraron un pico agudo en 2067cm-1 relacionado con el estiramiento del
enlace de Fe-CN, donde los grupos CN están unidos a un Fe2+ con carácter iónico. Por
otro lado, mediante espectroscopía Vis-UV se observó la banda de absorción a 672 nm
asociada a la transferencia de carga entre el Fe3+ y Fe2+, y que igualmente ha sido
utilizada como prueba irrefutable de la formación del depósito de PB.
Con el fin de optimizar las condiciones de deposición se estudió, por CV y CPA,
la respuesta del transductor modificado frente a la adición de H2O2, así como el efecto
que ejercen distintos electrolitos soportes en el mecanismo de oxidación del par
PW/PB, y por ende, en la sensibilidad para el H2O2. La respuesta (CV) frente a la
adición de H2O2 fue evidente, observándose el característico comportamiento
electrocatalítico al incrementarse la concentración de H2O2 (reducción del pico anódico
e incremento del pico catódico). Por otro lado, se encontró un incremento en la
sensibilidad frente al H2O2 (CPA) a medida que disminuye el radio hidratado del
catión empleado como electrolito soporte, dicho hallazgo se encontró también bien
documentado en la bibliografía. Dicho fenómeno tiene su explicación en la
transferencia iónica subyacente durante la reacción de reducción/oxidación del PB.
Durante la interconversión del par PW/PB es necesario un flujo catiónico, de o desde
la disolución soporte, para compensar el balance de cargas asociados al cambio del
estado de oxidación del átomo de hierro. Es por ello que, en presencia de iones con

107
pequeño volumen hidratado (Cs+, K+) la sensibilidad para el H2O2 es mayor, puesto
que se favorece dicho flujo catiónico en el interior de la estructura cristalina.
En el presente trabajo se ha optimizado el potencial de trabajo, así como las
posibles interferencias con el O2, otro compuesto que puede ser detectado mediante el
empleo de electrodos modificados con PB. Los resultados mostraron que el potencial
óptimo para detectar H2O2 en presencia de O2 se encuentran en el rango de +0.1 a -0.2
V frente SCE, y que en igualdad de condiciones el PB es dos órdenes de magnitud más
sensible al H2O2. Dichos resultados están de acuerdo con los datos presentados por
otros grupos y con que la forma PW, presente a potenciales < +0.1 V, es la que cataliza
la reducción del H2O2. Finalmente, se obtuvo una sensibilidad y un límite de detección
de 1.00 ± 0.04 A M−1 cm−2 y 1 10−8 M respectivamente.
Con el fin de optimizar la estabilidad y selectividad se procedió a realizar el
recubrimiento del microelectrodo (CFE/PB) con distintos polímeros: Nafion, PoPD y
una configuración híbrida (Naf/PoPD). El resultado más evidente ha sido la pérdida
de casi el 50% de sensibilidad para la configuración (CFE/PB/PoPD), atribuida a
fenómenos difusivos. Las otras dos configuraciones presentaron una disminución de la
sensibilidad (70-80%), que puede ser debida tanto a procesos difusivos como a una
menor electrodeposición de PB sobre el transductor modificado previamente con
Nafion (CFE/Naf/PB/PoPD). Finalmente, la configuración óptima fue seleccionada en
base a la selectividad de las distintas configuraciones frente a distintos interferentes
(DA, DOPAC, AA, AU). Sin duda alguna, la configuración con PoPD presentó en
ambos casos mejores propiedades antiinterferentes. La configuración CFE/PB/NAF
presentó baja selectividad frente a la DA. Dicho fenómeno puede entenderse a que la
DA a pH fisiológico tiene carga neta positiva, siendo capaz de difundir a través de la
matriz polimérica.

108
Con el fin de demostrar la utilidad del presente dispositivo se construyó el
primer prototipo de microbiosensor sensible a glucosa y se realizaron los primeros
experimentos in vivo de validación. Para la construcción de dicho microbiosensor se
partió de un microelectrodo (CFE/PB) al que se le añadió Gox, mediante
entrecruzamiento con glutaraldehido. Finalmente, se añadió una capa externa de PoPD
para mejorar la biocompatibilidad del dispositivo y evitar la respuesta frente a
interferentes endógenos. Este microbiosensor se adecuó hasta un rango lineal próximo
a 6mM, presentando una sensibilidad de 121 ± 1 pA/mM (R2= 0.998) y un límite de
detección de 54 µM.

109
6.2.- Microbiosensores sensibles a glucosa, basados en microelectrodos de carbono
modificados con PB: Aplicaciones in vivo en el sistema nervioso central
Extraído de:
Salazar P, Martín M, Roche R, González Mora JL, O'Neill RD. Microbiosensors for glucose based on Prussian Blue modified carbon fiber electrodes for in vivo monitoring in the central nervous system. Biosensors & Bioelectronics 26 (2010) 748-753.
Índice de impacto: 5.637 (5 últimos años)
Si bien, en el primer trabajo se desarrolló y demostró, por primera vez, la
idoneidad de un microelectrodo de fibra de carbono modificado con PB y Gox para
construir un biosensor sensible a glucosa, en el presente artículo, se ha optimizado la
deposición de la Gox, con el fin de obtener diferentes configuraciones y evaluar su
utilidad y viabilidad en aplicaciones in vivo. La electrodeposición de PB ha sido
realizada mediante CV en un rango de potencial de -0.2 a + 0.4 V frente Ag/AgClsat (v=
110
0.1 V/s). Posteriormente, los electrodos modificados con PB (CFE/PB) fueron
activados ciclando 50 veces en el medio electrolítico soporte y sometidos a tratamiento
térmico (100 ºC, 2 h).
Una vez modificados los microelectrodos (CFE/PB), el siguiente paso consistió
en la inmovilización enzimática. La Gox se disolvió en PBS a la concentración deseada
(300 U/ml) y se emplearon diferentes protocolos para inmovilizar la enzima (ver
detalles en apartado 3.3.1. del presente artículo y resultados en tabla 1). Uno de los
parámetros estudiados fue el número de inmersiones en la configuración básica
(CFE/PB/Goxα), siendo α el número de inmersiones aplicadas. Finalmente, con el
objetivo de disminuir el tiempo de modificación, fueron seleccionadas 5 inmersiones.
Posteriormente, se intentó aumentar la carga enzimática mediante el uso de un
polímero catiónico (PEI), mostrando un incremento significativo en la sensibilidad y en
la carga enzimática de los dispositivos. En todas las configuraciones la retención
definitiva de la enzima se hizo mediante entrecruzamiento con glutaraldehido.
El protocolo definitivo seleccionado fue: (1) inmersión rápida en 5% de PEI y
secado durante 1 h; (2) una inmersión durante 5 minutos en Gox (300 U / ml) y secado
otros 5 minutos. Posteriormente, se procedió a realizar otras 30 inmersiones rápidas en
la solución de Gox y dejar secar otros 5 minutos. Finalmente, se realizaron 15
inmersiones rápidas en una disolución de glutaraldehido y se dejó secar durante 1 hora
a 37 ºC. Con esta configuración se mejoró la sensibilidad y se redujo el límite de
detección (ambos en 2 órdenes de magnitud) con respecto a la configuración básica.
En base a la publicación anterior, se electrodepositó una capa de PoPD sobre el
biosensor y se hizo un estudio con varios interferentes (AA, AU). El primer resultado
significativo, comentado anteriormente fue la pérdida de casi el 50% de sensibilidad
debido a una menor difusión de glucosa hacia la superficie del biosensor. No obstante,

111
el límite de detección se modificó ligeramente. El rango de linealidad encontrado para
dicha configuración fue de 0.08-2 mM de glucosa, rango suficiente para realizar
medidas en el SNC, cuya concentración se encuentra en torno a 0.5-1 mM.
El estudio de interferencias estuvo en la misma línea que la publicación anterior,
no observándose cambios apreciables en la respuesta del microbiosensor en presencia
de AA y AU, validando así la presente configuración.
Dado que el pH juega un papel importante en la respuesta del microbiosensor, ya
que tanto la bioactividad de Gox como la estabilidad de la película PB son pH-
dependientes, se procedió al estudio de la respuesta del microbiosensor a distintos pH.
De esta forma, se procedió a estudiar la respuesta del biosensor optimizado
(CFE/PB/PEI5%/Goxopt/PoPD) en un rango de pH de 6.5 a 8.5. Finalmente, los
resultados no mostraron cambios significativos en la respuesta frente a glucosa,
confirmando así la excelente estabilidad del dispositivo y que la Gox y el PB están bien
estabilizados en la superficie del microelectrodo de carbono. Las ventajas del presente
diseño son: (1) el PEI y el glutaraldehido, son capaces de reducir los posibles cambios
conformacionales de la enzima, puesto que la estructura terciaria y cuaternaria de la
enzima no se pueden modificar; (2) la película POPD puede, y ha sido demostrado por
el grupo de Karyakin, aumentar la estabilidad del PB.
A fin de demostrar la utilidad de este diseño, se evaluó su respuesta in vivo frente
a cambios en los niveles de glucosa extracelular. Para ello, se examinó el efecto que
producía en su respuesta la inyección local de glucosa (2mM en PBS, 100 mM de NaCl)
y la despolarización con KCl (150 mM en PBS, 100 mM de NaCl). La inyección
localizada se realizó mediante el uso de una microcánula colocada en las cercanías del
microbiosensor (50-100 µm) liberando un pequeño volumen de glucosa o KCl (0.1-5
µL).

112
La inyección de glucosa confirmó la respuesta del microbiosensor en el SNC,
observándose un incremento de la señal durante la inyección de glucosa, que
posteriormente disminuye y alcanza la línea base inicial al cabo de unos segundos. Esta
disminución posterior puede ser atribuida tanto a un fenómeno de dilución como a
captación celular de la misma. Por otro lado, la inyección de KCl produjo un
incremento de los niveles de glucosa. Dicho comportamiento podría ser explicado por
una activación neuronal y su inmediata respuesta: liberación de glucosa hacia el
intersticio desde los vasos sanguíneos circundantes que suplirían los costes energéticos
de dicha activación. A su vez, la inyección de 5 µL de KCl mostró el comportamiento
típico del spreading depresion (SD), donde se observa un proceso de máximo consumo, 1
minuto después de finalizar la inyección, que poco a poco recupera los niveles basales
iniciales, estableciéndose nuevamente un balance entre el suministro y consumo.
6.3.- Aplicaciones fisiológicas de microbiosensores sensibles a glucosa basados en
microelectrodos de carbonos modificados con PB
113
Extraído de:
Salazar P, O'Neill RD, Martín M, Roche R, González Mora JL. Amperometric glucose microbiosensor based on a Prussian Blue modified carbon fiber electrode for physiological applications. Sensors and Actuators B-Chemical 152 (2011) 137-143.
Índice de impacto: 3.751 (5 últimos años)
En este tercer trabajo los principales pasos de construcción del microbiosensor
sensible a glucosa han sido examinados en detalle mediante CV y EIS. A su vez, se ha
hecho un estudio detallado de la selectividad del microbiosensor optimizado frente a
un gran número de posibles interferentes fisiológicos. Finalmente, la respuesta del
microbiosensor fue analizada durante modificación farmacológica, inyección
intraperitoneal y local, así como mediante estimulación eléctrica local, demostrándose
la utilidad del presente diseño en experimentos fisiológicos.

114
En esta ocasión el proceso de modificación se cambió ligeramente con respecto a
las publicaciones anteriores. La disolución electrolítica empleada durante la
electrodeposición del PB fue más ácida (0.1 M KCl y HCl 0.1 M) con el fin de mejorar la
estabilidad del PB. A su vez, el protocolo de deposición enzimática también fue
modificado con el objeto de optimizar la configuración anterior. El protocolo seguido
ha sido: (1) 15 inmersiones rápidas en una disolución Nafion y un período de secado
de 30 minutos; (2) 15 inmersiones rápidas en una disolución de PEI y un período de
secado (30 min); (3) inmersión en Gox (300 U/ml) durante 5 minutos y un período de
secado (5 min); (4) 30 inmersiones rápidas en la solución de Gox y secado durante 5
minutos; (5) 15 inmersiones rápidas en la solución entrecruzamiento (BSA/GLUT).
Posteriormente, todos los biosensores se curaron durante 1 hora a 37 ºC y finalmente se
electrodepositó una capa de PoPD/BSA sobre cada biosensor.
Mediante el empleo de la CV se ha estudiado como cambia la respuesta del CFE
durante las diferentes etapas de construcción, confirmándose así las modificaciones
que va sufriendo la superficie del microelectrodo. Para ello se ha usado un barrido de
potencial desde -0.2 a +0.4 V (0.1 V/s). Congruentemente, el barrido del CFE sin
modificar presentó una respuesta mínima, puesto que la disolución de trabajo no
contenía ningún par redox. Sin embargo, después de la electrodeposición de PB sí que
aparece la curva característica para el par redox PW/PB, confirmándose así la
existencia de dicho compuesto sobre la superficie del electrodo. Posteriormente, los
cambios en el CV de los electrodos se pueden explicar debido a dos procesos
claramente diferenciados: electrostáticos y difusivos, dado que durante la inter-
conversión PW/PB es necesario el transporte de K+ o cualquier otro catión a través de
su estructura. Es por ello que, los polímeros con carga neta negativa facilitan la
reversibilidad de dicha conversión (Nafion), mientras que, los polímeros catiónicos
(PEI) ofrecen cierta resistencia al transporte de estos cationes a través de su estructura.
115
Por último, la electrodeposición de PoPD sobre la superficie del microbiosensor mostró
una reducción importante del CV, que justifica la disminución de sensibilidad
encontrada en las anteriores publicaciones tras la electrodeposición de la misma.
Por otro lado, la EIS es un método eficaz para estudiar las propiedades
interfaciales durante la modificación de superficies conductoras. En este caso, se usó el
par redox ferro/ferricianuro (ambos cargados negativamente). El espectro de
impedancia para el CFE mostró un proceso limitado por transferencia de carga en el
rango de frecuencias estudiado. Sin embargo, la configuración CFE/PB mostró
también la componente difusiva (tramo lineal) y redujo considerablemente la
resistencia eléctrica de la superficie sensora (disminución del diámetro del tramo
circular) del proceso de oxido/reducción del par redox empleado. Estos datos indican
que el PB mejora las propiedades conductoras favoreciendo los procesos de
transferencia de electrones. Así mismo, las sucesivas modificaciones presentaron
pequeños cambios en el tamaño de la región semicircular, que pueden ser atribuidas a
la facilidad o dificultad con la que ocurren los procesos de transferencia de carga entre
la superficie del electrodo y el par ferro/ferricianuro. Por último, la electrodeposición
de PoPD produjo un incremento significativo de la resistencia (gran incremento del
diámetro de la región semicircular), que puede deberse a su naturaleza no conductora
en las condiciones de síntesis.
Para verificar las propiedades antiinterferentes del presente diseño, se evaluó la
respuesta del microbiosensor frente a un gran número de potenciales interferentes (15
en total). Los valores de selectividad obtenidos para todas las interferencias fueron <
0,15% excepto para AA (1,6%) que está presente en el cerebro extracelular líquido a una
concentración superior (0.4 mM).

116
Finalmente, se procedió a la evaluación in vivo del diseño propuesto. Para ello se
recurrió nuevamente a la inyección local de KCl y glucosa, mostrando un
comportamiento similar al descrito en las publicaciones anteriores. Adicionalmente, se
realizó la administración farmacológica de insulina (administración intraperitoneal).
Previamente al experimento, a los animales de experimentación se les retiró la comida
(ayuno de 12 h) para disminuir sus niveles de glucógeno. Una vez que el
microbiosensor fue insertado se esperó aproximadamente 1 h para alcanzar los niveles
basales y posteriormente se procedió a la administración de insulina (20 U/kg). Entre
15-20 minutos después de la inyección se observó un descenso de los niveles de
glucosa extracelular que redujo aproximadamente un 70-80% los niveles basales.
Posteriormente, los niveles de glucosa fueron incrementados mediante la inyección de
glucosa intraperitonealmente (1 g/Kg). La respuesta del biosensor luego de la
inyección de glucosa aumentó rápidamente 10 minutos después de la inyección,
alcanzando casi el 80% del nivel basal a los 30 minutos siguientes. Sin embargo, no se
alcanzaron los niveles basales preinsulina, probablemente debido a la influencia
duradera de esta hormona en el organismo.
Adicionalmente, se realizó estimulación eléctrica local, mediante un estimulador
bipolar que se posicionó en las proximidades del microbiosensor. La estimulación
consistió en una secuencia de pulsos cuadrados que se aplicaron tanto al
microbiosensor de glucosa como a un electrodo centinela (sin Gox). Bajo las
condiciones de estudio se observó que la estimulación producía inmediatamente una
señal típica SD (comentado anteriormente). No obstante, posterior a la estimulación
eléctrica, se observó, una rápida caída de los niveles de glucosa (que se podría atribuir
a un consumo por las neuronas excitadas) y luego, se observó, un incremento de la

117
glucosa extracelular (probablemente debido a un aporte vascular). Por otro lado, la
estimulación con los microelectrodos empleados como centinela no presentaron dicha
respuesta, hecho que confirma que la respuesta observada anteriormente es debida
exclusivamente a cambios de glucosa en el intersticio.
118
6.4.- Electrodeposición de PB sobre electrodos de carbono mediada por surfactantes:
mejoras en la estabilidad, en las propiedades electroquímicas y aplicación en
microbiosensores sensibles a lactato
Extraído de:
Salazar P, Martín M, O'Neill RD, Roche R, González Mora JL. Surfactant-promoted Prussian Blue-modified carbon electrodes: Enhancement of electro-deposition step, stabilization, electrochemical properties and application to lactate microbiosensors for the neurosciences. Colloids and Surfaces B 92 (2012) 180-189.
Índice de impacto: 3.354 (5 últimos años)
En las últimas décadas el PB, el compuesto más representativo de la familia de
los hexacianometalatos, ha recibido mucha atención, debido principalmente, a las
propiedades electrocatalíticas de su forma reducida (PW) en la reducción de H2O2.
Generalmente, su electrodeposición se ha realizado mediante CV en condiciones
ácidas. Sin embargo, la adición de surfactantes como el bromuro de cetiltrimetilamonio

119
(CTAB), ha producido una mejora considerable en el crecimiento del depósito, en su
estabilidad y en la eficiencia de transferencia de carga.
En la presente publicación se compara el efecto de diferentes tensioactivos
catiónicos como: CTAB, cloruro de bencetonio (BZTC) y cloruro de cetilpiridinio
(CPC). En la primera etapa del estudio se han empleado electrodos serigrafiados
(SPCE) debido a su alta reproducibilidad, bajo costo y configuración conveniente en
comparación con los electrodos de fibra de carbono (CFE) que se necesitan para la
implantación in vivo.
La electrodeposición de PB sobre SPCEs se realizó colocando una gota de
disolución precursora modificada previamente con surfactante (1 mM) y se procedió al
ciclado entre -0.2 y +1 V (0.1 V/s). Análogamente, se prepararon electrodos
modificados con PB en ausencia de surfactante para comparar el efecto de los mismos.
Una vez preparados, las propiedades electroquímicas de los distintos diseños fueron
investigadas, prestando especial atención a parámetros tales como: cantidad de PB
depositado, espesor de la película, transferencia de carga, permeabilidad,
reversibilidad, estabilidad y sensibilidad a la detección de H2O2.
Todos los electrodos modificados en presencia de surfactantes presentaron una
mejora significativa en sus propiedades electroquímicas en comparación con los SPCE
modificados en ausencia de ellos. Así, la cantidad depositada de PB en presencia de
surfactantes alcanzó un valor de ~ 2.05 × 10⁻⁸ moles cm-2, mientras que en su ausencia
tuvo un valor de 7.25 × 10⁻⁹ mol cm-2. En consecuencia, las películas modificadas en
presencia de surfactantes alcanzaron un espesor de ~ 33 nm, mientras que en su
ausencia fue tan solo de ~ 12 nm. Dichos resultados indicaron que la electrodeposición
de PB es más eficiente en presencia de surfactantes catiónicos.

120
Estudios análogos realizados mediante SEM mostraron una electrodeposición
más eficiente en presencia de surfactante. Para ello, se electrodepositó el PB sobre
platino, con el fin de tener una mejor superficie de partida. En este caso, se aplicaron
aproximadamente 100 ciclos de deposición, con el fin de obtener una buena imagen en
SEM, ya que se comprobó que con pocos ciclos la película de PB era demasiado fina
para ser observada en detalle. Mientras que en ausencia de surfactantes, se observaron
huecos (pin-holes) sobre el platino, mostrando zonas donde no se había producido la
electrodeposición del PB, el depósito, en presencia de surfactantes, mostró un
espectacular crecimiento cristalino, presentando un crecimiento columnar de
estructuras cúbicas. Finalmente, dichas imágenes corroboraron los datos anteriores,
donde se observaba una mayor electrodeposición de PB en presencia de surfactante.
La permeabilidad del depósito de PB para el K+, fue 8.24 × 10⁻¹² cm2 s-1, mientras
que para el PB depositado en presencia de surfactantes fue casi un orden de magnitud,
mayor, mostrando la configuración PB-CTAB las mejores propiedades difusivas 8,53 ×
10-11 cm2 s-1. Por otra parte, el coeficiente de difusión para iones más voluminosos como
el Na+ fue mejorado significativamente, comprobándose una mejor reversibilidad para
dicho ion y atenuándose la inserción irreversible que se produce al ciclar los electrodos
en presencia de Na+. De esta forma, los sensores de PB modificados con surfactantes
recuperaron ~ 86% de la corriente inicial después de haber sido ciclados en presencia
de iones Na+, mientras que la configuración básica logro alcanzar únicamente un valor
de 40%.
El depósito obtenido en ausencia de surfactante presentó una constante de
transmisión electrónica (ks) de 1.2 s-1, estando en concordancia con los datos
encontrados en la bibliografía. Por otro lado, el valor del coeficiente de transferencia (α)
presentó un valor de 0.59, indicando que el proceso de transferencia electrónica no es

121
del todo simétrica. Curiosamente, los depósitos obtenidos en presencia de surfactante
presentaron menores valores para el parámetro ks y mayores para el parámetro α,
mostrando que los fenómenos de transferencia electrónica son más lentos y con un
grado mayor de irreversibilidad, pudiendo estar relacionada esta observación con el
grosor de la película.
Consecuentemente, se ha hecho un estudio de la sensibilidad hacia el H2O2 de las
distintas configuraciones, siendo este uno de los parámetros más importantes a tener
en cuenta para evaluar la optimización del diseño. Los resultados obtenidos estuvieron
en consonancia con otros resultados encontrados. Los sensores modificados en
presencia de surfactantes presentaron una mayor sensibilidad frente al H2O2 (0.63 A
M-1 cm-2), así como un mayor rango lineal de trabajo. Dichos resultados pueden
atribuirse tanto a la mejora en la difusión iónica a través de su estructura
tridimensional, como al incremento de la cantidad del depósito, lo que aumentaría el
número de centros redox disponibles para reducir al H2O2.
Finalmente, se procedió a la construcción de un microbiosensor sensible a lactato.
Para ello, se depositó PB aplicando 3 ciclos de deposición en presencia de BZT (1 mM)
La inmovilización enzimática se realizó de acuerdo al siguiente protocolo: 15 y 30
inmersiones rápidas en PEI y Lox, respectivamente, con un período de secado de 10
minutos entre ellas; por último se sumergieron 15 veces en glutaraldehido y se curaron
durante 4 horas a 37 ºC. Posteriormente, se procedió a la electrodeposición vía CPA de
PoPD. Finalmente, los microbiosensores se limpiaron con agua bidestilada y se
almacenaron en la nevera.
La respuesta del microbiosensor fue evaluada in vitro. De estos resultados se
desprende, al igual que en los microbiosensores sensibles a glucosa previamente

122
diseñados, la idoneidad y las excelentes propiedades del diseño, si bien, el proceso de
inmovilización debe ser adecuado para obtener un mayor rango lineal de trabajo. El
diseño actual no mostró respuesta alguna frente a la adición de AA a distintas
concentraciones, corroborando la buena elección del PoPD como capa antiinterferente.
Finalmente, la sensibilidad de los microelectrodos fue estudiada durante un período
corto (5h de medidas continuas en PBS) y en un período largo (15 días). Ambos
estudios no mostraron pérdida significativa de sensibilidad, demostrando la excelente
retención enzimática y la estabilidad de PB a pH fisiológico.

123
6.5.- Optimización y caracterización de electrodos serigrafiados de carbono
modificados con PB en presencia de surfactantes: detección de H2O2 a bajos
potenciales
Extraído de:
Salazar P, Martín M, O'Neill RD, Roche R, González Mora JL. Improvement and characterization of surfactant-modified Prussian Blue screen-printed carbon electrodes for selective H2O2 detection at low applied potentials. Journal of Electroanalytical Chemistry (2012) 674 48-56
Índice de impacto: 2.739 (5 últimos años)
El PB ha resultado ser un compuesto muy útil en la fabricación de biosensores,
amperométricos, ya que actúa como una “peroxidasa artificial”. Sin embargo, su
estabilidad operativa en medios básicos y neutros, óptimos para la mayoría de las
enzimas empleadas en la construcción de biosensores, sigue siendo un problema. La
razón de este comportamiento se atribuye a la fuerte interacción entre los iones férricos

124
e iones hidróxido para formar Fe(OH)3 a pH superior a 6.4. Para resolver este
problema, se han empleado distintas aproximaciones: (1) modificación química del
depósito, (2) protección con polímeros, (3) uso de surfactantes en la disolución de
electrodeposición.
Este último enfoque representa un método rápido y sencillo que permite mejorar:
(1) la cantidad de PB electrodepositado, (2) sus propiedades electrocatalíticas, (3) su
sensibilidad frente al H2O2, (4) su estabilidad en medios neutros y básicos.
En la presente publicación se ha optimizado la electrodeposición de PB en
presencia de BZTC. Para ello, se ha optimizado la concentración de surfactante
empleado, así como sus condiciones de electrodeposición. Los principales parámetros
estudiados en dicha optimización han sido: (1) reversibilidad, (2) cantidad de depósito
generado, (3) coeficiente de difusión para el K+, (4) estabilidad, (5) sensibilidad frente al
H2O2.
La electrodeposición de PB sobre SPCEs se realizó colocando una gota de
disolución precursora con diferentes concentraciones de surfactante (0-5 mM),
procediendo posteriormente al ciclado (CV) entre -0.2 y +1 V (0.1 V/s). Del análisis de
estos resultados se desprende que la concentración de surfactante óptima es 2mM,
probablemente, siendo esta su concentración miscelar crítica en las condiciones de
trabajo. En estas condiciones, la cantidad depositada de PB alcanzó un valor de ~ 6.3 ×
10-8 moles cm-2, mientras que en su ausencia tuvo un valor de 9.71 × 10⁻⁹ mol cm-2. En
consecuencia, las películas obtenidas en condiciones óptimas alcanzaron un espesor de
~ 122 nm, mientras que en su ausencia fue tan solo de ~ 16 nm.
El análisis estructural (SEM) reveló una clara diferencia morfológica en los
depósitos, dependiendo ésta de la concentración de surfactante empleada. Mientras

125
que el depósito de PB sintetizado en ausencia de BZTC mostró un espesor muy fino
(apreciable sólo a mayores aumentos), en condiciones óptimas el depósito de PB
mostró un excelente recubrimiento. En contraste, a una concentración elevada de
surfactante (6 mM) la electrodeposición de PB fue prácticamente inhibida,
posiblemente debido a la formación de micelas en estas condiciones.
Los datos obtenidos mediante EIS mostraron nuevamente que en presencia de
surfactante la resistencia de transferencia de carga es menor. De estos resultados se
desprende que las propiedades conductoras del depósito mejoran considerablemente,
siendo nuevamente la concentración de 2 mM la que mejor resultados presenta.
Con el fin de comparar la actividad electrocatalítica de distintas configuraciones
(0 y 2 mM de BZTC) se analizó su respuesta frente al H2O2. El análisis de la
dependencia del pico catódica frente a la velocidad de barrido y la raíz cuadrada de
velocidad de barrido sugiere un comportamiento puramente difusivo. Por otro lado,
mediante cronoamperometría, se obtuvo el coeficiente de difusión para el H2O2,
presentando ambas configuraciones un valor ~ 5.5× 10⁻⁶ cm2 s-1, valores consistentes
con los encontrados en la bibliografía. Mediante cronoamperometría también se
determinó la constante catalítica (Kcat) para dichas configuraciones, encontrándose
nuevamente que la configuración obtenida en presencia de BZTC (2mM) es la que
presenta mejores resultados.
Se volvió a estudiar la estabilidad de los sensores en presencia de iones Na+,
obteniendo resultados similares a los anteriormente publicados. Estos datos revelan
que, el daño causado por la inserción irreversible de iones Na+, una característica
indeseable para los sensores diseñados para aplicaciones biológicas, es atenuado en las
condiciones óptimas de electrodeposición encontradas.

126
Con el fin de estudiar la estabilidad de PB frente al pH, se han examinado
distintas configuraciones mediante CV. Los sensores fueron ciclados 100 veces en
disoluciones ajustadas en un amplio rango de pH. La actividad residual se calculó
utilizando la intensidad del pico anódico antes y después del ciclado. Los resultados
mostraron una baja estabilidad del depósito de PB en ausencia de surfactante, incluso
en medios ácidos, con un descenso significativo de la señal (~ 70%) a pH 7,4. Por el
contrario, la configuración optimizada, BZTC(2mM)/PB, mostró una mejor estabilidad,
conservando el 100% de la señal por debajo de pH 6, y perdiendo sólo el 10% de la
señal inicial al final de los 100 ciclos a pH 7.4.
La etapa de calibración mostró que la configuración optimizada presenta una
mayor sensibilidad (1.07 ± 0.03 A M-1 cm-2, n = 5), mejorando significativamente los
valores encontrados en la literatura para electrodos serigrafiados. El estudio de
interferencias se realizó empleando el AA como prototipo de interferente endógeno. A
su vez, se optimizó el potencial aplicado para minimizar dicha contribución. Del
análisis de resultados se concluyó que el rango óptimo de potencial se encuentra entre -
0.05 y - 0.15 V, donde la relación de selectividad es menor del 1%.
Finalmente, la estabilidad a largo plazo de los sensores modificados con PB fue
estudiada. Para ello, se comprobó la sensibilidad frente al H2O2 de distintos sensores
almacenados en seco, en la oscuridad y a temperatura ambiente. Del presente estudio
se concluyó que: al menos durante el periodo estudiado (4 meses) los sensores
retuvieron aproximadamente el 90% de su sensibilidad inicial.

128
6.6.- Desarrollo de un microbiosensor basado en fibras de carbono modificado con
PB para medir lactato en el espacio extracelular del tejido cerebral
Extraído de:
Salazar P, Martín M, O’Neill RD, Roche R, González Mora JL. Biosensors based on Prussian Blue modified carbon fibers electrodes for monitoring lactate in the extracellular space of brain tissue. International Journal of Electrochemical Sciences 7 (2012) 5910-5926.
Índice de impacto: 3.729 (2011)
En esta última publicación se ha presentado un microbiosensor sensible a lactato,
análogo a los microbiosensores de glucosa ya presentados en trabajos anteriores.
Nuevamente se ha optimizado el procedimiento de fabricación y se ha validado su
respuesta frente a algunos de los interferentes más comunes en el SNC. Finalmente, se
presentaron algunos resultados in vivo, incluyendo: estimulación farmacológica,

129
fisiológica y electrofisiológicas, que demostraron que el presente diseño es adecuado
para explorar el papel del lactato en el SNC.
La electrodeposición del PB se ha realizado de forma análoga a las anteriores
publicaciones. La caracterización electrocrómica de PB (CV, EIS, FTIR y Vis-UV) ha
coincidido con los datos presentados anteriormente. Adicionalmente, en esta
publicación, se ha estudiado cómo afecta la estabilización térmica en dichas
propiedades. Los datos obtenidos mediante CV muestran una progresiva disminución
de los picos de oxidación/reducción y una importante pérdida de actividad
electroquímica a 200 ºC. Los espectros FTIR y absorbancia (Vis-UV) reproducen la
característica banda a 2067 cm-1 (vibración del enlace Fe-CN) y la banda de absorción a
672 nm (transferencia de carga entre Fe3+ a Fe2 +), respectivamente. Por otro lado, en el
espectro FTIR se observó una banda ancha en las altas frecuencias (~ 3000 cm-1) debida
a las tensiones del enlace OH del agua. Esta última banda fue reducida mediante el
tratamiento térmico, si bien la banda a 2067 cm-1 también disminuyó y desapareció a
200 ºC. El espectro Vis-UV mostró un comportamiento similar al discutido
anteriormente, aunque a 200 ºC mostró una banda entre 300 y 400 nm, que corresponde
a la región de longitud de onda de Fe2O3, indicando que el tratamiento térmico a altas
temperaturas produce la oxidación del PB a óxidos de hierro. En vista de estos
resultados, la temperatura de 100 ° C fue seleccionada como temperatura óptima.
Siguiendo los protocolos ya descritos anteriormente se procedió a la construcción
del microbiosensor sensible a lactato, fijando por defecto el número de inmersiones
rápidas en la disolución enzimática en 30. El primer parámetro investigado fue la
concentración enzimática, construyéndose varios microbiosensores con diferentes
concentraciones de Lox (25, 50 y 100 U ml-1). Las curvas de calibración de estos
biosensores muestran que la concentración de 100 U ml-1 presenta los mejores
130
resultados con una Vmax 15 veces mayor que la concentración más baja, siendo dicha
concentración, el valor seleccionado para el resto de la investigación.
El siguiente paso en la optimización fue estudiar cómo afecta el PEI
(polielectrolito catiónico) en la carga de enzimática. En este contexto, se determinó la
concentración óptima de PEI y en cómo afectaba el contenido de agua en la carga
enzimática. En respuesta a la primera pregunta, se construyeron varias configuraciones
usando distintas disoluciones de PEI en agua (1, 2.5 y 5% w/v). Los resultados
mostraron que tanto la concentración de 2.5 como la de 5 % w/v duplicaban la carga
enzimática respecto a la obtenida con la concentración de 1% w/v. Finalmente la
concentración de 2.5% w/v PEI fue seleccionada para posteriores estudios. Hasta este
momento, se había trabajado con un período de secado de 5 minutos entre las
disoluciones de PEI y las de Lox. Con el fin de estudiar como afectaba este parámetro
en la carga enzimática, se elaboraron diferentes electrodos, empleando distintos
tiempos de secado. Los resultados sugieren que al aumentar el tiempo de secado se
consigue una mayor carga enzimática, presentando la configuración con 15 minutos de
secado una carga enzimática aproximadamente 3 veces mayor que para la
configuración en donde se ha sumergido el microelectrodo seguidamente en la
disolución enzimática (t= 0). En base a estos resultados, el tiempo de secado se
aumentó a 15 minutos en los estudios posteriores.
El último paso en la construcción del microbiosensor fue la electrodeposición de
una PoPD en su superficie para mejorar la selectividad y la compatibilidad biológica
del dispositivo. Los primeros resultados mostraron una pérdida significativa de
sensibilidad (~ 60%) que se puede atribuir a varios factores tales como: la desactivación
enzimática, la formación de una barrera difusiva en superficie, etc. Dicha configuración
presentó una sensibilidad de ~ 42 nA mM-1 cm-2, un rango lineal próximo a 0,6 mM, y

131
un límite de detección de ~ 6 µM (S/N = 3). Teniendo en cuenta que la concentración
en el SNC de lactato es de ~ 0,4 mM y que, durante la activación neuronal, los cambios
registrados pueden alcanzar ~ 200% de su concentración basal (~ 0,7 mM), esta
configuración presenta una excelente sensibilidad, pero el rango lineal está bastante
ajustado para su uso en aplicaciones fisiológicas.
Finalmente, se aumentó el rango lineal de la configuración anterior mediante la
adición de una capa externa de Nafion. El protocolo consistió en realizar tres
inmersiones en una disolución alcohólica de Nafion (5%). Un número mayor de
inmersiones produjo la pérdida total de sensibilidad del microelectrodo,
principalmente, debido a las repulsiones electrostáticas entre los aniones lactato y los
grupos sulfonatos del dicho polímero. En esta configuración la sensibilidad fue inferior
~ 12 nA mM-1 cm-2, sin embargo, se logró obtener un límite de detección (~20 µM)
aceptable y un rango lineal más apropiado para los estudios fisiológicos (~ 1.2 mM).
Otros dos parámetros importantes a tener en cuenta en el diseño de sensores
electroquímicos para aplicaciones in vivo son: estabilidad frente a la floculación de
proteínas en su superficie y respuesta frente a distintos interferentes endógenos. Para
responder a la primera cuestión, se sumergieron diferentes biosensores con y sin PoPD
durante 18 horas en una disolución de BSA y se comprobó su sensibilidad frente al
lactato antes y después. En vista de los resultados se concluyó que ambas
configuraciones eran óptimas para su uso en el SNC. Por otro lado, en el estudio con
distintos interferentes, la configuración sin PoPD, no mostró respuesta para la mayoría
de interferentes (resultado del bajo potencial aplicado para detectar H2O2). Sin
embargo, la adición de AA a la concentración basal (0.2 mM) si produjo una respuesta
clara, lo que puso de manifiesto la necesidad de añadir PoPD a la configuración
definitiva. Finalmente, el microbiosensor de lactato optimizado, con un capa externa
132
POPD/Naf, superó el test de interferencias, concluyendo así el proceso de
optimización y fabricación del microbiosensor.
Una vez finalizada la etapa de optimización, el siguiente paso fue estudiar la
respuesta del microbiosensor en experimentos in vivo en el SNC. Para ello, se trabajó
con ratas Sprague Dawley macho anestesiadas. Bajo estas condiciones, y con los
microelectrodos de lactato previamente calibrados, se obtuvo una concentración basal
de 0.36 ± 0.02 mM (media ± DE, n = 5), valor acorde al encontrado en la bibliografía.
Los estudios farmacológicos y la estimulación eléctrica local mostraron cambios
evidentes en la concentración de lactato en el intersticio, coincidiendo con otros datos
publicados en la literatura. Finalmente, se procedió al estudio simultáneo de los niveles
de lactato y O2 bajo estimulación electrofisiológica. Los resultados muestran un
consumo de lactato inicial y un aporte posterior a la estimulación, mientras que el O2
descendió ligeramente después de la estimulación. Teniendo en cuenta estos
resultados, todo parece indicar que el lactato podría ser sintetizado y/o exportado al
compartimento extracelular no solo en condiciones anóxicas severas, sino también,
podría ser usado como sustrato energético durante los procesos de activación neuronal
en condiciones fisiológicas normales.

133
CONCLUSIONES
7.-Conclusiones
En la presente memoria de tesis doctoral se han desarrollado microbiosensores
orientados a cuantificar las concentraciones de glucosa y lactato en el espacio
extracelular del sistema nervioso central de animales de experimentación. A su vez,
durante el desarrollo de dichos microbiosensores, se ha realizado un estudio
metodológico de las modificaciones previas con Azul de Prusia y de los protocolos de
inmovilización enzimática.

134
A modo de resumen podemos citar las siguientes conclusiones:
1) Se ha desarrollado y demostrado la idoneidad de microelectrodos de fibra de
carbono de pequeñas dimensiones (Φ ~ 10 µm) modificados previamente con Azul de
Prusia para detectar H2O2 a bajo potencial, lo cual permite disminuir los artefactos y la
excitación neuronal derivada de aplicar elevados potenciales de trabajo.
2) Se ha estudiado y optimizado las condiciones de electrodeposición del Azul de
Prusia. Los resultados mostraron que el potencial óptimo para detectar H2O2 se
encuentran en el rango de +0.1 a -0.2 V frente SCE, obteniéndose una sensibilidad y un
límite de detección de 1.00 ± 0.04 A M−1 cm−2 y 1 10 nM respectivamente. También se
han utilizado distintos polímeros para mejorar la estabilidad y selectividad del
microsensor para H2O2, encontrando idóneo para tales fines el empleo de la poli-o-
fenilendiamina.
3) Se ha demostrado el efecto beneficioso del empleo de distintos surfactantes como
el bromuro de cetiltrimetilamonio (CTAB), el cloruro de bencetonio (BZTC) y el cloruro
de cetilpiridinio (CPC) durante la electrodeposición de Azul de Prusia sobre tarjetas
serigrafiadas. Produciendo una mejora considerable en el crecimiento del depósito, así
como en la estabilidad, permeabilidad y eficiencia de transferencia de carga.
Finalmente, la sensibilidad frente al H2O2 ha mejorado significativamente los valores
encontrados en la literatura para configuraciones análogas.
4) Se han desarrollado protocolos de modificación y optimización para la
construcción de microbiosensores amperométricos enzimáticos de primera generación
para medir glucosa y lactato. El estudio concienzudo de cada una de las variables de
construcción (materiales de partida, protocolos de modificación, etc.) ha permitido
desarrollar microbiosensores con la sensibilidad, selectividad, tiempo de respuesta,
rango lineal y límite de detección adecuados para trabajar en el SNC.
5) Se ha demostrado la utilidad de los microbiosensores de glucosa y lactato
elaborados mediante evaluación de la respuesta in vivo en animales de

135
experimentación. Obteniéndose concentraciones basales para glucosa y lactato de 1.2 y
0.4 mM respectivamente, valores ampliamente recogidos en la bibliografía. Además, se
comprobó la respuesta de dichos microbioensores frente a cambios en los niveles
basales de glucosa y lactato mediante estimulación eléctrica local, inyección
farmacológica local e intraperitoneal, administración de gases, etc.
6) Se ha resuelto el problema de la limitación estequiométrica derivada de las bajas
concentraciones de oxígeno en el SNC (déficit de oxígeno) mediante el empleo de
polímeros fluorocarbonados (Nafion, H700). De esta forma, se han obtenido
microbiosensores de glucosa con mayor sensibilidad y un rango de trabajo óptimo para
estudios fisiológicos (ver anexo II: otras publicaciones).
7) Se han realizado medidas simultáneas de la respuesta hemodinámica (flujo local
sanguíneo) y de los niveles de glucosa extracelular frente a estimulación eléctrica local.
El presente diseño permitió optimizar el espacio de trabajo en la ventana craneal y el
estudio simultáneo de ambas variables. Los resultados mostraron una correlación
positiva (R2 ~ 0.94) entre el flujo y la concentración extracelular de glucosa en el
intersticio, pese a que se registró un ligero desacoplamiento entre ambas variables (ver
anexo II: otras publicaciones).
8) En base a los resultados obtenidos concluimos que los microbiosensores de
glucosa y lactato desarrollados y descritos en la presente memoria son adecuados para
su uso en estudios neurometabólicos en el SNC de animales de experimentación.

136
TRABAJOS FUTUROS
8.- Trabajos futuros
Durante el desarrollo de la presente tesis, y especialmente durante esta última
etapa he podido ampliar mis conocimientos en el área de los biosensores trabajando
con nuevas enzimas (glutamato oxidasa, peroxidasas) y materiales (nanotubos de carbono,
nanopartículas, nanopartículas magnéticas, anticuerpos). A su vez, he podido interactuar
con otros grupos de investigación nacionales e internacionales. En el panorama actual

137
tenemos que promover la conexión con otros grupos de biosensores, especialmente
cuando en Canarias no existen grupos de investigación importantes en dicha área.
El ámbito de la Biotecnología y la Biomédica ofrecen una gran diversidad de
aplicaciones en el ámbito de los biosensores como herramienta de diagnóstico, de
control de procesos y calidad, así como en estudios de modelos animales. Una vez
terminada esta etapa, solo espero poder continuar en la investigación, desarrollo y
aplicación de biosensores, ya sea en el sector público o en el privado, entendiendo
necesaria la estrecha colaboración entre ambos sectores para hacer sostenible la
investigación y el desarrollo tecnológico en Canarias.

138
ANEXOS
9.-Anexo I: Publicaciones

Author's personal copy
Electrochimica Acta 55 (2010) 6476–6484
Contents lists available at ScienceDirect
Electrochimica Acta
journa l homepage: www.e lsev ier .com/ locate /e lec tac ta
Prussian Blue-modified microelectrodes for selective transduction inenzyme-based amperometric microbiosensors for in vivo neurochemicalmonitoring
P. Salazara,∗, M. Martína, R. Rochea, R.D. O’Neill b, J.L. González-Moraa
a Neurochemistry and Neuroimaging Group, Faculty of Medicine, University of La Laguna, La Laguna, Tenerife, Spainb UCD School of Chemistry and Chemical Biology, University College Dublin, Belfield, Dublin 4, Ireland
a r t i c l e i n f o
Article history:Received 12 March 2010Received in revised form 8 June 2010Accepted 12 June 2010Available online 19 June 2010
Keywords:Carbon fiber electrodesHydrogen peroxidePrussian BluePoly(o-phenylenediamine)Biosensor
a b s t r a c t
Prussian Blue-modified carbon fiber microelectrodes (CFE/PBs) are proposed as an alternative to themore conventional metal transducers used for H2O2-detecting biosensors in brain extracellular fluid(ECF). The main advantages of this approach are the very small dimensions (∼10 m diameter) and thelow applied potentials needed (0.0 V versus SCE). Electrocatalytic and physiochemical properties of PBdeposits were studied using cyclic voltammetric (CV), amperometric and spectroscopic methods (FTIRand VIS). Optimized CFE/PB microsensors displayed a H2O2 current density of 1.00 ± 0.04 A M−1 cm−2
with a detection limit of 10−8 M. Furthermore, to improve stability and selectivity properties, severalpolymeric films were investigated: Nafion, poly(o-phenylenediamine) (PoPD), and a hybrid configurationof these two polymers. Finally, the PoPD film was selected due to its excellent anti-interference prop-erties. The use of this permselective film also enhanced the stability of PB against solubilization at highpH, albeit at the expense of slightly lower H2O2 sensitivity (0.48 ± 0.02 A M−1 cm−2) and higher detectionlimit (∼10−7 M). However, the use of the PoPD film significantly enhanced the selectivity against the mainendogenous brain interference species (ascorbic acid, uric acid, dopamine and 3,4-dihydroxyphenylaceticacid), expressed as the ratio of the sensitivity slopes (SH2O2 /Sinterference), which was close to 600 for all inter-ference molecules studied. A prototype of a CFE/PB-based glucose microbiosensor design is presented,together with preliminary studies of its characteristics in vitro and its functionality in brain ECF in vivo.
© 2010 Elsevier Ltd. All rights reserved.
1. Introduction
1.1. Prussian Blue
Prussian Blue (PB), Fe4[Fe(CN)6]3, belongs to a transition metalhexacyanometallate family [1] and is the oldest coordination com-pound known and used [2]. Electrochemical properties of PB filmsare known since 1978 when Neff [3] reported the successful depo-sition of a thin layer on a platinum foil. A large number of studiesfollowed, and different methods for the preparation of PB-modifiedelectrodes have been described [4–7]. In 1984, Itaya et al. [8]showed that the reduced form of PB (Prussian White, PW) displayedcatalytic activity for the reduction of O2 and H2O2. The zeolite struc-ture of PB, with a cubic unit cell of 1.02 nm and channel diametersof about 0.32 nm [9], allows the diffusion of low molecular weightmolecules (such as O2 and H2O2) through the crystal structure.
∗ Corresponding author at: School of Medicine, University of La Laguna, Depart-ment of Physiology, Campus Ciencias de La Salud, 38071 La Laguna, Tenerife, Spain.Tel.: +34 922 319363.
E-mail address: [email protected] (P. Salazar).
Nowadays its electrochemical behavior is well-understood withcyclic voltammograms of PB-modified electrode showing two pairsof almost reversible and symmetrical peaks [10]. The first peak paircorresponds to the interconversion of PW and PB forms, and thesecond pair from PB to Prussian Green (PG) and its reversal. Theelectron transfer reactions in the presence of potassium chlorideas supporting electrolyte may be formulated as follows:
(PB) Fe(III)4[Fe(II)(CN)6]3 + 4e− + 4K+
→ (PW) K4Fe(II)4[Fe(II)(CN)6]3 (1)
(PB) Fe(III)4[Fe(II)(CN)6]3 + 3Cl−
→ (PG) Fe(III)4[Fe(III)(CN)6]3Cl3 + 3e− (2)
corresponding to peaks at 0.1 V and 0.9 V versus SCE, respectively[11–13].
Electrochemical properties such as formal electrode potential,sensitivity, stability and electron transfer rate constants of thePB/PW and PB/PG conversions depend on deposition method, pH,nature and concentration of the supporting electrolyte, etc. [14,15].
0013-4686/$ – see front matter © 2010 Elsevier Ltd. All rights reserved.doi:10.1016/j.electacta.2010.06.036
139

Author's personal copy
P. Salazar et al. / Electrochimica Acta 55 (2010) 6476–6484 6477
As can be seen in Eqs. (1) and (2), these reduction and oxidationreactions are supported by free diffusion of cationic and anionicspecies, respectively. In the present work we focus on the firstpeak (conversion from PB to PW). Due to this mechanism, onlycations with small hydrated radii, such as K+, NH4
+, Rb+ and Cs+,can support this electrochemical activity by diffusing across thePB structure during iron center oxidation/reduction. On the otherhand, Na+, Li+, Mg2+, Ca2+ can be described as blocking cations ofthe PB film, due to their larger hydrated radii inhibiting the freediffusion referred to above [1,16,17].
The principal handicap of PB is related to its high solubility atneutral and basic pH, although in acid conditions it shows goodsensitivity and stability [18,19]. Different pH stability studies indi-cate that PB films can be made more stable in basic media bychanging the deposition procedure, thus modifying slightly PBthree-dimensional structure and avoiding OH− diffusion acrossthe crystal [20,21]. However, a more practical approach has beenthe use of protective polymer films deposited over PB to enhanceboth its operational stability and selectivity against electroactivespecies. Several polymers have been used, such as Nafion, polypyr-role, polyaniline and poly(o-phenylenediamine) [10,17,22]. Thesefilms partially block access of interference through different mech-anisms (e.g., size and/or charge exclusion). Recently, Lukachova etal. have described a PoPD-coated, PB-modified macrodisk electrodewith moderate hydrogen peroxide sensitivity of 0.3 A M−1 cm−2,high selectivity ratio (∼600) against ascorbic acid (main endoge-nous interference in physiological media), and high stability undercontinuous flow of 0.1 mM H2O2 (almost total retained sensitivityafter 20 h) [22].
1.2. Prussian Blue-modified biosensors
Although the birth of biosensors occurred in the early 1960s[23], when Clark and Lyons coupled an enzyme (glucose oxidase,Gox) to an amperometric electrode for detecting O2, and PB elec-trochemical properties have been known since the late 1970s, thefirst work on biosensors involving the use of a PB-modified elec-trode was not reported until 1994 [24–26]. In these first reports,the authors proposed the use of PB-modified electrodes as analternative to the traditional Pt transducer used to detect H2O2.During the last decade, a great number of studies involving PB haveappeared using different biosensor configurations (carbon paste,screen-printing, glassy carbon, etc. substrates) and different oxi-dase enzymes (glucose oxidase, lactate oxidase, glutamate oxidase,etc.) [27–29].
On the other hand, in the neuroscience field traditional first-generation biosensors based on noble metal transducers [30], andsecond-generation biosensors based on artificial redox mediators,have been generally used [31]. Thus, the main purpose of thepresent work is to present CFE/PBs as an alternative for implantablemicrobiosensor designs.CFE/PBs were characterized, optimized,coated with permselective polymers, and a range of endogenousinterferences in brain ECF (ascorbic acid, uric acid, dopamine, and3,4-dihydroxyphenylacetic acid) tested. In addition, a prototype ofa CFE/PB-based glucose microbiosensor is presented, together withpreliminary studies of its characteristics in vitro and its responsive-ness in brain ECF in vivo.
2. Experimental
2.1. Reagents and solutions
The enzyme glucose oxidase (Gox) from Aspergillus niger (EC1.1.3.4, type VII–S, lyophilized powder), glutaraldehyde (Glut, 25%solution) were obtained from Sigma Chemical Co., and stored
at−21 C until used. All chemicals, including o-phenylenediamine(o-PD), polyethyleneimine (PEI), NaCl, KCl, CaCl2, MgCl2, FeCl3,K3[Fe(CN)6], HCl (35%, w/w), H2O2 (30%, w/v), Nafion (5 wt.% ina mixture of lower aliphatic alcohols and water), bovine serumalbumin (BSA, fraction V), glucose and phosphate buffer saline(PBS, pH 7.4 containing 0.1 M NaCl) were obtained from Sigma andused as supplied. Endogenous interference species were obtainedfrom Aldrich (ascorbic acid, AA, and 3,4-dihydroxyphenylaceticacid, DOPAC) and Sigma (dopamine, DA, and uric acid, UA). Allsolutions were prepared in doubly distilled water (18.2 M cm,Millipore-Q). The stock calibration solution of H2O2 (10 mM) wasprepared in water just before its use. Stock solutions of glucose (1and 0.25 M) were prepared in water, left for 24 h at room tempera-ture to allow equilibration of the anomers, and then stored at 4 C.300 mM of o-PD monomer solution was prepared using 48.6 mgof o-PD and 7.5 mg of BSA in 1.5 ml of N2-saturated PBS, and soni-cated for 15 min. Carbon fibers (7 m diameter) were obtained fromGoodfellow, glass capillaries from Word Precision Instruments Inc.,250 m internal diameter Teflon-coated copper wire from RS, andsilver epoxy paint was supplied by Sigma. An in-house microinjec-tion cannula was constructed using fused silica capillary (75 minner diameter) supplied by Composite Metal Service, Hallow, UK.
2.2. Instrumentation and software
Experiments were computer controlled, using data acquisitionsoftware EChemTM for cyclic voltammetry and ChartTM for con-stant potential amperometry. The data acquisition system used wase-Corder 401 (EDAQ) and a low-noise and high-sensitivity poten-tiostat, Picostat (EDAQ). To electro-deposit and activate PB film,an in-house Ag/AgCl/saturated KCl reference and platinum wireauxiliary electrode were used. Transmittance spectra of PB filmswere recorded in the range 300–1000 nm with respect to air in aTranspec® photodiode array spectrophotometer. FTIR spectra wererecorded with respect to air, using a Varian 670-IR spectropho-tometer in the range 4000–400 cm−1.
The electrochemical characterization experiments, H2O2 andglucose calibrations were done in a 25 mL glass cell at 21 C, usinga standard three-electrode setup with a commercial saturatedcalomel electrode, SCE (CRISON Instrument S.A.), as the referenceand platinum wire as the auxiliary electrode. The applied poten-tial for amperometric studies was 0.0 V versus SCE, unless statedotherwise. H2O2 and glucose calibrations were performed in qui-escent air-saturated PBS (following stabilization of the backgroundcurrent for 20–30 min) by adding aliquots of H2O2 or glucose stocksolution. After each addition, the solutions were stirred for 10 s andthen left to reach the quiescent steady-state current.
2.3. Preparation of the working electrodes
2.3.1. Fabrication of carbon fiber electrodesCFEs were constructed using the following steps. Carbon fibers
(diameter 7 m, 20–50 mm in length) were attached to Teflon-coated copper wire (diameter 250 m), using high purity silverpaint, and dried for 1 h at 80 C. The borosilicate glass capillary waspulled to a tip using a vertical microelectrode puller (Needle/Pipettepuller, Model 750, David Kopf Instruments). After drying, the car-bon fiber was carefully inserted into the pulled glass capillary tubeunder a microscope, leaving 2–4 mm of the carbon fiber protrud-ing at the pulled end. Subsequently, the carbon fiber was cut tothe desired length (approximately 250 or 500 m), using a micro-surgical scalpel. At the stem end of the capillary tube, the copperwire was fixed by casting with non-conducting epoxy glue; thecarbon fiber was also sealed into the capillary mouth, using thenon-conductive epoxy glue. Finally, CFEs were dried again for 1 h,and were optically and electrochemically inspected before use.
140

Author's personal copy
6478 P. Salazar et al. / Electrochimica Acta 55 (2010) 6476–6484
2.3.2. PB deposition onto carbon fiber electrodesCFEs were modified by means of electro-deposition and acti-
vation of a PB film. The PB layer was electro-deposited using cyclicvoltammetric (CV) methodology, applying 3 cyclic scans within thelimits of −0.2 to 0.4 V at scan rate of 0.1 V/s in a fresh de-aeratedsolution containing 1.5 mM K3[Fe(CN)6] and 1.5 mM FeCl3 in 0.1 MKCl and 3 mM HCl. These CFE/PBs were cleaned in doubly distilledwater and activated by applying another 50 cycles in de-aeratedelectrolyte solution (0.1 M KCl and 3 mM HCl), using the same pro-tocol. Before being used, the CFE/PBs were cleaned again in doublydistilled water for several seconds. Finally, the PB film was tem-pered at 100 C for 2 h.
2.3.3. PoPD deposition onto carbon fiber electrodesTo enhance PB stability at neutral pH and selectivity against
principal endogenous brain interference species, several perms-elective polymer coatings were employed: PoPD–BSA electro-deposited; cast Nafion coatings; and a mixed method with Nafionmodification before the electro-deposition of the PoPD–BSA film(discussed below). Electrosynthesis of PoPD was carried out witha standard three-electrode setup; an in-house Ag/AgCl/saturatedKCl was used as the reference electrode and platinum wire as theauxiliary electrode. The electropolymerization was performed inPBS containing 300 mM o-PD, using two approaches: by CV (scanrate: 0.05 V/s, limits: 0–0.8 V) and by applying a constant potential(+0.75 V) for 20–25 min. BSA was included in the monomer solu-tion because globular proteins trapped in the PoPD polymer matrixcan improve its permselectivity under some conditions, as well asacting as a model for trapped enzyme molecules in biosensor appli-cations [32–34]. For clarity in the nomenclature, however, the termBSA will be omitted in all sensor configurations.
2.3.4. In vivo experimentsExperiments were carried out with male rats of ∼300 g
(Sprague–Dawley) in accordance with the European CommunitiesCouncil Directive of November 24, 1986 (86/609/EEC) regardingthe care and use of animals for experimental procedures, and ade-quate measures were taken to minimize pain and discomfort. Therats were anesthetized with urethane (1.5 g/kg), immobilized in astereotaxic frame, and body temperature maintained at 37 C with aheating blanket. The skull was surgically exposed and a small holedrilled for microbiosensor implantations. The biosensor, Ag/AgClreference electrode and platinum auxiliary electrode were placedin the cortex, and the skull kept wet with saline-soaked pads. Thereference potential provided by the Ag/AgCl wire in brain tissue wasvery similar to that of the SCE. Local microinjection was performedusing a microcannula based on a fused silica capillary tube with75 m inner diameter located 400 m from the recording electrodetip.
3. Results and discussion
3.1. Prussian Blue electro-deposition
A PB layer was electro-deposited onto CFEs, by applying threecyclic scans (CV) within the limits of −0.2 to 0.4 V versus SCEat scan rate of 0.1 V/s, in a fresh de-aerated solution containing1.5 mM K3[Fe(CN)6] and 1.5 mM FeCl3 in 0.1 M KCl and 3 mM HCl.With these parameters a thin film of 3–4 m thickness was mea-sured using the Leica microscope (New York Microscope CompanyInc.) and the Andor iXonEM DU-897 back-illuminated EMCCD cam-era (ANDORTM technology). Fig. 1a shows CV electro-depositionwith four scans. A clear increase in the peak currents occurred dueto the deposition of PB onto the CFE. The formal electrode potentialwas centered at about 0.1 V and Ep ∼ 52 mV showing a mono-electronic process per unit of Fe, which is in good agreement withdata reported previously [11–13]. Such voltammograms reflect theregular structure of PB with homogeneous distribution of electron-and ion-transfer rates throughout the film [13].
During the activation step, conversion between insoluble (freeof potassium) and soluble forms of PB (KFe[Fe(CN)6]) occurs, asdiscussed previously [35] During this conversion a disruption ofthe structure occurs and one quarter of the high-spin Fe3+ is lost;instead a potassium ion occupies interstitial sites in the structureof soluble PB film [16]. Here, the term solubility refers to the easewith which Fe3+ is exchanged by potassium, and is not related withthe solubility in water. Fig. 1b shows conversion between solubleand insoluble forms [21]. During conversion, the two peaks becomeslightly narrower and sharper, and after ∼20 cycles the voltam-mogram is stabilized, while the formal potential does not changeappreciably during activation cycles.
Once PB had been electrosynthesized, it was characterizedby means of CV, FTIR and VIS techniques. Fig. 2a shows CV ofKFe[Fe(CN)6]; two characteristic peaks due to conversion of PW/PBand PB/PG appear well defined with formal potentials of ∼0.10 Vand ∼0.85 V, close to values reported previously [11–13]. Ep of thefirst peak pair (PW/PB) was close to 59 mV, showing a clear mono-electronic and reversible behavior, and can be attributed to thereversible redox interconversion between the two forms, reducedand oxidized species of PB; see Eq. (1).
Absorbance spectrum (Fig. 2b) of an as-deposited PB filmshowed the characteristic broad absorption peak at 672 nm dueto charge transfer between Fe3+ and Fe2+ ions; this value is in goodaccord with data reported by other authors [36–38]. FTIR spectrum(Fig. 2c) was measured in the range of 4000–400 cm−1. The trans-mittance spectrum in the high frequency region is characterizedby a very broad band which can be attributed to stretching modesof bonded (2973 cm−1) and free (3435 cm−1) OH− groups of water[7,38]. This band shows that water molecules can be found in PB
Fig. 1. (a) Electro-deposition of PB film onto a carbon fiber electrode (CFE): four scans of increasing amplitude; scan range, −0.2 to 0.4 V versus Ag/AgCl/saturated KCl; scanrate, 0.1 V s−1 in a fresh de-aerated solution containing 1.5 mM K3[Fe(CN)6] and 1.5 mM FeCl3 in 0.1 M KCl and 3 mM HCl. (b) Activation of the PB film by applying another 50cycles in de-aerated electrolyte solution (0.1 M KCl and 3 mM HCl) under the same conditions.
141

Author's personal copy
P. Salazar et al. / Electrochimica Acta 55 (2010) 6476–6484 6479
Fig. 2. (a) Cyclic voltammogram in de-aerated electrolyte solution of a PB-modifiedCFE showing the reduction and oxidation peaks of Prussian Blue at 0.1 and 0.85 V ver-sus SCE, respectively. (b) Absorbance spectrum of electrosynthesized as-depositedPB film (c) FTIR spectra of PB electrosynthesized as-deposited.
coordinated in the shell of high spin iron or occupying interstitialpositions as uncoordinated water. The characteristic Fe–CN band,observed as a very sharp peak at 2067 cm−1, is related to the stretch-ing vibration of Fe–CN, where the CN groups are bonded to an Fe2+
ion. This peak has been used by several authors as a fingerprint ofPB film formation [39].
3.2. Optimization of PB film: sensitivity
The most important applications of PB have involved modifi-cation of surface transducers (Pt, Pt/Ir, ITO, etc.) to detect H2O2at low potential (∼0.0 V versus SCE). Its immediate applicationin the biosensor field allows the detection of H2O2 as the inter-mediate of enzymatic reactions of oxidase enzymes (e.g., glucose
Fig. 3. (a) Cyclic voltammograms in de-aerated electrolyte solution of modifiedCFE/PB in absence and in the presence of several concentrations of H2O2 (0–400 M).(b) Effect of hydrated radii of monovalent and divalent cations on the H2O2 sensitiv-ity of a PB film. (c) Currents for CFE/PB in background in air-saturated solution, [O2]∼240 M (dot), background in air-saturated solution with 10 M of H2O2 (square)and with 240 M of H2O2 (triangle).
oxidase, lactate oxidase, glutamate oxidase). Because of this lowapplied potential, artifacts due to endogenous interferences andbio-polymerization reactions can be avoided. Fig. 3a shows thecyclic voltammograms of a modified CFE/PBs microelectrode inthe absence and presence of several concentrations of H2O2(0–400 M). Voltammograms in the absence of H2O2 display a welldefined cathodic and anodic peak centered about 0.1 V versus SCE,with an Iox/Ired ratio of ∼1. Increasing the concentration of H2O2systematically enhanced the cathodic current, whereas the anodiccurrent displayed a parallel decrease. This observation indicates acatalytic reduction reaction, which can be ascribed to the reductionof H2O2 to water as previously reported [3,8].
142

Author's personal copy
6480 P. Salazar et al. / Electrochimica Acta 55 (2010) 6476–6484
During the oxidation/reduction reaction (PB ↔ PW; see Eq. (1)),the transfer of electrons must be compensated for by the entrap-ment in the film or liberation to the bulk solution of cationicspecies. Due to this mechanism and specially due to structural con-ditions of the PB film, only monovalent cations with low hydratedradii, such us, K+ and NH4
+ (both with hydrated radii equal to0.125 nm) can support this electrochemical activity and can diffuseacross the zeolite PB structure (cubit cell of 1.02 nm and channelradius of 0.16 nm). On the other hand, monovalent and divalentcations with higher hydrated radii, such as Na+, Ca2+and Mg2+
(with hydrated radii of 0.135, 0.156 and 0.161 nm, respectively),have difficulty penetrating the film [6,8]. Therefore, electrolytesupport plays an important role and affects sensitivity and con-ductivity properties of PB films. Fig. 3b shows how PB films inthe presence of monovalent cations with lower hydrated radii dis-play better H2O2 sensitivity than monovalent and divalent cationswith higher hydrated radii. Nevertheless, K+ and NH4
+ with simi-lar radii exhibit different H2O2 sensitivities. This observation canbe explained by taking hydration enthalpies into account. García-Jarreno et al., showed that cations enter and leave the PB filmwithout water of hydration, so that energy is needed to dehydratecations at the film/solution interface which can act as an energybarrier to the cation insertion or expulsion [17]. This factor is con-sistent with PB displaying better electrocatalytic properties in thepresence of K+ (Hhyd = −336 kJ mol−1) as supporting electrolytethan NH4
+ (Hhyd = –365 kJ mol−1).In the early 1980s, Itaya claimed that the reduced form of
PB showed catalytic effects for the reduction of O2 and H2O2[8,11,12]. It can be seen in Fig. 3c that PB, electro-depositedand conditioned under the present conditions, is highly selectivetoward H2O2 reduction in the presence of O2. Here we presentcurrent–potential curves of H2O2 reduction at CFE/PBs at 10 and240 M H2O2 against background electrolyte in air-saturated solu-tion ([O2] ∼ 240 M). At potentials between 0.00 and 0.05 V againstSCE the current reduction of H2O2 was at least two orders of mag-nitude higher (67:0.6 nA) than the O2 reduction current generatedin air-saturated solution.
3.3. Optimization of PB film with poly(o-phenylenediamine):stability and selectivity
Since the discovery of the electrocatalytic properties of PB toreduce H2O2, the principal inconvenience has been its instabil-ity in neutral and basic medium [5,13]. While in acid media PBfilms display high stability, in neutral and basic pH PB is disruptedafter few seconds or minutes. The source of this instability hasbeen attributed to hydroxyl ion interactions forming Fe(OH)3 at pHhigher than 6.4, and hence solubilizing PB. On the other hand, evenat optimum pH, another source of OH–must be taken into account,viz H2O2 electro-reduction [40].
Different strategies have been used to increase PB stabilityin neutral and basic medium: (1) varying the deposition proce-dure [22,41]; and (2) coating PB with permselective membranessuch as Nafion, polyaniline, or poly(o-phenylenediamine) (PoPD)[22,42]. Here we employed a thin film of PoPD on the top sur-face of CFE/PBs to prevent its solubilization. Two main methods(CV and amperometry) have been proposed to electro-depositPoPD [43–46]. Both of these approaches have been shown to beeffective in generating permselective PoPD films. However, PoPDelectrosynthesized amperometrically exhibits better reproducibil-ity and permselective properties [47]. In our case PoPD films wereelectro-deposited in a PBS solution of monomer (300 mM, pH 7.4).Fig. 4a and b shows the two methods employed for PoPD electro-deposition; both techniques show typical self-sealing behavior(during growth of the PoPD film, the electrode surface is sealedand the oxidation of new monomer on the surface is inhibited).
The CV method (Fig. 4a) reveals the irreversible nature of o-PDelectro-oxidation, with a dramatic decrease in current after firstscan which continued to diminish in subsequent scans. Electropoly-merization for 15–20 min at a fixed high potential (+0.75 V versus.Ag/AgCl/saturated KCl) and neutral pH has been proposed as opti-mal conditions to obtain better interference rejecting films in theamperometric methodology [33,46]. Due to the self-sealing natureof PoPD electro-deposition, longer amperometric polymerizationtimes are not necessary and do not improve selectivity [34]. Fig. 4bshows PoPD electro-deposition at constant potential, where a rapiddecrease in current was observed, consistent with self-sealingbehavior. Data have been fitted using a one- and two-phase expo-nential decay equation with a high coefficient of determination(R2 ∼ 0.956 and ∼0.996, respectively). Nevertheless, the two-phaseexponential decay model was significantly better (p < 0.001) in fit-ting the electropolymerization phenomena, with fast and slowhalf-life values of 0.3 and 2.6 min, respectively.
Fig. 5a shows CV scans for CFE/PBs in PBS (pH 7.4) with 0.1 Mof NaCl. Two clear effects are evident associated with the support-ing electrolyte solution employed: an increase in Ep (∼200 mV),showing a decrease in its reversibility and a shift in formal potentialof about–150 mV. Nevertheless, the IOx/IRed ratio was ∼1, simi-lar to behavior described by other authors previously [48]. Thesolid line represents the first CV scan at 0.1 V s−1 between−0.4 and+0.4 V versus SCE, and the dotted line is the 250th scan. A cleardecrease of ∼80% in IOx and IRed was observed, presumably dueto OH− groups present at pH 7.4. After PoPD electro-deposition,CFE/PB/PoPDs showed a clear decrease in IOx and IRed for scan 1(Fig. 5b). This effect can be ascribed due to additional diffusion resis-tance across the PoPD film. Nevertheless, this covering provided asignificant improvement in stability, and no significant changes inpeak currents were observed during the 250 scan cycles.
The dependence of the peak currents on scan rate was also stud-ied for CFE/PB/PoPD. Fig. 5c and d show the results obtained whenthe scan rate was changed from 0.05 to 0.50 V s−1 in PBS (pH 7.4)containing 0.1 M NaCl. Both IOx and IRed were linearly proportional(R2 = 0.996) to the square root of scan rate, suggesting that the dif-fusion of ions through the electrode coatings is rate determining,as commented above.
Electrosynthesized PoPD has been widely employed in biosen-sor configurations due to its excellent permselective properties[49,50]. PoPD blocks and/or minimizes the access of interferencespecies by different mechanisms (size and/or charge exclusion)[51]. This film also excludes surface-active macromolecules, henceprotecting the surface and giving higher stability in vivo [52–54]. Inaddition, the self-controlling mechanism of non-conducting poly-mer formation, reproducibly provides a thin and uniform filmthickness (∼10–30 nm) for PoPD [55–57].
To investigate CFE/PB/PoPD permselective properties, severalendogenous electroactive species found in brain ECF (such as AA,UA, DA and DOPAC) were tested. To understand better the intrinsicmechanism and the advantages of the use of this permselectivefilm, in preference to other more conventional membranes likeNafion, the behavior of several sensor configurations was also stud-ied. Three different anti-interference films were fabricated andcharacterized: CFE/PB/PoPD (the main design), CFE/PB/Naf (5%) andCFE/Naf (0.5%)/PB/PoPD.
The first configuration involved coating the PB surface withPoPD (15 min at +0.75 V) and in the second configuration Nafion at5 wt.% (15 fast immersions and then left to dry for 1 h at room tem-perature) was applied over the PB layer. Last method consisted ofapplying 15 fast immersions in Nafion (0.5 wt.%) to the CFE surface,and then the Nafion was annealed for 10 min at 200 C. After that,the PB and PoPD films were deposited in the same way as describedfor the first configuration. Electrode sensitivity was determined bycalculating the slope of the calibration curve using linear regres-
143

Author's personal copy
P. Salazar et al. / Electrochimica Acta 55 (2010) 6476–6484 6481
Fig. 4. (a) Cyclic voltammograms obtained during electropolymerization of 300 mM o-phenylenediamine at a CFE in phosphate buffer (pH: 7.4, NaCl 0.1 M scan rate:0.05 V/s). (b) Current–time change during fixed-potential electropolymerization of 300 mM o-phenylenediamine at a CFE in PBS (time: 20 min, potential: +0.75 V versusAg/AgCl/saturated KCl.
sion analysis of the different species in a range concentration of0–40 M (DA and DOPAC), 0–400 M (AA and UA) and 0–100 Mfor H2O2. These data were then normalized with respect to theelectrode surface area. Results obtained using these different con-figurations are shown in Fig. 6, where sensitivity (S) is expressed ascurrent density, and Fig. 7 where selectivity (sensitivity ratios) toH2O2 (expressed as: SH2O2 /Sinterference) are plotted using differentprotective configurations (a: CFE/PB/PoPD, b: CFE/PB/Naf (5%), andc: CFE/Naf (0.5%)/PB/PoPD.
A clear decrease of 50% in H2O2 sensitivity occurred when PoPDwas electropolymerized onto the PB surface, presenting the finalconfiguration H2O2 sensitivity of 0.48 ± 0.02 A M−1 cm−2 (n = 4).This effect appears to be due to a new diffusive film on the
PB layer, i.e., the free diffusion of analyte across PoPD film wasimpeded. Greater decreases in H2O2 sensitivity were found for theother two approaches: ∼75% CFE/Naf (0.5%)/PB/PoPD and ∼85%for CFE/PB/Naf (5%). H2O2 sensitivity ratios between CFE/PB/PoPD(sensitivity 480 nA M−1 cm−2) and to the other two configura-tions, CFE/Naf (0.5%)/PB/PoPD (sensitivity 256 nA M−1 cm−2) andCFE/PB/Naf (5%) (sensitivity 167 nA M−1 cm−2) were ∼2 and ∼3respectively; this last value is in good agreement with valuesreported previously by Hamdi et al. [58].
Evolution of selectivities (H2O2 against AA) was also studied,and all films improved the selectivity properties of the sensor,although CFE/PB/PoPD gave the best results with a selectivity ratio∼536 compared to 7, 237 and 72 for CFE/PB, CFE/Naf (0.5%)/PB/PoPD
Fig. 5. 1st and 250th scans in cyclic voltammograms of an uncovered (a) and covered with PoPD (b) PB-modified microelectrode in phosphate buffer (pH: 7.4, NaCl 0.1 M). (c)Cyclic voltammograms of PB microelectrode covered with PoPD at different scan rates in phosphate buffer (pH 7.4, NaCl 0.1 M). From inner to outer curve: 0.05–0.50 V s−1.(d) Linear dependence of anodic and cathodic peak currents on the square root of the potential scan rate.
144

Author's personal copy
6482 P. Salazar et al. / Electrochimica Acta 55 (2010) 6476–6484
Fig. 6. Sensitivities of different PB microsensor configurations to H2O2 and someof the main endogenous brain interference species (DA, DOPAC, UA, AA). Work-ing potential: 0.0 V versus SCE in phosphate buffer solution (pH 7.4, 0.1 M NaCl).(a) CFE/PB/PoPD, (b) CFE/Naf (0.5%)/PB/PoPD, (c) CFE/PB/Naf (5%). Error bars areexpressed as the standard deviation, n = 4.
and CFE/PB/Naf (5%) respectively. A similar selectivity ratio againstAA has been reported by Lukachova et al. for non-implantablePB/PoPD-modified glassy carbon macro-disk electrodes [22], show-ing not only its anti-interference properties, but also the long-termstability obtained using this approach. On the other hand, the selec-tivity ratio (against AA), between PoPD and Naf configurations(536:72), is close to the value reported by Hamdi et al. [58].
Sensitivities for H2O2 and endogenous interference molecules(AA, AU, DA, and DOPAC) of the three different configurations arerepresented in Fig. 6a–c. In all cases sensitivity for H2O2 was severalorders of magnitude higher than for interference species. Neverthe-less, CFE/PB/Naf (5%) showed higher sensitivities for electroactivespecies than for both PoPD configurations, as commented above,and its sensitivity for H2O2 was slightly lower.
Selectivity ratios were expressed as the ratio between sensitiv-ity for H2O2 and sensitivity for interference compounds. For theconfiguration CFE/PB/PoPD, all selectivity ratios are close to 600(Fig. 7a), while for the configuration using hybrid permselective lay-ers, CFE/Naf (0.5%)/PB/PoPD, the selectivity ratios are close to 300(Fig. 7b) because the sensitivities for the endogenous interference
Fig. 7. Selectivities ratios of different PB microsensor configurations expressed asSH2O2 /Sinterference for some of the main endogenous interference species (DA, DOPAC,UA, AA). Working potential: 0.0 V versus SCE in phosphate buffer solution (pH 7.4,0.1 M NaCl); (a) CFE/PB/PoPD, (b) CFE/Naf (0.5%)/PB/PoPD, (c) CFE/PB/Naf (5%). Errorbars are expressed as the standard deviation, n = 4.
analytes studied were not very different for these two approaches.The difference in the selectivity ratios can be partly attributed tothe sensitivity for H2O2 being lower in this last configuration com-pared to the PoPD layer only. The configuration with Nafion as theexternal permselective film, CFE/PB/Naf (5%), displayed selectivi-ties significantly lower than those of the others configurations, withselectivity ratios close to 80 (Fig. 7c).
Another important insight into the anti-interference mecha-nism of the different protective films can be obtained from Fig. 7.Here we can see that selectivity against anionic interferences (AA,UA and DOPAC) was higher than for the cationic interference(DA) in CFE/PB/Naf (5%) configuration. As expected, and in goodagreement with previous literature [58], Nafion-coated surfacesshowed good rejection properties of anionic compounds, yet hadpoor permselectivity against cationic species like dopamine andother catecholamines such as serotonin, epinephrine, and nore-pinephrine. This is due to the fact that Nafion is a negatively chargedpolymer, which repels anionic compounds while attracting thepositively charged DA. In addition, this negatively charged poly-
145

Author's personal copy
P. Salazar et al. / Electrochimica Acta 55 (2010) 6476–6484 6483
Fig. 8. Calibration curve for glucose microbiosensor based on Prussian Blue-modified carbon fiber electrode (diameter: 7 m and length: 250 m) working at0 mV versus SCE. Apparent Michaelis–Menten constant K′ = 12 ± 1 mM, maximumresponse Vm = 1629 ± 36 pA and sensitivity in the linear range, S = 121 ± 1 pA/mM.Data are represented as mean ± SEM (n = 3 biosensors).
mer suffers other drawbacks, such as non-uniform thickness andpoor reproducibility. The PoPD layer displayed lower permeabilityto both interference species types (cations and anions) thanks todifferent mechanisms (size and/or charge exclusion).
Another important parameter, the H2O2 detection limit, wasevaluated for all configurations. Detection limits were calculatedon the basis of a signal to noise ratio of 3 in a backgroundsolution. While CFE/PB presented a detection limit in the rangeof 10−8 M, configurations covered with PoPD (CFE/PB/PoPD andCFE/Naf (0.5%)/PB/PoPD) layers presented a higher detection limitof approximately (1–4) × 10−7 M, which is more than adequate formost biosensor applications.
3.4. In vitro and in vivo response of glucose microbiosensor basedon PB-modified CFE
In order to check that the proposed method can be used todevelop microbiosensors with low dimensions (∼10 m diameter,and 250 m length), glucose oxidase (Gox), an archetype of oxidaseenzymes, was immobilized on the surface of the sensor. CFE/PBswere immersed for several seconds in PEI (5% (w/v) in water) and,after a drying period of 30 min, they were dip coated for 5 min in anenzyme solution (300 U/mL in PBS, pH 7.4) to adsorb the Gox, andfinally cross-linked with glutaraldehyde (0.1%, w/v) and BSA (1%,w/v) (one fast immersion). After a 5 min curing period, additionalrapid immersions in enzyme and cross-linking solutions were done.This last step was repeated another 4 times, waiting 5 min betweeneach cycle. Finally, microbiosensors were cured at 37 C for 1 h andstored at 4 C for use the next day.
Calibration plots (see Fig. 8) for glucose (n = 3 microbiosensors)were generated by plotting averaged steady-state currents againstsubstrate concentration and fitting the data, using non-linearregression to obtain the apparent Michaelis–Menten constant,K′ = 12 ± 1 mM, maximum response, Vm = 1629 ± 36 pA, and the Hillparameter, h = 1.21 ± 0.06, the latter parameter showing a reason-able hyperbolic behavior in the microbiosensor response. Linearregression was used in the linear range to determine biosensorsensitivity, S = 121 ± 1 pA/mM with a coefficient of determination,R2 = 0.998. Detection limit was 54 M (calculated as 3× SD of thebackground current) and linear range up to 6 mM glucose.
During the present work, preliminary in vivo response studies ofglucose microbiosensors based on PB-modified CFE were also car-ried out. For in vivo experiments, PoPD film was electro-depositedon the top of the microbiosensor to avoid interference responseto electroactive compounds, as commented above, observing asignificant loss of sensitivity of ∼50% due to diffusional phenom-
Fig. 9. (a) Variations of glucose microbiosensor response (expressed as basal levelof glucose (%) after subtracting the background current) in prefrontal cortex dueto different volume injections (a: 2 L, b: 1.5 L, c: 1 L, d: 0.4 L, e: 0.8 L) of150 mM KCl in PBS (pH 7.4 100 mM NaCl) at 10 L min−1. (b) Current variationsof glucose microbiosensor in prefrontal cortex due an injection of 2 L of the KClsolution, with a t90% ∼ 5.5 s. (c) Linear correlation between glucose current changeand injected volume, the dotted line representing the 95% confidence interval.
ena across the polymeric film. To measure the glucose responsein ECF, the microbiosensor was implanted in prefrontal cortexaccording to Paxinos and Watson, coordinates: A/P + 2.7 mm fromBregma, M/L + 1.2 mm and D/V – 0.5 mm from the Dura [60]. Glu-cose responses were evaluated by quantifying the microbiosensorcurrent following depolarization of the surrounding tissue with150 mM KCl in PBS (pH 7.4 and 0.1 M NaCl) administered in theextracellular medium with a microcannula located ∼400 m fromthe microbiosensor tip. Previous work [61] has shown that, underthese conditions, an increment of extracellular glucose concentra-tion occurs due to a response of neural activation.
Fig. 9a shows the current variations (expressed as basal levelof glucose (%) after subtracting the background current) of a glu-cose microbiosensor due to different volume injections (a: 2 L,b: 1.5 L, c: 1 L, d: 0.4 L, e: 0.8 L) of 150 mM KCl. A calibra-tion curve determined before implantation allowed us to estimatethe glucose basal level at ∼0.5 mM, which is in good agreementwith previous data reported in literature for rat striatum [50].Reproducibility of the in vivo response was studied by injectingan aliquot of 1.5 L three times (Fig. 9a and b). The increase (nor-malized respect to basal level) was calculated, and represented avalue of 164% ± 2% (mean ± SEM) and a coefficient of variation (CV)of ∼2%. Microbiosensor responses after each injection were ana-lyzed; Fig. 9b shows the increase of glucose in ECF after an injectionof 150 mM KCl. A delay of ∼5 s between injection and a clear currentchange was observed, which can be attributed to diffusion phenom-ena of the KCl in the ECF from microcannula located at ∼400 m.The total response registered was ∼186% which corresponds to a
146

Author's personal copy
6484 P. Salazar et al. / Electrochimica Acta 55 (2010) 6476–6484
glucose concentration of ∼0.95 mM. Microbiosensor time responsebased on in vivo experiments was estimated as the 90% of currentchange after each injection and it presented a value of t90% ∼ 5–6 s,showing in this way the fast response of microbiosensor and val-idating it use in physiological measurements; on the other hand,after KCl depolarization, extracellular glucose returned to its basallevels after 2–3 min. The relationship between injected volume andtotal change is shown in Fig. 9c, where a clear linear correlation,with r2 = 0.997 observed.
4. Conclusions
We have demonstrated that PB-modified CFEs can be usedas a selective transducer to detect H2O2. Due to its electrocat-alytic behavior, H2O2 can be detected at a very low potential(0.0 V versus SCE) avoiding principal problems of biofouling andinterference reactions. To implement such electrocatalytic filmsand solve solubility problems, a PoPD film was employed whichimproved stability and selectivity properties. Sensitivity, selectiv-ity and detection limits obtained in this work are in good agreementwith values reported by other groups with significantly higher elec-trode dimensions. Finally, preliminary biosensor calibrations andglucose changes in brain ECF during local microinjection showedgood results and validated the methodology presented in this workto develop implantable microbiosensors. Nevertheless, in futurestudies, PB electro-deposition, selectivity against a wide rangeof endogenous interferences, and enzyme immobilization will besystematically examined in order to optimize a microbiosensorconfiguration for use in physiological studies in vivo.
Acknowledgements
The funds for the development of this device had been promotedby the following national public projects: ULLAPD-08/01 granted bythe Agencia Canaria de Investigación, Innovación y Sociedad de laInformación, Ministerio de Industria, Turismo y Comercio (ProyectoAVANZA) TSI-020100-2008-337 and Ministerio de Ciencia e Inno-vación (Proyecto CICYT) TIN2008-06867-C02-01/TIN.
References
[1] A. Abbaspour, M.A. Kamyabi, J. Electroanal. Chem. 584 (2005) 117.[2] J. Brown, J. Philos. Trans. 33 (1724) 17.[3] V.D. Neff, J. Electrochem. Soc. 125 (1978) 886.[4] A.A. Karyakin, O.V. Gitelmacher, E.E. Karyakina, Anal. Chem. 67 (1995) 2419.[5] S.A. Jaffari, A.P.F. Turner, Biosens. Bioelectron. 12 (1997) 1.[6] F. Ricci, A. Amine, G. Palleschi, D. Moscone, Biosens. Bioelectron. 18 (2003) 165.[7] J.D. Qiu, H.Z. Peng, R.P. Liang, J. Li, X.H. Xia, Langmuir 23 (2007) 2133.[8] K. Itaya, N. Shoji, I. Uchida, J. Am. Chem. Soc. 106 (1984) 3423.[9] F. Herren, P. Fischer, A. Ludi, W. Halg, Inorg. Chem. 19 (1980) 956.
[10] Ricci, G. Palleschi, Biosens. Bioelectron. 21 (2005) 389.[11] K. Itaya, T. Ataka, S. Toshima, J. Am. Chem. Soc. 104 (1982) 4767.[12] K. Itaya, T. Ataka, S. Toshima, T. Shinohara, J. Phys. Chem. 86 (1982) 2415.[13] A.A. Karyakin, Electroanalysis 13 (2001) 813.
[14] J. Kawiak, T. Jendral, Z. Galus, J. Electroanal. Chem. 145 (1983) 163.[15] H. Gomathi, G. Prabhakara Rao, J. Appl. Electrochem. 20 (1990) 454.[16] K. Itaya, K. Shibayama, H. Akahoshi, S. Toshima, J. Appl. Phys. 53 (1982) 804.[17] J.J. García-Jareno, D.F.V. Giménez-Romero, F. Vicente, C. Gabrielli, M. Keddam,
H. Perrot, J. Phys. Chem. B 107 (2003) 11321.[18] D. Stilwell, K.H. Park, M.H. Miles, J. Appl. Electrochem. 22 (1992) 325.[19] B.J. Feldman, R.W. Murray, Inorg. Chem. 26 (1987) 1702.[20] D. Moscone, D. D’Ottavi, D. Compagnone, G. Palleschi, A. Amine, Anal. Chem. 73
(2001) 2529.[21] B. Haghighi, S. Varma, F.M.Sh. Alizadeh, Y. Yigzaw, L. Gorton, Talanta 64 (2004)
3.[22] L.V. Lukachova, E.A. Kotel’nikova, D. D’Ottavi, E.A. Shkerin, E.E. Karyakina, D.
Moscone, G. Palleschi, A. Curulli, A.A. Karyakin, IEEE Sens. J. 3 (2003) 326.[23] L.C. Clark, C. Lyons, Ann. NY. Acad. Sci. 102 (1962) 29.[24] A.A. Karyakin, O. Gitelmacher, E.E. Karyakina, Anal. Lett. 27 (1994) 2861.[25] A.A. Karyakin, M. Chaplin, J. Electroanal. Chem. 56 (1994) 85.[26] A.A. Karyakin, E.E. Karyakina, Sens. Actuators B 57 (1999) 268.[27] B. Haghighi, S. Varma, F.M. Alizadeh, Y. Yigzaw, L. Gorton, Talanta 64 (2004) 3.[28] H. Shi, Y. Yang, J. Huang, Z. Zhao, X. Xu, J. Anzai, T. Osa, Q. Chen, Talanta 70
(2006) 852.[29] X. Wang, H. Gu, F. Yin, Y. Tu, Biosens. Bioelectron. 24 (2009) 1527.[30] J.P. Lowry, R.D. O’Neill, Electroanalysis 6 (1994) 369.[31] W.H. Oldenziel, G. Dijkstra, T.I.F.H. Cremers, B.H.C. Westerink, Brain Res. 1118
(2006) 34.[32] K. McAteer, R.D. O’Neill, Analyst 121 (1996) 773.[33] B.M. Dixon, J.P. Lowry, R.D. O’Neill, J. Neurosci. Methods 119 (2002) 135.[34] M.R. Ryan, J.P. Lowry, R.D. O’Neill, Analyst 122 (1997) 1419.[35] R.J. Lin, N. Toshima, Bull. Chem. Soc. Jpn. 64 (1991) 136.[36] Y.L. Hu, J.H. Yuan, W. Chen, K. Wang, X.H. Xia, Electrochem. Commun. 7 (2005)
1252.[37] S.A. Agnihotry, P. Singh, A.G. Joshi, D.P. Singh, K.N. Sood, S.M. Shivaprasad,
Electrochim. Acta 51 (2006) 4291.[38] P.J. Kulesza, S. Zamponi, M.A. Malik, K. Miecznikowski, M. Berrettoni, R. Marassi,
J. Solid State Electrochem. 1 (1997) 88.[39] K. Itaya, I. Uchida, V.D. Neff, Acc. Chem. Res. 19 (1986) 162.[40] R. Araminaité, R. Garjonyté, A. Malinauskas, Cent. Eur. J. Chem. 6 (2008) 175.[41] I.L. Mattos, L. Gorton, T. Ruzgas, A.A. Karyakin, Anal. Sci. 16 (2000) 795.[42] J. García-Jareno, J. Navarro-Laboulais, F. Vicente, Electrochim. Acta 41 (1996)
2675.[43] I. Losito, F. Palmisano, P.G. Zambonin, Anal. Chem. 75 (2003) 4988.[44] S.A. Rothwell, S.J. Killoran, E.M. Neville, A.M. Crotty, R.D. O’Neill, Electrochem.
Commun. 10 (2008) 1078.[45] Y.Q. Dai, D.M. Zhou, K.K. Shiu, Electrochim. Acta 52 (2006) 297.[46] C.P. McMahon, S.J. Killoran, R.D. O’Neill, J. Electroanal. Chem. 580 (2005)
193.[47] S.A. Rothwell, C.P. McMahon, R.D. O’Neill, Electrochim. Acta 55 (2010) 1051.[48] M.P. O’Halloran, M. Pravda, G.G. Guilbault, Talanta 55 (2001) 605.[49] F. Palmisano, P.G. Zambonin, D. Centonze, Fresen. J. Anal. Chem. 366 (2000)
586.[50] R.D. O’Neill, J.P. Lowry, G. Rocchitta, C.P. McMahon, P.A. Serra, Trends Anal.
Chem. 27 (2008) 78.[51] D. Centonze, C. Malitesta, F. Palmisano, P.G. Zambonin, Electroanalysis 6 (1994)
423.[52] S. Myler, S. Eaton, S.P.J. Higson, Anal. Chim. Acta 357 (1997) 55.[53] M. Yuqing, C. Jianrong, W. Xiaohua, Trends Biotechnol. 22 (2004) 227.[54] S.M. Kirwan, G. Rocchitta, C.P. McMahon, J.D. Craig, S.J. Killoran, K.B. O’Brien,
P.A. Serra, J.P. Lowry, R.D. O’Neill, Sensors 7 (2007) 420.[55] Y. Ohnuki, H. Matsuda, T. Ohsaka, N. Oyama, J. Electroanal. Chem. 158 (1983)
55.[56] J.D. Craig, R.D. O’Neill, Analyst 128 (2003) 905.[57] S.J. Killoran, R.D. O’Neill, Electrochim. Acta 53 (2008) 7303.[58] N. Hamdi, J. Wang, H.G. Monbouquette, J. Electroanal. Chem. 581 (2005)
258.[60] G. Paxinos, C. Watson, Academic Press, Sydney (1986).[61] Y. Hu, G.S. Wilson, J. Neurochem. 68 (1997) 1745.
147

Author's personal copy
Biosensors and Bioelectronics 26 (2010) 748–753
Contents lists available at ScienceDirect
Biosensors and Bioelectronics
journa l homepage: www.e lsev ier .com/ locate /b ios
Microbiosensors for glucose based on Prussian Blue modified carbon fiberelectrodes for in vivo monitoring in the central nervous system
P. Salazara,∗, M. Martína, R. Rochea, J.L. González–Moraa, R.D. O’Neill b
a Neurochemistry and Neuroimaging Group, Faculty of Medicine, University of La Laguna, Tenerife, Spainb UCD School of Chemistry and Chemical Biology, University College Dublin, Belfield, Dublin 4, Ireland
a r t i c l e i n f o
Article history:Received 9 April 2010Received in revised form 4 June 2010Accepted 25 June 2010Available online 24 July 2010
Keywords:BiosensorCarbon fiber electrodeGlucose oxidasePrussian BlueHydrogen peroxidePoly(o-phenylenediamine)
a b s t r a c t
Carbon fiber electrodes (CFEs) were used to develop microbiosensors for glucose as an alternative tothe classical Pt and Pt–Ir transducers. Their low dimensions (∼250 m CFE length and ∼10 m diame-ter) are important factors for measurements in physiological environments. An electrocatalytic PrussianBlue (PB) film facilitated detection of enzyme-generated hydrogen peroxide at a low applied potential(∼0.0 V against SCE), contrasting the high potential used in many previous designs (∼0.7 V). The elec-trosynthesized polymer, poly-o-phenylenediamine (PoPD), was used to improve biosensor stability andselectivity against endogenous interference species, such as ascorbic and uric acids. Optimization of thefabrication procedure is described, including activation of CFE/PB, enzyme immobilization and stabiliza-tion, anti-interference films, optimizing applied potential, and pH effects. Analytical properties were alsocharacterized such as sensitivity, LOD, linear range, and enzyme loading. Finally, an optimized biosen-sor displaying a linear sensitivity of 9.3 ± 0.1 A mM−1 cm−2 (n = 3), a 2% RSD and free of interference, isproposed as a suitable candidate for in vivo glucose monitoring in the CNS.
© 2010 Elsevier B.V. All rights reserved.
1. Introduction
First generation biosensors are based on the detection of anyelectroactive metabolite that is generated (e.g., H2O2) or consumed(e.g., O2) during the enzyme reaction. The principal problem ofthese approaches for oxidase-based biosensors is the high over-potential needed to detect either O2 or H2O2 on Pt (Clark andLyons, 1962; Clark, 1979) and other native electrode materials(Schuvailo et al., 2005). At high potentials, interference and poly-merization reactions can occur at the biosensor surface. Biosensorsin biological media are subject to interference by endogenouselectroactive reducing agents, especially ascorbic acid (AA) anduric acid (UA) (D’Orazio, 2003; Osborne and Hashimoto, 2004;Garjonyte and Malinaus, 1999). These problems have been solvedby several approaches: (a) the use of polymer films with anti-interference properties, such as poly-o-phenylenediamine (PoPD)(Lowry and O’Neill, 1994; Dai et al., 2006); (b) the use of artifi-cial redox mediators (Castillo et al., 2003; Gregg and Heller, 1990;Habermüller et al., 2000; Mitala and Michael, 2006); (c) the useof electrocatalytic films to detect H2O2 at lower applied poten-
∗ Corresponding author.E-mail address: [email protected] (P. Salazar).
tials (see Fig. 1) (Karyakin et al., 1995; Karyakin and Karyakina,1999).
The neurophysiological motivation for this work is based on glu-cose being the principal source of energy in the brain. Fellows andBoutelle (1993) showed that physiological stimulation of neuralactivity is associated with an increase in glucose concentration inthe extracellular compartment, which has a much longer durationthan the associated change in regional cerebral blood flow (rCBF).On the other hand, recent studies suggest that increased energyrequirements of activated neurons are met by neuronal utilizationof lactate (Pellerin et al., 2007). Thanks to the development and useof microbiosensors to determine principal energy metabolites andneurotransmitters (Dale et al., 2005; Lowry et al., 1998), we cannow further explore the relationship between neural activation,rCBF and brain metabolites.
Biosensors offer a variety of advantages over classical tech-niques for neurochemical monitoring: high spatial and temporalresolution; good selectivity; ease of implementation; amenableto miniaturization; rapid response time; etc. Recently, O’Neill etal. (2008) reviewed the development of wire-based amperometricpolymer–enzyme composite biosensors, focusing on the relation-ship between key design features and analytical parameters. Usinga carbon fiber substrate, we now propose a novel glucose biosensor,developed following this systematic approach, with significantly
0956-5663/$ – see front matter © 2010 Elsevier B.V. All rights reserved.doi:10.1016/j.bios.2010.06.045
148

Author's personal copy
P. Salazar et al. / Biosensors and Bioelectronics 26 (2010) 748–753 749
Fig. 1. Detection scheme for glucose biosensor based on a Prussian Blue (PB) modi-fied electrode. Glucose is converted to gluconolactone, catalyzed by glucose oxidase(Gox) immobilized on the electrode surface. Secondary to this reaction is the pro-duction of hydrogen peroxide that can be reduced amperometrically at low appliedoverpotentials, electrocatalyzed by the PB.
smaller dimensions and a low working potential, which providesignificant advantages for in vivo monitoring.
2. Materials and methods
2.1. Reagents and solutions
The enzyme glucose oxidase (Gox) from Aspergillus niger (EC1.1.3.4, Type VII–S, lyophilized powder), glutaraldehyde (Glut, 25%solution) were obtained from Sigma Chemical Co., and stored at−21 C until used. Other chemicals, including o-phenylenediamine(oPD), glucose, ascorbic acid (AA), uric acid (UA), polyethyleneimine(PEI), KCl, FeCl3, K3[Fe(CN)6], HCl (35%, w/w), H2O2 (30%, w/v),Nafion (5%, w/w, in a mixture of lower aliphatic alcohols and water),bovine serum albumin (BSA, fraction V) and phosphate buffer salinesolution containing 0.1 M NaCl (PBS), were obtained from Sigmaand used as supplied. PBS stock solutions (pH 7.4) were preparedin doubly distilled water (18.2 M cm, Millipore–Q), and stored at4 C. Enzyme solutions were prepared in PBS, which also served asthe background electrolyte for all in vitro experiments. Stock 1 Mand 250 mM solutions of glucose were prepared in water, left for24 h at room temperature to allow equilibration of the anomers,and stored at 4 C. The PEI solutions used were prepared by dissolv-ing PEI at 1% (w/v) and 5% (w/v) ratios in H2O. The cross-linkingsolution was prepared in PBS with 1% (w/v) BSA and 0.1% (w/v)glutaraldehyde. Monomer solution of 300 mM oPD was preparedusing 48.6 mg oPD and 7.5 mg BSA in 1.5 mL of N2-saturated PBSand sonicating for 15 min. A 300 U/mL solution of Gox was preparedby dissolving 3.7 mg in 2 mL of PBS. Carbon fibers (8 m diameter)were obtained from Goodfellow, glass capillaries from Word Pre-cision Instruments Inc., 250 m internal diameter Teflon-coatedcopper wire from RS, and silver epoxy paint was supplied by Sigma.
2.2. Instrumentation and software
Experiments were computer controlled with data acquisitionsoftware EChemTM for cyclic voltammetry and ChartTM for constantpotential amperometry (ADInstruments Pty Ltd., Australia). Thedata acquisition system used was e–Corder 401 and a low-noise andhigh-sensitivity potentiostat, Picostat (eDAQ Pty Ltd., Australia).The linear and non-linear regression analyses were performedusing the graphical software package Prism (ver. 5.00 GraphPadSoftware, San Diego, CA, USA). To electro-deposit and activate thePB (see Section 2.5), an in-house Ag/AgCl/saturated KCl referenceelectrode and platinum wire auxiliary electrode were used.
2.3. Amperometric experiments
All experiments were done in a 25 mL glass cell at 21 C, usinga standard three-electrode set-up with a commercial saturatedcalomel electrode (SCE) (CRISON Instrument S.A. Barcelona, Spain)as the reference and platinum wire as the auxiliary electrode. Theapplied potential chosen for most amperometric studies was 0.0 Vagainst SCE. Glucose calibrations were performed in quiescent air-saturated PBS (following stabilization of the background current for30 min) by adding aliquots of glucose stock solution (1 or 0.25 M) tothe electrochemical cell. After the addition of glucose aliquots, thesolutions were stirred for 10 s and then left to reach the quiescentsteady-state current.
2.4. Data analysis
Calibration plots for glucose were generated by plotting aver-aged steady-state currents against substrate concentration andfitting the data, using non-linear regression to obtain the appar-ent Michaelis–Menten constants, K′ (mM), maximum biosensorresponse, Vm (pA), and the Hill parameter, h. Linear regression wasused in the linear range to determine biosensor sensitivity, signal tonoise ratio and coefficient of determination (r2). In all cases, the cur-rents recorded in background electrolyte were subtracted from thecalibration responses. Data are reported as mean ± SEM, n being thenumber of biosensors or number of measurements (as specified).
2.5. Preparation of the working electrodes
2.5.1. Fabrication of carbon fiber electrodesCarbon fiber electrodes (CFEs) were constructed using the fol-
lowing steps. A carbon fiber (diameter 8 m, 20–50 mm in length)was attached to Teflon-coated copper wire (diameter 250 m)
Fig. 2. a) Carbon fiber electrodes (CFEs) with a diameter of 8 m and length of 250 m. b) Cyclic voltammogram of the PB-modified CFE in de-aerated electrolyte solution(0.1 M KCl and 3 mM HCl) at a scan rate of 10 mV/s. PW is Prussian White, and PG is Prussian Green.
149

Author's personal copy
750 P. Salazar et al. / Biosensors and Bioelectronics 26 (2010) 748–753
using high purity silver paint, and dried for 1 h at 80 C. Aborosilicate glass capillary was pulled to a tip using a vertical micro-electrode puller (Needle/Pipette puller, Model 750, David KopfInstruments, California, USA). After drying, the carbon fiber wascarefully inserted into the pulled glass capillary tube under a micro-scope, leaving 2–4 mm of the carbon fiber protruding at the pulledend. Subsequently, the carbon fiber was cut to the desired length(approximately 250 m), using a microsurgical scalpel. At the stemend of the capillary tube, the copper wire was fixed by castingwith non-conducting epoxy glue; the carbon fiber was also sealedinto the capillary mouth, using the same epoxy glue (Fig. 2a). Sub-sequently, CFEs were dried again for 1 h and were optically andelectrochemically inspected before use.
2.5.2. PB electro-deposition onto carbon fiber electrodesCFEs were modified by electro-deposition and activation of a
Prussian Blue (PB) film. The PB layer was electro-deposited by acyclic voltammetric (CV) method, applying n cyclic scans withinthe limits of −0.2 to 0.4 V, at a scan rate of 50 mV/s, to the CFEsin a fresh de-aerated solution containing 1.5 mM K3[Fe(CN)6] and1.5 mM FeCl3 in 0.1 M KCl and 3 mM HCl. The electrode was thencleaned in doubly distilled water, and the CFE/PB activated byapplying another m scans within the limits of −0.2 to 0.4 V at ascan rate of 100 mV/s in de-aerated electrolyte solution (0.1 M KCland 3 mM HCl). Before being used, the CFE/PB was cleaned again indoubly distilled water for several seconds. Finally, the PB film wastempered at 100 C for 2 h.
2.5.3. Microbiosensor construction based on CFE/PBWhen modified Prussian Blue CFEs (CFE/PB) were ready to use,
the next step was to immobilize the enzyme glucose oxidase (Gox).Gox was dissolved in PBS to the desired concentration (300 U/mL).Different methodologies to immobilize the enzyme were investi-gated to improve the analytical response (described in Section 3).After the immobilization step, all biosensors were cured for 1 h at37 C.
2.5.4. PoPD deposition onto the microbiosensorsFinally, an interference-rejection film of PoPD–BSA was elec-
tropolymerized onto the CFE/PB/Gox surface. Electrosynthesis ofPoPD was carried out with a standard three-electrode set-up in PBScontaining 300 mM oPD and 5 mg/mL of BSA, by applying a con-stant potential (+0.75 V) for 20–25 min. BSA was included in themonomer solution because globular proteins trapped in the PoPDpolymer matrix can improve its permselectivity under some con-ditions (McAteer and O’Neill, 1996; Kirwan et al., 2007). For clarityin the nomenclature, however, the term BSA will be omitted in allsensor configurations, e.g., CFE/PB/Gox/PoPD.
After the biosensor fabrication procedure was completed, theywere cleaned in doubly distilled water and stored overnight at 4 Cin a refrigerator, and used the next day. When not in use, biosensorswere stored again at 4 C in a refrigerator.
3. Results and discussion
3.1. Prussian Blue film
Prussian Blue (PB) has been widely used in biosensor construc-tion to suppress or attenuate interference contributions (Li andGu, 2006). Due to the peculiar structure of PB, its reduced form(Prussian White, PW) has a catalytic activity for H2O2 reduction inneutral media [ec.1], indirectly allowing H2O2 detection at poten-tials close to 0.0 V against SCE, and exhibiting better properties thanother H2O2-detecting devices, such as Pt or horseradish peroxidase
(Karyakin and Karyakina, 1999).
(PW) Fe4K4[Fe(CN)6]3 + 2H2O2 → (PB) Fe4[Fe(CN)6]3 + 4OH−
+ 4K+ (1)
The zeolitic structure of PB with a cubic unit cell of 10.2 Å andwith channel diameters of about 3.2 Å allows the diffusion oflow molecular weight molecules (such as O2 and H2O2) throughthe crystal structure (Ricci and Palleschi, 2005). A voltammogramof a PB-modified CFE is shown in Fig. 2b; two pairs of almostsymmetrical peaks appear with formal potential values of ∼0.15and ∼0.9 V, coinciding with formal potentials reported previouslyby others authors (Karyakin, 2001). The first peak pair corre-sponds to the interconversion of PW and PB, and the second pairfrom PB to Prussian Green (PG). Nevertheless, only the first peakpair will be studied; the response of this first peak pair pointsto a mono-electron, quasi-reversible process corresponding to asurface-adsorbed redox couple (Karyakin, 2001).
Due to this high activity and selectivity towards H2O2 reduc-tion, some authors have named Prussian Blue an “artificial enzymeperoxidase” (Karyakin et al., 2000). Further improvements in thestability and selectivity of PB-based H2O2 transducers can beobtained by electropolymerizing a non-conducting PoPD perms-elective coating. Such improvements can increase 600-fold theselectivity of the PB/PoPD-based transducer relative to ascorbate,which is much better compared to the other reported systems(Lukachova et al., 2003; Salazar et al., in press).
3.2. Applied potential selection
To study the best operating potential, the effect of applied poten-tial on the PB-modified electrode was studied in the range from−0.2 V to +0.2 V in PBS. The current generated by addition of 2.5 MH2O2, was registered and represented as sensitivity in pA/M. Ascan be seen in Fig. 3a the maximum response was obtained at 0.0 V,but no significant differences were found compared with other neg-ative potentials; on the other hand, it was observed that sensitivitydecreased rapidly at positive potential, giving significant differ-ences between 0.0 V and +0.05 V (p < 0.007, n = 3), and complete lossof sensitivity at potentials close to +0.2 V. This observation can bejustified on the basis that only the reduced form of PB (PW) pos-sesses these electrocatalytic properties, so only at potentials wherethis form is present the electro-reduction of H2O2 can occur. Thisrange of potentials is in agreement with the CV of the PB-modifiedCFE showed in Fig. 2b. Finally, 0.0 V was selected as the appliedpotential for glucose sensing.
3.3. Enzyme immobilization
3.3.1. Study of immobilization techniquesGlucose oxidase was immobilized on the transducer surface via
dip-coating procedures. The principal problem of this method is thecontinuous loss of enzyme during the measurement process, dueto the low strength of the non-specific interactions. To avoid this,enzyme can be attached to the surface by means of glutaraldehyde.The addition of another non-catalytic protein, with high numbersof lysine residues such us BSA, can help to diminish deactivationduring the cross-linking phase and increase Gox stability (Goudaet al., 2001). The use of pre-casting with a polyelectrolyte, suchas polyethyleneimine (PEI), has also been shown to stabilize andincrease enzyme loading (Breccia et al., 2002; Qian et al., 2004).
To study how different methodologies of immobilization canimprove the analytical properties of CFE/PB-based biosensors, sev-eral biosensor groups were developed. As a starting point, weused the following parameters in the electro-deposition of PB film:n = 2 and m = 10 to produce ∼10-m diameter CFE/PB electrodes.
150

Author's personal copy
P. Salazar et al. / Biosensors and Bioelectronics 26 (2010) 748–753 751
Fig. 3. a) Effect of the applied potential in the sensitivity of H2O2 in a PB-modified electrode in the studied range from −0.2 V to +0.2 V in PBS. b) Calibration raw data in PBSfor optimized glucose biosensor with a PoPD film (CFE/PB/PEI5%/Goxopt/PoPD): glucose additions of 1, 1 and 2 mM (arrows); and interference additions of 100 M UA and400 M AA (current artifacts). c) Calibration curves of the optimized glucose biosensor in presence and absence of 400 M of AA. d) Optimized glucose biosensor responseto 0.5 mM addition of glucose in artificial extracellular fluid ECF adjusted at different pH values. Data are represented as mean ± SEM (n = 3).
Enzyme loading was modified by applying different immobilizationprotocols: (1) changing numbers of immersions (˛) in Gox solution,and (2) the presence or absence of PEI in solutions before and duringGox immobilization.
The first group of CFE/PB microelectrodes were dip coated for5 min to adsorb the enzyme (Gox) from the enzyme solution andfinally cross-linked with glutaraldehyde (0.1%, w/v) and BSA (1%,w/v) (one fast immersion). This group was denoted by CFE/PB/Gox0.The second and third groups were constructed in the similarway to the basic CFE/PB/Gox0 design, but with additional ˛ rapidimmersions in enzyme and cross-linking solutions, waiting 5 minbetween each dip-evaporation cycle. Accordingly, this fabricationprocedure, for which ˛ = 5 or 10, provided biosensors of the form:CFE/PB/Gox5 and CFE/PB/Gox10.
A fourth group of biosensors were constructed using thesame protocol of CFE/PB/Gox5, but adding an additional solution(1% PEI). The biosensors were dipped briefly in this PEI solu-tion after the enzyme solution and before cross-linking solution.According to this fabrication procedure, the biosensors producedwere: CFE/PB/(Gox–PEI1%)5. A fifth group of biosensors were con-structed using the same protocol as CFE/PB/(Gox–PEI1%)5, butafter stabilizing the PB film and before enzyme immobilization,biosensors were dipped in a 5% PEI solution and dried for 1 h.In this case the nomenclature was: CFE/PB/PEI5%/(Gox–PEI1%)5.The last group of biosensors were constructed using the sameprotocol as for CFE/PB/PEI5%/(Gox–PEI1%)5, but using 5% PEI forall PEI applications. In this case the nomenclature selected was:CFE/PB/PEI5%/(Gox–PEI5%)5.
Table 1 shows the enzyme kinetic and analytical parametersobtained from calibration curves for different ∼10-m diameterglucose biosensors fabricated with and without PEI and differentdeposition procedures. These results show that increased num-bers of dip-coatings increased the relative active enzyme loading(increasing Vm) and linear range sensitivity. Increasing the amountof PEI also increased sensitivity significantly. The value of apparent
Michaelis constant (K′) for the basic configuration (CFE/PB/Gox0,20–30 mM) was close to the value reported for free enzyme(Swoboda and Massay, 1965), indicating that immobilization on PBhad no detrimental effect on enzyme affinity. The incorporation ofPEI increased enzyme affinity, which was the main mechanism forenhanced linear sensitivity (∼Vm/K′ (O’Neill et al., 2008)), leading tolower LOD values. Almost all biosensors showed hyperbolic behav-ior (Hill parameter, h ≈ 1), except the last ‘basic’ design, where h ≈ 2(sigmoidal behavior) making it unsuitable for straightforward glu-cose monitoring applications.
When the number of deep-coatings is increased, the biosensormanufacturing time suffers a considerable increase. So the final fab-rication process (developed below) was optimized with respect totime. Several configurations of PB deposition, activation steps andenzyme immobilization were studied (data not shown) to optimizethe balance of glucose sensitivity and fabrication time. The mostimportant fabrication parameters selected, following systematicoptimization, are summarized as follows:
(1) PB deposition: n = 3, PB activation: m = 50 and stabilization for2 h at 100 C.
(2) Enzyme immobilization: one fast immersion in 5% PEI and driedfor 1 h; one immersion in Gox (300 U/mL) and drying period(5 min for each step); 30 fast immersions in Gox solution, andfinally, 15 fast immersions in cross-linking solution (BSA/Glut).
This microbiosensor design will be referred to as:CFE/PB/PEI5%/Goxopt (see enzyme and analytical parametersin Table 1)
3.3.2. Study of poly-o-phenylenediamine anti-interference filmAt the low applied potential used in the present work, the
influence of physiological interferences on the response of thebiosensor should be very low. One useful way in diminishing thiselectroactive interference further, and also improve the stability
151

Author's personal copy
752 P. Salazar et al. / Biosensors and Bioelectronics 26 (2010) 748–753
Table 1Enzyme kinetic and analytical parameters of different glucose biosensor designs.
Biosensors Sensitivity (pA/mM) r2 in L.R. Detection Limit (M) K′ (mM) Vm (pA) h
CFE/PB/Gox0 10.0 ± 0.3 0.999 564 27 ± 3 339 ± 33 0.9 ± 0.1CFE/PB/Gox5 20.3 ± 1.3 0.984 270 19 ± 3 643 ± 68 0.9 ± 0.1CFE/PB/Gox10 38.5 ± 1.3 0.996 103 19 ± 2 1240 ± 128 0.8 ± 0.1CFE/PB/(Gox–PEI1%)5 74.8 ± 2.7 0.997 57 13 ± 2 1306 ± 42 1.1 ± 0.1CFE/PB/PEI5%/(Gox–PEI1%)5 111 ± 7 0.991 47 10.3 ± 1.5 1661 ± 55 1.2 ± 0.1CFE/PB/PEI5%/(Gox–PEI5%)5 523 ± 5 0.999 10 3.2 ± 0.6 1967 ± 41 2.0 ± 0.2CFE/PB/PEI5%/Goxopt 1814 ± 29 0.999 3 1.7 ± 0.2 5300 ± 57 1.6 ± 0.1CFE/PB/PEI5%/Goxopt/PoPD 747 ± 7 0.999 8 2.6 ± 0.1 2790 ± 20 1.4 ± 0.1
Mean ± SEM (n = 3 biosensors) for: linear sensitivity, coefficient of determination; and apparent Michaelis constant (K′) and calibration plateau (Vm; see Fig. 3). Detectionlimit was calculated as 3 × SD of the background current. The Hill parameter is included to highlight possible deviations from straightforward Michaelis–Menten kinetics,for which h = 1. Calibration curves were obtained by applying 0.0 V against SCE in air-saturated PBS (pH 7.4).
of the PB film, is to employ permselective films (Salazar et al., inpress). These films minimize access of interference species andexclude surface-active macromolecules (Lyne and O’Neill, 1990).Among these electropolymerized films are PoPD and analogues,polyphenol, and overoxidized polypyrrole (Basudam Adhikari andMajumdar, 2004; Yuqing et al., 2004). The self-controlling filmthickness of PoPD during electropolymerization, reproducibly pro-vides a thin and uniform film thickness (3–15 nm) (Killoran andO’Neill, 2008; Rothwell et al., 2008). The use of BSA can increase theinterference rejecting properties of the PoPD (McAteer and O’Neill,1996; Ryan et al., 1997; Dixon et al., 2002; Kirwan et al., 2007).
PoPD films were grown potentiostatically on theCFE/PB/PEI5%/Goxopt surface at +0.75 V against Ag/AgCl. Afterelectropolymerization, biosensors were rinsed with distilled waterand allowed to dry for approximately 1 h before being used. ThePoPD film reduced the biosensor sensitivity to glucose by ∼40–50%compared with the PoPD-free CFE/PB/PEI5%/Goxopt design (seeTable 1). Nevertheless, the sensitivity of CFE/PB/PEI5%/Goxopt/PoPDwas 0.75 nA/mM corresponding to a current density of9.3 ± 0.1 A mM−1 cm−2 (n = 3). This was due to a combina-tion of significantly higher Vm and lower K′ values compared withthe non-optimized designs; see Table 1. Biosensor responses to glu-cose (1 mM), with and without 400 M AA (principal physiologicalinterference), were recorded and normalized as a percentage withrespect to current observed without AA. No significant differenceswere found in the absence (100 ± 2%) and presence of 400 M AA(99 ± 3%, n = 5, p > 0.66).
Fig. 3b and c show calibration data for glucose and theeffect of two principal endogenous brain interference species,using CFE/PB/PEI5%/Goxopt/PoPD. In Fig. 3b several additions of AA(400 M) and UA (100 M) had no effect on either the backgroundcurrent or on the sensitivity of biosensor when glucose concentra-tion was increased by 1, 1 and 2 mM, respectively. No significantdifference was found in the entire glucose calibration plot (Fig. 3c),and specifically the linear sensitivity of the optimized biosensordesign (Fig. 3c, inset) in the absence (737 ± 7 pA/mM) and presence(756 ± 14 pA/mM) of AA (400 M), p > 0.23, n = 8. These results indi-cate that the effects of electroactive interference, at low appliedpotentials and using PoPD as permselective films, are negligibleand suggest that these devices might be suitable for monitoring acomplex matrix like CNS tissue.
3.3.3. pH dependencepH plays an important role in affecting the sensitivity of glucose
biosensors, because both the bioactivity of Gox and the stabilityof the PB film are pH dependent. It is clearly reported that PB isunstable and dissolves at pH values above 7 (Feldman and Murray,1987), suggesting an important problem when working in phys-iological media. One way to solve these problems is by using apolyelectrolyte, such as PEI, to reduce possible changes in enzymeconformation by the formation of cationic–anionic complexes, and
an external polymer film (PoPD) to increase the stability of the PBlayer. The effect of pH of the detection solution on the responseof optimized glucose biosensor (CFE/PB/PEI5%/Goxopt/PoPD) wasinvestigated using artificial extracellular fluid ECF (135 mM NaCl,3 mM KCl, 1 mM MgCl2, 1.2 mM CaCl2) in a pH range from 6.5 to8.5. Fig. 3d shows no significant changes in the glucose responseat different pH values, confirm the excellent stability of thedevices, and shows that Gox and PB are well stabilized on the CFEsurface.
3.4. In vivo recording
In order to demonstrate that glucose biosensors based onCFE/PB respond to changes in glucose levels in brain extracellu-lar fluid (ECF), we examined the effect of local injection of glucoseand depolarization with 150 mM KCl on responses recorded with(CFE/PB/PEI5%/Goxopt/PoPD) in the ECF; all experiments were doneafter reaching the baseline (∼30 min). Fig. 4 shows changes of glu-cose registered in prefrontal cortex after local injections of 2 mMglucose via a micro-pipette on the surface exposed of the cortex inthe proximity of the biosensor: (a) 1 L; (b) 0.5 L and (c) 0.1 L atan injection flux of 3 L min−1. Clear biosensor response changesduring infusion are evident and, after the first injection, the glu-cose levels remained augmented (upper inset). Linear correlationappears between glucose change and volume injected (r2 = 0.97),i.e., no saturation effect was observed.
Spreading depression (SD) is a striking and highly reproducibleresponse of the gray matter of the CNS. Normoxic SD can betriggered by high-frequency electrical pulses and a variety of chem-icals. Among the chemical agents noteworthy are potassium ions
Fig. 4. Raw current changes of glucose microbiosensor recorded with the opti-mized configuration (CFE/PB/PEI5%/Goxopt/PoPD) in brain extracellular fluid afterlocal injections of 2 mM glucose (PBS, pH 7.4 100 mM NaCl) in an anesthetizedSprague Dawley rat: (a) 1 L; (b) 0.5 L and (c) 0.1 L at injection flux of 3 L min−1.Upper inset represents the first peak where the injection period is denoted with ablack bar.
152

Author's personal copy
P. Salazar et al. / Biosensors and Bioelectronics 26 (2010) 748–753 753
Fig. 5. Raw current changes of glucose microbiosensor recorded with the optimizedconfiguration (CFE/PB/PEI5%/Goxopt/PoPD): response in brain extracellular fluid afterseveral transient of spreading depression generated by injection of 150 mM KClin PBS in anesthetized Sprague Dawley rat. Injection flux 5 L min−1: a) volumeinjected 1 L; b) volume injected 5 L.
and glutamate. In our case a single SD episode was elicited byapplying an aliquot of 150 mM KCl in PBS to the surface of thecortex beside the implanted biosensor. Biosensor responses asso-ciated with different volume injections of KCl are shown in Fig. 5,where a clear increase in current (dose dependent) was observedafter different KCl injections. This was followed by a slower restora-tion of the basal levels, especially for the last injection where thevolume injected was 5 L and the time to reach basal levels, afterterminating local injection, was estimated to be ∼2 min. After eachexperiment, the sensitivity of the biosensors did not show signifi-cant changes, demonstrating its good anti-biofouling properties.
4. Conclusions
Microbiosensors of glucose based on PB-modified CFEs havebeen developed. Several advantages of this approach were: smalldimensions, low applied potentials (associated with electrocatal-ysis by the PB deposit) and anti-interference properties (dueto low applied potential and a PoPD permselectivity film), andthese have been contrasted to conventional Pt–Ir-based biosensors(higher dimensions and potentials) for work in physiological media.Principal steps of fabrication have also been discussed: electro-deposition and activation of CFE with PB, enzyme immobilization,etc. By exploring enzyme immobilization steps, biosensors with dif-ferent analytical properties have been developed. Optimal appliedpotential studies for H2O2 detection, and pH effects on biosen-sor response have also been investigated and discussed. Finally,an optimized biosensor configuration, CFE/PB/PEI5%/Goxopt/PoPD,is proposed as an effective candidate to be used for in vivo studieswith a sensitivity of 9.3 ± 0.1 A mM−1 cm−2 (n = 3), RSD of 2% andfree of electroactive interference.
Acknowledgements
The funds for the development of this device have been providedby the following national public projects: ULLAPD-08/01 granted bythe Agencia Canaria de Investigación, Innovación y Sociedad de laInformación, Ministerio de Industria, Turismo y Comercio (ProyectoAVANZA) TSI-020100-2008-337 and Ministerio de Ciencia e Inno-vación (Proyecto CICYT) TIN2008-06867-C02-01/TIN.
References
Basudam Adhikari, B., Majumdar, S., 2004. Prog. Polym. Sci. 29 (7), 699–766.Breccia, J.D., Andersson, M.M., Hatti–Kaul, R., 2002. Biochim. et Biophys. Acta 1570
(3), 165–173.Castillo, J., Gáspár, S., Sakharov, I., Csöregi, E., 2003. Biosens. Bioelectron. 18 (5–6),
705–714.Clark Jr., L.C., 1979. Methods in Enzymology, vol. 56. Academic Press, New York.Clark Jr., L.C., Lyons, C., 1962. Ann. N. Y. Acad. Sci. 102, 29–45.Dai, Y.Q., Zhou, D.M., Shiu, K.K., 2006. Electrochim. Acta 52 (1), 297–303.Dale, D., Hatz, S., Tian, F., Llaudet, E., 2005. Trends Biotechnol. 23 (8), 420–428.Dixon, B.M., Lowry, J.P., O’Neill, R.D., 2002. J. Neurosci. Methods 119, 135–142.D’Orazio, P., 2003. Clin. Chim. Acta 334 (1–2), 41–69.Feldman, B.J., Murray, R.W., 1987. Inorg. Chem. 26 (11), 1702–1708.Fellows, L.K., Boutelle, M.G., 1993. Brain Res. 604 (1–2), 225–231.Garjonyte, R., Malinaus, A., 1999. Sens. Actuators B 56 (1–2), 85–92.Gouda, M.D., Thakur, Karanth, N.G., 2001. Electroanalysis 13 (10), 849–855.Gregg, B.A., Heller, A., 1990. Anal. Chem. 62 (3), 258–263.Habermüller, K., Mosbach, M., Schuhmann, W., 2000. Fresenius J. Anal. Chem 366
(6–7), 560–568.Karyakin, A.A., 2001. Electroanalysis 13 (10), 813–819.Karyakin, A.A., Gitelmacher, O.V., Karyakina, E.E., 1995. Anal. Chem. 67 (14),
2419–2423.Karyakin, A.A., Karyakina, E.E., 1999. Sens. Actuators B 57 (1–3), 268–273.Karyakin, A.A., Karyakina, E.E., Gordon, L., 2000. Anal. Chem. 72 (7), 1720–1723.Killoran, S.J., O’Neill, R.D., 2008. Electrochim. Acta 53 (24), 7303–7312.Kirwan, S.M., Rocchitta, G., McMahon, C.P., Craig, J.D., Killoran, S.J., O’Brien, K.B., Serra,
P.A., Lowry, J.P., O’Neill, R.D., 2007. Sensors 7 (4), 420–437.Li, J.P., Gu, H.N., 2006. J. Chin. Chem. Soc. 53 (3), 575–582.Lowry, J.P., Miele, M., O’Neill, R.D., Boutelle, M.G., Fillenz, M., 1998. J. Neurosci.
Methods 79 (1), 65–74.Lowry, J.P., O’Neill, R.D., 1994. Electroanalysis 6 (5–6), 369–379.Lukachova, L.V., Kotel’nikova, E.A., D’Ottavi, D., Shkerin, E.A., Karyakina, E.E.,
Moscone, D., Palleschi, G., Curulli, A., Karyakin, A.A., 2003. IEEE Sens. J. 03 (3),326–332.
Lyne, P.D., O’Neill, R.D., 1990. Anal. Chem. 62 (21), 2347–2351.McAteer, K., O’Neill, R.D., 1996. Analyst 121 (6), 773–777.Mitala, J.J., Michael, A.C., 2006. Anal. Chim. Acta 556 (2), 326–332.O’Neill, R.D., Lowry, J.P., Rocchitta, G., McMahon, C.P., Serra, P.A., 2008. Trends Anal.
Chem. 27 (1), 78–88.Osborne, P., Hashimoto, M., 2004. Analyst 129, 759–765.Pellerin, L., Bouzier–Sore, A.K., Aubert, A., Serres, S., Merle, M., Costalat, R., Mag-
istretti, P.J., 2007. Glia 55 (12), 1251–1262.Qian, J.M., Suo, A.L., Yao, Y., Jina, Z.H., 2004. Clin. Biochem. 37 (2), 155–161.Ryan, M.R., Lowry, J.P., O’Neill, R.D., 1997. Analyst 122 (11), 1419–1424.Ricci, F., Palleschi, G., 2005. Biosens. Bioelectron. 21 (3), 389–407.Rothwell, S.A., Killoran, S.J., Neville, E.M., Crotty, A.M., O’Neill, R.D., 2008. Elec-
trochem. Commun. 10 (7), 1078–1081.Salazar P., Martín M., Roche R., O’Neill R.D., González-Mora J.L., Electrochim. Acta, in
press, doi:10.1016/j.electacta.2010.06.036.Schuvailo, O.N., Dzyadevych, S.V., El’skaya, A., Gautier-Sauvigne, S., Csoregi, E.,
Cespuglio, R., Soldatkin, A.P., 2005. Biosens. Bioelectron. 21 (1), 87–94.Swoboda, B.E.P., Massay, V., 1965. J. Biol. Chem. 240 (5), 2209–2215.Yuqing, M., Jianrong, C., Xiaohua, W., 2004. Trends Biotechnol. 22 (5), 227–231.
153

Author's personal copy
Sensors and Actuators B 152 (2011) 137–143
Contents lists available at ScienceDirect
Sensors and Actuators B: Chemical
journa l homepage: www.e lsev ier .com/ locate /snb
Amperometric glucose microbiosensor based on a Prussian Blue modified carbonfiber electrode for physiological applications
P. Salazara,∗, R.D. O’Neill b, M. Martína, R. Rochea, J.L. González-Moraa
a Neurochemistry and Neuroimaging Group, Faculty of Medicine, University of La Laguna, Tenerife, Spainb UCD School of Chemistry and Chemical Biology, University College Dublin, Belfield, Dublin 4, Ireland
a r t i c l e i n f o
Article history:Received 30 September 2010Received in revised form16 November 2010Accepted 25 November 2010Available online 3 December 2010
Keywords:BiosensorCarbon fiber electrodeBrain glucosePrussian bluePolyphenylenediamine
a b s t r a c t
Results of experiments in vitro and in vivo, using an amperometric glucose microbiosensor based on aPrussian Blue (PB) modified carbon fiber electrode with very low dimensions (∼10 m diameter), arepresented. The electrocatalytic properties of the PB film enable detection of an enzymatic by-product(H2O2) at a very low applied potential: 0.0 V against SCE. The main steps during glucose microbiosen-sor construction were examined by cyclic voltammetry and electrochemical impedance spectroscopy.Excellent selectivity of the glucose microbiosensors against a large number of physiological interferencecompounds is demonstrated. Finally, microbiosensor responses during intraperitoneal injection, localinfusion and local electrical stimulation showed sufficient sensitivity and stability to monitor multi-phasic and reversible changes in brain ECF glucose levels during physiological experiments, illustratingthe excellent properties and utility of this biosensor design in the neurosciences.
© 2010 Elsevier B.V. All rights reserved.
1. Introduction
First generation devices have been used preferentially in amper-ometric biosensor design over recent decades. They are based onthe measurement of one product (H2O2) or one co-factor (O2)involved in the enzymatic reaction [1,2]. The principal problems ofthis approach are: the high overpotential that needs to be applied tothe working electrode to detect either O2 or H2O2 (in the region of−0.6 and +0.7 V against SCE, respectively) [3–5]; and possible fluc-tuations in O2 concentration that are not related to the enzymaticreaction, especially in biological tissues [6–9]. Also, electroactiveinterference [10–15] and bio-polymerization reactions [16–18] canoccur on the biosensor surface held at high working potentials. Tosolve these problems Karyakin proposed to modify the transduc-tion element with a thin film of Prussian Blue (PB), Fe4[Fe(CN)6]3,the most representative compound of the transition metal hexa-cyanometallate family [19–21]. This deposit has electrocatalyticeffects on the reduction of H2O2 [22], allowing its detection ata potential close to 0.0 V against SCE. By detecting H2O2 at thislow potential, artifacts due to interference and fluctuations of O2concentration are attenuated.
∗ Corresponding author at: University of La Laguna, School of Medicine, Dept. ofFisiology, Facultad Ciencias de La Salud, La Laguna, Tenerife, Spain.
E-mail address: [email protected] (P. Salazar).
After the introduction of PB in the biosensor field by Karyakinet al. [19] in the 1990s, different material supports and depo-sition methodologies have been reported in order to enhanceits electrocatalytic properties and stability [23–27]. Furthermore,an ultra-small glucose biosensor based on a PB-modified trans-ducer has been reported [28], although its application for in vivostudies, and especially in neuroscience, has been poorly devel-oped. In contrast, first generation microbiosensors based on noblemetal transducers with high dimensions (∼100 m diameter)have been employed successfully during last decades for neuro-chemical monitoring of glucose [15,29]. Consequently, our grouphas been working in recent years to implement microbiosensorsbased on PB-modified carbon fiber electrodes (CFEs) with lowdimensions (∼10 m diameter) for use in physiological studies[30,31].
Based on these previous studies, now we present a more detailedinvestigation of an optimized glucose microbiosensor configura-tion (described below), paying special attention to: the evolutionof surface physicochemical properties at different stages of micro-biosensor construction (by using electrochemical impedance andvoltammetric studies); biosensor response and linear range inorder to obtain higher sensitivity (∼5 times greater than ourprevious design [30]); selectivity against a large number of poten-tial interference species (our previous work focused on ascorbicand uric acids) [30,31]; and the response of the novel biosensorunder previous [30,31] and new in vivo experimental conditions todemonstrate the excellent properties of this microbiosensor design
0925-4005/$ – see front matter © 2010 Elsevier B.V. All rights reserved.doi:10.1016/j.snb.2010.11.056
154

Author's personal copy
138 P. Salazar et al. / Sensors and Actuators B 152 (2011) 137–143
and its potential utility for electrophysiological and pharmacolog-ical studies in the neurosciences.
2. Materials and methods
2.1. Reagents and solutions
The enzyme glucose oxidase (Gox) from Aspergillus niger (EC1.1.3.4, Type VII-S), purchased as a lyophilized powder, andglutaraldehyde 25% (Glut) were obtained from Sigma Chemi-cal Co., and stored at −21 C until use. Bovine serum albumin(BSA, fraction V) was also obtained from Sigma. All chemicals,including o-phenylenediamine (o-PD), glucose, polyethyleneimine(PEI), KCl, FeCl3, K3[Fe(CN)6], HCl (35% w/w), H2O2 (30% w/v),Nafion (5 wt% in a mixture of lower aliphatic alcohols andwater), phosphate buffer saline (PBS, pH 7.4 containing 0.1 MNaCl) were obtained from Sigma and used as supplied. Allinterference compounds: ascorbic acid (AA), uric acid (UA),dopamine (DA), 3,4-dihydroxyphenylacetic acid (DOPAC), sero-tonin (5-HT), glycine (Gly), l-tryptophan (l-Tryp), aspartate (Asp),l-cysteine (l-cys), norepinephrine (Nep), epinephrine (Ep), l-tyrosine (l-tyr), -aminobutyric acid (GABA), homovanillic acid(HVA), and 5-hydroxyindoleacetic acid (5-HIAA) were obtainedfor Aldrich–Sigma and used as supplied. PBS stock solutions wereprepared in doubly distilled water (18.2 M cm, Millipore-Q), andstored at 4 C when not in use. Stock 250 mM solutions of glucosewere prepared in water, left for 24 h at room temperature to allowequilibration of the anomers, and then stored at 4 C. The PEI solu-tion used was prepared by dissolving PEI at 5% w/v in H2O. Thecross-linking solution was prepared in PBS with 1% w/v of BSA and0.1% w/v of Glut. Monomer solution (300 mM o-PD) was preparedusing 48.6 mg of o-PD and 7.5 mg of BSA in 1.5 mL of N2-saturatedPBS and sonicated for 15 min [32]. A 300 U/mL solution of Gox wasprepared by dissolving 3.7 mg in 2 mL of PBS. Interference solu-tions were prepared in water just before use and, if necessary, pHwas adjusted to 7.4. Carbon fibers (8 m diameter), glass capil-laries, and 250 m internal diameter Teflon-coated copper wirewere obtained from Word Precision Instruments Inc., and silverepoxy paint was supplied by Sigma. N2 (high grade, O2 ≤ 2 ppm)was supplied by Air Liquide.
2.2. Instrumentation and software
Experiments were computer controlled with data-acquisitionsoftware EChemTM for CV and ChartTM for CPA. The data-acquisitionsystem used was e-Corder 401 (EDAQ) and a low-noise and high-sensitivity potentiostat, Picostat (EDAQ). CV and EIS experimentsfor microbiosensor characterization were conducted with an Auto-lab PGSTAT 20 potentiostat and a FRA module from EcoChemie,computer controlled by their general purpose electrochemicalsystem (GPES) and FRA software, respectively. The linear and non-linear regression analyses were performed using the graphicalsoftware package Prism (ver. 5.00 GraphPad Software). To electro-deposit and activate the PB, a custom-made Ag/AgCl/saturated KClreference electrode and platinum wire auxiliary electrode wereused.
2.3. Amperometric experiments
2.3.1. In vitroAll in vitro experiments were done in a 25 mL glass cell at 21 C,
using a standard three-electrode set-up with a commercial sat-urated calomel electrode (SCE) (CRISON Instrument S.A.) as thereference and platinum wire as the auxiliary electrode. The opti-mized applied potential for amperometric studies was 0.0 V againstSCE [30,31]. Glucose calibrations were performed in quiescent air-
saturated PBS (following stabilization of the background currentfor 30 min) by adding aliquots of glucose stock solution (0.25 M) tothe electrochemical cell. After the addition of glucose aliquots, thesolution was stirred for 10 s and then left to reach the steady-statecurrent. CV experiments were carried out in electrolyte supportsolution (0.1 M KCl and 3 mM HCl). EIS measurements were per-formed in the presence of a 2.5 mM K3[Fe(CN)6]/K4[Fe(CN)6] (1:1)mixture as a redox probe in PBS. The stabilization potential wasset to 0.1 V against SCE, the signal amplitude was 5 mV and thefrequency range was 40 kHz−0.5 Hz.
2.3.2. In vivoThese experiments were carried out with male rats of ∼300 g
(Sprague Dawley) in accordance with the European Communi-ties Council Directive of 1986 (86/609/EEC) regarding the careand use of animals for experimental procedures, and adequatemeasures were taken to minimize pain and discomfort. Afterbeing anesthetized with urethane (1.5 g/kg), the animal’s head wasimmobilized in a stereotaxic frame and its body temperature main-tained at 37 C with a heating blanket. The skull was then surgicallyexposed and a small hole drilled for microbiosensor implantations.To measure prefrontal cortex glucose, the microbiosensors wereimplanted according to Paxinos and Watson coordinates: A/P +2.7from bregma, M/L +1.2 and D/V −0.5 from dura [33]. The Ag/AgClreference electrode and platinum auxiliary electrode were placedover the skull near the prefrontal cortex, and the skull kept wet withsaline-soaked pads. Local infusion was performed using a polymi-cro tube based on a fused silica capillary tube with 75 m innerdiameter located 400 m from the recording electrode tip. Elec-trical stimulation was provided by an S-8800 Grass model and abipolar electrode made with two tungsten rods (100 m diameter;A-M Systems Inc.) etched with an oxyacetylene torch flame, insu-lated with glass fused silica capillary (Composite Metal Service). Thetwo active tips were separated by 25 m, and the exposed activesurface of each tip was approximately 0.5 mm long. Stimuli weregiven from 0.02 to 0.15 mA at 100 Hz for 400 ms, using 0.9 ms squarebiphasic pulses.
2.4. Microbiosensor construction based on CFE/PB
Carbon fiber electrodes (CFEs: 8 m diameter, 250–500 mlength) where constructed and modified as described previously[30,31]; however, the electrolyte solution employed during PBmodification was 0.1 M KCl and 0.1 M HCl, according to Karyakinaet al. [22], in order to improve PB film stability. When the PB/CFEswere ready to use, the next step was to immobilize the perms-elective films and the Gox using the following protocol: 15 fastimmersions in Nafion solution and a drying period of 30 min; 15fast immersions in PEI solution and a drying period (30 min); oneimmersion in Gox (300 U/mL) for 5 min and a drying period (5 min);30 fast immersions in the Gox solution; and 15 fast immersionsin the cross-linking solution (BSA/Glut). After the immobilizationsteps, all biosensors were cured for 1 h at 37 C, and finally aninterference-rejection film of PoPD/BSA was electropolymerizedover the biosensor [31]. After the fabrication procedure of thebiosensors was completed, they were cleaned in doubly distilledwater, stored overnight at 4 C in a refrigerator, and used the nextday. When not in use, biosensors were stored again at 4 C in arefrigerator in dry conditions.
3. Results and discussion
3.1. CV analysis of the PB film
Once the PB film was electro-deposited, activated and stabilized[30,31], it was characterized using CV and EIS. Fig. 1a shows a CV
155
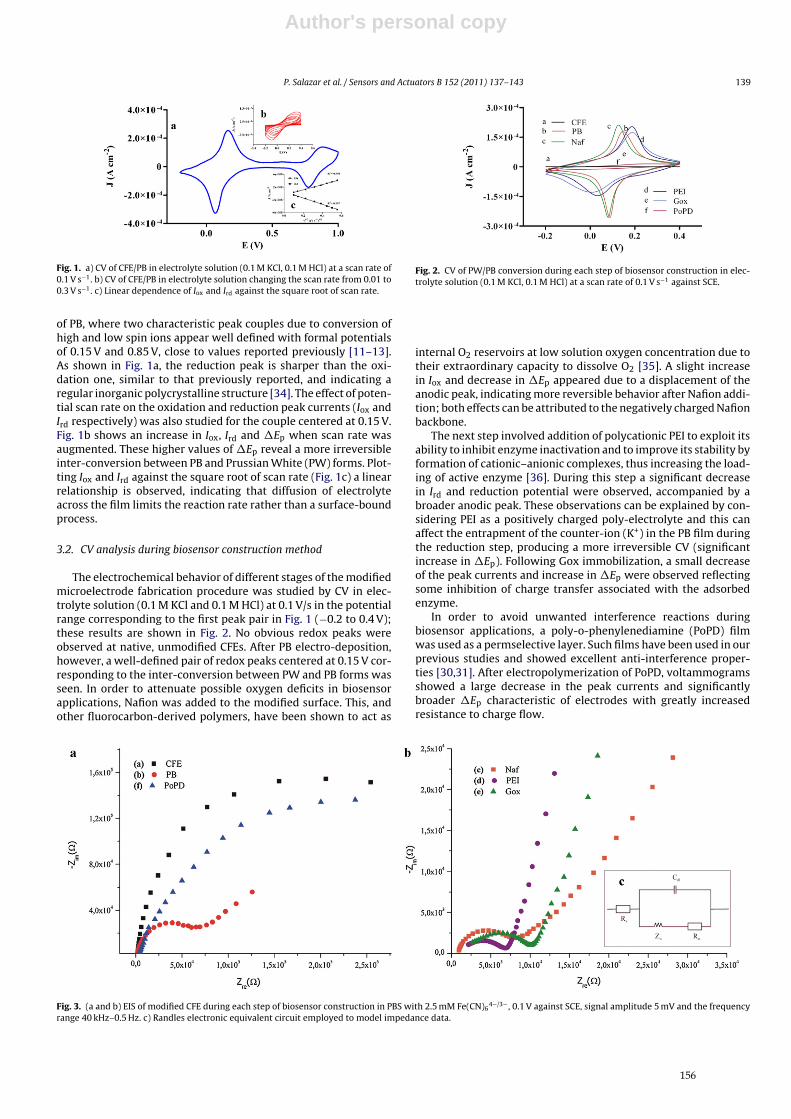
Author's personal copy
P. Salazar et al. / Sensors and Actuators B 152 (2011) 137–143 139
Fig. 1. a) CV of CFE/PB in electrolyte solution (0.1 M KCl, 0.1 M HCl) at a scan rate of0.1 V s−1. b) CV of CFE/PB in electrolyte solution changing the scan rate from 0.01 to0.3 V s−1. c) Linear dependence of Iox and Ird against the square root of scan rate.
of PB, where two characteristic peak couples due to conversion ofhigh and low spin ions appear well defined with formal potentialsof 0.15 V and 0.85 V, close to values reported previously [11–13].As shown in Fig. 1a, the reduction peak is sharper than the oxi-dation one, similar to that previously reported, and indicating aregular inorganic polycrystalline structure [34]. The effect of poten-tial scan rate on the oxidation and reduction peak currents (Iox andIrd respectively) was also studied for the couple centered at 0.15 V.Fig. 1b shows an increase in Iox, Ird and Ep when scan rate wasaugmented. These higher values of Ep reveal a more irreversibleinter-conversion between PB and Prussian White (PW) forms. Plot-ting Iox and Ird against the square root of scan rate (Fig. 1c) a linearrelationship is observed, indicating that diffusion of electrolyteacross the film limits the reaction rate rather than a surface-boundprocess.
3.2. CV analysis during biosensor construction method
The electrochemical behavior of different stages of the modifiedmicroelectrode fabrication procedure was studied by CV in elec-trolyte solution (0.1 M KCl and 0.1 M HCl) at 0.1 V/s in the potentialrange corresponding to the first peak pair in Fig. 1 (−0.2 to 0.4 V);these results are shown in Fig. 2. No obvious redox peaks wereobserved at native, unmodified CFEs. After PB electro-deposition,however, a well-defined pair of redox peaks centered at 0.15 V cor-responding to the inter-conversion between PW and PB forms wasseen. In order to attenuate possible oxygen deficits in biosensorapplications, Nafion was added to the modified surface. This, andother fluorocarbon-derived polymers, have been shown to act as
Fig. 2. CV of PW/PB conversion during each step of biosensor construction in elec-trolyte solution (0.1 M KCl, 0.1 M HCl) at a scan rate of 0.1 V s−1 against SCE.
internal O2 reservoirs at low solution oxygen concentration due totheir extraordinary capacity to dissolve O2 [35]. A slight increasein Iox and decrease in Ep appeared due to a displacement of theanodic peak, indicating more reversible behavior after Nafion addi-tion; both effects can be attributed to the negatively charged Nafionbackbone.
The next step involved addition of polycationic PEI to exploit itsability to inhibit enzyme inactivation and to improve its stability byformation of cationic–anionic complexes, thus increasing the load-ing of active enzyme [36]. During this step a significant decreasein Ird and reduction potential were observed, accompanied by abroader anodic peak. These observations can be explained by con-sidering PEI as a positively charged poly-electrolyte and this canaffect the entrapment of the counter-ion (K+) in the PB film duringthe reduction step, producing a more irreversible CV (significantincrease in Ep). Following Gox immobilization, a small decreaseof the peak currents and increase in Ep were observed reflectingsome inhibition of charge transfer associated with the adsorbedenzyme.
In order to avoid unwanted interference reactions duringbiosensor applications, a poly-o-phenylenediamine (PoPD) filmwas used as a permselective layer. Such films have been used in ourprevious studies and showed excellent anti-interference proper-ties [30,31]. After electropolymerization of PoPD, voltammogramsshowed a large decrease in the peak currents and significantlybroader Ep characteristic of electrodes with greatly increasedresistance to charge flow.
Fig. 3. (a and b) EIS of modified CFE during each step of biosensor construction in PBS with 2.5 mM Fe(CN)64−/3− , 0.1 V against SCE, signal amplitude 5 mV and the frequency
range 40 kHz–0.5 Hz. c) Randles electronic equivalent circuit employed to model impedance data.
156

Author's personal copy
140 P. Salazar et al. / Sensors and Actuators B 152 (2011) 137–143
Table 1Selectivity coefficients for glucose against a large number of physiological interferences found in the ECF. Selectivity coefficients have been calculated according Eq. (1).Glucose biosensor design (CFE/PB/Nafion/PEI/Gox/PoPD) used in this study showed a sensitivity of 751 ± 3 pA/mM (mean ± SEM) n = 5.
Interference Basal concentration (M) Calibration range (M) ix ± SEM (pA) S ± SEM (%) n
AA 200 0–500 5.88 ± 0.42 1.57 ± 0.12 4l-Tryp 30 0–50 0.37 ± 0.07 0.10 ± 0.02 5l-cys 30 0–50 0.29 ± 0.05 0.08 ± 0.01 5l-tyr 30 0–50 0.48 ± 0.06 0.13 ± 0.02 5Gly 10 0–50 0.308 ± 0.04 0.08 ± 0.01 55-HLAA 10 0–50 0.44 ± 0.04 0.12 ± 0.01 5UA 10 0–50 0.213 ± 0.02 0.06 ± 0.01 4HVA 10 0–50 0.06 ± 0.02 0.02 ± 0.01 5DOPAC 10 0–50 0.29 ± 0.08 0.08 ± 0.02 4GABA 5 0–50 0.30 ± 0.02 0.08 ± 0.01 5Asp 5 0–50 <0.01 <0.001 4DA 0.01 0–1 <0.01 <0.001 45-HT 0.01 0–1 <0.01 <0.001 4Nep 0.005 0–1 <0.01 <0.001 4Ep 0.005 0–1 <0.01 <0.001 5
3.3. Electrochemical impedance spectroscopy analysis duringconstruction procedure
Electrochemical impedance spectroscopy (EIS) is an effectivemethod to probe the interfacial properties of surface-modified elec-trodes. A typical shape of a Faradic impedance spectrum includesa semicircle region (at higher frequencies) and a straight line por-tion (at lower frequencies). The semicircle portion corresponds tothe charge-transfer limited process, and the linear portion repre-sents the diffusion-limited process. The semicircle diameter in theimpedance spectrum equates to the charge-transfer resistance, Rct,at the electrode surface [37]
The experimental Faradaic impedance spectra were fitted usinga general Randles electronic equivalent circuit (Fig. 3c), which isvery often used to model interfacial phenomena [38], includingthe ohmic resistance of the electrolyte solution, Rs, the Warburgimpedance, Zw, the double layer capacitance, Cdl and the charge-transfer resistance, Rct. The two components, Rs and Zw, representbulk properties of the electrolyte solution and diffusion feature ofthe redox probe in solution, respectively; therefore, these param-eters are not affected by the electrochemical reaction occurring atthe electrode surface. On the other hand, Cdl and Rct depend onthe dielectric and insulating features at the electrode/electrolyteinterface, respectively.
At an unmodified CFE, the redox process of the [Fe(CN)63−/4−]
probe showed an electron transfer resistance (Rct) of about 339 k(Fig. 3a, curve a); the CFE modified with a PB film showed amuch lower resistance (157 k) for the same redox probe (Fig. 3a,curve b), indicating that the PB improved the electric conduct-ing properties and facilitated electron transfer. The succeedingmodifications for biosensor construction were: addition of Nafionand coating with PEI (Fig. 3b, curves c and d, respectively); thesetwo modifications gave Rct values of 37 and 5 k, respectively.This can be attributed to the fact that both are charged poly-mers and so improve charge transfer at the electrode/electrolyteinterface. Nevertheless, Nafion showed a higher value of Rct, pre-sumably due to repulsion between the negatively charged SO3
−
groups of the Nafion polymer backbone and the negatively chargedFe(CN)6
3−/4− ions. When Gox was immobilized with BSA/Glutonto the CFE/PB/Nafion/PEI-modified electrode surface, the chargetransfer resistance increased, reaching a value of 15 k (Fig. 3b,curve e), which is consistent with the immobilization of theglobular protein (Gox) on the electrode. The last step, electropoly-merization of PoPD/BSA, increased again the resistance value to374 k (Fig. 3a, curve f), and indicates a significant blocking ofcharge exchange between the redox probe and the electrode sur-face, in good agreement with conclusions reached from CV analysis(Fig. 2).
3.4. Anti-interference properties
To quantify the anti-interference properties of these glucosemicro-biosensors, a large number of potential interference com-pounds were checked by means of in vitro calibrations of glucoseand interference in their physiological range (see Table 1). Theselectivity coefficient for glucose against interference, S (%), wascalculated using Eq. (1)
S (%) = ixigluc
× 100 (1)
where ix refers to the current measured for estimated basal concen-tration of interference species and igluc is the current measured for0.5 mM of glucose (Table 1). For ideally selective polymer-modifiedelectrodes that block interferences efficiently and yet allow glucoseaccess to the biosensor surface, S (%) approaches 0%. Selectivitycoefficient values obtained for all interferences were lower than0.15% except for AA (1.6%) which is present in brain extracellularfluid at significantly higher concentration. These results indicatethat the effects of electroactive interference, at low applied poten-tials and using PoPD as a permselective film, are negligible andsuggest that these devices might be suitable for a complex matrixlike CNS tissue. Reproducibility expressed as the CV between dif-ferent biosensors (intra and inter-group) was 2.7% (n = 6) and 5.1%(n = 3) respectively, and stability (loss of ∼10% of the initial responseafter 2 weeks) showed that these biosensors are adequate for short-and medium-term applications.
3.5. In vivo glucose microbiosensor response
During all in vivo experiments glucose levels were in the rangeof 0.2–2 mM, the value depending on the experimental condi-tions, especially electrical and pharmacological stimulation. Takingaccount of biosensor calibrations before and after implantation,baseline extracellular fluid glucose concentration in prefrontal cor-tex was 1.2 ± 0.2 mM (mean ± SD, n = 5) for the state of anesthesiaused here. This value is about twice that reported for the morecommonly studied striatal brain region [15,30], but closer to thatestimated for another subcortical region, the hippocampus [39].
3.5.1. Effects of glucose local infusion (LI) and glucose and insulinintraperitoneal injections (IP)
In order to demonstrate that CFE/PB/Nafion/PEI/Gox/PoPDbiosensors respond to glucose changes in brain extracellular fluidwe began in vivo characterization by examining the effect of glu-cose 2 mM LI. Fig. 4 inset shows different injections, where theinjected volume was increased from 0.1 to 2 L. As expected, aclear saturation effect and asymptotic behavior was observed, with
157

Author's personal copy
P. Salazar et al. / Sensors and Actuators B 152 (2011) 137–143 141
Fig. 4. Effect of intraperitoneal injections of insulin (*) (20 U/kg) and glucose (**)(1 g/kg) on the response of a glucose microbiosensor (CFE/PB/Nafion/PEI/Gox/PoPD)placed in the prefrontal cortex of anesthetized rat. Data are normalized with respectto basal levels before the injection taken as 100%. Inset: current changes in glu-cose microbiosensor after local infusion of different volumes (a: 0.1 L; b: 0.2 L; c:0.5 L; d: 0.8 L; e: 2 L) of 2 mM glucose at 10 L min−1.
the maximum current registered (comparing with previous in vitrocalibration) corresponding to a value of 2 mM glucose, the concen-tration of the infused stock solution.
The effects of insulin and glucose IP were also studied. Theexperimental rats (n = 3) were isolated and access to food restrictedfor 12 h prior to recording. Glucose biosensors were inserted inthe right prefrontal cortex and after a stabilization period (1 h) theeffect of insulin (20 U/kg, IP) was studied. Fig. 4 shows the meanbaseline glucose current, normalized as a percentage of basal val-ues. At 40 ± 10 min after the injection, the measured current ofglucose started to decrease and reached 20 ± 10% of basal values.The maximum hormone effect was observed approximately 1 hafter injection. Fig. 4 also shows the increase in biosensor responseafter glucose (1 g/kg, IP), reaching almost 80% of the pre-insulinglucose basal level. Similar results have been obtained in the stria-tum of unanesthetized freely moving rats, using 125-m diameterbiosensors [29]. The biosensor response following glucose injectionincreased rapidly by 10 ± 5 min after injection but did not reach thefull basal levels, probably because of the lasting influence of theinjected insulin.
3.5.2. Spreading depression produced by local infusion of 150 mMKCl and local electrical stimulation
Spreading depression (SD) is a striking and highly reproducibleresponse of the gray matter of the central nervous system. At thecore of SD is a rapid and nearly complete depolarization of a siz-able population of brain cells [40]. Normoxic SD can be triggeredby high-frequency electrical pulses, mechanical stimuli and a vari-ety of chemicals, such as potassium ions and glutamate. In our casea single SD episode was elicited by applying an aliquot (from 1 to3 L) of 150 mM of KCl at 10 L min−1.
The effect on the biosensor response caused by depolarizationby different volume injections of KCl is shown in Fig. 5, where a clearincrease in glucose level was observed after different KCl infusion(∼2.5 s), followed by a rapid decreased of glucose concentration anda not-so-rapid restoration of the basal levels (∼5 min). The increasein glucose response was dose dependent. The rapid depolarizationof neurons and astrocytes can explain the glucose kinetics after theK+ injection: the increased signal during injection could be due arapid global depolarization, especially glutamatergic neurons, andthe subsequent decrease could be explained by the inhibition ofthe synaptic activity [41] which recovers in a few minutes; similarresults were found in all animals employed (n = 3).
SD episodes were also elicited by applying high-frequency(100 Hz) electrical pulses of 0.15 mA for 400 ms. Both the glucosebiosensor and a blank sensor (without Gox) were stereotaxicallypositioned close to each other in the prefrontal cortex of rat brain∼200 m from a bipolar stimulating electrode described above.
Fig. 5. Changes in CFE/PB/Nafion/PEI/Gox/PoPD biosensor response after severaltransients of spreading depression generated by local infusion of different volumes(from 1 to 3 L) of 150 mM KCl at 10 L min−1.
Fig. 6. Typical recordings showing the physiological responses registered with aglucose microbiosensor (CFE/PB/Nafion/PEI/Gox/PoPD) after electrical stimulationat 100 Hz for 400 ms (*): left inset, three consecutive responses with blank sen-sor; right inset, glucose microbiosensor response. Similar results were found in allcorresponding in vivo experiments (n = 4).
While blank sensors only displayed a brief artifact during electricalstimulus (Fig. 6, left inset), glucose microbiosensors (Fig. 6, rightinset) showed the same artifact and a typical SD response after arapid and short decrease of glucose current (∼8 s), due to the phys-iological consumption of glucose caused by electrical stimulation.
4. Conclusions
A new implantable glucose biosensor based on PB-modified CFEwith a very small cross-sectional area (10 m diameter) and alow working potential (0.0 V against SCE) has been designed andcharacterized. Incorporating an electrocatalytic layer (PB), as wellas Nafion to attenuate oxygen dependence, PEI to stabilize theenzyme, and PoPD as a permselective layer, these microbiosen-sors displayed good glucose sensitivity (∼12 nA M−1 cm−2) andexcellent anti-interference properties. During microbiosensor con-struction each step was studied in detail to provide insight into howsurface properties changed following each modification. Moreover,exploratory pharmacological and electrical stimulations reportedhere demonstrate that these devices have sufficient sensitivity andstability to monitor multi-phasic and reversible changes in brainECF glucose levels in vivo.
Acknowledgement
The funds for the development of this device have been providedby the following national public grants: ULLAPD-08/01 grantedby the Agencia Canaria de Investigación, Innovación y Sociedadde la Información, Ministerio de Industria, Turismo y Comer-cio (AVANZA) TSI-020100-2008-337 and Ministerio de Ciencia e
158

Author's personal copy
142 P. Salazar et al. / Sensors and Actuators B 152 (2011) 137–143
Innovación (CICYT) TIN2008-06867-C02-01/TIN. We thank Dr JLRodriguez Marrero and J Florez Montano for help in EIS measure-ments.
References
[1] L.C. Clark Jr., C. Lyons, Electrode system for continuous monitoring in cardio-vascular surgery, Ann. N. Y. Acad. Sci. 102 (1962) 29–46.
[2] S.J. Updike, G.P. Hicks, The enzyme electrode, Nature 214 (1967) 986–988.[3] J. Liu, J. Wang, Improved design for the glucose biosensor, Food Technol.
Biotechnol. 39 (2001) 55–58.[4] J. Wang, Glucose biosensors: 40 years of advances and challenges, Electroanal-
ysis 13 (2001) 983–988.[5] M. Stoytcheva, R. Zlatev, Z. Velkova, B. Valdez, M. Ovalle, Analytical character-
istics of electrochemical biosensors, Portugaliae Electrochim. Acta 27 (2009)353–362.
[6] C.P. McMahon, S.J. Killoran, R.D. O’Neill, Design variations of a polymer–enzymecomposite biosensor for glucose: enhanced analyte sensitivity withoutincreased oxygen dependence, J. Electroanal. Chem. 580 (2005) 193–202.
[7] C.P. McMahon, R.D. O’Neill, Polymer–enzyme composite biosensor with highglutamate sensitivity and low oxygen dependence, Anal. Chem. 77 (2005)1196–1199.
[8] C.P. McMahon, G. Rocchitta, P.A. Serra, S.M. Kirwan, J.P. Lowry, R.D. O’Neill, Con-trol of the oxygen dependence of an implantable polymer/enzyme compositebiosensor for glutamate, Anal. Chem. 78 (2006) 2352–2359.
[9] B.M. Dixon, J.P. Lowry, R.D. O’Neill, Characterization in vitro and in vivo ofthe oxygen dependence of an enzyme/polymer biosensor for monitoring brainglucose, J. Neurosci. Methods 119 (2002) 135–142.
[10] F. Palmisano, P.G. Zambonin, Ascorbic acid interferences in hydrogen peroxidedetecting biosensors based on electrochemically immobilized enzymes, Anal.Chem. 65 (1993) 2690–2692.
[11] D. Carelli, D. Centonze, A. De Giglio, M. Quinto, P.G. Zambonin, An interference-free first generation alcohol biosensor based on a gold electrode modified byan overoxidised non-conducting polypyrrole film, Anal. Chim. Acta 565 (2006)27–35.
[12] S.M. Kirwan, G. Rocchitta, C.P. McMahon, J.D. Craig, S.J. Killoran, K.B. O’Brien,P.A. Serra, J.P. Lowry, R.D. O’Neill, Modifications of poly(o-phenylenediamine)permselective layer on Pt–Ir for biosensor application in neurochemical mon-itoring, Sensors 7 (2007) 420–437.
[13] M.C. Rodríguez, G.A. Rivas, Highly selective first generation glucose biosensorbased on carbon paste containing copper and glucose oxidase, Electroanalysis13 (2001) 1179–1184.
[14] J. Wang, L. Chen, J. Liu, F. Lu, Enhanced selectivity and sensitivity of first-generation enzyme electrodes based on the coupling of rhodinized carbon pastetransducers and permselective poly(o-phenylenediamine) coatings, Electro-analysis 8 (2005) 1127–1130.
[15] R.D. O’Neill, J.P. Lowry, G. Rocchitta, C.P. McMahon, P.A. Serra, Designing sensi-tive and selective polymer/enzyme composite biosensors for brain monitoringin vivo, Trends Anal. Chem. 27 (2008) 78–88.
[16] M. Gerritsena, A. Krosb, V. Sprakelb, J.A. Luttermanc, R.J.M. Nolteb, J.A. Jansen,Biocompatibility evaluation of sol–gel coatings for subcutaneously implantableglucose sensors, Biomaterials 21 (2000) 71–78.
[17] M. Yuqing, C. Jianrong, W. Xiaohua, Using electropolymerized non-conductingpolymers to develop enzyme amperometric biosensors, Trends Biotechnol. 22(2004) 227–231.
[18] N. Wisniewski, F. Moussy, W.M. Reichert, Characterization of implantablebiosensor membrane biofouling, Fresenius J. Anal. Chem. 366 (2000) 611–621.
[19] A.A. Karyakin, O.V. Gitelmacher, E.E. Karyakina, A high sensitive glucose amper-ometric biosensor based on Prussian Blue modified electrodes, Anal. Lett. 27(1994) 2861–2869.
[20] A.A. Karyakin, O.V. Gitelmacher, E.E. Karyakina, Prussian Blue based first gen-eration biosensors A high sensitive amperometric electrode for glucose, Anal.Chem. 67 (1995) 2419–2423.
[21] A.A. Karyakin, E.E. Karyakina, L. Gorton, Prussian Blue based amperometricbiosensors in flow-injection analysis, Talanta 43 (1996) 1597–1606.
[22] A.A. Karyakina, E.E. Karyakina, L. Gorton, On the mechanism of H2O2 reductionat Prussian Blue modified electrodes, Electrochem. Commun. 1 (1999) 78–82.
[23] I.L. Mattors, L. Gorton, T. Ruzgas, A.A. Karyakin, Sensor for hydrogen peroxidebased on Prussian Blue modified electrode: improvement of the operationalstability, Anal. Sci. 16 (2000) 795–798.
[24] F. Ricci, G. Palleschi, Sensor and biosensor preparation, optimisation and appli-cations of Prussian Blue modified electrodes, Biosens. Bioelectron. 21 (2005)389–407.
[25] D. Lowinsohn, M. Bertotti, Flow injection analysis of blood l-lactate by using aPrussian Blue-based biosensor as amperometric detector, Anal. Biochem. 265(2007) 260–265.
[26] A.K.M. Kafi, F. Yin, H.K. Shin, Y.S. Kwon, Amperometric thiol sensor based onPrussian blue-modified glassy carbon electrode, Curr. Appl. Phys. 7 (2007)496–499.
[27] Y. Liua, Z. Chua, W. Jin, A sensitivity-controlled hydrogen peroxide sensor basedon self-assembled Prussian Blue modified electrode, Electrochem. Commun. 11(2009) 484–487.
[28] X. Zhang, J. Wang, B. Ogorevc, U.E. Spichiger, Glucose nanosensor based onPrussian-Blue modified carbon-fiber cone nanoelectrode and an integratedreference electrode, Electroanalysis 11 (1999) 945–949.
[29] J.P. Lowry, M. Miele, R.D. O’Neill, M.G. Boutelle, M. Fillenz, An amperomet-ric glucose-oxidase/poly(o-phenylenediamine) biosensor for monitoring brainextracellular glucose: in vivo characterisation in the striatum of freely-movingrats, J. Neurosci. Methods 79 (1998) 65–74.
[30] P. Salazar, M. Martín, R. Roche, R.D. O’Neill, J.L. González-Mora, PrussianBlue-modified microelectrodes for selective transduction in enzyme-basedamperometric microbiosensors for in vivo neurochemical monitoring, Elec-trochim. Acta 55 (2010) 6476–6484.
[31] P. Salazar, M. Martín, R. Roche, J.L. González-Mora, R.D. O’Neill, Microbiosensorsfor glucose based on Prussian Blue modified carbon fiber electrodes for in-vivo monitoring in the central nervous system, Biosens. Bioelectron. 26 (2010)748–753.
[32] K. McAteer, R.D. O’Neill, Strategies for decreasing ascorbate interference at glu-cose oxidase-modified poly(o-phenylenediamine)-coated electrodes, Analyst121 (1996) 773–777.
[33] G. Paxinos, C. Watson, The Rat Brain in Stereotaxic Coordinates, Academic Press,Sydney, 1986.
[34] A.A. Karyakin, Prussian blue and its analogues: electrochemistry and analyticalapplications, Electroanalysis 13 (2001) 813–819.
[35] J. Wang, L. Chen, M.P. Chatrathi, Evaluation of different fluorocarbon oils fortheir internal oxygen supply in glucose microsensors operated under oxygen-deficit conditions, Anal. Chim. Acta 411 (2000) 187–192.
[36] J.D. Breccia, M.M. Andersson, R. Hatti-Kaul, The role of poly(ethyleneimine) instabilization against metal-catalyzed oxidation of proteins: a case study withlactate dehydrogenase, Biochim. Biophys. Acta 1570 (2002) 165–173.
[37] M. Zhou, L. Shang, B. Li, L. Huang, S.J. Dong, Highly ordered mesoporous carbonsas electrode material for the construction of electrochemical dehydrogenase-and oxidase-based biosensors, Biosens. Bioelectron. 24 (2008) 442–447.
[38] Y. Liu, X. Qu, H. Guo, H. Chen, B. Liu, S. Dong, Facile preparation of amper-ometric laccase biosensor with multifunction based on the matrix of carbonnanotubes–chitosan composite, Biosens. Bioelectron. 21 (2006) 2195–2201.
[39] E.C. McNay, R.C. McCarty, P.E. Gold, Fluctuations in brain glucose concentrationduring behavioral testing: dissociations between brain areas and between brainand blood, Neurobiol. Learn. Mem. 75 (2001) 325–337.
[40] G.G. Somjen, Mechanisms of spreading depression and hypoxic spreadingdepression-like depolarization, Physiol. Rev. 81 (2001) 1065–1096.
[41] V.I. Koroleva, V.I. Davydov, G.Y. Roshchina, Properties of spreading depres-sion identified by EEG spectral analysis in conscious rabbits, Neurosci. Behav.Physiol. 39 (2009) 87–97.
Biographies
Pedro Salazar Carballo received his degree in ChemicalSciences (2003) and his DEA (Advanced Studies Diploma)(2005) from the University of La Laguna (ULL). Since2006 he has been a researcher at the Neurochemical andNeuroimaging headed by J.L. González-Mora. In 2010 hereceived his Master in Chemistry from ULL: nowadays, heis working in different areas: (1) development and imple-mentation of enzymatic amperometric biosensors focusedon the connection between the neurovascular system andthe central nervous system, (2) surface nanostructurationwith electroactive compounds and (3) development oflabel-free immunosensors based on Prussian Blue films.
Robert D. O’Neill BSc (Chemistry, University CollegeDublin, 1976); Ryan Gold Medal (Chemistry, 1976); PhD(Electrochemistry, supervised by Prof. David Feakins,UCD, 1980). Postdoctoral research (1980–1983) with JohnAlbery, FRS (Chemistry, Imperial College London) andMarianne Fillenz, MD, PhD (Physiology, Oxford Univer-sity). Research Fellowships (1983–1985) in Physiology(Worcester College, Oxford) and Neurochemistry (BeitMemorial Fellowship in Medical Research) at OxfordUniversity. Appointed to UCD in 1985 and is now UCD Pro-fessor of Electrochemistry. Core research interests includedesign and characterization of amperometric sensors andbiosensors; neurotransmitter glutamate and dopamine
monitoring; and brain vitamin-C/glutamate interactions.
Miriam Martín Hernández received her degree in Chem-ical Sciences from the University of La Laguna (ULL, 2005).Since 2006 she has worked as researcher at the Neu-rochemical and Neuroimaging laboratory headed by J.L.González-Mora. In 2007 and 2010 she received her DEA(Advanced Studies Diploma) and her Master in Chemistryrespectively from the ULL. Nowadays, she is working intwo different areas: (1) development and implementationof enzymatic amperometric biosensors and (2) develop-ment and implementation of ISE microelectrodes, both ofwhich are focused on the connection between the neu-rovascular system and the central nervous system.
159

Author's personal copy
P. Salazar et al. / Sensors and Actuators B 152 (2011) 137–143 143
Rossany Roche received her Chemical Engineer degree in2000 and her Doctorate degree in 2006, both from Univer-sidad Simón Bolívar, in Caracas, Venezuela. She workedat Processes and Systems Department of the Simón Bolí-var University in the Automatic Control Systems area until2006. She joined the Neurochemistry and Neuroimaginggroup of the Physiology Department at La Laguna Uni-versity in 2007. Her research interests have been focusedon modelling and identification of dynamical systems andspecially the mathematical modelling of bio-medical sys-tems.
J.L. González-Mora received his MD and PhD degrees in1982 and 1987, respectively. Since 1992, he has beensenior professor in the Department of Physiology (Schoolof Medicine, University of La Laguna, ULL), and is the headof the Neurochemical and Neuroimaging laboratory. Hisgroup has worked on “in vivo” voltammetry from 1988using this methodology for continuous on-line monitoringof monoamine neurotransmitter release in living animalsand humans. His group has also been a pioneer in theapplication of this technique in the study of neurochem-ical release, associated with complex behavior such associal and sexual interaction.
160

Author's personal copy
Colloids and Surfaces B: Biointerfaces 92 (2012) 180– 189
Contents lists available at SciVerse ScienceDirect
Colloids and Surfaces B: Biointerfaces
j our na l ho me p age: www.elsev ier .com/ locate /co lsur fb
Surfactant-promoted Prussian Blue-modified carbon electrodes: Enhancement ofelectro-deposition step, stabilization, electrochemical properties and applicationto lactate microbiosensors for the neurosciences
P. Salazara,∗, M. Martína, R.D. O’Neill b, R. Rochea, J.L. González-Moraa
a Neurochemistry and Neuroimaging Group, Faculty of Medicine, University of La Laguna, Tenerife, Spainb UCD School of Chemistry and Chemical Biology, University College Dublin, Belfield, Dublin 4, Ireland
a r t i c l e i n f o
Article history:Received 8 August 2011Received in revised form22 November 2011Accepted 22 November 2011Available online 8 December 2011
Keywords:Prussian BlueSurfactantBZTH2O2 sensorLactate biosensor
a b s t r a c t
We report here for the first time a comparison of the beneficial effects of different cationic surfactants– cetyl trimethyl ammonium bromide (CTAB), benzethonium chloride (BZT) and cetylpyridinium chlo-ride (CPC) – for the electrochemical synthesis of Prussian Blue (PB) films, using cyclic voltammetry (CV),on screen-printed carbon electrodes (SPCEs). Their electrochemical properties were investigated, pay-ing special attention to parameters such as the amount of PB deposited, film thickness, charge transferrate, permeability, reversibility, stability and sensitivity to hydrogen peroxide detection. All surfactant-enhanced PB-modified SPCEs displayed a significant improvement in their electrochemical propertiescompared with PB-modified SPCEs formed in the absence of surfactants. Surfactant-modified electrodesdisplayed a consistently higher PB surface concentration value of 2.1 ± 0.4 × 10⁻⁸ mol cm−2 (mean ± SD,n = 3) indicating that PB deposition efficiency was improved 2–3 fold. K+ and Na+ permeability propertiesof the films were also studied, as were kinetic parameters, such as the surface electron transfer rate con-stant (ks) and the transfer coefficient (˛). The hydrogen peroxide sensitivity of surfactant-modified PBfilms generated by 10 electro-deposition CV cycles gave values of 0.63 A M−1 cm−2, which is higher thanthose reported previously for SPCEs by other authors. Finally, the first lactate microbiosensor describedin the literature based on BZT-modified PB-coated carbon fiber electrodes is presented. Its very smallcross-section (∼10 m diameter) makes it particularly suitable for neuroscience studies in vivo.
© 2011 Elsevier B.V. All rights reserved.
1. Introduction
Over recent decades, Prussian Blue (PB), Fe4[Fe(CN)6]3, the mostrepresentative compound of the transition metal hexacyanometal-late family [1,2], has received much attention in a variety of fields.Although its magnetic and electrochromic properties have provedvery attractive [3,4], the electrocatalytic effect of its reduced form(Prussian White, PW) on the reduction of H2O2 at low appliedpotentials is the most important application to date [5]. Togetherwith the facile modification of the electrode substrate and thelow cost of production, this has led to an on-going replacementof the common enzymatic detection method – horseradish per-oxidase (HRP) – which is more expensive and complicated thanPB-modified substrates [6–13].
Screen printing technology has been employed with great suc-cess in the manufacture of electrodes in the last decade, allowingthe mass production of electrodes with extremely low cost and
∗ Corresponding author. Tel.: +34 922319363; fax: +34 922319397.E-mail address: [email protected] (P. Salazar).
therefore suitable for production of disposable electrodes [14].Relatively few papers appear in the literature combining screen-printed carbon electrodes (SPCEs) and PB. These reports were basedon the chemical synthesis of PB and subsequent bulk modificationof the carbon ink by PB microparticles [15] or the in situ modifica-tion of glassy carbon or graphite powder with PB [16], both methodsgiving similar hydrogen peroxide sensitivity of ∼0.14 A M−1 cm−2.Another method, proposed by Ricci et al. [17], involved the directchemical synthesis of PB onto SPCEs, placing a drop of precursorsolution onto the working electrode area. With this approach aH2O2 sensitivity of ∼0.23 A M−1 cm−2 has been achieved.
An important advance in the context of the electro-depositionof PB (and other hexacyanoferrates) was the addition of cetyltrimethyl ammonium bromide (CTAB), a cationic surfactant[18–21]. With this approach, a significantly enhanced film growth,efficient and rapid charge transfer, and extremely high stabilityhave been reported [18–23]. However, many of these studies todate have focused mainly on the use of CTAB as a stabilizing agentfor PB deposited on classical electrodes, usually GCEs.
In the present paper we compare the effect of differentcationic surfactants (CTAB, benzethonium chloride (BZT) and
0927-7765/$ – see front matter © 2011 Elsevier B.V. All rights reserved.doi:10.1016/j.colsurfb.2011.11.047
161
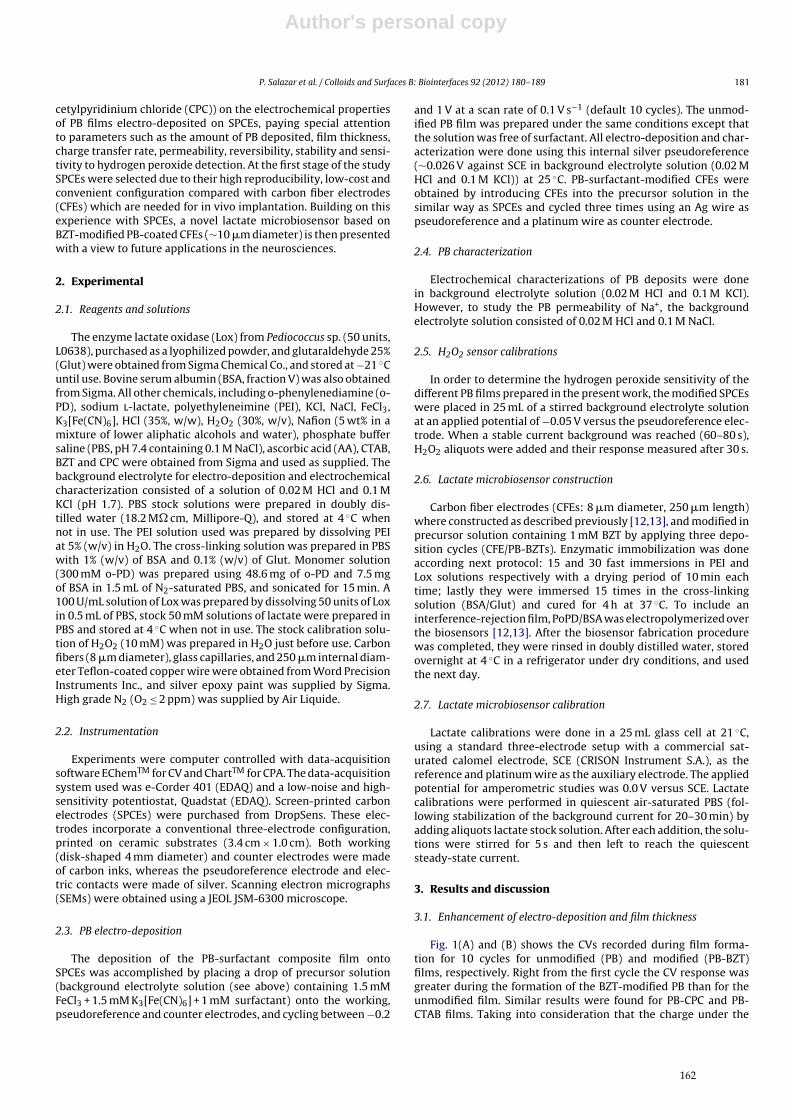
Author's personal copy
P. Salazar et al. / Colloids and Surfaces B: Biointerfaces 92 (2012) 180– 189 181
cetylpyridinium chloride (CPC)) on the electrochemical propertiesof PB films electro-deposited on SPCEs, paying special attentionto parameters such as the amount of PB deposited, film thickness,charge transfer rate, permeability, reversibility, stability and sensi-tivity to hydrogen peroxide detection. At the first stage of the studySPCEs were selected due to their high reproducibility, low-cost andconvenient configuration compared with carbon fiber electrodes(CFEs) which are needed for in vivo implantation. Building on thisexperience with SPCEs, a novel lactate microbiosensor based onBZT-modified PB-coated CFEs (∼10 m diameter) is then presentedwith a view to future applications in the neurosciences.
2. Experimental
2.1. Reagents and solutions
The enzyme lactate oxidase (Lox) from Pediococcus sp. (50 units,L0638), purchased as a lyophilized powder, and glutaraldehyde 25%(Glut) were obtained from Sigma Chemical Co., and stored at −21 Cuntil use. Bovine serum albumin (BSA, fraction V) was also obtainedfrom Sigma. All other chemicals, including o-phenylenediamine (o-PD), sodium l-lactate, polyethyleneimine (PEI), KCl, NaCl, FeCl3,K3[Fe(CN)6], HCl (35%, w/w), H2O2 (30%, w/v), Nafion (5 wt% in amixture of lower aliphatic alcohols and water), phosphate buffersaline (PBS, pH 7.4 containing 0.1 M NaCl), ascorbic acid (AA), CTAB,BZT and CPC were obtained from Sigma and used as supplied. Thebackground electrolyte for electro-deposition and electrochemicalcharacterization consisted of a solution of 0.02 M HCl and 0.1 MKCl (pH 1.7). PBS stock solutions were prepared in doubly dis-tilled water (18.2 M cm, Millipore-Q), and stored at 4 C whennot in use. The PEI solution used was prepared by dissolving PEIat 5% (w/v) in H2O. The cross-linking solution was prepared in PBSwith 1% (w/v) of BSA and 0.1% (w/v) of Glut. Monomer solution(300 mM o-PD) was prepared using 48.6 mg of o-PD and 7.5 mgof BSA in 1.5 mL of N2-saturated PBS, and sonicated for 15 min. A100 U/mL solution of Lox was prepared by dissolving 50 units of Loxin 0.5 mL of PBS, stock 50 mM solutions of lactate were prepared inPBS and stored at 4 C when not in use. The stock calibration solu-tion of H2O2 (10 mM) was prepared in H2O just before use. Carbonfibers (8 m diameter), glass capillaries, and 250 m internal diam-eter Teflon-coated copper wire were obtained from Word PrecisionInstruments Inc., and silver epoxy paint was supplied by Sigma.High grade N2 (O2 ≤ 2 ppm) was supplied by Air Liquide.
2.2. Instrumentation
Experiments were computer controlled with data-acquisitionsoftware EChemTM for CV and ChartTM for CPA. The data-acquisitionsystem used was e-Corder 401 (EDAQ) and a low-noise and high-sensitivity potentiostat, Quadstat (EDAQ). Screen-printed carbonelectrodes (SPCEs) were purchased from DropSens. These elec-trodes incorporate a conventional three-electrode configuration,printed on ceramic substrates (3.4 cm × 1.0 cm). Both working(disk-shaped 4 mm diameter) and counter electrodes were madeof carbon inks, whereas the pseudoreference electrode and elec-tric contacts were made of silver. Scanning electron micrographs(SEMs) were obtained using a JEOL JSM-6300 microscope.
2.3. PB electro-deposition
The deposition of the PB-surfactant composite film ontoSPCEs was accomplished by placing a drop of precursor solution(background electrolyte solution (see above) containing 1.5 mMFeCl3 + 1.5 mM K3[Fe(CN)6] + 1 mM surfactant) onto the working,pseudoreference and counter electrodes, and cycling between −0.2
and 1 V at a scan rate of 0.1 V s−1 (default 10 cycles). The unmod-ified PB film was prepared under the same conditions except thatthe solution was free of surfactant. All electro-deposition and char-acterization were done using this internal silver pseudoreference(∼0.026 V against SCE in background electrolyte solution (0.02 MHCl and 0.1 M KCl)) at 25 C. PB-surfactant-modified CFEs wereobtained by introducing CFEs into the precursor solution in thesimilar way as SPCEs and cycled three times using an Ag wire aspseudoreference and a platinum wire as counter electrode.
2.4. PB characterization
Electrochemical characterizations of PB deposits were donein background electrolyte solution (0.02 M HCl and 0.1 M KCl).However, to study the PB permeability of Na+, the backgroundelectrolyte solution consisted of 0.02 M HCl and 0.1 M NaCl.
2.5. H2O2 sensor calibrations
In order to determine the hydrogen peroxide sensitivity of thedifferent PB films prepared in the present work, the modified SPCEswere placed in 25 mL of a stirred background electrolyte solutionat an applied potential of −0.05 V versus the pseudoreference elec-trode. When a stable current background was reached (60–80 s),H2O2 aliquots were added and their response measured after 30 s.
2.6. Lactate microbiosensor construction
Carbon fiber electrodes (CFEs: 8 m diameter, 250 m length)where constructed as described previously [12,13], and modified inprecursor solution containing 1 mM BZT by applying three depo-sition cycles (CFE/PB-BZTs). Enzymatic immobilization was doneaccording next protocol: 15 and 30 fast immersions in PEI andLox solutions respectively with a drying period of 10 min eachtime; lastly they were immersed 15 times in the cross-linkingsolution (BSA/Glut) and cured for 4 h at 37 C. To include aninterference-rejection film, PoPD/BSA was electropolymerized overthe biosensors [12,13]. After the biosensor fabrication procedurewas completed, they were rinsed in doubly distilled water, storedovernight at 4 C in a refrigerator under dry conditions, and usedthe next day.
2.7. Lactate microbiosensor calibration
Lactate calibrations were done in a 25 mL glass cell at 21 C,using a standard three-electrode setup with a commercial sat-urated calomel electrode, SCE (CRISON Instrument S.A.), as thereference and platinum wire as the auxiliary electrode. The appliedpotential for amperometric studies was 0.0 V versus SCE. Lactatecalibrations were performed in quiescent air-saturated PBS (fol-lowing stabilization of the background current for 20–30 min) byadding aliquots lactate stock solution. After each addition, the solu-tions were stirred for 5 s and then left to reach the quiescentsteady-state current.
3. Results and discussion
3.1. Enhancement of electro-deposition and film thickness
Fig. 1(A) and (B) shows the CVs recorded during film forma-tion for 10 cycles for unmodified (PB) and modified (PB-BZT)films, respectively. Right from the first cycle the CV response wasgreater during the formation of the BZT-modified PB than for theunmodified film. Similar results were found for PB-CPC and PB-CTAB films. Taking into consideration that the charge under the
162
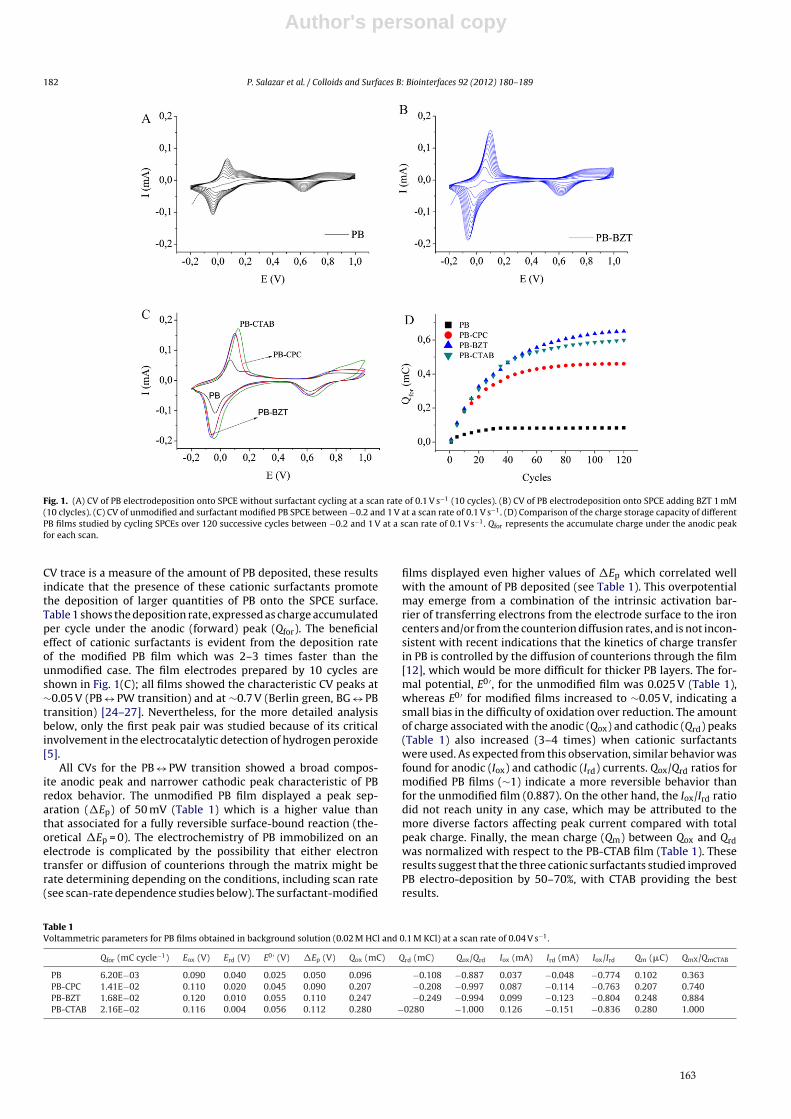
Author's personal copy
182 P. Salazar et al. / Colloids and Surfaces B: Biointerfaces 92 (2012) 180– 189
Fig. 1. (A) CV of PB electrodeposition onto SPCE without surfactant cycling at a scan rate of 0.1 V s−1 (10 cycles). (B) CV of PB electrodeposition onto SPCE adding BZT 1 mM(10 clycles). (C) CV of unmodified and surfactant modified PB SPCE between −0.2 and 1 V at a scan rate of 0.1 V s−1. (D) Comparison of the charge storage capacity of differentPB films studied by cycling SPCEs over 120 successive cycles between −0.2 and 1 V at a scan rate of 0.1 V s−1. Qfor represents the accumulate charge under the anodic peakfor each scan.
CV trace is a measure of the amount of PB deposited, these resultsindicate that the presence of these cationic surfactants promotethe deposition of larger quantities of PB onto the SPCE surface.Table 1 shows the deposition rate, expressed as charge accumulatedper cycle under the anodic (forward) peak (Qfor). The beneficialeffect of cationic surfactants is evident from the deposition rateof the modified PB film which was 2–3 times faster than theunmodified case. The film electrodes prepared by 10 cycles areshown in Fig. 1(C); all films showed the characteristic CV peaks at∼0.05 V (PB ↔ PW transition) and at ∼0.7 V (Berlin green, BG ↔ PBtransition) [24–27]. Nevertheless, for the more detailed analysisbelow, only the first peak pair was studied because of its criticalinvolvement in the electrocatalytic detection of hydrogen peroxide[5].
All CVs for the PB ↔ PW transition showed a broad compos-ite anodic peak and narrower cathodic peak characteristic of PBredox behavior. The unmodified PB film displayed a peak sep-aration (Ep) of 50 mV (Table 1) which is a higher value thanthat associated for a fully reversible surface-bound reaction (the-oretical Ep = 0). The electrochemistry of PB immobilized on anelectrode is complicated by the possibility that either electrontransfer or diffusion of counterions through the matrix might berate determining depending on the conditions, including scan rate(see scan-rate dependence studies below). The surfactant-modified
films displayed even higher values of Ep which correlated wellwith the amount of PB deposited (see Table 1). This overpotentialmay emerge from a combination of the intrinsic activation bar-rier of transferring electrons from the electrode surface to the ironcenters and/or from the counterion diffusion rates, and is not incon-sistent with recent indications that the kinetics of charge transferin PB is controlled by the diffusion of counterions through the film[12], which would be more difficult for thicker PB layers. The for-mal potential, E0 ′, for the unmodified film was 0.025 V (Table 1),whereas E0 ′ for modified films increased to ∼0.05 V, indicating asmall bias in the difficulty of oxidation over reduction. The amountof charge associated with the anodic (Qox) and cathodic (Qrd) peaks(Table 1) also increased (3–4 times) when cationic surfactantswere used. As expected from this observation, similar behavior wasfound for anodic (Iox) and cathodic (Ird) currents. Qox/Qrd ratios formodified PB films (∼1) indicate a more reversible behavior thanfor the unmodified film (0.887). On the other hand, the Iox/Ird ratiodid not reach unity in any case, which may be attributed to themore diverse factors affecting peak current compared with totalpeak charge. Finally, the mean charge (Qm) between Qox and Qrdwas normalized with respect to the PB-CTAB film (Table 1). Theseresults suggest that the three cationic surfactants studied improvedPB electro-deposition by 50–70%, with CTAB providing the bestresults.
Table 1Voltammetric parameters for PB films obtained in background solution (0.02 M HCl and 0.1 M KCl) at a scan rate of 0.04 V s−1.
Qfor (mC cycle−1) Eox (V) Erd (V) E0 ′ (V) Ep (V) Qox (mC) Qrd (mC) Qox/Qrd Iox (mA) Ird (mA) Iox/Ird Qm (C) QmX/QmCTAB
PB 6.20E−03 0.090 0.040 0.025 0.050 0.096 −0.108 −0.887 0.037 −0.048 −0.774 0.102 0.363PB-CPC 1.41E−02 0.110 0.020 0.045 0.090 0.207 −0.208 −0.997 0.087 −0.114 −0.763 0.207 0.740PB-BZT 1.68E−02 0.120 0.010 0.055 0.110 0.247 −0.249 −0.994 0.099 −0.123 −0.804 0.248 0.884PB-CTAB 2.16E−02 0.116 0.004 0.056 0.112 0.280 −0280 −1.000 0.126 −0.151 −0.836 0.280 1.000
163

Author's personal copy
P. Salazar et al. / Colloids and Surfaces B: Biointerfaces 92 (2012) 180– 189 183
The surface coverage of the electroactive species generated fromthe PW → PB transition, 0
Fe3+ , was calculated using Eq. (1):
0Fe3+ = Qox
nfA(1)
where n the number of electrons consumed (n = 1), F is theFaraday constant and A the working electrode area, calcu-lated geometrically (A = 0.126 cm2); these results are summarizedin Table 2. The unmodified electrode gave a 0
Fe3+ value
of 7.25 ± 0.18 × 10⁻⁹ mol cm−2 (mean ± SD, n = 3). Surfactant-modified electrodes displayed a consistently higher value:2.05 ± 0.35 × 10⁻⁸ mol cm−2 (mean ± SD, n = 3), indicating that PBdeposition was improved (2–3 times) when surfactants wereused, consistent with data reported previously for other substrates[18–23].
The thickness of the film, d, was estimated taking account of thenumber of unit cells present on the electrode surface, geometricalparameters of the PB cell, and the working electrode area, accordingthe Eq. (2):
d =(
Qox
nFA
)(l3NA
4
)= 0
Fe3+
(l3NA
4
)(2)
where NA is Avogadro’s number and l is the length of the unit cell(1.02 nm) [27], although this value must be considered an esti-mation because the density of the modified film is not available.Modified films showed a thickness of 33 ± 6 nm (mean ± SD, n = 3)which is likely to represent a minimum value due to the additionalbulk of the surfactant, whereas the PB film electro-deposited with-out any surfactant was only ∼12 nm thick (Table 2). This findingconfirms that thicker films are obtained in the presence of cationicsurfactants [18–23].
The charge storage capacity of different films was also stud-ied by cycling SPCEs over 120 successive cycles. Fig. 1(D) showsthe Qfor evolution against number of cycles, starting with the bareSPCE. All films showed an increase in accumulated charge in eachsuccessive cycle. Nevertheless, the rate of formation was greaterwhen surfactants were present in the precursor solution (discussedabove). For the unmodified PB film after ∼20 cycles, Qfor reacheda plateau value (0.082 mC), after which there was no significantincrease. In contrast, Qfor for modified PB films continued increasinguntil 50–80 cycles, showing higher deposition efficiency and higherquantity of PB deposited onto the SPCE surface in the presenceof surfactants. According Kumar’s mechanism [23], surfactants,close to their miscellar concentration (cmc), can assist depositionof PB on the electrode surface by interacting favorably with solu-tion constituents and the SPCE surface, increasing the efficiencyof PB formation. In our case 1 mM concentration was used for allsurfactants, which is close to the cmc of CTAB [23], CPC [28–30]and BZT [31,32]. Finally CTAB and BZT show better depositionefficiency (∼0.6 mC) than CPC (∼0.45 mC).Fig. 2 shows PB films gen-erated cycling 120 times in the absence of surfactant (Fig. 2(A)) andwith 1 mM BZT (Fig. 2(B)), and indicate that the two films have amarkedly different morphology. Whereas the unmodified PB filmshowed a very thin deposit with some areas apparently PB free(revealing the bare Pt), the PB-BZT film displayed the importantcolumnar growing pattern of cubic structures onto a well definedPB film background. These findings demonstrate better depositionefficiency when BZT is present in the precursor solution and is ingood concordance with data described above; see Fig. 1(D). TheSEM data reveal a clear improvement in the crystal growth duringPB electro-deposition when surfactant is used. This is in agreementwith independent studies [21], where the authors found, using X-ray diffraction, that the degree of crystallinity is much higher forPB films incorporating surfactant.
Fig. 2. Scanning electron micrographs (SEM) at a 5000 magnification for: (A) PB and(B) PB-BZT electrodes. Both films were deposited onto Pt over 120 successive cyclesbetween −0.2 and 1 V at a scan rate of 0.1 V s−1.
3.2. Permeability of PB films
It has been demonstrated that PB films display a specific trans-port of alkali metal cations due to its zeolite structure [33,34,1],with a cubic cell of 1.02 nm and channel diameter of about0.32 nm [27,35]. These geometrical conditions affect the transportof cations during PB ↔ PW transition (see Eq. (3) for electron trans-fer reactions in the presence of potassium chloride as supportingelectrolyte), so only cations with lower hydrated diameter such asK+ (0.25 nm), Rb+ (0.26 nm), and Cs+ (0.24 nm) [35] can penetrateinto the structure during this conversion.
(PB) Fe(III)4[Fe(II)(CN)6]3 + 4e− + 4 K+
↔ (PW) K4Fe(II)4[Fe(II)(CN)6]3 (3)
In order to demonstrate beneficial effects of modified PB filmson ionic transport, the permeability for K+ was investigated. Theeffect of scan rate (v) on Iox and Ird for all configurations was stud-ied in background electrolyte (0.02 M HCl and 0.1 M KCl) from0.14 to 0.26 V s−1. Plotting Iox and Ird against the square root ofscan rate, a linear relationship was observed (data not shown),indicating that diffusion of electrolyte across the films, at thisscan rate range, limits the reaction rate rather than surface-boundprocesses (for further discussion see below). Considering a

Author's personal copy
184 P. Salazar et al. / Colloids and Surfaces B: Biointerfaces 92 (2012) 180– 189
Table 2Surface coverage, film thickness and electrode-kinetic parameters obtained for the PB anodic peak of different electrodes recorded in pH 1.7 (0.02 M HCl + 0.1 M KCl), exceptfor mNa+ and DNa+ that were obtained in the presence of 0.02 M HCl + 0.1 M NaCl.
Cycles 0Fe3+ (mol cm−2) d (nm) mK+ (mA (V s−1)−1/2) DK+ (cm2 s−1) mNa+ (mA (V s−1)−1/2) DNa+ (cm2 s−1) ks (s−1) S (A M−1 cm−2)
PB 10 7.25E−09 11.6 0.38 8.24E−12 0.17 2.59E−12 1.20 0.59 0.44PB-CPC 10 1.71E−08 27.3 0.79 4.42E−11 0.42 2.12E−11 0.57 0.67 0.63PB-BZT 10 2.04E−08 32.5 0.81 5.33E−11 0.44 2.53E−11 0.42 0.67 0.62PB-CTAB 10 2.40E−08 38.3 0.89 8.53E−11 0.55 4.58E−11 0.41 0.70 0.63
reversible diffusion-controlled process and using Eq. (4) at 25 C[36]:
Iox = 2.69 × 10⁵n3/2ACD1/2v1/2 (4)
where D is the apparent diffusion coefficient of cation and C the con-centration of cation in the PB film. CK+ , concentration of potassiumin the film, has been calculated for each film according Purnaghi-Azar et al. [37,38], and finally the apparent diffusion coefficientfor potassium, DK+ , has been obtained from the slope (mK+ ) ofIox against v1/2 (Table 2). These data reveal that the permeabil-ity of the modified PB film was greater than the unmodified one(DK+ unmodified = 8.24 × 10⁻¹² cm2 s−1), by almost an order of mag-nitude, and PB-CTAB film showed the highest value (DK+ PB-CTAB =8.53 × 10⁻¹¹ cm2 s−1). Thus modified films, with increased porosityand lower rigidity for facile entry and exit of charge compensatingK+ ions, can facilitate interconversion between PB ↔ PW forms andenhance its electrochemical properties.
Permeability for Na+, with higher hydrated diameter (0.37 nm),was also obtained for all films, in a similar way to K+. During thesestudies background electrolyte consisted of a solution of 0.02 MHCl and 0.1 M NaCl (pH 1.7). These data (mNa+ , DNa+ ) are reportedin Table 2. Permeability for this larger hydrated cation was lowerthan the values obtained for K+. Nevertheless, DNa+ for all modifiedfilms are greater than DK+ for the unmodified film, highlighting thebeneficial effect of surfactants and the enhancement of PB electro-chemical properties. However, a significant current decrease and anegative shift of E0 ′ occurred when films were cycled (at 0.1 V s−1
in the presence of Na+), indicating that although crystallinity andlattice defects have been improved, lattice channel size is enoughto allow freer diffusion of Na+. In this context it is interesting tocompare CVs (in 0.02 M HCl and 0.1 M KCl) before and after cyclingPB films in a medium containing Na+ ions (50 cycles at 0.1 V s−1
in 0.02 M HCl and 0.1 M NaCl) (see Fig. 3). The surfactant-modifiedPB films recovered by ∼86% (Iafter/Ibefore) of the initial current (Iox),whereas unmodified PB films reached a value of only ∼40%, indicat-ing a significant degradation. These data reveal that the irreversibledamage due to the insertion of hydrated Na+ ions is attenuated forsurfactant-modified PB films, and is consistent with higher DNa+values obtained for modified films reported in this work and byothers [21].
3.3. Charge transfer rate of PB films
Surfactant-modified PB films displayed higher values of peakseparation, Ep, than the unmodified film. Nevertheless all filmsshowed an increase in Ep when the scan rate was increased,characteristic of quasi-reversible electrochemistry. This behav-ior was accentuated in modified PB films even at low scan rate(0.04 V s−1) where unmodified PB films displayed the lowest Ep
value (see Table 1). Fig. 4(A) shows a CV obtained for a PB-CTABfilm scanning from 0.03 to 0.9 V s−1. Plotting Iox and Ird againstv and v1/2 (Fig. 4(B) and (C), respectively) we can observe howpeak currents are linearly proportional to the scan rate between arange of 0.03–0.15 V s−1, suggesting that the kinetic limitations are
Fig. 3. CVs of PB deposited in the presence of 1 mM CTAB at different scan rates (ranging from 0.005 to 0.9 V s−1) in background electrolyte solution. (B) Non-linear dependenceof anodic and cathodic peak currents of PB-CTAB modified SPCE on the potential scan rate (v). (C) Linear dependence of anodic and cathodic peak currents of PB-CTAB modifiedSPCE on the square root of v. (D) Dependence of anodic and cathodic potential of PB-CTAB modified SPCE on log v.
165

Author's personal copy
P. Salazar et al. / Colloids and Surfaces B: Biointerfaces 92 (2012) 180– 189 185
Fig. 4. CVs of different H2O2 sensor in background solution (0.02 M HCl and 0.1 M KCl) before and after cycling PB films in presence of Na+ (0.02 M HCl and 0.1 M NaCl) during50 cycles at a scan rate of 0.1 V s−1.
associated mainly with charge propagation in the film. Neverthe-less at higher scan rates 0.2–0.9 V s−1 the anodic and cathodic peaksare linearly proportional to the square root of scan rate, which isexpected for a diffusion-controlled process. Similar results werefound for the other three configurations (data not shown). Thesedata reveal that electrochemistry of PB immobilized on an elec-trode is complicated by the possibility that either electron transferor diffusion of counterions through the matrix might be rate deter-mining depending on the experimental conditions, including scanrate, as showed previously Pournaghi-Azar et al. [38].However, thegreater Ep values obtained at higher scan rate may result fromlimiting charge transfer kinetics. Plotting Eox and Erd against log(v)(Fig. 4(D)) we obtain a linear dependence at high v as indicatedby Laviron [39]. Similar results were found for the other films.Finally, kinetic parameters, such as the surface electron transferrate constant (ks) and the transfer coefficient (˛) were calculated(see Table 2) from the linear Eox versus log(v) plot based on Laviron’sequation (Eq. (5)), derived for Ep > 200/n mV [37]:
Eox = E0′ +[
RT
(1 − ˛)nF
]ln
[(1 − a)nF
RT
] [ vks
](5)
where
slope = 2.303RT
(1 − a)nF= S (6)
intercept = E0′ + S log(
2.303S
)− S log(ks) (7)
where E0 ′ was obtained for each film experimentally. For theunmodified film, ks gave a value of 1.2 s−1 that is in good agreementwith data reported previously for PB and analogues [23,37,38]. The
value ( = 0.59) obtained indicates that the redox transition stateis not fully symmetrical. Interestingly, for films prepared undersimilar conditions Ep values for modified films was higher thanfor the unmodified PB film (see Table 1); this finding together withthe ks and values (see Table 2) obtained for modified PB films
suggest that electron-transfer rate is slower and displays a moreirreversible behavior than for the unmodified film.
3.4. Sensitivity of PB films toward H2O2
For similar electro-deposition conditions (10 cycles), allsurfactant-modified PB films displayed higher sensitivities towardH2O2 than for the unmodified PB film (Table 2). Fig. 5 shows a cal-ibration curve for PB and PB-BZT films from 0 to 1.1 mM H2O2,showing clearly the higher sensitivity of the modified film. Fig. 5(inset) denotes the CV response for background electrolyte solu-tion and for this background solution plus 10 mM H2O2. In thiscase the catalytic reduction at PB-BZT film is again clear com-pared with the unmodified PB film. Even unmodified PB showed ahydrogen peroxide sensitivity of 0.44 A M−1 cm−2 that is ∼3 [15,16]and ∼2 [17] times higher than previous values reported in theliterature for SPEs; see Table 3. The mean value for surfactant-modified PB gave a sensitivity of 0.63 ± 0.01 A M−1 cm−2 which is∼5 [15,16] and ∼3 [17] times higher than previous, and is closeto data reported by Liu et al. [40], using a platinum foil electrodemodified with PB as a working electrode, and close to other PBconfigurations; see Table 3. However, this Pt-based sensor was fab-ricated by a self-assembly process, including multiple sequentialadsorption of ferric and hexacyanoferrate ions, and represents atime-consuming method when compared with the electrochemi-cal method reported in the present work. Notably, Razmi et al. [41]described a highly sensitive (0.76 A M−1 cm−2) H2O2 electrochem-ical sensor based on self-assembled PB nanoparticles on a carbonceramic electrode, which exhibited good mechanical and electro-chemical stability compared with other PB based H2O2 sensors [seereferences in 42].
A more detailed study of the two configurations (unmodifiedPB and modified PB-BZT films) showed similar time responsefor the two cases (t90% ∼ 4 s). Nevertheless, linearity in the rangefrom 0 to 400 M H2O2 was improved slightly in the modifiedfilm (r2 = 0.998) compared with the basic configuration (r2 = 0.992).
166

Author's personal copy
186 P. Salazar et al. / Colloids and Surfaces B: Biointerfaces 92 (2012) 180– 189
Fig. 5. Calibration curves from 0 to 1.1 mM H2O2 for PB and PB-BZT films recorded at −0.05 V in a stirred background electrolyte solution (0.1 M KCl, 0.02 HCl). Inset: cyclicvoltammogram recorded at 0.1 V s−1 for PB and PB-BZT films in background electrolyte solution (solid) and in background solution plus 10 mM H2O2 (dashed).
H2O2 detection limits were calculated on the basis of a signal tonoise ratio of 3 in a background electrolyte solution. While PBdisplayed a detection limit of 2.6 × 10⁻⁷ M, the value for the PB-CTAB sensor was 1.6 × 10⁻⁷ M showing a slight improvement ofthe detection limit, and both of which were more than adequatefor most biosensor applications. Comparing the optimized PB sen-sor reported in the present work with similar sensitivity devices[41], our configuration exhibited a lower LOD and higher oper-ational range, while allowing a perfect control of the amount ofPB deposited, and hence represents a versatile approach for futuredevelopment of microsensor devices [22].
3.5. Stability of PB films
The stability of modified and unmodified films was analyzedby cycling SPCEs over 250 successive cycles (see Fig. 6) in back-ground solution at 0.1 V s−1 from 0.1 to 0.3 V (for ∼33 min). Theresidual activity was calculated using the anodic peak intensity(In) for each measurement cycle and normalizing respect to thefirst one (I1). Whereas the unmodified PB film showed a significant
residual activity decay (I250/I1 = 0.65), typical for soluble PB forms[22], PB-BZT and PB-CTAB presented a slight increase (I250/I1 = 1.2)and PB-CPC remained invariant during all cycles. Kumar et al. [22]found similar behavior for PB-CTAB and suggested that this increasemay be related to slow conversion of the insoluble PB to solubleform in modified PB films during continuous cycles. Nevertheless,PB-CPC behavior has not been described previously. Additional sta-bility, especially in neutral media, may be obtained because CPC,BZT and CTAB are quaternary ammonium compounds and actingas an acid can nullify the effect of OH-ions, thereby stabilizing thePB film. Finally, electrostatic stabilization between cationic surfac-tants bilayers and clay layers may offer an additional stabilizationmechanism to prevent its dissolution.
3.6. Lactate microbiosensor
Following design strategies of glucose microbiosensors devel-oped by our group [12,13,42], we assembled a lactate microbiosen-sors (CFE/PB − BZT/Lox) based on PB − BZT modified CFEs. The mainadvance of the present configuration over classical biosensors
Table 3Comparison of some analytical parameters of different PB sensors obtained with stirred batch amperometry.
Type of sensor Deposition method Applied potential (mV) LOD (M) LR (M) S (mA M−1 cm−2) Ref.
Carbon fiber electrode Cyclic voltammetry 0 0.01 – 1000 [12]Carbon fiber electrode Cyclic voltammetry 0 0.1 – 480 [12]Graphite screen printed
electrodePB microparticlesmixed with carbon ink
0 0.25 0.4–100 137 [15]
Graphite screen printedelectrode
Chemical deposition ongraphite/GC mixedwith carbon ink
−50 0.3 0.5–1000 135 [16]
Graphite screen printedelectrode
Chemical deposition ongraphite screen printedelectrode
−50 0.1 0.1–50 234 [17]
Glassy carbon electrode Cyclic voltammetry 0 0.036 0.079–15.8 153 [22]Glassy carbon electrode Cyclic voltammetry in
presence of surfactant0 0.012 0.0038–100 979 [22]
Platinum foil electrodes Chemical depositionbased on self-assemblyprocess
−50 1 1–400 625 [40]
Carbon ceramic electrode Chemical depositionbased on self-assemblyprocess
−100 0.8 1–260 755 [41]
Graphite screen printedelectrode
Cyclic voltammetry −50 0.26 0.26–400 440 This work
Graphite screen printedelectrode
Cyclic voltammetry inpresence of surfactant
−50 0.16 0.16–400 630 This work
167

Author's personal copy
P. Salazar et al. / Colloids and Surfaces B: Biointerfaces 92 (2012) 180– 189 187
Fig. 6. First and 250th CVs for different H2O2 sensors – (A) PB, (B) PB-CPC and (C) PB-BZT – obtained cycling SPCEs over 250 successive cycles in background solution at0.1 V s−1 from 0.1 to 0.3 V (∼33 min) in background electrolyte solution (0.02 M HCl and 0.1 M KCl). (D) Evolution of the residual activity over the 250 cycles obtained as peakcurrent ratio between the nth cycle and the first (In/I1).
(based on the detection of over Pt, Pt–Ir, etc.) is its low dimensionsand low applied working potential of ∼0.0 V against SCE. Theselow dimensions (∼10 m diameter, 250 m length) will allow itsuse in neuroscience applications. The modification protocol wasdescribed in detail above. Due to the PB stability issues discussedabove, acidified K+-containing media were used for many of theexperiments to this point, and so an important question for biosen-sor applications is the functionality of PB-BZT films in physiological
conditions. Biosensors were therefore calibrated in PBS (pH 7.4,0.1 M NaCl).
Fig. 7(A) shows calibration data for lactate microbiosensors(mean ± SD, n = 3). Enzymatic parameters obtained using a Hill-modified Michaelis–Menten equation [43] were (mean ± SEM):the apparent Michaelis constant, K′ = 0.22 ± 0.03 mM; max-imum response, Imax = 2.76 ± 0.08 nA; and the Hill param-eter, h = 1.14 ± 0.05. Finally an external permselective film,
Fig. 7. (A) Calibration curve in PBS for lactate microbiosensors, CFE/PB − BZT/Lox (diameter: ∼10 m and length: 250 m), working at 0 V vs. SCE (mean ± SD n = 3). (B)Calibration raw data for CFE/PB − BZT/Lox/PoPD microbiosensor for 4 successive additions of 0.1 mM lactate (*), 3 successive additions of 0.2 mM (**) and 1 addition of 0.4 mM(***). (C) CFE/PB − BZT/Lox/PoPD response for 5 successive additions of 0.2 mM AA. (D) CFE/PB − BZT/Lox/PoPD stability during a period of 15 days (mean ± SD, n = 3).
168
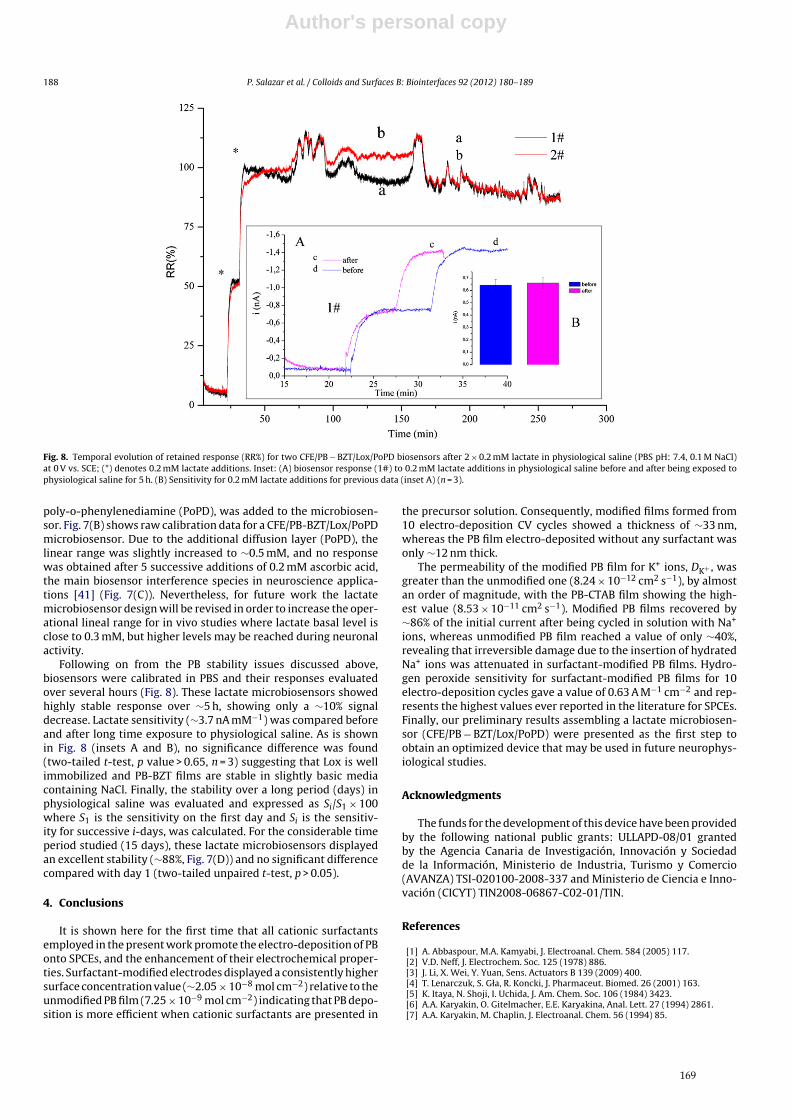
Author's personal copy
188 P. Salazar et al. / Colloids and Surfaces B: Biointerfaces 92 (2012) 180– 189
Fig. 8. Temporal evolution of retained response (RR%) for two CFE/PB − BZT/Lox/PoPD biosensors after 2 × 0.2 mM lactate in physiological saline (PBS pH: 7.4, 0.1 M NaCl)at 0 V vs. SCE; (*) denotes 0.2 mM lactate additions. Inset: (A) biosensor response (1#) to 0.2 mM lactate additions in physiological saline before and after being exposed tophysiological saline for 5 h. (B) Sensitivity for 0.2 mM lactate additions for previous data (inset A) (n = 3).
poly-o-phenylenediamine (PoPD), was added to the microbiosen-sor. Fig. 7(B) shows raw calibration data for a CFE/PB-BZT/Lox/PoPDmicrobiosensor. Due to the additional diffusion layer (PoPD), thelinear range was slightly increased to ∼0.5 mM, and no responsewas obtained after 5 successive additions of 0.2 mM ascorbic acid,the main biosensor interference species in neuroscience applica-tions [41] (Fig. 7(C)). Nevertheless, for future work the lactatemicrobiosensor design will be revised in order to increase the oper-ational lineal range for in vivo studies where lactate basal level isclose to 0.3 mM, but higher levels may be reached during neuronalactivity.
Following on from the PB stability issues discussed above,biosensors were calibrated in PBS and their responses evaluatedover several hours (Fig. 8). These lactate microbiosensors showedhighly stable response over ∼5 h, showing only a ∼10% signaldecrease. Lactate sensitivity (∼3.7 nA mM−1) was compared beforeand after long time exposure to physiological saline. As is shownin Fig. 8 (insets A and B), no significance difference was found(two-tailed t-test, p value > 0.65, n = 3) suggesting that Lox is wellimmobilized and PB-BZT films are stable in slightly basic mediacontaining NaCl. Finally, the stability over a long period (days) inphysiological saline was evaluated and expressed as Si/S1 × 100where S1 is the sensitivity on the first day and Si is the sensitiv-ity for successive i-days, was calculated. For the considerable timeperiod studied (15 days), these lactate microbiosensors displayedan excellent stability (∼88%, Fig. 7(D)) and no significant differencecompared with day 1 (two-tailed unpaired t-test, p > 0.05).
4. Conclusions
It is shown here for the first time that all cationic surfactantsemployed in the present work promote the electro-deposition of PBonto SPCEs, and the enhancement of their electrochemical proper-ties. Surfactant-modified electrodes displayed a consistently highersurface concentration value (∼2.05 × 10⁻⁸ mol cm−2) relative to theunmodified PB film (7.25 × 10⁻⁹ mol cm−2) indicating that PB depo-sition is more efficient when cationic surfactants are presented in
the precursor solution. Consequently, modified films formed from10 electro-deposition CV cycles showed a thickness of ∼33 nm,whereas the PB film electro-deposited without any surfactant wasonly ∼12 nm thick.
The permeability of the modified PB film for K+ ions, DK+ , wasgreater than the unmodified one (8.24 × 10⁻¹² cm2 s−1), by almostan order of magnitude, with the PB-CTAB film showing the high-est value (8.53 × 10⁻¹¹ cm2 s−1). Modified PB films recovered by∼86% of the initial current after being cycled in solution with Na+
ions, whereas unmodified PB film reached a value of only ∼40%,revealing that irreversible damage due to the insertion of hydratedNa+ ions was attenuated in surfactant-modified PB films. Hydro-gen peroxide sensitivity for surfactant-modified PB films for 10electro-deposition cycles gave a value of 0.63 A M−1 cm−2 and rep-resents the highest values ever reported in the literature for SPCEs.Finally, our preliminary results assembling a lactate microbiosen-sor (CFE/PB − BZT/Lox/PoPD) were presented as the first step toobtain an optimized device that may be used in future neurophys-iological studies.
Acknowledgments
The funds for the development of this device have been providedby the following national public grants: ULLAPD-08/01 grantedby the Agencia Canaria de Investigación, Innovación y Sociedadde la Información, Ministerio de Industria, Turismo y Comercio(AVANZA) TSI-020100-2008-337 and Ministerio de Ciencia e Inno-vación (CICYT) TIN2008-06867-C02-01/TIN.
References
[1] A. Abbaspour, M.A. Kamyabi, J. Electroanal. Chem. 584 (2005) 117.[2] V.D. Neff, J. Electrochem. Soc. 125 (1978) 886.[3] J. Li, X. Wei, Y. Yuan, Sens. Actuators B 139 (2009) 400.[4] T. Lenarczuk, S. Gła, R. Koncki, J. Pharmaceut. Biomed. 26 (2001) 163.[5] K. Itaya, N. Shoji, I. Uchida, J. Am. Chem. Soc. 106 (1984) 3423.[6] A.A. Karyakin, O. Gitelmacher, E.E. Karyakina, Anal. Lett. 27 (1994) 2861.[7] A.A. Karyakin, M. Chaplin, J. Electroanal. Chem. 56 (1994) 85.
169

Author's personal copy
P. Salazar et al. / Colloids and Surfaces B: Biointerfaces 92 (2012) 180– 189 189
[8] A.A. Karyakin, E.E. Karyakina, Sens. Actuators B 57 (1999) 268.[9] B. Haghighi, S. Varma, F.M. Alizadeh, Y. Yigzaw, L. Gorton, Talanta 64 (2004) 3.
[10] H. Shi, Y. Yang, J. Huang, Z. Zhao, X. Xu, J. Anzai, T. Osa, Q. Chen, Talanta 70(2006) 852.
[11] X. Wang, H. Gu, F. Yin, Y. Tu, Biosens. Bioelectron. 24 (2009) 1527.[12] P. Salazar, M. Martín, R. Roche, R.D. O’Neill, J.L. González-Mora, Electrochim.
Acta 55 (2010) 6476.[13] P. Salazar, M. Martín, R. Roche, J.L. González-Mora, R.D. O’Neill, Biosens. Bio-
electron. 26 (2010) 748.[14] J. Wang, X. Zhang, Anal. Lett. 32 (1999) 1739.[15] M.P. O’Halloran, M. Pravda, G.G. Guilbault, Talanta 55 (2001) 605.[16] F. Ricci, A. Amine, C.S. Tuta, A.A. Ciucu, F. Lucarelli, G. Palleschi, D. Moscone,
Anal.Chim. Acta 485 (2003) 111.[17] F. Ricci, A. Amine, G. Palleschi, D. Moscone, Biosens. Bioelectron. 18 (2003) 165.[18] R. Vittal, M. Jayalakshmi, H. Gomathi, G. Prabhakara Raoa, J. Electrochem. Soc.
146 (1999) 786.[19] R. Vittal, H. Gomathi, G. Prabhakara Rao, Electrochim. Acta 45 (2000) 2083.[20] R. Vittal, H. Gomathi, K.J. Kim, Adv. Colloid Interface 119 (2006) 55.[21] R. Vittal, K.J. Kim, H. Gomathi, V. Yegnaraman, J. Phys. Chem. B 112 (2008) 1149.[22] S.M. Senthil Kumar, K. Chandrasekara Pillai, Electrochem. Commun. 8 (2006)
621.[23] S.M. Senthil Kumar, K. Chandrasekara Pillai, J. Electroanal. Chem. 589 (2006)
167.
[24] K. Itaya, T. Ataka, S. Toshima, J. Am. Chem. Soc. 104 (1982) 4767.[25] K. Itaya, T. Ataka, S. Toshima, T. Shinohara, J. Phys. Chem. 86 (1982) 2415.[26] A.A. Karyakin, Electroanalysis 13 (2001) 813.[27] F. Herren, P. Fischer, A. Ludi, W. Halg, Inorg. Chem. 19 (1980) 956.[28] E.W. Anacker, J. Phys. Chem. 62 (1958) 41.[29] A.B. Mandal, B.U. Nair, J. Phys. Chem. 95 (1991) 9008.[30] T.V. Vladimirova, L.M. Ramenskaya, Russ. J. Phys. Chem. 80 (2006) 836.[31] H.H. Paradies, U. Hinze, M. Thies, Berich. Bunsen.Gesell. 98 (1994) 938.[32] F. Kopecky, B. Kopecká, P. Kaclík, Ceska Slov. Farm. 55 (2006) 175.[33] K. Itaya, K. Shibayama, H. Akahoshi, S. Toshima, J. Appl. Phys. 53 (1982) 804.[34] J.J. García-Jareno, D. Giménez-Romero, F. Vicente, C. Gabrielli, M. Keddam, H.
Perrot, J. Phys. Chem. B 107 (2003) 11321.[35] F. Ricci, G. Palleschi, Biosens. Bioelectron. 21 (2005) 389.[36] J. Wang, Analytical Electrochemistry, third ed., John Wiley & Sons Inc., New
Jersey, 2006.[37] M.H. Pournaghi-Azar, H. Razmi-Nerbin, Electroanalysis 12 (1999) 209.[38] M.H. Pournaghi-Azar, N. Nahalparvari, J. Solid State Electrochem. 8 (2004) 550.[39] E. Laviron, J. Electroanal. Chem. 101 (1979) 19.[40] Y. Liu, Z. Chua, W. Jin, Electrochem. Commun. 11 (2009) 484.[41] H. Razmi, R. Mohammad-Rezaei, H. Heidari, Electroanalysis 21 (2009) 2355.[42] P. Salazar, R.D. O’Neill, M. Martín, R. Roche, J.L. González-Mora, Sens. Actuators
B 152 (2011) 137.[43] S.S. El Atrash, R.D. O’Neill, Electrochim. Acta 40 (1995) 2791.
170

Author's personal copy
Improvement and characterization of surfactant-modified Prussian bluescreen-printed carbon electrodes for selective H2O2 detection at low appliedpotentials
P. Salazar a,⇑, M. Martín a, R.D. O’Neill b, R. Roche a, J.L. González-Mora a
a Neurochemistry and Neuroimaging Group, Faculty of Medicine, University of La Laguna, Tenerife, Spainb UCD School of Chemistry and Chemical Biology, University College Dublin, Belfield, Dublin 4, Ireland
a r t i c l e i n f o
Article history:Received 7 February 2012Received in revised form 30 March 2012Accepted 9 April 2012Available online 19 April 2012
Keywords:Prussian blueScreen-printed carbon electrodes (SPCEs)SurfactantBenzethonium chloride (BZTC)H2O2 sensor
a b s t r a c t
The development of a highly selective and sensitive H2O2 sensor, based on the electro-deposition of Prus-sian blue (PB) onto screen-printed carbon electrodes (SPCEs) modified by benzethonium chloride (BZTC),is described. This methodology provides a time-efficient method for producing stable films in the presenceof a BZTC concentration which was optimized with respect to electrochemical and electroanalytical prop-erties. Some parameters such as the amount of PB deposited, film thickness, reversibility, permeability,stability, electrocatalytic properties and sensitivity to H2O2 were considered in order to select the optimalsensor. Under optimal conditions (2 mM BZTC), the surface coverage and apparent diffusion coefficient forK+ displayed values of 6.4 ± 0.2 108 mol cm2 and 5.2 1011 cm2 s1, respectively, one order of mag-nitude higher than without surfactant. The catalytic rate constant for the optimized film was2.8 103 M1 s1 which was in good agreement with data found in the literature. BZTC(2 mM)/PB oper-ating at0 V vs. SCE displayed the highest H2O2 sensitivity (1.07 ± 0.03 A M1 cm2, n = 5) reported in theliterature to date for PB-modified SPCEs, and showed an excellent limit of detection (<107 M) and linear-ity range (up to1.5 mM). Sensors incorporating BZTC were significantly more stable in media containingNa+ ions, even at neutral pH, than unmodified devices, critical properties for sensor applications in biolog-ical environments. Finally, BZTC(2 mM)/PB-based sensors stored dry at room temperature over 4 monthsretained the 90% of their initial response to H2O2, a useful property for commercial applications.
2012 Elsevier B.V. All rights reserved.
1. Introduction
Prussian blue (PB) is a hexacyanoferrate with two different ironvalences (+2 and +3) and was initially developed as a blue pigmentin the 1700s [1]. Since Neff [2] reported for the first time the suc-cessful deposition of a thin layer on a platinum foil and Itaya et al.[3] showed that the reduced form of Prussian blue (also calledPrussian white, PW) had a catalytic effect on the reduction of bothO2 and H2O2, many publications have appeared exploring its elec-trocatalytic, electromagnetic and electrochromic properties [4].Following reports by Karyakin et al. [5] that PB was an excellentmaterial for use in the fabrication of biosensors because it acts asan artificial peroxidase, its applications in the biosensor field havecontinued to diversify. In addition, other useful properties such asnon-toxicity, high electrocatalytic activity and low operatingoverpotential have contributed to the diversification of its use in
enzyme-based biosensors [4–6] and label-free immunosensors[7–10].
However, the stability of PB during operation remains a centralproblem, especially in basic and neutral media which is an optimalcondition for the majority of enzymes employed in biosensor appli-cations. The reason for this behavior is ascribed to the strong inter-action between ferric ions and hydroxide ions to form Fe(OH)3 at pHhigher than 6.4 [11], leading to the destruction of the Fe–CN–Febond, and solubilizing PB [12]. To solve this problem, numerous ap-proaches (more or less complicated and tedious) have been devel-oped, such as: (1) modifying the chemical and/or electrochemicaldeposition of PB [13–15]; (2) adding external protective polymerfilms, such as poly(o-phenylenediamine), poly(o-aminophenol),poly(vinylpyrrolidone), and Nafion [16–19]; (3) using additives inthe working solution, such as tetrabutylammonium toluene4-sulfonate [20].
Focusing on the last of these approaches, surfactants have beenemployed in a great number of applications in chemistry [21],exploiting their tendency to accumulate at a surface or interfacebetween two different bulk phases, such as the electrode-solutioninterface. This property has been utilized in recent years in the
1572-6657/$ - see front matter 2012 Elsevier B.V. All rights reserved.http://dx.doi.org/10.1016/j.jelechem.2012.04.005
⇑ Corresponding author. Tel.: +34 922319363.E-mail address: [email protected] (P. Salazar).
Journal of Electroanalytical Chemistry 674 (2012) 48–56
Contents lists available at SciVerse ScienceDirect
Journal of Electroanalytical Chemistry
journal homepage: www.elsevier .com/locate / je lechem
171

Author's personal copy
surface modification of electrodes with PB and other hexacyanano-ferrates, where the presence of added surfactant offers enhancedfilm growth, improved stability and excellent electrochemicalreversibility [22–24]. This new approach represents a fast and easymethod to improve its electrocatalytic and electrochemical proper-ties, and to increase its stability in neutral and basic media.Although, studies to date have focused mainly on the use of cetyl-trimethyl ammonium bromide (CTAB), we have recently shownthat other cationic surfactants such as benzethonium chloride(BZTC) may also be used successfully [25].
Here we optimize the electro-deposition method for BZTC, andstudy the electrochemical and analytical properties of differentmodified BZTC/PB films. The improved electro-deposition methods,pH stability and permeability of the optimized BZTC/PB film pro-vide a further boost in its sensitivity for H2O2 detection, whichcan be a critical parameter in biosensor design and application.
2. Experimental
2.1. Reagents and solutions
All chemicals were obtained from Sigma and used as supplied.Stock solutions were prepared in doubly distilled water(18.2 MO cm, Millipore-Q), and stored at 4 C when not in use.
2.2. Instrumentation
Screen-printed carbon electrodes (SPCEs) were purchased fromDropSens, model DRP-110. Experiments were computer controlled,using data-acquisition software EChem™ for CV and Chart™ forCPA. The data-acquisition system used was e-Corder 401 (EDAQ)and a low-noise and high-sensitivity potentiostat, Quadstat(EDAQ). EIS experiments for sensor characterization were con-ducted with an Autolab PGSTAT 20 potentiostat and a FRA modulefrom EcoChemie, computer controlled by their general purposeelectrochemical system (GPES) and FRA software, respectively.Scanning electron micrographs (SEMs) were obtained using a JEOLJSM-6300 microscope.
2.3. PB electro-deposition
The background electrolyte solution consisted of (0.02 M HCland 0.1 M KCl; pH, 1.7). Electro-deposition of the BZTC/PB compos-ite film onto SPCEs was accomplished by placing a drop of back-ground solution with 1.5 mM FeCl3, 1.5 mM K3[Fe(CN)6] and xmM BZTC onto the combined working electrode, silver pseudore-ference and counter electrode. Finally, the SPCE was cycled be-tween 0.2 and 1.0 V at a scan rate of 0.1 V s1 (default 10cycles). These sensors will be termed BZTC(x mM)/PB. The unmod-ified PB film was prepared under the same conditions except thatthe solution was free of surfactant. All electro-deposition and char-acterization were carried out using the internal silver pseudorefer-ence (0.026 V against SCE in background solution at 25 C).
2.4. PB characterization
Electrochemical characterization was done in backgroundelectrolyte at 0.1 V s1. However, to study the PB stability in Na+-containing solutions, the background electrolyte solution consistedof 0.02 M HCl and 0.1 M NaCl (solution-A). PB stability as a functionof pH was investigated in phosphate buffer and in backgroundsolution adjusted to different pH values, both in 0.1 M KCl. EISmeasurements were performed in background electrolyte solution.The stabilization potential was set to +80 mV against SCE, thesignal amplitude was 5 mV and the frequency range was
130 kHz10 Hz. In order to obtain better SEMs, unmodified andmodified PB films were electro-deposited onto Pt electrodes.
2.5. H2O2 sensor calibrations
H2O2 sensitivities were obtained according to the following pro-tocol. The modified SPCEs were placed in 25 mL of a stirred back-ground solution sample. The stock calibration solution of H2O2
(10 mM) was prepared in water just before use. When a stable cur-rent was reached in the background electrolyte (100 s) H2O2 ali-quots were added and their response measured after 20 s. Theresponse time (t90%) for the sensors was also determined in thisway.
3. Results and discussion
3.1. Electrochemical characterization
Fig. 1A shows the CVs recorded during film formation for 10 cy-cles for PB and BZTC(2 mM)/PB films (scan rate 0.1 V s1). Rightfrom the first cycle the CV response was greater during the forma-tion of the BZTC(2 mM)/PB film. Taking into consideration that thecharge under the CV trace is a measure of the amount of PB depos-ited (see Section 3.2), these results indicate that the presence ofBZTC promotes the deposition of larger quantities of PB onto theSPCE surface. The BZTC concentration in the precursor solutionwas optimized in the range 0–5 mM, values straddling its criticalmicellar concentration (cmc 2.8 mM) (Supplementary MaterialSM_figure 1). BZTC(x mM)/PB showed the characteristic CV peakpair at 0.07 V (PB M PW (Prussian White) transition) and at0.8 V (PB M BG (Berlin Green) transition) [3–6]. Nevertheless,only the first peak pair was studied here because of its criticalinvolvement in the electrocatalytic detection of H2O2 in first gener-ation biosensor [4,6,16,25–27]. Fig. 1B shows that more PB wasdeposited when BZTC concentration was increased until 2 mM;at higher concentrations the CV amplitude decreased considerably,suggesting that electro-deposition is inhibited to some extent athigher surfactant concentration.
Peak charge, current and potential were calculated for differentconfigurations and summarized in Table 1 (scan rate 20 mV s1).Current and charge data displayed similar behavior, showing high-er values close to 2 mM BZTC (Qox = 0.544 mC). The formal poten-tial, E00, also showed a minimum in this concentration region.The finding that Qox/Qrd and Iox/Ird ratios for this quasi-reversiblesystem were 1 under most conditions studied highlights thetrapped nature of the electroactive centers on the electrode sur-face. Peak separation, DE (Table 1), which showed a strong correla-tion (>0.9) with both Qox and Qrd, displayed a maximum value justbelow the cmc (0.1 V), significantly greater than the ideal revers-ible value of 0 V and indicating an increased energy of activationfor this redox process in the thicker layers. The data for all config-urations are consistent with the mono-electronic process charac-teristic of the PB system [3,16]. Furthermore, the more detailedBZTC concentration profiles shown in Table 1 and the Supplemen-tary Material SM_figure 2 indicate its optimal level in the electro-deposition solution was close to 2.0 mM.
The charge under the oxidation (forward) peak during PB elec-tro-deposition was taken as charge storage capacity (Qfor) and wascalculated for different configurations cycling SPCEs over 120 suc-cessive cycles SM_figure 2. Again a maximum value (1.7 mC) wasobtained at 2 mM BZTC. Above this concentration a clear inhibitioneffect appeared. This finding may be related with the stabilizationof the miscelles with FeðCNÞ36 anions after the cmc is reached. Thelower cmc value in our precursor solution may be explained takingaccount that Cl and FeðCNÞ36 anions decrease the solvation of thehydrophilic part of the BZT+ molecules and reduce the electrostatic
P. Salazar et al. / Journal of Electroanalytical Chemistry 674 (2012) 48–56 49
172

Author's personal copy
repulsion between charged hydrophilic parts. These effects favorthe formation of micelles, and tend to decrease the cmc comparedwith that observed in water [21,23].
The beneficial effect of BZTC during electro-deposition may beunderstood according to Kumar’s mechanisms for CTAB [24]. Inour case, BZT+ is absorbed forming a bilayer between the negativeelectrode surface (unmodified electrode or PB film) and solution.This positive bilayer containing well oriented BZT+ shows higherreactivity towards FeðCNÞ36 , which is the precursor in formingPB. The process of alternate layer-by-layer deposition of PB andBZT+ bilayer can continue in each successive potential cycle indef-initely until the reactant materials become exhausted in solution[24]. With this mechanism, it is suggested that, when surfactantconcentration exceeds its cmc, FeðCNÞ36 -stabilized micelles de-crease free FeðCNÞ36 in the bulk solution and hence inhibits PBelectro-deposition.
3.2. Surface coverage and morphological study
The surface coverage of the electroactive species generatedfrom the PW ? PB transition, C0
Fe3þ , was determined in backgroundelectrolyte and calculated using the following equation:
C0Fe3þ ¼ Q ox=nFA ð1Þ
where n the number of electrons consumed (n = 1), F is the Faradayconstant, and A the electrochemical surface area (cm2) of the bareSPCE calculated using the Randles–Sevcik equation for a reversibleelectrochemical process under diffusion control (T = 25 C):
Ip ¼ 2:69 105n3=2ACD1=2m1=2 ð2Þ
where C is the concentration (mol cm3) of the electroactive mole-cule, D is its diffusion coefficient, and v is the scan rate (V s1). Thearea was determined using FeðCNÞ36 in 0.1 M KCl background elec-trolyte (D = 6.3 106 cm2 s1 for 0.5 mM FeðCNÞ36 in 0.1 M KCl)[28]. The electrochemical area of the bare SPCE from DropSens thusdetermined was 0.095 cm2 (CV% = 2.2, n = 4) and represents only75% of the geometrical area (0.126 cm2). This result indicates thatthe rough carbon is partially passivated due to surface contami-nants or organic binder of the carbon ink, and the value is in goodagreement with previous data in the literature [29].
The PB film deposited in the absence of BZTC showed a C0Fe3þ va-
lue of 9.61 ± 0.24 109 mol cm2 (mean ± SD, n = 3) and is in goodagreement with the amount of PB deposited by other authors usingdifferent protocols [30,31]. C0
Fe3þ for the BZTC-modified electrodesstudied here displayed a consistently higher value with the highestC0
Fe3þ value (6.43 ± 0.16 108 mol cm2, n = 8) corresponding tothe BZTC(2 mM)/PB film, approximately seven times higher than
Fig. 1. (A) CV for PB electro-deposition onto SPCE without (PB) and with 2 mM BZTC (BZTC(2 mM)/PB) at 0.1 V s1 against the internal silver pseudoreference. (B) CV ofBZTC(x mM)/PB (scan rate of 0.1 V s1). (C) CVs of BZTC(2 mM)/PB at different scan rates (ranging from 10 to 150 mV s1) in background electrolyte (0.02 M HCl and 0.1 MKCl); (D) dependence of peak currents on the scan rate and the square root of scan rate (E).
Table 1Cyclic voltammetric parameters, surface coverage and film thickness for different PB sensors obtained in background electrolyte (0.02 M HCl and 0.1 M KCl) at a scan rate of0.02 V s1.
BZTC (x mM)/PB Ird (mA) Iox (mA) Ird/Iox Erd (V) Eox (V) dE (V) Eo0 (V) Qrd (mC) Qox (mC) Qrd/Qox (Qox)i/(Qox) 2 mM C0Fe3þ (mol cm2) d (nm)
0 0.048 0.037 1.293 0.040 0.090 0.050 0.065 0.108 0.096 1.128 0.191 9.71E09 16.340.25 0.063 0.044 1.432 0.052 0.108 0.056 0.080 0.138 0.131 1.051 0.262 1.43E08 28.990.5 0.059 0.048 1.239 0.060 0.118 0.058 0.089 0.148 0.140 1.057 0.279 1.53E08 32.531 0.084 0.070 1.203 0.042 O.I24 0.082 0.083 0.261 0.252 1.038 0.502 2.75E08 52.961.5 0.116 0.111 1.044 0.022 0.120 0.098 0.071 0.481 0.462 1.041 0.921 5.27E08 101.932 0.140 0.133 1.055 0.018 0.123 0.105 0.071 0.582 0.554 1.051 1.104 6.30E08 122.602.25 0.135 0.125 1.083 0.022 0.119 0.097 0.071 0.510 0.502 1.017 1.000 5.53E08 108.323 0.086 0.086 1.009 0.034 0.109 0.075 0.072 0.430 0.399 1.077 0.796 4.36E08 79.694 0.050 0.050 1.008 0.050 0.102 0.052 0.076 0.260 0.218 1.194 0.434 2 39E08 48.645 0.021 0.021 1.019 0.072 0.104 0.032 0.088 0.125 0.091 1.375 0.182 9.97E09 22.97
50 P. Salazar et al. / Journal of Electroanalytical Chemistry 674 (2012) 48–56
173

Author's personal copy
without surfactant. Based on the value of C0Fe3þ , the electro-deposi-
tion method gave an excellent reproducibility (CV% = 2.5, n = 8), inagreement with values reported by other authors [14,32] andproviding a time-efficient method.
Morphological analysis was done by mean of scanning electronmicrographs (SEMs). Fig. 2 shows PB films generated by cycling120 times in the absence of surfactant (Fig. 2A) and with 2 and6 mM BZT (Fig. 2B and C, respectively). The present analysis revealsa clear morphological difference, depending on the experimentalconditions. Whereas the unmodified PB film showed a very thin de-posit (appreciable only at higher magnifications), the BZTC(2 mM)/PB film displayed a significant amount of deposit with a columnargrowing pattern of cubic structures onto a well-defined PB filmbackground. In contrast, the BZTC(6 mM)/PB film formation ap-peared inhibited due to the high surfactant concentration, where avery thin and poor deposit was observed at higher magnification.This observation is in good concordance with the mechanism andelectrochemical data discussed above. As expected, microanalysis(Fig. 2D and E) revealed a significant amount of Fe atoms in thefilms, confirming PB deposition onto the Pt electrodes used in theSEM studies. However, the Fe/Pt peak ratio was orders of magnitudegreater for BZTC(2 mM)/PB compared with the unmodified PB film,confirming the higher deposition efficiency in the presence ofsurfactant inferred from the electrochemical data discussed above.
Finally, the thickness of the film, d (Table 1), was estimated bytaking account of the number of unit cells present on the electrodesurface, geometrical parameters of the PB cell, and the electro-chemical surface area, according to Eq. (3) [25]:
d ¼ ðQ ox=nFAÞðl3NA=4Þ ¼ C0Fe3þ ðl3NA=4Þ ð3Þ
where NA is Avogadro’s number and l is the length of the unit cell(1.02 nm) [4]. Although this value must be considered an estimationbecause the density of the modified film is not available,BZTC(2 mM)/PB film showed a thickness of 122 nm whereas the
PB film electro-deposited without any surfactant was only16 nm thick, the latter value being in good agreement with previ-ous work [25]. This finding confirms that thicker films are obtainedin the presence of BZTC and thickness showed a similar evolutionvs. surfactant concentration as discussed above.
3.3. Permeability properties
As can be seen in reaction (4), PB redox behavior depends on thefree diffusion of cationic species across the film [4]. Due to thismechanism, only cations with small hydrated radii, such as K+,NHþ4 , Rb+ and Cs+, can support this electrochemical activity bydiffusing across the PB structure during iron center oxidation/reduction [4].
ðPBÞFeðIIIÞ4 ½FeðIIÞðCNÞ63 þ 4e þ 4Kþ $ ðPWÞK4FeðIIÞ4 ½FeðIIÞðCNÞ63ð4Þ
In order to demonstrate the beneficial effects of modified BZTC/PB films on ionic transport, the permeability for K+ was investi-gated by plotting peak currents (Iox and Ird), Fig. 1C, against the scanrate (v) and the square root of the scan rate (v1/2). This analysis (forthe BZTC(2 mM)/PB film) demonstrated that peak currents werelinearly proportional to scan rate at low scan rates (v < 50 mV s1),Fig. 1D, suggesting that the kinetic limitations were associatedmainly with charge propagation in the film. At higher scan rates,however, the anodic and cathodic peaks were linearly proportionalto the v1/2, Fig. 1E, which is expected for a diffusion-controlledprocess. These data revealed that the electrochemistry of PBimmobilized on an electrode is complicated by the possibility thateither electron transfer or diffusion of counterions through the ma-trix might be rate determining depending on the experimentalconditions, including scan rate.
Trends in the apparent diffusion coefficient for potassium in thefilm, DKþ , for different PB configurations were determined from the
Fig. 2. Scanning electron micrographs (SEMs) at a 350 and 5000 magnification for: (A) PB, (B) BZTC(2 mM)/PB and (C) BZTC(6 mM)/PB electrodes. All films were depositedonto Pt over 120 successive cycles between 0.2 and 1.0 V at a scan rate of 0.1 V s1. Microanalysis of the of PB (D) and BZTC(2 mM)/PB (E) films.
P. Salazar et al. / Journal of Electroanalytical Chemistry 674 (2012) 48–56 51
174

Author's personal copy
slope of I against v1/2 (Fig. 1E), using Eq. (2) as an approximation,where CKþ , the concentration of potassium in the film, was calcu-lated for each film according previous reports [25,33]. In these esti-mations, A has been replaced by the modified electrochemicalactive area (A) of each PB-modified sensor, calculated accordingto literature methods [29]. This approach differs from previouspublications where the bare electrode area was employed[22,25,34]. From data in Table 2 we observe that A shows a similarbehavior described above, displaying its highest value at 2 mMBZTC. The apparent K+ permeability of all modified PB filmsðfDKþgox 5:2 1011 cm2 s1Þ was greater than for the unmodi-fied case ðfDKþgox ¼ 8:5 1012 cm2 s1Þ. In order to study the glo-bal diffusion process, the ratio ðfDKþgox=fDKþgrdÞ has beencalculated for different configurations (see Table 2 for details). Inthe absence of BZTC, this ratio was 0.84 revealing a more facile dif-fusion process during the reduction step compared with oxidation,in good concordance with previous data [22,34]. In contrast, in thepresence of surfactant this ratio was close to unity, indicating a sig-nificant improvement in ion diffusion during the oxidation step.
A possible explanation for this finding is that the electrochemicalbehavior of PB films not only depends on the real rate of transport ofcations through the film but also on the ease of insertion-expulsionof cations during the electrochemical processes [35]. In this sense,the slightly modified zeolite channels dimensions, or more probablythe increased porosity and lower rigidity of the surfactant-modifiedPB film, may improve potassium expulsion during the oxidationstep and hence facilitate the interconversion between PW ? PBforms, enhancing its electrochemical reversibility.
3.4. Electrochemical impedance spectroscopy analysis
Electrochemical impedance spectroscopy (EIS) was used todetermine the interfacial properties of surface-modified electrodesfor PB, BZTC(1 mM)/PB and BZTC(2 mM)/PB films in backgroundelectrolyte. A typical shape of a Faradic impedance spectrum in-cludes a semicircle region (at higher frequencies, correspondingto a charge-transfer limited process) and a straight line portion(at lower frequencies, representing a diffusion-limited process).The semicircle diameter in the impedance spectrum equates tothe charge-transfer resistance, Rct, at the electrode surface. Theexperimental Faradaic impedance spectra were fitted using a gen-eral Randles electronic equivalent circuit, which is very often usedto model interfacial phenomena (for details see [26]). Fig. 3 showsEIS data for the three configurations, where it is clear that, depend-ing on the concentration of BZTC employed, the PB film displayeddifferent charge-transfer resistance properties. Fitting these datawith the equivalent circuit (see above), the Rct values obtainedwere 12.7, 6.8 and 3.2 X for PB, BZTC(1 mM)/PB andBZTC(2 mM)/PB, respectively. These data reveal that, in the pres-ence of surfactant, electron-transfer properties of the PB film areenhanced. The lower Rct value for BZTC(2 mM)/PB shows that thisconfiguration improves the electric conducting properties of thefilm and facilitates the charge-transfer process, in good agreementwith the CV data discussed above.
3.5. Electrocatalytic reduction of H2O2 on PB-modified electrodes
In order to compare the electrocatalytic activity of BZTC(2 mM)/PB and PB modified electrodes, their response to H2O2 was mea-sured. In acid media, H2O2 detection can be described by the fol-lowing reaction [36]:
H2O2 þ 2e þ 2Hþ ! 2H2O ð5Þ
CV analysis revealed that, with the addition of 10 mM H2O2, thecathodic peak current increased and the anodic peak current de-creased, indicating an electrocatalytic reduction of H2O2 for bothconfigurations (data not shown). In order to get more informationabout the catalytic reaction mechanism, CVs of the modified elec-trodes were recorded in the presence of 1 mM H2O2 at various scanrates; data for the BZTC(2 mM)/PB configuration are shown inFig. 4A. Plots of cathodic peak current against scan rate (Fig. 4B)and square root of scan rate (Fig. 4C) suggest a mass-transfer con-trolled process for H2O2; furthermore the current function, Ird/v1/2
vs. v plot (Fig. 4D) indicates that exchange process between H2O2
and the redox site of the BZTC(2 mM)/PB modified electrode is con-trolled by an EC0 mechanism [37]; qualitatively similar resultswere obtained for the unmodified PB electrode.
More information about the electrocatalytic reaction of the twoconfigurations (PB and BZTC(2 mM)/PB) was obtained from chro-noamperometric data. Fig. 5A shows the current-time plots forthe PB sensor recorded following stepping the applied potentialfrom open circuit conditions to 0.05 V in the absence and pres-ence of H2O2 in the concentration range 0–6 mM. The time evolu-tion of the semi-infinite linear diffusion-controlled current isdescribed by the Cottrell equation [38]:
I ¼ nFACðD=ptÞ1=2 ð6Þ
Table 2Apparent diffusion coefficient for potassium, DKþ , for different sensor configurations obtained in background electrolyte (0.02 M HCl + 0.1 M KCl).
BZTC (x mM)/PB A (cm2) fDKþ gox (cm2 s1) fDKþ grd (cm2 s1) fDKþ gox=fDKþ grd
0 0.121 8.5E12 1.0E11 0.841 0.235 4.2E11 4.3E11 0.922 0.342 5.2E11 5.3E11 0.983 0.250 5.1E11 4.9E11 1.044 0.136 5.2E11 5.1E11 1.025 0.103 4.7E11 4.7E11 1.00
Fig. 3. EIS of PB, BZTC(1 mM)/PB and BZTC(2 mM)/PB configurations in backgroundelectrolyte (0.02 M HCl and 0.1 M KCl), stabilization potential: +0.08 mV, signalamplitude: 5 mV and frequency range: 130 kHz–10 Hz.
52 P. Salazar et al. / Journal of Electroanalytical Chemistry 674 (2012) 48–56
175

Author's personal copy
where the modified electrochemical active area (A) of each PB-modified sensor was used, as in Eq. (2). The plot of I vs. t1/2 at eachconcentration of H2O2 was linear (Fig. 5B), and the slopes of theresulting straight lines were plotted vs. H2O2 concentration. Theslope of the resulting straight line was then used to estimate thediffusion coefficient for H2O2 (Fig. 5C). The average values of Dwere 5.4 106 and 5.6 106 cm2 s1 for unmodified PB andBZTC(2 mM)/PB sensors, respectively. These values are fairly consis-tent with the range 2.3 106 to 1.6 105 cm2 s1 reported else-where [37,39–42], and are in good agreement with the valueobtained for other PB and hexacyanoferrate sensors found in the lit-erature [36,37,42].
Chronoamperometry was also used for the evaluation of thecatalytic rate constant, kcat. At intermediate times, when the cur-rent is dominated by the rate of the electrocatalyzed reduction ofH2O2, the catalytic current (Icat) can be written as follows [43]:
Icat=IL ¼ ðkcatpCtÞ1=2 ð7Þ
where IL is the current of the BZTC(2 mM)/PB or PB in the absence ofH2O2 and Icat is the catalytic current due to the addition of 1 mMH2O2. Over a limited time frame, the values of Icat/IL were linearlydependent on t1/2, and from its slope kcat was calculated. The valuesobtained were 1.1 103 and 2.8 103 M1 s1 for PB and
Fig. 4. (A) CV for BZTC(2 mM)/PB in the presence of 1 mM H2O2 at different potential scan rates, from 10 to 300 mV s1. Insets (B) and (C) represent the variations of thecathodic peak current against scan rate (v) and the square root of scan rate (v1/2), respectively; (D) variation of the cathodic current function, I/v1/2 vs. v. Supporting electrolytewas as in Fig. 1.
Fig. 5. (A) Chronoamperograms for a PB sensor in different concentration of H2O2: 0, 0.5, 1, 2, 3, 4, 6 mM; (B) plots of I vs. t1/2 obtained from the data of (A); (C) plot of theabsolute value of the slopes (mi) obtained from (B) vs. the concentration of H2O2. The step potential was 0.05 V against the internal silver pseudoreference.
P. Salazar et al. / Journal of Electroanalytical Chemistry 674 (2012) 48–56 53
176

Author's personal copy
BZTC(2 mM)/PB, respectively, and are in good agreement with datafound in the literature [44]. The higher value for BZTC(2 mM)/PB isconsistent with the finding that kcat has been found to be dependenton the amount of Prussian blue deposited, indicating that H2O2 pen-etrates the films, and the inner layers of the polycrystalline matrixtake part in the catalysis [44].
3.6. Stability of PB films
Due to geometrical restriction in the lattice, PB is sensitive tothe insertion of the more highly hydrated Na+ ions [14,16,25]. PBand BZTC(2 mM)/PB sensors were cycled three times in the stan-dard background electrolyte, 250 times in solution-A (containingNa+), and finally a further three times in background electrolyte.The peak current ratio after and before being exposed to Na+ ionsshowed a recovery of 86% for BZTC(2 mM)/PB, whereas the surfac-tant-free PB sensor recovered only 47%, showing a significant lostof redox activity (for details, see SM_figure 4). These data revealthat the irreversible damage caused by Na+, an undesirable prop-erty for sensors designed for biological applications, is attenuatedfor the BTZC(2 mM)/PB configuration, and is consistent with higherDNaþ values obtained for surfactant-modified films reported in ourprevious work [25].
In order to study the pH stability here, sensors were cycled 100times (at 0.1 V s1 from 0.1 to 0.3 V) in different solutions adjustedin a large pH range. The residual activity was calculated using theanodic peak intensity for the 100th cycle (I100) for each configura-tion and normalizing it with respect to the first one (I1) (Fig. 6A).Unmodified PB films were highly unstable, even in acid media,and displayed a significant signal decrease (by 70%) at pH 7.4. Incontrast, the optimized BZTC(2 mM)/PB sensors, with and withoutthermal treatment (100 C during 1 h) [14], showed highly stableresponse, conserving 100% of the signal below pH 6, and losingonly 10% of the initial signal at the end of the 100 cycles at pH7.4. This excellent stability, especially in neutral media, may be ob-tained because BZTC is a quaternary ammonium compound, andacting as an acid to nullify the effect of OH ions, thereby stabiliz-ing the PB film. Finally, electrostatic interactions between cationicsurfactants bilayers and clay layers may offer an additional stabil-ization mechanism to prevent its dissolution [24].
3.7. Sensitivity and selectivity toward H2O2
In previous work [16,25–27], we demonstrated that ascorbicacid (AA) is the main endogenous interference in physiologicalapplications due to its low redox potential and high concentrationin many biological media. Thus AA is the prototypical electroactiveinterference species in a great number of analytical applications.The choice of applied potential at the working electrode istherefore fundamental to achieve the lowest detection limit andto avoid the possibility of interference in biosensor applications.The response to 0.1 mM H2O2 and 1 mM AA (one order of magni-tude higher) was therefore evaluated here. These data (Fig. 6B) re-veal that PB at negative applied potentials, where it is in the PWform, showed higher sensitivity to H2O2, whereas at positivepotentials the PB form did not respond significantly to H2O2. Incontrast, the AA response (oxidation) displayed a higher responsewhen the applied potential was more positive, reaching a maxi-mum value at +0.2 V, close to the optimal range found by otherauthors for the electro-catalytic detection of AA based on PB-mod-ified electrodes [45]. On the other hand, a small cathodic incrementin the interference signal appeared at 0.2 V, which may be attrib-uted to the electrocatalytic reduction of O2 reported by our group[16] and by other authors at this potential [3,4]. From these results(Fig. 6B), it is evident that the optimal potential range was ob-served between 0.05 and 0.15 V, where the selectivity ratio
(100 AA/H2O2) was 61%. An applied potential value of 0.05 Vwas therefore selected for further sensor characterization to avoidpossible interference by reduction of molecular oxygen at morecathodic potentials.
Calibration curves for different H2O2 sensors configurations(from 0 to 1.1 mM H2O2) were obtained (Fig. 7A). A visual inspec-tion (Fig. 7B) revealed that BZTC(2 mM)/PB showed the highestsensitivity and linearity. Analytical parameters, summarized inTable 3, showed that BZTC(2 mM)/PB displayed the best sensitivity(1.07 ± 0.03 A M1 cm2, n = 5), limit of detection (LOD = 9.3 108 M) and linearity (r2 = 0.9998). Sensitivity, coefficient of deter-mination, and LOD (see Table 3 and SM_figure 5) for the differentconfigurations showed similar behavior described above for otherelectrochemical parameters, displaying analytically better valueswhen BZTC concentration was increased up to the optimal concen-tration (2 mM), and then a clear deterioration occurred at highersurfactant concentrations.
This H2O2 sensitivity value represents an improvement on ourprevious work [25] and is higher than previous PB-modified SCPEsvalues found in the literature (for details see SM_Table 1 and refer-ences in [25]). The time response for all configurations was mea-sured in batch conditions after H2O2 additions; in this case allsensors studied showed fast response times (t90% 4 s), Fig. 7C.
The last important parameter investigated in the present studywas the effect of storage time on H2O2 sensitivity. In order toexamine this effect, different sensor configurations were preparedand stored in dark and dry conditions at room temperature for
Fig. 6. (A) pH stability for different sensor configurations: without (PB) and with2 mM BZTC (BZTC(2 mM)/PB) present during the electro-deposition step, and withand without additional thermal treatment (Q) at 100 C for 1 h. Experiments weredone in phosphate buffer and in background electrolyte adjusted to different pHvalues, both in 0.1 M KCl. (B) Sensitivity (H2O2) and selectivity (ascorbic acid, AA)responses plotted against applied potential, background solution being employed assupporting electrolyte.
54 P. Salazar et al. / Journal of Electroanalytical Chemistry 674 (2012) 48–56
177

Author's personal copy
4 months. Fig. 7D shows calibration curves in a range from 0 to1.5 mM H2O2 for a freshly prepared BZTC(2 mM)/PB and for astored BZTC(2 mM)/PB sensor. As can be seen, sensitivity after thislong storage time was well retained, preserving 92% of the initialresponse. Other BZTC(2 mM)/PB sensors showed similar results(between 86 and 90% of the initial response). Other configurationssuch as BZTC(1 mM)/PB also showed similar stability. These datareveal the excellent stability of the BZTC-modified PB depositedonto SPCEs that may be stored during long time periods, whichmay be useful for future commercial applications.
4. Conclusions
We have optimized the electro-deposition method for PB in thepresence of BZTC, and studied the electrochemical and analyticalproperties for different PB film configurations. The BZTC(2 mM)/PB configuration showed the best electrochemical behavior withimproved surface coverage and diffusion parameters. The electro-deposition method displayed an excellent reproducibility, CV%2.5. Under optimal conditions we were able to develop a highlysensitive H2O2 sensor (1.07 A M1 cm2) with a detection limit of107 M. At the selected applied potential, the defined selectivityratio against AA was better than 1%. This design showed betterH2O2 sensitivity than previous configurations based on modifiedSPCEs, and represents a less time-consuming method when com-
pared with other highly sensitive sensors. PB-modified electrodesshowed good stability in neutral and weakly alkali solutions, with-out further treatment. The stability of PB-modified SCPEs was sat-isfactory, at least for 4 months stored dry in the dark at roomtemperature.
Acknowledgments
The funds for the development of this device have been pro-vided by the Ministerio de Industria, Turismo y Comercio (TSI-020100-2011-189 and TSI-020100-2010-346) and Ministerio deCiencia e Innovación (TIN2011-28146 and TIN2008-06867-C02-01/TIN). We thank Dr. J.L. Rodriguez Marrero and J. Florez Montañofor help in EIS measurements.
Appendix A. Supplementary material
Supplementary data associated with this article can be found, inthe online version, at http://dx.doi.org/10.1016/j.jelechem.2012.04.005.
References
[1] J. Brown, J. Philos. Trans. 33 (1724) 17–24.[2] V.D. Neff, J. Electrochem. Soc. 125 (1978) 886–887.[3] K. Itaya, T. Ataka, S.J. Toshima, J. Am. Chem. Soc. 104 (1982) 4767–4772.[4] F. Ricci, G. Palleschi, Biosens. Bioelectron. 21 (2005) 389–407.[5] A.A. Karyakin, O. Gitelmacher, E.E. Karyakina, Anal. Lett. 27 (1994) 2861–2869.[6] P. Salazar, M. Martín, R. Roche, J.L. González-Mora, R.D. O’Neill, Biosens.
Bioelectron. 26 (2010) 748–753.[7] Z. Song, R. Yuan, Y. Chai, J. Wang, X. Che, Sens. Actuators B 145 (2010) 817–825.[8] Z. Zhong, J. Shan, Z. Zhang, Yi Qing, D. Wang, Electroanalysis 22 (2010) 2569–
2575.[9] S. Chen, R. Yuan, Y. Chai, Y. Xu, Ligen Min, N. Li, Sens. Actuators B 135 (2008)
236–244.[10] W. Shi, Z. Ma, Biosens. Bioelectron. 26 (2011) 3068–3071.[11] B.J. Feldman, R.W. Murray, Inorg. Chem. 26 (1987) 1702–1708.[12] A.A. Karyakin, E.E. Karyakina, Sens. Actuators B 57 (1999) 268–273.
Fig. 7. (A) Successive amperometric response for BZTC(x mM)/PB films from 0 to 1.1 mM H2O2 recorded at 0.05 V in stirred background electrolyte: (a) 0, (b) 1, (c) 2 and (d)3 mM BZTC; (B) Calibration curves for the sensors in (A); (C) Time response of BZTC(2 mM)/PB. (D) Calibration curves for BZTC(2 mM)/PB sensor, both fresh and after4 months of dry storage in the dark, from 0 to 1.5 mM H2O2. Calibration conditions were as in (A).
Table 3Comparison of some analytical parameters of different PB sensors obtained withbatch amperometry at 0.05 V in a stirred background electrolyte. Sensitivity datanormalized respect to the electrochemical area of the bare SPCE.
BZTC (mM) S (A M1) r2 S (A M1 cm2) LOD (lM)
0 0.0399 0.9876 0.420 0.3401 0.0692 0.9936 0.728 0.2022 0.102 0.9998 1.074 0.0933 0.0832 0.9976 0.876 0.1194 0.0405 0.9981 0.426 0.2055 0.0213 0.9852 0.224 0.451
P. Salazar et al. / Journal of Electroanalytical Chemistry 674 (2012) 48–56 55
178

Author's personal copy
[13] D. Moscone, D. D’Ottavi, D. Compagnone, G. Palleschi, A. Amine, Anal. Chem. 73(2001) 2529–2535.
[14] F. Ricci, A. Amine, G. Palleschi, D. Moscone, Biosens. Bioelectron. 18 (2003)165–174.
[15] I.L. de Mattos, L. Gorton, T. Ruzgas, Biosens. Bioelectron. 18 (2003) 193–200.[16] P. Salazar, M. Martín, R. Roche, R.D. O’Neill, J.L. González-Mora, Electrochim.
Acta 55 (2010) 6476–6484.[17] L.V. Lukachova, E.A. Kotel’nikova, D. D’Ottavi, E.A. Shkerin, E.E. Karyakina, D.
Moscone, G. Palleschi, A. Curulli, A.A. Karyakin, Bioelectrochemistry 55 (2002)145–148.
[18] T. Uemura, S. Kitagawa, J. Am. Chem. Soc. 125 (2003) 7814–7815.[19] D. Pan, J. Chen, L. Nie, W. Tao, S. Yao, Electrochim. Acta 49 (2004) 795–801.[20] M.S. Lin, W.C. Shih, Anal. Chim. Acta 381 (1999) 183–189.[21] S. Paria, K.C. Khilar, Adv. Colloid Interface 110 (2004) 75–95.[22] R. Vittal, H. Gomathi, G. Prabhakara Rao, Electrochim. Acta 45 (2000) 2083–
2093.[23] R. Vittal, K.J. Kim, H. Gomathi, V. Yegnaraman, J. Phys. Chem. B 112 (2008)
1149–1156.[24] S.M. Senthil Kumar, K. Chandrasekara Pillai, J. Electroanal. Chem. 589 (2006)
167–175.[25] P. Salazar, M. Martín, R.D. O’Neill, R. Roche, J.L. González-Mora, Colloid Surface
B 92 (2012) 180–189.[26] P. Salazar, R.D. O’Neill, M. Martín, R. Roche, J.L. González-Mora, Sens. Actuators
B 152 (2011) 137–143.[27] R. Roche, P. Salazar, M. Martín, F. Marcano, J.L. González-Mora, J. Neurosci.
Method 202 (2011) 192–198.[28] A.J. Bard, L.R. Faulkner, Electrochemical Methods: Fundamentals and
Applications, second ed., John Wiley & Sons, Inc., New York, 2001.
[29] P. Fanjul-Bolado, P. Queipo, P.J. Lamas-Ardisana, A. Costa-García, Talanta 74(2007) 427–433.
[30] B. Haghighi, N. Shams, L. Gorton, Electroanalysis 19 (2007) 1921–1932.[31] A.A. Karyakin, E.A. Puganova, I.A. Budashov, I.N. Kurochkin, E.E. Karyakina, V.A.
Levchenko, V.N. Matveyenko, S.D. Varfolomeyev, Anal. Chem. 76 (2004)474–478.
[32] B. Haghighi, H. Hamidi, L. Gorton, Sens. Actuators B 147 (2010) 270–276.[33] M.H. Pournaghi-Azar, N. Nahalparvari, J. Solid State Electrochem. 8 (2004)
550–557.[34] R. Vittal, M. Jayalakshmi, H. Gomathi, G. Prabhakara Rao, J. Electrochem. Soc.
146 (1999) 786–793.[35] J.J. García-Jareño, D. Giménez-Romero, F.V.C. Gabrielli, M. Keddam, H. Perrot, J.
Phys. Chem. B 107 (2003) 11321–11330.[36] L. Muresan, G.L. Turdean, I.C. Popescu, J. Appl. Electrochem. 38 (2008) 349–
355.[37] H. Razmi, R. Mohammad-Rezaei, H. Heidari, Electroanalysis 21 (2009) 2355–
2362.[38] A.J. Bard, L.R. Faulkner, Electrochemical Methods: Fundamentals and
Applications, Wiley, New York, 1980.[39] B. Csoka, G. Nagy, J. Biochem. Biophys. Method 61 (2004) 57–67.[40] P.A. Forshey, T. Kuwana, Inorg. Chem. 22 (1983) 699–707.[41] J. Huang, C. Zhang, W. Zhang, X. Zhou, J. Electroanal. Chem. 433 (1997) 33–39.[42] H. Yu, Q.L. Sheng, J.B. Zheng, Electrochim. Acta 52 (2007) 4403–4410.[43] H. Razmi, A. Taghvimi, Int. J. Electrochem. Sci. 5 (2010) 751–762.[44] A.A. Karyakin, E.E. Karyakina, L. Gorton, J. Electroanal. Chem. 456 (1998) 97–
104.[45] S.S.L. Castro, V.R. Balbo, P.J.S. Barbeira, N.R. Stradiotto, Talanta 55 (2001) 249–
254.
56 P. Salazar et al. / Journal of Electroanalytical Chemistry 674 (2012) 48–56
179

Supplementary Materials
Figure and Table Captions
SM_figure 1.- Conductometric determination of the critical micellar concentration
(cmc) for BZTC in water as the change in the slope when the specific conductance vs.
surfactant concentration in H2O was plotted.
SM_figure 2.- (Top) Comparison of the charge storage capacity of different BZTC(x
mM)/PB films studied by cycling SPCEs over 120 successive cycles between –0.2 and
1.0 V at a scan rate of 0.1 V s–1. Qfor represents the accumulated charge under the
anodic peak for each scan. (Bottom) Plot of the maximum charge stored vs. the
concentration of BZTC in the solution.
SM_figure 3.- CVs for PB and BZTC(2 mM)/PB films in background electrolyte
before and after being cycled 250 times in solution-A (0.02 M HCl and 0.1 M NaCl) at a
scan rate of 0.1 V s–1.
SM_figure 4.- Analytical parameter evolution for different BZTC(x mM)/PB
configurations, x = 0, 1, 2, 3, 4 and 5.
SM_table 1.- Comparison of some analytical parameters of different PB sensors
obtained with stirred batch amperometry.
180
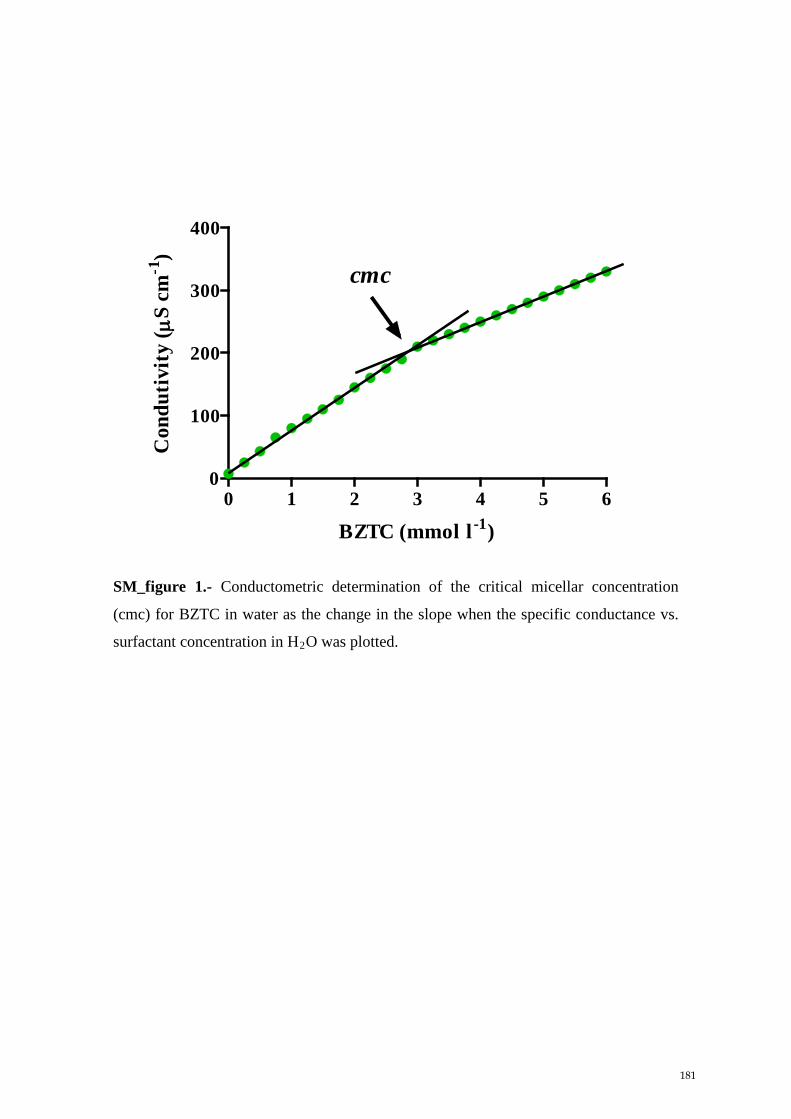
0 1 2 3 4 5 60
100
200
300
400
cmc
BZTC (mmol l-1)
Con
duti
vity
( µS
cm-1
)
SM_figure 1.- Conductometric determination of the critical micellar concentration
(cmc) for BZTC in water as the change in the slope when the specific conductance vs.
surfactant concentration in H2O was plotted.
181
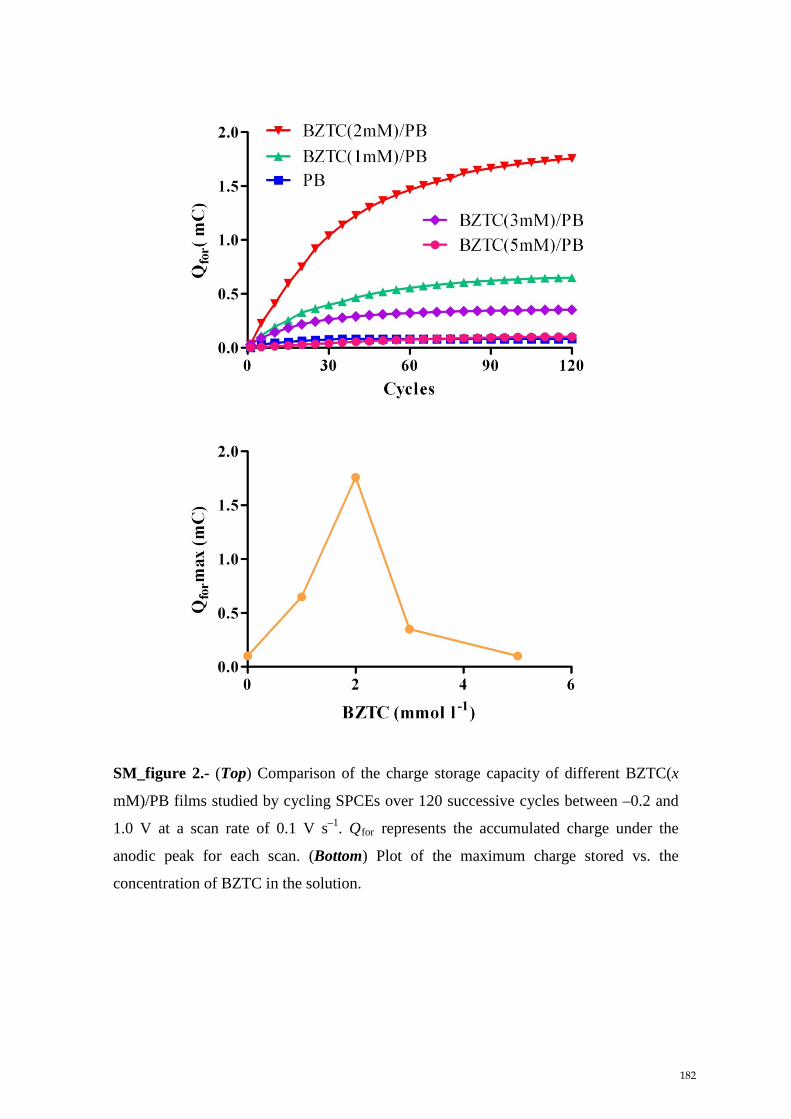
SM_figure 2.- (Top) Comparison of the charge storage capacity of different BZTC(x
mM)/PB films studied by cycling SPCEs over 120 successive cycles between –0.2 and
1.0 V at a scan rate of 0.1 V s–1. Qfor represents the accumulated charge under the
anodic peak for each scan. (Bottom) Plot of the maximum charge stored vs. the
concentration of BZTC in the solution.
182

-0.4 -0.2 0.0 0.2 0.4 0.6-0.15
-0.10
-0.05
0.00
0.05
0.10
BeforeAfter
PB
E( V)
I (m
A)
-0.4 -0.2 0.0 0.2 0.4 0.6-0.4
-0.2
0.0
0.2
0.4
BeforeAfter
BZTC(2mM)/PB
E( V)
I (m
A)
SM_figure 3.- CVs for PB and BZTC(2 mM)/PB films in background electrolyte
before and after being cycled 250 times in solution-A (0.02 M HCl and 0.1 M NaCl) at a
scan rate of 0.1 V s–1.
183

SM_figure 4.- Analytical parameter evolution for different BZTC(x mM)/PB
configurations, x = 0, 1, 2, 3, 4 and 5.
184

SM_table 1.- Comparison of some analytical parameters of different PB sensors
obtained with stirred batch amperometry.
*References in previous group’s publications [25].
Type of sensor Deposition method Applied potential (mV) LOD (µM) LR (µM) S (mA M-1 cm-2) Ref.
Carbon fiber electrode Cyclic voltammetry 0
0.01 -
1000
[12]*
Carbon fiber electrode Cyclic voltammetry
0
0.1 -
480
[12]*
Graphite screen printed electrode
PB microparticles mixed with carbon ink 0 0.25 0.4 - 100 137 [15]*
Graphite screen printed electrode
Chemical deposition on graphite/GC mixed with carbon
ink -50 0.3 0.5 - 1000 135 [16]*
Graphite screen printed electrode
Chemical deposition on graphite screen printed electrode -50 0.1 0.1 - 50 234 [17]*
Glassy carbon electrode Cyclic voltammetry 0 0.036 0.079 - 15.8 153 [22]* Glassy carbon electrode Cyclic voltammetry in presence
of surfactant 0 0.012 0.0038 - 100 979 [22]*
Platinum foil electrodes Chemical deposition based on self-assembly process -50 1 1 - 400 625 [41]*
Carbon ceramic electrode Chemical deposition based on self-assembly process -100 0.8 1 - 260 755 [42]*
Graphite screen printed electrode
Cyclic voltammetry -50 0.26 0.26 - 400 440 [25]
Graphite screen printed electrode
Cyclic voltammetry in presence of surfactant -50 0.16 0.16 - 400 630 [25]
Graphite screen printed electrode
Cyclic voltammetry in presence of surfactant -50 0.093 0.093 - 1500 1074 This work
185

Int. J. Electrochem. Sci., 7 (2012) 5910 - 5926
International Journal of
ELECTROCHEMICAL SCIENCE
www.electrochemsci.org
Biosensors Based On Prussian Blue Modified Carbon Fibers
Electrodes for Monitoring Lactate in The Extracellular Space of
Brain Tissue
P. Salazar1*
, M. Martín1, R.D. O’Neill
2, R. Roche
1 and J.L. González-Mora
1
1 Neurochemistry and Neuroimaging group, Faculty of Medicine, University of La Laguna, Tenerife,
Spain. 2
UCD School of Chemistry and Chemical Biology, University College Dublin, Belfield, Dublin 4,
Ireland. *E-mail: [email protected]
Received: 10 May 2012 / Accepted: 4 June 2012 / Published: 1 July 2012
During recent decades, a new paradigm has emerged in neuroscience from growing evidence that
lactate, and not glucose, has the more important role as an energy substrate during neural activation.
Based on these findings, the astrocyte–neuron–lactate shuttle hypothesis (ANLSH) has been proposed.
Over the same period, biosensors have become an important tool for in-vivo studies, providing higher
time and spatial resolution over microdialysis and other neuroanalytical techniques. In this work we
present a new lactate microbiosensor based on Prussian Blue (PB)-modified carbon fiber electrodes
(CFEs) that allows the detection of enzyme-generated hydrogen peroxide at a low applied potential (~0
V against SCE), contrasting the high overpotential used in many previous designs based on platinum
transducers (~0.7 V). Here, optimization of the fabrication procedure is described, including activation
of CFE/PB, enzyme immobilization, anti-biofouling and anti-interference properties. Finally, to
illustrate the potential use of this approach, some in-vivo results are presented, including
pharmacological, physiological and electrophysiological stimulation, showing that this microbiosensor
design is well suited to exploring the role of lactate in brain extracellular fluid.
Keywords: Biosensor, Carbon fiber electrode, Brain lactate, Prussian Blue, Oxygen sensor.
1. INTRODUCTION
During the last decade an important debate has been generated about the regulation of brain
metabolic responses to neuronal activity [1-6]. Brain cells are dependent on a continuous supply of
energy, glucose being its main fuel under normal physiological conditions. Because the brain has very
little energy reserve, a continuous vascular supply of glucose and oxygen is mandatory to sustain
186

Int. J. Electrochem. Sci., Vol. 7, 2012
5911
neuronal activity. Historically, lactate was considered a dead-end metabolite of glycolysis or a sign of
hypoxia and anaerobic energy metabolism [7, 8]. However, a body of evidence has been accumulated
to indicate that large amounts of lactate can be produced in many tissues under fully aerobic conditions
[8-13]. Therefore, some authors point out that lactate could be used as a supplementary fuel [2, 14, 15],
and has even been suggested to be the predominant oxidative substrate over glucose during neural
activation [6, 16, 17]. Due to these findings, the astrocyte–neuron–lactate shuttle hypothesis (ANLSH)
has been suggested [14, 15, 18]. According to this model, during neural activation the uptake of
glutamate leads to glucose uptake into the astrocytes, and its glycolysis generates lactate which is
exported into the extracellular compartment where it is taken up by neurons for its ultimate
phosphorylation. This idea has divided the neuroscience community into two schools, and has
generated an intense discussion [1-6, 14-22]. Most of the evidence for ANLSH are based on in-vitro
experiments and on the presence of some enzymes and transporters required in the proposed
hypothesis [3, 11-13]. ANLSH argues a causal sequence of events that can only be tested under in-vivo
conditions. Traditionally, microdialysis has been employed for monitoring extracellular metabolites in
vivo [23-25]; unfortunately, this technique often displays poor time resolution (10–30 min). More
recently, biosensors have been shown to be an excellent analytical tool, providing high spatial and
temporal resolution, and enough sensitivity and selectivity for in-vivo experiments [26]. In this way,
microdialysis technique has been coupled with biosensor technology [27, 28], presenting as its main
advance over conventional sample collection better time resolution (as low as 30 s) [29]. Nevertheless,
implantable biosensors based on carbon fiber electrodes (CFEs) have smaller dimensions (~10 µm
diameter) than microdialysis probes (200–500 µm), which attenuates traumatic brain injury during
insertion [30], and provides yet higher time resolution, allowing real-time correlation with animal
behavior [31-35].
In recent years our group has been working on Prussian Blue modified microelectrodes to
detect enzyme-generated H2O2 at low applied potentials (0 V vs. SCE) as an alternative to
conventional noble metal based transducers often employed in first-generation biosensors for
physiological applications. Thanks to this approach glucose biosensors reached very low dimensions
(~10 µm diameter) and displayed excellent in-vitro and in-vivo responses [32-35]. Now we present a
new lactate biosensor adapting our previous glucose biosensor design, exploring and optimizing the
main fabrication steps in order to improve sensitivity, stability, selectivity and anti-biofouling
properties. Finally, in order to show its potential use in physiological studies we present some in-vivo
experiments with this optimized lactate biosensor.
2. EXPERIMENTAL
2.1 Reagents and Solutions
The enzyme lactate oxidase (Lox) from Pediococcus sp., purchased as a lyophilized powder,
and glutaraldehyde (Glut, 25%) were obtained from Sigma Chemical Co., and stored at –21 ºC until
use. Bovine serum albumin (BSA, fraction V) and all other chemicals, including o-phenylenediamine
187

Int. J. Electrochem. Sci., Vol. 7, 2012
5912
(o-PD), lactate, polyethyleneimine (PEI), KCl, NaCl, CaCl2, FeCl3, K3[Fe(CN)6], HCl (35% w/w),
H2O2 (30% w/v), Nafion (5% w/w in a mixture of lower aliphatic alcohols and water) and phosphate
buffer saline (PBS, pH 7.4 containing 0.1 M NaCl) were also obtained from Sigma, and used as
supplied. The interference compounds: glucose, ascorbic acid (AA), uric acid (UA), dopamine (DA),
3,4-dihydroxyphenylacetic acid (DOPAC), serotonin (5-HT), glutamate (Glu) and glutamine (Gln)
were obtained for Aldrich-Sigma, and used as supplied. PBS stock solutions were prepared in doubly
distilled water (18.2 MΩ cm, Millipore-Q), and stored at 4 °C when not in use. A stock 50 mM
solution of lactate was prepared in water, and stored at 4 ºC when is not in use. The PEI solutions were
prepared by dissolving PEI at x% w/v in H2O. The cross-linking solution was prepared in PBS with
1% w/v of BSA and 0.1% w/v of Glut. Monomer solution of 300 mM o-PD was prepared using 48.6
mg of o-PD and 7.5 mg of BSA in 1.5 mL of N2 saturated PBS and sonicating for 15 min. A 100
units/mL solution of Lox was prepared by dissolving 50 units in 0.5 mL of PBS. Interference solutions
were prepared in water just before use and, if necessary, the pH was adjusted to 7.4. Carbon fibers (8
µm diameter), Platinum/Iridium wire (25 µm diameter), glass capillaries, and 250 µm internal diameter
Teflon-coated copper wire were obtained from Word Precision Instruments Inc. and silver epoxy paint
was supplied by Sigma.
2.2 Instrumentation and Software
Experiments were computer controlled with data-acquisition software EChem™ for CV and
Chart™ for constant potential amperometry (CPA). The data-acquisition system used was e-Corder
401 (EDAQ) and a low-noise and high-sensitivity potentiostat, Quadstat (EDAQ). CV and
electrochemical impedance spectroscopy (EIS) experiments for micro-biosensor characterization were
conducted with an Autolab PGSTAT 20 potentiostat and a FRA module from EcoChemie, computer
controlled by their General Purpose Electrochemical System (GPES) and FRA software, respectively.
The linear and non-linear regression analyses were performed using the graphical software package
Prism (GraphPad Software, ver. 5.00). To electro-deposit and activate the PB, a custom-made
Ag/AgCl/saturated KCl reference electrode and platinum wire auxiliary electrode were used.
2.3 Amperometric experiments
2.3.1 In vitro
CV and EIS experiments for PB characterization were measured in electrolyte support solution
(0.1 M XCl and 0.1 M HCl (X being either Na or K)) or (0.1 M CaCl2 and 0.1 M HCl). Experimental
conditions for EIS measurements were: applied potential +0.1 V against SCE, signal amplitude 5 mV
and frequency range 40 kHz–0.5 Hz. All in-vitro experiments were done in a 25 mL glass cell at 21
°C, using a standard three-electrode set-up with a commercial saturated calomel electrode (SCE,
CRISON Instrument S.A.) as the reference and platinum wire as the auxiliary electrode. The
previously determined optimum applied potential for amperometric studies on CFE/PB-based
biosensors was 0 V against SCE [32-35]. Lactate calibrations were performed in quiescent air-
188

Int. J. Electrochem. Sci., Vol. 7, 2012
5913
saturated PBS (following stabilization of the background current for 20 min) by adding aliquots of
lactate stock solution to the electrochemical cell. After each addition, the solutions were stirred for 5 s
and then left to reach the steady-state current.
2.3.2 In vivo
These experiments were carried out with male rats of ~300 g (Sprague Dawley) in accordance
with the European Communities Council Directive of 1986 (86/609/EEC) regarding the care and use
of animals for experimental procedures, and adequate measures were taken to minimize pain and
discomfort. After being anesthetized with urethane (1.5 g/kg), the animal’s head was immobilized in a
stereotaxic frame and its body temperature maintained at 37 ºC with a heating blanket. The skull was
then surgically exposed and small hole drilled for microbiosensor implantations. To measure prefrontal
cortex lactate, the microbiosensor was implanted according to Paxinos and Watson coordinates: A/P
+2.7 from bregma, M/L +1.2 and D/V –0.5 from dura [36]. The Ag/AgCl reference electrode and
platinum auxiliary electrode were placed in the cortex, and the skull kept wet with saline-soaked pads.
The reference potential provided by the Ag/AgCl wire in brain tissue is very similar to that of the SCE.
For in-vivo oxygen measurement a CFE/PoPD was polarized at –0.65 V. Electrical stimulation was
provided by an S-8800 Grass model and a bipolar electrode made with two unmodified CFE mounted
in a two-barrel glass capillary. The exposed surface of the tip was approximately 500 µm long.
Electrical stimuli parameters were: 0.15 mA of 1-ms square biphasic pulses for 3–5 seconds at 20–30
Hz. During oxygen-manipulation studies, the appropriate gas was pumped close to the rat’s nose to
ensure optimal exposure, and alternatively pure O2 and N2 were administered during ~1 min, after
which the air flux was restored. Intraperitoneal injection (i.p.) was selected for pharmacological
administration.
2.4 Preparation of the Working Electrodes
2.4.1 Fabrication of Carbon Fiber Electrodes
Carbon fibers (diameter 8 µm, 20–50 mm in length) were attached to Teflon-coated copper
wire (diameter 250 µm), using high purity silver paint, and dried for 1 h at 80 ºC. The borosilicate
glass capillary was pulled to a tip using a vertical microelectrode puller (Needle/Pipette puller, Model
750, David Kopf Instruments). After drying, the carbon fiber was carefully inserted into the pulled
glass capillary tube under a microscope, leaving 2–4 mm of the carbon fiber protruding at the pulled
end. Subsequently, the carbon fiber was cut to the desired length (approximately 250 µm) using a
microsurgical scalpel. At the stem end of the capillary tube, the copper wire was fixed by casting with
non-conducting epoxy glue; the carbon fiber was also sealed into the capillary mouth, using the same
epoxy glue.
189

Int. J. Electrochem. Sci., Vol. 7, 2012
5914
2.4.2 PB electro-deposition onto Carbon Fiber Electrodes
CFEs were modified by means of electro-deposition and activation of a PB film. Briefly, the
PB layer was electro-deposited using CV and applying 1, 3, 6, 9 or 12 cyclic scans within the limits of
–0.2 to 0.4 V at scan rate of 0.05 or 0.1 V/s in a solution containing 1.5 mM K3[Fe(CN)6] and 1.5 mM
FeCl3 in 0.1 M KCl and 0.1 M HCl. These CFE/PBs were cleaned in doubly-distilled water and
activated by applying another 50 cycles in electrolyte solution (0.1 M KCl and 0.1 M HCl), using the
same protocol. Before being used, the CFE/PBs were cleaned again in doubly-distilled water for
several seconds. Finally, the PB film was tempered for 1 h at 100 – 200 oC.
2.4.3 Micro-biosensor construction based on CFE/PB
When CFE/PBs were ready to use, the next step was to immobilize the Lox using the following
protocol: 15 fast immersions in the PEI (2.5% w/v; default configuration) solution and a drying period
(default 5 min at room temperature); 30 fast immersions in the Lox solution; and 15 fast immersions in
the cross-linking solution (BSA/Glut). After the immobilization step, all biosensors were cured for 2 h
at 37 ºC and stored overnight at 4 ºC in a refrigerator. Finally, an interference-rejection film of
PoPD/BSA (PoPD for clarity, below) was electropolymerized over the biosensor.
Electropolymerization of PoPD was carried out with a standard three-electrode setup; a custom-made
Ag/AgCl /saturated KCl reference was used as the reference electrode and platinum wire as the
auxiliary electrode. The electropolymerization was driven at a constant potential (+0.75 V) for 20–25
min. After the fabrication procedure of the biosensors was completed, they were cleaned in doubly-
distilled water. When not in use, biosensors were stored in dry condition at 4 ºC.
3. RESULTS AND DISCUSSION
3.1 Prussian Blue film: characterization and optimization
PB-modified microsensors were characterized using CV. Two well-defined characteristic peaks
appeared with formal potentials of 0.1 V and 0.9 V, in good agreement with previous data [32-34, 37].
The PB ↔ PW (Prussian White) transition (Figure 1a) showed a broad composite anodic peak and
narrower cathodic peak characteristic of PB redox behavior displaying a mono-electronic quasi-
reversible inter-conversion (ΔE ~ 65 mV and Ird/Iox ~ 0.8 at a scan rate 25 mV s–1
).
A clear change in the CV of PB (Figure 1a) was observed in the presence of H2O2: an
enhancement of the cathodic current and a concomitant decrease in the anodic current. This
observation reflects the catalytic reduction reaction, which can be ascribed to the reduction of H2O2 to
water by PW, as previously reported [32, 38].
The thickness of the film, d, was estimated taking account of the number of unit cells present
on the electrode surface, geometrical parameters of the PB cell, and the working electrode area [39],
according to equation 1:
190

Int. J. Electrochem. Sci., Vol. 7, 2012
5915
d = (Qox/nFA) (l 3
NA/4) (1)
where Qox is the electrical charge associated to the anodic peak, n the number of electrons in
the redox process (l), F the Faraday constant, A the electrode area (6.33 × 10⁻⁵
cm2), l is the length of
the unit cell (1.02 nm) [37] and NA is Avogadro's number. The value 4 appears in the equation since
there are four effective iron atoms in the unit cell.
Figure 1. (a) CV for PB-modified carbon fiber electrodes (CFE/PB) without and with 600 µM H2O2.
(b) Thickness evolution of PB deposit against the number of cycles employed during electro-
deposition at two different scan rates. (c) Evolution of the peak separation (∆E) and the formal
potential (Eº´) against the number of cycles applied during the electro-deposition at 0.01 V s–1
.
Our results indicate a linear relationship between film thickness (Figure 1b) and the number of
cycles, as well as faster growth when the potential scan rate was decreased (i.e., 17 and 35 nm/cycle at
0.1 and 0.05 V s–1
, respectively), in agreement with previous reports [40]. The PB film deposited at 0.1
V s–1
showed a positive correlation between peak separation, ∆E, and the number of cycles (Figure 1c).
In contrast, the formal potential, E0´, remained constant after 3 cycles (Figure 1c). From these results,
0.1 V s–1
and three cycles were selected to deposit a thin film onto CFEs for biosensor fabrication
(Section 3.2), which gave a thickness of 51 ± 5 nm (mean ± SD, n = 6).
The CV shape of deposited PB films showed a clear dependence on the ionic composition of
the background electrolyte solution (Figure 2, inset). Previously, it has been demonstrated that PB
films display a specific transport of alkali metal cations due to its zeolite structure [32, 37]. These
geometrical conditions affect the transport of cations during PB ↔ PW transitions, determining its
electrochemical properties. In order to explore the ionic transport across the film, electrochemical
191
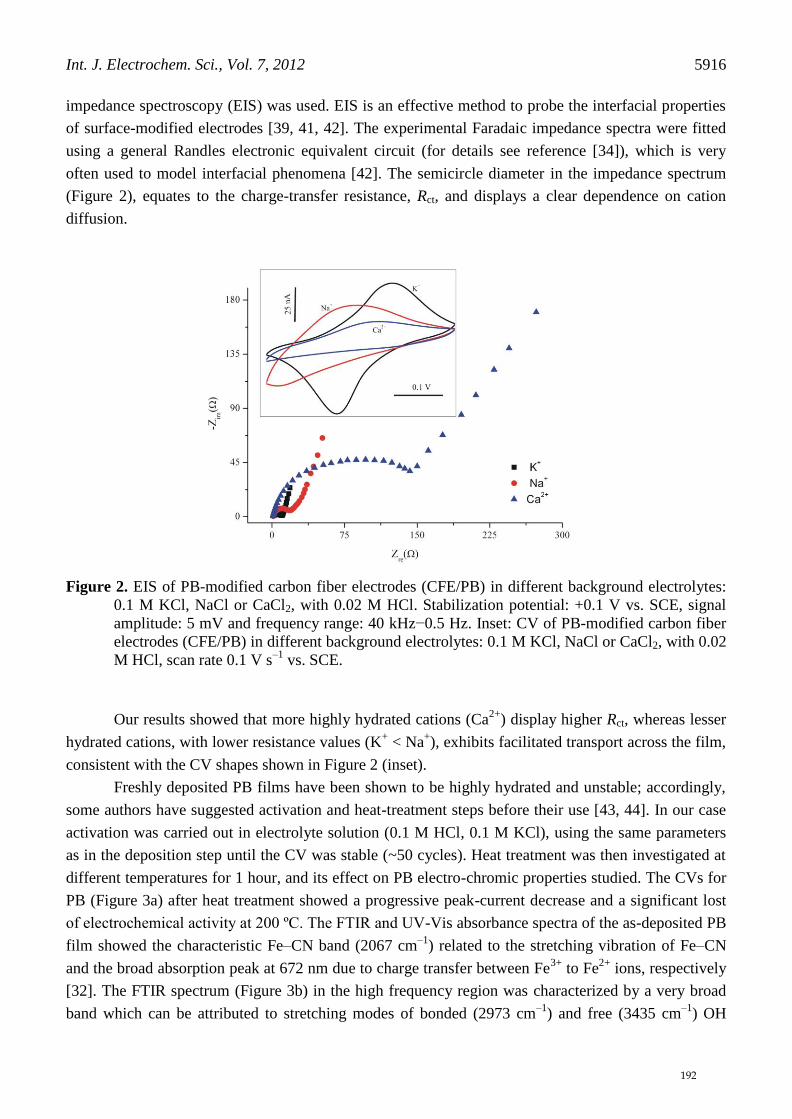
Int. J. Electrochem. Sci., Vol. 7, 2012
5916
impedance spectroscopy (EIS) was used. EIS is an effective method to probe the interfacial properties
of surface-modified electrodes [39, 41, 42]. The experimental Faradaic impedance spectra were fitted
using a general Randles electronic equivalent circuit (for details see reference [34]), which is very
often used to model interfacial phenomena [42]. The semicircle diameter in the impedance spectrum
(Figure 2), equates to the charge-transfer resistance, Rct, and displays a clear dependence on cation
diffusion.
Figure 2. EIS of PB-modified carbon fiber electrodes (CFE/PB) in different background electrolytes:
0.1 M KCl, NaCl or CaCl2, with 0.02 M HCl. Stabilization potential: +0.1 V vs. SCE, signal
amplitude: 5 mV and frequency range: 40 kHz−0.5 Hz. Inset: CV of PB-modified carbon fiber
electrodes (CFE/PB) in different background electrolytes: 0.1 M KCl, NaCl or CaCl2, with 0.02
M HCl, scan rate 0.1 V s–1
vs. SCE.
Our results showed that more highly hydrated cations (Ca2+
) display higher Rct, whereas lesser
hydrated cations, with lower resistance values (K+ < Na
+), exhibits facilitated transport across the film,
consistent with the CV shapes shown in Figure 2 (inset).
Freshly deposited PB films have been shown to be highly hydrated and unstable; accordingly,
some authors have suggested activation and heat-treatment steps before their use [43, 44]. In our case
activation was carried out in electrolyte solution (0.1 M HCl, 0.1 M KCl), using the same parameters
as in the deposition step until the CV was stable (~50 cycles). Heat treatment was then investigated at
different temperatures for 1 hour, and its effect on PB electro-chromic properties studied. The CVs for
PB (Figure 3a) after heat treatment showed a progressive peak-current decrease and a significant lost
of electrochemical activity at 200 ºC. The FTIR and UV-Vis absorbance spectra of the as-deposited PB
film showed the characteristic Fe–CN band (2067 cm–1
) related to the stretching vibration of Fe–CN
and the broad absorption peak at 672 nm due to charge transfer between Fe3+
to Fe2+
ions, respectively
[32]. The FTIR spectrum (Figure 3b) in the high frequency region was characterized by a very broad
band which can be attributed to stretching modes of bonded (2973 cm–1
) and free (3435 cm–1
) OH
192

Int. J. Electrochem. Sci., Vol. 7, 2012
5917
groups of water [45, 46]. This band shows that water molecules can be found in PB, either coordinated
in the shell of high spin iron or occupying interstitial positions as uncoordinated water. With heat
treatment these bands gradually decrease in intensity. On the other hand, the Fe–CN band suffers only
a slight decrease up to 150 o
C, but almost disappeared at 200 ºC, showing a clear thermal
decomposition of PB. The UV-Vis spectrum (Figure 3c) showed a similar behavior discussed for the
FTIR, although at 200 ºC it displayed a typical rust color and a clear band between 300 and 400 nm
that corresponds to the wavelength region of Fe2O3 [47]. In view of these results, 100 ºC was selected
for further investigation.
The effect of pH during electro-deposition was studied by using different electrolyte solutions:
0.02 (Figure 3di) and 0.1 M HCl (Figure 3dj and 3dk), and then cycling CFE/PB at 0.1 V s–1
(~33 min)
in PBS (pH 6). Our results indicate that PB films deposited in the more acid medium (Figure 3dj)
showed better stability, whereas PB electro-deposited with 0.02 M HCl (Figure 3di) showed a
significant peak reduction when the first and the last (150th
) cycles were compared. Nevertheless, only
with an additional thermal treatment (Figure 3dk), does PB display enough stability for useful
application in electro-analytical devices.
Figure 3.– Effect of annealing PB films at different temperatures, illustrated by CV (a), FTIR (b) and
UV–Vis (c) spectra. (d) Stability for PB-modified electrodes (CFE/PB) electrodeposited at
different pH conditions (scan-1 in red; scan-150 in blue: 0.02 M HCl (i) and 0.1 M HCl (j) and
(k), without (j) and with (k) thermal treatment.
3.2 Lactate biosensor optimization
Following the design of glucose microbiosensors developed by our group [32-35], we
assembled new lactate microbiosensors. Previously we showed that enzyme loading depends on the
193

Int. J. Electrochem. Sci., Vol. 7, 2012
5918
number of dip-immersions employed during the manufacturing process [33]. Consequently, in the
present work this number was fixed at 30 fast immersions. The first parameter investigated was the
enzyme concentration. In order to optimize this concentration several biosensors were assembled using
different Lox concentrations (25, 50 and 100 U mL–1
). Calibration curves for these biosensors (Figure
4a) showed that 100 U mL–1
displayed the best result with Vmax [26] 15 times higher than the lowest
concentration; for further studies this concentration was selected.
Figure 4.– Calibration curves for different lactate biosensors during optimization by changing
different assembly parameters: (a) enzyme concentration, (b) polyethyleneimine (PEI)
concentration, and (c) drying time between PEI immersion and enzyme loading. (d) Calibration
curves for both types of lactate biosensors proposed in the present work (mean + SEM, n = 4).
The background electrolyte solution was PBS (0.1 M NaCl) pH 7.4; the applied potential was 0
V against SCE.
The next step was to study the effect on the enzyme loading of a polyelectrolyte such as PEI
[33-34]. In recent years its ability to inhibit enzyme inactivation, and to improve its stability by the
formation of cationic–anionic complexes, has been exploited [48]. In this context we studied the
optimal concentration of PEI and how water content affects the enzyme loading during biosensor
assembly. Responding to the first question, several PEI solutions were prepared (1, 2.5 and 5 % w/v) in
water and used during biosensor construction. Figure 4b shows that both 2.5 and 5 % w/v almost
doubled the enzyme loading (higher Vmax values) compared with 1% w/v. So 2.5 % w/v PEI was
maintained for further studies. Until now a drying period of 5 min was employed between immersion
194

Int. J. Electrochem. Sci., Vol. 7, 2012
5919
in PEI and Lox solutions. In order to explore if water content affects the enzyme loading, several
drying times were selected (0, 5 and 15 min). Our results (Figure 4c) suggest that longer drying times
provide higher enzyme loading (Vmax ~ 3 times with respect to the wet configuration), and that the
hydration conditions of PEI are an important parameter in order to improve the enzyme loading. On
the basis of these data, drying times were increased to 15 min in the following development studies.
The final step during microbiosensor construction was the addition of an external permselective
film, (Lox/PoPD), which improves anti-biofouling properties and selectivity against potential
endogenous interferences such as AA, UA, DA, etc. [32-34, 49]. First results showed a significant loss
of sensitivity (~60%) that may be attributed to several factors such as: enzyme deactivation, the new
diffusion barrier [32-34] and electrostatic repulsion between BSA and lactate anions. Figure 4d shows
calibration data for lactate microbiosensors incorporating PoPD. Enzyme parameters, obtained using a
Hill-modified Michaelis–Menten equation [50], and analytical parameters are summarized in Table 1.
Lox/PoPD showed a linear range up to 0.6 mM with a sensitivity (S) of 2.68 + 0.12 nA mM–1
(~42 nA
µM–1
cm–2
); meanwhile the detection limit (S/N = 3) and reproducibility (CV%) were ~6 μM and 4 %,
respectively.
Taking into account that extracellular fluid (ECF) concentration of lactate is ~0.4 mM [51, 52]
and that changes registered during neuronal activation may reach ~200% of its basal concentration
(~0.7 mM) [10, 51, 52], the present configuration possessed excellent sensitivity, but the operational
linear range is pretty tight for use in physiological applications. However, we were able to increase the
linear range up to 1.2 mM by means of an external Nafion film (Lox/PoPD/Naf). Three dip
immersions in 5% Nafion proved enough for our purpose, whereas a higher number of dips (eight)
resulted in the complete loss of sensitivity. This new diffusion film provides a barrier to lactate,
decreasing sensitivity to 0.77 nA mM–1
(~12 nA µM–1
cm–2
) by both decreasing Vmax and increasing K´
[26] (see Table 1). Meanwhile free diffusion of O2 to the enzyme was maintained where it is needed to
regenerate its active center. Thus we present two possible configurations that may be used depending
on the in-vivo requirements.
Table 1. Enzyme kinetic (apparent Michaelis constant (K'), calibration plateau (Vmax), and Hill
coefficient (h)), and analytical parameters (sensitivity (S), coefficient of determination (R2),
detection limit (D.L.), linear range (L.R.) and coefficient of variation (CV%)) of different
optimized lactate biosensor designs, Mean + SEM, n = 4. D.L. was calculated as 3 × SD of the
background current. The Hill parameter is included to highlight possible deviations from
straightforward Michaelis–Menten kinetics, for which h = 1. Calibration curves were obtained
by applying 0 V against SCE in air-saturated PBS 0.1 M NaCl (pH 7.4).
Configuration
K'
(mM)
Vmax
(nA)
h
S
(nA mM-1)
S (nA µM-1
cm-2)
R2
D.L.
(M)
L.R.
(mM)
CV
(%)
PB/Lox/PoPD
(n =4)
0.44 ±
0.05
2.88 ±
0.09
1.3 ± 0.1 2.68 ±0.09 42.3 ± 1.5 0.994 5.6 ·
10-6
D.L -
0.6
7.1
PB/Lox/PoPD/Naf (n =4) 0.97 ±
0.14
1.57 ±
0.1
1.4 ± 0.1 0.77 ±0.03 12.2 ±0.4 0.994 16.8 ·
10-6
D.L -
1.2
6.7
195

Int. J. Electrochem. Sci., Vol. 7, 2012
5920
Another two important questions, when designing sensors for an electrochemically hostile
environment such as brain [53], are protein biofouling and interference response. In order to study the
anti-biofouling properties of our biosensors, they (with and without PoPD/Naf) were immersed for 18
h in a solution of BSA (10% w/v), and lactate sensitivity before and after BSA exposure determined in
its linear range (n = 3). Surprisingly, both configurations showed no significant difference (two-tailed
paired t-test, p-value: 0.11 and 0.07, respectively) before and after being dipped in the protein solution,
demonstrating the excellent anti-biofouling properties of the present configurations (Figure 5a). In this
sense, PoPD films have been shown to be stable during long periods (~15 days) in in-vivo
experiments, displaying excellent biocompatibility and anti-interference properties [26, 52].
Non-optimized lactate biosensors free of PoPD film (Figure 5b) showed good anti-interference
properties (as a result of the low applied potential used to detect H2O2 at the PB-modified surface) for
a considerable number of interference species and metabolites at their basal concentration [34], and
responded well to lactate additions (c: 0.4 and g: 0.2 mM). Only AA (0.2 mM), one of the major
endogenous interferences in the CNS, produced a clear change in the biosensor current, indicating that
although we were working at a low potential, we needed an additional permselective film to avoid AA
effects on biosensor responses [49]. Finally, the optimized lactate biosensor (with an external
PoPD/Naf film) didn’t response to the main interferences and metabolites (including AA; see Figure
5c).
Figure 5. (a) Normalized sensitivity (mean + SEM, n = 4) for PB/Lox and PB/Lox/PoPD/Naf
configurations before and after being immersed in a BSA solution (10% w/v) for 18 h.
Amperometric response for non–optimized PB/Lox (b) and optimized PB/Lox/PoPD/Naf (c)
configurations with successive additions of: (a) 10 nM dopamine (DA), (b) 10 µM 3,4-
dihydroxyphenylacetic acid (DOPAC), (c) 0.4 mM lactate, (d) 10 nM serotonin (5-HT), (e) 20
µM glutamate (Glu), (f) 0.4 mM glutamine (Gln), (g) 0.2 mM lactate, (h) 1 mM glucose, (i) 10
µM uric acid (UA) and (j) 0.2 mM ascorbic acid (AA). Calibration conditions as in Figure 4.
196

Int. J. Electrochem. Sci., Vol. 7, 2012
5921
3.3 Lactate biosensor measurements in in-vivo experiments
Although there is an extensive bibliography about lactate biosensors [54-60], there are few
papers published regarding lactate microbiosensors measuring directly in the CNS [10, 51, 52, 61, 62].
Much of these reports were based on either modified Pt transducers [10, 51], ceramic-based multisite
microelectrodes [62] or CFEs [52, 61], working at a high applied potential (~0.7 V) [10, 51, 62] or
using differential normal pulse voltammetry (DNPV) [52, 61] to detect the H2O2 generated during the
enzymatic reaction. Here we present, for the first time, a lactate microbiosensor based on PB-modified
CFE that is able to detect physiological changes in lactate levels at a low applied potential in the CNS.
For all in-vivo experiments, a time of 30 min after biosensor insertion was used to stabilize the
baseline current. This was used to estimate the basal lactate concentration, comparing this current with
previous calibration data. The basal lactate concentration (0.36 + 0.02 mM, mean + SD, n = 5) was in
good agreement with previous data reported by other authors [51, 52], although factors such as the
state of anesthesia will influence such comparisons [63].
It is known that extracellular fluid lactate concentration can be increased by the stimulation of
neuronal activity [2, 14, 15, 52] and studies concerning such a stimulation by glutamate and N-methyl-
D-aspartate (NMDA) have been reported [52]. In the present work, we also used NMDA, an ionotropic
glutamate receptor agonist. After obtaining a stable baseline for the biosensors (normalized basal
response: 100 + 12 %; mean + SD, n = 3), NMDA (5 mg in 2 mL PBS) was administered (i.p.). After
5–10 min a clear increase in lactate level was observed reaching a value of 205 + 13 % which
remained at this level for ~1 h. These results are in good concordance with previous data [52] and with
ANLSH [2, 6, 14-18].
The lactate biosensor response was also evaluated during electrophysiological stimulation. In
this context, local electrical stimulation was applied (30 Hz for 3 s) at intervals of 3 min
approximately, allowing enough time to reach the basal resting level again. Data showed (Figure 6a) a
slight decrease (~25 %) in lactate level during local electrical stimulation, suggesting that lactate is
consumed during neural activity. After that, an increase in extracellular lactate concentrations (~90 %
of the basal concentration) appears to be a response of the tissue to the demand for additional energy
[10, 14-18]. Similar results were obtained with a lactate biosensor employing a 25-μm diameter Pt wire
transducer and detecting H2O2 at +0.7 V (Figure 6b), the configuration commonly employed in
biosensors for in-vivo applications, validating the kinetic and physiological lactate response. Finally,
theses data are in good agreement with previous publications where extracellular lactate concentration
fluctuations and its relationships with neural activity were explored in the dentate gyrus of the
hippocampus of the rat brain after electrical stimulation of the perforant pathway [10].
The last sets of experiments were conducted to study changes of lactate and O2 in the
extracellular compartment. An O2 sensor was constructed by coating an unmodified CFE with PoPD
(CFE/PoPD) to reject interferences and to improve biocompatibility properties of the sensor [51]. This
sensor was polarized at –0.65 V to detect O2 [64]. Firstly, the in-vivo oxygen response was checked by
changing extracellular oxygen concentration via gas administration (pure O2 or N2). Under these
conditions, the O2 sensor showed a clear current increase during mild hyperoxia (O2 supply; Figure
7a), whereas the same period of mild hypoxia (N2 supply) showed the opposite effect (Figure 7b).
197

Int. J. Electrochem. Sci., Vol. 7, 2012
5922
Under these conditions, the O2 signal suffered a change of 40–50% with respect to its basal level, in
good agreement with previous work [65]. Changes in both cases were immediate and, on cessation of
gas administration, the signals quickly returned to baseline levels indicating a rapid return to normoxic
conditions. These results confirmed that CFE/PoPDs implanted in anesthetized animals respond
rapidly to changes in cerebral tissue O2 concentrations.
Figure 6. Extracellular lactate changes during electrical stimulation (30 Hz, 3 s) registered in the
prefrontal cortex of an anesthetized rat. Data were obtained with (a) a PB/Lox/PoPD/Naf
biosensor and with (b) a Pt/Lox/PoPD/Naf biosensor proposed in the present work
In order to study simultaneous changes in lactate and O2 levels, both sensors were inserted in the
prefrontal cortex close to the stimulation electrodes (50–100 µm). Electrical stimulation (20 Hz during
5 s) generated a lactate change consisting of a short period of lactate consumption followed by an
increase of almost 90 % of the basal lactate concentration, similar to that seen in Figure 6 (see Figure
7c). In contrast, the O2 sensor response showed an immediate decrease in extracellular O2 levels
(~20% of the basal value) during the stimulation, and this level was held for ~30 s after the stimulus. A
198

Int. J. Electrochem. Sci., Vol. 7, 2012
5923
similar time was needed to reach the lactate basal level after stimulation. Taking into account that
extracellular analyte concentrations are determined by a balance between consumption and supply
from different compartments, these data reveal that O2 may be consumed during oxidative processes
(TCA cycles) in active neurons [1-6], and lactate could serve as an additional non-oxidative fuel
during activation events [2, 14, 15] or may be the predominant oxidative substrate [6, 16, 17].
Nevertheless to obtain more robust arguments, additional experiments will be needed. At this point,
these experiments have been presented to illustrate the potential use of our lactate biosensors in
physiological applications. Future work will be done in order to explore lactate changes during neural
activation and its relationship with hemodynamic responses, and with other metabolic substrates such
as glucose, pyruvate and O2.
Figure 7. Effect of physiological manipulation of prefrontal cortex dissolved oxygen, monitored using
a CFE/PoPD sensor. Exposing the animal briefly to pure oxygen (a), the ECF oxygen
concentration promptly increased (~160% of baseline), returning back after restoration of a
normal atmosphere. In contrast, exposure to nitrogen (b), induced a short-lasting decline in
brain oxygen levels (~50%) which recovered promptly following nitrogen removal. (c)
Simultaneous changes in lactate biosensor and oxygen (CFE/PoPD) sensor signals before,
during and after electrical stimulation (20 Hz, 5 s) recorded in the prefrontal cortex of an
anesthetized rat.
199

Int. J. Electrochem. Sci., Vol. 7, 2012
5924
4. CONCLUSIONS
In this study we present a novel lactate microbiosensor based on PB-modified CFEs. This
approach allows the detection of H2O2 enzymatically generated in the biosensor surface layer at low
applied potential (0 V against SCE), instead of the high potential (+0.7 V against SCE) commonly
used with the Pt transducers. During construction, each step was studied in detail in order to obtain an
optimized configuration determined by functional and biocompatibility needs of neurochemical
applications. In this way PB electro-deposition was studied and film properties were characterized
using CV, EIS, IR and Vis-UV techniques. After optimizing the protocol to modify the CFEs with this
electrocatalytic compound (PB), the next step was its modification with lactate oxidase. In this context,
biosensor responses were honed to the special conditions needed for physiological applications such
as: sensitivity, selectivity, operational linear range, biocompatibility, etc. Finally, an optimized lactate
biosensor is presented and some in-vivo results shown to illustrate its application in the study of lactate
and oxygen in the brain during neuronal activation.
ACKNOWLEDGMENT
The funds for the development of this device have been provided by the Ministerio de Industria,
Turismo y Comercio (TSI-020100-2011-189 and TSI-020100-2010-346) and Ministerio de Ciencia e
Innovación (TIN2011-28146 and TIN2008-06867-C02-01/TIN). We thank Dr JL Rodriguez Marrero
and J Florez Montaño for help in EIS measurements.
References
1. T.M. Bliss, R.M. Sapolsky, Brain Res., 899 (2001) 134
2. A. K. Bouzier–Sore, M. Merle, P.J. Magistretti, L. Pellerin, J. Physiol. Paris 96 (2002) 273
3. L.H. Bergersen, Neuroscience 145 (2007) 11
4. L. Hertz, M. Fillenz, Neurochem. Int. 34 (1999) 71
5. C.P. Chih, E.L. Roberts, J. Cerebr. Blood Flow Metab. 23 (2003) 1263
6. A.K. Bouzier–Sore, P Voisin, P Canioni, P.J. Magistretti, L. Pellerin, J. Cerebr. Blood Flow
Metab. 23 (2003) 1298
7. T.E. Friedmann, C. Barborka, J. Biol. Chem. 141 (1941) 993
8. H. Haljamae, Intens. Care World 4 (1987) 118
9. G.A. Brooks, Fed. Proc. 45 (1987) 2924
10. Y.B. Hu, G.S. Wilson, J. Neurochem. 69 (1997) 1484
11. M.G. Larrabee, J. Neurochem. 64 (1995) 1734
12. C.L. Poitry–Yamate, S. Poitry, M. Tsacopoulos, J. Neurosci. 15 (1995) 5179
13. A. Schurr, J.J. Miller, R.S. Payne, B.M. Rigor, J. Neurosci. 19 (1999) 34
14. L. Pellerin, P,J. Magistretti, Proc. Nat. Acad. Sci. USA 91(1994) 10625
15. M. Tsacopoulos, P.J. Magistretti, J. Neurosci. 16 (1996) 877
16. A.K. Bouzier–Sore, P. Voisin, V. Bouchaud, E. Bezancon, J.M. Franconi, L. Pellerin, Euro. J.
Neurosci. 24 (2006) 1687
17. Y. Itoh, T. Esaki, K. Shimoji, M. Cook, M.J. Law, E. Kaufman, L. Sokoloff, Proc. Natl. Acad. Sci.
USA 100 (2003) 4879
18. L. Pellerin, G. Pellegri, P.G. Bittar, Y. Charnay, C. Bouras, J.L. Martin, N. Stella, P.J. Magistretti,
Dev. Neurosci. 20 (1998) 291
200

Int. J. Electrochem. Sci., Vol. 7, 2012
5925
19. C.P. Chih, P. Lipton, E.L. Roberts, Trends Neurosci. 24 (2001) 573
20. G.A. Dienel, L. Hertz, J. Neurosci. Res. 66 (2001) 824
21. J. Korf, J. Cereb. Blood. Flow Metab. 26 (2006) 1584.
22. A. Schurr, J. Cereb. Blood Flow Metab. 26 (2006) 142
23. D.A. Jones, J. Ros, H. Landolt, M. Fillenz, M.G. Boutelle, J. Neurochem. 75 (2000) 1703
24. T. Yao, T. Yano, Y. Nanjyo, H. Nishino, Anal. Sci. 19 (2003) 61
25. Y. Dong, L. Wang, D. Shangguan, X. Yu, R. Zhao, H. Han, G. Liu, Neurochem. Int. 43 (2003) 67
26. R.D. O’Neill, G. Rocchitta, C.P. McMahon, P.A. Serra, J.P. Lowry, Trends Anal. Chem. 27 (2008)
78
27. J.B. Gramsbergen, J. Skjøth–Rasmussen, C. Rasmussen, K.L. Lambertsen, J. Neurosci. Meth. 140
(2004) 93
28. T. Yao, G. Okano, Anal. Sci. 24 (2008) 1469
29. M.C Parkin., S.E. Hopwood, D.A. Jones, P. Hashemi, H. Landolt, M. Fabricius, M. Lauritzen,
M.G. Boutelle, A.J. Strong, J. Cereb. Blood Flow Metab. 25 (2005) 402
30. R.D. O'Neill, J.L. Gonzalez–Mora, M.G. Boutelle, D.E. Ormonde, J.P. Lowry, A. Duff, B. Fumero,
M. Fillenz, M. Mas, J. Neurochem. 57 (1991) 22
31. R.D. O'Neill, J.P. Lowry, M. Mas, Crit. Rev. Neurobiol. 12 (1998) 69
32. P. Salazar, M. Martín, R. Roche, R.D. O’Neill, J.L. González–Mora, Electrochim. Acta 55 (2010)
6476
33. P. Salazar, M. Martín, R. Roche, J.L. González–Mora, R.D. O’Neill, Biosens. Bioelectron. 26
(2010) 748
34. P. Salazar, R.D. O’Neill, M. Martín, R. Roche, J.L. González–Mora, Sensors Act. B–Chem. 152
(2011) 137
35. R. Roche, P. Salazar, M. Martín, F. Marcano, J.L. González–Mora, J. Neurosci. Meth. 202 (2011)
192
36. G. Paxinos, C. Watson, The Rat Brain in Stereotaxic Coordinates, Academic Press, Sydney (1986)
37. F. Ricci, G. Palleschi, Biosens. Bioelectron. 21 (2005) 389
38. K. Itaya, N. Shoji, I. Uchida, J. Am. Chem. Soc. 106 (1984) 3423
39. J.J. García–Jareño, J.J. Navarro, A.F. Roig, H. Scholl, F. Vicente, Electrochim. Acta 40 (1995)
1113
40. A. Goux, J. Ghanbaja. A. Walcarius, J. Mater. Sci. 44 (2009) 6601
41. M. Zhou, L. Shang, B. Li, L. Huang, S.J. Dong, Biosens. Bioelectron. 24 (2008) 442
42. Y. Liu, X. Qu, H. Guo, H. Chen, B. Liu, S. Dong, Biosens. Bioelectron. 21 (2006) 2195
43. I.L. Mattos, L. Gorton, T. Laurell, A. Malinauskas, A.A. Karyakin, Talanta 52 (2000) 791
44. I.L. Mattos, L. Gorton, T. Ruzgas, Biosens. Bioelectron. 18 (2003) 193
45. J.D. Qiu, H.Z. Peng, R.P. Liang, J. Li, X.H. Xia, Langmuir 23 (2007) 2133
46. P.J. Kulesza, S. Zamponi, M.A. Malik, K. Miecznikowski, M. Berrettoni, R. Marassi, J. Solid State
Electrochem. 1 (1997) 88
47. S.A. Agnihotry, P. Singh, A. G. Joshi, D.P. Singh, K.N. Sood, S.M. Shivaprasad, Electrochim.
Acta 51 (2006) 4291
48. J.D. Breccia, M.M. Andersson, R. Hatti–Kaul, Biochim. Biophys. Acta 1570 (2002) 165
49. S.A. Rothwell, S.J. Killoran. R.D. O’Neill, Sensors 10 (2010) 6439
50. S.S. El Atrash, R.D. O'Neill, Electrochim. Acta 40 (1995) 2791
51. M. Demestre, M. Boutelle, M. Fillenz, J. Physiol. 499 (1997) 825
52. N.F. Shram, L.I. Netchiporouk, C. Martelet, N. Jaffrezic–Renault, C. Bonnet, R. Cespuglio, Anal.
Chem. 70 (1998) 2618
53. R.D. O'Neill, Analyst 118 (1993) 433
54. R. Garjonnyte, Y. Yigzaw, R. Meskys, A. Malinauskas, L. Gorton, Sensors Act. B–Chem. 79
(2001) 33
55. N.G. Patel, A. Erlenkötter, K. Cammann, G.–C. Chemnitius, Sensors Act. B–Chem. 67 (2000)134
201

Int. J. Electrochem. Sci., Vol. 7, 2012
5926
56. A. Ges, F. Baudenbache, Biosens. Bioelectron. 26 (2010) 828
57. J. Haccoun, B. Piro, V. Noël, M.C. Pham, Bioelectrochemistry 68 (2006) 218
58. L. Cheng–Li, S. Cheng–Ling, C. Lai–Kwan, Anal. Chem. 79 (2007) 3757
59. A. Poscia, D. Messeri, D. Moscone, F. Ricci, F. Valgimigli, Biosens. Bioelectron. 20 (2005) 2244
60. S.A.M. Marzouk, V.V. Cosofret, R.P. Buck, H. Yang, W.E. Cascio, S.S.M. Hassan, Talanta 44
(1997) 1527
61. N. Shram, L. Netchiporouk, R. Cespuglio, Eur. J. Neurosci. 16 (2002) 461
62. J.J. Burmeister, M. Palmer, G.A. Gerhardt, Biosens. Bioelectron. 20 (2005) 1772
63. J.C Goodman, A.B Valadka, S.P.Gopinath, M. Cormio, C.S. Robertson, J. Neurotrauma 13
(1996)549
64. M.L. Hitchman, Measurement of dissolved oxygen; John Wiley, New York (1978)
65. F.B. Bolger, J.P. Lowry, Sensors 5 (2005) 473
© 2012 by ESG (www.electrochemsci.org)
202

10.-Anexo II: Otras publicaciones
Pese a que se han empleado seis publicaciones en el compendio de la presente tesis, no quería
dejar pasar la oportunidad de añadir otras dos que no han sido incluidas por distintos motivos:
la 1ª por no llegar a los criterios de inclusión y la 2ª por estar en estos momentos en proceso de
redacción.
Sin embargo, creo que su inclusión como material anexo termina de completar y dar forma a la
tesis. En ellas se muestra una aplicación inmediata de los microbiosensores de glucosa en el
análisis neurometabólico, realizando estudios hemodinámicos simultáneos. Por otro lado, en la
otra publicación se introducen mejoras en el diseño propuesto, prestando especial atención a las
limitaciones estequiométricas del oxígeno “déficit de oxígeno”.
psalazar
203

Si
RN
a
ARRA
KGOHNOE
1
sccrtefapmIiMe
NcT
0d
Journal of Neuroscience Methods 202 (2011) 192– 198
Contents lists available at ScienceDirect
Journal of Neuroscience Methods
j o ur nal homep age: www.elsev ier .com/ locate / jneumeth
imultaneous measurements of glucose, oxyhemoglobin and deoxyhemoglobinn exposed rat cortex
. Roche ∗, P. Salazar, M. Martín, F. Marcano, J.L. González-Moraeurochemistry and Neuroimaging Group, Faculty of Medicine, University of La Laguna, Campus de Ofra s/n, 38071 Tenerife, Spain
r t i c l e i n f o
rticle history:eceived 15 December 2010eceived in revised form 23 June 2011ccepted 5 July 2011
eywords:lucose biosensorptical imagingemoglobineurovascular couplingxidative brain metabolism
a b s t r a c t
The present work addresses the simultaneous monitoring of hemoglobin and glucose consumption inrat somatosensory cortex in vivo. We propose a method which combines two techniques: 2-dimensionaloptical imaging and an amperometric microbiosensor. The mounted setup optimizes the space in thecranial window so that three micro-electrodes can be inserted: glucose microbiosensor, sentinel andstimulating electrode as well as the holder to manipulate the optical fiber. Additionally, a tool basedon graphical user interface programming has been developed to visualize a two-dimension spectralmap of oxy-, deoxy- and total hemoglobin, HbO2, HbR and HbT respectively, in the cortex. Our resultsshowed a good sensitivity, selectivity and spatial resolution for both methods. Relevant hemodynamicresponses had a common central focus (at the site of the stimulus) which later segregated to othervascular compartments. A good linear relationship between extracellular glucose concentration and HbO2
xposed rat cortex values during brain activation after local electrical stimulation was observed for electrochemical andoptical recordings (R2 values were over 0.94). Time courses between glucose and HbO2 signals showeda temporal delay ranging from 1 s to 2 s, suggesting that both variables are not always coupled. Thetemporal mismatching reported here, provides in vivo evidence that supports a neuronal hypothesis:cerebral blow flow and oxidative metabolism are driven in parallel by neural activity – rather than aconcatenation of events (‘in-series’ events) occurring at sites of neuronal activation.
. Introduction
The human brain has a high-energy requirement. The brain con-umes almost 20% of the global resting metabolism although itonstitutes only 2% of body weight, (Sokoloff, 1960). The glucoseonsumption rate increases no more than ∼50% when the brainesponds to external stimuli, and the increases in oxygen consump-ion are even lower (Shulman et al., 2001; Giove et al., 2003). Thesenergy requirements and accompanying hemodynamic responsesorm the basis of most current neuroimaging approaches (e.g., fMRInd PET) used for functional mapping in the brain. However, inter-retation of these macroscopic signals in terms of the underlyingicroscopic neurovascular physiology remains a great challenge.
n order to overcome this difficulty, we propose here, using two
n vivo techniques simultaneously: optical imaging (González-ora et al., 2002) and an amperometric biosensor device (Salazart al., 2010a,b,c) to measure hemoglobin and glucose concentra-
∗ Corresponding author at: Dra. Rossany Roche. Laboratorio de Neuroquímica yeuroimagen, Departamento de Fisiología, Facultad de Medicina, Campus de Cien-ias de La Salud, Universidad de La Laguna, 38071, Santa Cruz de Tenerife, Spain.el.: +34 922 319363; fax: +34 922 319397.
E-mail addresses: [email protected], [email protected] (R. Roche).
165-0270/$ – see front matter © 2011 Elsevier B.V. All rights reserved.oi:10.1016/j.jneumeth.2011.07.003
© 2011 Elsevier B.V. All rights reserved.
tions in the rat brain cortex. Both techniques have been improvedand adapted in our laboratory for use in small animals offering agood temporal and spatial resolution.
Biosensors are based on the detection of any electroactivemetabolite that is generated (e.g., H2O2) or consumed (e.g., O2) dur-ing enzyme reaction. Biosensors offer a variety of advantages overclassical techniques for neurochemical monitoring: high spatialand temporal resolution; good selectivity; ease of implementa-tion; amenability to miniaturization; rapid response time; etc. Wehave developed a glucose biosensor, using a carbon fiber substrate,(Salazar et al., 2010a,b,c) with significantly smaller dimensionsand a low working potential, which has significant advantages forin vivo monitoring and is free of common biological interference(Salazar et al., 2010a,b).
On the other hand, optical imaging is a technique that detectschanges in blow flood by simply imaging the exposed cortexunder optical illumination (Hernández et al., 2009). This is possiblebecause oxy- and deoxyhemoglobin (HbO2 and HbR) are chro-mophores that exhibit markedly different absorption spectra in thenear-infrared region (Sfareni et al., 1997; Wray et al., 1988), for
wavelengths typically in the range of 650–950 nm. Although thistechnique is one of the simplest in the field of neuroimaging, cal-culation of hemoglobin concentration is not simple because opticalimaging is affected by physiological noise (breathing, heart-rate,204
scienc
huf
moiaamaa
2
2
2
1tLaApHaiswulapwMofw(nPp
2
wei2Tr−1Tb0ctisisw
R. Roche et al. / Journal of Neuro
ead movement, etc.). In Section 2.2 we describe the procedure wese in our laboratory to obtain and analyze relevant optical datarom the exposed rat cortex.
Finally, this work tries to test the capabilities of our proposedethod to study different aspects of the relationship between
xygen/glucose supplies during neurovascular coupling by detect-ng the temporal and spatial characteristic of hemoglobin statend extracellular glucose concentration. Furthermore, this workttempts to propose the use of micro-biosensors for quasi real-timeeasurement of glucose associated to optical imaging as a valid
pproach for the elucidation of the mechanisms of energy supplynd utilization in the brain.
. Material and methods
.1. Glucose biosensor
.1.1. Reagents and solutionsThe enzyme glucose oxidase (Gox) from Aspergillus niger (EC
.1.3.4, Type VII-S), purchased as a lyophilized powder, and glu-araldehyde 25% (Glut) were obtained from Sigma–Aldrich (St.ouis, MO, USA), and stored at −21 C until use. Bovine serumlbumin (BSA, fractionV) was also obtained from Sigma–Aldrich.ll chemicals, including o-phenylenediamine (o-PD), glucose,olyethyleneimine (PEI), KCl, FeCl3, K3[Fe(CN)6], HCl (35%, w/w),2O2 (30%, w/v), Nafion (5 wt.% in a mixture of lower aliphaticlcohols and water), phosphate buffer saline (PBS, pH 7.4 contain-ng 0.1 M NaCl) were obtained from Sigma–Aldrich and used asupplied. PBS stock solutions were prepared in doubly distilledater (18.2 M cm, Millipore-Q), and stored at 4 C when not inse. Stock 125 mM solutions of glucose were prepared in water,
eft for 24 h at room temperature to allow equilibration of thenomers, and then stored at 4 C. The PEI solution used was pre-ared by dissolving PEI at 5%, w/v in H2O. The cross-linking solutionas prepared in PBS with 1%, w/v of BSA and 0.1%, w/v of Glut.onomer solution (300 mM o-PD) was prepared using 48.6 mg of
-PD and 7.5 mg of BSA in 1.5 mL of N2-saturated PBS and sonicatedor 15 min (McAteer and O’Neill, 1996). A 300 U/mL solution of Goxas prepared by dissolving 3.7 mg in 2 mL of PBS. Carbon fibers
8 m diameter), single-barrel glass capillaries, and 250 m inter-al diameter Teflon-coated copper wire was obtained from Wordrecision Instruments Inc. (Sarasota, FL, USA), and silver epoxyaint was supplied by Sigma–Aldrich.
.1.2. Glucose biosensorCarbon fiber electrodes (CFEs: 8 m diameter, 500 m length)
ere constructed by modifying our previous method (Salazart al., 2010a,b). Briefly: carbon fibers (diameter 8 m, 20–50 mmn length) were attached to Teflon-coated copper wire (diameter50 m), using high purity silver paint, and dried for 1 h at 80 C.he PB layer was then electro-deposited using cyclic voltammet-ic (CV) methodology, applying 3 cyclic scans within the limits of0.2 to 0.4 V at scan rate of 0.1 V/s in a fresh solution containing.5 mM K3[Fe(CN)6] and 1.5 mM FeCl3 in 0.1 M KCl and 0.1 M HCl.hese CFE/PBs were cleaned in doubly-distilled water and activatedy applying another 50 cycles of electrolyte solution (0.1 M KCl and.1 M HCl), using the same protocol. Before use, the CFE/PBs wereleaned again in doubly-distilled water for several seconds. Finally,he PB film was tempered at 100 C for 1 h. The next step was tommobilize the Gox using the following protocol: 15 fast immer-
ions in PEI solution and a drying period (5 min); 30 fast immersionsn the Gox solution; and 15 fast immersions in the cross-linkingolution (BSA/Glut). After the immobilization step, all biosensorsere cured for 1 h.e Methods 202 (2011) 192– 198 193
2.1.3. SentinelA sentinel electrode has been developed to check non-specific
reactions in the background media. Fabrication protocol was thesame as described above for glucose biosensor, however Gox wasnot added.
2.1.4. AssembledAfter curing, the glucose biosensor and sentinel electrode were
inserted into the pulled single-barrel glass capillary tube under amicroscope, leaving 500 m of the carbon fibers protruding at thepulled end. At the stem end of the capillary tube, the copper wirewas fixed by casting with non-conducting epoxy glue; the modi-fied carbon fibers were also sealed into the capillary mouth, usingnon-conductive epoxy glue. Finally, an interference-rejection filmof PoPD/BSA was electropolymerized over the glucose biosensorand sentinel (McAteer and O’Neill, 1996). Electro-polymerizationof PoPD was performed with a standard three-electrode setup; acustom-made Ag/AgCl/saturated KCl reference was used as the ref-erence electrode and platinum wire as the auxiliary electrode. Theelectro-polymerization was driven at a constant potential (+0.75 V)for 20–25 min. After the fabrication procedure of the biosensors andtheir sentinels (blank sensor) were completed, they were cleanedin doubly-distilled water, stored overnight at 4 C in a refrigerator,and used the next day. When not in use, both sensors were storedagain at 4 C in a refrigerator in dry conditions.
2.1.5. Instrumentation and software for acquiring amperometricdata
Carbon fiber modifications and experiments were computercontrolled with data-acquisition software EChemTM for cyclicvoltammetry and ChartTM for constant potential applied. The data-acquisition system used was e-Corder 401 from EDAQPty Ltd.(Denistone East, Australia) and a low-noise and high-sensitivitypotentiostat, Quadstat (EDAQ). The linear and non-linear regres-sion analyses were performed using the graphical software packagePrism (ver. 5.00 Graph Pad Software).
2.2. Optical imaging
2.2.1. SetupIn order to obtain optical data in our experiments, a fiberscope
from PENTAX Medical Company (Montvale, NJ, USA) was opticallyadapted to illuminate the cortex with a filter free high intensityhalogen illuminator (FO-150, Chiu Technical Corporation, KingsPark, NY, USA) and to collect images in a cooled charge-coupleddevice (iXonEM+ 885 EMCCD Camera, ANDORTM, South Windsor,CT, USA). An optosplit from CAIRN Research Ltd. (Faversham, Kent,UK) coupled to the camera can record images simultaneously at twodifferent optical wavelengths: 687 ± 5 nm and 835 ± 5 nm. Imageswere acquired at 1.00× magnification, 5 frames/s and 512 × 512pixel array and stored on a desktop computer using ANDOR IQsoftware. The fibroscope was positioned in the center of the holderto visualize the location of all implanted electrodes (see Fig. 1 formore detail). The sentinel and the microbiosensor were positionedas close to the center of activation as possible, avoiding the pial anddural vessels. The sentinel, microbiosensor and stimulating elec-trodes were carefully positioned so that the distance between thetwo sensors and bipolar electrode was less than 100 m. The mainadvantage of using this setup is that this optimized the space for theinsertion of three electrodes and the fiber at the same time (Fig. 1).
2.2.2. Analysis of optical data
Processing of images was performed after their capture(off-line), by using our user friendly home-made software: Met-calculator. Metcalculator was programmed using Matlab Guide® (v7.9.0) and allows users to load the dark data (Idark), the reference
205

194 R. Roche et al. / Journal of Neuroscienc
Fig. 1. Photograph of the experimental setup showing the metallic holder for theotn
dtcccO
iwstaw(
r
aaHsvdc
3
3
2
ptic fiber (fibroscope tip) located in the center and the electrodes surrounding theip. Please note that the microbiosensors are orientated in such a way so that theyearly meet at the tip where the electrodes are implanted.
ata (Iref) and the resting image data (Ibasal) for each experimen-al essay. In order to reach a higher processing speed, the useran reduce the data by choosing a region of interest (ROI). In thisase, any sub-array and any number of frames can be set. Opti-al density for each pixel was obtained by the following equation:.D = −log((I − Idark)/Iref).
This formula was applied to both experimental data (I) and rest-ng data (Ibasal). The values of intensity data (Idark, Iref, Ibasal and I)
ere previously filtered with a spatial filter to smooth the borders,hadows and whites of the images. Afterwards, O.D data was fil-ered with a Gaussian low-pass filter at 0.8 Hz to remove all artifactsnd physiological noise. Relative concentrations of HbR and HbO2ere calculated from these pre-processing O.D data by solving Eq.
1).
HbO2
HbR=
[˛1
HbO2˛1
HbR
˛2HbO2
˛2HbR
]·[
O.D1I − O.D1
Ibasal
O.D2I − O.D2
Ibasal
](1)
Although we have used the absorption coefficient values (˛i)
eported by Prahl (1998) in our results, these can be set by the user.On the other hand, the splitter used here can simultaneously
cquire images at two wavelengths, which makes it possible topply Eq. (1) to our collected data and to calculate HbO2, HbR andbT values for the whole images. Spectral maps in two dimen-
ions (2D), resulting from correlating a color-map matrix and thesealues, are useful for analyzing ROIs contained in the cranial win-ow and for establishing comparison criteria and well contrastedontours.
. Experiments
.1. In vitro experiments to calibrate the microbiosensor
All in vitro experiments were performed in a 25 mL glass cell at1 C, using a standard three-electrode set-up with a commercial
e Methods 202 (2011) 192– 198
saturated calomel electrode (SCE) (CRISON Instrument S.A., Alella,Barcelona, Spain) as the reference and platinum wire as the auxil-iary electrode. The optimized applied potential for amperometricstudies was 0.0 V against SCE [30,31]. Glucose calibrations wereperformed in quiescent air-saturated PBS (following stabilizationof the background current for 30 min) by adding aliquots of glu-cose stock solution (0.25 M) to the electrochemical cell. After theaddition of glucose aliquots, the solution was stirred for 10 s andthen left to reach the steady-state current.
3.2. In vivo
These experiments were conducted with eight male rats of∼350 g (Sprague–Dawley) in accordance with the European Com-munities Council Directive of 1986 (86/609/EEC) regarding thecare and use of animals for experimental procedures, and ade-quate measures were taken to minimize pain and discomfort. Afterbeing anesthetized with urethane (1.5 g/kg), the animal’s headwas immobilized in a stereotaxic frame and its body tempera-ture maintained at 37 C with a heating blanket. A midline scalpincision was made to expose the bone over the parietal cortexof one hemisphere. The bone over the hemisphere to be imagedwas carefully removed with a dental drill. Agar solution 1%, w/vwas applied to increase the stability against physiological noiseand the translucency of the area. In order to measure prefrontalcortex glucose, the microbiosensors were implanted according toPaxinos and Watson coordinates: A/P +2.7 from bregma, M/L +1.2and D/V −0.5 from dura (Dixon et al., 2002). The Ag/AgCl refer-ence electrode and platinum auxiliary electrode were placed overthe skull near the prefrontal cortex, and the skull kept wet withsaline-soaked pads. Electrical stimulation was provided by an S-8800 Grass model and a bipolar electrode made with two pointedcarbon fibers (30 m diameter; Word Precision Instruments Inc.,Sarasota, FL, USA) mounted in a two-barrel glass capillary, andseparated by ∼100 m. One stimulation trial consisted of 140 sof recording. Electrical Stimulus was set as follows: 1 s, 0.15 mA,0.9 ms current pulse. Neural activity was varied by modulating thestimulation frequency (20, 30 and 40 Hz). One stimulus was deliv-ered 20 s after the start of each trial. The trial was repeated 10 timeswith a 60 s rest interval.
4. Results and discussion
Fig. 2A, shows the spectral map superimposed over the realimage obtained at 20 Hz and at 0–1–2–3–5 and 10 s after onset ofelectrical stimulation. Fig. 2C includes the relative positions of thestimulating electrode, glucose biosensor and their sentinel. The cir-cular area is the cerebral region studied by the optic fibers and theyellow color represents the spectral map superimposed (activatedarea) 4 s after electrical stimulation. Fig. 2B shows HbT recordedversus time in an activated area (magenta) and non-activated area(blue) for comparison. No changes were detected in non-activatedROIs (no yellow spectral map). This result agrees with the resultsof Sheth and co-workers where relevant hemodynamic responseshave a common central focus which later segregates to other vas-cular compartments.
Changes in extra-cellular fluid (ECF) of glucose, in the samegroups of rats, were measured by a glucose microbiosen-sor (CFE/PB/Nafion/PEI/Gox/PoPD) after the electrical stimulation(Fig. 3A). Similar recordings were carried out with a blank sen-sor (without Gox) very close (less than 100 m) to the glucose
microbiosensor (see Fig. 3B). After electrical stimulus, the glucosedecreased to 15–20% below the basal levels depending on the fre-quency used. In contrast to the HbT and HbO2 results (see Fig. 4 ormore details), the application of local stimuli at 20, 30 and 40 Hz206

R. Roche et al. / Journal of Neuroscience Methods 202 (2011) 192– 198 195
Fig. 2. (A) Hemodynamic optical imaging showing two ROIs, one very close to the bipolar electrical stimulating electrode (activated area) and the other 1 mm away (deactivatedarea). The images show the HbT following stimulus onset (t = 0) with the above describe(B) The graph shows the HbT concentration recorded in both ROIs. (C) Relative positions
Fig. 3. (A) Glucose and HbO2 recorded for 10 s in the active area where the micro-biosensor for glucose was implanted. The shadow bar shows where the electricalstimulation occurred. The hemodynamic changes start about 2 s after the end ofstimulation. The increase of glucose levels start during stimulation and reach themaximum before HbO2. Insets 1 and 2: curves showing the close relationshipbetween the maximum depletion and repletion amplitude of glucose and HbO2 atdifferent frequencies of stimulation. (B) Typical recordings showing the responsesregistered with the blank sensor microbiosensor (without Gox) after local electricalstimulation.
d ROIs. Time (in seconds) relative to stimulus onset is indicated above the images.of the stimulating electrode, glucose biosensor and its sentinel.
produced a decrease of the glucose current but the signal of glucosestarted to increase before the end of the stimuli. This typical resulthas been observed by us (Salazar et al., 2010b,c) and other authors(Dixon et al., 2002; Silver and Erecinska, 1994). Since extracellularconcentration of glucose is the product of the rate of sugar deliv-ery from capillaries across the blood–brain barrier and the rate ofutilization by cells (Cremer JE et al., 1981; Hawkins et al., 1983;Cunningham et al., 1986; Robinson and Rapoport, 1986; Furleret al., 1991), the glucose decrease observed here could probablybe explained by the physiological consumption of glucose causedby the neuronal activation.
After this short decrease, the glucose current began to rise andreached a peak 30% above the basal levels (see Fig. 3A) 3 s afterthe onset of the stimulus. The glucose recordings returned to basallevels in 12 ± 3 s depending on the frequency of stimuli. Fig. 3Bshows the response of the blank sensors (sentinels) after electricalstimulation that only had a brief artifact. As regards the perfor-mance of the glucose biosensor, the inset shows the small changesexperienced by the sentinel (0.1 nA) in comparison to the high sen-sitivity of the glucose sensor proving that interferences and otherchemicals such as hydrogen peroxide did not influence our mea-surements.
Similar behavior on maximum depletion (1) and repletion (2)amplitude of glucose and HbO2 were observed versus used fre-quencies, see Fig. 3, inset 1 and inset 2. Two blocks (1 and 2) can beobserved in Fig. 3A to clarify the behavior of these variables (glucoseand HbO2 state). The first block (1), called depletion, includes the
electrical stimulation period and 1 s after the end of the stimulationwhen the glucose signal reached the basal levels. The second block(2), includes the increase of glucose and HbO2 concentration in ECFafter electrical stimulation and is called repletion. The depletion207
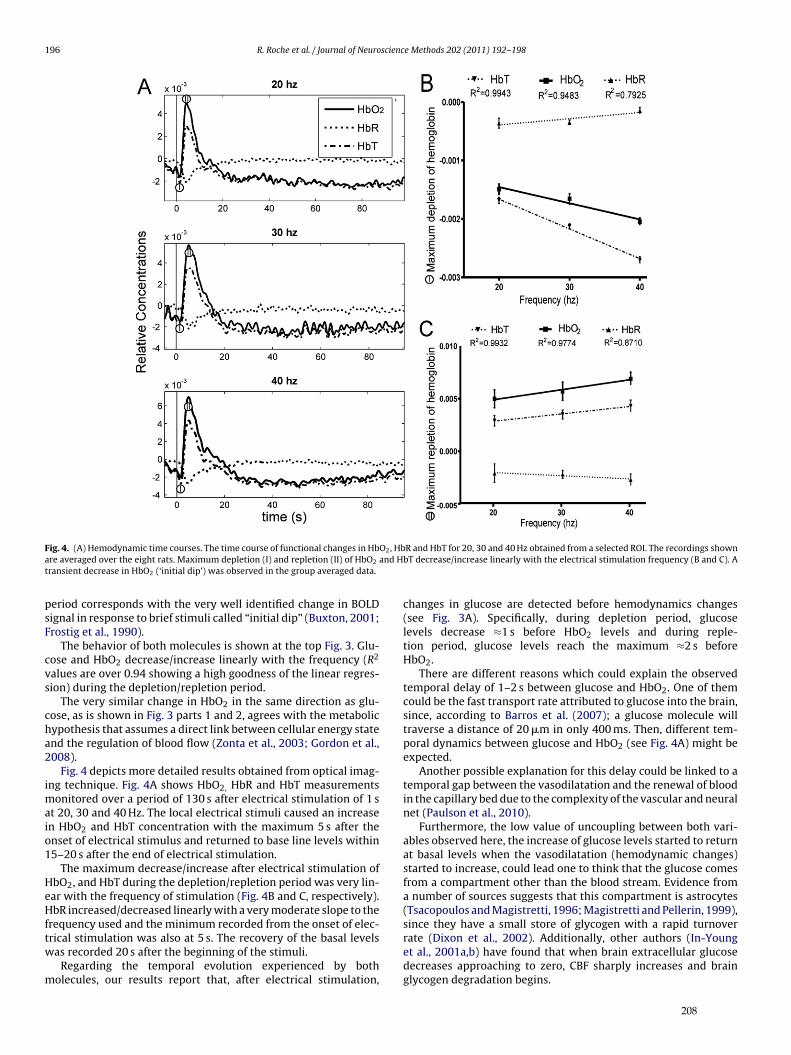
196 R. Roche et al. / Journal of Neuroscience Methods 202 (2011) 192– 198
F O2, Hba and Ht
psF
cvs
cha2
imaio1
HeHftw
m
ig. 4. (A) Hemodynamic time courses. The time course of functional changes in Hbre averaged over the eight rats. Maximum depletion (I) and repletion (II) of HbO2
ransient decrease in HbO2 (‘initial dip’) was observed in the group averaged data.
eriod corresponds with the very well identified change in BOLDignal in response to brief stimuli called “initial dip” (Buxton, 2001;rostig et al., 1990).
The behavior of both molecules is shown at the top Fig. 3. Glu-ose and HbO2 decrease/increase linearly with the frequency (R2
alues are over 0.94 showing a high goodness of the linear regres-ion) during the depletion/repletion period.
The very similar change in HbO2 in the same direction as glu-ose, as is shown in Fig. 3 parts 1 and 2, agrees with the metabolicypothesis that assumes a direct link between cellular energy statend the regulation of blood flow (Zonta et al., 2003; Gordon et al.,008).
Fig. 4 depicts more detailed results obtained from optical imag-ng technique. Fig. 4A shows HbO2, HbR and HbT measurements
onitored over a period of 130 s after electrical stimulation of 1 st 20, 30 and 40 Hz. The local electrical stimuli caused an increasen HbO2 and HbT concentration with the maximum 5 s after thenset of electrical stimulus and returned to base line levels within5–20 s after the end of electrical stimulation.
The maximum decrease/increase after electrical stimulation ofbO2, and HbT during the depletion/repletion period was very lin-ar with the frequency of stimulation (Fig. 4B and C, respectively).bR increased/decreased linearly with a very moderate slope to the
requency used and the minimum recorded from the onset of elec-
rical stimulation was also at 5 s. The recovery of the basal levelsas recorded 20 s after the beginning of the stimuli.Regarding the temporal evolution experienced by botholecules, our results report that, after electrical stimulation,
R and HbT for 20, 30 and 40 Hz obtained from a selected ROI. The recordings shownbT decrease/increase linearly with the electrical stimulation frequency (B and C). A
changes in glucose are detected before hemodynamics changes(see Fig. 3A). Specifically, during depletion period, glucoselevels decrease ≈1 s before HbO2 levels and during reple-tion period, glucose levels reach the maximum ≈2 s beforeHbO2.
There are different reasons which could explain the observedtemporal delay of 1–2 s between glucose and HbO2. One of themcould be the fast transport rate attributed to glucose into the brain,since, according to Barros et al. (2007); a glucose molecule willtraverse a distance of 20 m in only 400 ms. Then, different tem-poral dynamics between glucose and HbO2 (see Fig. 4A) might beexpected.
Another possible explanation for this delay could be linked to atemporal gap between the vasodilatation and the renewal of bloodin the capillary bed due to the complexity of the vascular and neuralnet (Paulson et al., 2010).
Furthermore, the low value of uncoupling between both vari-ables observed here, the increase of glucose levels started to returnat basal levels when the vasodilatation (hemodynamic changes)started to increase, could lead one to think that the glucose comesfrom a compartment other than the blood stream. Evidence froma number of sources suggests that this compartment is astrocytes(Tsacopoulos and Magistretti, 1996; Magistretti and Pellerin, 1999),since they have a small store of glycogen with a rapid turnover
rate (Dixon et al., 2002). Additionally, other authors (In-Younget al., 2001a,b) have found that when brain extracellular glucosedecreases approaching to zero, CBF sharply increases and brainglycogen degradation begins.208

scienc
ambwwrauol(atsHmrl
ifiCoot
htastm
iwscu2sp
toPcmohatrdinfpn
5
f
R. Roche et al. / Journal of Neuro
Although this last result does not fit in with the generallyccepted idea (Villringer and Dirnagl, 1995) that the energyetabolism dynamic occurring at sites of neuronal activation can
e considered as a concatenation of events (‘in-series’ events),here active neurons liberate signals producing an increase of CBFhich afterwards provides energy substrates (e.g., glucose), the
easons explained above support the argument that blood flownd glucose use are not always coupled. In fact, it is possible thatncoupling of CBF and energy metabolism suggests the existencef alternative pathways that use a variety of metabolites such asactate, H+ or adenosine to mediate the neurovascular couplingMagistretti and Pellerin, 1999). Besides which, as far as our resultsre concerned, it is possible to hypothesize that the observed deple-ion in brain glucose level must activate homeostatic mechanisms,uch as increase in blood flow, also suggested by other authors (Vanarreveld and Ochs, 1957; Leniger-Follert, 1979) and/or enhance-ent of transport (Gjedde et al., 1981) because the reduction is
apidly followed by a transient overshoot after which the glucoseevel returns to its original value.
This hypothesis is coherent with recent evidence of mismatch-ng between CBF and cerebral metabolic rate of oxygen (CMRO2)ound by Leithner and co-workers. They report the surprising find-ng that pharmacological inhibition of vasoactive agents reducedBF responses without affecting CMRO2, which suggests that thexygen delivered through blood flow serves as a safety mechanismf protection against hypoxia or pathological conditions rather thano increase oxidative metabolism (Leithner et al., 2010).
Moreover, Lindauer and co-workers reported that despite usingyperbaric hyperoxygenation to prevent hemoglobin deoxygena-ion, hemodynamic and neuronal responses remained unalteredfter electrical forepaw stimulation or cortical spreading depres-ion supporting the view that oxygen dissolved in tissue ratherhan oxygen transported by the vascular net activates oxidative
etabolism.The independence between CBF and neuronal responses found
n these works (Leithner et al., 2010; Lindauer et al., 2010) togetherith the time lag between glucose and HbO2 signals reported here,
upport the ‘neuronal’ hypothesis: the neuron-astrocyte ensembleommunicates the energetic demand to the vasculature and mod-lates changes in CBF in an feed-forward manner (Lindauer et al.,010; Buxton, 2010) by involving multiple vasoactive messengersuch as neurotransmitters, nitric oxide, epoxyeicosatrienoic acids,otassium ions and other intermediaries (Cauli, 2010).
Finally, although the application of spectroscopic analysis towo-dimensional optical imaging data has been used before byther authors (Devor et al., 2003, Paulson et al., 2010; Sheth andrakash, 2009), this report is the first to extend previous findings byombining measurements of glucose levels in CFS in real-time usingicrobiosensors to critically assess spatiotemporal characteristics
f hemodynamic responses. Our results suggest that functionalemodynamic changes in HbO2 are very similar to glucose levelsfter local electrical stimulation of the rat brain, but the temporalime course of both are very different, the glucose kinetic (short andapid decrease and posterior increase) takes place before hemo-ynamic changes. This result creates a significant challenge for
nterpreting blood oxygenation level dependent signal (BOLD sig-al) which is the basis of some neuroimaging approaches (e.g.,
MRI), since CBF and oxidative metabolism seem to be driven inarallel by neural activity – rather than a serial connection witheural activity, as is discussed by Buxton (2010).
. Conclusions
We have demonstrated that the two in vivo techniques per-ormed in this work can be combined and used to quantify
e Methods 202 (2011) 192– 198 197
hemoglobin and glucose concentration. Besides which, we havesuccessfully tested the performance of our setup to record signalsat a satisfactory temporal and spatial resolution. On the other hand,we developed software (Metcalculator) for 2-dimensional opticalimaging, which could be an interesting tool for studying hemo-dynamics and brain metabolism. Future works will be focused onanalyzing the data in real time and on properly integrating a moresophisticated filter design tool aimed at removing physiologicalnoise.
Finally, the existence of the uncoupling between CBF and glu-cose use found here means that it is now necessary to design newexperiments to obtain a better understanding of the interactionsbetween the metabolites and the hemodynamic involved in theneurovascular coupling mechanism. Therefore, new lines of futureresearch will be devoted to simultaneously using two additionalbiosensors, also developed in our laboratory, to detect lactate andglutamate.
Conflict of interest statement
The authors declare no conflict of interest.
Acknowledgements
The funds for the development of this work had been promotedby the following national public projects: ULLAPD-08/01 granted bythe Agencia Canaria de Investigación, Innovación y Sociedad de laInformación, Ministerio de Industria, Turismo y Comercio (ProyectoAVANZA) TSI-020100-2008-337 and Ministerio de Ciencia e Inno-vación (Proyecto CICYT) TIN2008-06867-C02-01/TIN.
References
Barros LF, Bittner CX, Loaiza A, Porras OH. A quantitative overview of glucose dynam-ics in the gliovascular unit. Glia 2007;55(12):1222–37.
Buxton RB. Interpreting oxygenation-based neuroimaging signals: the importanceand the challenge of understanding brain oxygen metabolism. Frontiers in Neu-roenergetics 2010;2:8.
Buxton RB. The elusive initial dip. NeuroImage 2001;13:953–8.Cauli B, Hamel E. Revisiting the role of neurons in neurovascular coupling. Frontiers
in Neuroenergetics 2010;2:9.Cremer JE, Ray DE, Sarna GS, Cunningham V. A study of the kinetic behavior of glucose
based on simultaneous estimates of influx and phosphorylation in brain regionsof rats in different physiological states. Brain Research 1981;22(1):331–42.
Cunningham VJ, Hargreaves RJ, Pelling D, Moorhouse SR. Regional blood–brain glu-cose transfer in the rat: a novel double-membrane kinetic analysis. Journal ofCerebral Blood Flow and Metabolism 1986;6(3):305–14.
Devor A, Dunn AK, Andermann ML, Ulbert I, Boas DA, Dale AM. Neuron cou-pling of total hemoglobin concentration, oxygenation, and neural activity in ratsomatosensory cortex. Proceedings of the National Academy of Sciences of theUnited States of America 2003;39(2):353–9.
Dixon BM, Lowry JP, O’Neill RD. Characterization in vitro and in vivo of the oxy-gen dependence of an enzyme/polymer biosensor for monitoring brain glucose.Journal of Neuroscience Methods 2002;19(2):135–42.
Frostig RD, Lieke EE, Ts’o DY, Grinvald A. Cortical functional architecture and localcoupling between neuronal activity and the microcirculation revealed by in vivohigh-resolution optical imaging of intrinsic signals. Proceedings of the NationalAcademy of Sciences of the United States of America 1990;87(16):6082–6.
Furler SM, Jenkins AB, Storlien LH, Kraegen EW. In vivo location of the rate-limitingstep of hexose uptake in muscle and brain tissue of rats. American Journal ofPhysiology 1991;261(3):E337–47.
Giove F, Mangia S, Bianciardi M, Garreffa G, Di Salle F, Morrone R, Maraviglia B. Thephysiology and metabolism of neuronal activation: in vivo studies by NMR andother methods. Magnetic Resonance Imaging 2003;21:1283–93.
Gjedde A, Hansen AJ, Quistorff B. Blood–brain glucose transfer in spreading depres-sion. Journal of Neurochemistry 1981;37(4):807–12.
González-Mora JL, Martín FA, Rojas-Díaz D, Hernández S, Ramos-Pérez I, RodríguezVD, Castellano MA. In vivo spectroscopy: a novel approach for simultaneouslyestimating nitric oxide and hemodynamic parameters in the rat brain. Journalof Neuroscience Methods 2002;119:151–61.
Gordon GR, Choi HB, Rungta RL, Ellis-Davies GC, MacVicar BA. Brain
metabolism dictates the polarity of astrocyte control over arterioles. Nature2008;456(7223):745–9.Hawkins RA, Mans AM, Davis DW, Hibbard LS, Lu DM. Glucose availability toindividual cerebral structures is correlated to glucose metabolism. Journal ofNeurochemistry 1983;40(4):1013–8.
209

1 scienc
H
I
I
L
L
L
M
M
P
P
R
S
98 R. Roche et al. / Journal of Neuro
ernández SE, Rodríguez VD, Pérez J, Martín FA, Castellano MA, Gonzalez-Mora JL.Diffuse reflectance spectroscopy characterization of hemoglobin and intralipidsolutions: in vitro measurements with continuous variation of absorption andscattering. Journal of Biomedical Optics 2009;14:1–22.
n-Young C, Sang-Pil L, Seong-Gi K, Rolf G. Relationship between glucose/glycogenmetabolism and CBF during insulin-induced hypoglycemia in vivo. Annual Meet-ing Proceedings of the International Society for Magnetic Resonance in Medicine2001a;9:492.
n-Young C, Sang-Pil L, Seong-Gi K, Rolf G. In vivo measurements of brain glu-cose transport using the reversible Michaelis–Menten model and simultaneousmeasurements of cerebral blood flow changes during hypoglycemia. Journal ofCerebral Blood Flow and Metabolism 2001b;21:653–63.
eithner C, Royl G, Offenhauser N, Füchtemeier M, Kohl-Bareis M, VillringerA, Dirnagl U, Lindauer U. Pharmacological uncoupling of activation inducedincreases in CBF and CMRO2. Journal of Cerebral Blood Flow & Metabolism2010;30(2):311–22.
eniger-Follert E, Hossmann KA. Simultaneous measurements of microflow andevoked potentials in the somatomotor cortex of the cat brain during spe-cific sensory activation. Pflügers Archiv European Journal of Physiology1979;380(1):85–9.
indauer U, Leithner C, Kaasch H, Rohrer B, Foddis M, Füchtemeier M, OffenhauserN, Steinbrink J, Royl G, Kohl-Bareis M, Dirnagl U. Neurovascular coupling in ratbrain operates independent of hemoglobin deoxygenation. Journal of CerebralBlood Flow & Metabolism 2010;30(4):757–68.
agistretti PJ, Pellerin L. Cellular mechanisms of brain energy metabolism and theirrelevance to functional brain imaging. Philosophical Transactions of the RoyalSociety B: Biological Sciences 1999;354(1387):1155–63.
cAteer K, O’Neill RD. Strategies for decreasing ascorbate interference at glu-cose oxidase-modified poly(o-phenylenediamine)-coated electrodes. Analyst1996;121:773–7.
aulson OB, Hasselbalch SG, Rostrup E, Knudsen GM, Pelligrino D. Cerebral bloodflow response to functional activation. Journal of Cerebral Blood Flow &Metabolism 2010;30:2–14.
rahl SA. Tabulated Molar Extinction Coefficient for Hemoglobin in Water,
http://omlc.ogi.edu/spectra/hemoglobin/summary.html.1998.obinson PJ, Rapoport SI. Glucose transport and metabolism in the brain. AmericanJournal of Physiology 1986;250(1):R127–36.
alazar P, Martín M, Roche R, González-Mora JL, O’Neill RD. Microbiosensors forglucose based on Prussian Blue modified carbon fiber electrodes for in vivo
e Methods 202 (2011) 192– 198
monitoring in the central nervous system. Biosensors and Bioelectronics2010a;26:748–53.
Salazar P, Martín M, Roche R, O’Neill RD, González-Mora JL. Prussian Blue-modifiedmicroelectrodes for selective transduction in enzyme-based amperometricmi-crobiosensors for in vivo neurochemical monitoring. Electrochimica Acta2010b;55:6476–84.
Salazar P, O’Neill RD, Martín M, Roche R, González-Mora JL. Amperometric glu-cose microbiosensor based on Prussian Blue modified carbon fiber electrodefor physiological applications. Sensors and Actuators B: Chemical 2010c:1–27.
Sfareni R, Boffi A, Quaresima V, Ferrari M. Near infrared absorption spectra of humandeoxy- and oxyhaemoglobin in the temperature range 20–40 C. Biochimica etBiophysica Acta 1997;1340(2):165–9.
Sheth SA, Prakash N, Michael Guiou M, Toga AW. Validation and visualizationof two-dimensional optical spectroscopic imaging of cerebral hemodynamics.NeuroImage 2009;47:T36–43.
Shulman RG, Hyder F, Rothman DL. Lactate efflux and the neuroenergetic basis ofbrain function. NMR in Biomedicine 2001;14:389–96.
Silver IA, Erecinska M. Extracellular glucose concentration in mammalian brain:continuous monitoring of changes during increased neuronal activity and uponlimitation in oxygen supply in normo- hypo-, and hyperglycemic animals. Jour-nal of Neuroscience 1994;14(8):5068–76.
Sokoloff L. The metabolism of the central nervous system in vivo. In: Field J, MagounHW, Hall VE, editors. Handbook of physiology. Section I. Neurophysiology, vol.3. Washington, DC: American Physiological Society; 1960. p. 1843–64.
Tsacopoulos M, Magistretti PJ. Metabolic coupling between glia and neurons. Journalof Neuroscience 1996;16(3):877–85.
Van Harreveld A, Ochs S. Electrical and vascular concomitants of spreading depres-sion. American Journal of Physiology 1957;189(1):159–66.
Villringer A, Dirnagl U. Coupling of brain activity and cerebral blood flow: basisof functional neuroimaging. Cerebrovascular and Brain Metabolism Reviews1995;7(3):240–76.
Wray S, Cope M, Delpy DT, Wyatt JS, Reynolds EO. Characterization of the nearinfrared absorption spectra of cytochrome aa3 and haemoglobin for the non-
invasive monitoring of cerebral oxygenation. Biochimica et Biophysica Acta1988;933(1):184–92.Zonta M, Angulo MC, Gobbo S, Rosengarten B, Hossmann KA, Pozzan T, Carmignoto G.Neuron-to-astrocyte signaling is central to the dynamic control of brain micro-circulation. Nature Neuroscience 2003;6:43–50.
210

The use of fluorocarbons to mitigate the “oxygen deficit” in glucose
microbiosensors for the neuroscience: an in vitro approach.
Salazar P1,*, Martín M1,2, O’Neill RD3, Roche R1 and González-Mora JL1
1Neurochemistry and Neuroimaging group, Faculty of Medicine, University of La
Laguna, Tenerife, Spain. 2Atlántica Biomédica SL, Tenerife, Spain. 3UCD School of Chemistry and Chemical Biology, University College Dublin, Belfield,
Dublin 4, Ireland.
Abstract
First generation of amperometric glucose biosensors are the most commonly used
method for glucose detection in the neuroscience. The so-called oxygen deficit, which
means that the biosensor response depends on the O2 concentration, is a common
problem for all first-generation biosensors. This is an important issue in
neurophysiological studies because the mean O2 concentration in brain ECF has been
reported to be close to 50 µM. In the present work we use different fluorocarbons oils
such as Nafion and H700 to mitigate the oxygen deficit of our previous glucose
biosensor designs. These fluorocarbon-derived materials display a remarkable solubility
for O2, and act as oxygen reservoirs supporting the enzymatic reaction at very low O2
concentration. We present different biosensor configurations and study, step by step,
each biosensor configuration, evaluating its oxygen dependence Finally, Nafion and
H700-modified biosensors presented a remarkable oxygen tolerance in the physiological
glucose range concentration without the decrease significantively the enzymatic
loading.
Keywords: Glucose biosensor, oxygen deficit, Fluorocarbon oil, Nafion, H700.
211

1. Introduction:
Amperometric glucose biosensors are now the most commonly used method for
glucose detection because of its many advantages, such as simplicity and speed. These
devices have been employed in several areas of science, especially in the neurosciences.
Where such devices must be adapted to special requirements such as: low dimensions,
high selectivity and sensitivity, low co-sustrate concentration, short time response, etc.
The overall enzymatic process for glucose oxidase (Gox), that is similar for many
oxidases, may be written as equations 1 and 2, where FAD and FADH2 are the oxidized
and reduced forms, respectively, of the prosthetic group, flavin adenine dinucleotide [1].
Equation 3 represents the electrochemical measurement of the H2O2 generated during
the reaction of oxido-reductase enzymes (see eq. 2), and in first generation devices is
generally carried out amperometrically, either directly on the substrate surface at
relatively high applied potentials or catalytically at lower potentials.
β-D-glucose + Gox/FAD D - glucono-δ-lactone + Gox/FADH2 [eq. 1]
Gox/FADH2 + O2 Gox/FAD +H2O2 [eq. 2]
H2O2 O2 + 2H+ + 2e- [eq. 3]
The so-called oxygen deficit, which means that the biosensor response depends
on the O2 concentration (see eq. 2) is a common problem for all first-generation
biosensors [2]. This is an important issue in neurophysiological studies because the
mean O2 concentration in brain ECF has been reported to be close to 50 µM (five times
lower than aerated solutions), and this level can fluctuate significantly under
physiological conditions and with pharmacological intervention [3].
212

Different approaches have been employed to solve this O2 dependence. Thus,
second and third biosensor generations appeared during last decades. Nevertheless, first
generation biosensors are still preferred for many researches for its easy
implementation, stability, short time response, etc. Attempts to overcome this problem
in first generation biosensors include: (1) the study of different electrode geometries; (2)
inclusion of a diffusion barrier to increase O2/substrate permeation ratio; (3)
optimization of the enzymatic loading, and so the biosensor's sensitivity and linear
range; (4) the use of oxygen-rich polymers (fluorocarbon-derived materials) as internal
oxygen supply.
Fluorocarbon-derived materials display a remarkable solubility for O2, and they
have been used, for example, in carbon paste electrodes as an oxygen reservoir [2]. The
internal flux of O2 can support the enzymatic reaction for extended periods, even in O2-
free media. Although this approach has been used in macrobiosensor design, studies in
the microbiosensor field are very limited.
Our group has been working in recent years to implement microbiosensors based
on Prussian Blue-modified carbon fiber electrodes (CFEs) with low dimensions (~10
µm diameter) for use in physiological studies. Previous works showed the excellent
properties of our glucose biosensors during in vitro and in vivo experiments.
Nevertheless, O2 dependence had not been studied before. This work presents our first
results using common fluorocarbon polymers such as Nafion and H700 as an internal O2
source for our previous microbiosensor designs [4].
213

2. Materials and methods
2.1 Reagents and solutions
The enzyme glucose oxidase (Gox) from Aspergillus niger (EC 1.1.3.4, Type VII-S),
purchased as a lyophilized powder, and glutaraldehyde 25% (Glut) were obtained from
Sigma Chemical Co., and stored at –21 ºC until use. Bovine serum albumin (BSA,
fraction V) was also obtained from Sigma. All chemicals, including o-
phenylenediamine (o-PD), glucose, polyethyleneimine (PEI), KCl, FeCl3, K3[Fe(CN)6],
HCl (35%w/w), H2O2 (30% w/v), Nafion (5 wt% in a mixture of lower aliphatic
alcohols and water), Halocarbon oil (H700) and phosphate buffer saline (PBS, pH 7.4
containing 0.1M NaCl) were obtained from Sigma and used as supplied. PBS stock
solutions were prepared in doubly distilled water (Millipore-Q), and stored at 4 °C when
not in use. A stock 250 mM solution of glucose were prepared in water, left for 24 h at
room temperature to allow equilibration of the anomers, and then stored at 4 ºC. The
PEI and H700 solutions used were prepared by dissolving PEI and H700 at 5% w/v in
H2O. The cross-linking solution was prepared in PBS with 1% w/v of BSA and 0.1%
w/v of Glut. Monomer solution of 300 mM o-PD was prepared using 48.6 mg of o-PD
and 7.5 mg of BSA in 1.5 mL of N2-saturated PBS and sonicated for 15 min. A 300
U/mL solution of Gox was prepared by dissolving 3.7 mg in 2 mL of PBS. Carbon
fibers (8 µm diameter), glass capillaries, and 250 µm internal diameter Teflon-coated
copper wires were obtained from Word Precision Instruments Inc., and silver epoxy
paint was supplied by Sigma. N2 (high grade, O2 < 2 ppm) was supplied by Air Liquide.
2.2 Micro-biosensor construction based on CFE/PB
Carbon fiber electrodes (CFEs) were constructed and modified with Prussian
Blue (PB) as described previously [4]. When PB/CFEs were ready to use, the next step
214

was to immobilize the Gox, using the following protocol: 15 fast immersions in Nafion
or H700 solution and a drying period of 30 min; 15 fast immersions in PEI solution and
a drying period (15 min); n fast immersions in Gox (300 U/mL) and a drying period (5
min); and 15 fast immersions in the cross-linking solution (BSA/glutaraldehyde). After
the immobilization step, all biosensors were cured for 1 h at 37 ºC, and finally an
interference-rejection film of poly-o-phenylenediamine (PoPD/BSA) was
electropolymerized over the biosensor. In order to compare the beneficial effect of
Nafion and H700, different configurations were checked by changing the main steps in
the fabrication.
2.3 Amperometric experiments
All calibrations were done in a 25 mL glass cell at 21 °C, using a standard three-
electrode set-up with a commercial saturated calomel electrode (SCE) (CRISON
Instrument S.A.) as the reference and platinum wire as the auxiliary electrode. The
applied potential for amperometric studies was 0.0 V against SCE. Glucose calibrations
were performed in quiescent air-saturated or nitrogen-saturated PBS (following
stabilization of the background current for 15 min) by adding aliquots of glucose stock
solution (0.25 M) to the electrochemical cell. After the addition of glucose aliquots, the
solutions were stirred for 5 s and then left to reach the steady-state current. To measure
oxygen dependence, several biosensors were stabilized (during continuous air bubbling)
in a voltammetric gas cell with 50 ml PBS at different glucose concentration. After that
N2 was bubbled, at the same bubble rate, and the glucose current change registered over
time. To relate these results with O2 concentration, the latter was sensed by using an
unmodified CFE poised at – 650 mV against SCE.
215

2.4 Instrumentation and software
Experiments were computer controlled with data-acquisition software EChem™
for CV and Chart™ for CPA. The data-acquisition system used was e-Corder 401
(EDAQ) and a low-noise and high-sensitivity potentiostat, Quadstat (EDAQ). The
linear and non-linear regression analyses were performed using the graphical software
package Prism (ver. 5.00 GraphPad Software). To electro-deposit and activate the PB, a
custom-made Ag/AgCl/saturated KCl reference electrode and platinum wire auxiliary
electrode were used.
3. Results and discussion:
One of the most important parameters in biosensor design is its substrate
sensitivity. However, for biosensors, excessive sensitivity may carry two significant
problems: (1) short linear range; and (2) high cofactor consumption (eq. 2). In order to
check the oxygen dependence of our previous glucose biosensors, we constructed and
calibrated different biosensor configurations both in aerated and in de-aerated solution.
Figure 1 shows responses of a glucose biosensor with a high sensitivity (1.07 nA/mM)
calibrated under these two conditions. The effect of de-aeration (or, more realistically,
low O2 concentration) is clear when the retained response (RR%, the percentage
difference between these two conditions) is computed. Even at low glucose
concentrations, RR% (green) was ~70%, showing a significant stoichiometric
limitation.
216

Figure 1.- Calibration curves for glucose biosensor (Gox) in aerated (red) and de-aerated (blue) solutions. Retained response (RR%) was computed as the percentage difference between these two conditions (green). Sensitivity was computed in the range of 0-2 mM glucose.
The addition of a diffusive membrane (such as PoPD) on top of the biosensor to
enhance the glucose/O2 ratio is commonly used [1]. The main effect of this diffusion
barrier was to decrease the sensitivity to the target analyte (to compare see Figure 1 and
Figure 2a). Different configurations, with different sensitivities were studied (Figure
2a, b, c). Although RR% was improved, it did not reach an acceptable value (RR% ≥
90) in the physiological glucose concentration range for brain ECF (0.5 – 2 mM)
(Figure 2a and Figure 2b). Finally, with this approach, only when glucose sensitivity
was reduced to ~0.17 nA/mM (Figure 2c), RR% reached an acceptable value in a
relevant glucose concentration range (0 – 3 mM).
217
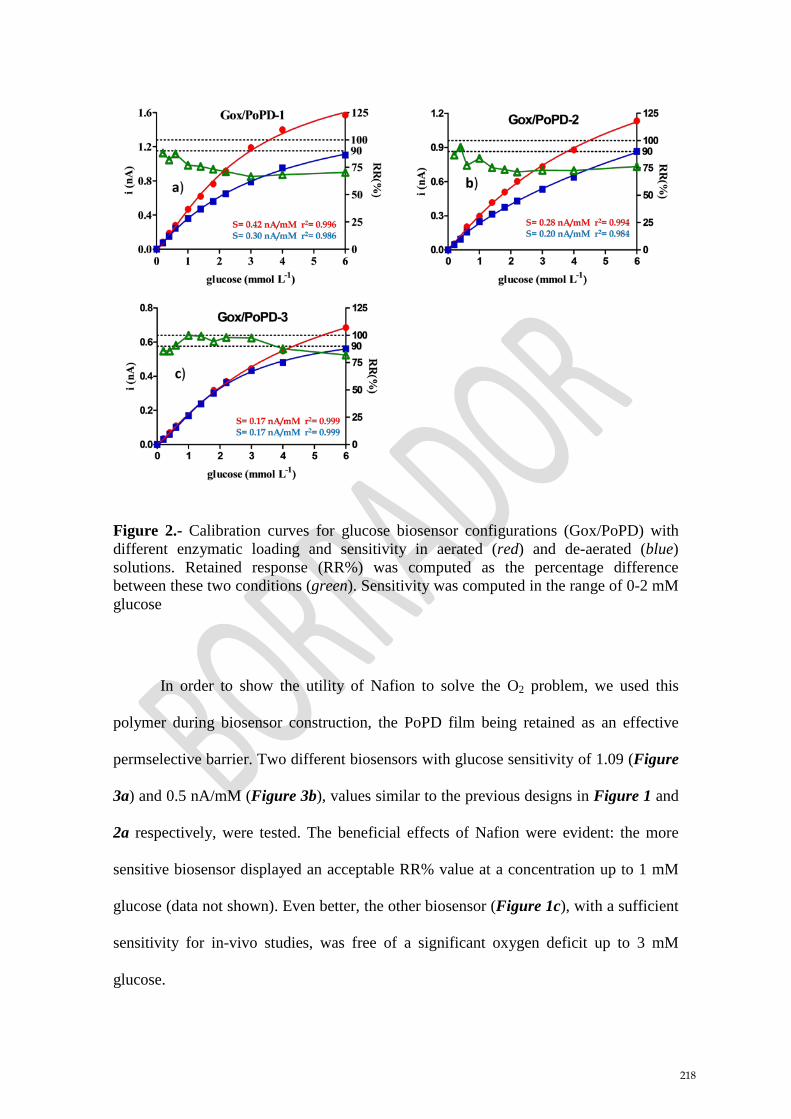
Figure 2.- Calibration curves for glucose biosensor configurations (Gox/PoPD) with different enzymatic loading and sensitivity in aerated (red) and de-aerated (blue) solutions. Retained response (RR%) was computed as the percentage difference between these two conditions (green). Sensitivity was computed in the range of 0-2 mM glucose
In order to show the utility of Nafion to solve the O2 problem, we used this
polymer during biosensor construction, the PoPD film being retained as an effective
permselective barrier. Two different biosensors with glucose sensitivity of 1.09 (Figure
3a) and 0.5 nA/mM (Figure 3b), values similar to the previous designs in Figure 1 and
2a respectively, were tested. The beneficial effects of Nafion were evident: the more
sensitive biosensor displayed an acceptable RR% value at a concentration up to 1 mM
glucose (data not shown). Even better, the other biosensor (Figure 1c), with a sufficient
sensitivity for in-vivo studies, was free of a significant oxygen deficit up to 3 mM
glucose.
218

Figure 3.- Calibration curves for glucose biosensor configurations (Naf/Gox/PoPD), with different enzymatic loading and sensitivity in aerated (red) and de-aerated (blue) solutions. Retained response (RR%) was computed as the percentage difference between these two conditions (green). Sensitivity was computed in the range of 0-2 mM glucose
More detailed studies were carried out under dynamic conditions (Figure 4a),
using different biosensor configurations. These experiments consisted of changing the
O2 concentration (bubbling with N2 or air) at different glucose concentrations. In this
way, biosensor oxygen dependence was quantified as KM(O2) defined by eq. (3)
JGluc= Jmax / (1 + KM(O2)/[O2]) (eq. 3)
KM(O2) value of 11 ± 2 μM (mean ± SD) in the brain ECF glucose range (0.5 – 2
mM); meanwhile, at higher glucose levels (5 – 10 mM), the KM(O2) value was 31 ± 8
μM. The smaller the value of KM(O2), the lower the oxygen dependence because higher
oxygen affinity leads to oxygen saturation at lower pO2, thereby reducing biosensor
dependency at higher pO2 levels. These data reveal that our optimized configuration is
adequate for applications in neurophysiology where oxygen levels may fluctuate in a
range of 30 – 80 µM under non-extreme (i.e., normoxic) conditions.
219

Figure 4.- a) Glucose biosensor response for Naf/Gox/PoPD-2 configuration at different glucose concentration (i:0.5 mM; j:1 mM, k:2 mM, l:5 mM; m:10 mM) against oxygen concentration (ñ) b) Normalized glucose–oxygen correlation plots for these five concentrations.
Figure 5.- Calibration curves for glucose biosensor configurations (H700/Gox/PoPD), with different enzymatic loading and sensitivity in aerated (red) and de-aerated (blue) solutions. Retained response (RR%) was computed as the percentage difference between these two conditions (green). Sensitivity was computed in the range of 0-2 mM glucose.
During the present study we carried out preliminary tests on other fluorocarbon oils as
an internal source of oxygen to solve the oxygen deficit problem (Figure 5a). H700
displayed promising behavior in this respect, showing good oxygen tolerance, even for
biosensors with higher glucose sensitivity (Figure 5b). These alternative fluorocarbons
will be explored more systematically in future investigations.
220
Acknowledgement
The funds for the development of this device have been provided by subprograma INNCORPORA and FEDER (INC-TU-2011-1621), Ministerio de Industria, Turismo y Comercio (TSI-020100-2011-189 and TSI-020100-2010-346); Ministerio de Ciencia e Investigación (TIN2011-28146).
References
1) McMahon CP, Killoran SJ, O’Neill RD (2005) Design variations of a polymer–enzyme composite biosensor for glucose: Enhanced analyte sensitivity without increased oxygen dependence. Journal of Electroanalytical Chemistry 580: 193–202.
2) Wang J, Lu F (1998) Oxygen-Rich Oxidase Enzyme Electrodes for Operation in Oxygen-Free Solutions. Journal of American Chemistry Society 120: 1048–1050.
3) Dixon BM, Lowry JP, O'Neill RD (2002) Characterization in vitro and in vivo of the oxygen dependence of an enzyme/polymer biosensor for monitoring brain glucose. Journal of Neuroscience Methods 119: 135–142.
4) Salazar P, O’Neill RD, Martín M, Roche R, González Mora JL (2011) Amperometric glucose microbiosensor based on a Prussian Blue modified carbon fiber electrode for physiological applications. Sensors and Actuators B 152: 137–143.
221

BIBLIOGRAFÍA
222

11.- Bibliografía
Abad A, Montoya A. Production of monoclonal antibodies for carbaryl from a hapten preserving the carbamate group. J. Agric. Food Chem. 42 (1994) 1818-1823.
Abbaspour A, Kamyabi MA. Electrochemical formation of Prussian blue films with a single ferricyanide solution on gold electrode.J. Electroanal. Chem. 584 (2005) 117–123.
Anderson JM. Mechanisms of inflammation and infection with implanted devices. Cardiovasc. Pathol. 2 (1993) 33S–41S.
Andreescu S, Magearu V, Lougarre A, Fournier D, Marty JL. Immobilization of enzymes on screen-printed sensors via an histidine tail. Application to the detection of pesticides using modified cholinesterase. Anal. Lett. 34 (2001) 529–540.
Andreescu S, Marty JL. Twenty years research in cholinesterase biosensors: from basic research to practical applications. Biomol. Eng. 23 (2006) 1-15.
Antiochia R, Gorton L. Development of a carbon nanotube paste electrode osmium polymer-mediated for determination of glucose in alcoholic beverages. Biosens. Bioelectron. 22 (2007) 2611–2617.
Araque A, Parpura V, Sanzgiri RP, Haydon PG. Tripartite synapses: glia, the unacknowledged partner. Trends Neurosci 22 (1999) 208–215.
Arya SK, Datta M, Malhotra BD. Recent advances in cholesterol biosensor. Biosens. Bioelectron. 23 (2008) 1083–1100.
Avshalumov MV, Chen BT, Marshall SP, Peña DM, Rice ME. Glutamate-dependent inhibition of dopamine release in striatum is mediated by a new diffusible messenger, H2O2. J Neurosci. 23 (2003) 2744 –2750.
Baldwin SA, Lienhard GE. Purification and reconstitution of glucose transporter from human erythrocytes. Methods Enzymol. 174 (1989) 39–50.
Ballerstadt R, Schultz JS. A fluorescence affinity hollow fiber sensor for continuous transdermal glucose monitoring. Anal. Chem. 72 (2000) 4185–4192.
Barrett D, Shumake J, Jones D, Gonzalez-Lima F. Metabolic mapping of mouse brain activity after extinction of a conditioned emotional response. J. Neurosci. 23 (2003) 5740–5749.
Bazzu G, Puggioni GM, Dedola, Calia G, Rocchitta G, Migheli R, Desole MS, Lowry JP, O'Neill RD, Serra PA. Real-time monitoring of brain tissue oxygen using a miniaturized biotelemetric device implanted in freely-moving rats Anal. Chem. 81 (2009) 2235-2241.
223

Benveniste H, Drejer J, Schousboe A, Diemer NH. Regional cerebral glucose phosphorylation and blood flow after insertion of a microdialysis fiber through the dorsal hippocampus in the rat. J. Neurochem. 49 (1987) 729-734.
Benveniste H, Hüttemeier PC. Microdialysis-theory and application. Progr. Neurobiol. 35 (1990) 35 195-215.
Berezhetskyy AL, Sosovska OF, Durrieu C, Chovelon JM, Dzyadevych SV, Tran-Minh C. Alkaline phosphatase conductometric biosensor for heavy-metal ions determination. ITBM-RBM 29 (2008) 136–140.
Bergersen LH. Is lactate food for neurons? Comparison of monocarboxylate transporter subtypes in brain and muscle, Neuroscience 145 (2007) 11-19.
Bermúdez V, Bermúdez F, Arraiz N, Leal E, Linares S, Mengual E, Valdelamar L, Rodríguez M, Seyfi H, Amell A, Carrillo M, Silva C, Acosta A, Añez J, Andara C, Angulo V, Martins G. Biología molecular de los transportadores de glucosa: clasificación, estructura y distribución. AVFT 26 (2007) 76-86.
Bito L, Davson H, Levin E, Murray M, Snider N. The concentrations of free amino acids and other electrolytes in cerebrospinal fluid, in vivo dialysate of brain, and blood plasma of the dog. J. Neurochem. 13 (1966) 1057-1067.
Bliss TM, Sapolsky RM, Interactions among glucose, lactate and adenosine regulate energy substrate utilization in hippocampal cultures, Brain Res. 899 (2001) 134-141.
Bolger FB, Lowry JP. Brain Tissue Oxygen: In Vivo Monitoring with Carbon Paste Electrodes. Sensors 5 (2005) 473-487.
Bondy CA, Lee CY, Zhou J Ontogeny and cellular distribution of brain glucose transporter gene expression. Mol Cell Neurosci 3 (1992) 305–313.
Borland LM, Guoyue S, Yang H, Michael AC. Voltammetric study of extracellular dopamine near microdialysis probes acutely implanted in the striatum of the anesthetized rat. J. Neurosci. Meth. 146 (2005) 149-158.
Bouzier-Sore AK, Merle M, Magistretti PJ, Pellerin L. Feeding active neurons: (re)emergence of a nursing role for astrocytes, J. Physiol. Paris 96 (2002), 273-282.
Bouzier-Sore AK, Voisin P, Canioni P, Magistretti PJ. and L. Pellerin, Lactate is a preferential oxidative energy substrate over glucose for neurons in culture, J. Cerebr. Blood Flow Metab. 23 (2003) 1298–1306.
Bradbury MWB. The blood-brain barrier. Experimental Physiology 78(1993) 453-472.
Breccia JD, Andersson MM, Hatti–Kaul R. The role of poly(ethyleneimine) in stabilization against metal-catalyzed oxidation of proteins: a case study with lactate dehydrogenase. Biochim. Biophys. Acta 1570 (2002) 165–173.
224
Brooks GA. Lactate production under fully aerobic conditions: the lactate shuttle during rest and exercise. Fed. Proc. 45 (1987) 2924–2929.
Bucur B, Danet AF, Marty JL. Versatile method of cholinesterase immobilization via affinity bonds using concanavalin A applied to the construction of a screen-printed biosensor. Biosens. Bioelectron. 20 (2004) 217–225.
Burmeister JJ, Palmer M, Gerhardt GA.L-lactate measures in brain tissue with ceramic-based multisite microelectrodes. Biosens Bioelectron. 20 (2005) 1772-1779.
Buser HJ, Schwarzenbach D, Petter W. Ludi A. The crystal structure of Prussian Blue: Fe4[Fe(CN)6]3 ×H2O. Inorg. Chem. 16 (1977) 2704–2710.
Cano M, Ávila JL, Mayén M, Mena ML, Pingarrón M, Rodríguez-Amaro R. A new, third generation, PVC/TTF–TCNQ composite amperometric biosensor for glucose determination. J. Electroanal. Chem. 615 (2008) 69-74.
Cao L. Carrier-bound immobilized enzymes—principles, applications and design. Wiley-VCH 2005.
Castillo J, Gáspár S,. Leth S, Niculescu, Mortari A, Bontidean I, Soukharev V, Dorneanu SA, Ryabov AD, Csöregi E. Biosensors for life quality design, development and applications. Sens. Actuators B 102 (2004) 179–194.
Cerdan S, Rodrigues T B, Sierra A, Benito M, Fonseca L L, Fonseca CP, García-Martín M L. The redox switch/redox coupling hypothesis. Neurochem. Int. 48 (2006) 523–530.
Chapman RG, Ostuni E, Liang MN, Meluleni G, Kim E,Yan L, Pier G, Warren HS, Whitesides GM. Polymeric thin films that resist the adsorption of proteins and the adhesion of bacteria. Langmuir 17 (2001) 1225-1233.
Chaubey A, Malhotra BD. Mediated biosensors. Biosens. Bioelectron. 17 (2002) 441-456.
Chaubey A, Pande KK, Singh VS, Malhotra BD. Co-immobilization of lactate oxidase and lactate dehydrogenase on conducting polyaniline films. Anal. Chim. Acta 407 (2000) 97-103.
Cheer JF, Wassum KM, Heien MLAV, Phillips PEM, Wightman RM. Cannabinoids enhance subsecond dopamine release in the Nucleus Accumbens of awake rats. J. Neurosci. 24 (2004) 4393-4400.
Chi Q, Dong S. Amperometric biosensors based on the immobilization of oxidases in a Prussian Blue film by electrochemical codeposition. Anal. Chim. Acta 310 (1995) 429–436.
Chiba K, Ohsaka T, Ohnuki Y, Oyama N. Electrochemical preparation of a ladder polymer containing phenazine rings. J Electroanal. Chem. 219 (1987) 117-124.
225

Chih CP, Roberts EL. Energy substrates for neurons during neural activity: a critical Review of the Astrocyte-Neuron Lactate Shuttle Hypothesis J. Cerebr. Blood Flow Metab. 23 (2003) 1263–1281.
Choeri C, Staines W, Miki T, Seino S, Messier C. Glucose transporter plasticity during memory processing. Neuroscience 130 (2005) 591–600.
Choi HN, Kim MA, Lee W-Y. Amperometric glucose biosensor based on sol–gel derived metal oxide/Nafion composite films. Anal. Chim. Acta 537 (2005) 179–187.
Choi MFM. Progress in enzyme-based biosensors using optical transducers. Microchim. Acta 148 (2004) 107–132.
Chumbimuni-Torres KY, Dai Z, Rubinova N, Xiang Y, Pretsch E, Wang J, Bakker E. Potentiometric biosensing of proteins with ultrasensitive ion-selective microelectrodes and nanoparticle labels. J. Am. Chem. Soc. 128 (2006) 13676-13677.
Chumbimuni-Torres KY, Wang J. Nanoparticle-induced potentiometric biosensing of NADH at copper ion-selective electrodes. Analyst 134 (2009) 1614-1617.
Clark Jr LC, Misrahy G, Fox RP. Chronically implanted polarographic electrodes. J. Appl. Physiol. 13 (1958) 85–91.
Clark LC Jr, Lyons C. Studies of a glassy carbon electrode for brain polarography with observations on the effect of carbonic anhydrase inhibition. Ala. J. Med. Sci. 4 (1965) 353-359.
Clark LC, Lyons C. Electrode system for continuous monitoring in cardiovascular surgery. Ann. N. Y. Acad. Sci. 102 (1962) 29-45.
Clarke DD, Sokoloff L. Circulation and energy metabolism of the brain. (en) Basic neurochemistry:molecular, cellular, and medical aspects, 6th Ed. Lippincott-Raven, Philadelphia (1999) 637–669 .
Colliver TL, Pyott SJ, Achalabun M, Ewing AG. VMAT-Mediated changes in quantal size and vesicular volume. J. Neurosci. 20 (2000) 5276–5282.
Cremer JE, Cunningham VJ, Pardridge WM, Braun LD, Oldendort WH. Kinetic of blood-brain barrier transport of pyruvate, lactate and glucose in the suckling, weaking and adult rats. J. Neurochem. 33 (1979) 439-445.
Cremer JE. Substrate utilization and brain development. J. Cereb. Blood Flow Metab. 2(1982) 394–407.
Delgado JMR, DeFeudis FV, Roth RH, Ryugo OK, Mitruka BM. Dialytrode for long term intracerebral perfusion in awake monkeys. Arch. Int. Pharmacodyn. Ther. 198 (1972) 9-21.
Delvaux M, Demoustier-Champagne S. Immobilisation of glucose oxidase within metallic nanotubes arrays for application to enzyme biosensors. Biosens Bioelectron 18 (2003) 943–951.
226

Demchenko AV, Melnik VG, Starodub NF. Thermal biosensor for detecting nonylphenol in the environment. Ukr. Biokhim. Zh. 79 (2007) 212-215.
Demestre M, Boutelle M, Fillenz M. Stimulated release of lactate in freely moving rats is dependent on the uptake of glutamate. J. Physiol. 499 (1997) 825–32.
Divis C. Ethanol oxidation by an Acetobacter xylinum microbial electrode. Ann. of Microbiol. 126A (1975) 175-186
Dixon BM, Lowry JP, O'Neill RD. Characterization in vitro and in vivo of the oxygen dependence of an enzyme/polymer biosensor for monitoring brain glucose. J.Neurosci. Methods 119 (2002) 135-142.
Doege H, Schürmann A, Bahrenberg G, Brauers A & Joost HG. GLUT8, a novel member of the sugar transport facilitator family with glucose transport activity. Journal of Biological Chemistry 275 (2000) 16275–16280.
D'Orazio P. Biosensors in clinical chemistry - 2011 update. Clin. Chim. Acta 412 (2011) 1749-1761.
D'Orazio P. Biosensors in clinical chemistry. Clin. Chim. Acta 334 (2003) 41-69.
Dostal A, Meyer B, Scholz F, Schroder U, Bond AM, Marken F, Shaw SJ. Electrochemical study of microcrystalline solid Prussian Blue particles mechanically attached to graphite and gold electrodes: electrochemically induced lattice reconstruction. J. Phys. Chem. 99 (1995) 2096–2103.
Duncan, JF, Wrigley, PWR. The electronic structure of the iron atoms in complex iron cyanides. J. Chem. Soc. (1963) 1120–1125.
Dwyer D S, Vannucci S J, Simpson, I A. Expression, regulation and functional role of glucose transporters (GLUTs) in brain. Int. Rev. Neurobiol. 51 (2002) 159–188.
Ellis D, Eckhoff M, Neff VD. Electrochromism in the mixed valence hexacyanides. 1. Voltammetric and spectral studies of the oxidation and reduction of thin films of Prussian Blue. J. Phys. Chem. 85 (1981)1225–1231.
Farrell CL, Pardridge WM. Blood–brain barrier glucose transporter is asymmetrically distributed on brain capillary endothelial lumenal and ablumenal membranes: an electron microscopic immunogold study. Proc. Natl. Acad. Sci. USA 88 (1991) 5779–5783.
Feldman BJ, Murray RW. Electron diffusion in wet and dry Prussian Blue films on interdigitated array electrodes. Inorg. Chem. 26 (1987) 1702–1708.
Ferreira L, Ramos M, Dordick J, Gil M. Influence of different silica derivatives in the immobilization and stabilization of a Bacillus licheniformis protease (Subtilisin Carlsberg). J. Mol. Catalysis B 21 (2003) 189–199.
227

Ferri T, Maida S, Poscia A, Santucci R. A Glucose Biosensor Based on Electro-Enzyme Catalyzed Oxidation of Glucose Using a HRP-GOD Layered Assembly. Electroanalysis 13 (2001) 1198-1202.
Fillenz M, Lowry JP.The relation between local cerebral blood flow and extracellular glucose concentration in rat striatum. Exp. Physiol. 83 (1998) 233-238.
Fiorito PA, Córdoba de Torresi I. Optimized multilayer oxalate biosensor. Talanta 62 (2004) 649–654.
Fiorito PA, Córdoba de Torresi SI. Glucose Amperometric Biosensor Based on the Co-immobilization of Glucose Oxidase (GOx) and Ferrocene in Poly(pyrrole) Generated from Ethanol / Water Mixtures. J. Braz. Chem. Soc. 12 (2001) 729-733.
Fox PT, Raichle M, Mintun M, Dence C. Nonoxidative glucose consumption during focal physiologic neuronal activity. Science 241 (1988) 462−464.
Fox PT, Raichle ME. Focal physiological uncoupling of cerebral blood flow and oxidative metabolism during somatosensory stimulation in human subjects. Proc Natl Acad Sci USA 83 (1986) 1140–1144.
Fox SI. Fisiología Humana 7ª ed. McGraw-Hill, Madrid (2004).
Fritzen-García MB, Oliveira IRWZ, Zanetti-Ramos BG, Fatibello-Filho O, Soldi V, Pasa AA, et al. Carbon paste electrode modified with pine kernel peroxidase immobilized on pegylated polyurethane nanoparticles. Sens. Actuators B 139 (2009) 570–575.
Frost M, Meyerhoff ME. In Vivo Chemical Sensors: Tackling Biocompatibility Anal. Chem. 78 (2006) 7371-7377.
Fumero B, Guadalupe T, Valladares F, Mora F, O'Neill RD, Mas M, González-Mora JL. Fixed versus removable microdialysis probes for in vivo neurochemical analysis: implications for behavioral studies. J. Neurochem. 63 (1994) 1407–1415.
Gallardo-Soto AM, Jaffari SA, Bone S. Characterisation and optimisation of AC conductimetric biosensors. Biosens. Bioelectron. 16 (2001) 23-29.
García-Jareño A, Navarro-Laboulais J, Vicente F. Electrochemical study of Nafion membranes/Prussian Blue films on ITO electrodes. Electrochim. Acta 41 (1996) 2675–2682.
García-Jareño JJ, Sanmatias A, Navarro-Laboulais J, Vicente F. The role of potassium and hydrogen ions in the Prussian Blue–Everitt’s salt process. Electrochim. Acta 44 (1998) 395–405.
Garguilo M. Amperometric microsensors for monitoring choline in the extracellular fluid of brain. J. Neurosci. Methods 70 (1996) 73–82.
228
Garjonyte R, Malinauskas A. Amperometric glucose biosensor based on glucose oxidase immobilized in poly(o-phenylenediamine) layer. Sens. Actuators B 56 (1999a) 85-92.
Garjonyte R, Malinauskas A. Amperometric glucose biosensors based on Prussian Blue and polyaniline glucose oxidase modified electrodes. Biosens. Bioelectron. 15 (2000b) 445–451.
Garjonyte R, Malinauskas A. Glucose biosensor based on glucose oxidase immobilized in electropolymerized polypyrrole and poly(o-phenylenediammine) films on a Prussian Blue-modified electrode. Sens. Actuators B 63 (2000a) 122–128.
Garjonyte R, Malinauskas A. Operational stability of amperometric hydrogen peroxide sensors, based on ferrous and copper hexacyanoferrates. Sens. Actuators B 56 (1999b) 93–97.
Garjonyte R, Yigzaw Y, Meskys R, Malinauskas A, Gorton L. Prussian-Blue and lactate oxidase-based amperometric biosensor for lactic acid. Sens. Actuators B 79 (2001) 33–38.
Garnett MC. Gene-delivery systems using cationic polymers. Crit. Rev. Ther. Drug Carr. Syst. 16 (1999) 147-207.
Gerhardt GA, Oke AF, Nagy G, Moghaddam B, Adams RN. Nafion-coated electrodes with high selectivity for CNS electrochemistry. Brain Research 290 (1984) 390-395.
Gifford R, Batchelor MM, Lee Y, Gokulrangan G, Meyerhoff ME, Wilson GSJ. Mediation of in vivo glucose sensor inflammatory response via nitric oxide release Biomed. Mater. Res. 75A (2005) 755-766.
Giménez-Romero D, Agrisuelas J, García-Jareño JJ, Gregori J, Gabrielli C, Perrot H, Vicente F. Electromechanical Phase Transition in Hexacyanometallate Nanostructure (Prussian Blue) J. Am. Chem,. Soc. 129 (2007) 7121-7126.
Godet C, Boujtita M, El Murr N. Direct electron transfer involving a large protein: glucose oxidase. New J. Chem. 23 (1999) 795-797.
Gogol EV, Evtugyn GA, Marty JL, Budnikov HC, Winter VG. Amperometric biosensors based on nafion coated screen-printed electrodes for the determination of cholinesterase inhibitors. Talanta (53) 2000 379–389.
Gonon FG, Fombarlet CM, Buda MJ, Pujol JF. Electrochemical treatment of pyrolytic carbon fiber electrodes. Anal. Chem. 53 (1981) 1386–1389.
González-Mora JL, Guadalupe T, Fumero Blas, Mas M. Mathematical resolution of mixed in vivo voltammetry signals. Models, algorithm, equipment, assessment by simultaneous microdialysis sampling. J. Neurosci. Methods 39 (1991) 231-244.
229

González-Mora JL, Guadalupe T, Mas M. In vivo voltammetry study of the modulatory action of prolactin on the mesolimbic dopaminergic system. Brain Res. Bull. 25 (1990) 729–733.
González-Mora JL, Maidment NT, Guadalupe T, Mas M. Postmortem dopamine dynamics assessed by voltammetry and microdialysis. Brain Res. Bull. 23 (1989) 323–327.
González-Mora JL, Sánchez-Bruno JA, Mas M. Concurrent on-line analysis of striatal ascorbate, dopamine and dihydroxyphenylacetic acid concentrations by in vivo voltammetry. Neuroscience Letters.86 (1988) 61-66.
Goodman JC, Valadka AB, Gopinath SP, Cormio M, Robertson CS. Lactate and excitatory amino acids measured by microdialysis are decreased by pentobarbital coma in head-injured patients. J. Neurotrauma 13 (1996) 549–556.
Grieshaber D, MacKenzie R, Vörös J, Reimhult E. Electrochemical Biosensors - Sensor Principles and Architectures. Sensors 8 (2008) 1400-1458.
Guadalupe T, González-Mora JL, Fumero B, MAs M. Voltammetric monitoring of brain extracellular levels of serotonin, 5-hydroxyindoleacetic acid and uric acid as assessed by simultaneous microdialysis. J. Neurosci. Methods 45 (1992) 59-64.
Guan JG, Miao YQ, Chen JR. Prussian Blue modified amperometric FIA biosensor: one step immunoassay for α-fetoprotein. Biosens. Bioelectron. 19 (2004) 789–794.
Guerrieri A, Lattanzio V, Palmisano F, Zambonin P. Electrosynthesized poly(pyrrole)/ poly(2-naphthol) bilayer membrane as an effective anti-interference layer for simultaneous determination of acethylcholine and choline by a dual electrode amperometric biosensor. Biosens. Bioelectron. 21 (2006) 1710–1718.
Guilbault G., Lubrano G. An enzyme electrode for the amperometric determination of glucose Anal. Chim. Acta 64 (1973) 439-455.
Guyton AC, Hall JE. Tratado de fisiología médica 12ª Ed. Elsevier, Barcelona (2011).
Habermüller K, Mosbach M, Schuhmann W. Electron-transfer mechanisms in amperometric biosensors. Fresenius J. Anal. Chem. 366 (2000) 560–568.
Haghighi B, Varma S, Alizadeh ShFM, Yigzaw Y, Gorton L. Prussian Blue modified glassy carbon electrodes-study on operational stability and its application as a sucrose biosensor. Talanta 64 (2004) 3–12.
Haljamae H. Lactate metabolism. Intens. Care World 4 (1987) 118–121.
230

Hamai M, Minokoshi Y, Shimazu T. L-Glutamate and insulin enhance glycogen synthesis in cultured astrocytes from the rat brain through different intracellular mechanisms. J. Neurochem. 73 (1999) 400–407.
Harik SI, Kalaria RN, Andersson L, Lundahl P, Perry G. Immunocytochemical localization of the erythroid glucose transporter: abundance in tissues with barrier functions. J. Neurosci. 10 (1990) 3862–72.
Hashimoto T, Hussien R, Cho HS, Kaufer D, Brooks GA. Evidence for the mitochondrial lactate oxidation complex in rat neurons: demonstration of an essential component of brain lactate shuttles. PLoS One 3 (2008) 1-8.
Hermanson GT, Mallia AK, Smith PK. Immobilized affinity ligand techniques. San Diego: Academic Press 1992.
Herren F, Fisher P, Ludi A, Halg W. Neutron diffraction study of Prussian Blue, Fe4[Fe(CN)6]3 ×H2O. Location of water molecules and long-range magnetic order. Inorg. Chem. 19 (1980) 956–959.
Hertz L, Fillenz M, Does the mystery of the extra glucose during CNS activation reflect glutamate synthesis? Neurochem. Int. 34 (1999) 71-75.
Hu YB, Wilson GS. A temporary local energy pool coupled to neuronal activity: fluctuations of extracellular lactate levels in rat brain monitored with rapid-response enzyme-based sensor. J. Neurochem. 69 (1997) 1484−1490.
Itaya K, Akahoshi H, Toshima S. Electrochemistry of Prussian Blue modified electrodes: an electrochemical preparation method. J. Electrochem. Soc. 129 (1982a) 1498–1500.
Itaya K, Ataka T, Toshima S, Shinohara T. Electrochemistry of Prussian Blue. An in situ Moessabauer effect measurement. J. Phys. Chem. 86 (1982c) 2415–2418.
Itaya K, Ataka T, Toshima S. Spectroelectrochemistry and electrochemical preparation method of Prussian Blue modified electrodes. J. Am. Chem. Soc. 104 (1982b) 4767–4772.
Itaya K, Shoj N, Uchida I, Catalysis of the reduction of molecular oxygen to water at Prussian Blue modified electrodes. J. Am. Chem. Soc. 106 (1984a) 3423–3429.
Itaya K, Uchida I, Neff VD. Electrochemistry of polynuclear transition metal cyanides: Prussian Blue and its analogues. Acc. Chem. Res. 19(1986) 162–168.
Itaya K, Uchida, I, Toshima, S, De la Rue RM. Photoelectrochemical studies of Prussian Blue on n-type semiconductor (N-TiO2). J. Electrochem. Soc. (1984b) 131, 2086–2092.
Jiang W, Yuan R, Chai YQ, Yin B. Amperometric immunosensor based on multiwalled carbon nanotubes/Prussian blue/nanogold-modified electrode for determination of α-fetoprotein. Anal Biochem. 407(2010) 65-71.
231

Joost HG, Bell GI, Best JD, Birnbaum MJ, Charron MJ, Chen YT, Doege H, James DE, Lodish HF, Moley KH, Moley JF, Mueckler M, Rogers S, Schurmann A, Seino S, Thorens B. Nomenclature of the GLUT/SLC2A family of sugar/polyol transport facilitators. Am J Physiol Endocrinol Metab 282(2002) 974–976.
Joost HG, Thorens B . The extended GLUT-family of sugar/polyol transport facilitators: nomenclature, sequence characteristics, and potential function of its novel members. Molecular Membrane Biology 18 (2001) 247–256.
Karyakin AA Karyakina EE. Prussian Blue-based “artificial peroxidase” as a transducer for hydrogen peroxide detection. Application to Biosensors. Sens. Actuators B 57 (1999) 268–273.
Karyakin AA, Chaplin M. Polypyrrole Prussian Blue films with controlled level of doping: codeposition of polypyrrole and Prussian Blue. J. Electroanal. Chem. 56(1994) 85–92.
Karyakin AA, Gitelmacher OV, Karyakina EE. Prussian Bluebased first-generation biosensor. A sensitive amperometric electrode for glucose. Anal. Chem. 67 (1995) 2419–2423.
Karyakin AA, Karyakina EE, Gorton L. Amperometric biosensor for glutamate using Prussian Blue-based ‘artificial peroxidase’ as a transducer for hydrogen peroxide. Anal. Chem. 72 (2000) 1720–1723.
Karyakin AA, Karyakina EE, Gorton L. Prussian-Blue based amperometric biosensors in flow-injection analysis. Talanta 43 (1996) 1597–1606.
Karyakin AA, Karyakina EE, Gorton L. The electrocatalytic activity of Prussian Blue in hydrogen peroxide reduction studied using a wall-jet cell with continuous flow. J. Electroanal. Chem. 456 (1998) 97–104.
Karyakin AA, Kotelnikova EA, Lukachova LV, Karyakina EE, Wang J. Optimal environment for glucose oxidase in perfluorosulfonated ionomer membranes: improvement of first-generation biosensors. Anal Chem. 74 (2002) 1597-1603.
Karyakin AA. Prussian Blue and its analogues: electrochemistry and analytical applications. Electroanalysis 13 (2001) 813–819.
Kasai N, Jimbo Y, Niwa O, Matsue T, Torimitsu K. Real-time multisite observation of glutamate release in rat hippocampal slices. Neurosci. Lett. 304 (2001) 112-116.
Kasai N, Jimbo Y, Torimitsu K. Electrochemical monitoring of glutamate release at multiple positions in a rat hippocampal slice. Anal. Sci. 18 (2002) 1325-1327.
Kaul S, Faiman MD, Lunte CE. Determination of GABA, glutamate, dopamine and carbamathione in brain microdialysis samples by micellar electrokinetic chromatography and laser-induced fluorescence (MEKC-LIF).Anal. Methods 3 (2011) 1514-1520.
232
Keggin JF, Miles FD. Structures and formulae of the Prussian Blues and related compounds. Nature 137 (1936) 577–578.
Khan AS, Michael AC. Invasive consequences of using micro-electrodes and microdialysis probes in the brain. Tr. Anal. Chem. 22 (2003) 503-508.
Killoran SJ, O'Neill RD. Characterization of permselective coatings electrosynthesized on Pt-Ir from the three phenylenediamine isomers for biosensor applications. Electrochim. Acta 53 (2008) 7303-7312.
Killoran SJ, Rai DK, O'Neill RD. Comparison of phenylenediamine isomers for the synthesis of permselective biosensor polymers for neurochemical analysis. J. Neurochem. 102 (2007) 196-197
Kissinger PT, Hart JB, Adams RN. Voltammetry in brain tissue: a new neurophysiological measurement. Brain Res. 55 (1973) 209-213.
Koncki R, Lenarczuk T, Radomska A, Glab S. Optical biosensors based on Prussian Blue films. Analyst 126 (2001) 1080–1085.
Koncki, R. Chemical sensors and biosensors based on Prussian Blues. Crit. Rev. Anal. Chem. 32 (2002) 79–96.
Kong T, Chen Y, Ye Y, Zhang K,Wang Z,Wang X. An amperometric glucose biosensor based on the immobilization of glucose oxidase on the ZnO nanotubes. Sens. Actuators B Chem. 138 (2009) 344–350.
Kozminski KD, Gutman DA, Davila V, Sulzer D, Ewing AG. Voltammetric and pharmacological characterization of dopamine release from single exocytotic events at rat pheochromocytoma (PC12) cells. Anal. Chem. 70 (1998) 3123–3130.
Kraft A. On the discovery and history of Prussian Blue. Bull. Hist. Chem. 33 (2008) 61-67.
Kreutz C, Lorgen J, Graewe B, Bargon J, Yoshida M, Fresco ZM, Frechet JMJ. High frequency quartz micro balances: a promising path to enhanced sensitivity of gravimetric sensors. Sensors 6 (2006) 335-340.
Kulagina NV, Shankar L, Michael AC. Monitoring glutamate and ascorbate in the extracellular space of brain tissue with electrochemical microsensors. Anal. Chem. 71 (1999) 5093-5100.
Kulys J, Laurinavicius V, Pesliakiene M, Gureviciene V. Metabolite determination in foodstuffs by enzyme analyzers. Biotechnol. Appl. Biochem. 11 (1989) 149-154.
Lammers F, Scheper T. Thermal biosensors in biotechnology. Adv. Biochem. Eng. Biotechnol. 64 (1999) 35-67.
Langer JJ, Filipiak M, Kecinska J, Jasnowska J, Wlodarczak J, Buladowski B. Polyaniline biosensor for choline determination. Surf. Sci. 573 (2004) 140–145.
233
Larrabee MG. Lactate metabolism and its effects on glucose metabolism in an excised neural tissue. J. Neurochem. 64 (1995) 1734−1741.
Lehninger AL, Nelson DL, Cox MM. Lehninger principles of biochemistry. New York: W.H. Freeman (2005).
Lemire J, Mailloux RJ, Appanna VD Mitochondrial Lactate Dehydrogenase Is Involved in Oxidative-Energy Metabolism in Human Astrocytoma Cells (CCF-STTG1). PLoS One 3 (2008) 1-10.
Leypoldt JK, Gough DA. Model of a two-substrate enzyme electrode for glucose, Anal. Chem. 56 (1984) 2896–2904.
Li G, Wang Y, Xu H. A Hydrogen Peroxide Sensor Prepared by Electropolymerization of Pyrrole Based on Screen Printed Carbon Paste Electrodes. Sensors 7 (2007) 239–250.
Li J, Peng T, Peng Y. A cholesterol biosensor based on entrapment of cholesterol oxidase in a silicic sol-gel matrix at a Prussian Blue modified elctrode. Electroanalysis 15 (2003) 1031–1037.
Li L, Qinglin Sheng Q, Zheng J, Zhang H. Facile and controllable preparation of glucose biosensor based on Prussian blue nanoparticles hybrid composites. Bioelectrochemistry 74 (2008) 170-175.
Li XG, Huang MR, Duan W. Novel multifunctional polymers from aromatic diamines by oxidative polymerizations. Chem. Rev. 102 (2002) 2925–3030.
Liu H, Yu R, Peng K, Zhao H, Li L, Wu X.A Signal-Amplified Electrochemical Immunosensor Based on Prussian Blue and Pt Hollow Nanospheres as Matrix. Electroanalysis 22 (2010) 2577 – 2586
Liu SN, Yin YJ, Cai CX. Immobilization and characterization of glucose oxidase on single-walled carbon nanotubes and its application to sensing glucose. Chin. J. Chem. 25 (2007) 439–447.
Loaiza A, Porras OH, Barros LF. Glutamate triggers rapid glucose transport stimulation in astrocytes as evidenced by realtime confocal microscopy. J. Neurosci. 23 (2003) 7337–7342.
Loaiza OA, Campuzano S, Guzmán-Vázquez de Prada A, Pedrero M, Pingarrón JM. Amperometric DNA quantification based on the use of peroxidase-mercaptopropionic acid-modified gold electrodes. Sens. Actuators B 132 (2008) 250-257
Loaiza OA, Campuzano S, Pedrero M, Pingarrón JM. DNA sensor based on an Escherichia coli lac Z gene probe immobilization at self-assembled monolayers-modified gold electrodes Talanta 73 (2007) 838-844.
Lönnroth P, Jansson PA, Smith U. A microdialysis method allowing characterization of intercellular water space in humans. Am. J. Physiol. 253 (1987) 228–231.
234

López MA, Ortega F. Domínguez E, Katakis I. Electrochemical immunosensor for the detection of atrazine. J. Mol. Recogn. 11 (1998) 178-181.
López MA, Ortega F. Inmunosensores: herramientas analíticas con un gran potencial de futuro. Schironia 1 (2002) 52-60.
López-Bayghen E, Ortega A. Células gliales y actividad sináptica: control traduccional del acople metabólico. Rev. Neurol. 50 (2010) 607-615.
López-Bayghen E, Rosas S, Castelán F, Ortega A. Cerebellar Bergmann glia: an important model to study neuron-glia interactions. Neuron Glia Biol. 3 (2007) 155-167.
Louilot A, González-Mora JL, Guadalupe T, Mas M. Sex-related olfatory stimuli induce a selective increase in dopamine release in the nucleus accumbens of male rats. a voltammetric study. Brain Res. 553(1991) 313-317.
Lowe AG, Walmsley AR. The kinetics of glucose transport in human red blood cells. Biochim. Biophys. Acta 857 (1986)146–54.
Lowry JP, Boutelle MG, O'Neill RD, Fillenz M. Characterization of carbon paste electrodes in vitro for simultaneous amperometric measurement of changes in oxygen and ascorbic acid concentrations in vivo. Analyst 121 (1996) 761-766.
Lowry JP, Demestre M, Fillenz M. Relation between cerebral blood flow and extracellular glucose in rat striatum during mild hypoxia and hyperoxia. Dev. Neurosci. 20 (1998) 52-58.
Ludi A, Gudel HU. Structural chemistry of polynuclear transition metal cyanides. Struct. Bond. 14 (1973) 1–22.
Lukachova LV, Kotel’nikova EA, D’Ottavi D, Shkerin EA, Karyakina EE, Moscone D, Palleschi G, Curulli A, Karyakin AA. Electrosynthesis of poly-o-diaminobenzene on the Prussian Blue modified electrodes for improvement of hydrogen peroxide transducer characteristics. Bioelectrochemistry 55 (2002) 145–148.
Lukachova LV, Kotel’nikova EA, D’Ottavi D, Shkerin EA, Karyakina EE, Moscone D, Palleschi G, Curulli A, Karyakin AA. Nonconducting polymers on Prussian Blue modified electrodes: improvement of selectivity and stability of the advanced H2O2 transducer. IEE Sens. J. 3 (2003) 326–332.
Luo P, Liu Y, Xie GM, Xiong XL, Deng SX, Song FZ. Determination of serum alcohol using a disposable biosensor. Forensic. Sci. Int. 179 (2008) 192–198.
Magistretti PJ, Pellerin L, Rothman DL, Shulman RG. Energy on demand. Science 283 (1999b) 496–497.
Magistretti PJ, Pellerin L. Cellular bases of brain energy metabolism and their relevance to functional brain imaging: evidence for a prominent role of astrocytes. Cereb. Cortex 6 (1996) 50–61.
235

Magistretti PJ, Pellerin L. Cellular mechanisms of brain energy metabolism and their relevance to functional brain imaging. Philos. Trans. R. Soc. Lond. B Biol. Sci. 354 (1999a) 1155–1163.
Magner E. Trends in electrochemical biosensors. Analyst 123 (1998) 1967–1970.
Maher F, Davies-Hill TM, Simpson IA. Substrate specificity and kinetic parameters of GLUT3 in rat cerebellar granule neurons. Biochem J 315 (1996) 827–31.
Maher F, Simpson IA. The GLUT3 glucose transporter is the predominant isoform in primary cultured neurons: assessment by biosynthetic and photoaffinity labelling. Biochem. J. 301(1994) 379–384.
Maher F, Vannucci SJ, Simpson IA. Glucose transporter isoforms in brain: absence of GLUT3 from the blood-brain barrier. J Cereb Blood Flow Metab 13(1993)342–345.
Malinski T, Taha Z. Nitric oxide release from a single cell measured in situ by a porphyrinic-based microsensor. Nature 358 (1992) 676-678.
Manclús JJ, Abad A, Lebedev MY, Mojarrad F, Micková B, Mercader JV, Primo J, Miranda MA, Montoya A. Development of a monoclonal immunoassay selective for chlorinated cyclodiene insecticides. J. Agric. Food Chem. 52 (2004) 2776-2784.
Mansouri S, Schultz JS. A miniature optical glucose sensor based on affinity binding. Biotechnology 2 (1984) 885–890.
Mao F, Mano N, Heller A. Long tethers binding redox centers to polymer backbones enhances electron transport in enzyme “wiring” hydrogels. J. Am. Chem. Soc. 125 (2003) 4951-4957.
Marcus RA, Sutin N. Electron transfers in chemistry and biology Biochim. Biophys. Acta 811 (1985)265–322.
Marcus RA. Electron Transfer Reactions in Chemistry: Theory and Experiment (Nobel Lecture). Angew. Chem. Int. Ed. English 32 (1993) 1111–1121.
Martínez-Paredes G, González-García MB, Costa-García A. Genosensor for detection of four pneumoniae bacteria using gold nanostructured screen-printed carbon electrodes as transducers. Sens. Actuators B 149 (2010) 329-335.
Marvin JS, Hellinga HW. Engineering biosensors by introducing fluorescent allosteric signal transducers: construction of a novel glucose sensor. J. Am. Chem. Soc. 120 (1998) 7–11.
Mas M, Fumero B, González-Mora JL. Voltammetric and microdialysis monitoring of brain monoamine neurotransmitter release during sociosexual interactions. Behav. Brain Res. 71 (1995b) 69-79.
236

Mas M, Fumero B, O'Neil RD, González-Mora JL. Fixed versus removable microdialysis cannulae for in vivo neurochemical analysis: implications for behavioral studies. J. Neurochem. 64 (1995a) 1899-1900.
Mas M, González-Mora JL, Louilot A, Solé C, Guadalupe T. Increased dopamine release in the nucleus accumbens of copulating male rats as evidenced by in vivo voltammetry. Neurosci. Lett.110 (1990) 303-308.
Mas M, González-Mora JL, Sanchez-Bruno A. Numerical methods for the analysis of in vivo voltammetry signals. J. Neurosci. Meth. 29 (1989) 303.
Mason MJ. Determination of glucose, sucrose, lactose, and ethanol in foods and beverages, using immobilized enzyme electrodes. Assoc. Anal. Chem. 66 (1988) 981-984.
Mateo C, Palomo JM, Fernandez-Lorente G, Guisan JM, Fernandez-Lafuente R. Improvement of enzyme activity, stability and selectivity via immobilization techniques. Enzyme Microb. Technol. 40 (2007) 1451–63.
Mathebe NGR, Morrin A, Iwuoha EI. Electrochemistry and scanning electron microscopy of polyaniline/peroxidase-based biosensor. Talanta 64 (2004) 115–120.
Mathews CK, van Holde KE, Ahern KG. Biochemistry (3 ed.) Prentice Hall (1999).
Mazeikiene R, Malinauskas A. The stability of poly(o-phenylenediamine) as an electrode material. Synth. Met. 128 (2002) 121–125.
McKenna M.C., Gruetter R., Sonnewald U., Waagepetersen H.S., Schousboe A. Energy Metabolism of the Brain (en) Basic Neurochemistry: Molecular, cellular and medical aspects, 7ª ed., Elsevier Academic Press. (2006) 531-557.
McMahon C P, Rocchitta G, Kirwan S M, Killoran SJ, Serra PA, Lowry JP, O'Neill RD. Oxygen tolerance of an implantable polymer/enzyme composite glutamate biosensor displaying polycation-enhanced substrate sensitivity. Biosens. Bioelectron. 22 (2007) 466-1473.
McMahon CP, Killoran SJ, O'Neill RD. Design variations of a polymer-enzyme composite biosensor for glucose: Enhanced analyte sensitivity without increased oxygen dependence. J. Electroanal. Chem. 580 (2005) 193-202.
McMahon CP, O'Neill RD. Polymer-enzyme composite biosensor with high glutamate sensitivity and low oxygen dependence. Anal. Chem. 77 (2005)1196-1199.
McMahon CP, Rocchitta G, Serra PA, Kirwan SM, Lowry JP, O'Neill RD. Control of the oxygen dependence of an implantable polymer/enzyme composite biosensor for glutamate. Anal. Chem. 78 (2006) 2352-2359.
237
McNay EC, McCarty RC, Gold PE. Fluctuations in brain glucose concentration during behavioral testing: dissociations between brain areas and between brain and blood, Neurobiol. Learn. Mem. 75 (2001) 325–337.
Medina, J. M. The role of lactate as an energy substrate for the brain during the early neonatal period. Biol. Neonate 48 (1985) 237–244.
Mehrvar M, Abdi M. Recent developments, characteristics, and potential applications of electrochemical biosensors. Anal. Sci. 20 (2004) 1113–1126.
Minteer SD. Enzyme stabilization and immobilization: methods and protocols. Methods in molecular biology. Humana Press 2011.
Mitala M. Improving the performance of electrochemical microsensors based on enzymes entrapped in a redox hydrogel. Anal.Chim. Acta 556 (2006) 326–332.
Mortimer RJ, Rosseinsky DR. Electrochemical polychromicity in iron hexacyanoferrate films, and a new film form of ferric ferricyanide. J. Electroanal. Chem. 151 (1983) 133–147.
Mortimer RJ, Rosseinsky DR. Iron hexacyanoferrate films: spectroelectrochemical distinction and electrodeposition sequence of “soluble” (K+-containing) and “insoluble” (K+-free) Prussian Blue, and composition changes in polyelectrochromic switching. J. Chem. Soc. Dalton Trans. (1984) 2059–2062.
Moscone D, D’Ottavi D, Compagnon, D, Palleschi G, Amine A. Construction and analytical characterization of Prussian Blue based carbon paste electrodes and their assembly as oxidase enzyme sensors. Anal. Chem. 73 (2001) 2529–2535.
Moscone D, Mascini M. Microdialysis and glucose biosensor for in vivo monitoring.Ann. Biol. Clin. 50 (1992) 323-327.
Moussy F, Harrison DJ, O’Brien DW, Rajotte RV. Performance of subcutaneously implanted needle-type glucose sensors employing a novel trilayer coating. Anal. Chem. 65 (1993) 2072-2077.
Murr R, Berger S, Schürer L, Peter K, Baethmann A. A novel, remote-controlled suspension device for brain tissue pO2 measurements with multiwire surface electrodes. Pflugers Arch. 426 (1994) 348-350.
Nagamatsu S, Sawa H, Kamada K, Nakamichi Y, Yoshimoto K, Hoshino T Neuron-specific glucose transporter (NSGT): CNS distribution of GLUT3 rat glucose transporter (RGT3) in rat central neurons. FEBS Lett. 334 (1993) 289–295.
Nair PK, Buerk DG, Halsey JH. Comparisons of oxygen metabolism and tissue pO2 in cortex and hippocampus of gerbil brain. Stroke 18 (1987) 616-622
238

Neff VD. Electrochemical oxidation and reduction of thin films of Prussian Blue. J. Electrochem. Soc. 125 (1978) 886–887.
Nehlig A. Brain uptake and metabolism of ketone bodies in animal models. Prostaglandins Leukot. Essent. Fatty Acids 70 (2004) 265–275.
Odaci D, Telefoncu A, Timur S. Pyranose oxidase biosensor based on carbon nanotube (CNT)-modified carbon paste electrodes. Sens. Actuators B 132 (2008) 159–165.
Oh BK, Robbines ME, Nablo BJ, Schoenfisch MH. Miniaturized glucose biosensor modified with a nitric oxide-releasing xerogel microarray. Biosen. Bioelectron. 21 (2005) 749-757.
Ohzuku T, Sawai K, Hurai T. On a homogeneous electrochemical reaction of Prussian Blue/Everitt’s salt system. J. Electrochem. Soc. 132 (1985) 2828–2834.
Oldenziel WH, Dijkstra G, Cremers TIFH, Westerink BHC. In vivo monitoring of extracellular glutamate in the brain with a microsensor. Brain Res. 118 (2006) 34-42.
Oldenziel WH, Zeyden van der M, Dijkstra G, Ghijsen WEJM, Karst H, Cremers TIFH, Westerink BHC. Monitoring extracellular glutamate in hippocampal slices with a microsensor. J. Neurosci. Meth. 160 (2007) 37–44.
O'Neill RD, Fillenz M, Albery WJ, Goddard NJ.The monitoring of ascorbate and monoamine transmitter metabolites in the striatum of unanaesthetised rats using microprocessor-based voltammetry. Neuroscience 9 (1983) 87-93.
O'Neill RD, Fillenz M. Detection of homovanillic acid in vivo using microcomputer-controlled voltammetry: simultaneous monitoring of rat motor activity and striatal dopamine release. Neuroscience. 14 (1985) 753-63.
O'Neill RD, González-Mora JL, Boutelle MG, Ormonde DE, Lowry JP, Duff A, Fumero B, Fillenz M, Mas M. Anomalously high concentrations of brain extracellular uric acid detected with chronically implanted probes: implications for in vivo sampling techniques. J. Neurochem. 57 (1991) 22–29.
O'Neill RD, Grunewald RA, Fillenz M, Albery WJ. Linear sweep voltammetry with carbon paste electrodes in the rat striatum. Neuroscience 7 (1982) 1945-1954.
O'Neill RD, Lowry JP, Mas M. Monitoring brain chemistry in vivo: voltammetric techniques, sensors and behavioral applications. Crit. Rev. Neurobiol. 12 (1998) 69-127.
O'Neill RD, Lowry JP, Rocchitta G, McMahon CP, Serra PA, Designing sensitive and selective polymer/enzyme composite biosensors for brain monitoring in vivo, Trends Anal. Chem. 27 (2008) 78–88.
239

O'Neill RD. Uric acid levels and dopamine transmission in rat striatum: diurnal changes and effects of drugs. Brain Res. 507 (1990) 267-272.
Ortiz M, Torréns M, Alakulppi N, Strömbom L, Fragoso A, O'Sullivan CK. Amperometric supramolecular genosensor self-assembled on cyclodextrin-modified surfaces Electrochem. Commun. 13 (2011) 578-581.
Palmisano F, Zambonin PG, Centonze D. Amperometric biosensors based on electrosynthesised polymeric films. Fres. J. Anal. Chem. 366 (2000) 586-601.
Paxinos G, Watson C, The Rat Brain in Stereotaxic Coordinates, Academic Press, Sydney 1986.
Pei J, Tian F, Thundat T. Glucose biosensor based on the microcantilever. Anal. Chem. 76 (2004) 292–297.
Pellerin L, Magistretti PJ. Sweet sixteen for ANLS. J Cereb Blood Flow Metab. (2011) doi:10.1038/jcbfm.2011.149
Pellerin L, Magistretti PJ. Glutamate uptake into astrocytes stimulates aerobic glycolysis: a mechanism coupling neuronal activity to glucose utilization. Proc. Nat. Acad. Sci. USA 91 (1994) 10625−10629.
Pellerin L, Magistretti PJ. Glutamate uptake stimulates Na+/K+-ATPase activity in astrocytes via activation of a distinct subunit highly sensitive to ouabain. J. Neurochem. 69(1997) 2132–2137.
Pellerin L, Pellegri G, Bittar PG, Charnay Y, Bouras C, Martin JL, Stella N, Magistretti PJ. Evidence supporting the existence of an activity-dependent astrocyte-neuron lactate shuttle. Dev. Neurosci. 20 (1998) 291–299.
Pellerin L. How Astrocytes Feed Hungry Neurons. Molecular Neurobiology 32 (2005) 59-72.
Pellerin L. Lactate as a pivotal element in neuron-glia metabolic cooperation. Neurochem. Int. 43 (2003) 331-338.
Pérez Escoda MT. Diseño y síntesis de péptidos para el diagnóstico de la infección por virus de la hepatitis G (GBV-C/HGV). Universidad de Barcelona, Facultad de Farmacia, tesis doctoral (2007).
Pickup JC, Hussain F, Evans ND, Rolinski OJ, Birch D. Fluorescence-based glucose sensors. Biosens. Bioelectron. 20 (2005) 2555–2565.
Pohanka M, Pavlis O, Skladal P. Diagnosis of tularemia using piezoelectric biosensor technology. Talanta 71 (2007) 981-985.
Pohanka M, Skladal P. Piezoelectric immunosensor for Francisella tularensis detection using immunoglobulin M in a limiting dilution. Anal. Lett. 2005, 38, 411-422.
Poitry-Yamate CL, Poitry S, Tsacopoulos M. Lactate released by Muller glial cells is metabolized by photoreceptors from mammalian retina. J. Neurosci. 15 (1995) 5179−5191.
240

Ponchon JL, Cespuglio R, Gonon F, Jouvet M, Pujol JF. Normal pulse polarography with carbon fiber electrodes for in vitro and in vivo determination of catecholamines. Anal. Chem. 51 (1979) 1483-1486.
Porras OH, Loaiza A, Barros LF. Glutamate mediates acute glucose transport inhibition in hippocampal neurons. J. Neurosci. 24 (2004) 9669–9673.
Pothos EN, Larsen KE, Krantz DE, Liu Y, Haycock JW, Setlik W, Gershon MD, Edwards RH, Sulzer D. Synaptic vesicle transporter expression regulates vesicle phenotype and quantal size. J Neurosci 20 (2000) 7297–7306.
Prodromidis MI, Karayannis MI. Enzyme Based Amperometric Biosensors for Food Analysis. Electroanal. 14 (2002) 241-261.
Puig-Lleixa C, Jimenez C, Bartroli J. Acrylated polyurethane Ð photopolymeric membrane for amperometric glucose biosensor construction. Sens. Actuators B 72 (2001) 56–62.
Qian JM, Suo AL, Yao Y, Jina ZH. Polyelectrolyte-stabilized glucose biosensor based on woodceramics as electrodeClin. Biochem. 37 (2004) 155–161.
Quinn CA, Connor RE, Heller A. Biocompatible, glucose-permeable hydrogel for in situ coating of implantable biosensors. Biomaterials 18 (1997) 1665-1670.
Rajan KP, Neff VD. Electrochromism in the mixed valence hexacyanides. 2. Kinetics of the reduction of Ruthenium Purple and Prussian Blue. J. Phys. Chem. 86 (1982) 4361–4368.
Ramanathan K, Rank M, Svitel J, Dzgoev A, Danielsson B. The development and applications of thermal biosensors for bioprocess monitoring. Trends Biotechnol. 17 (1999) 499-505.
Ramírez BG, Rodrigues T B, Violante I R, Cruz F, Fonseca L L, Ballesteros P, Castro MM, García-Martín ML, Cerdán S. Kinetic properties of the redox switch/redox coupling mechanism as determined in primary cultures of cortical neurons and astrocytes from rat brain. J. Neurosci. Res. 85 (2007) 3244–3253.
Ramos M, del Arco A, Pardo B, Martínez-Serrano AM, Martínez-Morales JR, Kobayashi K, Yasuda T, Bogónez E, Bovolenta P, Saheki T, Satrústegui J. Developmental changes in the Ca2+-regulated mitochondrial aspartate-glutamate carrier aralar1 in brain and prominent expression in the spinal cord. Dev. Brain Res. 143(2003) 33–46.
Ramsay G. Commercial Biosensors: Applications to clinical, bioprocess, and environmental samples. (Ed. Ramsay G.) New York: John Willey& Sons, 1998.
Rayner DV, Thomas ME, Trayhurn P. Glucose transporters (GLUTs 1–4) and their mRNAs in regions of the rat brain: insulin-sensitive transporter expression in the cerebellum. Canadian Journal of Physiology and Pharmacology 72 (1994) 476–479.
241

Reichert WM, Sharkawy AA. Handbook of Biomaterials Evaluation: Scientific, Technical, and Clinical Testing of Implant Materials vol. 28. Taylor and Francis, Philadelphia, (1999) 439–460.
Ricci F, Amine A, Palleschi G, Moscone D. Prussian Blue based screen printed biosensors with improved characteristics of long-term lifetime and pH stability. Biosens. Bioelectron. 18 (2003a) 165–174.
Ricci F, Amine A, Tuta CS, Ciucu AA, Lucarelli F, Palleschi G, Moscone D. Prussian Blue and enzyme bulk modified screen printed electrodes for hydrogen peroxide and glucose determination with improved storage and operational stability. Anal. Chim. Acta 485 (2003b) 111–120.
Ricci F, Caprio F, Poscia A, Valgimigli F, Messeri D, Lepori E, Dall'Oglio G, Palleschi G, Moscone D. Toward continuous glucose monitoring with planar modified biosensors and microdialysis. Study of temperature, oxygen dependence and in vivo experiment. Biosens Bioelectron. 22 (2007) 2032-2039.
Ricci F, Goncalves C, Amine A, Gorton L, Palleschi G, Moscone D. Electroanalytical study of Prussian Blue modified glassy carbon paste electrodes. Electroanalysis 15 (14) (2003c) 1204–1211.
Ricci F, Palleschi G. Sensor and biosensor preparation, optimisation and applications of Prussian Blue modified electrodes. Biosen. Bioelectron. 21 (2005) 389–407.
Roach PC, Ramsden DK, Hughes J, Williams P. Development of a conductimetric biosensor using immobilised Rhodococcus ruber whole cells for the detection and quantification of acrylonitrile. Biosens Bioelectron. 19 (2003) 73-78.
Robin, MB, Day P. Mixed valence chemistry—a survey and classification. (en) Emelus HJ, Sharpe AG (Eds.): Advances in Inorganic Chemistry and Radiochemistry Academic Press, New York 10 (1967) 247–422.
Robinson DL, Venton B J, Heien MLAV, Wightman RM. Detecting subsecond dopamine release with fast-scan cyclic voltammetry in vivo." Clin. Chem. 49 (2003) 1763-1773.
Rodrigues TB, López-Larrubia P, Cerdán S. Redox dependence and compartmentation of [13C] pyruvate in the brain of deuterated rats bearing implanted C6 gliomas J. Neurochem. 109 (2009) 237–245.
Rothwell S.A. and O'Neill R.D. Effects of applied potential on the mass of non-conducting poly(ortho-phenylenediamine) electro-deposited on EQCM electrodes: comparison with biosensor selectivity parameters. Phys. Chem. Chem. Phy. 13 (2011) 5413-5421.
242
Rothwell SA, Killoran SJ, Neville EM, Crotty AM, O'Neill RD. Poly(o-phenylenediamine) electrosynthesized in the absence of added background electrolyte provides a new permselectivity benchmark for biosensor applications. Electrochem.Commun. 10 (2008) 1078-1081.
Rothwell SA, Kinsella ME, Zain ZM, Serra PA, Rocchitta G, Lowry JP, O'Neill RD. Contributions by a novel edge effect to the permselectivity of an electrosynthesized polymer for microbiosensor applications. Anal. Chem. 81 (2009) 3911-3918.
Rothwell SA, McMahon CP, O'Neill RD. Effects of polymerization potential on the permselectivity of poly(o-phenylenediamine) coatings deposited on Pt-Ir electrodes for biosensor applications. Electrochim. Acta 55 (2010) 1051-1060.
Rubianes MD, Rivas GA. Carbon nanotubes paste electrodes. Electrochem. Commun. 5 (2003) 689–694.
Russell RJ, Pischko MV, Gefrides GC, McShane MJ, Coté GL. A fluorescence-based glucose biosensor using concanavalin A and dextran encapsulated in a poly(ethylene glycol) hydrogel. Anal. Chem. 71 (1999) 3126–3132.
Ruzgas T, Csöregi E, Emneus J, Gorton L, Marko-Varga G. Peroxidase-modified electrodes: Fundamentals and application. Anal. Chim. Acta 330 (1996) 123-138.
Ryabov AD, Amon A, Gorbatova RK, Ryabova ES, Gnedenko BB. Mechanism of a “jumping off” ferricenium in glucose oxidase-d-glucose-ferrocene micellar electrochemical systems. J.Phys. Chem. 99 (1995) 14072–14077.
Ryabova ES, Goral VN, Csöregi E, Matthiasson B, Ryabov AD. Coordinative approach to mediate electron transfer: ruthenium complexed to native glucose oxidase. Angew. Chem. Int. Ed. Engl. 38 (1999) 38 804-807.
Sassolas A, Blum LJ, Leca-Bouvier BD. Immobilization strategies to develop enzymatic biosensors. Biotechnol. Adv. 30 (2012) 489–511
Schuhmann W, Wohlschläger H, Lammert R, Schmidt HL, Löffler U, Wiemhöfer AD, Göpel W. Pyrrole, a new possibility for covalent binding of oxidoreductases to electrode surfaces as a base for stable biosensors. Sens. Actuators B 1 (1990) 537-541.
Schurr A, Miller JJ, Payne RS, Rigor BM. An increase in lactate output by brain tissue serves to meet the energy needs of glutamate-activated neurons. J. Neurosci. 19 (1999) 34−39.
Schurr A, Payne RS, Miller JJ, Rigor BM. Brain lactate, not glucose, fuels the recovery of synaptic function from hypoxia upon reoxygenation: an in vitro study. Brain Res. 744 (1997a) 105–111.
243

Schurr A, Payne RS. Lactate, not pyruvate, is neuronal aerobic glycolysis end product: an in vitro electrophysiological study. Neuroscience 147 (2007) 613–619.
Schurr A, Payne, RS, Miller JJ, Rigor BM,. Glia are the main source of lactate utilized by neurons for recovery of function post-hypoxia. Brain Res. 774 (1997b) 221–224.
Schurr A. Lactate: the ultimate cerebral oxidative energy substrate? J Cereb. Blood Flow Metab. 26(2006) 142–152.
Senthil Kumar SM, K. Chandrasekara Pillai K. Cetyltrimethyl ammonium bromide surfactant-assisted morphological and electrochemical changes in electrochemically prepared nanoclustered iron(III) hexacyanoferrate J. Electroanal. Chem. 589 (2006b) 167-175.
Senthil Kumar SM, K. Chandrasekara Pillai K. Compositional changes in unusually stabilized Prussian blue by CTAB surfactant: Application to electrocatalytic reduction of H2O2. Electrochem. Commun. 8 (2006a) 621-626.
Serrá MR, Díaz J, de Sande ML. Fisioterapia en neurología, sistema respiratorio y aparato cardiovascular. Elsevier, Barcelona (2005).
Shao Z, Li Y, Yang Q, Wang J, Li G. A novel electrochemical method to detect cell surface carbohydrates and target cells. Anal. Bioana.l Chem. 398 7-8 (2010) 2963–2967.
Sharp T, Maidment NT, Brazell M, Zetterstrom T, Bennett GW, Ungerstedt U, Mardsden CA. Parallel changes in voltammetric oxidation peaks and extracellular monoamine metabolites in rat striatum in vivo. Neurosci. Lett. Suppl. 14 (1983) 340.
Shin JH, Marxer HSM, Schoenfisch MH. Nitric oxide-releasing sol-gel particle/polyurethane glucose biosensor. Anal. Chem. 76 (2004) 4543-4549.
Shram NF, Netchiporouk LI, Martelet C, Jaffrezic–Renault N, Bonnet C, Cespuglio R. In vivo voltammetric detection of rat brain l-lactate with carbon fiber microelectrodes coated with l-lactate oxidase. Anal. Chem. 70 (1998) 2618–2622.
Siesjo BK. Utilisation of substrates by brain tissues. (en) Brain energy metabolism. New York: Wiley (1978) 101−130.
Simpson IA, Carruthers A, Vannucci SJ. Supply and demand in cerebral energy metabolism: the role of nutrient transporters. J. Cerebr. Blood F. Met. 27 (2007) 1766–1791.
Skladal P. Piezoelectric quartz crystal sensors applied for bioanalytical assays and characterization of affinity interactions. J. Braz. Chem. Soc. 14 (2003) 491-502.
244
Sokoloff L, Reivich M, Kennedy C, Des Rosiers MH, Patlak CS, Pettigrew KD, Sakurada O, Shinohara M. The [14C]deoxyglucose method for the measurement of local cerebral glucose utilization: theory, procedure, and normal values in the conscious and anesthetized albino rat. J. Neurochem. 28 (1977) 897–916.
Sokoloff L. Metabolism of the central nervous system in vivo. (en) Handbook of Physiology. Section 1 Neurophysiology. Williams and Wilkins, Washington DC. vol. 3 (1960) 1843–1864.
Steinkuhl R, Sundermeier C, Hinkers H, Dumschat C, Cammann K, Knoll M. Microdialysis system for continuous glucose monitoring. Sens. Actuators B 33 (1996) 19-24.
Stilwell D, Park, KH, Miles MH. Electrochemical studies of the factors influencing the cycle stability of Prussian Blue films. J. Appl. Electrochem. 22 (1992) 325–331.
Stuber GD, Roitman MF, Phillips PE, Carelli RM, Wightman RM. Rapid dopamine signaling in the nucleus accumbens during contingent and noncontingent cocaine administration. Neuropsychopharmacol. 30 (2005b) 853–863.
Stuber GD, Wightman RM, Carelli RM. Extinction of cocaine self-administration reveals functionally and temporally distinct dopaminergic signals in the nucleus accumbens. Neuron. 46 (2005a) 661–669.
Tabernero A, Vicario C, Medina JM. Lactate spares glucose as a metabolic fuel in neurons and astrocytes from primary culture. Neurosci. Res. 26 (1996) 369–376.
Takahashi S, Driscoll BF, Law MJ, Sokoloff L. Role of sodium and potassium ions in regulation of glucose metabolism in cultured astroglia. Proc. Natl. Acad. Sci. U.S.A. 92 (1995) 4616–4620.
Thévenot DR, Toth K, Durst RA, Wilson GS. Electrochemical Biosensors: Recommended Definitions and Classification. Biosens. Bioelectron. 16 (2001) 121–131.
Thévenot DR, Toth K, Durst RA, Wilson GS. Electrochemical Biosensors: Recommended Definitions and Classification. Pure Appl. Chem. 71 (1999) 2333-2348.
Tseng TF, Yang YL, Chuang MC, Lou SL, Galik M, Flechsig GU, Wang J. Thermally Stable Improved First-Generation Glucose Biosensors based on Nafion/Glucose-Oxidase Modified Heated Electrodes. Electrochem commun. 11 (2009)1819-1822.
Ungerstedt U, Pycock C. Functional correlates of dopamine neurotransmission. Bull. Schweiz Akad. Med. Wis., 30 (1974) 44-55.
Ungerstedt U. Microdialysis: principles and applications for studies in animals and man. J. Int. Med. 230 (1991) 365-373.
245

Updike SJ and Hicks GP. The enzyme electrode. Nature 214 (1967) 986-988.
Vannucci S J, Simpson I A. Developmental switch in brain nutrient transporter expression in the rat. Am. J. Physiol. Endocrinol. Metab. 285(2003) E1127–E1134.
Vannucci SJ, Clark RR, Koehler-Stec E, Li K, Smith CB, Davies P, Maher F, Simpson IA Glucose transporter expression in brain: relationship to cerebral glucose utilization. Dev Neurosci 20 (1998) 369 –379.
Vannucci SJ, Maher F, Simpson IA Glucose transporter proteins in brain: delivery of glucose to neurons and glia. Glia 21 (1997) 2–21.
Vidal JC, Espuelas J, García-Ruiz E, Castillo JR. Amperometric cholesterol biosensors based on the elctropolymerisation of pyrrole and the electrocatalytic effect of Prussian-Blue layers helped with self-assembled monolayers. Biosens. Bioelectron. 64 (2004) 655–664.
Vittal R, Gomathi H, Kim KJ. Beneficial role of surfactants in electrochemistry and in the modification of electrodes Adv. Colloid. Interfac. 119 (2006) 55.
Vittal R, Gomathi H, Prabhakara Rao G. Influence of a cationic surfactant on the modification of electrodes with nickel hexacyanoferrate surface films. Electrochim. Acta 45 (2000) 2083.
Vittal R, Gomathi H, Prabhakara Rao H. Derivatised nickel and cobalt oxide modified electrodes: effect of surfactant. J. Electroanal. Chem. 497 (2001) 47-54.
Vittal R, Jayalakshm M, Gomathi H, Prabhakara Rao G. J. Surfactant promoted enhancement in electrochemical and electrochromic properties of films of Prussian Blue and its analogs. Electrochem. Soc. 146 (1999) 786-793.
Vittal R, Kim KJ, Gomathi H, Yegnaraman V. CTAB-promoted Prussian Blue-modified electrode and its cation transport characteristics for K+, Na+, Li+, and NH4+ ions. J. Phys. Chem. B 112 (2008) 1149-1156.
Wang G, Zhang G, Huang H, Wang L. Graphene-Prussian blue/gold nanoparticles based electrochemical immunoassay of carcinoembryonic antigen. Anal. Methods 3 (2011), 2082-2087
Wang J, Chen L, Chatrathi MP. Evaluation of different fluorocarbon oils for their internal oxygen supply in glucose microsensors operated under oxygen-deficit conditions Anal. Chim. Acta 411 (2000a) 187–192.
Wang J, Chen L, Hocevar SB, Ogorevc B. One-step electropolymeric co-immobilization of glucose oxidase and heparin for amperometric biosensing of glucose. Analyst 125 (2000b) 125, 1431-1434.
Wang J, Li S, Moa JW, Porter J, Musameh MM, Dasgupta PK. Oxygen-independent poly(dimethylsiloxane)-based carbon-paste glucose biosensors .Biosens. Bioelectron. 17 (2002) 999–1003.
246
Wang J, Lu F. Oxygen-Rich Oxidase Enzyme Electrodes for Operation in Oxygen-Free Solutions. J. Am. Chem. Soc. 120 (1998) 1048–1050.
Wang J, Mo JW, Li S, Porter J. Comparison of oxygen-rich and mediator-based glucose-oxidase carbon-paste electrodes. Anal. Chim. Acta 441 (2001) 183–189.
Wang J, Wang L, Di J, Tu Y. Electrodeposition of gold nanoparticles on indium/tin oxide electrode for fabrication of a disposable hydrogen peroxide biosensor. Talanta 77 (2009) 1454–1459.
Wang J. Analytical Electrochemistry (2 ed.) John Wiley & Sons (2000c).
Wang J. Electrochemical Glucose Biosensors Chem. Rev. 108 (2008) 814-825.
Wang J. Glucose biosensors: 40 years of advances and challenges. Electroanal. 13 (2001) 983–988.
Wang Y, Chen Q, Zeng X. Potentiometric biosensor for studying hydroquinone cytotoxicity in vitro. Biosens. Bioelectron. 25 (2010) 1356-1362.
Wightman RM, May LJ, Michael AC.Detection of dopamine dynamics in the brain. Anal. Chem. 60 (1988) 769A–779A.
Williams DF. A model for biocompatibility and its evaluation. J. Biomed. Eng. 11 (1989) 185–191.
Wilson GS, Gifford R. Biosensors for real-time in vivo measurements. Biosens. Bioelectron. 20 (2005) 2388–2403.
Wilson MS. Electrochemical immunosensors for the simultaneous detection of two tumor markers. Anal. Chem. 77 (2005) 1496–1502.
Wood IS, Trayhurn P, Glucose transporters (GLUT and SGLT): expanded families of sugar transport proteins. British Journal of Nutrition 89 (2003) 3–9.
Wu H, Olier R, Jaffrezic-Renault N, Clechet P, Nyamsi A, Martelet C. Covalent immobilization of glucose ocidase onto graphitic electrodes. Electrochimica Acta 39 (1994) 327–331.
Xi F, Gao J, Wang J, Wang Z. Discrimination and detection of bacteria with alabel-freeimpedimetric biosensor based on self-assembled lectin monolayer. J. Electroanal. Chem. 656 (2001) 252-257.
Xiao Y, Patolsky F, Katz E, Hainfeld JF, Willner I. “Plugging into enzymes”: Nanowiring of redox enzymes by a gold nanoparticle. Science 299 (2003) 1877-1881.
Xu L, Zhu Y, Tang L, Yang X, Li C. Dendrimer-encapsulated Pt nanoparticles /polyaniline nanofibers for glucose detection. J. Appl. Polym. Sci. 109 (2008) 1802–1807.
247

Xue Y, Ding L, Lei J, Ju H. A simple electrochemical lectin-probe for in situ homogeneous cytosensing and facile evaluation of cell surface glycan. Biosens. Bioelectron. 26 (2010) 169–174.
Yano J. Electrochemical and structural studies on soluble and conducting polymer from o-phenylenediamine. J. Polym Sci. 33 (1995) 2435–2441.
Yáñez-Sedeño P, Pingarrón JM. Microelectrodos: nuevas posibilidades de la Electroquímica analítica. An. R. Soc. Esp. Quím. 4 (2001) 19-28.
Yao T, Yano T. On-line microdialysis assay of l-lactate and pyruvate in vitro and in vivo by a flow-injection system with a dual enzyme electrode. Talanta 63 (2004) 771-775.
Yonemori Y, Takahashi E, Ren H, Hayashi T, Endo H. Biosensor system for continuous glucose monitoring in fish. Anal. Chim. Acta. 633 (2009) 90–96.
Yu J S, Liao H X, Gerdon A E, Huffman B, Scearce RM, McAdams M, Alam SM, Popernack PM, Sullivan NJ, Wright D, Cliffel DE, Nabel GJ, Haynes BF. Detection of Ebola virus envelope using monoclonal and polyclonal antibodies in ELISA, surface plasmon resonance and a quartz crystal microbalance immunosensor. J. Virol. Methods 137 (2006) 219-228.
Zauner A, Bullock R, Di X, Young HF. Brain oxygen, CO2, pH, and temperature monitoring: evaluation in the feline brain. Neurosurgery 37 (1995) 1168-1176.
Zhang J, Luo A, Liu P, Wei S, Wang G, Wei S. Detection of organophosphorus pesticides using potentiometric enzymatic membrane biosensor based on methylcellulose immobilization. Anal. Sci. 25 (2009a) 511-515.
Zhang M, Liu K, Xiang L, Lin Y, Su L, Mao L. Carbon nanotube-modified carbon fiber microelectrodes for in vivo voltammetric measurement of ascorbic acid in rat brain. Anal. Chem. 79 (2007) 6559-6565.
Zhang Z, Xia S, Leonard D, Jaffrezic-Renault N, Zhang J, Bessueille F, Goepfert Y, Wang X, Chen L, Zhu Z, Zhao J, Almeida MG, Silveira CM. A novel nitrite biosensor based on conductometric electrode modified with cytochrome c reductase composite membrane. Biosens. Bioelectron. 24 (2009b) 1574–1579.
Zhou F, Zhu X, Castellani RJ, Stimmelmayr R, Perry G, Smith MA, Drew KL. Hibernation, a model of neuroprotection. Am. J. Pathol. 158 (2001) 2145-2151.
248