fabric defect segmentation using multichannel blob detectorscsajaykr/myhome/file/optical... ·...
TRANSCRIPT
Fabric defect segmentation using multichannelblob detectors
Ajay KumarIndustrial Automation Research
LaboratoryDepartment of Electrical and Electronic
EngineeringThe University of Hong KongPokfulam RoadHong KongE-mail: [email protected]
Grantham PangIndustrial Automation Research
LaboratoryDepartment of Electrical and Electronic
EngineeringThe University of Hong KongPokfulam RoadHong KongE-mail: [email protected]
Abstract. The problem of automated defect detection in textured mate-rials is investigated. A new algorithm based on multichannel filtering ispresented. The texture features are extracted by filtering the acquiredimage using a filter bank consisting of a number of real Gabor functions,with multiple narrow spatial frequency and orientation channels. Foreach image, we propose the use of image fusion to multiplex the infor-mation from sixteen different channels obtained in four orientations.Adaptive degrees of thresholding and the associated effect on sensitivityto material impurities are discussed. This algorithm realizes large com-putational savings over the previous approaches and enables high-quality real-time defect detection. The performance of this algorithm hasbeen tested thoroughly on real fabric defects, and experimental resultshave confirmed the usefulness of the approach. © 2000 Society of Photo-Optical Instrumentation Engineers. [S0091-3286(00)01912-7]
Subject terms: defect detection; Gabor filters; multichannel filtering; textile indus-try; computer vision; quality assurance; industrial automation.
Paper 200028 received Jan. 24, 2000; revised manuscript received July 7, 2000;accepted for publication July 21, 2000.
ionnysegthisreomto
tionicas inrs.icaachta-
urechss-end
emim-ar
lecateforalis
ta-
be
ter-
tion
time-ese
itsep-ureona-
ref-
onsco-
dfss
gef.
-res
ierricuslyare
tion
1 Introduction
Motivated by human beings’ robust texture-segmentatcapabilities and by studies of human perception, macomputer vision researchers have developed a texturementation paradigm that is based on the Gabor filter. Inparadigm, multiscale and multiorientation Gabor filters aused for feature extraction. These features are then cbined, typically using one or more polling mechanisms,segment defects. The framework for texture segmentabased on Gabor filters has been motivated by physiologevidence that the response of orientation-selective cellthe visual cortex can be modeled using Gabor filte1
Gabor-shaped receptive fields are fundamental to biologprocessing of texture, but any extensions of this approto computer vision are only appropriate within a computional framework.
In recent years, a large number of techniques for textanalysis have been based on Gabor filters. This approainspired by the multichannel filtering theory of the proceing of visual information in the biological model of thhuman visual system. As proposed by Campbell aRobson,2 this theory argues that the human visual systdecomposes the retinal image into a number of filteredages each of which contains intensity variations over a nrow range of frequency and orientation. Subsequent etrophysiological and psychophysical experiments indicthat the brain contains large array of neurons that filterorientation and size information at each point in visucortex.3 Each of these neurons found in the visual cortextuned to a particular combination of frequency and oriention in a narrow range, which is referred to as achannel.These channels are interpreted as bandpass filters anda striking resemblance to Gabor functions.1 Motivated bythis understanding of human perception, many compu
3176 Opt. Eng. 39(12) 3176–3190 (December 2000) 0091-3286/2000/
-
-
l
l
is
--
ar
vision researchers have proposed texture segmentamethods based on the filter-bank model.4,5
1.1 Prior Work
Fabric defect segmentation has been studied for a longusing various approaches.6–14 Computing features that capture textural properties are at the heart of most of thapproaches. The success of a particular feature is inability to describe texture that agrees with human perction. Thus Gabor functions are good descriptors of textfeatures. A general framework for fabric defect detectican be formulated by capturing fabric features through Gbor functions and then comparing these features with aerence~i.e., a defect-free fabric sample!. Defect segmenta-tion can be successfully achieved by statistical calculation these features. Texture features extracted from theoccurrence matrix,6 autocorrelation of web images,7 theKarhunen-Loe`ve ~KL ! transform,8 and means and standardeviations of subblocks9 have been used for detection ofabric defects. Modeling of fabric texture using the GauMarkov random field~GMRF! and defect detection usinstatistics derived from this model have been detailed in R10.
The periodicity of yarns in textile fabric provides valuable information, and therefore Fourier domain featuhave been suggested for detecting fabric defects.11 Whendefects cause global distortion in textile material, Fouranalysis is most suitable. But that is not true for local fabdefects, and therefore techniques that can simultaneomeasure in the spatial and the spatial-frequency domainmore useful. Therefore multiscale wavelet representa~MSWAR!12 and the Gabor filter bank13,14 have been usedto detect fabric defects. Prior work has used complex~i.e.,
$15.00 © 2000 Society of Photo-Optical Instrumentation Engineers
e
uecalan
ileingp-eg-
o
the
lsge-r-
tha
-n-otrsel,d-heinlyi-
nx-al
ualofat
in-pi-older
ndto
-r
of14.s a
en
ad
lenh
eons ae-
veny
s to
ore
s.rkcy-or-Dsedim-n ofion,ec-e-de-ors.realed
off
y atedan
dertnes
Kumar and Pang: Fabric defect segmentation . . .
real and imaginary! Gabor functions; however, we only usreal Gabor functions.
1.2 Present Work
In this paper, we present a multichannel filtering techniqbased on real Gabor functions for segmentation of lotexture defects. The technique has been developedevaluated for on-line detection of local defects in textwebs. One of the advantages of the multichannel filterapproach4,5 over other textural feature extraction aproaches that use a small window size is its ability to sment both fine and coarse texture defects.15 This is accom-plished by segmenting fine and coarse texture defectsdifferent scales~multichannel!. We now detail how our ap-proach is motivated by earlier work on mechanisms invisual cortex of mammals.
Psychophysically observed spatial-frequency channe16
and neurophysiologically observed blob-, bar-, and edsensitive neurons17 have been used to explain texture peception in human vision. Malik and Perona18 have pre-sented a model for preattentive* texture discriminationbased on human visual mechanisms. They have shownodd-symmetric ~imaginary Gabor function! and even-symmetric~real Gabor function! filters are not treated identically in texture discrimination. One of the important coclusions of their work is that odd-symmetric filters are nuseful in texture discrimination but even-symmetric filteare. They excluded odd-symmetric filters from their modsince they could not find any texture for which an odsymmetric mechanism was necessary. Therefore twork18 supports our defect detection scheme using oreal ~even-symmetric! Gabor functions and ignoring imagnary ~odd-symmetric! ones.
Some researchers20,21 have described how a well-knownonlinearity of visual system plays a significant role in teture discrimination. This nonlinearity is due to retinadaptations,22 and it follows a simple-cell-response~Gabor-shaped! stage. This nonlinearity enables the human vissystem to respond to local contrast over 10 log unitsillumination changes. As detailed in Ref. 18, there areleast two physiologically plausible causes for this nonlearity: ~a! a nonlinear contrast response function that tycally has sigmoid shape for neurons that exhibit a thresheffect for low contrast and a saturation effect for highcontrast,~b! intracortical inhibition that could occur withinand among responses in different channels. Malik aPerona,18 in their texture perception model, have chosenuse~b!, while ignoring~a!. In our work we use the nonlinearity suggested in~a!. The main contributions of this papeare summarized as follows:
1. This algorithm uses real Gabor functions insteadthe complex Gabor functions used in Refs. 13 andThis is because the real Gabor function can act ablob detector.5,26–29 More justification is given inSec. 1.2 and Sec. 3.
2. Computational and performance gain have been
*Preattentive texture discrimination is attributed to difference in first-orstatistics of stimulus features such as the orientation, size, and brighof constituent elements.19
d
n
t
r
-
hanced by the use of local nonlinear functions insteof the multiresolution pyramid used in Ref. 13.
3. An image fusion technique based on Bernoulli’s ruof combination12 is proposed to integrate informatiofrom different channels. This approach offers higdetection rate and low false-alarm rate.
4. This algorithm is computationally economic, with thuse of threshold tradeoff and smaller convolutimasks. Performance analysis of this algorithm afunction of sensitivity and mask size is also prsented.
5. A simple thresholding method is suggested to remoisolated noisy pixels, which does not require amorphological operations.
Prior texture segmentation work5 using real Gabor func-tions has been concentrated on Brodatz’s album.23 How-ever, the present work on defect segmentation pertainreal, meaningful patterns from the textile industry.
In this paper, ‘‘complex Gabor function’’ or ‘‘Gaborfunction’’ or ‘‘Gabor filter’’ refers to the real and imagi-nary parts~combined! of a Gabor function. Similarly, ‘‘realGabor function’’ means only the real part of the Gabfunction, and ‘‘imaginary Gabor function’’ means only thimaginary part.
The organization of the rest of this paper is as followIn Sec. 2, preliminary theoretical foundations of this woare introduced. Those include spatial- and frequendomain description of Gabor filters, and a review of priwork using real Gabor functions. In Sec. 3, a class of 2real-Gabor-function masks are introduced, which are uto encode images into multiple cosine-modulated subages. That section includes a discussion of the selectiosalient Gabor-function parameters for defect segmentatfollowed by a brief discussion of supervised defect dettion. Extraction of textural blob descriptors for online dfect segmentation is described in Sec. 4. Section 5scribes statistical calculations on these texture descriptIn Sec. 6, experimental results on synthetic as well asfabrics are reported. Section 7 gives a discussion, followby conclusions in Sec. 8.
2 Theoretical Foundations
In this section, we briefly review the basic propertiesGabor functions. This is followed by an introduction oprior work on real Gabor function.
2.1 Multiscale and Multiorientation Gabor Filters
A Gabor function is a complex exponential modulated bGaussian function in the spatial domain, and is a shifGaussian in the frequency domain. In general,n-dimensional Gabor function is expressed as24,25
h~p!5 f ~p!m~p!, ~1!
where f (p) is a Gaussian function~aperture! given by
f ~p!51
@~2p!nuCu#1/2expF21
2~p2p0!TC21~p2p0!G , ~2!
andm(p) is a complex modulating functions
3177Optical Engineering, Vol. 39 No. 12, December 2000
vec
eion
Thee-a-
ctssia
of
po-borfted
ss-
l-eir
ing a
be
fs innsntics,borne
p-ndef.m-arya
29isller
tex-een
by
s aump-othm-
vesnrdere-ea-ain.reinc-rateareveinse,lu-
i-se
eal
rs.
eavenstal
Kumar and Pang: Fabric defect segmentation . . .
m~p!5exp@ j v0T~p2p0!# ~3!
wherep, p0 , v0PRn, C is an n3n positive definite co-variance matrix, anduCu5detC.
For the 2-D case~to be used henceforth!, the horizontaland vertical spatial coordinates are represented by thetor p5@x,y#T. The shape of Gaussian functionf (p) is con-trolled by the matrixC, and the vectorp05@x0 ,y0#T standsfor the translation of its origin. Ifsx andsy are variancesof the Gaussian function along thex and y axes, respec-tively, then
C5Fsx2 0
0 sy2G , ~4!
where the constantssx andsy determine the scale and thwidth/aspect ratio, which is used to adjust the orientatsensitivity of the Gabor function. The vectorv5@u,v#T
represents two axial frequencies along two coordinatesvectorv05@u0 ,v0#T represents the overall translation frquency of the Gabor function. In two dimensions, the Gbor filter is tuned to the orientationu5tan21(v0 /u0) fromtheu axis. In the frequency domain, the Gabor function aas a 2-D bandpass filter represented as a shifted Gausfrequency-centered atv05@u0 ,v0#T. The axis of modula-tion in the frequency domain is oriented at an angletan21(v0 /u0) from theu axis.
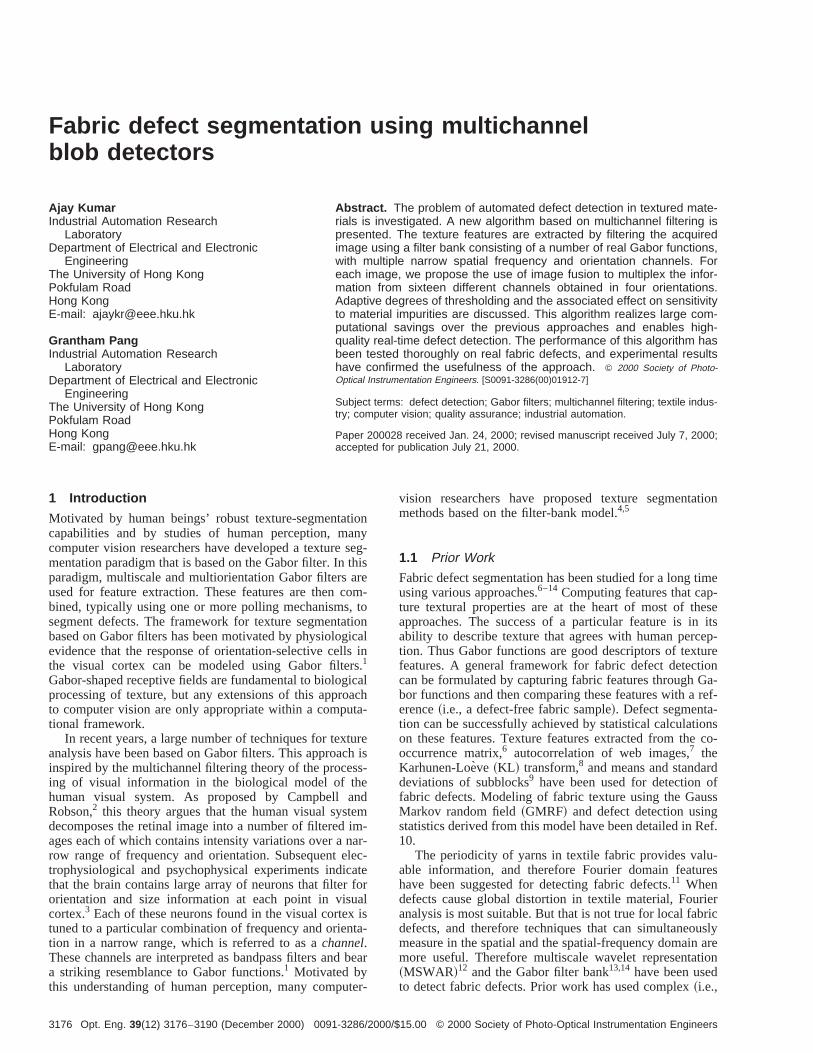
Figure 1 shows the perspective plot of the real comnent of a Gabor function. In the frequency domain, a Gafunction is a 2-D bandpass filter, represented as a shiGaussian function centered at (u0 ,v0):
H~v!5exp@2 12 ~v2v0!TC~v2v0!#. ~5!
Equation~1! can be interpreted as the sum of two Gauian functions that are cosine~real! and sine~imaginary!modulated. The impulse responses of these odd~real! andeven ~imaginary! Gabor functions are approximately Hibert pairs. This approximation is more exact when th
Fig. 1 Perspective view of real Gabor function in spatial domain.
3178 Optical Engineering, Vol. 39 No. 12, December 2000
-
n,
amplitudes are close, and this can be ensured by choosGabor filter with small half-peak bandwidth.24
2.2 Prior Work Using Real Gabor Functions
The real part of a Gabor function has been shown touseful as a correlation filter for object detection.26–29
Casasent and Smokelin26 use a weighted combination oreal Gabor functions to detect multiple classes of objectclutter, with object distortions and contrast variatiopresent. Their work employed initial real-Gabor-functioparameters based on the nominal target characteriscombined several real Gabor functions into a macro Gafilter, and used a general neural network algorithm to refiparameters of the initial macro Gabor filter. A similar aproach for object detection with reduced false alarms ahigher probability of detection has been suggested in R27. In this approach a clutter Gabor function has been eployed to locate candidate clutter regions and an imaginGabor function to detect object edges, in addition tomacro Gabor filter suggested in Ref. 26. In Refs. 28 andthe spatial modulation frequency of a real Gabor functionselected to produce one large positive lobe and two smanegative lobes on either side~Fig. 1!, since this selectionyields a proven blob detector.26 The prior work in Refs.26–29 has been focused on target detection. However,ture segmentation using only real Gabor functions has bdetailed in Ref. 5. Portilla et al.30 use real Gabor functionsfor extraction of texture features for synthesis of textureanalysis.
3 Gabor Filters for Defect Segmentation
In the spatial domain, an image is classically described acollection of pixels, and in the frequency domain, as a sof sinusoids of infinite extent. A fabric image can be reresented in either the frequency or the spatial domain. Bare relevant in a vision system entailing frequency sapling localized in space. The defect segmentation involidentification of regions with uniform textures in a giveimage. Appropriate measures of texture are needed in oto decide whether a given region has uniform texture. Dfect segmentation in texture requires simultaneous msurements in both the spatial and the frequency domFilters with small bandwidths in the frequency domain amore desirable, because they allow us to make finer disttions among different textures. On the other hand, acculocalization of texture boundaries requires filters thatlocalized in the spatial domain. However, the effectiwidth of the filter in the spatial domain and its bandwidththe frequency domain are inversely related. In this senGabor filters achieve the maximum possible joint resotions in the spatial and frequency domains.31
Escofet et al.13,14 used a combination of real and imagnary Gabor functions to detect defects. In our work, we uonly real Gabor functions and ignore imaginary ones. RGabor functions act as proven blob detectors,26 whileimaginary Gabor functions act as proven edge detecto32
As discussed in Sec. 1.2, Malik and Perona18 have shownthat odd-symmetric mechanisms~imaginary Gabor func-tions here! are not useful in texture discrimination. Whilanalyzing defects against texture background, we hfound that the contribution from imaginary Gabor functiois insignificant but they account for nearly 50% of the to
re-ert
e
ghtreds
ed-
putTheple
thens
fil-our
er
elsputandelsthels.
imec-
noror-re-
theom-n.
s
ve
m-aleen
by
ds.skageal
mctor
ck-thatfil-hey
Kumar and Pang: Fabric defect segmentation . . .
computation time. Thus, we approximate the impulsesponse of real and imaginary Gabor functions as Hilbpairs as used by Shi.24
The analytical form of a 2-D real Gabor function in thspatial domain is given by
h~x,y!mn51
2puCu1/2cosvmT ~pn2p0!
3expF21
2~pn2p0!TC21~pn2p0!G , ~6!
wherem is the index for scale andn is an index for orien-tation. The spatial modulation frequencyvm is only in onedirection, since we use Gabor function to detect only heiand width. The vectorp0 shifts the origin of the real Gabofunction, so that the output for each input position is shiftby p0 . The real Gabor functions for different orientationare obtained by the coordinate transformationp̃n5Jnpn andp̃05Jnp0 , with25
Jn5Fcosun 2sinun
sinun cosunG . ~7!
The angleun rotates the real Gabor function for any desirorientation. The parametersvm andun represent the angular frequency and orientation for themn channel. The pa-rameterssx andsy , which define the matrixC, control thebandwidth of the function.
In this scheme, power-spectrum sampling of an inimage at different scales and orientations is performed.complete set of self-similar Gabor functions used to samthe input image is obtained by rotation~varying un) andscaling~varying vm) of the basic Gabor function.
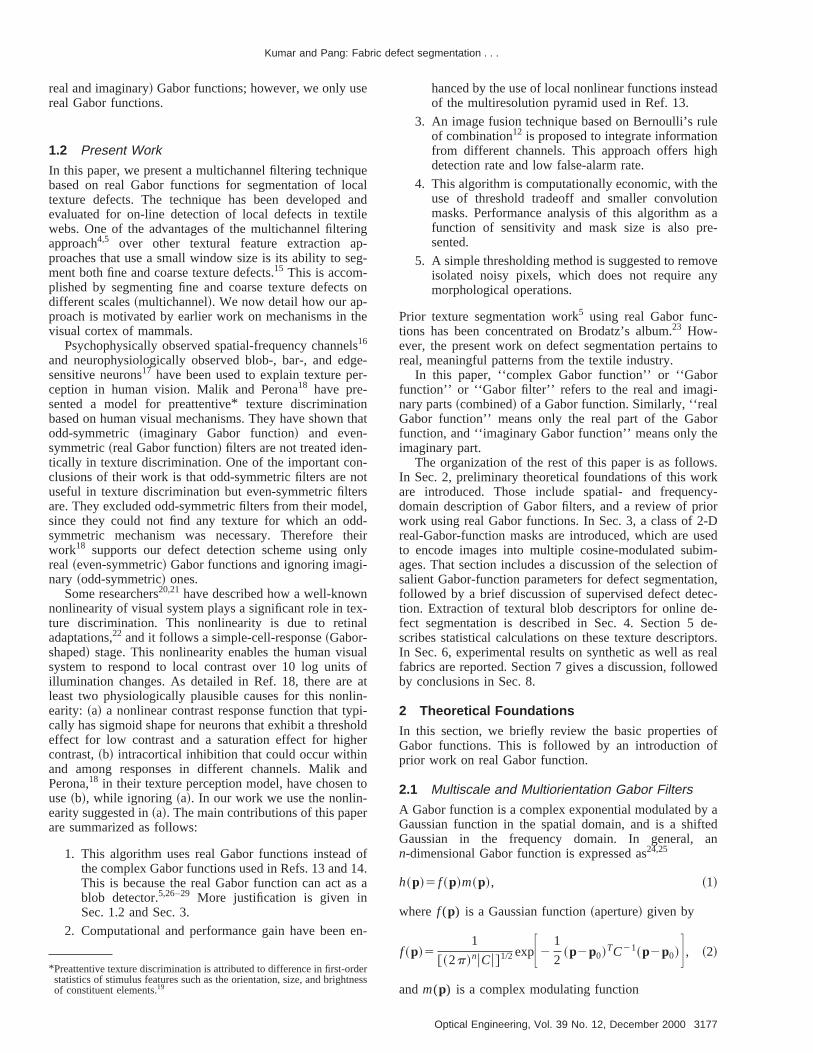
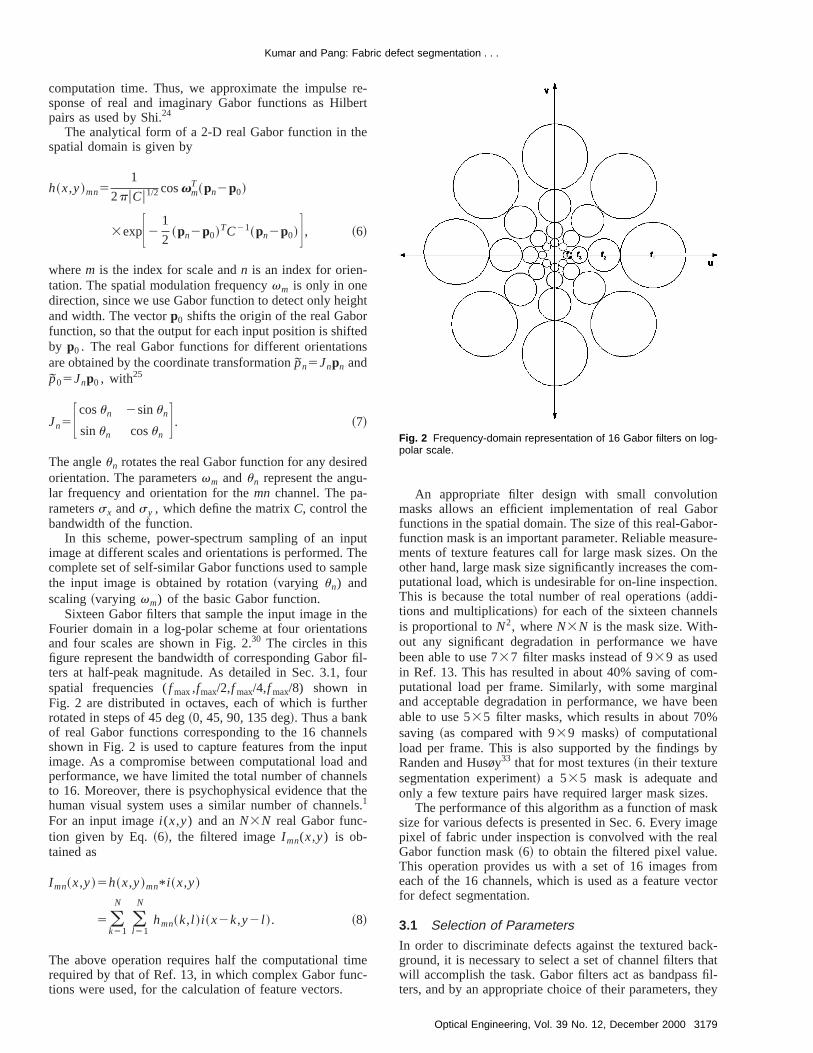
Sixteen Gabor filters that sample the input image inFourier domain in a log-polar scheme at four orientatioand four scales are shown in Fig. 2.30 The circles in thisfigure represent the bandwidth of corresponding Gaborters at half-peak magnitude. As detailed in Sec. 3.1, fspatial frequencies (f max,fmax/2,f max/4,f max/8) shown inFig. 2 are distributed in octaves, each of which is furthrotated in steps of 45 deg~0, 45, 90, 135 deg!. Thus a bankof real Gabor functions corresponding to the 16 channshown in Fig. 2 is used to capture features from the inimage. As a compromise between computational loadperformance, we have limited the total number of channto 16. Moreover, there is psychophysical evidence thathuman visual system uses a similar number of channe1
For an input imagei (x,y) and anN3N real Gabor func-tion given by Eq.~6!, the filtered imageI mn(x,y) is ob-tained as
I mn~x,y!5h~x,y!mn* i ~x,y!
5 (k51
N
(l 51
N
hmn~k,l !i ~x2k,y2 l !. ~8!
The above operation requires half the computational trequired by that of Ref. 13, in which complex Gabor funtions were used, for the calculation of feature vectors.
An appropriate filter design with small convolutiomasks allows an efficient implementation of real Gabfunctions in the spatial domain. The size of this real-Gabfunction mask is an important parameter. Reliable measuments of texture features call for large mask sizes. Onother hand, large mask size significantly increases the cputational load, which is undesirable for on-line inspectioThis is because the total number of real operations~addi-tions and multiplications! for each of the sixteen channelis proportional toN2, whereN3N is the mask size. With-out any significant degradation in performance we habeen able to use 737 filter masks instead of 939 as usedin Ref. 13. This has resulted in about 40% saving of coputational load per frame. Similarly, with some marginand acceptable degradation in performance, we have bable to use 535 filter masks, which results in about 70%saving ~as compared with 939 masks! of computationalload per frame. This is also supported by the findingsRanden and Husøy33 that for most textures~in their texturesegmentation experiment! a 535 mask is adequate anonly a few texture pairs have required larger mask size
The performance of this algorithm as a function of masize for various defects is presented in Sec. 6. Every impixel of fabric under inspection is convolved with the reGabor function mask~6! to obtain the filtered pixel value.This operation provides us with a set of 16 images froeach of the 16 channels, which is used as a feature vefor defect segmentation.
3.1 Selection of Parameters
In order to discriminate defects against the textured baground, it is necessary to select a set of channel filterswill accomplish the task. Gabor filters act as bandpassters, and by an appropriate choice of their parameters, t
Fig. 2 Frequency-domain representation of 16 Gabor filters on log-polar scale.
3179Optical Engineering, Vol. 39 No. 12, December 2000

pa-e-two
jech
ere
orl
ncye-
tantand
ge
e-
cy
e-tralre-
e.edum,-diale
s
ewThen-
werlo-n-
ofcansuchpro-orictsaborinelytial
veof
oisesh-t as
at-e to
Kumar and Pang: Fabric defect segmentation . . .
can be tuned to discriminate local fabric defects. The stial modulation frequency of real Gabor functions is slected so as to produce one large positive lobe andsmaller negative lobes on either side~Fig. 1!, since thisyields a proven blob detector.5,26 In Ref. 26 real Gaborfunctions were shaped to produce blob detectors for obdetection, while our work is similar to Ref. 5, in whicmultiscale and multiorientation real Gabor functions~Fig.3! are used to capture texture features. We have considthe model with circular symmetry (sx5sy5s) and a spa-tial bandwidth proportional to spatial frequency. For Gabfilter defined by Eq.~1!, the half-peak-magnitude axia(Ba) and orientation (Bu) bandwidths as shown in Fig. 4are defined as4,5
Ba5 log2Fvms1~2 ln 2!
vms2~2 ln 2!G , Bu52 tan21F ~2 ln 2!
vms G .~9!
Several experiments have shown that the frequebandwidth of cells in the visual cortex is about onoctave.34 This justifies the choice for fixing the axial bandwidth as one octave. From Eq.~9! this can be achieved by
Fig. 4 Frequency-domain parameters of a Gabor filter.
Fig. 3 Sixteen real Gabor functions in spatial domain.
3180 Optical Engineering, Vol. 39 No. 12, December 2000
t
d
s53~2 ln 2!1/2
vm. ~10!
In this way, the radial and angular bandwidths are conson the log-polar scale, and are equal to one octave36.87 deg, respectively.
The spatial-frequency plane of the acquired fabric imais divided into four different orientations~0, 45, 90, and135 deg!. A common method of decomposing the frquency band, motivated by a human-vision model,34 hasbeen to use an octave-band~dyadic! decomposition.5,30
Therefore, we divide the radial axis of the spatial-frequenplane into four equal octave bands~centered atf 1 , f 2 , f 3 ,and f 4). In a bandwidth of one octave, the spatial frquency increases by a factor of two. The highest cenfrequency for each direction is located at the Nyquist fquency to avoid ringing and noise.35 The resultant filterbank performs log-polar sampling of acquired fabric imag
The width of the thinnest yarn of this fabric, expressin terms of the number of pixels, determines the maximfrequency of interest. Letf 1 be this maximum frequencyalso denoted byf max. This choice of radial frequency guarantees that the passband of the filter with highest rafrequency~i.e., f max) falls inside the image array. Thus wselect the next radial frequency of the Gabor filter,f 2 , atthe next lower octave channel~one octave away!, i.e., f 2
5 f max/2. Similarly, f m5 f max212m (m51,2,3,4). For a par-ticular fabric, if it is found that the thinnest yarn occupie12 pixels, then we choosef max51/12 cycle/pixel. With amaximum frequency of this order, we expect to detect fdefects whose sizes are approximately that of one yarn.larger defects can be located with filters of lower frequecies. That is, the greater the extent of the defect, the lois the filter frequency needed to detect it. The contourcations of 16 Gabor filters along with their center frequecies are shown in Fig. 2.
3.2 Supervised Segmentation of Defects
If a priori knowledge regarding the orientation and sizelocal fabric defects is made available to the process, itbe regarded as supervised defect segmentation. Incases, segmentation can be performed using just one appriately tuned Gabor filter instead of the bank of Gabfilters discussed in last subsection. Figure 5 clearly depsuccessful supervised defect segmentation using a Gfilter. From the visual examination of the fabric sampleFig. 5~a! it can be observed that the defect is approximatone yarn wide and is located at about 90 deg in the spaplane. Since one yarn in this image occupies 24 pixels~ap-proximately!, a Gabor filter located atf 51/24 cycle/pixelis chosen. A 15315 ~ad hoc! Gabor filter mask withf51/24,u590 deg, and half-peak bandwidth of one octa@Eq. ~10!# was found to be appropriate for attenuationbackground and accentuation of defects. Further, a 939median filter was used to suppress the speckle-like nfrom the filtered image, and the resulting image was threolded to obtain a binary image of the segmented defecshown in Fig. 5~c!. The thresholding value is obtained fromEq. ~18!, as detailed in Sec. 5.2. The median filteringtenuates irrelevant spectral features that do not contribut

fecin
lds
can15e:
-er,s-areall
n on-d iheec-
blend
s aedfabe
6ired
g-tingncellu-ec.redextratesof
via-
brics isayf
nd
age
re
s a
e aure.nta-at1 tohatthe
ionn-sher
ethethethatnc-ev-
nentit-
alr-ave
rmns-tithFthe
Kumar and Pang: Fabric defect segmentation . . .
an efficient segmentation using thresholding. Figure 5~d!shows another fabric sample, in which the observed deis approximately 2 yarns wide and is oriented at 90 degthe spatial plane. A similar processing of this image yiethe segmented defect shown in Fig. 5~f!. For the fabricsample images shown in Fig. 5, defect segmentationalso be achieved with a convolution mask smaller than315 ~ad hoc!, but with some degradation in performancthe segmented defect is not so clear as in Fig. 5.
A supervised approach will have limitations as compared to the flexibility of unsupervised approach. Howevin many industrial inspection applications it may be asumed that the orientation and resolution of defectsfixed. Supervised defect segmentation can be economicimplemented on general-purpose hardware for inspectiodefects of known sizes in a known direction. However, usupervised defect segmentation is a more critical task anmore suitable for on-line detection of local defects in ttextile industry. This problem is discussed in the next stion.
4 Online Defect Detection
Any online fabric defect detection system must be capaof integrating defects captured at different orientations aresolution levels of the Gabor filter. The desired output ibinary image of local defects in the fabric. The desirprocedure must be robust, automatic, and applicable toric with different structures. Vibration-free images of thfabric under test are acquired using backlighting.
Fig. 5 Supervised defect segmentation: (a) and (d), test samples;(b) and (e), corresponding Gabor-filtered images; (c) and (f), bina-rized filtered images with segmented defects.
t
yf
s
-
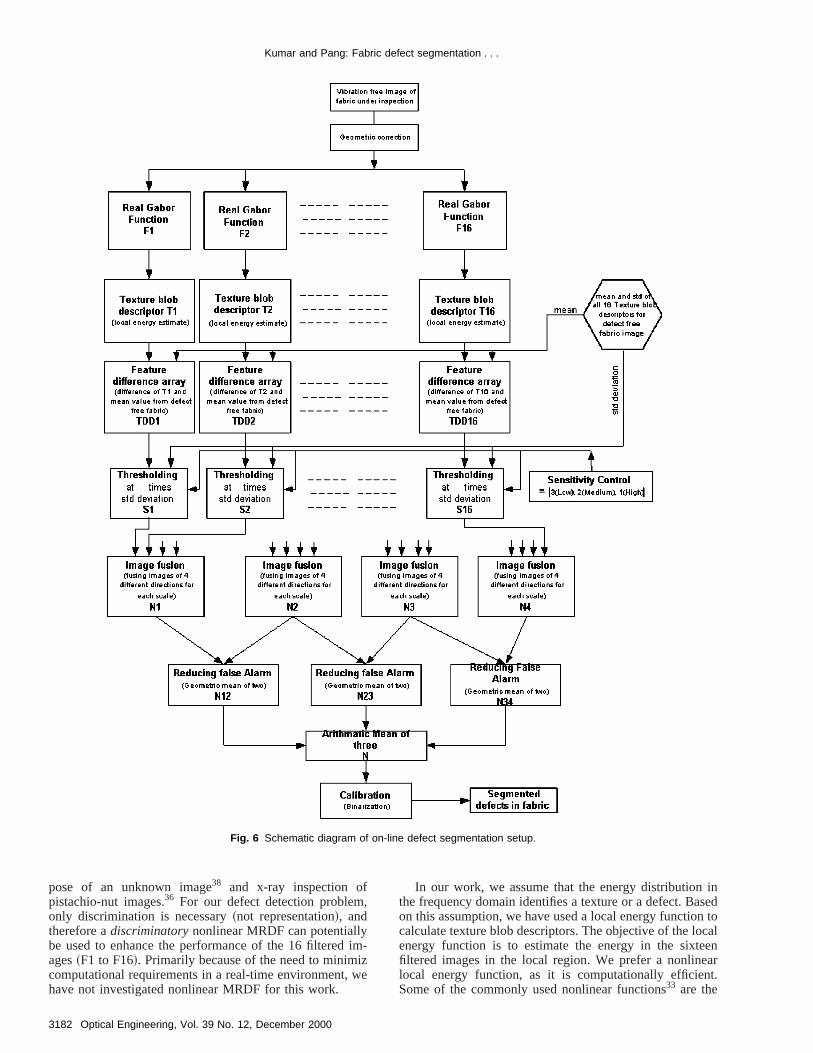
The block diagram of this procedure is shown in Fig.and discussed here. The procedure starts with an acquimage of fabric with defectsi (x,y). The acquired imagesexhibit artifacts of brightness gradient due to nonhomoenous lighting. These artifacts are corrected by subtraca reference image from the acquired images. This refereimage of plain white paper is acquired under the same imination condition. The Gabor functions described in S3.1 are applied to this corrected image and the 16 filteimages F1 to F16 are obtained. As detailed in the nsubsection, a nonlinear operator on these images genecorresponding blob descriptors T1 to T16. A similar setoperations on a defect-free fabric sample~reference! is usedto obtain blob descriptors~R1 to R16! for a reference fabricsample. As shown in Fig. 6, the mean and standard detions from each of the sixteen blob descriptors~R1 to R16!are computed at the beginning and stored before the fainspection. This set of means and standard deviationutilized to generate a feature difference arr~TDD1, . . . ,TDD16!. Section 5 explains the operation othe sensitivity control, which is used to monitor noise agenerates 16 images~S1 to S16!. As shown in Fig. 6 anddetailed in Sec. 5.1, these images are subjected to imfusion, and a set of four images~N1 to N4! correspondingto each of the four scales~m! is obtained. These images ain turn combined~Sec. 5.1! to a single image outputN so asto further reduce false alarms. This imageN is subjected tocalibration, which is detailed in Sec. 5.2, and the result ifinal image of segmented defects~if any! in the fabricsample under inspection.
4.1 Extraction of Texture Blob Descriptors
For reliable defect segmentation, it is necessary to havset of feature vectors that can characterize the textThese texture features form the basis for defect segmetion. Now our objective is to find a transform function thcan enhance the changes in each of the 16 images FF16, which may correspond to a defect, in such a way ta thresholding operation can segment the defect fromtextured background. Talukdar and Casasent36 have devel-oped a linear maximum representation and discriminatfeature~MRDF! that has been shown to outperform stadard linear feature extraction techniques such as the Filinear discriminant, Fukunaga-Koontz~FK! transform, andKarhunen-Loe`ve ~KL ! transform for segmentation of imagdata. However, linear transforms are only optimal whendata are Gaussian and symmetrically distributed aboutmean. They are not necessarily the best for image dataare not characterized by Gaussian probability density futions. Therefore, nonlinear transforms are necessary. Seral nonlinear transforms, such as independent-compoanalysis and nonlinear principal-component analysis, areerative ~and may fail to converge to the globally optimsolution! and have limitations on the rank of decision sufaces. These shortcomings of nonlinear transforms hbeen addressed by Talukdar and Casasent36,37 with the useof a nonlinear MRDF. They have derived a closed-fosolution that automatically finds the best nonlinear traform, which is a polynomial mapping of the input, withouany increased computational complexity as compared wlinear approaches. Applications of the nonlinear MRDhave been successfully demonstrated for estimation of
3181Optical Engineering, Vol. 39 No. 12, December 2000
Kumar and Pang: Fabric defect segmentation . . .
3182 Opt
Fig. 6 Schematic diagram of on-line defect segmentation setup.
,
imizwe
insedn tocalenart.
pose of an unknown image38 and x-ray inspection ofpistachio-nut images.36 For our defect detection problemonly discrimination is necessary~not representation!, andtherefore adiscriminatorynonlinear MRDF can potentiallybe used to enhance the performance of the 16 filteredages~F1 to F16!. Primarily because of the need to minimcomputational requirements in a real-time environment,have not investigated nonlinear MRDF for this work.
ical Engineering, Vol. 39 No. 12, December 2000
-
In our work, we assume that the energy distributionthe frequency domain identifies a texture or a defect. Baon this assumption, we have used a local energy functiocalculate texture blob descriptors. The objective of the loenergy function is to estimate the energy in the sixtefiltered images in the local region. We prefer a nonlinelocal energy function, as it is computationally efficienSome of the commonly used nonlinear functions33 are the
deartheor-otn-nto
onsur-
ramheure
lo
ture
on,ac-
sared achtheoth
s-tors
16plet oracrs
ray
en-ngimad
th-
thto
ectde
is.hes,
ehengge,ct.rip-
re
e ise-
de-re-
t
esere-ng
ingitiv-rmageblye-ris
thend
ord-
ceeect.
cego-ee-
forted-iledhe,er-
Kumar and Pang: Fabric defect segmentation . . .
magnitudeuxu, the squareuxu2, and the rectified sigmoidutanhbxu. Unser and Eden39 have proposed and analyzeseveral combinations of the first and the second nonlinity for texture segmentation. They have concluded thatnonlinear function that squares along with logarithmic nmalization is the best combination. However, they did ntest the rectified sigmoid, which is also an important nolinear function similar to the sigmoidal activation functiocommonly used in artificial neural networks. In contrastthe rectified sigmoid, the magnitude and squaring functido not require any tuning parameters. However, in the crent application, this may be a disadvantage, as the paeterb might be tuned. Furthermore, the nonlinearity of tsigmoid is supported by human visual models for textdiscrimination, as discussed in Sec. 1.2. Therefore, thecal energy function proposed by Jain and Furrokhnia5 isappropriate for our application. T1 is obtained as
T1~x,y!5u f @F1~x,y!#u, f ~ t !5tanhbt. ~11!
Similarly, a new set of 16 images, described here as texblob descriptors~T1 to T16! are obtained. The parameterb,which gives the saturation characteristics of this functidepends on the dynamic range of gray levels in thequired images.33 Empirically, this is fixed at 0.3 to give afast-saturating, thresholdlike function.
The application of the local energy function transformthe sinusoidal modulations in the filtered image to squmodulations. Therefore, this operation can be interpreteblob detection.5 Since the nonlinear function used for eaof the 16 filtered images F1 to F16 is odd-symmetric,texture blob descriptors T1 to T16 are accompanied by bdark and light blobs.
Individual blobs in T1 to T16 are identified and are asigned to defect or defect-free texture. Texture descripfor the reference~defect-free! fabric sample~R1 to R16!are obtained in a similar manner. For each of thesetexture descriptors corresponding to the defect-free samwe obtain the mean and standard deviation. This semeans and standard deviations is used for further chaterization of each pixel from the texture blob descripto~T1 to T16!.
5 Statistical Defect Segmentation
Texture features characterized by the enhanced local glevel statistical distribution~11! are asymptotically uniformfor defect-free fabric~in sufficiently large image areas!.Given a prototype of the fabric under test, defect segmtation requires identification of a proper distance amosuch distributions. Classical approaches based on esttion of some statistical moments~e.g., mean value, standardeviation! or other statistical parameters40 allow very quickcharacterization of image pixels. On the other hand, meods based on higher-order statistics~e.g., co-occurrencematrix, run-length metrics, statistical feature matrices! pro-vide more information but are highly demanding in bocomputational and memory requirements. Primarilyavoid a computational bottleneck in the online fabric defdetection system, we have processed the texture blobscriptors T1 to T16 by using first-order statistical analys
The set of texture blob descriptors T1 to T16 forms tbasis for defect segmentation. From these descriptor
-
-
-
s
,f-
-
-
-
a
comparison for each pixel of a defective fabric with thcorresponding pixel of defect-free fabric is made. If tdifference is small, the probability of a pixel correspondito the defect-free sample is high. If the difference is larit is highly probable that this pixel corresponds to a defeFor each of the texture blob descriptors, the texture desctor difference~magnitude! TDD can be written as
TDD~x,y!5uT~x,y!2mdefect-freeu, ~12!
wheremdefect-freeis the mean of the corresponding textublob descriptors for defect-free fabric~R1 to R16!. Next,the standard thresholding operation to reduce the noisperformed. For each of the pixels in TDD, we find corrsponding pixels inS:
S~x,y!5H TDD~x,y! if TDD ~x,y!>t sd,
0 otherwise.~13!
The thresholding is thus proportional to the standardviation ~sd!. This standard deviation is calculated fodefect-free fabric from each of its sixteen texture blob dscriptors, R1 to R16. The magnitude of the coefficientdepends on the sensitivity as fixed by the user.
The motivation behind the introduction ofsensitivitycontrol in our algorithm is twofold. When we increase thsize of fabric in the image frame in an attempt to increathe performance, the mean gray-level variation in thesulting image tends to be uniform. Now the thresholdilimit has to be much smaller~highly sensitive! to discrimi-nate the defective pixels. We have found that a thresholdlimit equal to one standard deviation increases the sensity and is most suitable for large-area images with unifomean gray level. Second, when the fabric size in the imframe is small so that gray-level variations are consideranonuniform, a thresholding limit of twice the standard dviation ~medium sensitivity! is appropriate. On the othehand, when the number of yarn impurities in the fabrichigh, the sensitivity has to be kept low~t 53! to discrimi-nate the defects against the noisy background. Thussensitivity control largely depends on the fabric texture aimage acquisition conditions, and must be adjusted accingly.
Now we have obtained 16 threshold feature differenimages~S1 to S16!, and our next task is to preserve thpixels in each of these images that correspond to a def
5.1 Image Fusion
Evaluating the reliability of texture difference pixels fromdifferent channels is crucial when the texture differenimages reveal inconsistencies. A number of fusion alrithms have been developed29,41–43and used to reduce thfalse-alarm rate while maintaining high probability of dtection. One approach that has been successfully usedtarget detection involves deliberate generation of unwanoutput ~clutter! followed by its subtraction from the detection output. Examples of this approach have been detain Refs. 41 and 42: the hit-miss transform, involving tintersection fusion of the outputs from hit and miss filters41
and the morphological wavelet transform, involving thsubtraction of clutter-map output from analog cluttereduction output.42 Casasent and Smokelin27 use imaginary
3183Optical Engineering, Vol. 39 No. 12, December 2000
tesbor
go-f
vernfi-
soownAs
go-ec-tedsoof-
urde-
or
a
m
-
ol-lowes
uesourchine
env-
atev-snosteo-
is
ob-ed-
Aare
andblyofnyhis
he-
ho-
ofnde
nise,fectsriorand
sh-s an
ldtad,-
othtingthe
Kumar and Pang: Fabric defect segmentation . . .
and clutter Gabor-filter outputs to reduce false-alarm rain detection output generated by using only real Gafunctions. Casasent and Ye43 have performed qualitativeand quantitative analysis of binary and analog fusion alrithms. A binary fusion algorithm uses the logical AND ooutputs obtained from several detection outputs. Howesuch an algorithm does not weight the difference in codence levels between different detection outputs, andanalog-and-hierarchical fusion algorithms have been shto produce better results, i.e., lower false-alarm rates.detailed in Ref. 43, an analog-and-hierarchical fusion alrithm uses a mapping function to convert different dettion outputs into a common range. This step is motivaby the fuzzification function used in fuzzy logic, and is alused in a fusion algorithm based on Bernoulli’s rulecombination,44 though with a different membership function.
The main function of the image fusion module in owork is to attenuate background pixels and accentuatefective pixels from four directions. Bernoulli’s rule of combination, which is often used in image fusion,12,44 is ex-tended here for integrating images from four directions. Feach of the four images at every scalem, the followingmapping function is used to convert pixel values intocommon output range from 0 to 1:
Omn~x,y!5Smn~x,y!2min@Smn~x,y!#
max@Smn~x,y!#2min@Smn~x,y!#, ~14!
where the image inputSmn(x,y) is the same asS(x,y) fromEq. ~13!, but has been subscripted with indices for scalemand orientationn as in Eq.~6!. Thus for Eq.~14! the featuredifference images S1 to S4 are denoted byS11(x,y) toS14(x,y) to indicate that the images have originated froreal Gabor functions at scalem51 and orientationn51,2,3,4,~0, 45, 90, and 135 deg!.
Next, a fused outputNm(x,y) is generated for everyscalem, by fusion of the normalized images~14! from fourdirections:
Nm~x,y!5 (n51
4
Omn~x,y!2@Om1~x,y!Om2~x,y!
1Om2~x,y!Om3~x,y!1Om3~x,y!Om4~x,y!
1Om4~x,y!Om1~x,y!1Om4~x,y!Om2~x,y!
1Om3~x,y!Om1~x,y!#. ~15!
Thus for every scalem51,2,3,4, we obtain one fused image output Nm(x,y) from the four imagesSm1(x,y),Sm2(x,y), Sm3(x,y), and Sm4(x,y) using Eqs.~14! and~15!. As detailed in Ref. 12, the fused outputs tend to flow one of the inputs closely if the other inputs possessvalues. On the other hand, an input with very high valutends to dominate the outputs, regardless of their valThus the pixels from the defects captured in any of the forientations will dominate in the final fused image for eascale. Thus the fusion suppresses the noise and combsixteen images~S1 to S16! into four images~N1 to N4!.
Due attention to reducing false alarms should be givwhen the information gathered from the four resolution le
3184 Optical Engineering, Vol. 39 No. 12, December 2000
,
-
.
s
els ~N1 to N4! is combined. It is reasonable to assume tha defect will appear on at least two adjacent resolution lels; otherwise it is highly unlikely that it is a defect. Areported by Escofet et al.,13 this consideration has beefound to reduce the false-alarm rate while preserving mof the defective areas. This is ensured by computing gmetric means of every adjacent level. For example, N12computed as
N12~x,y!5@N1~x,y!N2~x,y!#1/2. ~16!
Next, a set of three images N12, N23, and N34 aretained. An arithmetic mean will combine defects capturby them. This imageN(x,y) in essence contains contribution from all sixteen texture descriptors~T1 to T16!:
N~x,y!5 13 @N12~x,y!1N23~x,y!1N34~x,y!#. ~17!
5.2 Calibration
Finally, this last image is subjected to thresholding.thresholding value is selected such that values below itconsidered as belonging to regular texture in the fabric,values above as belonging to defects. This value is suitaobtained by calibration of the system at the beginningthe operation. For calibration, a fabric sample without adefects and yarn impurities is used. With the use of treference image,Ndefect-free(x,y) is obtained from Eq.~17!.The threshold valueh th is obtained by
h th5 maxx,yPW
$Ndefect-free~x,y!%, ~18!
where W is a window centered at the image. Thus tthreshold valueh th is the maximum amplitude of gray levels, within the windowW, in the imageNdefect-free(x,y) ob-tained from the reference image. The window size is csen to avoid the effects of border distortion.22 It is obtainedby removing 10 pixels~ad hoc! from each side of the imageNdefect-free(x,y). This choice depends on the mask sizethe real Gabor functions; for a 737 mask, at least sevepixels from the border have to be ignored. The magnituof h th is such that isolated noisy pixels inN(x,y) are com-pletely isolated in the output binary image. Binarizatiobased on this threshold limit helps to suppress the noalthough this operation also suppresses some of the decaptured at different orientations and frequencies. In pwork,13 the threshold value was based on the meanstandard deviation of the final image@Ndefect-free(x,y) here#.As stated in Ref. 13, and from our experiments, this threold value generates large noise in the output and requireopening operation with a convolution mask~typically 333) to eliminate the noise. With the use of the threshovalue suggested in Eq.~18!, the opening operation is noneeded and this results in reduction of computational lowhich is critical for real-time implementation of this algorithm.
6 Results
We have tested this defect segmentation algorithm on bsynthetic and real test fabric images. The reason for testhis algorithm on synthetic images was to ensure that

Kumar and Pang: Fabric defect segmentation . . .
Fig. 7 Synthetic test fabrics for evaluation: (a) with defect, (b) without defect, (c) with segmenteddefect.
s,gea-
enicsng.cts.eso
fonhereg
ig.tobe
rnnsseectsted
Asp-mectsein
acty
85
rgeisf fab-er1,ith
a of(atlynotGa-on,Fig.
thelu-ow-ture-ivee ofrebe
heage.on, as
clas-
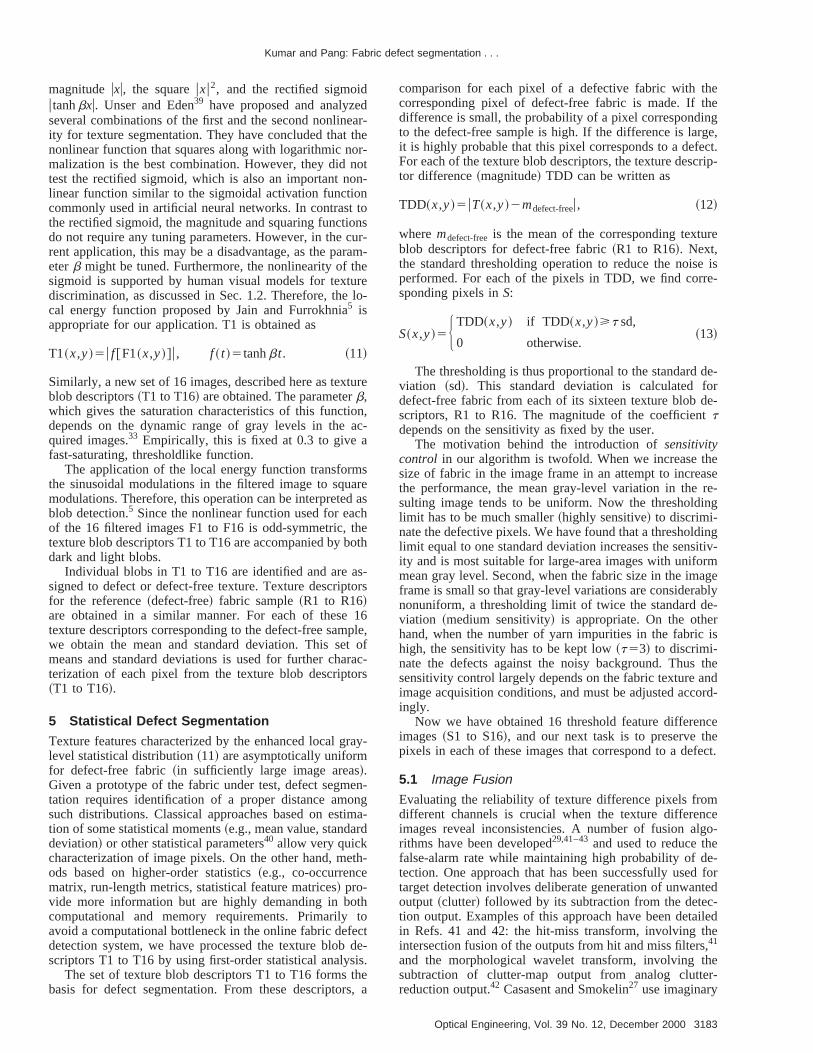
algorithm is able to discriminate difficult fabric defectwhich humans can discriminate preattentively. The imaacquisition subsystem developed at the Industrial Automtion Laboratory at The University of Hong Kong has beused to capture gray-level images of defective test fabrAll images used here were acquired using backlightiSamples of the most commonly occurring fabric defe~mixed filling, waste, mispicks, kinky filling, misreed, etc!were gathered from a loom, and their gray-level imagwere used to evaluate the algorithm described. Somethese results are reproduced here.
Figures 7~a! and 7~b! show synthetic binary images othe test and the reference fabric, respectively. The secrow of the test image has two more pixels than the otrows. This simulated defect of thick yarn can be seen smented in the final image@Fig. 7~c!#. Figures 8~a! and 8~b!show real fabric images, with defects segmented in F8~c!. The border effect in the segmented image is foundbe reasonably localized, and the border distortion canignored.
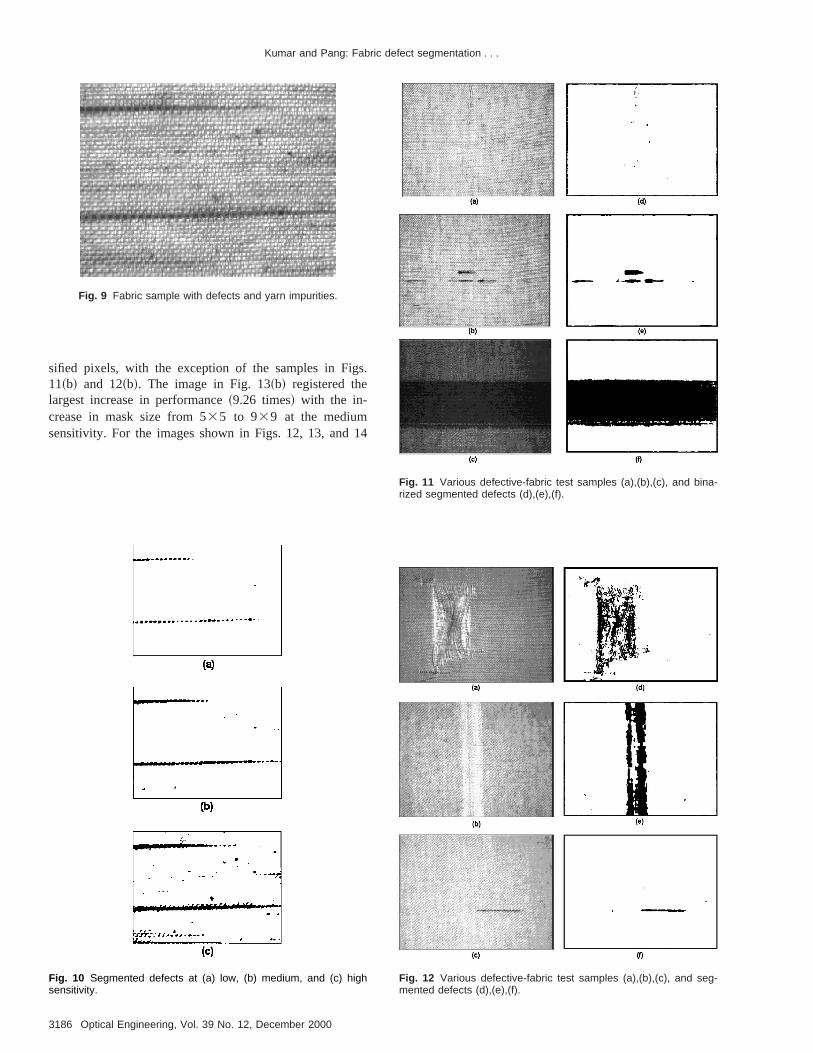
Accurate segmentation of defects is limited by poor yaquality. Impurities that are naturally present in fabric yartend to obscure more subtle defects. This effect can bein Figs. 9 and 10. The fabric image in Fig. 9 has defealong with large yarn impurities. The defects are segmenat three different sensitivities: low, high, and medium.seen from results in Fig. 10, low sensitivity helps to supress the yarn impurities but at the expense of losing sopixels from the defect. However, when segmenting defefrom fabric with large impurities, the sensitivity has to breduced to avoid yarn impurities appearing as defectsoutput.
The image acquisition subsystem was adjusted toquire large images while fabric is in motion with a veloci
.
f
d
-
n
-
of 30 cm/s. The acquired images were digitized in 33287 pixels, with 8-bit resolution~256 gray levels!. Nineimages of fabric with defects were chosen to have lacharacteristic variability in composition and structure. Itassumed that these sample images are representative oric defects in the textile industry. All these images cov10-cm width and 7.5-cm height of actual fabric. Figures 112, and 13 illustrate the defect segmentation achieved wthe proposed algorithm. Due to the increase in the arefabric per frame, we have increased the sensitivityt52). Figure 13~b! shows a fabric sample with defects thare visible only with difficulty. The appearing defects onalter the spatial arrangement of neighboring pixels andthe mean gray level. This change is registered by realbor functions and enhanced by the local energy functiand segmentation is successfully achieved as shown in13~e!.
The lack of appropriate quantitative measures forgoodness of segmentation makes it very difficult to evaate and compare different defect detection methods. Hever, a simple criterion that has been used in many texsegmentation algorithms5,15,33is the percentage of misclassified pixels. In defect segmentation problem, it is defectpixels that are of interest, and therefore the percentagall defective pixels misclassified is what is reported he~Table 1!. From this table some general observations canmade. With the increase in sensitivity from low to high, tpercentage of misclassified pixels increases for every imsample~for a 737 mask!, except for the sample of Fig11~b!. Another effect on performance due to the variatiin mask size can be observed. At the medium sensitivitythe mask size is increased from 535 to 939, for everyimage sample there is a decrease in percentage of mis
Fig. 8 Fabric sample for test: (a) with defect, (b) without defects, (c) with segmented defect.
3185Optical Engineering, Vol. 39 No. 12, December 2000
s.
14
Kumar and Pang: Fabric defect segmentation . . .
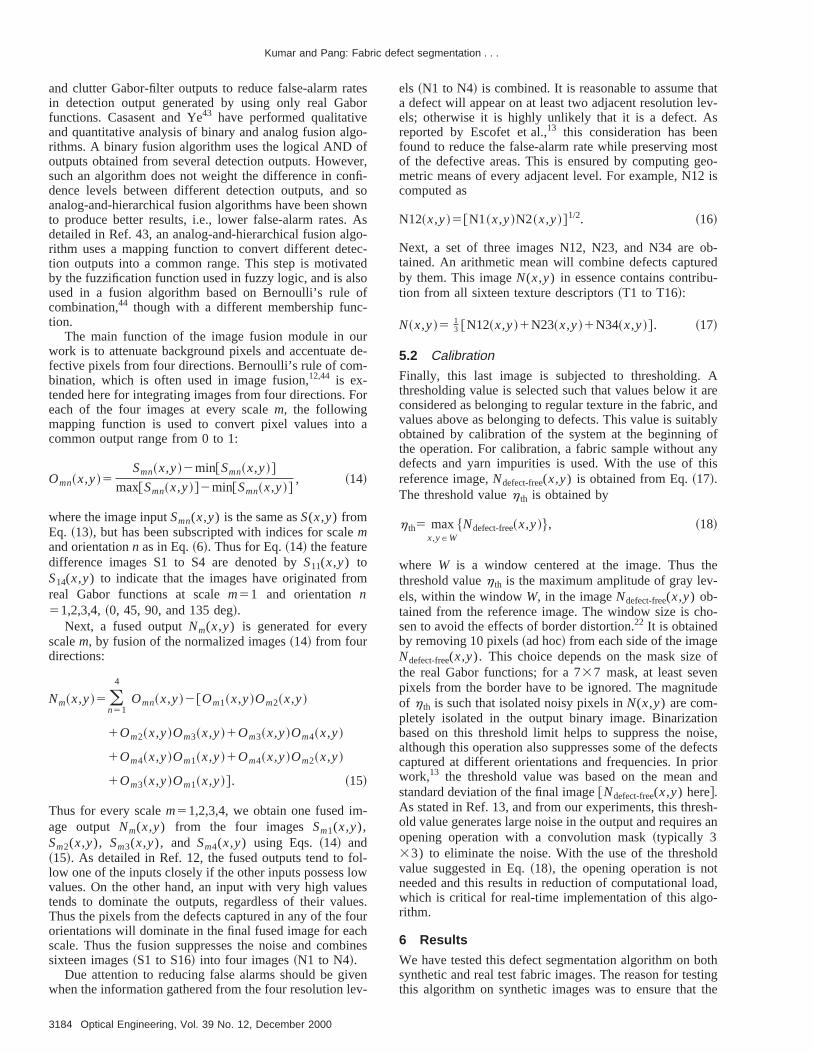
sified pixels, with the exception of the samples in Fig11~b! and 12~b!. The image in Fig. 13~b! registered thelargest increase in performance~9.26 times! with the in-crease in mask size from 535 to 939 at the mediumsensitivity. For the images shown in Figs. 12, 13, and
Fig. 9 Fabric sample with defects and yarn impurities.
Fig. 10 Segmented defects at (a) low, (b) medium, and (c) highsensitivity.
3186 Optical Engineering, Vol. 39 No. 12, December 2000
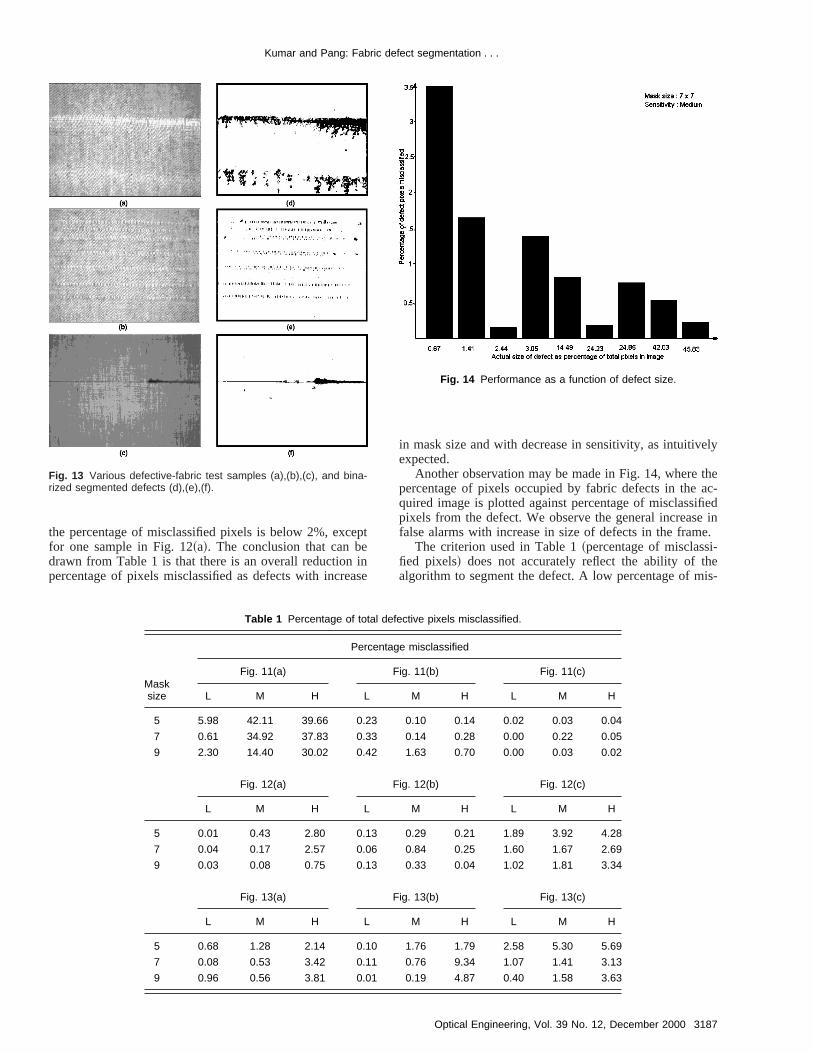
Fig. 11 Various defective-fabric test samples (a),(b),(c), and bina-rized segmented defects (d),(e),(f).
Fig. 12 Various defective-fabric test samples (a),(b),(c), and seg-mented defects (d),(e),(f).
ep
inas
ly
theac-fiede ine.-eis-
Kumar and Pang: Fabric defect segmentation . . .
the percentage of misclassified pixels is below 2%, excfor one sample in Fig. 12~a!. The conclusion that can bedrawn from Table 1 is that there is an overall reductionpercentage of pixels misclassified as defects with incre
Fig. 13 Various defective-fabric test samples (a),(b),(c), and bina-rized segmented defects (d),(e),(f).
t
e
in mask size and with decrease in sensitivity, as intuitiveexpected.
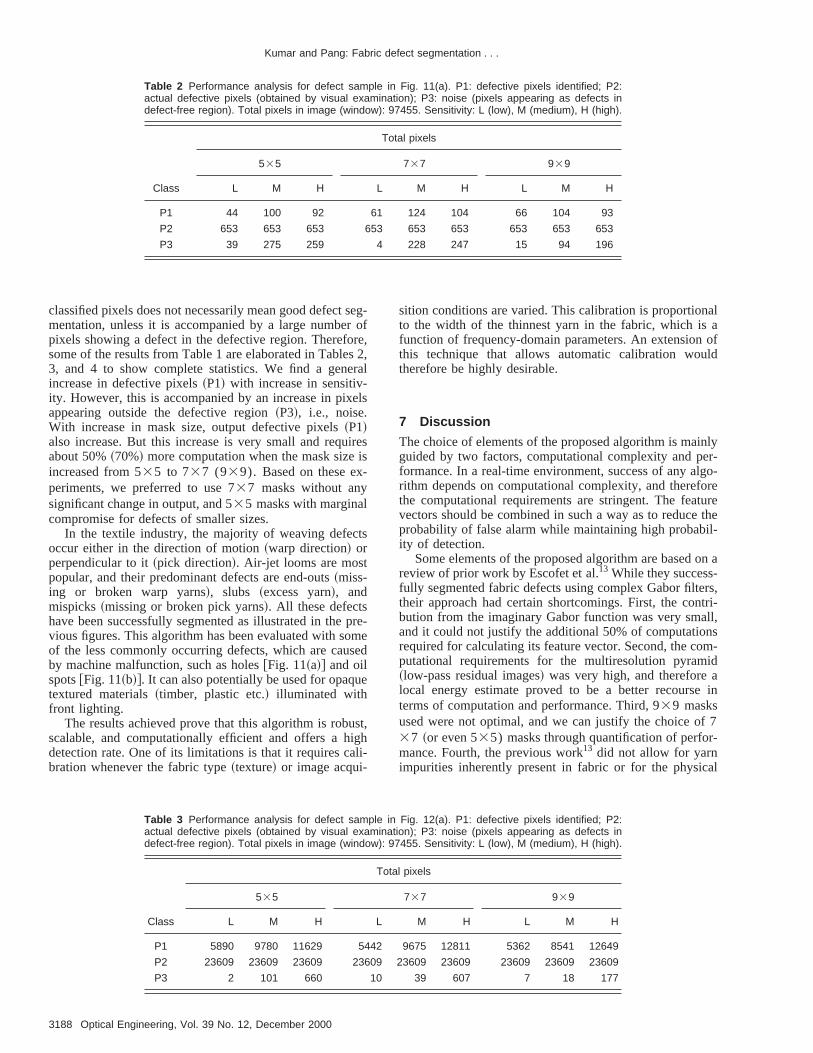
Another observation may be made in Fig. 14, wherepercentage of pixels occupied by fabric defects in thequired image is plotted against percentage of misclassipixels from the defect. We observe the general increasfalse alarms with increase in size of defects in the fram
The criterion used in Table 1~percentage of misclassified pixels! does not accurately reflect the ability of thalgorithm to segment the defect. A low percentage of m
Fig. 14 Performance as a function of defect size.
Table 1 Percentage of total defective pixels misclassified.
Masksize
Percentage misclassified
Fig. 11(a) Fig. 11(b) Fig. 11(c)
L M H L M H L M H
5 5.98 42.11 39.66 0.23 0.10 0.14 0.02 0.03 0.04
7 0.61 34.92 37.83 0.33 0.14 0.28 0.00 0.22 0.05
9 2.30 14.40 30.02 0.42 1.63 0.70 0.00 0.03 0.02
Fig. 12(a) Fig. 12(b) Fig. 12(c)
L M H L M H L M H
5 0.01 0.43 2.80 0.13 0.29 0.21 1.89 3.92 4.28
7 0.04 0.17 2.57 0.06 0.84 0.25 1.60 1.67 2.69
9 0.03 0.08 0.75 0.13 0.33 0.04 1.02 1.81 3.34
Fig. 13(a) Fig. 13(b) Fig. 13(c)
L M H L M H L M H
5 0.68 1.28 2.14 0.10 1.76 1.79 2.58 5.30 5.69
7 0.08 0.53 3.42 0.11 0.76 9.34 1.07 1.41 3.13
9 0.96 0.56 3.81 0.01 0.19 4.87 0.40 1.58 3.63
3187Optical Engineering, Vol. 39 No. 12, December 2000
Kumar and Pang: Fabric defect segmentation . . .
3188 Optical Engi
Table 2 Performance analysis for defect sample in Fig. 11(a). P1: defective pixels identified; P2:actual defective pixels (obtained by visual examination); P3: noise (pixels appearing as defects indefect-free region). Total pixels in image (window): 97455. Sensitivity: L (low), M (medium), H (high).
Class
Total pixels
535 737 939
L M H L M H L M H
P1 44 100 92 61 124 104 66 104 93
P2 653 653 653 653 653 653 653 653 653
P3 39 275 259 4 228 247 15 94 196
segr ore,s 2ra
els
iresis-
l
ts
premesed
e
st,ighli-
alaofld
nlyer-lgo-oreturethe
il-
on a
rs,tri-ll,
nsm-ida
in
f 7r-
al
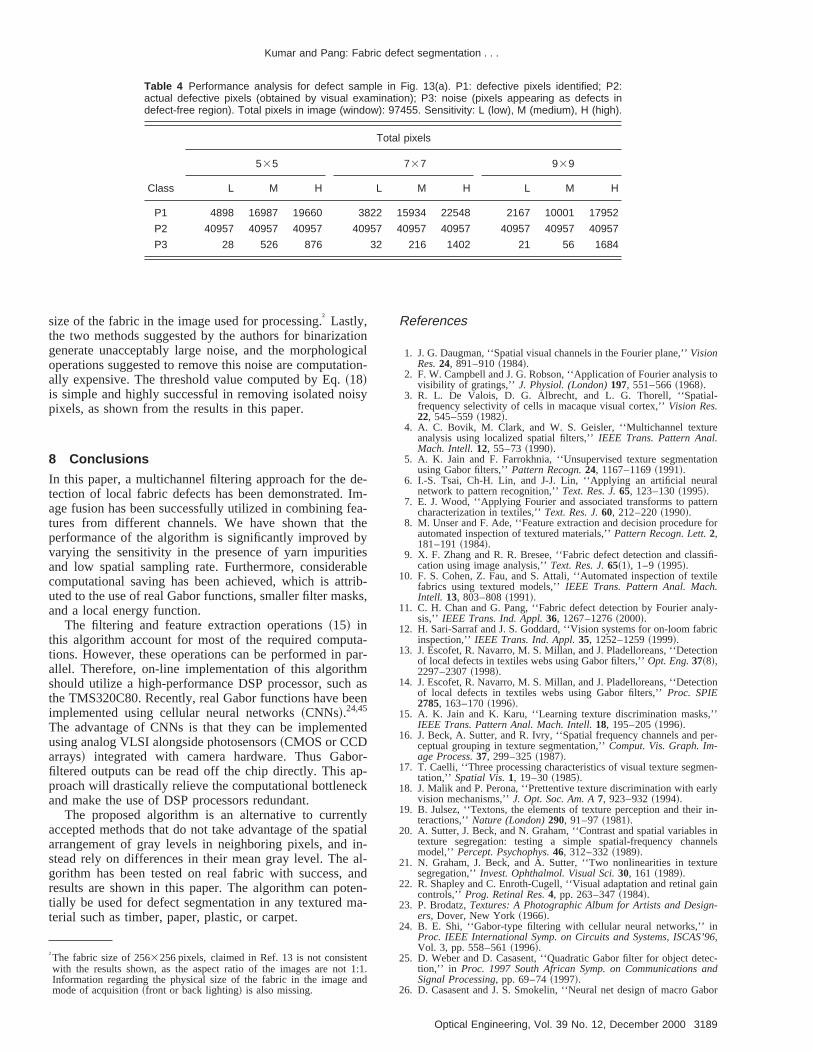
classified pixels does not necessarily mean good defectmentation, unless it is accompanied by a large numbepixels showing a defect in the defective region. Therefosome of the results from Table 1 are elaborated in Table3, and 4 to show complete statistics. We find a geneincrease in defective pixels~P1! with increase in sensitiv-ity. However, this is accompanied by an increase in pixappearing outside the defective region~P3!, i.e., noise.With increase in mask size, output defective pixels~P1!also increase. But this increase is very small and requabout 50%~70%! more computation when the mask sizeincreased from 535 to 737 (939). Based on these experiments, we preferred to use 737 masks without anysignificant change in output, and 535 masks with marginacompromise for defects of smaller sizes.
In the textile industry, the majority of weaving defecoccur either in the direction of motion~warp direction! orperpendicular to it~pick direction!. Air-jet looms are mostpopular, and their predominant defects are end-outs~miss-ing or broken warp yarns!, slubs ~excess yarn!, andmispicks~missing or broken pick yarns!. All these defectshave been successfully segmented as illustrated in thevious figures. This algorithm has been evaluated with soof the less commonly occurring defects, which are cauby machine malfunction, such as holes@Fig. 11~a!# and oilspots@Fig. 11~b!#. It can also potentially be used for opaqutextured materials~timber, plastic etc.! illuminated withfront lighting.
The results achieved prove that this algorithm is robuscalable, and computationally efficient and offers a hdetection rate. One of its limitations is that it requires cabration whenever the fabric type~texture! or image acqui-
neering, Vol. 39 No. 12, December 2000
-f
,l
-
sition conditions are varied. This calibration is proportionto the width of the thinnest yarn in the fabric, which isfunction of frequency-domain parameters. An extensionthis technique that allows automatic calibration woutherefore be highly desirable.
7 Discussion
The choice of elements of the proposed algorithm is maiguided by two factors, computational complexity and pformance. In a real-time environment, success of any arithm depends on computational complexity, and therefthe computational requirements are stringent. The feavectors should be combined in such a way as to reduceprobability of false alarm while maintaining high probabity of detection.
Some elements of the proposed algorithm are basedreview of prior work by Escofet et al.13 While they success-fully segmented fabric defects using complex Gabor filtetheir approach had certain shortcomings. First, the conbution from the imaginary Gabor function was very smaand it could not justify the additional 50% of computatiorequired for calculating its feature vector. Second, the coputational requirements for the multiresolution pyram~low-pass residual images! was very high, and thereforelocal energy estimate proved to be a better recourseterms of computation and performance. Third, 939 masksused were not optimal, and we can justify the choice o37 ~or even 535) masks through quantification of perfomance. Fourth, the previous work13 did not allow for yarnimpurities inherently present in fabric or for the physic
Table 3 Performance analysis for defect sample in Fig. 12(a). P1: defective pixels identified; P2:actual defective pixels (obtained by visual examination); P3: noise (pixels appearing as defects indefect-free region). Total pixels in image (window): 97455. Sensitivity: L (low), M (medium), H (high).
Class
Total pixels
535 737 939
L M H L M H L M H
P1 5890 9780 11629 5442 9675 12811 5362 8541 12649
P2 23609 23609 23609 23609 23609 23609 23609 23609 23609
P3 2 101 660 10 39 607 7 18 177
Kumar and Pang: Fabric defect segmentation . . .
Table 4 Performance analysis for defect sample in Fig. 13(a). P1: defective pixels identified; P2:actual defective pixels (obtained by visual examination); P3: noise (pixels appearing as defects indefect-free region). Total pixels in image (window): 97455. Sensitivity: L (low), M (medium), H (high).
Class
Total pixels
535 737 939
L M H L M H L M H
P1 4898 16987 19660 3822 15934 22548 2167 10001 17952
P2 40957 40957 40957 40957 40957 40957 40957 40957 40957
P3 28 526 876 32 216 1402 21 56 1684
tionica
tion
isy
e-Im-ea-thebyesblerib-ks
ta-parm
aeen
ted
or-p-ck
tlyatiin-al-anden-a-
to
-
e
tion
l
ern
for
sifi-
tile
aly-
ric
ion
ion
,’’
er-
en-
rly
in-
s innels
re
ain
n-
n’96
tec-nd
abor
nt1:1nd
size of the fabric in the image used for processing.† Lastly,the two methods suggested by the authors for binarizagenerate unacceptably large noise, and the morphologoperations suggested to remove this noise are computaally expensive. The threshold value computed by Eq.~18!is simple and highly successful in removing isolated nopixels, as shown from the results in this paper.
8 Conclusions
In this paper, a multichannel filtering approach for the dtection of local fabric defects has been demonstrated.age fusion has been successfully utilized in combining ftures from different channels. We have shown thatperformance of the algorithm is significantly improvedvarying the sensitivity in the presence of yarn impuritiand low spatial sampling rate. Furthermore, consideracomputational saving has been achieved, which is attuted to the use of real Gabor functions, smaller filter masand a local energy function.
The filtering and feature extraction operations~15! inthis algorithm account for most of the required computions. However, these operations can be performed inallel. Therefore, on-line implementation of this algorithshould utilize a high-performance DSP processor, suchthe TMS320C80. Recently, real Gabor functions have bimplemented using cellular neural networks~CNNs!.24,45
The advantage of CNNs is that they can be implemenusing analog VLSI alongside photosensors~CMOS or CCDarrays! integrated with camera hardware. Thus Gabfiltered outputs can be read off the chip directly. This aproach will drastically relieve the computational bottleneand make the use of DSP processors redundant.
The proposed algorithm is an alternative to currenaccepted methods that do not take advantage of the sparrangement of gray levels in neighboring pixels, andstead rely on differences in their mean gray level. Thegorithm has been tested on real fabric with success,results are shown in this paper. The algorithm can pottially be used for defect segmentation in any textured mterial such as timber, paper, plastic, or carpet.
†The fabric size of 2563256 pixels, claimed in Ref. 13 is not consistewith the results shown, as the aspect ratio of the images are notInformation regarding the physical size of the fabric in the image amode of acquisition~front or back lighting! is also missing.
l-
,
-
s
al
References
1. J. G. Daugman, ‘‘Spatial visual channels in the Fourier plane,’’VisionRes.24, 891–910~1984!.
2. F. W. Campbell and J. G. Robson, ‘‘Application of Fourier analysisvisibility of gratings,’’ J. Physiol. (London)197, 551–566~1968!.
3. R. L. De Valois, D. G. Albrecht, and L. G. Thorell, ‘‘Spatialfrequency selectivity of cells in macaque visual cortex,’’Vision Res.22, 545–559~1982!.
4. A. C. Bovik, M. Clark, and W. S. Geisler, ‘‘Multichannel texturanalysis using localized spatial filters,’’IEEE Trans. Pattern Anal.Mach. Intell.12, 55–73~1990!.
5. A. K. Jain and F. Farrokhnia, ‘‘Unsupervised texture segmentausing Gabor filters,’’Pattern Recogn.24, 1167–1169~1991!.
6. I.-S. Tsai, Ch-H. Lin, and J-J. Lin, ‘‘Applying an artificial neuranetwork to pattern recognition,’’Text. Res. J.65, 123–130~1995!.
7. E. J. Wood, ‘‘Applying Fourier and associated transforms to pattcharacterization in textiles,’’Text. Res. J.60, 212–220~1990!.
8. M. Unser and F. Ade, ‘‘Feature extraction and decision procedureautomated inspection of textured materials,’’Pattern Recogn. Lett.2,181–191~1984!.
9. X. F. Zhang and R. R. Bresee, ‘‘Fabric defect detection and clascation using image analysis,’’Text. Res. J.65~1!, 1–9 ~1995!.
10. F. S. Cohen, Z. Fau, and S. Attali, ‘‘Automated inspection of texfabrics using textured models,’’IEEE Trans. Pattern Anal. Mach.Intell. 13, 803–808~1991!.
11. C. H. Chan and G. Pang, ‘‘Fabric defect detection by Fourier ansis,’’ IEEE Trans. Ind. Appl.36, 1267–1276~2000!.
12. H. Sari-Sarraf and J. S. Goddard, ‘‘Vision systems for on-loom fabinspection,’’ IEEE Trans. Ind. Appl.35, 1252–1259~1999!.
13. J. Escofet, R. Navarro, M. S. Millan, and J. Pladelloreans, ‘‘Detectof local defects in textiles webs using Gabor filters,’’Opt. Eng.37~8!,2297–2307~1998!.
14. J. Escofet, R. Navarro, M. S. Millan, and J. Pladelloreans, ‘‘Detectof local defects in textiles webs using Gabor filters,’’Proc. SPIE2785, 163–170~1996!.
15. A. K. Jain and K. Karu, ‘‘Learning texture discrimination masksIEEE Trans. Pattern Anal. Mach. Intell.18, 195–205~1996!.
16. J. Beck, A. Sutter, and R. Ivry, ‘‘Spatial frequency channels and pceptual grouping in texture segmentation,’’Comput. Vis. Graph. Im-age Process.37, 299–325~1987!.
17. T. Caelli, ‘‘Three processing characteristics of visual texture segmtation,’’ Spatial Vis.1, 19–30~1985!.
18. J. Malik and P. Perona, ‘‘Prettentive texture discrimination with eavision mechanisms,’’J. Opt. Soc. Am. A7, 923–932~1994!.
19. B. Julsez, ‘‘Textons, the elements of texture perception and theirteractions,’’Nature (London)290, 91–97~1981!.
20. A. Sutter, J. Beck, and N. Graham, ‘‘Contrast and spatial variabletexture segregation: testing a simple spatial-frequency chanmodel,’’ Percept. Psychophys.46, 312–332~1989!.
21. N. Graham, J. Beck, and A. Sutter, ‘‘Two nonlinearities in textusegregation,’’Invest. Ophthalmol. Visual Sci.30, 161 ~1989!.
22. R. Shapley and C. Enroth-Cugell, ‘‘Visual adaptation and retinal gcontrols,’’ Prog. Retinal Res.4, pp. 263–347~1984!.
23. P. Brodatz,Textures: A Photographic Album for Artists and Desigers, Dover, New York~1966!.
24. B. E. Shi, ‘‘Gabor-type filtering with cellular neural networks,’’ iProc. IEEE International Symp. on Circuits and Systems, ISCAS,Vol. 3, pp. 558–561~1996!.
25. D. Weber and D. Casasent, ‘‘Quadratic Gabor filter for object detion,’’ in Proc. 1997 South African Symp. on Communications aSignal Processing, pp. 69–74~1997!.
26. D. Casasent and J. S. Smokelin, ‘‘Neural net design of macro G
.
3189Optical Engineering, Vol. 39 No. 12, December 2000
,’’
abor
sign
ant
uresion
fre-cal
er-
: a
ed
z-ati-
lta-s,’’
tion
n of
re
AR
rre-
for
for
ic
and
Kumar and Pang: Fabric defect segmentation . . .
wavelet filters for distortion-invariant object detection in clutterOpt. Eng.33~7!, 2264–2271~1994!.
27. D. Casasent and J. S. Smokelin, ‘‘Real, imaginary, and clutter Gfilter fusion for detection with reduced false alarms,’’Opt. Eng.33~7!,2255–2363~1994!.
28. D. Weber and D. Casasent, ‘‘Fusion and optimized Gabor filter defor object detection,’’Proc. SPIE2588, 662–675~1995!.
29. D. Casasent, ‘‘Gabor wavelet filters and fusion for distortion-invarimulti-class object detection,’’Proc. SPIE2491, 430–440~1995!.
30. J. Portilla, R. Navarro, O. Nestares, and A. Tabernero, ‘‘Textsynthesis-by-analysis method based on a multiscale early-vimodel,’’ Opt. Eng.35~8!, 2403–2417~1998!.
31. J. Daugman, ‘‘Uncertainty relation for resolution in space, spatialquency, and orientation optimized by two-dimensional visual cortifilters,’’ J. Opt. Soc. Am. A2~7!, 1160–1169~1985!.
32. R. Malhotra, K. R. Namuduru, and N. Ranganathan, ‘‘Gabor filtbased edge detection,’’Pattern Recogn.25, 1479–1494~1992!.
33. T. Randen and J. H. Husøy, ‘‘Filtering for texture classificationcomparative study,’’IEEE Trans. Pattern Anal. Mach. Intell.21,291–310~1999!.
34. D. A. Pollen and S. F. Ronner, ‘‘Visual cortical neurons as localizspatial frequency filters,’’IEEE Trans. Syst. Man Cybern.13, 907–916 ~1983!.
35. R. Rodriguez-Sa´nchez, J. A. Garcia, J. Fdez-Valdivia, and X. R. FdeVidal, ‘‘The RGTF representational model: a system for the automcally learned partitioning of ‘visual patterns’ in digital images,’’IEEETrans. Pattern Anal. Mach. Intell.21, 1044–1073~1999!.
36. A. Talukder and D. Casasent, ‘‘General methodology for simuneous representation and discrimination of multiple object classeOpt. Eng.37~3!, 904–917~1998!.
37. A. Talukder and D. Casasent, ‘‘Nonlinear features for classificaand pose estimation of machined parts from single views,’’Proc.SPIE3522, 16–27~1998!.
38. A. Talukder and D. Casasent, ‘‘Pose estimation and transformatiofaces,’’ Proc. SPIE3522, 84–95~1998!.
39. M. Unser and M. Eden, ‘‘Nonlinear operators for improving textusegmentation based on features extracted by spatial filtering,’’IEEETrans. Syst. Man Cybern.20, 804–815~1990!.
40. S. Oe, ‘‘Texture segmentation method by using two-dimensionalmodel and Kullback information,’’Pattern Recogn.26~2!, 237–244~1993!.
41. D. Casasent, A. Ye, J. S. Smokelin, and R. Schafer, ‘‘Optical colation filter fusion for object detection,’’Opt. Eng.33~6!, 1757–1767~1994!.
42. A. Ye and D. Casasent, ‘‘Morphological and wavelet transformsobject detection and image processing,’’Appl. Opt. 33~35!, 8226–8239 ~1994!.
43. D. Casasent and A. Ye, ‘‘Detection filters and algorithm fusionATR,’’ IEEE Trans. Image Process.6, 114–125~1997!.
44. M. Abdulghafour, J. Goddard, and M. A. Abidi, ‘‘Non-deterministapproaches in data fusion—a review,’’Proc. SPIE1393, 596–610~1990!.
3190 Optical Engineering, Vol. 39 No. 12, December 2000
45. K. R. Crounse and L. O. Chua, ‘‘Methods for image processingpattern formation in cellular neural networks: a tutorial,’’IEEE Trans.Circuits Syst., I: Fundam. Theory Appl.42, 583–601~1995!.
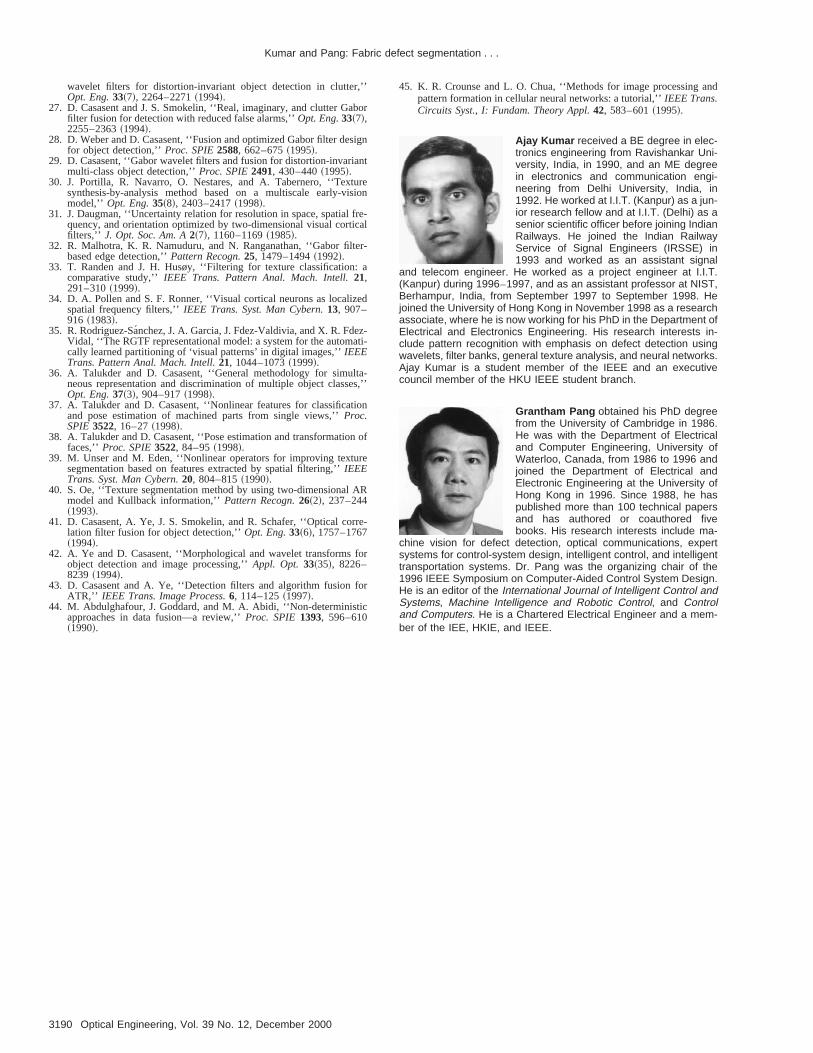
Ajay Kumar received a BE degree in elec-tronics engineering from Ravishankar Uni-versity, India, in 1990, and an ME degreein electronics and communication engi-neering from Delhi University, India, in1992. He worked at I.I.T. (Kanpur) as a jun-ior research fellow and at I.I.T. (Delhi) as asenior scientific officer before joining IndianRailways. He joined the Indian RailwayService of Signal Engineers (IRSSE) in1993 and worked as an assistant signal
and telecom engineer. He worked as a project engineer at I.I.T.(Kanpur) during 1996–1997, and as an assistant professor at NIST,Berhampur, India, from September 1997 to September 1998. Hejoined the University of Hong Kong in November 1998 as a researchassociate, where he is now working for his PhD in the Department ofElectrical and Electronics Engineering. His research interests in-clude pattern recognition with emphasis on defect detection usingwavelets, filter banks, general texture analysis, and neural networks.Ajay Kumar is a student member of the IEEE and an executivecouncil member of the HKU IEEE student branch.
Grantham Pang obtained his PhD degreefrom the University of Cambridge in 1986.He was with the Department of Electricaland Computer Engineering, University ofWaterloo, Canada, from 1986 to 1996 andjoined the Department of Electrical andElectronic Engineering at the University ofHong Kong in 1996. Since 1988, he haspublished more than 100 technical papersand has authored or coauthored fivebooks. His research interests include ma-
chine vision for defect detection, optical communications, expertsystems for control-system design, intelligent control, and intelligenttransportation systems. Dr. Pang was the organizing chair of the1996 IEEE Symposium on Computer-Aided Control System Design.He is an editor of the International Journal of Intelligent Control andSystems, Machine Intelligence and Robotic Control, and Controland Computers. He is a Chartered Electrical Engineer and a mem-ber of the IEE, HKIE, and IEEE.