faa pond design criteria water treatment modeling · pdf filestatewide airport stormwater...
TRANSCRIPT

Florida Department of Transportation – Aviation Office
Statewide Airport Stormwater Study
FAA Pond Design Criteria
Water Treatment Modeling
Report
Clean Water – Safe Airports
December, 2010


Florida Department of Transportation – Aviation Office i
STATEWIDE AIRPORT STORMWATER STUDY
FAA POND DESIGN CRITERIA –
WATER TREATMENT MODELING REPORT
TABLE OF CONTENTS 1 Executive Summary ....................................................................................................1
2 Introduction ................................................................................................................3
3 Purpose and Scope ......................................................................................................5
4 Material and Methods .................................................................................................8
4.1 Hyetographs ...........................................................................................................8
4.1.1 Study Hyetographs ..........................................................................................8
4.2 Particle Size Distribution ..................................................................................... 12
4.2.1 PSD Selection ............................................................................................... 12
4.2.2 PSD Significance .......................................................................................... 13
4.3 Physical Model Description ................................................................................. 14
4.3.1 Transformation of Rainfall Hyetographs to Runoff Hydrographs .................. 19
4.4 Wet pond at the Orlando Executive Airport .......................................................... 21
4.4.1 Hydrologic-hydraulic simulation ................................................................... 22
4.5 Generic Rectangular and Triangular Quarry Ponds ............................................... 30
4.6 Physical Model Methodology ............................................................................... 30
4.6.1 Description of the Equipment and Components ............................................. 31
4.6.2 Data Acquisition and Management................................................................ 33
4.6.3 Calibration Procedures and Verification ........................................................ 34
4.6.4 Slurry Mixing and Injection System .............................................................. 36
4.6.5 Sampling Methodology and Protocol ............................................................ 37
4.6.6 Mass Recovery and Sample Protocol ............................................................ 37
4.6.7 Laboratory Analysis ...................................................................................... 37
4.6.8 Verification of Mass Balance for each Experimental Run.............................. 38
4.6.9 Verification of PSD Balance for Each Run .................................................... 39

Statewide Airport Stormwater Study FAA Pond Design Criteria – Water Treatment Modeling Report December 2010
Florida Department of Transportation – Aviation Office ii
4.7 CFD modeling ..................................................................................................... 39
4.7.1 CFD governing equations ............................................................................. 39
4.7.2 Discrete phase model (DPM) ........................................................................ 41
4.7.3 Model Implementation .................................................................................. 42
4.7.4 Boundary and Initial Conditions, Computational Parameters and
Assumptions................................................................................................. 50
4.7.5 Population Balance ....................................................................................... 51
4.7.6 Model validation ........................................................................................... 51
4.7.7 Computational resources ............................................................................... 51
5 Results and Discussion .............................................................................................. 53
5.1 Experimental Results - FAA Linear Pond and Crenellated Pond Configurations .. 53
5.2 CFD Modeling – FAA Linear Pond and Crenellated Pond results ........................ 58
5.3 CFD Modeling – ORL Wet Pond Results ............................................................. 64
5.4 CFD Modeling - Triangular and Rectangular Quarry Ponds Results ..................... 75
6 Conclusions and Recommendations ......................................................................... 82
7 References ................................................................................................................. 85
8 Abbreviations and Symbols ...................................................................................... 88

Statewide Airport Stormwater Study FAA Pond Design Criteria – Water Treatment Modeling Report December 2010
Florida Department of Transportation – Aviation Office 1
1 Executive Summary This document is the fourth publication of the Florida Statewide Airport Stormwater Study,
which is jointly funded by the Federal Aviation Administration (FAA) and the Florida
Department of Transportation (FDOT). Technical review and guidance for stormwater
management is provided by the Florida Department of Environmental Protection (FDEP), and
the five Water Management Districts (WMDs). The purpose of the program is to develop design
options that promote aircraft safety through reducing wildlife attractants while meeting or
exceeding water quality protection and water quantity management standards. Results of the
efforts are being incorporated into Florida Administrative Code (FAC) as they demonstrate the
ability to satisfy both sets of criteria.
This study focuses on the expected behavior of two wet pond designs that meet the generic
guidance of the FAA and the United States Department of Agriculture (USDA) to minimize
attraction of birds and other wildlife hazardous to aircraft operation. The significant damage
caused to aircraft by bird and other wildlife strikes is documented, and dramatically illustrated by
the downing of US Airways Flight 1549 in the Hudson River in January 2009. Additional to the
two wet pond designs, the study includes preliminary examination of an existing airport pond
located at Orlando Executive Airport (ORL), and two ponds formed by old quarries located on or
near airports in Florida. The latter two quarry ponds are studied only for initial guidance on their
probable behavior, since quarry ponds are located near a set of Florida airports.
Expected behavior of the pond configurations studied was evaluated with Computational Fluid
Dynamic (CFD) models, validated with testing of scaled physical models of the FAA linear and
crenellated pond designs. The existing airport and the quarry ponds are evaluated solely using
CFD for comparative purposes only.
Results of the scaled physical models coupled with the validated CFD models demonstrate that a
crenellated pond configuration significantly outperforms a conventional linear FAA Pond design
for all hydrologic loadings tested. Note that the FAA linear design was predicted to outperform
typical Florida presumptive pond design. This statistically significant improvement in water
treatment function by the crenellated pond is shown by CFD to be a function of greatly improved

Statewide Airport Stormwater Study FAA Pond Design Criteria – Water Treatment Modeling Report December 2010
Florida Department of Transportation – Aviation Office 2
volumetric utilization (reduced dead zones) for the same pond surface area used by the FAA
linear pond. Based on the prior and current model results, while an FAA linear pond will likely
outperform a typical presumptively designed and permitted water management pond, a preferred
solution will involve the insertion of baffles into the linear pond to create a crenellated pond.
Full scale testing is planned to confirm the predicted behavior and validate the CFD modeling
concept for establishing presumptive permitting and design criteria for ponds that minimize
wildlife attraction.
Results of the CFD model for ORL demonstrate that for the existing deteriorated condition of the
pond the re-placement of the earthed baffles could be improved to achieve a better utilization of
volume and minimize the presence of dead zones. During influent flow rates up to approximately
3½ cfs (100 L/s), the earthed baffles exert their treatment function, constraining the flow to
follow the path delimited by the baffles. For higher flow rates, the water level in the pond
exceeds the top elevation of the baffles and a portion of the flow is able to bypass them. Under
this condition the effect of the baffles is minimized with potential generation of short-circuiting
and stagnant zones. Baffles must be elevated to preclude this under normal flow conditions.
The results of the CFD models for the quarry ponds indicate that volume (or mean residence
time) alone is not an adequate index for pond behavior. More appropriately the utilization of the
volume is more relevant with respect to formation of dead zones and short-circuiting. The area
and volume of such Ponds is excessive without potentially providing any additional particulate
matter (PM) separation and chemical conversion benefits beyond dilution. As CFD modeled
results demonstrate in this report, the volumetric utilization of the two quarry ponds is very low
and such extended Pond surface area could be optimized with the insertion of baffles.
While pond design will be unique for each set of airport conditions and time series loadings,
results of this study indicate that (1) the distance between inlet and outlet should be
hydrodynamically maximized while ensuring that scour velocities do not generate a bed shear
stress capable of re-entraining previously-separated yet unconsolidated bed PM; (2) volumetric
utilization of the pond is maximized; (3) maintenance is sufficient to ensure water chemistry
benefits for the treatment functioning of the pond; and (4) these objective functions provide
regulatory load reduction requirements that are achieved based on a cost-benefit function.

Statewide Airport Stormwater Study FAA Pond Design Criteria – Water Treatment Modeling Report December 2010
Florida Department of Transportation – Aviation Office 3
2 Introduction As reported in the literature, the treatment effectiveness (as PM separation) of stormwater
treatment structures based on gravitational settling primarily depends on the hydrodynamic
conditions established within the system (Pathapati and Sansalone, 2009a; He et al., 2008; Wu,
J.S. et al., 1996). In particular, PM removal is strongly affected by hydraulic detention times
since longer detention time allow particles to have enough time to settle. A method to enhance
PM separation is the placement of baffles through the system so that the flow across the cross-
section of the Pond is evenly distributed, minimizing the potential for short-circuiting and
increasing residence times; maximizing the hydrodynamic distance from inlet to outlet, and
essentially creating a plug flow reactor (PFR) system. For this reason, a baffled FAA pond is
proposed by placing baffles within the volumetric system, in order to potentially improve the
performance of a standard linear pond and maintain the same surface area.
The hydraulic response and PM separation of stormwater systems have been traditionally studied
using “lumped” parameters, such as surface overflow rate (SOR) defined as inflow divided by
the surface area of the sedimentation Pond (Metcalf and Eddy, 2003). In the last decades, in
contrast to these traditional methods, advanced tools such as CFD have became a defensible
approach to model the hydraulic and pollutant behavior of stormwater treatment systems; with
most conventional methods incapable of representing the coupled hydrodynamic and water
chemistry complexity of such systems (Sansalone and Pathapati, 2009c; Pathapati and
Sansalone, 2009b). The CFD method is based on numerically solving the fundamental equations
of fluid flow, the Navier-Stokes (N-S) equations, is especially powerful when the system is
subject to non-ideal conditions, such as complex flows typical of runoff, heterogeneous loadings
and complex geometries which often are not possible to model accurately using the traditional
methods. While a hydrodynamic model solves and simulates the flow field in CFD, a discrete
phase model is used to model particle trajectories and simulate particle separation. The latter
approach is coupled with granulometric data, such as particle size distribution (PSD), chemical
distribution with PM [for example mg/g] and specific gravity (ρs) of PM in order to obtain the
PM and PM-based treatment characteristics of the system.

Statewide Airport Stormwater Study FAA Pond Design Criteria – Water Treatment Modeling Report December 2010
Florida Department of Transportation – Aviation Office 4
The benefits offered by CFD modeling are numerous. Once the CFD model is
calibrated/validated it can be utilized as a design tool comparing different geometrical
configurations and layouts, avoiding the time and costs associated with physical testing of each
configuration. Additionally, three-dimensional description of particle and pollutant trajectories
and velocities which may not be determined in physical models, can be determined at each point
within the system.

Statewide Airport Stormwater Study FAA Pond Design Criteria – Water Treatment Modeling Report December 2010
Florida Department of Transportation – Aviation Office 5
3 Purpose and Scope The Florida Statewide Airport Stormwater Study is a multi-phase, multi-agency cooperative
effort addressing requirements of successful airport stormwater management. As part of a public
transportation facility, the stormwater management system must be consistent with safe and
efficient air transportation. As a component of environmental protection, the stormwater
management system must meet statutory and rule requirements intended to protect water quality,
limit or prevent flooding, and promote healthy ecosystems in downstream receiving waters.
Ultimately, the traveling and general public is the beneficiary of both requirements.
The Florida Statewide Airport Stormwater Study focuses on airside stormwater management.
This is required since airside land uses are similar airport to airport, and the stormwater runoff
from these has quantifiable quality characteristics. Contrarily, airport landside areas are highly
variable in use, including golf courses, race tracks, industrial park and concentrated commercial
lands. These landside uses are by their variability outside the scope of the Statewide Airport
Stormwater Study.
Previous study findings demonstrated the efficacy of overland flow as a best management
practice for most airport airside, stormwater management. The documentation in the Best
Management Practices Manual, the Technical Report for the Florida Statewide Airport
Stormwater Study and the Application Assessment for the Florida Statewide Airport
Stormwater Study describe the conditions where overland flow can be the sole structural method
of airside stormwater management and provide the supporting data. However, an estimated 20 to
30 percent of airport airside projects will not be able to use the overland flow BMP for
stormwater management. In these cases, where continuously wet, stormwater management
ponds will be required; the pond must be designed to minimize wildlife attractant features.
Federal Aviation Administration (FAA) and United States Department of Agriculture (USDA)
have set forth generic guidance for these type ponds in FAA Advisory Circular (AC) 150/5200-
33B Hazardous Wildlife Attractants On or Near Airports. The generic guidance in the AC is for
deep, steep-sided ponds without emergent vegetation. They do not conform to standard
“presumptive” pond design criteria of the Water Management Districts or Florida Department of
Environmental Regulation (FDEP). Further, detailed design criteria from FAA or the United

Statewide Airport Stormwater Study FAA Pond Design Criteria – Water Treatment Modeling Report December 2010
Florida Department of Transportation – Aviation Office 6
States Department of Agriculture (USDA) do not exist for these ponds, only generic features
intended to discourage bird and wildlife use are given. This study examines the hydrodynamic
and treatment behavior of two wet ponds configured consistent with the generic guidance of the
Hazardous Wildlife Attractant circular. The purpose is to characterize their potential for load
reduction, refining the expected water management behavior of the concept, and provide data for
detailed design. Prior to incorporation in rule, a full scale test pond configured to FAA/USDA
guidelines will need to demonstrate that the concept will meet Florida and federal environmental
regulatory standards. Accordingly, the model study provides guidance to help assure a first time
successful design for the full scale test pond.
This study is carried out using scaled physical models and numerical (CFD) models. These
efforts quantify the behavior of the standard, linear FAA pond design and a baffled (crenellated)
pond design of similar surface area, with deep, steep sided channels. Final components of the
study model an existing crenellated pond at the ORL, illustrating the existing functionality of the
pond; and two pond configurations typical of the quarry ponds adjacent to a number of Florida
airports.
CFD is an advanced, numerical modeling tool previously used for aerodynamic behavior for
rocket and aircraft component design. Increases in computer power and speed have made
feasible the extension of the tool into the fluid dynamic problems describing the transport and
settlement of particulates in water. This study uses CFD for hydrodynamic behavior of
constituents, represented by a particle size distribution (PSD) of PM and PM-bound chemicals.
For ponds designed to minimize avian or terrestrial wildlife attractants thereby minimizing
aircraft strikes, CFD results clearly illustrate the volumetric and geometric utilization of each
pond system examined and quantify pond behavior for load reduction benefits.
Study models use hydrologic loadings generated from a 25-year, 24-hour design storm, a
historical, high intensity storm recorded July 8, 2008 and a moderate intensity, triangular and
short duration event for the FAA linear and crenellated ponds. Pond pollutant reduction
behavior is examined utilizing a hetero-disperse PM that has a distribution in size from colloidal
to sand-size PM. The first component of this study analyzes the hydrodynamic and load
separation behavior of a linear FAA and a crenellated pond subject to such PM and hydrologic

Statewide Airport Stormwater Study FAA Pond Design Criteria – Water Treatment Modeling Report December 2010
Florida Department of Transportation – Aviation Office 7
loadings utilizing CFD validated by physical models. As reported in the 2007 Application
Assessment for the Florida Statewide Airport Stormwater Study the modeled behavior of an
FAA linear pond illustrated the benefit of increasing the length to width ratio (maximize
hydrodynamic separation of inlet and outlet) of a pond geometric design. The FAA linear pond
exhibited improved pollutant removal characteristics when compared to ponds designed based on
the typical presumptive design criteria published by Water Management Districts. Using the
2007 results as a starting point the linear FAA pond examined in this study has a length to width
ratio of 8:1. The CFD model is validated with physical model data to ensure congruence with
reality and to give confidence in the conclusions developed from the study. This avoids the
“hydro-fantasy” that can and does result from improper use of numerical or analytical models.
As a second component of this project, the existing crenellated pond at the Orlando Executive
Airport, in Orlando, Florida is studied in order to estimate its hydrodynamic and PM treatment
behavior. A CFD model for the existing condition of the pond is developed and applied based on
the existing bathymetry, geometrics and hydraulic configuration of the pond. The configured
CFD model is loaded by the same hetero-disperse PSD as the scaled physical model ponds.
The final component of this study examines the peak flow behavior of two existing quarry pond
configurations. The configurations are based on quarry ponds located near or on airports in
Florida. The specific locations are confidential by airport request, and with concurrence of the
project regulatory representatives.

Statewide Airport Stormwater Study FAA Pond Design Criteria – Water Treatment Modeling Report December 2010
Florida Department of Transportation – Aviation Office 8
4 Material and Methods
4.1 Hyetographs
4.1.1 Study Hyetographs
An initial component of this study is the definition of the hydrological loadings. The three
hyetographs selected are:
1. Triangular hyetograph with 0.5 inch of runoff volume and duration of 15 minutes. This
loading is selected as short and intense rainfall event during the wet season in Florida, where
more than half of the events are likely to be less extreme. A triangular shape is used to define
the design hyetograph as shown in Figure 1.
Time (hour)
0.00 0.05 0.10 0.15 0.20 0.25
Prec
ipita
tion
inte
nsity
(in/
hr)
0
1
2
3
4Total rainfall = 0.5 inta = 0.125 hrTd = 0.25 hr
5.0==d
a
Ttr
Figure 1 Triangular Design Hyetograph. Td is the rainfall duration, ta is the time to peak, and r is the storm advancement coefficient (Chow et al., 1988)
Td
ta

Statewide Airport Stormwater Study FAA Pond Design Criteria – Water Treatment Modeling Report December 2010
Florida Department of Transportation – Aviation Office 9
The maximum rainfall intensity of the triangular hyetograph is approximately 4 inches per hour
and the total excess precipitation depth is 0.5 inches. This is the same intensity used in roadway
“spread” calculations, since driving is considered difficult or impracticable at intensities above
this (FDOT, 2010). The hyetograph selected is considered a fairly extreme event, since 80% of
storm events occurring in Gainesville are characterized by a total precipitation depth equal or
less than 0.5 in. Figure 2 reported below depicts the frequency distribution of 1999-2008 hourly
rainfall data for Gainesville Regional Airport (GNV).
Rainfall depth, in
0.0001 0.001 0.01 0.1 1 10 100 1000
Cum
ulat
ive
freq
uenc
y di
strib
utio
n, %
0
20
40
60
80
100
Month1 2 3 4 5 6 7 8 9 101112
Mea
n #
of E
vent
s
05
1015202530
h rai
nfal
l (in
)
0
10
# eventsmean hrainfall
Figure 2 Frequency Distribution of Rainfall Precipitation for Gainesville, Florida on an hourly basis. The frequency distribution is obtained from a series of 1999-2008 hourly precipitation data for Gainesville Regional Airport (GNV)
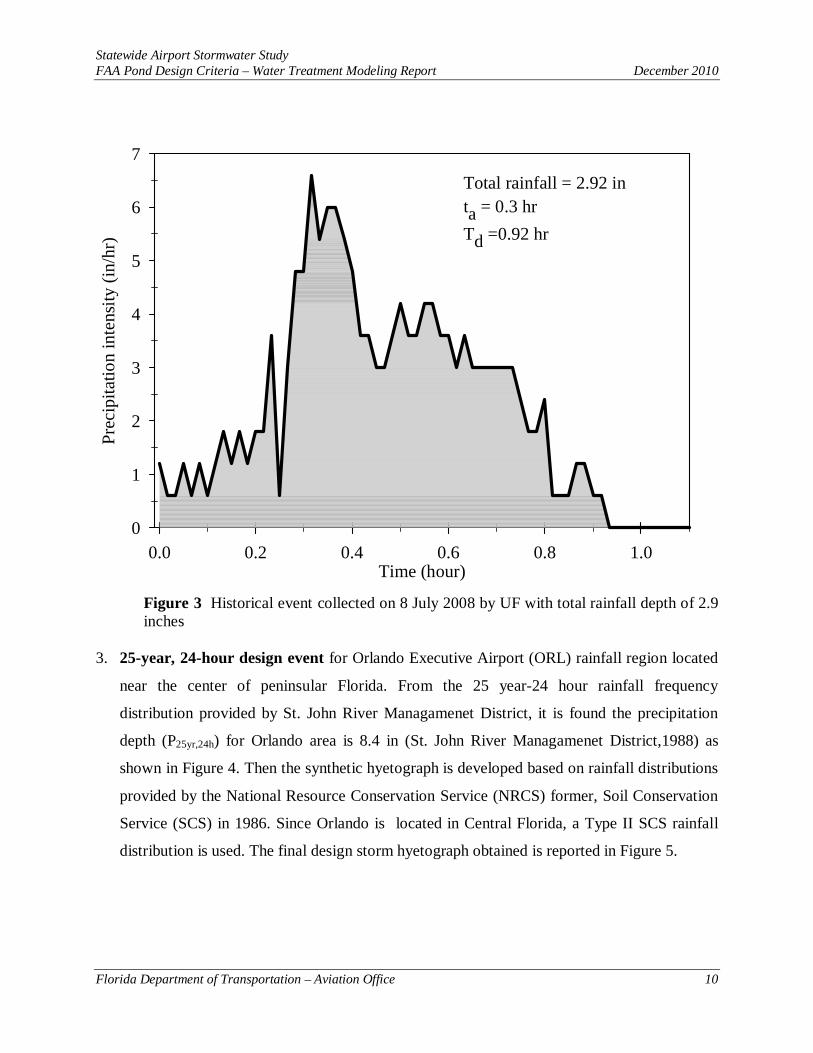
2. Historical event collected on 8 July 2008 by UF with total rainfall depth of 2.9 inches. This
event shown in Figure 3 is chosen since it is an extremely intense historical event, with a
peak rainfall intensity of about 6.5 in/h. This value is higher than peak precipitation intensity
of the 24 hour-25 year design storm described in the following paragraph.
Statewide Airport Stormwater Study FAA Pond Design Criteria – Water Treatment Modeling Report December 2010
Florida Department of Transportation – Aviation Office 10
Time (hour)0.0 0.2 0.4 0.6 0.8 1.0
Prec
ipita
tion
inte
nsity
(in/
hr)
0
1
2
3
4
5
6
7Total rainfall = 2.92 inta = 0.3 hrTd =0.92 hr
Figure 3 Historical event collected on 8 July 2008 by UF with total rainfall depth of 2.9 inches
3. 25-year, 24-hour design event for Orlando Executive Airport (ORL) rainfall region located
near the center of peninsular Florida. From the 25 year-24 hour rainfall frequency
distribution provided by St. John River Managamenet District, it is found the precipitation
depth (P25yr,24h) for Orlando area is 8.4 in (St. John River Managamenet District,1988) as
shown in Figure 4. Then the synthetic hyetograph is developed based on rainfall distributions
provided by the National Resource Conservation Service (NRCS) former, Soil Conservation
Service (SCS) in 1986. Since Orlando is located in Central Florida, a Type II SCS rainfall
distribution is used. The final design storm hyetograph obtained is reported in Figure 5.

Statewide Airport Stormwater Study FAA Pond Design Criteria – Water Treatment Modeling Report December 2010
Florida Department of Transportation – Aviation Office 11
Figure 4 25 year- 24 hour Rainfall frequency distribution (St. John River Water Management District,1988)

Statewide Airport Stormwater Study FAA Pond Design Criteria – Water Treatment Modeling Report December 2010
Florida Department of Transportation – Aviation Office 12
Time (hour)
0 5 10 15 20 25
Prec
ipita
tion
inte
nsity
(in/
hr)
0
1
2
3
4Total rainfall = 8.4 inta = 12 hrTd = 24 hr
Figure 5 25 Year – 24 hour Design Storm from SCS type II rainfall distribution for Orlando, Florida
4.2 Particle Size Distribution
4.2.1 PSD Selection
The influent particulate loading used throughout the entire study for CFD wet-pond simulation
runs and experimental full-scale physical model testing consists of a PSD that is in the silt-size
range. The PSD, ranging from less than 1 to 75 μm is reported in Figure 6. The PM specific
gravity is 2.63. The mass-based PSD is well described by a gamma distribution function (GF)
(Sansalone and Ying, 2008). The probability density function is given by Equation 1 as a
function of particle diameter d, where α is a distribution shape factor and γ a scaling parameter.
The cumulative gamma distribution function is expressed in Equation 2.

Statewide Airport Stormwater Study FAA Pond Design Criteria – Water Treatment Modeling Report December 2010
Florida Department of Transportation – Aviation Office 13
4.2.2 PSD Significance
PM is widely recognized as a primary vehicle for the transport and partitioning of pollutants and
PM is a pollutant itself that impacts the deterioration of receiving surface waters (EPA, 2000).
The potential for water chemistry impairment strongly depends on PM loading and PSD.
Furthermore, many PM-bound constituents, such as metals, nutrients and other pollutants,
partition to and from PM while transported by PM through rainfall-runoff events (Sansalone et
al., 2010; Ma and al., 2010; Dickenson et al., 2009; Sansalone and Buchberger, 1997). Therefore,
PSD plays an important role in the transport and chemical processes occurring in runoff and its
knowledge is crucial for the analysis and the selection of unit operations.
(1)( )
( )
( )γαα
αγ
Γ⋅
⎟⎠⎞
⎜⎝⎛
=
−−
ded
df
1
( ) ( )dxxfxFx
0∫= (2)

Statewide Airport Stormwater Study FAA Pond Design Criteria – Water Treatment Modeling Report December 2010
Florida Department of Transportation – Aviation Office 14
Particle Diameter, d (μm)0.1110100
% fi
ner b
y m
ass
0
20
40
60
80
100Silt PSD ( 75μm)
GF (α= 0.8, γ = 29)
Figure 6 Influent Silt PM PSD. PSD data are fitted by Gamma Function (GF) based on its distribution parameters, α, shape factor and β, scale factor.
4.3 Physical Model Description The linear FAA Pond physical model, illustrated in Figure 7, is a trapezoidal cross-section,
approximately 5.31 feet (1.62 m) tall and 24 feet (7.31 m) long. The scaled physical model of
Linear FAA Pond is designed with the following considerations:
• Total length to mid-depth width ratio is 8:1
• Trapezoidal section with bottom width 10% of top width (Top width = 6 feet)
• Side slopes are 2:1(horizontal to vertical)
• A maximum permanent pool depth of 4.3 feet
≥

Statewide Airport Stormwater Study FAA Pond Design Criteria – Water Treatment Modeling Report December 2010
Florida Department of Transportation – Aviation Office 15
The Crenellated Pond physical model, illustrated in Figure 8, is a rectangular tank,
approximately 6.13 feet (1.87 m) tall, 6 feet (1.8m) wide and 24 feet (7.31 m) long. Eleven
baffles are placed within the unit to avoid the potential for short-circuiting. The pond is designed
with the following considerations:
• Total length to mid-depth width ratio is 8:1
• Length to width ratio is 4:1 within the crenellations
• Side slopes are vertical within the rectangular crenellated sections
• A maximum permanent pool depth of 4.3 feet
• 11 Baffles (crenellations) with length of 4 feet (1.22 m) and inter-distance of 2 feet
(0.61 m)
Figure 7 Isometric view of Pilot-scale Physical Model of the Linear FAA Pond Configuration Model
Inlet
Outlet
5.31 feet
24 feet

Statewide Airport Stormwater Study FAA Pond Design Criteria – Water Treatment Modeling Report December 2010
Florida Department of Transportation – Aviation Office 16
Figure 8 Isometric view of Pilot-scale Physical Model of the Crenellated Pond Configuration
The design flow rate of the physical model is determined to be ~ 1.77 cfs (790 gpm),
corresponding to the hydraulic capacity of physical model as an open-channel system. The full-
scale physical model is located at the site at the Stormwater Unit Operations and Processes
Laboratory located at the University of Florida, in Gainesville Florida. A schematic process
diagram of the experimental setup is reported in Figure 9. The following photograph in Figure
10 further illustrates the scaled physical model.
Outlet
24 feet
2 feet
4 feet
6.13 feet
Inlet

Statewide Airport Stormwater Study FAA Pond Design Criteria – Water Treatment Modeling Report December 2010
Florida Department of Transportation – Aviation Office 17
Figure 9 Schematic representation of experimental site setup
Pumps, VFD
Municipal Water line
12,000 gal Supply Tank
12,000 gal Supply Tank
Slurry Tank
2” pipe
24’
6’
Flow meter 1 Flow meter 2Discharge
VFD
8” I.D. piping
Inlet (Particle
Injection)
Outlet (Effluent Sampling)

Statewide Airport Stormwater Study FAA Pond Design Criteria – Water Treatment Modeling Report December 2010
Florida Department of Transportation – Aviation Office 18
Figure 10 Photograph of the Linear FAA Pond physical scale model

Statewide Airport Stormwater Study FAA Pond Design Criteria – Water Treatment Modeling Report December 2010
Florida Department of Transportation – Aviation Office 19
4.3.1 Transformation of Rainfall Hyetographs to Runoff Hydrographs
The hyetographs reported in Figure 1, Figure 3 and Figure 5, are transformed as event-based
hydrographs by using Storm Water Management Model (SWMM) for each physical and CFD
model. The objective of the rainfall-runoff simulations is to generate unsteady runoff flow
loadings for the scaled physical model and CFD model. SWMM translates rainfall in runoff
given specific catchment properties (FDOT, 2007).
In this transformation from rainfall to runoff for the scaled physical Ponds the watershed area is
matched to deliver peak runoff flow rate equal to the design flow rate of the unit operation
(physical model of FAA pond). As shown in Section 3.1.1, the July 8th 2008 historical
hyetograph is characterized by the highest rainfall peak intensity (approximately 6.5 in/h) in
comparison to the other selected hyetographs. Therefore, the historical hyetograph is utilized as
reference to perform the flow scaling of the physical testing model. Since the maximum
hydraulic capacity of the physical models is ≈ 800 gallons/minute (1.8 cfs), the area of the
catchment implemented in SWMM is defined to deliver peak flow rate approximately equal to
800 gallons/minute for the historical storm of 8 July 2008.
Modeling parameters adopted are based on an asphalt-pavement typical of a runway/taxiway.
The Green-Ampt method is used to model the infiltration process (Teng and Sansalone, 2004;
FDOT, 2007). The rainfall-runoff modeling results for the three hyetographs are shown in
Figure 11.

Statewide Airport Stormwater Study FAA Pond Design Criteria – Water Treatment Modeling Report December 2010
Florida Department of Transportation – Aviation Office 20
Flow
rate
(gpm
)
0
200
400
600
800
1000
1200
1400
Rai
nfal
l Int
ensi
ty (i
n/hr
)
0
2
4
6
8
10
12
14
t/tmax0.0 0.2 0.4 0.6 0.8 1.0
Flow
rate
s (gp
m)
0
200
400
600
800
Rai
nfal
l Int
ensit
y (in
/hr)
0
2
4
6
8
10
t/tmax
0.0 0.2 0.4 0.6 0.8 1.0
Rai
nfal
l Int
ensi
ty (i
n/hr
)0
2
4
6
8
10
Flow
rate
s (gp
m)
0
200
400
600
800
Figure 11 Loading Hydrologic Events utilized (Triangular Hyetograph (A), Historical 8 July 2008 Loading Hydrologic Event Collected by UF (B) and 24 Hour, 25 Year Loading Hydrologic Event (C)) for full-scale physical model of Linear FAA Pond and Crenellated Pond Configurations. The SWMM Rainfall-Runoff modeling is based on modeling parameters for asphalt-pavement of a typical airport runway/taxiway (FDOT, 2007).
(A)
(B)
(C)
Qp = 449 gpm Ttot = 93 min V = 3,998 gal
Qp = 792 gpm Ttot = 248 min V = 23,518 gal
Qp = 482 gpm Ttot = 1570 min V = 67,575 gal

Statewide Airport Stormwater Study FAA Pond Design Criteria – Water Treatment Modeling Report December 2010
Florida Department of Transportation – Aviation Office 21
Figure 11 illustrates the hydrograph (B) generated in SWMM for historical event presents a peak
flow rate equal to the maximum hydraulic capacity of 1.77 cfs (50 L/s). The hyetograph (A)
generates a peak flow rate of about 0.98 cfs (28 L/s), while hyetograph (C) generates a peak flow
rate of 1 cfs (30 L/s).
4.4 Wet pond at the Orlando Executive Airport The area of interest is the Orlando Executive Airport (ORL) located in Orlando, Fl (28°32′44″N
081°19′59″W). It covers an area of 1,055 acres (427 ha) at an elevation of 113 feet (34 m) above
mean sea level. It has two asphalt paved runways: 7/25 is 6,003 by 150 feet (1,830 x 46 m) and
13/31 is 4,638 by 100 feet (1,414 x 30 m). In 2009 ORL had more than 108,000 aircraft
operations constituted by general aviation, air taxi and military. The ORL includes parking lots
and commercial areas besides areas dedicated to airport activities. The ORL drainage system
consists of a network of piping discharging into 4 wet ponds in series and Lake Underhill as the
receiving water.
The pond of interest in this study is the downstream one named South Treatment Pond (STB).
The area drained by this wet pond consists of 124 acres of pavement/impervious areas, 19 acres
of roofs, 57 acres of vegetated areas and 31 acres of water (Figure 12). Details of the major
downstream ponds are shown in Figure 13Figure . Each upstream pond has multiple inlets and it
is connected to the downstream ones through a system of 3-6’X 6’box culverts. The STB has a
storage capacity of around 68 acre feet, a water depth of 97.4” at normal pool elevation and an
area of around 11.4 acres (Figure 13). The conveyance system consists of 3-6’x 6’box culverts
discharging into an open channel that directly flows into the lake. A flow/level control system
consisting of a 90˚ V-notch weir is installed in the STB. The weir has a maximum elevation of
97.4”. When the water level in the pond reaches this elevation, the system overflows the weir
that is submerged and the conveyance system in this case consists of the box culverts as for the
upstream ponds. Over this elevation the whole system hydraulically can be considered as 5
connected storage tanks controlled by the level of the downstream one that in this case is Lake
Underhill.

Statewide Airport Stormwater Study FAA Pond Design Criteria – Water Treatment Modeling Report December 2010
Florida Department of Transportation – Aviation Office 22
4.4.1 Hydrologic-hydraulic simulation
The runoff flow rate at the inlet of the STB for different design storms is calculated through the
SWMM model. The drained area is then subdivided in 8 catchments whose end sections are
inlets to the upstream ponds, named north Ponds (NB1 and NB2) and mixing Pond (MB) as
shown in Figure 14. Each catchment is subdivided in several sub-catchments as a function of the
drainage system and elevations. A total number of 26 sub-catchments are considered and details
on the land use of each one of these areas are reported in Table 1.
In Figure 15 the connectivity diagram of the SWMM model is shown with the major catchments
highlighted in red.
The soil characterization of the drained area is reported in Figure 16. Three different soils,
Millhopper, St. Lucie and Tavares characterize the area of interest.
Hydrologic characteristics of each area depending on the different soil are reported in Table 22 .
The dynamic wave model is chosen for the flow routing while Green Ampt is chosen to model
the infiltration.
The investigated hydrologic event is the 25 yr-24 hr storm. The resulting hydrograph simulated
through SWMM is shown in Figure 17. The hydrograph is characterized by a peak flow rate
equal to 241 cfs.

Statewide Airport Stormwater Study FAA Pond Design Criteria – Water Treatment Modeling Report December 2010
Florida Department of Transportation – Aviation Office 23
Figure 12 Plan View of Orlando executive airport (ORL) with the area drained by the wet pond of interest highlighted in red

Statewide Airport Stormwater Study FAA Pond Design Criteria – Water Treatment Modeling Report December 2010
Florida Department of Transportation – Aviation Office 24
Figure 13 Plan view of Orlando Executive Airport (ORL) Pond system. Details of the three major ponds (NB = North Pond 2, MB = Mixing Pond, STB = South Treatment Pond, I =
Influent, O = Outlet, S= Storage) and the inlets and outlets of each pond.

Statewide Airport Stormwater Study FAA Pond Design Criteria – Water Treatment Modeling Report December 2010
Florida Department of Transportation – Aviation Office 25
Figure 14 Drained area subdivision as a function of the drainage system. Each catchment end section is the inlet of the ponds

Statewide Airport Stormwater Study FAA Pond Design Criteria – Water Treatment Modeling Report December 2010
Florida Department of Transportation – Aviation Office 26
Catchments Sub-catchments
Area (acre)
Roof (%)
Pavement (%)
Vegetated (%)
NB1-I 1 2.84 55.88 44.12 0.00 2 16.25 6.27 93.73 0.00
NB1-II 1 8.78 0.00 2.26 97.74
NB1-III 1 12.60 12.30 23.55 64.15 2 4.63 23.10 47.66 29.24 3 3.90 32.97 67.03 0.00
NB2-I 1 3.72 10.46 84.64 4.91 2 6.36 0.00 86.21 13.79
NB2-II 1 12.95 4.24 80.47 15.29
NB2-III
1 4.24 0.00 92.85 7.15 2 6.54 19.18 77.12 3.70 3 7.41 10.13 75.25 14.63 4 7.49 9.41 90.59 0.00
MB-I
1 8.72 0.00 26.16 73.84 2 8.10 12.14 71.44 16.42 3 5.52 7.50 40.34 52.16 4 2.97 9.11 46.65 44.24
MB-II
1 7.07 0.00 51.08 48.92 2 10.50 0.00 23.68 76.32 3 8.27 0.00 100.00 0.00 4 8.73 0.00 100.00 0.00 5 14.43 11.84 70.39 17.77 6 10.48 24.82 60.11 15.06 7 4.34 21.12 39.01 39.87 8 8.81 5.21 41.16 53.64 9 4.03 33.23 53.82 12.95
Table 1 Sub-catchment characteristics in terms of extensions and land uses

Statewide Airport Stormwater Study FAA Pond Design Criteria – Water Treatment Modeling Report December 2010
Florida Department of Transportation – Aviation Office 27
Figure 15 Connectivity diagram of the SWMM model with the catchments subdivision highlighted in red

Statewide Airport Stormwater Study FAA Pond Design Criteria – Water Treatment Modeling Report December 2010
Florida Department of Transportation – Aviation Office 28
Figure 16 Orlando Executive Airport soil characterization

Statewide Airport Stormwater Study FAA Pond Design Criteria – Water Treatment Modeling Report December 2010
Florida Department of Transportation – Aviation Office 29
Parameter
Millhopper
St. Lucie
Tavares Area 97.33 acre 76.70 acre 25.70 acre % Impervious 66.07 70.5 93.65 Evaporation Daily Daily Daily Design Storm 25-year, 24-hr 25-year, 24-hr 25-year, 24-hr Total Precipitation 8.4 in 8.4 in 8.4 in Rainfall Distribution SCS Type II SCS Type II SCS Type II Infiltration Algorithm Green Ampt Green Ampt Green Ampt Flow Routing Dynamic Wave Dynamic Wave Dynamic Wave
Table 2 SWMM model information and algorithms utilized for hydrologic characteristics of the drained area as a function of the different soils.
Soil Type

Statewide Airport Stormwater Study FAA Pond Design Criteria – Water Treatment Modeling Report December 2010
Florida Department of Transportation – Aviation Office 30
Time (hrs)
0 5 10 15 20 25 30
Flow
Rat
e (c
fs)
0
100
200
300
400
5000 5 10 15 20 25 30
i rai
n (in
/hr)
0
2
4
6
8
10
Flow RateRainfall
Vin = 3.49 x 106 ft3
Qpeak= 241 cfs
Figure 17 Hyetograph and simulated hydrograph for the 24 Hour, 25 Year Hydrologic Event.
4.5 Generic Rectangular and Triangular Quarry Ponds The two generic rectangular and triangular quarry Ponds are selected to be modeled in CFD
under steady conditions. The flow rates selected represent the peak flow rate of the 25 year – 24
hour design storm. In particular, the flow rate for the rectangular quarry Pond is 158 cfs, while
the flow rate for the triangular quarry Pond is 821 cfs.
4.6 Physical Model Methodology The data for this study are collected at the Stormwater Unit Operations and Processes Laboratory
located at the University of Florida, in Gainesville Florida. The site footprint area is of 8,911 ft2,
consisting of a 40 by 60 feet concrete pad covered by a roof. A two storied 20 by 20 foot tower
building is used as a multipurpose lab for engineered media preparation, particle mixture

Statewide Airport Stormwater Study FAA Pond Design Criteria – Water Treatment Modeling Report December 2010
Florida Department of Transportation – Aviation Office 31
preparation and as a storage space. There is a data acquisition room, 10 by 6 foot within the
concrete pad, with A/C control for collecting the data during each run. The site is also provided
with two 12,000-gallon water tanks fed by a pressured municipal water supply line and power (3
phase 208 volt 200 amps). Figure 18 is the basic layout of the experimental site:
Experimental runs are performed on the full-scale physical models at unsteady influent hydraulic
conditions at a temperature of 20 ˚C. The systems are hydraulically loaded with three
hydrographs illustrated previously. Their formulation is based on the maximum hydraulic
capacity for the given treatment system 1.76 cfs (50 L/s).
4.6.1 Description of the Equipment and Components
This section outlines the core components of the physical model hydraulic control system.
4.6.1.1 Duplexing Booster Pumping Station with Programmable Logic Control (PLC) System
The site is engineered with a low-head liquid/slurry delivery system which has capability to
deliver accurate flow rates under low total dynamic head conditions for a wide range of flow
rates from 33 to 1300 gallons per minute. Flow rates lower than 33 gpm are achieved by using a
2 inch feedline and valve. The system is equipped with a duplex, constant flow booster pumping
station with two variable speed Berkley centrifugal pumps which operate in parallel (300 gpm,
Figure 18 Site layout of the Stormwater Unit Operations and Processes Laboratory at the University of Florida

Statewide Airport Stormwater Study FAA Pond Design Criteria – Water Treatment Modeling Report December 2010
Florida Department of Transportation – Aviation Office 32
4" Suction, 3" Discharge, 3 HP (horsepower) and 1000 gpm 8" Suction, 6" Discharge, 10 HP
respectively) for controlling the water inlet into the physical model Pond. A series of two
magnetic flow meters, valves, and VFDs (variable frequency drives) are integrated with the PLC
to support the testing applications by providing a feedback control loop to maintain the desired
flow rates and for logging real-time data. The flow rate measurements are recorded on a Micro-
Logger with a logging frequency of 1 second. Before a run, the PLC is pre-programmed with the
target influent unsteady flow rate.
4.6.1.2 Slurry Mixing and Feeding system
The slurry mixing and feeding system consists of a 65 gallon conical bottom HDPE slurry tank
and two (one internal and one external) mixing pumps which provide vertical and horizontal
mixing to keep the particles in suspension within the tank while slurry is being injected into the
system. Internal mixing is provided by a 1HP 2” discharge ABS JC-11W submersible pump and
external mixing is done with the help of a small straight centrifugal pump (3608 series). The
slurry mixing system is located above the roof of the Stormwater Unit Operations and Processes
Laboratory at an elevation of 15 feet above the facility slab. This slurry mixing system suspends
the PM slurry and provides a consistent PM concentration and PSD profiles.
4.6.1.3 Mx Ultramag Meters for Flow Rate
The Mx UltraMag incorporates microprocessor technology which offers a broad range of flow
rate tracking from low flows (30 gpm) to high velocity flows (well over the 1500 gpm capability
of the system). The two flowmeters are equipped with a remotely mounted signal converter that
indicates both rates of flow and total flow as well as providing analog and pulse outputs. The Mx
UltraMag electromagnetic flow meter is an obstruction-less, volumetric flow measuring device
that is capable of measuring the flow rate of almost all conducting liquids and slurries with a
high degree of accuracy. Compact, high-density field coils generate a magnetic field across the
flow tube. The moving flow generates a voltage which is then amplified and converted to give a
direct flow rate reading with 4 to 20 mA and frequency outputs. The signal converter is remotely
mounted up to 300 feet from the meter and is factory programmed for every meter. This signal is
split by a multiplexor to simultaneously communicate with the PLC pump controller and the CR
3000 data logger.

Statewide Airport Stormwater Study FAA Pond Design Criteria – Water Treatment Modeling Report December 2010
Florida Department of Transportation – Aviation Office 33
4.6.1.4 MJK Level Transmitter
A 30 kHz ultrasonic sensor (model Shuttle Level Transmitter, manufactured by MJK Inc.) is
placed at the effluent section of the physical model to acquire effluent water level measurements.
After appropriate installation and calibration of the sensor, the ultrasonic sensor is utilized to
record at 1 second intervals the effluent water levels. The water level data are then transformed
to effluent flow rates according to a calibration curve previously obtained.
4.6.1.5 YSI 600 OMS Probe
YSI 600 OMS probe is a multi parameter water quality monitoring device equipped with a 6136
Turbidity Sensor for accurate, in-situ measurement of turbidity. The OMS also incorporates
sensors for the measurement of conductivity and temperature. It has a built-in memory that can
store the data it records. Temperature data is an important input variable for various types of
models such as a CFD model and surface overflow rate (SOR) based-models. Conductivity data
can be used to experimentally measure hydraulic residence time distributions. Influent and
effluent turbidity data can be used to develop a relationship between particle concentration and
turbidity which can be eventually used as a tool to continuously monitor the influent and effluent
particle concentration profile throughout the entire duration of the treatment run under steady- or
non-steady state conditions. The data stored in the YSI is downloaded after each run.
4.6.2 Data Acquisition and Management
All the necessary data for the experimental run are collected in the data acquisition room with
help of the data acquisition notebook computer which has the necessary software platforms
installed. The following primary data for the experiment are collected.
4.6.2.1 Downloading the Recorded Turbidity Data
The YSI is programmed before every run with field details and calibrated to start logging data.
After each run the data are uploaded from the YSI with the data acquisition notebook computer
which is installed with Eco Watch, a PC software interface for YSI.

Statewide Airport Stormwater Study FAA Pond Design Criteria – Water Treatment Modeling Report December 2010
Florida Department of Transportation – Aviation Office 34
4.6.2.2 The Programmable Micro-Logger for Flow Rate
The PLC is preset with a target flow rate for a particular test run. The CR3000 Micrologger is a
data logger, manufactured by Campbell Scientific Inc. This is used as the real-time data
monitoring and data collection unit. The CR3000 is powered for constant operation by 110-V
AC power with a 12-V DC battery backup. Data are transferred from the data logger to a data
acquisition notebook computer using a data transfer cable with the help of LoggerNet v3.0, a
data monitoring and acquisition program compatible with the CR3000 Micrologger. This
particular data logger system provides 4-20 mA current inputs via a 100 Ohm shunt resistor as
well as multiple voltage inputs which enables it to simultaneously measure flow from two
sensors, log sample events from two automatic water samplers, and log input from a high
frequency velocity probe.
An initial Quality assurance/ Quality Control (QA/QC) check is performed following each data
download to ensure that the acquired data is reasonable. This is done by routinely checking for
any outliers, spikes, questionable values, or incomplete data in the logged data that would
indicate erroneous measurement or configuration of the data logging system.
4.6.3 Calibration Procedures and Verification
4.6.3.1 Calibration of Flow Measurement Devices
As already mentioned the flow rate is motivated by a duplex, constant flow booster pumping
station with a PLC. After initially installing the system it is volumetrically calibrated as follows.
The data acquisition notebook computer is connected with CR3000 data logger, and real-time
flow data in terms of mV are measured using the flow meter and monitored on the Logger Net
c3.0 software and the graphical user interface. The rectangular container for volumetric
calibration is characterized by a surface area of 22,200 in2, and volume of 1,198,800 in3.
Prior to flow rate calibration at a specific flow rate, flow is directed to bypass the rectangular
clarifier used for calibration unit until a steady flow rate is achieved. Once steady state is
achieved flow is directed to the clarifier. The calibration curves obtained for each flow meter are
shown in Figure 19.

Statewide Airport Stormwater Study FAA Pond Design Criteria – Water Treatment Modeling Report December 2010
Florida Department of Transportation – Aviation Office 35
1st Flow meter
400 500 600 700 800G
PM
0
100
200
300
400
500
600
700
800
GPM vs mV
2nd Flow meter
mV400 500 600 700 800
0
100
200
300
400
500
600
700
800
GPM vs mV
Figure 19 Flow calibration curves for the two Mx UltraMag flow meters developed from volumetric calibration at the Stormwater Unit Operations and Processes Laboratory at UF
4.6.3.2 Calibration of Slurry Mixing and Injection System
The slurry mixing and injection system is calibrated to deliver slurry composed of the NJCAT
gradation. The rate of slurry addition to the drop box is controlled by a peristaltic pump
manufactured by Eccentric Pumps driven by a VFD. The rate of slurry injection is controlled by
the frequency of the VFD and is calibrated volumetrically.
y = 2.234 x – 888.2 R2 = 0.999
y = 2.213 x – 882.3 R2 = 0.999

Statewide Airport Stormwater Study FAA Pond Design Criteria – Water Treatment Modeling Report December 2010
Florida Department of Transportation – Aviation Office 36
Figure 20 is the result in liters per minute (LPM) and gallons per minute (GPM) of duplicate
calibration experiments on the slurry injection system for flow rate for specified Hz input to the
slurry pump VFD.
Hz0 20 40 60
L/m
in o
r gpm
0
2
4
6
8
10
lpm lpm gpm gpm
Figure 20 Calibration of Slurry Injection Pump by volumetric calibration at the Stormwater Unit Operations and Processes Laboratory
4.6.4 Slurry Mixing and Injection System
The experiments are conducted at constant concentration of 200 mg/L and constant influent
particle size distribution (PSD) of PM. The PM influent gradation utilized is a silt gradation
ranging from 0.1 to 75 μm with a d50 of 15 μm as shown in Figure 6. The particulate specific
gravity is 2.63 g/cm3. The silica particles are purchased from US Silica. The slurry mixing and
feeding system consists of a 65 gallon conical bottom HDPE slurry tank and two (one internal
and one external) mixing pumps which provide vertical and horizontal mixing to keep the
particles in suspension within the tank while slurry is being injected into the system. Internal
mixing is provided by a 1HP 2” discharge ABS JC-11W submersible pump and external mixing
is done with the help of a small straight centrifugal pump (3608 series). The slurry mixing
system is located on the roof of the Stormwater Unit Operations and Processes Laboratory. This
slurry mixing system suspends the silt slurry and makes the particle concentration profiles
consistent. The slurry mixing and injection system is calibrated to deliver slurry composed of the

Statewide Airport Stormwater Study FAA Pond Design Criteria – Water Treatment Modeling Report December 2010
Florida Department of Transportation – Aviation Office 37
silt gradation. The rate of slurry addition to the drop box is controlled by a peristaltic pump
manufactured by Eccentric Pumps driven by a VFD. The rate of slurry injection is controlled by
the frequency of the VFD and is calibrated volumetrically. The VFD is also connected to the
PLC system of the pumping station and controls the unsteady rate of slurry varying according to
the flow rate.
4.6.5 Sampling Methodology and Protocol
The sampling is conducted according to the following procedure. During the test running time,
representative effluent samples are taken manually across the entire cross section of the effluent
section of the unit as discrete samples in 1L wide mouthed bottles. Samples are collected in
duplicate through the entire duration of the run at variable time sampling frequency according to
the flow rate gradients and event duration to provide a reasonable estimate of effluent variability
of PM concentration and PSD. The minimum sampling time interval is 1 minute.
The sampling protocol used to characterize the supernatant PSD consists of taking a duplicate
sample at the geometric midpoint of the supernatant after overnight settling. In particular, four
PSD and SSC duplicate samples are taken at four evenly spaced intervals of height of the stored
supernatant volume.
4.6.6 Mass Recovery and Sample Protocol
After the supernatant sample has been collected, the wet slurry from the system is recovered
from the bottom of the unit by manually sweeping it through the washout points into buckets and
taken to the laboratory where they are allowed to stand for quiescent settling and dried in glass
trays at 105 degrees Celsius in an oven. After the slurry completely dries, the dry silica is
disaggregated and collected in pre-weighed glass bottles and the gross weight is recorded to find
the overall PM separation of the system based on mass and for the mass balance. Laser
diffraction analysis for the collected dry sample is then performed to analyze the PSD of the
captured particle.
4.6.7 Laboratory Analysis
The experimental analyses include PSD measurements for influent, effluent and captured PM by
laser diffraction analysis, effluent gravimetric analysis based on PM concentration as suspended

Statewide Airport Stormwater Study FAA Pond Design Criteria – Water Treatment Modeling Report December 2010
Florida Department of Transportation – Aviation Office 38
solid concentration (SSC). SSC analysis is performed to quantify particle concentration for each
effluent composite sample as collected from each run and to calculate the effluent mass load for
the operating flow rates. Fully characterizing the entire PSD and utilizing SSC allow a mass
balance to be conducted which is not possible when utilizing an index component and method of
PM, such as total suspended solids, TSS. The protocol specifically followed for this laboratory
analysis is the ASTM D 3977 (ASTM, 2002).
To perform the PSD analysis the Malvern Mastersizer 2000, a commercial laser diffraction
analyzer is utilized in this experimental analysis. The instrument technology is based on laser
diffraction, occurring when a laser beam passing through a dispersion of particles in air or in a
liquid is diffracted at the particle surface. The angle of diffraction is influenced by the size and
the shape of the particle. As the particle size decreases, the scattering angle increases
(Jillavenkatesa et al., 2001). The Mastersizer 2000 detects particle sizes in the range of ~0.02 to
2000 μm in spherical diameter. The 10 duplicate samples are analyzed independently in the
Mastersizer 2000 as 20 one liter samples. During a sample measurement, the instrument is
programmed to characterize the PSD three times. These three PSD curves are then analyzed for
stability to ensure that the measurement settings for the instrument are adequately suited for the
sample and to ensure that any bubbles that might be present and affect the reliability of the
measurement are purged from the system. The three measured and stable PSDs for the
individual sample are averaged into a representative curve for that sample. An event mean PSD
is generated from averaging the individual Mastersizer measurements (both A and B).
Finally, the captured PSD is measured with the laser diffraction analyzer in dry phase. In order to
representatively sub-sample the dry mass the silica is uniformly mixed to obtain a sub-sample as
representative as is physically obtainable. Duplicate 20 gram samples are taken for the dry phase
of the laser diffraction analyzer. The dry dispersion cell is connected to the laser diffraction
analyzer and the dry sample is measured by forming a PM aerosol with a high pressure, high
velocity air stream. The PSDs measured are observed for stability and averaged.
4.6.8 Verification of Mass Balance for each Experimental Run
A mass balance evaluation is conducted to ensure representative and defensible event-based
treatment performance results for the unit. The PM mass balance is calculated from dried

Statewide Airport Stormwater Study FAA Pond Design Criteria – Water Treatment Modeling Report December 2010
Florida Department of Transportation – Aviation Office 39
captured mass, effluent mass load, and supernatant mass load. The mass balance error (MBE)
criterion is ±10% MBE and determined by the following equation (Kim and Sansalone, 2008):
( ) 100×−+
=load mass Influent
load mass Influentload mass Captured load mass Effluent (%) BEM
4.6.9 Verification of PSD Balance for Each Run
The gravimetric PSD of the effluent, supernatant and recovered mass is measured and compared
with that of the influent to verify the balance of influent and effluent PSDs. This QC
measurement is performed by quantifying the deviation between the representative silt influent
loading and the summation PSD of the effluent, recovered, and supernatant mass.
( )
∑
∑
=
=
++= n
1ii
n
1iiiii
error
PSDInfluent
PSDt Supernatan PSD Recovered PSDEffluent - PSDInfluent PSD
In this expression each i is a discrete measurement at a specific particle size of the cumulative
PSD.
Measured results including temporal effluent PSD, PM and SSC obtained from the physical
modeling testing are utilized to validate the CFD model parametric analysis.
4.7 CFD modeling CFD is a branch of the analysis of fluid dynamics widely used in many disciplines such as
aerodynamics and airplane engineering design applications and it rapidly emerged with the
development of computer-related technologies and the advancement of solving ordinary and
partial differential equations (ODE and PDE). CFD represents a proven and versatile technology
to model fluid flow field encountered in different applications, such as discrete particles, heat-
transfer, mixed fluid flow, drag, combustion, and many other fluid phenomena.
4.7.1 CFD governing equations
CFD is based on numerically solving Navier-Stokes (N-S) equations across a computational
domain. In this study, the Reynolds Averaged Navier Stokes (RANS) formulation is utilized to
(3)
(4)

Statewide Airport Stormwater Study FAA Pond Design Criteria – Water Treatment Modeling Report December 2010
Florida Department of Transportation – Aviation Office 40
solve the flow field with Fluent 12.1. The RANS conservation equations are obtained from the
N-S equations, by applying the Reynolds decomposition which decomposes the fluid flow
properties into their time-mean value and fluctuating component. The mean velocity is defined as
a time average for a period T which is larger than the time scale of the fluctuations. The time
average of the fluctuations over T tends to zero meaning the turbulence components do not
contribute to the bulk mass transport. The time-dependent RANS equations for continuity and
momentum conservation are reported below:
( ) ,0=∂∂
ii
ux
ρ
( ) ij
i
iij
jji
j
i gx
uxpuu
xuu
xtu
ρμρρρ +∂
∂+
∂∂
−=⎟⎠⎞
⎜⎝⎛
∂∂
+∂
∂+
∂∂
2
2''
In these expressions ρ is fluid density, xi is the ith direction vector, uj is the Reynolds averaged
velocity in the ith direction; pj is the Reynolds averaged pressure; and gi is the sum of body
forces in the ith direction. The decomposition of the momentum equation with Reynolds
decomposition generates the Reynolds stresses term, ''jiuuρ− , from the nonlinear convection
component. Since the Reynolds stresses are unknown variables, the realizable k-ε model
proposed by Shih et al. (1995) is used to resolve the closure problem. The realizable k-ε model
consists of a turbulent kinetic energy equation and a turbulence energy dissipation rate equation,
respectively reported below (Shih et al., 1995):
εσ
ν−
∂∂
−⎟⎟
⎠
⎞
⎜⎜
⎝
⎛
∂∂
∂∂
=∂∂
+∂∂
j
iji
jkjjj x
uuu
xk
xxku
tk T ''
νε
εεεσνεε
ε +−⋅+
⎟⎟
⎠
⎞
⎜⎜
⎝
⎛
∂∂
∂∂
=∂∂
+∂∂
kCSC
xxxu
t jT
jjj
221
where
(5)
(6)
(7)
(8)

Statewide Airport Stormwater Study FAA Pond Design Criteria – Water Treatment Modeling Report December 2010
Florida Department of Transportation – Aviation Office 41
ijij SSSkSC ⋅⋅=⋅=⎥⎦
⎤⎢⎣
⎡+
= 2,,5
,43.0max1 ε
ηη
η
In these expressions the constants are: σk = 1.0, σε = 1.2 and C2 = 1.9. In these equations, k is the
turbulent kinetic energy; ε is the turbulent energy dissipation rate; S is the mean strain rate; νT is
the eddy viscosity; ν is the fluid viscosity; and uji and uj′u′i are defined in Equations 7-9. Hence,
the turbulent flow field is determined by solving a system of four equations including the
governing equations (See Equation 5-6) and the k- ε turbulence model (See Equation 7-8). The
numerical solver used in the current study is the pressure based solver, which is well-suited for
incompressible flows governed by motion based on pressure gradients. The used spatial
discretization schemes are the second order for the pressure, the second order upwind scheme for
the momentum, the turbulence energy and the specific dissipation and the Semi-Implicit Method
for Pressure-Linked Equations (SIMPLE) algorithm for pressure-velocity coupling. For temporal
discretization of the governing equations the second-order implicit scheme is utilized. The
solutions are considered converged when the scaled residuals for all governing equations are
below 1*10-3 (Ranade, 2001).
4.7.2 Discrete phase model (DPM)
In CFD, DPM is used to simulate three-dimensional trajectories of discrete phase particles
through the computational domain and to model particle separation. DPM is based on Euler-
Lagrangian approach. While the aqueous phase is treated as a continuum in an Eulerian frame
and solved by integrating the time-averaged Navier-Stokes equations (Equation 5-6), the
particulate phase is studied as a discrete phase in a Lagrangian reference frame. The assumptions
of the Lagrangian particle tracking approach are:
The particles are spherical
The particle motion is influenced by the continuous fluid phase, but the continuous
fluid phase is not affected by the particle motion (one-way coupled model)
Particle-particle flocculation is neglected; therefore, dispersed phase is assumed to
be sufficiently dilute by checking the volume fraction is less than 10-12% (Brennen,
2005)
Particle-wall interaction is neglected except for reflection
(9)

Statewide Airport Stormwater Study FAA Pond Design Criteria – Water Treatment Modeling Report December 2010
Florida Department of Transportation – Aviation Office 42
DPM integrates the governing equation of motion for the dispersed phase and tracks individual
particles through the flow field by balancing the forces acting on them, such as gravitational
body force, drag force, inertial force, and buoyancy. The trajectory of particles is calculated by
integrating the force balance equation written below in the ith-direction:
( ) ( )p
pipiiDi
pi gvvF
dtdv
ρ
ρρ −⋅+−⋅=
The first term on the right-hand side is the drag force per unit particle mass, in which FDi is
defined in Equation 11. The second term is buoyancy/gravitational force per unit particle mass.
24Re18
2iDi
ppDi
C
dF
⋅⋅=
ρ
μ
where Rei, Reynolds number for a spherical particle, and CDi, drag coefficient are respectively
given by:
μ
ρ ipipi
vvd −⋅=Re
3221
ReReK
KKC
iiiD ++=
In Equations 10-13, ρ is the fluid density, ρp is particle density, vi is fluid velocity, vpi is particle
velocity dp is particle diameter, μ is the dynamic viscosity, K1, K2, K3 are empirical constants for
spherical particles as function of Rei.
4.7.3 Model Implementation
The methodology of using CFD for analysis comprises three general steps: geometry and mesh
generation (pre-processing), setting-up and solving a physical model (processing) and finally,
post-processing the modeled data.
This study utilizes FLUENT 12.1 and GAMBIT 2.0 algorithms (Fluent Inc., NH, USA) to
perform the CFD analysis. GAMBIT 2.0 is used for solid geometry creation and meshing, while
for FLUENT 12.1 for solving the system of time averaged governing equations (RANS-based
model) through the numerical method of finite volume difference elements.
(10)
(11)
(12)
(13)

Statewide Airport Stormwater Study FAA Pond Design Criteria – Water Treatment Modeling Report December 2010
Florida Department of Transportation – Aviation Office 43
4.7.3.1 Geometry and Mesh Generation for Linear and Crenellated Ponds
The physical geometry of the Linear and Crenellated ponds is built in the GAMBIT
environment. Particular attention is placed in building elements that can be easily discretized and
do not generate eventual meshing abnormalities, such as high skewness and poor aspect ratios.
The geometry created in the computational domain represented the volume occupied by the flow.
To discretize the geometry, the complex domain of the control volume is spatially subdivided
into a set of discrete simple-shaped cells of pre-defined topology. These cells are referred to as
mesh elements and are adjacently connected to each other. The mesh generated is completely
comprised of tetrahedral elements, which is a non-uniform meshing scheme where the nodes do
not reside on a grid. A high quality mesh is important to the accuracy and convergence of the
finite element computation and any aberration within the mesh will negatively impact the final
result. This mesh is checked to ensure that equiangle skewness and local variations in cell size
are minimized to produce a high quality mesh. In addition, several iterations of grid refinement
are performed to determine the necessary mesh density that balances the accuracy of the solution
with the exponentially increasing demand of computational resources.
Figure 21 shows the isometric views of meshed geometry for both Pond configurations to
illustrate the meshing process. The system as a whole is discretized into approximately 3 million
cells for FAA linear Pond and 3.5 million cells for Crenellated Pond.

Statewide Airport Stormwater Study FAA Pond Design Criteria – Water Treatment Modeling Report December 2010
Florida Department of Transportation – Aviation Office 44
Figure 21 Isometric Section of the Pilot-scale Physical Model of the FAA Linear Pond (A) and Crenellated Configuration (B) Models built in GAMBIT environment.
The figure shows that the mesh used to model this geometrically complex domain is comprised
of tetrahedral elements and characterized by a non-uniform meshing scheme. Elements for the
FAA Linear Pond Model are 3 millions and Elements for the Crenellated Configuration Model
are 3.5 million.
Free surface
Vertical Wall
Free surface
Side Slope
Statewide Airport Stormwater Study FAA Pond Design Criteria – Water Treatment Modeling Report December 2010
Florida Department of Transportation – Aviation Office 45
4.7.3.2 Geometry and Mesh Generation for ORL Wet Pond
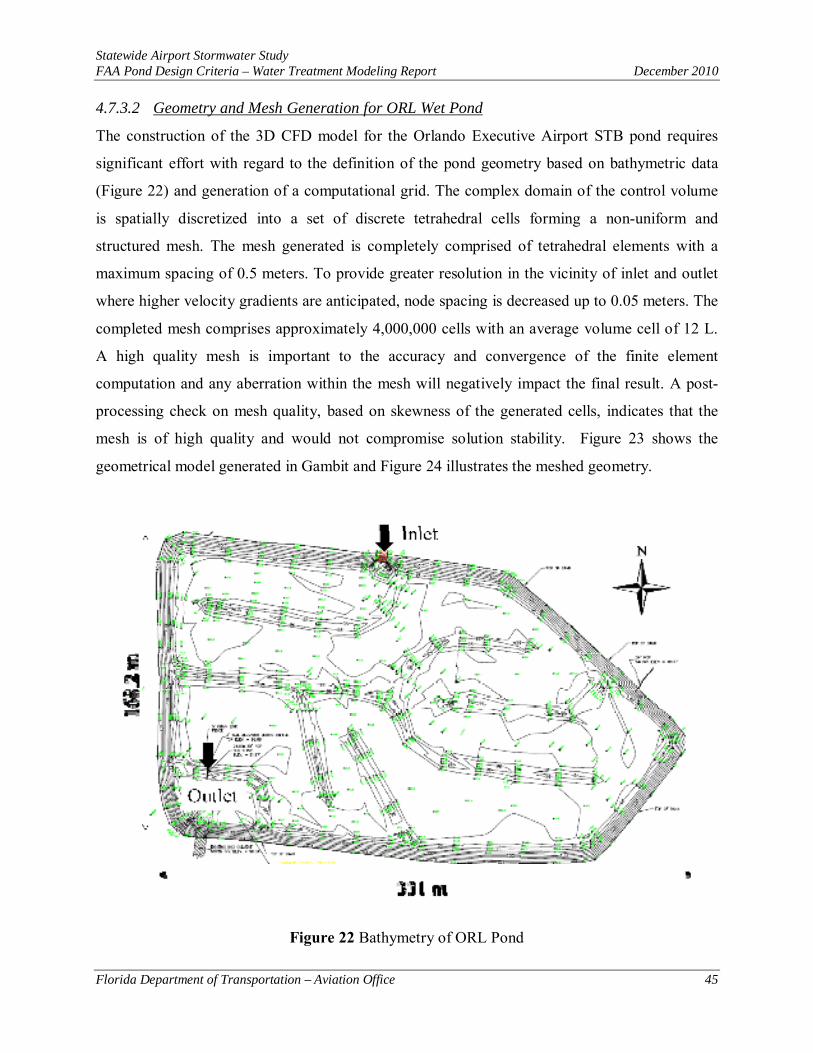
The construction of the 3D CFD model for the Orlando Executive Airport STB pond requires
significant effort with regard to the definition of the pond geometry based on bathymetric data
(Figure 22) and generation of a computational grid. The complex domain of the control volume
is spatially discretized into a set of discrete tetrahedral cells forming a non-uniform and
structured mesh. The mesh generated is completely comprised of tetrahedral elements with a
maximum spacing of 0.5 meters. To provide greater resolution in the vicinity of inlet and outlet
where higher velocity gradients are anticipated, node spacing is decreased up to 0.05 meters. The
completed mesh comprises approximately 4,000,000 cells with an average volume cell of 12 L.
A high quality mesh is important to the accuracy and convergence of the finite element
computation and any aberration within the mesh will negatively impact the final result. A post-
processing check on mesh quality, based on skewness of the generated cells, indicates that the
mesh is of high quality and would not compromise solution stability. Figure 23 shows the
geometrical model generated in Gambit and Figure 24 illustrates the meshed geometry.
Figure 22 Bathymetry of ORL Pond

Statewide Airport Stormwater Study FAA Pond Design Criteria – Water Treatment Modeling Report December 2010
Florida Department of Transportation – Aviation Office 46
Figure 23 Plan view of the South Wet Pond located at the Orlando Executive Airport
Figure 24 Plan View of the Meshed Geometry for ORL Pond
168 m
Outlet
Inlet
331 m
Earthen Baffles (Max Elev. : 29.6 m)
NWL = 29.68 m DWL = 30 m
ZX
Y
Inlet
Outflow

Statewide Airport Stormwater Study FAA Pond Design Criteria – Water Treatment Modeling Report December 2010
Florida Department of Transportation – Aviation Office 47
4.7.3.3 Geometry and Mesh Generation for Triangular and Rectangular Quarry Ponds
Similarly to the ORL Wet Pond, the geometrical model for the Triangular and Rectangular
Quarry Ponds was built in Gambit and successively meshed. The meshes generated comprise
respectively approximately 700,000 cells and 600,000 for triangular and Rectangular Quarry
Ponds. A post-processing check on mesh quality was performed to verify the skewness of the
generated cell and to ensure the mesh is of high quality and does not compromise solution
stability.
Figures 26-27 show the meshed geometry for both Ponds.
Figure 25 Geometrical model of generic triangular Pond
Inlet#2
Inlet#1
Outlet#1
Outlet#2
Outlet#3
Outlet#4
457 m
518 m

Statewide Airport Stormwater Study FAA Pond Design Criteria – Water Treatment Modeling Report December 2010
Florida Department of Transportation – Aviation Office 48
Figure 26 Meshed Geometry for generic triangular quarry Pond
Inlet#1
Inlet#2
Outlet#1
Outlet#2
Outlet#3
Outlet#4

Statewide Airport Stormwater Study FAA Pond Design Criteria – Water Treatment Modeling Report December 2010
Florida Department of Transportation – Aviation Office 49
Figure 27 Geometry of generic Rectangular Pond
479 m
619 mInlet#1 Inlet#2
Outlet

Statewide Airport Stormwater Study FAA Pond Design Criteria – Water Treatment Modeling Report December 2010
Florida Department of Transportation – Aviation Office 50
4.7.4 Boundary and Initial Conditions, Computational Parameters and Assumptions
Boundary conditions are required for the bottom, sides and top of the mesh model. The bottom
and sides are specified as wall boundary conditions. The inlet is specified as velocity inlet. The
Pond outlet is specified as an outflow boundary. The free surface is approximated as shear free
wall with velocity components normal to the surface. PM injections are uniformly released from
the inlet section at a temporal frequency of 1 min to ensure a continuous delivery of PM into the
system. The PM tracking length is computed in CFD model by tracking trajectories of a tracer,
with diameter of 1 micrometer and density of 62.4 lb/ft3 (998.2 kg/m3) (equal to water density) at
a lowest flow rates (1% of Qp). In order to model the time-dependent distribution of effluent
particles, a custom subroutine is implemented in CFD. This user defined function records
injection time, residence time and particle size of each particle eluted from the computational
domain. To model the influent PSD, the PM gradation is discretized into a number of particle
classes on a symmetric gravimetric basis on the arithmetic scale. Dickenson and Sansalone
(2009) demonstrates that a discretization number (DN) of 16 is generally able to reproduce
accurate results for silt gradations under steady conditions. Therefore, in this study a DN equal to
16 is used since a hetero-disperse and fine influent PM gradation is analyzed (Figure 6). The
governing equations are solved based on a time step of 10 seconds, which turned out to provide time-
independent results.
The method is based on the following assumptions to fully specify and characterize the CFD model:
The flow regime established within the domain is hypothesized to be turbulent
Gravity influences fluid flow and PM and is defined as 32 ft/s2 (9.81 m/s2).
Fluid medium is water and is defined to have a density of 62.4 lb/ft3 (998.2 kg/m3) and a kinematic viscosity of 1.1·10-5 ft2/s (1.004 *10-6 m2/s) at a temperature of 68 ºF (20°C).

Statewide Airport Stormwater Study FAA Pond Design Criteria – Water Treatment Modeling Report December 2010
Florida Department of Transportation – Aviation Office 51
4.7.5 Population Balance
A population balance model (PBM) is coupled with CFD to model particle separation. Assuming
no flocculation in the dispersed particle phase, the PBM equation (Jakobsen, 2008) and mass per
particle, pξ,τ,n are as follows.
( ) ( ) ( )∑∑∑∑∑∑∑∑∑= == == =
+=max
min
max
min
max
min 0 1,,
0 1,,
0 1inf,,
ξ
ξ ττξ
ξ
ξ ττξ
ξ
ξ ττξ
ddd t N
nsepn
t N
neffn
t N
nn ppp
(14)
N
nn N
Mp
1
,,,
=⎟⎟⎠
⎞⎜⎜⎝
⎛= τξ
τξ
(151)
Mξ,τ is PM mass associated with the particle size range ξ as function of injection time τ, N is the
total number of particles injected at the inlet section, td is the event duration.
4.7.6 Model validation
To evaluate the accuracy of the modeled results, Absolute relative error Δβ is introduced. It
represents a measure of the accuracy error of the CFD model results respect to the full scale
physical model data. The value of Δβ is computed as follows:
%measured
modeledmeasured ⋅−
=Δβ
βββ
where βmeasured and βmodeled represent respectively measured and modeled PM separation.
4.7.7 Computational resources
CFD simulations are solved in parallel on a Dell Precision 690 Workstation equipped with two
quad core Intel Xeon® 2.33GHz (a total of eight cores), 16 GB of RAM, and a Dell Precision
(16)

Statewide Airport Stormwater Study FAA Pond Design Criteria – Water Treatment Modeling Report December 2010
Florida Department of Transportation – Aviation Office 52
7400 Workstation equipped with two quad core Intel Xeon® 2.5GHz (a total of eight cores), 32
GB of RAM. The computing times for physical model Pond models are between 6-36 hours. The
computing time of ST Pond model is about 1 week.

Statewide Airport Stormwater Study FAA Pond Design Criteria – Water Treatment Modeling Report December 2010
Florida Department of Transportation – Aviation Office 53
5 Results and Discussion
5.1 Experimental Results - FAA Linear Pond and Crenellated Pond
Configurations From December 2009 through May 2010, the full-scale model of FAA Linear Pond and
Crenellated Pond underwent physical model testing at the “Stormwater Unit Operations and
Processes” facility located at University of Florida, Gainesville, FL. A total of 6 physical
modeling experimental runs are performed for two Pond Configurations at unsteady influent
flow rates (see Figure 7 and 8) and at steady state thermal, granulometric (particle size
distribution) and gravimetric (particle concentration) conditions. In this section, monitoring data
collected from the tests are reported along with a discussion of the findings. This analysis
examines the PM separation of the two Pond Configurations (linear and crenellated) when it is
subjected to the influent silt PM gradation. Testing experiments are carried out for the three
hydrographs reported in Figure 11 and at influent sediment concentrations of 200 mg/L. The run
operational parameters and the treatment run results for three hydrographs are summarized in the
following Table 3. This table also correlates a given experimental run to a MBE, which confirms
that each accepted run remained within ±10% MBE in order to fulfill the QC protocol. Any
physical model run that did not achieve this requirement is reconstructed and rerun.
In order to investigate the influence of particle sizes from a hetero-disperse PSD on the overall
PM separation of the system, the physical model results corresponding to the influent
concentration of 200 mg/L are reported in terms of temporal variation of effluent PM in the
following plot (Figure 28).
As expected, the performance of the FAA Linear Pond unit demonstrates exponentially
increasing mass removal as the unsteady flow rate decreases towards low flow. At 2%
maximum hydraulic capacity, the unit exhibits PM separation nearly equal to 90%. The PM
separation decreases with increased flow up to the flow rate corresponding to 50%-100% of
maximum hydraulic capacity. This phenomenon corresponds to the exponentially decreasing
settling velocity of PM with respect to particle size. Since the influent PM gradation is hetero-
disperse and contains a significant portion of finer particles it is expected that the unit, primarily

Statewide Airport Stormwater Study FAA Pond Design Criteria – Water Treatment Modeling Report December 2010
Florida Department of Transportation – Aviation Office 54
using the mechanism of gravitational settling, will not reach high efficiencies unless it is
operating at very low flow rates. For the higher flow rates the unit is primarily capturing coarse
PM while the fine material is passing through the unit. From the results shown in Table 3 and
Figure 28, the PM separation results for the Crenellated Pond are almost doubled with respect to
those obtained for the Linear Pond. This suggests that the Crenellated Pond is able to remove the
coarser fraction of the influent PM gradation and retain part of finer fraction. This is due to a
better utilization of the unit volume. In fact, the formation of dead zones is avoided and potential
short-circuiting are reduced by the presence of the baffles, which lead to significantly increased
detention times inside the system. However, as it is possible to note from Figure 28, for all three
hydrographs at high flow rates, the effluent PM eluted from the crenellated Pond, although less
than that shown for Linear Pond, is still significantly high. The reason of these findings is that at
high flow rates the PM material which accumulates in the system throughout the entire
controlled experimental run and that remain in suspension, is washed out from the unit.
Effluent PSD data obtained for each experimental run are compared to investigate the
performance of both unit configurations under the loading of a silt gradation. Figure 29 shows
PSD ranges related to tested unsteady hydrographs for influent loading concentrations of 200
mg/L. As it is expected, performance of both units increases by capturing finer PM as the flow
rate decreases. Furthermore, the graph in Figure 29 provides an insight on the settling behavior
of each particle size, showing the ranges of particle sizes which are completely retained within
the unit for given flow rates. In addition, the PSD data are compared with the influent silt
gradation to evaluate the system performance in terms of PM separation.

Statewide Airport Stormwater Study FAA Pond Design Criteria – Water Treatment Modeling Report December 2010
Florida Department of Transportation – Aviation Office 55
Table 3 Summary of run operational parameters and measured treatment performance results based on effluent concentration and separated particulate matter (PM) for Pilot-scale Linear Pond and Crenellated Pond Configurations at UF loaded by hetero-disperse silt particle size gradation for three different hydrological events. Qp is the peak influent flow rate, V is the Total Influent Volume, Ttot is the duration of the hydrological event, SOR50 is Surface Overflow Rate at Median Flow Rate, dp is d50 of Recovered PM PSD, and MBE is Mass Balance Error
Qp V Ttot SOR50 dp βmeasured MBEHydrograph (gpm) (gal) (min) gal/(min-ft2) (μm) (%) (%)Triangular 450 3,99 44 23.4 23.8 47.1 6.03July 8th 2008 806 23,52 110 82.0 35.6 20.6 0.4625 year - 24 hr 408 67,13 1369 25.6 35.6 32.3 1.76
Qp V Ttot SOR50 dp βmeasured MBEHydrograph (gpm) (gal) (min) gal/(min-ft2) (μm) (%) (%)Triangular 450 3,99 44 10.6 25.2 98.3 10.40July 8th 2008 806 23,52 110 50.6 22.4 71.3 0.8525 year - 24 hr 408 67,13 1369 14.9 28.3 63.7 9.67
Linear FAA Pond
Crenellated Pond

Statewide Airport Stormwater Study FAA Pond Design Criteria – Water Treatment Modeling Report December 2010
Florida Department of Transportation – Aviation Office 56
Efflu
ent P
M (g
)
0
200
400
600
800
Effluent QMeasured
Qp = 449 gpmTtot = 44 minV = 3,998 gal
Effluent Measured PM = 1.65 KgInfluent PM = 3.03 Kg
Efflu
ent Q
(gpm
)
0
200
400
600
800
1000
Effluent QMeasured
Effluent Measured PM = 0.05 KgInfluent PM = 3.03 Kg
Qp = 449 gpmTtot = 44 minV = 3,998 gal
Efflu
ent P
M (g
)
0
200
400
600
800
Effluent QMeasured
Efflu
ent Q
(gpm
)
0
200
400
600
800
1000
Effluent QMeasured
Effluent Measured PM = 13 KgInfluent PM = 16.4 Kg
Qp = 792 gpmTtot = 110 minV = 23,518 gal
Effluent Measured PM = 4.7 KgInfluent PM = 16.4 Kg
Qp = 792 gpmTtot = 110 minV = 23,518 gal
t/Ttot
0.0 0.2 0.4 0.6 0.8 1.0
Efflu
ent P
M (g
)
0
200
400
600
800
Effluent QMeasured
t/Ttot
0.0 0.2 0.4 0.6 0.8 1.0
Efflu
ent Q
(gpm
)
0
200
400
600
800
1000
Effluent QMeasured
Effluent Measured PM = 34.4 KgInfluent PM = 50.8 Kg
Qp = 482 gpmTtot = 1440 min
V = 67,575 gal
Effluent Measured PM = 18.6 KgInfluent PM = 51.1 Kg
Qp = 482 gpmTtot = 1440 min
V = 67,575 gal
Linear Basin
Linear Basin
Linear Basin Crenellated Basin
Crenellated Basin
Crenellated Basin
Figure 28 Effluent measured PM results for the Triangular Hyetograph (A, B), the Hydrological Event of July 8th 2008 (C, D) and the Design Storm Event of 24 hour-25 years (E, F) respectively for Pilot-scale Linear and Crenellated Pond Configurations at UF. V is the total influent volume, Qp is the Peak Influent Flow Rate and Ttot is the total duration of the Hydrological Event.
(A) (B)
(C) (D)
(E) (F)

Statewide Airport Stormwater Study FAA Pond Design Criteria – Water Treatment Modeling Report December 2010
Florida Department of Transportation – Aviation Office 57
Particle Diameter, d (μm)0.1110100
% fi
ner b
y m
ass
0
20
40
60
80
100
Qp= 449 gpmTtot = 44 min
Linear BasinCinf = 200 mg/L ρs = 2650 g/cm3
Particle Diameter, d (μm)0.1110100
% fi
ner b
y m
ass
0
20
40
60
80
100Influent MeasuredEffluent Measured
Qp = 449 gpmTtot = 44 min
Crenellated BasinCinf = 200 mg/L
ρs = 2650 g/cm3
% fi
ner b
y m
ass
0
20
40
60
80
100 Influent MeasuredEffluent Measured
Linear BasinCinf = 200 mg/L
ρs = 2650 g/cm3
% fi
ner b
y m
ass
0
20
40
60
80
100Influent MeasuredEffluent Measured
Qp = 792 gpmTtot = 44 min
Crenellated BasinCinf = 200 mg/L
ρs = 2650 g/cm3
Particle Diameter, d (μm)0.1110100
% fi
ner b
y m
ass
0
20
40
60
80
100 Influent MeasuredEffluent Measured
Linear BasinCinf = 200 mg/L
ρs = 2650 g/cm3
Particle Diameter, d (μm)0.1110100
% fi
ner b
y m
ass
0
20
40
60
80
100Influent MeasuredEffluent Measured
Crenellated BasinCinf = 200 mg/L
ρs = 2650 g/cm3
Qp = 792 gpmTtot = 110 min
Qp = 482 gpmTtot = 1440 min
Qp = 482 gpmTtot = 1440 min
Influent MeasuredEffluent Measured
Figure 29 Effluent Measured PSDs for the Triangular Hyetograph (A, B), the Hydrological Event of July 8th 2008 (C, D) and the Design Storm Event of 24 hour-25 years (E, F) respectively for Pilot-scale Linear and Crenellated Pond Configurations at UF. ρs is the particle density, Qp is the Peak Influent Flow Rate and Ttot is the total duration of the Hydrological Event.
(A) (B)
(C) (D)
(E) (F)

Statewide Airport Stormwater Study FAA Pond Design Criteria – Water Treatment Modeling Report December 2010
Florida Department of Transportation – Aviation Office 58
5.2 CFD Modeling – FAA Linear Pond and Crenellated Pond results
After running the CFD model and solving the flow field, it is possible to analyze the
hydrodynamic response of the two systems and visualize the results in terms of pathlines in post-
processing. Checking the behavior of the pathlines through the unit operation (UO) in steady
state condition confirms the quality of the mesh created in GAMBIT and the validity of the
model constructed and consequently processed in CFD. Figure 30 and Figure 31 shows the
pathlines for steady state condition obtained for the FAA Linear Pond and Crenellated Pond
models for the maximum hydraulic capacity, 1.77 cfs (50 L/s). As it is possible to note from the
figure reported below, fluid pathlines follow an acceptable and plausible pattern through both
systems. The density of the pathlines can give an indication of the utilization of the treatment
volume. At the maximum hydraulic capacity, it is qualitatively apparent that for the FAA Linear
Pond the treatment volume is not uniformly fully utilized, showing two lateral stagnant regions
and a short circuiting at the middle section of the unit. The presence of these defects in the
hydraulic footprint indicates that the geometry of the unit can be modified to increase the
utilization of the entire treatment volume and improve the hydraulic response of the system.
Conversely, the Crenellated Pond shows a better utilization of the treatment volume due to the
presence of the baffles, which constrains the flow to follow a longer path and occupy uniformly
the entire cross section of the Pond. Dead zones are still visible at the intersection of the baffles
and the lateral walls, but they represent reasonably small entities.
In Table 4 the results obtained from the CFD model are summarized and compared to those
retrieved from the experimental testing. To assess the accuracy of the CFD results with the
monitoring data, the absolute percentage difference (Δβ) is computed. The Δβs computed range
from a minimum of 0.2 to a maximum of 9.7%. The values obtained are therefore within the
control limit defined for Δβ, which is 10%, demonstrating that the CFD model shows excellent
confluence to the experimental data.
Figure 32 shows the CFD model results in terms of Effluent PM as function of time for both
configurations and demonstrates physical model data are in accordance with numerical model
outcomes. Figure 33 depicts the effluent PM PSDs variation over time for the set of six
simulations performed. As before, the CFD modeled PSDs are in good agreement with measured

Statewide Airport Stormwater Study FAA Pond Design Criteria – Water Treatment Modeling Report December 2010
Florida Department of Transportation – Aviation Office 59
PSD results. In particular, in the figure the range of effluent measured and modeled PSDs (grey
shaded) are shown, knowing that the PSDs vary throughout the event according to the unsteady
flow rate.
Figure 30 Fluid pathlines at maximum hydraulic capacity of 1.77 cfs (50 L/s) from FAA Linear Pond model developed in CFD, respectively. The pathlines are colored by Velocity Magnitude expressed as m/s.
Outlet Inlet
5.00 4.75 4.50 4.25 4.00 3.75 3.50 3.25 2.00 2.75 2.50 2.25 2.00 1.75 1.50 1.25 1.00 0.75 0.50 0.25 0.00

Statewide Airport Stormwater Study FAA Pond Design Criteria – Water Treatment Modeling Report December 2010
Florida Department of Transportation – Aviation Office 60
Figure 31 Fluid pathlines at maximum hydraulic capacity of 1.77 cfs (50 L/s) from Crenellated Pond model developed in CFD, respectively. The pathlines are colored by Velocity Magnitude expressed as m/s.
Outlet Inlet
5.00 4.75 4.50 4.25 4.00 3.75 3.50 3.25 2.00 2.75 2.50 2.25 2.00 1.75 1.50 1.25 1.00 0.75 0.50 0.25 0.00

Statewide Airport Stormwater Study FAA Pond Design Criteria – Water Treatment Modeling Report December 2010
Florida Department of Transportation – Aviation Office 61
Table 4 Summary of Experimental and Measured treatment performance results based on effluent concentration and separated particulate matter (PM) for Pilot-scale Linear and Crenellated Pond Configurations at UF loaded by hetero-disperse silt particle size gradation for three different hydrological events. V is the Total Influent Volume, Qp is the peak influent flow rate, Ttot is the duration of the hydrological event and Δβ is Absolute Percentage Error.
Qp V Ttot βmeasured βmodeled Δβ Hydrograph (gpm) (gal) (min) (%) (%) %Triangular 450 3,99 44 47.1 47 0.20July 8th 2008 806 23,52 110 20.6 19 8.025 year - 24 hr 408 67,13 1369 32.3 29.2 9.7
Qp V Ttot βmeasured βmodeled Δβ Hydrograph (gpm) (gal) (min) (%) (%) %Triangular 450 3,99 44 98.3 98 0.3July 8th 2008 806 23,52 110 71.3 68 4.725 year - 24 hr 408 67,13 1369 63.7 67 5.2
FAA Linear Pond
Crenellated Pond

Statewide Airport Stormwater Study FAA Pond Design Criteria – Water Treatment Modeling Report December 2010
Florida Department of Transportation – Aviation Office 62
Efflu
ent P
M (g
)
0
200
400
600
800
Effluent QMeasuredModeled
Qp = 449 gpmTtot = 44 minV = 3,998 gal
Effluent Measured PM = 1.65 KgEffluent Modeled PM = 1.6 Kg
Influent PM = 3.03 Kg
Efflu
ent Q
(gpm
)
0
200
400
600
800
1000
Effluent QMeasuredModeled
Effluent Measured PM = 0.05 KgEffluent Modeled PM = 0.04 Kg
Influent PM = 3.03 Kg
Qp = 449 gpmTtot = 44 minV = 3,998 gal
Efflu
ent P
M (g
)
0
200
400
600
800
Effluent QMeasuredModeled
Efflu
ent Q
(gpm
)
0
200
400
600
800
1000
Effluent QMeasuredModeled
Effluent Measured PM = 13 KgEffluent Modeled PM = 13.2 Kg
Influent PM = 16.4 Kg
Qp = 792 gpmTtot = 110 minV = 23,518 gal
Effluent Measured PM = 4.7 KgEffluent Modeled PM = 5.1 Kg
Influent PM = 16.4 Kg
Qp = 792 gpmTtot = 110 minV = 23,518 gal
t/Ttot
0.0 0.2 0.4 0.6 0.8 1.0
Efflu
ent P
M (g
)
0
200
400
600
800
Effluent QMeasuredModeled
t/Ttot
0.0 0.2 0.4 0.6 0.8 1.0
Efflu
ent Q
(gpm
)
0
200
400
600
800
1000
Effluent QMeasuredModeled
Effluent Measured PM = 34.4 KgEffluent Modeled PM = 36 Kg
Influent PM = 50.8 KgQp = 482 gpmTtot = 1440 min
V = 67,575 gal
Effluent Measured PM = 18.6 KgEffluent Modeled PM = 16.8 Kg
Influent PM = 51.1 Kg
Qp = 482 gpmTtot = 1440 min
V = 67,575 gal
Linear Basin
Linear Basin
Linear Basin Crenellated Basin
Crenellated Basin
Crenellated Basin
Δβm = 0.2 % Δβm = 0.3 %
Δβm = 8 % Δβm = 4.7 %
Δβm = 9.7 %Δβm = 5.2 %
Figure 32 Effluent measured and CFD modeled PM results for the Triangular Hyetograph (A, B), the Hydrological Event of July 8th 2008 (C, D) and the Design Storm Event of 24 hour-25 years (E, F) respectively for pilot-scale Linear and Crenellated Pond Configurations at UF. Δβ represents the Absolute Percentage Error, V is the total influent volume, Qp is the Peak Influent Flow Rate and Ttot is the total duration of the hydrological Event.
(A) (B)
(C) (D)
(E) (F)

Statewide Airport Stormwater Study FAA Pond Design Criteria – Water Treatment Modeling Report December 2010
Florida Department of Transportation – Aviation Office 63
Particle Diameter, d (μm)0.1110100
% fi
ner b
y m
ass
0
20
40
60
80
100 Effluent ModeledInfluent MeasuredEffluent Measured
Qp= 449 gpmTtot = 44 min
Linear BasinCinf = 200 mg/L
RMSE = 1.9 %ρs = 2650 g/cm3
Particle Diameter, d (μm)0.1110100
% fi
ner b
y m
ass
0
20
40
60
80
100Effluent ModeledInfluent MeasuredEffluent Measured
Qp = 449 gpmTtot = 44 min
Crenellated Basin
Cinf = 200 mg/L
RMSE = 1.64 %ρs = 2650 g/cm3
% fi
ner b
y m
ass
0
20
40
60
80
100 Effluent ModeledInfluent MeasuredEffluent Measured
Linear BasinCinf = 200 mg/L
ρs = 2650 g/cm3
% fi
ner b
y m
ass
0
20
40
60
80
100Effluent ModeledInfluent MeasuredEffluent Measured
Qp = 792 gpmTtot = 44 min
Crenellated BasinCinf = 200 mg/L
RMSE = 1.64 %ρs = 2650 g/cm3
Particle Diameter, d (μm)0.1110100
% fi
ner b
y m
ass
0
20
40
60
80
100 Effluent ModeledInfluent MeasuredEffluent Measured
Linear BasinCinf = 200 mg/L
ρs = 2650 g/cm3
Particle Diameter, d (μm)0.1110100
% fi
ner b
y m
ass
0
20
40
60
80
100Effluent ModeledInfluent MeasuredEffluent Measured
Crenellated BasinCinf = 200 mg/L
ρs = 2650 g/cm3
Qp = 792 gpmTtot = 110 min
RMSE = 2.1 %
Qp = 482 gpmTtot = 1440 min
Qp = 482 gpmTtot = 1440 min
RMSE = 7.1 % RMSE = 2.3 %
Figure 33 Effluent Measured and CFD Modeled PSDs for the Triangular Hyetograph (A, B), the Hydrological Event of July 8th 2008 (C, D) and the Design Storm Event of 24 hour-25 years (E, F) respectively for Pilot-scale Linear FAA and Crenellated Pond Configurations at UF. The shaded area indicates the range of variation of effluent PSDs throughout the hydrological events. RMSE is the Root Mean Squared Error between Effluent Average Measured and Modeled PSDs, ρs is the particle density, Qp is the Peak Influent Flow Rate and Ttot is the total duration of the Hydrological Event.
(A) (B)
(C) (D)
(E) (F)

Statewide Airport Stormwater Study FAA Pond Design Criteria – Water Treatment Modeling Report December 2010
Florida Department of Transportation – Aviation Office 64
5.3 CFD Modeling – ORL Wet Pond Results The flow field, consisting of pressure and velocity data, is solved for selected hydrographs and
the DPM model is applied for the influent silt gradation. The behavior of the pathlines within the
system is shown at flow rates of 3.53 cfs (100 L/s) (1.5 % of Qp), 26.48 cfs (750 L/s) (11% of
Qp), 106 cfs (3000 L/s) (50% of Qp) and 238 cfs (6750 L/s) (100% of Qp) in Figure 34. As it is
possible to note from the pathlines as the flow rate increases the short-circuiting toward to the
outlet of the Pond increases. This is due to the fact that up to a flow rate of 3.53 cfs (100 L/s) the
presence of baffles has a strong influence on the flow path and constrains it to follow the longest
trajectories, since the water level in the ST Pond is lower or at most equal to the maximum
elevation of the earthed baffles. When flow rate values are above 3.53 cfs (100 L/s), the water
level in the Pond, increases and becomes higher than the height of the baffles of 3 feet (0.9 m).
This means while some of the pathlines still follow the path delimited by the baffles, others
overpass the baffle structures and reach the outlet section faster. The effect of the baffles
therefore is reduced for flow rates higher than 3.53 cfs (100 L/s), without playing any further
their role in the treatment unit. The plot reported below (Figure 35) explicates this concept.
Figure 36, Figure 37 and Figure 38 show also that for flow rates higher than 3.53 cfs, a portion of
flow path lines, in the inlet zone, impinge against the horizontal baffle and turn in a vortex on the
left side. The other portion of the flow does not encounter the baffle and turns toward to the right
side following the pressure gradients toward to the outlet and partially the path delimited by the
baffles. Selected PM sizes utilized to discretize the influent PSD and to evaluate the performance
of the system are below included for visualization purposes as standard sizes. The following
figures (Figure 39-42) show the particle trajectories obtained from CFD simulations at a peak
flow rate of 238 cfs (6750 L/s) and represent a qualitative visualization of the particle dispersion
behavior within the treatment system. As expected, 5 μm particles at the peak flow rate are
uniformly dispersed within the system and are partially eluted from the system. Greater particle
sizes are able to settle and the percentage of retained particles increases with the weight of the
specific PM particle.

Statewide Airport Stormwater Study FAA Pond Design Criteria – Water Treatment Modeling Report December 2010
Florida Department of Transportation – Aviation Office 65
t/Ttot
0.0 0.2 0.4 0.6 0.8 1.0
Influ
ent Q
(cfs
)
0
50
100
150
200
250
Figure 34 25 yr-24 hr Design Storm for ORL Wet Pond. The Qp is 238 cfs (6750 L/s). The red arrows indicate the flow rates at which the pathline visualization is performed in the following figures. Five flow rates are highlighted: 3.53 cfs (100 L/s) which represents 1.5 % of Qp, 26.48 cfs (750 L/s) which represents 10% of Qp, 106 cfs (3000 L/s) which represents 50% of Qp and 238 cfs (6750 L/s) equal to the peak flow rate. Based on the hydraulic condition established in the ORL Wet Pond, the water level at 1.5 % of Qp reaches the height of the earthed baffles. In this case the baffles influence the flow path, avoiding short-circuiting. At higher flow rates than 1.5% of Qp the water level increases and a portion of the flow overpasses the baffles. In this case, baffles partially exert their function and their effect on the flow path is significantly reduced.
Q = 3.53 cfs
Q = 106 cfs
Q = 24.68 cfs
Q = 238 cfs No Baffle Effects
Baffle Effects
Ttot = 1800 min

Statewide Airport Stormwater Study FAA Pond Design Criteria – Water Treatment Modeling Report December 2010
Florida Department of Transportation – Aviation Office 66
Figure 35 Fluid pathlines respectively at Q = 3.53 cfs (100 L/s) from ST ORL Pond model developed in Fluent 12. The pathlines are colored by Velocity Magnitude expressed as m/s
Outlet
Inlet
1.00 0.95 0.90 0.85 0.80 0.75 0.70 0.65 0.60 0.55 0.50 0.45 0.40 0.35 0.30 0.25 0.20 0.15 0.10 0.05 0.00

Statewide Airport Stormwater Study FAA Pond Design Criteria – Water Treatment Modeling Report December 2010
Florida Department of Transportation – Aviation Office 67
Figure 36 Fluid pathlines respectively at Q = 26.48 cfs (750 L/s) from ST ORL Pond model developed in Fluent 12. The pathlines are colored by Velocity Magnitude expressed as m/s
Outlet
Inlet
1.00 0.95 0.90 0.85 0.80 0.75 0.70 0.65 0.60 0.55 0.50 0.45 0.40 0.35 0.30 0.25 0.20 0.15 0.10 0.05 0.00

Statewide Airport Stormwater Study FAA Pond Design Criteria – Water Treatment Modeling Report December 2010
Florida Department of Transportation – Aviation Office 68
Figure 37 Fluid pathlines respectively at Q = 106 cfs (3000 L/s) for ORL Pond model developed in Fluent 12. The pathlines are colored by Velocity Magnitude expressed as m/s.
1.00 0.95 0.90 0.85 0.80 0.75 0.70 0.65 0.60 0.55 0.50 0.45 0.40 0.35 0.30 0.25 0.20 0.15 0.10 0.05 0.00

Statewide Airport Stormwater Study FAA Pond Design Criteria – Water Treatment Modeling Report December 2010
Florida Department of Transportation – Aviation Office 69
Figure 38 Fluid pathlines respectively at Q = 238 cfs (6750 L/s) for ORL Pond model developed in Fluent 12. The pathlines are colored by Velocity Magnitude expressed as m/s.
Outlet
Inlet
1.00 0.95 0.90 0.85 0.80 0.75 0.70 0.65 0.60 0.55 0.50 0.45 0.40 0.35 0.30 0.25 0.20 0.15 0.10 0.05 0.00

Statewide Airport Stormwater Study FAA Pond Design Criteria – Water Treatment Modeling Report December 2010
Florida Department of Transportation – Aviation Office 70
Figure 39 Discrete particle tracks for 5 μm PM (ρs=2.650 g/cm3) for Q= 238 cfs (6750 L/s). Particle tracks are colored by particle residence time. In the figures, dark blue and red correspond to the shortest and longest residence times, respectively. However, the color gradation refers to different value range for each picture; therefore, the figure provides only a qualitative representation of the particle tracks as function of residence time expressed in seconds
Outlet
Inlet
21800 20800 19700 18600 17500 16400 15300 14200 13100 12000 10900 9830 8740 7650 6550 5460 4370 3280 2180 1090 0

Statewide Airport Stormwater Study FAA Pond Design Criteria – Water Treatment Modeling Report December 2010
Florida Department of Transportation – Aviation Office 71
Figure 40 Discrete particle tracks for 35 µm PM (ρs=2.650 g/cm3) for Q= 238 cfs (6750 L/s). Particle tracks are colored by particle residence time. In the figures, dark blue and red correspond to the shortest and longest residence times, respectively. However, the color gradation refers to different value range for each picture; therefore, the figure provides only a qualitative representation of the particle tracks as function of residence time expressed in seconds.
Outlet
Inlet
21200 20200 19100 18000 17000 15900 14900 13800 12700 11700 10600 9550 8490 7430 6370 5300 4240 3180 2120 1060 0

Statewide Airport Stormwater Study FAA Pond Design Criteria – Water Treatment Modeling Report December 2010
Florida Department of Transportation – Aviation Office 72
Figure 41 Discrete particle tracks for 55 µm PM (ρs=2.650 g/cm3) for Q= 238 cfs (6750 L/s). Particle tracks are colored by particle residence time. In the figures, dark blue and red correspond to the shortest and longest residence times, respectively. However, the color gradation refers to different value range for each picture; therefore, the figure provides only a qualitative representation of the particle tracks as function of residence time expressed in seconds.
Outlet
Inlet
12000 11400 10800 10200 9620 9020 8420 7820 7220 6620 6010 5410 4810 4210 3610 3010 2410 1800 1200 600 0

Statewide Airport Stormwater Study FAA Pond Design Criteria – Water Treatment Modeling Report December 2010
Florida Department of Transportation – Aviation Office 73
Figure 42 Discrete particle tracks for 85 µm PM (ρs=2.650 g/cm3) for Q= 238 cfs (6750 L/s). Particle tracks are colored by particle residence time. In the figures, dark blue and red correspond to the shortest and longest residence times, respectively. However, the color gradation refers to different value range for each picture; therefore, the figure provides only a qualitative representation of the particle tracks as function of residence time expressed in seconds.
Outlet
Inlet
11000 10400 9870 9320 8770 8230 7680 7130 6580 6030 5480 4940 4390 3840 3290 2740 2190 1650 1100 548 0

Statewide Airport Stormwater Study FAA Pond Design Criteria – Water Treatment Modeling Report December 2010
Florida Department of Transportation – Aviation Office 74
Finally, the CFD modeled results under unsteady condition are shown for the ST ORL Pond. In
particular, the PM separation and the temporal variation of effluent PM eluted from the system
are depicted in Figure 43.
Figure 43 shows the results obtained for the 25 year-24 hour Design Storm generated from the
SWMM model previously described in Section 3.4 at a constant influent silt concentration of 100
mg/L. The overall PM separation for the Design Storm is approximately 53 %. In Figure 44
CFD modeled results in terms of temporal variation of effluent PSDs are shown. Note the PSD
with a d50 of 25 μm that delineates the lower limit of the shaded area is coarser than the influent
PSD. This is due to the fact the coarser fraction of influent PM accumulates in the first part of the
event and at the peak flow rate it is rapidly stirred up and flushed from the system.
t/Ttot
0.0 0.2 0.4 0.6 0.8 1.0
Efflu
ent Q
(cfs
)
0
50
100
150
200
250
300
Efflu
ent P
M (K
g)
0
5
10
15
20
25
30
Effluent QModeled
Qp = 238 cfsTtot= 1800 min
ST Basin (EMC)inf = 100 mg/L
Effluent Modeled PM = 3,360 Kg Influent PM = 7,200 Kg
βmodeled = 53%
Figure 43 CFD Modeled Effluent PM for 25 year-24 hour Design Storm for ST ORL Pond. (EMC)inf represents the Influent Event Mean Concentration; Qp is the peak flow rate, equal to 6750 L/s (238 cfs), Ttot is the total duration of the hydrograph; βmax is the modeled PM separation

Statewide Airport Stormwater Study FAA Pond Design Criteria – Water Treatment Modeling Report December 2010
Florida Department of Transportation – Aviation Office 75
Particle Diameter, d (μm)0.1110100
% fi
ner b
y m
ass
0
20
40
60
80
100 Effluent ModeledInfluent
(EMC)inf = 100 mg/L
ρs = 2650 g/cm3
Qp = 238 cfsTtot= 1800 min
Figure 44 CFD Modeled Effluent PSD. The shaded area indicates the range of variation of effluent PSDs throughout the 25 year-24 hour Design Storm. (EMC)inf represents the Influent Event Mean Concentration; Qp is the peak flow, equal to 6750 L/s (238 cfs), Ttot is the total duration of the hydrograph
5.4 CFD Modeling - Triangular and Rectangular Quarry Ponds Results In this section the CFD modeled results are reported for the Triangular and Rectangular Quarry
Ponds. In particular, the flow pathlines and particle tracks for 25 μm particle diameter are shown
in Figure 45 and Figure 46. The modeled results demonstrate the hydraulic volume available is
partially utilized, showing the presence of short-circuiting. The fluid pathlines coming out from
the inlet #2 follow the slope along the right side wall and successively, reach the outlet along the
south vertical wall.

Statewide Airport Stormwater Study FAA Pond Design Criteria – Water Treatment Modeling Report December 2010
Florida Department of Transportation – Aviation Office 76
The use of such an extended surface area is pointless since a large amount of space is occupied
without providing any additional treatment performance advantage.
Figure 45 Fluid pathlines respectively at Q = 821 cfs for generic Rectangular Pond model developed in Fluent 12. The pathlines are colored by Velocity Magnitude.
Outlet
Inlet #1 Inlet #2
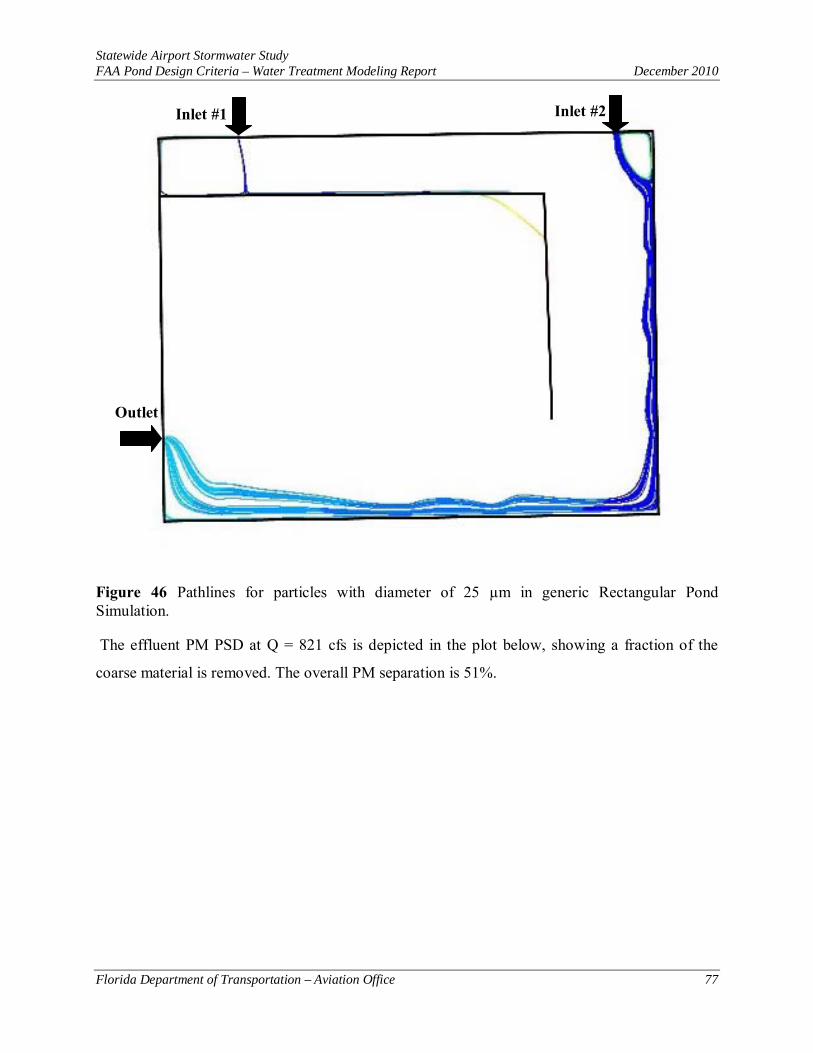
Statewide Airport Stormwater Study FAA Pond Design Criteria – Water Treatment Modeling Report December 2010
Florida Department of Transportation – Aviation Office 77
Figure 46 Pathlines for particles with diameter of 25 µm in generic Rectangular Pond Simulation.
The effluent PM PSD at Q = 821 cfs is depicted in the plot below, showing a fraction of the
coarse material is removed. The overall PM separation is 51%.
Outlet
Inlet #1 Inlet #2

Statewide Airport Stormwater Study FAA Pond Design Criteria – Water Treatment Modeling Report December 2010
Florida Department of Transportation – Aviation Office 78
Particle diameter, μm
0.1110100
% fi
ner b
y m
ass
0
20
40
60
80
100
InfluentEffluent
Figure 47 Particle size distribution (PSD) for influent and effluent particles in generic Rectangular Pond Simulation. Overall Separation (β) is 51 %.
In Figure 48 and Figure 49 the flow pathlines and particle tracks for 25 μm particle diameter are
respectively shown for the Triangular Quarry Pond. The pathlines show the actual path followed
by the flow to escape the system is relatively short, in comparison to the extended dimension of
the unit. At the peak flow rate the finer fraction of the PM PSD is completely eluted from the
system. The effluent PM PSD at Q = 236 cfs is depicted in the plot below. The overall PM
separation is 21% for the Triangular Quarry Pond at the peak flow rate.
β = 51%

Statewide Airport Stormwater Study FAA Pond Design Criteria – Water Treatment Modeling Report December 2010
Florida Department of Transportation – Aviation Office 79
Figure 48 Fluid pathlines at maximum hydraulic capacity of 236 cfs (6682.6 L/s) for generic triangular Pond model developed in CFD, respectively. The pathlines are colored by Velocity Magnitude.
Inlet#2
Inlet#1
Outlet#4
Outlet#3
Outlet#1
Outlet#2
1.00 0.95 0.90 0.85 0.80 0.75 0.70 0.65 0.60 0.55 0.50 0.45 0.40 0.35 0.30 0.25 0.20 0.15 0.10 0.05 0.00

Statewide Airport Stormwater Study FAA Pond Design Criteria – Water Treatment Modeling Report December 2010
Florida Department of Transportation – Aviation Office 80
Figure 49 Discrete particle tracks for 25 µm PM (ρs=2.650 g/cm3) for 236 cfs (6682.6 L/s) for generic triangular Pond model. Particle tracks are colored by particle residence time. In the figures, dark blue and red correspond to the shortest and longest residence times, respectively. However, the color gradation refers to different value range for each picture; therefore, the figure provides only a qualitative representation of the particle tracks as function of residence time.
Inlet#2
Inlet#1
Outlet#4
Outlet#3
Outlet#2
Outlet#1
1.00 0.95 0.90 0.85 0.80 0.75 0.70 0.65 0.60 0.55 0.50 0.45 0.40 0.35 0.30 0.25 0.20 0.15 0.10 0.05 0.00

Statewide Airport Stormwater Study FAA Pond Design Criteria – Water Treatment Modeling Report December 2010
Florida Department of Transportation – Aviation Office 81
Particle diameter, μm
0.1110100
% fi
ner b
y m
ass
0
20
40
60
80
100
InfluentEffluent
Figure 50 Particle size distribution (PSD) for influent and effluent particles for generic triangular quarry Pond. Overall Separation (β) is 21 %.
β = 21%

Statewide Airport Stormwater Study FAA Pond Design Criteria – Water Treatment Modeling Report December 2010
Florida Department of Transportation – Aviation Office 82
6 Conclusions and Recommendations 1. This analysis demonstrates the ability of CFD to model effluent mass and PSDs of
PM as well as the overall PM separation of the Ponds investigated through achieving a
high level of agreement between measured and modeled results. This level of agreement
is accomplished by combining a validated CFD model and representative measurements
of flow and granulometric quantities coupled with mass balance checks. Post-processing
results provided insight into the mechanistic Pond behavior by means of three
dimensional hydraulic profiles and particle trajectories.
2. The very large triangular and rectangular pond models demonstrate that the generic
application of volume and depth (permanent pools having a mean residence time) without
hydrodynamic isolation between inflow and outflow and also hydrodynamic control
within the pond results in highly inefficient utilization of a pond volume. This is
aggravated during extreme events. While such ponds have very low volumetric utilization
and treatment effectiveness (for example, PM separation), they may represent a good
repository for non-hazardous and non-reactive constituents that do not impact the overall
water chemistry.
3. Modeled results for the FAA Linear Pond in companion with experimental data
indicate that PM separation is fairly low varying from 48 to 20 % when the system is
loaded with a silt PSD. However, this performance range is for relatively intense storms
whose intensity will be exceeded less than 20% of the time on an annual basis for the
least intense storm or only once every 25 years for the more intense storms modeled.
Average annual performance should be expected to be better. Based on prior modeling
(FDOT 2007) the expected average annual performance would exceed traditional
presumptive ponds currently incorporated in Florida rules. Since treatment effectiveness
(for example, PM separation or solute reduction) is based on average annual performance
and not extreme events, this does not eliminate an FAA linear pond as a viable water
management option, but suggests a modified form of the pond is likely a better option.
For the FAA Linear Pond, the silt PSD used in this report, as representative of the fine

Statewide Airport Stormwater Study FAA Pond Design Criteria – Water Treatment Modeling Report December 2010
Florida Department of Transportation – Aviation Office 83
yet non-colloidal fraction of a PSD is recommended for use with Newton's Law (Stoke's
law in the laminar settling regime) to establish the appropriate effluent discharge rate.
4. The treatment effectiveness (as PM separation) of a FAA Linear Pond is significantly
improved using a Crenellated Pond with a series of internal baffles for the same surface
area and volume. This has been identified as the best treatment performance within a
given footprint that can be built with features that minimize wildlife attraction. The
Crenellated Pond is characterized by the same surface area of the FAA Linear Pond. By
comparing the modeled flow patterns with those for the case without baffles, it is evident
that flow conditions are significantly improved. In particular, short-circuiting is
considerably mitigated and velocity distribution within the Pond are more evenly
distributed and drastically reduced in magnitude. Additionally, the volume is fully
utilized avoiding the presence of dead zones. These factors significantly favor PM
clarification, increasing the overall PM separation by a factor of 2. For the FAA Linear
Pond, the silt PSD used in this report, as representative of the fine yet non-colloidal
fraction of a PSD is recommended for use with Newton's Law (Stoke's law in the laminar
settling regime) to establish the appropriate SOR. The baffle number and spacing could
be based on the study results, but improved guidance will be developed following full
scale pond testing recognizing that design guidance will be also be guided by individual
site conditions. Major advantages for airport use include minimizing pond surface area to
reduce the attractiveness to hazardous wildlife, minimizing the land required for water
management, designing more maintainable pond systems and still maintaining a high PM
separation per unit volume utilized. Furthermore, the effect of different layouts and
numbers of baffles for given airport constraints can be investigated in CFD to verify
which design best satisfies pre-set requirements in terms of cost, maintenance and overall
performance.
5. The CFD models for the existing ORL pond indicate even baffled Ponds require
spacing and top elevations consistent with a defined performance level during extreme
events. The recommendation is to design the height elevation of the baffles based on the
water level established at the peak flow rate (or at least 75% of Qp) in the 25 year-24 hour

Statewide Airport Stormwater Study FAA Pond Design Criteria – Water Treatment Modeling Report December 2010
Florida Department of Transportation – Aviation Office 84
storm. The baffles placed in the Pond should be appropriately armored to avoid erosion
of the baffles. The location of the baffles may be also improved in order to avoid the
generation of dead zones and to dissipate completely the impinging jet coming from the
inlet pipe. CFD model can be used to investigate different layouts. Potentially, fine PM
and chemicals have a high potential to re-suspend and re-partition during intense events.
6. Periodic preventative maintenance is recommended to lower this potential adverse
effect. The selection of the maintenance frequency should be based on a combination of
rainfall frequency analysis, sediment buildup, and CFD predicted performance of the
pond system. The crenellated pond will likely have the most infrequent maintenance
needs to maintain a satisfactory level of water treatment performance based on the
modeling results reported.

Statewide Airport Stormwater Study FAA Pond Design Criteria – Water Treatment Modeling Report December 2010
Florida Department of Transportation – Aviation Office 85
7 References ASTM Standard D 3977, 1997 (2002). Standard Test Methods for Determining
Sediment Concentration in Water Samples. ASTM International, West
Conshohocken, PA, www.astm.org
Brennen, C. (2005). Fundamentals of Multiphase Flow. New York: Cambridge
University Press
Chow, V., Maidment D., Mays L.W. (1988). Applied Hydrology. New York, NY:
McGraw-Hill
Cristina, C.M. and Sansalone, J.J. (2003). First flush, power law and particle
separation diagrams for urban storm-water suspended particulates. Journal
Environmental Engineering, 129(4), 298–307
Dickenson J. A. and J. J. Sansalone (2009). Discrete Phase Model Representation of
Particulate Matter (PM) for Simulating PM Separation by Hydrodynamic Unit
Operations. Environmental Science Technology, 43(21), 8220–8226
EPA, 2000. National Water Quality Inventory. National Water Quality Report to
Congress under Clean Water Act Section 305(b), retrieved from
http://www.epa.gov/305b/2000report/
FAA, 2007, Advisory Circular 150/5200-33B Hazardous Wildlife Attractants On or
Near Airports
FDOT, 2010, Drainage Manual
FDOT, 2005 : Technical Report for the Florida Statewide Airport Stormwater Study
FDOT, 2007 Application Assessment for the Florida Statewide Airport Stormwater
Study

Statewide Airport Stormwater Study FAA Pond Design Criteria – Water Treatment Modeling Report December 2010
Florida Department of Transportation – Aviation Office 86
Ferziger, J., Peric, M. (2002) Computational Methods for Fluid Dynamics. Springer:
Berlin
Fluent Inc., (2006). Fluent 12 User's Guide, Lebanon, New Hampshire, USA
He, C., Wood, J., Marsalek, J., Rochfort, Q. (2008). Using CFD Modeling to Improve
the Inlet Hydraulics and Performance of a Storm-Water Clarifier. Journal of
Environmental Engineering, 134(9), 722-730
Jakobsen, H.A. (2008). Chemical Reactor Modeling: Multiphase Reactive Flows.
Springer Berlin: Heidelberg
Jillavenkatesa A., Dapkunas S.J. and Lum L.S.H. (2001). Particle Size
Characterization. National Institute of Standards and Technology, Special Publication
960-1, DC Washington
Ma J., Ying G., and Sansalone J. J. (2010). Transport and Distribution of Particulate
Matter Phosphorus Fractions in Rainfall-Runoff from Roadway Source Areas.
Journal of Environmental Engineering, 136 (11), 1197-1205
Magill N., Sansalone J. (2010). Distribution of Particulate-Bound Metals for Source
Area Snow in the Lake Tahoe Watershed. Journal of Environmental Engineering,
136(2), 185-193
Metcalf and Eddy (2003). Wastewater Engineering Treatment and Reuse. Boston:
McGraw-Hill
Pathapati S., Sansalone J.J. (2009a). CFD Modeling of a Storm-Water Hydrodynamic
Separator. Journal of Environmental Engineering, 135(4), 191-202
Pathapati S., Sansalone J.J. (2009b). CFD Modeling of Particulate Matter Fate and
Pressure Drop in a Storm-Water Radial Filter. Journal of Environmental Engineering,
135(2), 77-85

Statewide Airport Stormwater Study FAA Pond Design Criteria – Water Treatment Modeling Report December 2010
Florida Department of Transportation – Aviation Office 87
Sansalone, J. J., and S.-S. Pathapati (2009c). Particle dynamics in a hydrodynamic
separator subject to transient rainfall-runoff. Water Resources Research, 45
doi:10.1029/2008WR007661
Sansalone J.J., Ying G. and Lin H. (2010). Distribution of Metals for Particulate
Matter Transported in Source Area Rainfall-Runoff. Journal Environmental
Engineering, 136(2), 172-184
Ranade, V. V. (2001). Computational Flow Modeling for Chemical Reactor
Engineering. 1st ed., London: Academic
Shih, T.-H.; Liou, W. W.; Shabbir, A.; Yang, Z.; Zhu, J. (1995). A new κ-ε eddy-
viscosity model for high Reynolds Number turbulent flows- model development and
validation. Computational Fluids, 24 (3), 227–238.
St. Johns river management District, Technical publication SJ 88-3: Rainfall analysis
for Northeast Florida, 1988
Teng, Z. and Sansalone, J.J. (2004). In-situ storm water treatment and recharge
through infiltration: Particle transport and separation mechanisms. Journal of
Environmental Engineering, 130(9), 1008-1020
Wu, J.S., Holman, R. E., Dorney, J.R. (1996). Systematic Evaluation of Pollutant
Removal by Urban Wet Detention Ponds. Journal of Environmental Engineering,
122(11), 983-988

Statewide Airport Stormwater Study FAA Pond Design Criteria – Water Treatment Modeling Report December 2010
Florida Department of Transportation – Aviation Office 88
8 Abbreviations and Symbols
AC: Advisory Circular
CDi : Drag coefficient
Cinf : influent concentration [mg/L]
C1, C2 : Empirical constants in the standard k-ε model
CFD : Computational fluid dynamics
dp : particle diameter (μm)
DN : Discretization number
DHL : Dynamic Head Level (ft)
DPM : Discrete particle model
(EMC)inf : Influent Event Mean Concentration [mg/L]
FAA : Federal Aviation Administration
FDEP : Florida Department of Environmental Protection
FDi : Buoyancy/gravitational force per unit particle mass
gi : sum of body sources in the ith direction (m s-2)
GF : Gamma Function
GNV : Gainesville Regional Airport
GPM : Gallons per minute
HDPE : High-density polyethylene
HP : Horse Power
I : Inflow
k : turbulent kinetic energy per unit mass (m2 s-2)

Statewide Airport Stormwater Study FAA Pond Design Criteria – Water Treatment Modeling Report December 2010
Florida Department of Transportation – Aviation Office 89
K1, K2, K3 : empirical constants as function of particle Rei
LPM : Liter per minute
Mξ,τ : PM mass associated with the particle size range ξ as function of injection
time τ
MB : Mixing Pond
MBE : Mass Balance Error
N : Number of particles injected at the inlet section
NB : North Pond
NRCS : National Resource Conservation Service
N-S : Navier-Stokes
NWL : Normal Water Level (ft)
O : Outflow
ORL : Orlando Executive Airport
Pξ,τ,ν : Mass per particle (Kg)
PFR : Plug Flow Reactor
PM : Particulate matter (Kg)
PSD : Particle size distribution
Qp : Peak flow rate (L s-1, cfs, gpm)
Q : Flow rate (L s-1, cfs, gpm)
pj : Reynolds averaged pressure (Kg m-2)
P25year, 24 hour : Rainfall precipitation with return period of 25 year and duration of 24
hour
PBM : Population Balance Model

Statewide Airport Stormwater Study FAA Pond Design Criteria – Water Treatment Modeling Report December 2010
Florida Department of Transportation – Aviation Office 90
PLC : Programmable Logic Control System
QA : Quality Assurance
QC : Quality Control
RANS : Reynolds Averaged Navier Stokes
Rei : Reynold number for a particle
RMSE : Root Mean Squared Error
S : Storage
SCS : Soil Conservation Service
SIMPLE : Semi-Implicit Method for Pressure-Linked Equations
SOR : Surface Overflow Rate
SOR50 : Surface Overflow Rate at median flow rate
SSC : Suspended sediment concentration (mg L-1)
STB : South Treatment Pond
SWMM : Storm Water Management Model
ta: Time to peak rainfall (min)
Td : Total rainfall duration (min)
tp : Time of peak flow rate (min)
Ttot : Duration of runoff event
ui : Reynolds averaged velocity in the ith direction (m s-1)
uj : Reynolds averaged velocity in the jth direction (m s-1)
UO : Unit operation
USDA : United Stated Department of Agriculture
vi : fluid velocity (m s-1)

Statewide Airport Stormwater Study FAA Pond Design Criteria – Water Treatment Modeling Report December 2010
Florida Department of Transportation – Aviation Office 91
vpi : Particle velocity (m s-1)
V : Event Total Volume (L, gal)
VF : Volume fraction
VFD : Variable Frequency Driver
xm : modeled variable
xi : ith direction vector (m)
α : Gamma distribution scale factor
βmeasured : Measured PM Separation
βmodeled : Modeled PM Separation
γ : Gamma distribution shape factor
Δβ : Absolute percentage difference between measured and modeled PM separation
ε : Turbulent energy dissipation viscosity (m2 s-2)
μ : dynamic viscosity (Kg m-1s-1)
ν : Fluid viscosity (m2 s-1)
νΤ : Eddy viscositym2 s-1
ξ : Particle size range (μm)
ρ: fluid density (Kg m-3)
ρp : particle density (Kg m-3)
Computational and fluid constants are available in Dickenson and Sansalone (2009).