faa aerospace forecasts fiscal years 2020-2040€¦ · brazil and russia feel the drag from china...
TRANSCRIPT

9
FAA Aerospace Forecasts Fiscal Years 2020-2040

10
Economic Environment
In the near term, IHS Markit projects that world economic growth will hold steady at about its 2019 rate of 2.6 percent after falling markedly from 3.2 percent in 2018. Econo-mies will require several years to return to their long-run trend growth rates and in the meantime growth is projected at 2.5 percent in 2020 and 2.7 percent in 2021. Strong con-sumer spending continues to drive the U.S. economy and is expected to be sustained even as the effects of the recent fiscal stimu-lus wear off. European growth suffered in 2019 as Germany and Italy weakened con-siderably and political uncertainty impacted confidence, but moderate growth in France, reduced uncertainty about Brexit, and im-
proved financial conditions appear to be re-straining the slowdown. Japan’s economic growth is projected to slow sharply due to an increase in the consumption tax at the end of 2019 but fiscal stimulus and rising employ-ment should mitigate the effects over the coming years. In emerging markets, China’s growth rate continues to gradually decelerate through 6 percent, though braced by govern-ment efforts, while other countries such as Brazil and Russia feel the drag from China and headwinds of falling commodity prices and modest demand from advanced econo-mies. India is expected to post growth rates of about 5 percent in the near-term as high debt levels and a need for structural reforms restrains activity.
IHS Markit forecasts world real GDP to grow at 2.7 percent a year between 2020 and 2040. Emerging markets, at 4.0 percent a year, are forecast to grow above the global average but at lower rates than in the early 2000’s. Asia (excluding Japan), led by India
and China, is projected to have the fastest growth followed by Africa and Middle East, Latin America, and Eastern Europe. Growth in the more mature economies (1.6 percent a year) will be lower than the global trend with the fastest rates in the U.S. followed by
6.2
4.8
2.3
1.2 1.1 1.1 1.1
2.6
0.0
1.0
2.0
3.0
4.0
5.0
6.0
7.0
Annu
al P
erce
nt C
hang
e
China and India Led World Economic Growth in 2019
China India U.S. Eurozone Russia Brazil Japan World
Source: IHS Markit

11
Europe. Growth in Japan is forecast to be very slow at 0.9 percent a year reflecting
deep structural issues associated with a shrinking and aging population.
The average crude oil price in 2019 was down 6 percent from the year before to about $60 per barrel, partially offsetting the in-creases seen in 2017 and 2018. IHS Markit is projecting continued moderation in prices in 2020 and 2021 due to slowing global de-mand combined with modest non-OPEC
supply growth. The price of oil is projected to increase over the long run due to growing global demand and higher costs of extrac-tion. IHS Markit forecasts U.S. refiner's ac-quisition cost of crude to cross the $100 per barrel mark just before the end of the fore-cast in 2040.
Japan
Eurozone
U.S.
Emerging Europe
World
Latin America
M.E. & N. Africa
Asia ex. China & Japan
China
Asia and Middle East/N. Africa Lead Global Economic Growth
Source: IHS Markit, Dec 2019 World Forecast
(annual GDP percent growth 2020-2040)
0.9
1.2
1.9
2.4
2.7
2.8
3.0
3.4
4.3

12
$0
$20
$40
$60
$80
$100
$120$
Per B
arre
l of O
il
Fiscal Year
U.S. Refiners' Acquistion Cost
Source: IHS Markit
U.S. Airlines
Domestic Market
Mainline and regional carriers3 offer domes-tic and international passenger service be-tween the U.S. and foreign destinations, alt-hough regional carrier international service is confined to the border markets in Canada, Mexico, and the Caribbean.
The commercial air carrier industry in 2020 will respond to four trends already underway: (1) selective capacity expansion; (2) steady growth of seats per aircraft, whether through up-gauging or reconfiguring existing aircraft; (3) increasing competitive pressure due to ul-tra-low-cost carrier expansion; and (4) in-
creasing price discrimination4 through ancil-lary revenues and revenue management systems.
Following the 2007-09 recession, the U.S. airline industry underwent considerable re-structuring that has resulted in an unprece-dented period of capacity discipline, espe-cially in domestic markets. Since 2009, U.S. domestic ASMs have increased at an aver-age rate of 2.6 percent per year while RPMs have grown 3.2 percent per year. Although those average rates of growth since the re-cession are modest, they conceal the fact
3 Mainline carriers are defined as those providing service primarily via aircraft with 90 or more seats. Regionals are defined as those providing service primarily via aircraft with 89 or fewer seats
and whose routes serve mainly as feeders to the mainline carriers. 4 Simply defined as the business strategy of sell-ing largely similar products to different custom-ers at different prices.

13
that growth has been picking up over the pe-riod (4.4 percent and 4.6 percent a year since 2014, respectively). ASM growth has risen due to a variety of factors including upgaug-ing, and the expansion of ultra-low-cost car-riers and the competitive response by major carriers, driven in large part by low fuel prices. Looking ahead to the near-term, the acceleration of growth in ASM is likely to con-tinue as some carriers have indicated plans to open new routes and potential new en-trants have announced plans to begin oper-ations. As new service begins, competitors may respond defensively by adding their own new routes, thus further boosting ASM growth.
The period of domestic capacity restraint since 2007 has not been shared equally be-tween the mainline carriers and their regional counterparts. In 2019, the mainline carrier group provided 19.2 percent more capacity than in 2007 while carrying 22.8 percent more passengers. Capacity flown by the re-gional group has risen 5.1 percent over the same 12-year period (with passengers car-ried up 2.1 percent).
The regional market has continued to lose ground as the regionals compete for even fewer contracts with the remaining dominant carriers; this has meant paltry growth in en-planements and yields.
654 690 744 808 880 949 1,023
159 168181
197214
231249
-
200
400
600
800
1,000
1,200
1,400
2019E 2020 2024 2028 2032 2036 2040
Enpl
anem
ents
(mill
ions
)
Fiscal Year
U.S. Commercial Air CarriersDomestic Enplanements by Carrier Group
Mainline Regional

14
The regionals have less leverage with the mainline carriers than they have had in the past as the mainline carriers have negotiated contracts that are more favorable for their op-erational and financial bottom lines. Further-more, the regional airlines are facing some pilot shortages. Their labor costs are in-creasing as they raise wages to combat the pilot shortage while their capital costs have increased in the short-term as they continue to replace their 50 seat regional jets with more fuel-efficient 70 seat jets. The move to the larger aircraft will prove beneficial in the future, however, since their unit costs are lower.
Growing seats per aircraft has been a longstanding trend for regionals that saw this measure rise by more than 55 percent over
the decade from 1997 to 2007. The trend has slowed more recently, however, as re-gional seats per aircraft rose 17 percent over the ten years ending in 2019.
Mainline carriers have also been increasing the seats per aircraft flown although the trend has been accelerating – the reverse of re-gionals' behavior. From 1997-2007, mainline seats per aircraft expanded just one-half of one percent. Since 2009, this measure has grown 10 percent.
Another continuing trend is that of ancillary revenues. Carriers generate ancillary reve-nues by selling products and services be-yond that of an airplane ticket to customers. This includes the un-bundling of services previously included in the ticket price such as
14.1 14.215.1
16.517.6
18.820.0
11.6 11.612.5
13.614.5
15.416.4
-
5.00
10.00
15.00
20.00
25.00
2019E 2020 2024 2028 2032 2036 2040
Rev
enue
Per
Mile
(¢)
Fiscal Year
U.S. Commercial Air CarriersDomestic Passenger Nominal Yield
Mainline Regionals

15
checked bags, on-board meals and seat se-lection, and by adding new services such as boarding priority and internet access. After posting record net profits in 2015, U.S. pas-senger carrier profits declined in the subse-quent three years on rising fuel and labor costs, and flat yields. Nevertheless, profits remain solid and supported by ancillary rev-enues and the implementation of increas-ingly sophisticated revenue management systems. These systems enable carriers to price fares optimally for each day and time of flight and minimize foregone revenue. Be-sides this method of price discrimination, air-lines are continuing to implement plans to further segment their passengers into more discreet cost categories based on comfort amenities like seat pitch, leg room, and ac-cess to social media and power outlets. In 2015, Delta introduced “Basic Economy” fares that provided customers with a main cabin experience at lower cost in exchange for fewer options. By the end of 2017 these fares were available in 100% of Delta’s do-mestic network. In February 2017, American began offering its version, and had expanded to the entire domestic network by Septem-ber. United deployed its version of Basic Economy fares across its domestic network in May 2017, but quickly pulled back the
scale of deployment across its domestic net-work as negative revenue impacts were more than anticipated.
The offering of Basic Economy fares has been part of an effort by network carriers to protect market share in response to the rapid growth low cost carriers (LCC) have achieved in recent years. While mainline en-planements have increased almost 23 per-cent since 2007, and regionals' have risen 2 percent, low cost carrier enplanements have grown by 39 percent. RPMs over the same period show a similar pattern with mainline RPMs up almost 27 percent, regional RPMs up 11 percent and LCC RPMs fully 48 per-cent higher.
U.S. commercial air carriers’ total number of domestic departures rose for the second year in a row in 2019, leaving them about 15 percent below the 2007 level. ASMs, RPMs and enplanements, however, all grew in each of the past nine years; these trends un-derlie the expanding size of aircraft and higher load factors.5 In 2019, the domestic load factor bumped up to 85.1 percent – a new historic high. Load factor is forecast to rise and peak around 86.8 percent in the fu-ture due to the logistical difficulties inherent in matching supply perfectly with demand.
5 Commercial air carriers encompass both main-line and regional carriers.

16
84.0
84.5
85.0
85.5
86.0
86.5
87.0
0.0
1.0
2.0
3.0
4.0
5.0
6.0
7.0
2019E 2022 2025 2028 2031 2034 2037 2040
Load
Fac
tor
Annu
al P
erce
nt C
hang
e
Fiscal Year
U.S. Commercial Air CarriersDomestic Market
ASMs RPMs Enplanements Load Factor (right axis)
System (the sum of domestic plus interna-tional) capacity increased 3.4 percent to 1.236 trillion ASMs in 2019 while RPMs in-creased 4.3 percent to 1.044 trillion. During the same period system-wide enplanements increased 4.1 percent to 916.7 million. In 2019, U.S. carriers continued to prioritize the domestic over the international market in terms of allocating capacity as domestic ca-pacity increased 4.0 percent while interna-tional capacity was up just 2.1 percent. U.S. carriers' domestic capacity growth will ex-ceed their international capacity growth in 2020 but carriers will start expanding capac-ity in international markets faster than do-mestic markets beginning in 2022 and this trend is projected to continue through 2040 as the domestic market continues to mature.
U.S. mainline carrier enplanement growth in the combined domestic and international market was 4.3 percent in 2019 while re-gional carriers carried 3.5 percent more pas-sengers.
In the domestic market, mainline enplane-ments increased for the ninth consecutive year, up 4.3 percent, marking the first time since 2000 that the industry recorded nine consecutive years of passenger growth in the domestic market. Mainline passengers in international markets posted the tenth year of growth, up 4.1 percent. Domestic mainline enplanement growth is forecast to remain strong, increasing at 5.5 percent in 2020 be-fore slowing as economic activity cools and averaging 2.0 percent annually over the fore-cast. After slowing during the early part of

17
the forecast, international mainline enplane-ments are expected to accelerate to an aver-age of 3.2 percent through the forecast hori-zon.
With relatively robust demand, industry ca-pacity growth was up 3.4 percent in 2019 af-ter a 4.4 percent increase in 2018. The in-creased passenger volume and traffic offset slow yield growth and along with higher an-cillary revenues and relatively low fuel prices, U.S. carriers were solidly profitable in 2019. Domestic mainline capacity is expected to match the pattern of enplanements with strong 5.7 percent growth in 2020, followed by more moderate growth at about the long
term trend. International mainline enplane-ments are forecast to slow somewhat over the next two years before picking up and re-turning to growth of about 3.4 percent through the remainder of the forecast.
System load factor rose by seven tenths of a percentage point while trip length increased 2.2 miles (0.2 percent) in 2019, even as seats per aircraft mile increased by 0.9 per-cent; again reflecting the trend towards using larger aircraft. Seats per aircraft mile sys-tem-wide increased to 157.5 seats (up 1.3 seats per aircraft mile), the highest level since 1990.
18
International Market
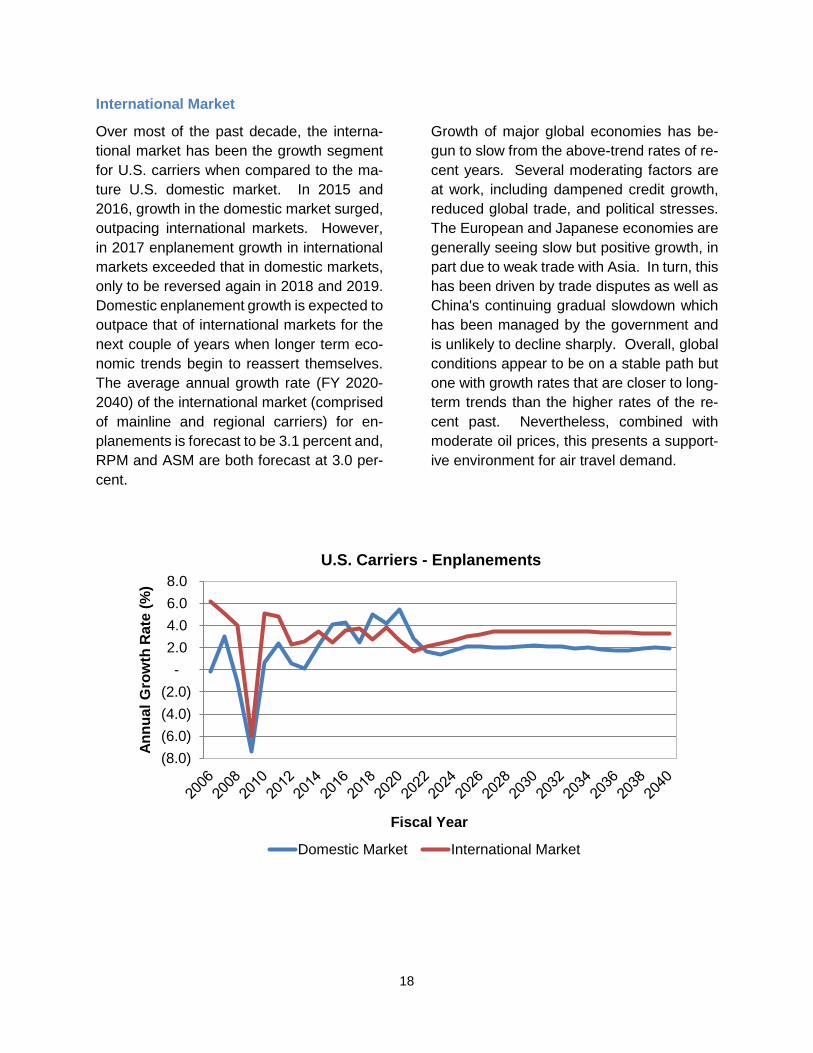
Over most of the past decade, the interna-tional market has been the growth segment for U.S. carriers when compared to the ma-ture U.S. domestic market. In 2015 and 2016, growth in the domestic market surged, outpacing international markets. However, in 2017 enplanement growth in international markets exceeded that in domestic markets, only to be reversed again in 2018 and 2019. Domestic enplanement growth is expected to outpace that of international markets for the next couple of years when longer term eco-nomic trends begin to reassert themselves. The average annual growth rate (FY 2020-2040) of the international market (comprised of mainline and regional carriers) for en-planements is forecast to be 3.1 percent and, RPM and ASM are both forecast at 3.0 per-cent.
Growth of major global economies has be-gun to slow from the above-trend rates of re-cent years. Several moderating factors are at work, including dampened credit growth, reduced global trade, and political stresses. The European and Japanese economies are generally seeing slow but positive growth, in part due to weak trade with Asia. In turn, this has been driven by trade disputes as well as China's continuing gradual slowdown which has been managed by the government and is unlikely to decline sharply. Overall, global conditions appear to be on a stable path but one with growth rates that are closer to long-term trends than the higher rates of the re-cent past. Nevertheless, combined with moderate oil prices, this presents a support-ive environment for air travel demand.
(8.0) (6.0) (4.0) (2.0)
- 2.0 4.0 6.0 8.0
Annu
al G
row
th R
ate
(%)
Fiscal Year
U.S. Carriers - Enplanements
Domestic Market International Market
19
(10.0) (8.0) (6.0) (4.0) (2.0)
- 2.0 4.0 6.0 8.0
Annu
al G
row
th R
ate
(%)
Fiscal Year
U.S. Carriers - RPMs
Domestic Market International Market
(10.0) (8.0) (6.0) (4.0) (2.0)
- 2.0 4.0 6.0 8.0
Annu
al G
row
th R
ate
(%)
Fiscal Year
U.S. Carriers - ASMs
Domestic Market International Market
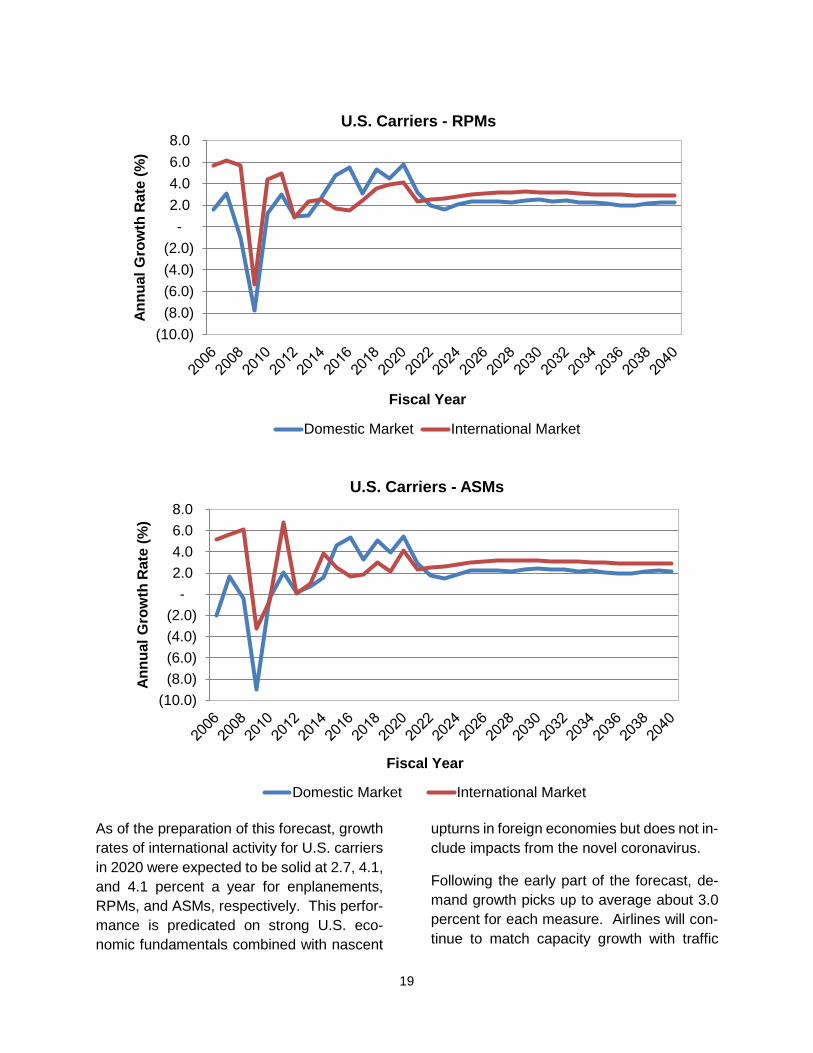
As of the preparation of this forecast, growth rates of international activity for U.S. carriers in 2020 were expected to be solid at 2.7, 4.1, and 4.1 percent a year for enplanements, RPMs, and ASMs, respectively. This perfor-mance is predicated on strong U.S. eco-nomic fundamentals combined with nascent
upturns in foreign economies but does not in-clude impacts from the novel coronavirus.
Following the early part of the forecast, de-mand growth picks up to average about 3.0 percent for each measure. Airlines will con-tinue to match capacity growth with traffic

20
growth and load factor is expected to stabi-lize around 82.9%. This surpasses the pre-vious record high load factor seen in 2013.
0.0
0.5
1.0
1.5
2.0
2.5
3.0
3.5
4.0
4.5
2019E 2022 2025 2028 2031 2034 2037 2040
Annu
al P
erce
nt C
hang
e
Fiscal Year
U.S. Commercial Air CarriersInternational Market
ASMs RPMs Enplanements
For U.S. carriers, Latin America remains the largest international destination despite the recent economic and political crises in Vene-zuela and Brazil. Enplanements in 2019 grew an estimated 4.0 percent while RPMs increased 2.2 percent. Growth is projected to ease considerably in 2020 and 2021 as U.S. carriers trim capacity expansion to sup-port yields. Enplanements and RPMs are forecast to increase 0.6 and 1.1 percent, re-spectively, in 2020. Over the twenty-year pe-riod 2020-2040, Latin America enplane-ments are forecast to increase at an average rate of 3.8 percent a year while RPMs grow 4.0 percent a year.
The Pacific region is the smallest in terms of enplanements despite the economic growth and potential of air travel to the region's emerging markets. In 2019, U.S. carriers
saw enplanements decline 0.9 percent from their 2018 levels, mainly due to a sharp slow-down in travel between the U.S. and China and India, markets that had recently posted very strong growth. Meanwhile, traffic (RPMs) increased by just 0.4 percent. Alt-hough the region is forecast to have the high-est economic growth of any region over the next 20 years, led by China and India, U.S. carrier enplanements and RPMs for the Pa-cific region are forecast to grow a modest 2.2 and 2.3 percent a year, respectively. Traffic growth is relatively moderate in part because U.S. carriers continue to have a majority of their service in the region to Japan as op-posed to faster growing countries.
After contracting in 2015 and 2016, the At-lantic region has accelerated steadily in re-cent years. By 2019, enplanements grew of

21
7.0 percent as and RPMs expanded by 7.7 percent. This growth has been supported by U.S. demand as well as growth of Middle East and African markets, even as the Euro-pean economies slowed in 2019. While Western Europe is a mature area with mod-erate economic growth, the economically smaller Middle East and Africa areas are ex-panding rapidly with GDP growth rates more
than twice that of Europe. As a result, a larger share of the forecast aviation demand in the Atlantic region is linked to those two areas, particularly in the second half of the forecast period. Over the twenty-year period from 2020 to 2040, enplanements in the At-lantic region are forecast to grow at an aver-age annual rate of 2.2 percent a year while RPMs grow 2.5 percent a year.
88 91 101 115 131 147 164
88 91 99115
134156
182
44 4553
6271
8090
32 3236
4147
53
60
0
100
200
300
400
500
600
2019 2020 2024 2028 2032 2036 2040
Mill
ions
of P
asse
nger
s
Calendar Year
Total Passengers To/From the U.S.American and Foreign Flag Carriers
Atlantic* L. America Pacific Canada TransborderSource: US Customs & Border Protection data processed and released by Department of Commerce; data also received from Transport Canada* Per past practice, the Mid-East region and Africa are included in the Atlantic category.
Total passengers (including Foreign Flag carriers) between the United States and the rest of the world increased an estimated 3.2 percent to 252 million in 2019 as all regions
posted gains led by a 4.1 percent increase in the Atlantic region.

22
FAA projects total international passenger growth of 2.9 percent in 2020 as global eco-nomic growth remains modest with the high-est passenger growth expected in the Atlan-tic and Pacific regions. Moderate global eco-nomic growth averaging 2.9 percent a year over the next 20 years (2020-2040) is the foundation for the forecast growth of interna-tional passengers of 3.3 percent a year, as levels almost double from 252 million to 496 million.
The Latin American region is the largest in-ternational market and is projected to grow at the fastest rate (3.5 percent a year) of any region over the forecast period. Within the region, Mexico and Dominican Republic are the two largest markets and are expected to post average annual growth rates of 3.6 per-cent and 4.4 percent, respectively.
Powered by economic growth and rising in-comes in China, India and South Korea, total
passengers in the Pacific region are forecast to more than double to 90 million by 2040. From 2020 to 2040, passengers between the United States and the Pacific region are fore-cast to grow 3.5 percent a year.
Both the Atlantic and Canada regions are more mature markets and are projected to have somewhat slower growth than the Latin or Pacific regions. The Atlantic region is fore-cast to grow at an average rate of 3.0 percent a year as an increasing share of the passen-gers in this region come from the Middle East and Africa markets. Though sizable and comparable to Mexico in passenger traffic, the Canadian transborder market is consid-erably smaller than the Atlantic region. With solid North American economic growth, Can-ada transborder passengers are forecast to grow at an annual average of 3.2 percent a year over the next 20 years.
Cargo
Air cargo traffic includes both domestic and international freight/express and mail. The demand for air cargo is a derived demand re-sulting from economic activity. Cargo moves in the bellies of passenger aircraft and in dedicated all-cargo aircraft on both sched-uled and nonscheduled service. Cargo car-riers face price competition from alternative shipping modes such as trucks, container ships, and rail cars, as well as from other air carriers.
U.S. air carriers flew 42.9 billion revenue ton miles (RTMs) in 2019, up just 0.2 percent from 2018 with domestic cargo RTMs in-creasing 2.8 percent to 16.2 billion while in-ternational RTMs contracted 1.3 percent to 26.6 billion. Air cargo RTMs flown by all-
cargo carriers comprised 80.3 percent of to-tal RTMs in 2019, with passenger carriers fly-ing the remainder. Total RTMs flown by the all-cargo carriers increased 2.3 percent in 2019 while total RTMs flown by passenger carriers fell by 7.2 percent.
U.S. carrier international air cargo traffic spans four regions consisting of Atlantic, Latin, Pacific, and ‘Other International.’
Historically, air cargo activity tracks with GDP. Other factors that affect air cargo growth are fuel price volatility, movement of real yields, globalization and trade.

23
The forecasts of revenue ton miles rely on several assumptions specific to the cargo in-dustry. First, security restrictions on air cargo transportation will remain in place. Second, most of the shift from air to ground transportation has occurred. Finally, long-term cargo activity depends heavily on eco-nomic growth.
The forecasts of RTMs derive from models that link cargo activity to GDP. Forecasts of domestic cargo RTMs use real U.S. GDP as the primary driver of activity. Projections of international cargo RTMs depend on growth in world and regional GDP, adjusted for infla-tion. FAA forecasts the distribution of RTMs between passenger and all-cargo carriers based on an analysis of historic trends in shares, changes in industry structure, and market assumptions.
After increasing by just 0.2 percent in 2019, total RTMs are expected to recover and grow 4.5 percent in 2020. Because of steady U.S. and world economic growth in the long term, FAA projects total RTMs to increase at an av-erage annual rate of 3.5 percent for the bal-ance of the forecast period (from 2020 to 2040).
Following a 2.8 percent increase in 2019, do-mestic cargo RTMs are projected to grow 1.9
percent in 2020 as the global trade slowdown impacts domestic activity. Between 2020 and 2040, domestic cargo RTMs are forecast to increase at an average annual rate of 1.9 percent. In 2019, all-cargo carriers carried 90.9 percent of domestic cargo RTMs. The all-cargo share is forecast to grow modestly to 92.2 percent by 2040 based on increases in capacity for all-cargo carriers.
International cargo RTMs fell 1.3 percent in 2019 after posting a 10.0 percent increase in 2018. Trade disputes and slower economic growth around the world have materially im-pacted global trade. Growth in international RTMs recover in 2020, growing at 6.2 per-cent as foreign economies regain their foot-ing and some trade disputes are resolved. For the forecast period (2020-2040), interna-tional cargo RTMs are expected to increase an average of 4.2 percent a year based on projected growth in world GDP with the Other International region having the fastest growth (5.0 percent), followed by the Pacific (4.7 percent), Atlantic (3.1 percent), and Latin America regions (1.3 percent).
The share of international cargo RTMs flown by all-cargo carriers is forecast to increase from 73.8 percent in 2019 to 79.0 percent by 2040.

24
General Aviation
The FAA uses estimates of fleet size, hours flown, and utilization rates from the General Aviation and Part 135 Activity Survey (GA Survey) as baseline figures to forecast the GA fleet and activity. Since the survey is conducted on a calendar year (CY) base and the records are collected by CY, the GA fore-cast is done by CY. Forecasts of new aircraft deliveries, which use the data from General Aviation Manufacturers Association (GAMA), together with assumptions of retirement rates, produce growth rates of the fleet by air-craft categories, which are applied to the GA Survey fleet estimates. The forecasts are carried out for “active aircraft,”6 not total air-craft. The FAA’s general aviation forecasts also rely on discussions with the industry ex-perts conducted at industry meetings, includ-ing Transportation Research Board (TRB) meetings of Business Aviation and Civil Heli-copter Subcommittees conducted twice a year in January and June.
The results of the 2018 GA Survey, the latest available, were consistent with the results of surveys conducted since 2004 improve-
ments to the survey methodology. The ac-tive GA fleet was estimated to be 211,749 aircraft in 2018 (0.0 percent change from 2017), as increases in fixed wing piston, fixed wing turbine, and experimental aircraft were offset by declines in rotorcraft and other air-craft (gliders and lighter than air). Total hours flown were estimated to be 25.5 mil-lion, up 1.2 percent from 2017. Increases in fixed wing piston and fixed wing turbine air-craft more than offset sharp declines in ro-torcraft and experimental aircraft.
In 2019, deliveries of the general aviation air-craft manufactured in the U.S. increased slightly to 1,771, 1.4 percent higher than in CY 2018. Deliveries of single-engine piston aircraft were up 7.0 percent while multi-en-gine piston deliveries were flat. Business jet deliveries were up by 6.3 percent, but turbo-prop deliveries were down by 13.3 percent. Overall piston deliveries were up 6.5 percent while turbine shipments were down by 3.2 percent. Based on figures released by GAMA, they amounted to $14.0 billion in fac-tory net billings, a record for the U.S. indus-try.
6 An active aircraft is one that flies at least one hour during the year.

25
GAMA and industry experts reported the ro-torcraft deliveries declined in 2019 in both piston and turbine segments.
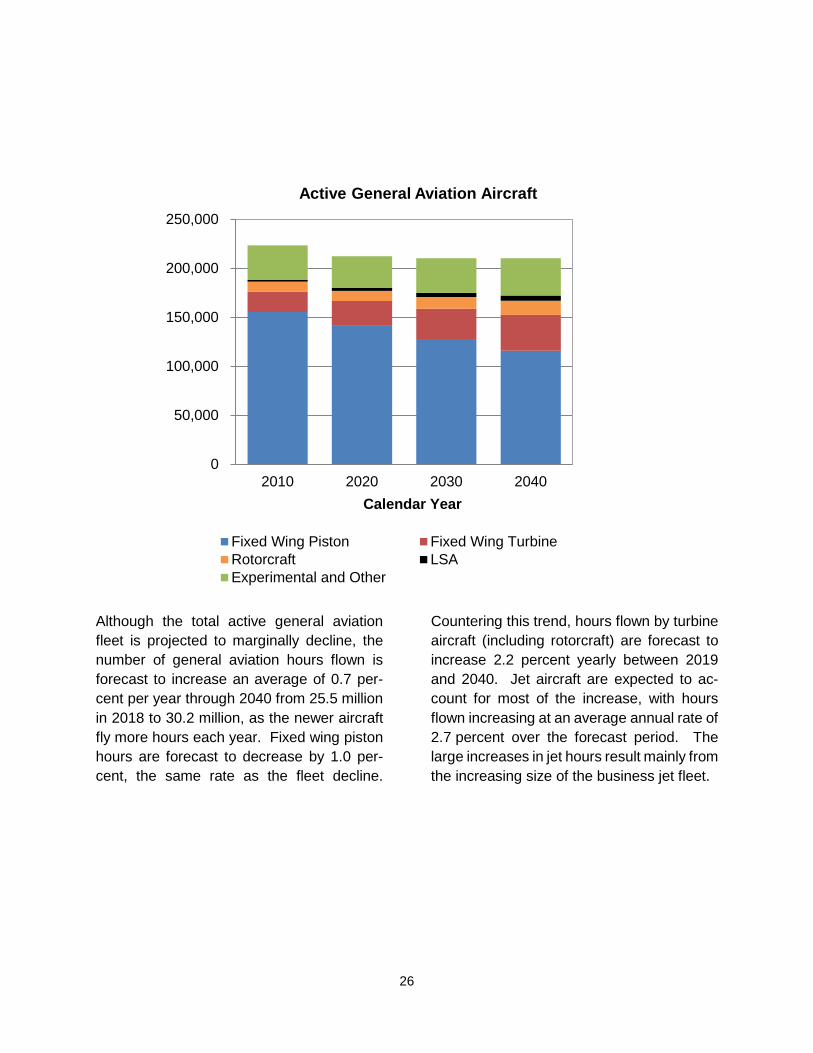
Against these current conditions, the long- term outlook for general aviation, driven by turbine aircraft activity, remains stable. The active general aviation fleet is projected to decrease slightly from its current level, as the declines in the fixed-wing piston fleet remain just above the increases in the turbine, ex-perimental, and light sport fleets. The total active general aviation fleet changes from an estimated 212,335 in 2019 to 210,380 air-craft by 2040 (a small decline of 0.9 percent).
The more expensive and sophisticated tur-bine-powered fleet (including rotorcraft) is projected to grow by 14,640 aircraft -- an av-erage rate of 1.8 percent a year between
2019 and 2040, with the turbojet fleet in-creasing 2.3 percent a year. The growth in U.S. GDP and corporate profits are catalysts for the growth in the turbine fleet.
The largest segment of the fleet, fixed wing piston aircraft, is predicted to shrink over the forecast period by 26,365 aircraft (an aver-age annual rate of -1.0 percent). Unfavora-ble pilot demographics, overall increasing cost of aircraft ownership, availability of much lower cost alternatives for recreational usage, coupled with new aircraft deliveries not keeping pace with retirements of the ag-ing fleet are the drivers of the decline.
On the other hand, the smallest category, light-sport-aircraft (created in 2005), is fore-cast to grow by 3.4 percent annually, adding about 2,730 new aircraft by 2040, more than doubling its 2018 fleet size.
Billings ($B)Shipments
Calendar Year
General AviationU.S. Manufactured Aircraft Shipments and Billings
Shipments Billings ($ Billion)Source: GAMA
$0
$2
$4
$6
$8
$10
$12
$14
$16
-
500
1,000
1,500
2,000
2010 2011 2012 2013 2014 2015 2016 2017 2018 2019
26
Although the total active general aviation fleet is projected to marginally decline, the number of general aviation hours flown is forecast to increase an average of 0.7 per-cent per year through 2040 from 25.5 million in 2018 to 30.2 million, as the newer aircraft fly more hours each year. Fixed wing piston hours are forecast to decrease by 1.0 per-cent, the same rate as the fleet decline.
Countering this trend, hours flown by turbine aircraft (including rotorcraft) are forecast to increase 2.2 percent yearly between 2019 and 2040. Jet aircraft are expected to ac-count for most of the increase, with hours flown increasing at an average annual rate of 2.7 percent over the forecast period. The large increases in jet hours result mainly from the increasing size of the business jet fleet.
0
50,000
100,000
150,000
200,000
250,000
2010 2020 2030 2040Calendar Year
Active General Aviation Aircraft
Fixed Wing Piston Fixed Wing TurbineRotorcraft LSAExperimental and Other

27
0
5,000
2010 2020 2030 2040Calendar Year
General Aviation Hours Flown(in thousands)
Fixed Wing Piston Fixed Wing TurbineRotorcraft LSAExperimental and Other
10,000
15,000
20,000
25,000
30,000
35,000
Rotorcraft activity, which was not as heavily impacted by the previous economic down-turn as other aircraft and rebounded earlier, faces the challenges brought by lower oil prices, a trend which has been continuing. The low oil prices impacted utilization rates and new aircraft orders both directly through decreasing activity in oil exploration, and also through a slowdown in related economic activity. While significant use in other activi-ties such as air medical, training, air taxi and tours continues, the 2018 GA Survey showed a 5.0 percent decrease in the active fleet and a 12.0 percent decrease in hours flown. The fleet is projected to grow at a sim-ilar rate to previous year’s forecast, although starting from a lower base and at a slower pace in the piston segment. Rotorcraft hours are projected to grow by 2.1 percent annually over the forecast period.
Lastly, the light sport aircraft category is fore-casted to see an increase of 4.2 percent a year in hours flown, primarily driven by growth in the fleet.
The FAA also conducts a forecast of pilots by certification categories, using the data com-piled by the Administration’s Mike Monroney Aeronautical Center. There were 664,565 active pilots certificated by FAA at the end of 2019. The number of certificates in most pi-lot categories continued to increase, with the exception of private, rotorcraft only and rec-reational certificates. The FAA has sus-pended the student pilot forecast for the third consecutive year. The number of student pi-lot certificates has been affected by a regu-latory change that went into effect in April 2016 and removed the expiration date on the new student pilot certificates. The number of student pilots jumped from 128,501 at the end of 2016 to 149,121 by the end of 2017,
28
and to 197,665 at the end of 2019. The 2016 rule change generates a cumulative increase in the certificate numbers and breaks the link between student pilot and advanced certifi-cate levels of private pilot or higher. There is no sufficient data yet to perform a reliable forecast for the student pilots.
Commercial and air transport pilot (ATP) cer-tificates have been impacted by a legislative change as well. The Airline Safety and Fed-eral Aviation Administration Extension Act of 2010 mandated that all part 121 (scheduled airline) flight crew members would hold an ATP certificate by August 2013. Airline pilots holding a commercial pilot certificate and mostly serving at Second in Command posi-tions at the regional airlines could no longer operate with only a commercial pilot certifi-cate after that date, and the FAA data initially showed a faster decline in commercial pilot
numbers, accompanied by a higher rate of increase in ATP certificates. The number of both commercial pilot and ATP certificates have been increasing for the last three years, to 100,863 and 164,947, respectively by the end of 2019.
The number of active general aviation pilots (excluding students and ATPs) is projected to decrease about 12,120 (down 0.2 percent yearly) between 2019 and 2040. The ATP category is forecast to increase by 25,150 (up 0.7 percent annually). The much smaller category of sport pilots are predicted to in-crease by 2.9 percent annually over the fore-cast period. On the other hand, both private and commercial pilot certificates are pro-jected to decrease at an average annual rate of 0.6 and 0.1 percent, respectively until 2040.

29
0
100,000
200,000
300,000
400,000
500,000
600,000
2009 2019 2029 2040Calendar Year
Active Pilots by Type of Certificate
Sport Pilot Private PilotCommercial Pilot Airline Transport PilotRotorcraft only

30
FAA Operations
The growth in air travel demand and the busi-ness aviation fleet will drive growth in opera-tions at FAA facilities over the forecast pe-riod. Activity at FAA and contract towers is forecast to increase at an average rate of 0.9 percent a year through 2040 from 53.3 mil-lion in 2019 to close to 64.6 million in 2040. Commercial operations7 at these facilities are forecast to increase 1.6 percent a year, approximately four times faster than non-commercial operations. The growth in com-mercial operations is less than the growth in U.S. airline passengers (1.6 percent versus 2.2 percent) over the forecast period due pri-marily to larger aircraft (seats per aircraft mile) and higher load factors. Both of these
trends allow U.S. airlines to accommodate more passengers without increasing the number of flights. General aviation opera-tions (which accounted for 51.4 percent of operations in 2019) are forecast to increase an average of 0.4 percent a year as in-creases in turbine powered activity more than offset declines in piston activity.
The growth in operations at towered airports is not uniform. Most of the activity at large and medium hubs8 is commercial in nature, given that these are the airports where most of the passengers, about 88 percent in 2019, in the system fly to.
7 Sum of air carrier and commuter/air taxi cate-gories. 8 Large hub is defined to have 1 percent or more of total U.S. revenue passenger enplanements in FY 2019. There are 30 airports in this category.
Medium hub is defined to have at least 0.25 per-cent but less than 1 percent of total U.S. revenue passenger enplanements in FY 2019. There are 31 airports classified as medium hubs.
0
10,000
20,000
30,000
40,000
50,000
60,000
70,000
2010 2020 2030 2040
Ope
ratio
ns (0
00)
Fiscal Year
FAA & Contract Tower Operations
Commercial Non Commercial

31
Given the growth in airline demand and most of that demand is at large and medium hubs, activity at the large and medium hubs is fore-cast to grow substantially faster than small towered airports including small FAA towers9 and FAA contract towers10. The forecasted annual growth is 1.7 percent at large hubs, 1.6 at medium hubs, 0.5 percent at small FAA towers and FAA contract towers be-tween 2019 and 2040.
Among the 30 large hubs, the airports with the fastest annual growth forecast are those located along the coastal sections of the country where most large cities are located. Large cities have historically shown to gen-erate robust economic activity, which in turn drives up the airline demand. On the other hand, the airports forecast to have slower an-nual growth tend to be located in the middle of the country.
FAA Tracon (Terminal Radar Approach Con-trol) Operations11 are forecast to grow slightly faster than at towered facilities. This is in part a reflection of the different mix of activity at Tracons. Tracon operations are forecast to increase an average of 1.1 per-
cent a year between 2019 and 2040. Com-mercial operations accounted for approxi-mately 60 percent of Tracon operations in 2019 and are projected to grow 1.5 percent a year over the forecast period. General avi-ation activity at these facilities is projected to grow only 0.25 percent a year over the fore-cast.
The number of IFR aircraft handled is the measure of FAA En-Route Center activity. Growth in airline traffic and business aviation is expected to lead to increases in activity at En-Route centers. Over the forecast period, aircraft handled at En-Route centers are forecast to increase at an average rate of 1.5 percent a year, with commercial activity growing at the rate of 1.7 percent annually. Activity at En-Route centers is forecast to grow faster than activity at towered airports and FAA Tracons because more of the activ-ity at En-Route centers is from the faster growing commercial sector and high-end (mainly turbine) general aviation flying.12 In 2019, the share of commercial IFR aircraft handled at FAA En-Route centers is about 82 percent, which is greater than the 60 per-cent share at Tracons or the 44 percent share at FAA and Contract Towers.
9 Small FAA towers are defined as towered air-ports that are neither large or medium hubs nor FAA contract towers. 10 FAA contract towers are air traffic control tow-ers providing air traffic control services under contract with FAA, staffed by contracted air traffic control specialists.
11 Tracon operations consist of itinerant Instru-ment Flight Rules (IFR) and Visual Flight Rules (VFR) arrivals and departures at all airports in the domain of the Tracon as well as IFR and VFR overflights. 12 Much of the general aviation activity at tow-ered airports, which is growing more slowly, is local in nature, and does not impact the centers.

32
U.S. Commercial Aircraft Fleet
The number of aircraft in the U.S. commer-cial fleet is forecast to increase from 7,628 in 2019 to 9,421 in 2040, an average annual growth rate of 1 percent a year. Increased demand for air travel and growth in air cargo is expected to fuel increases in both the pas-senger and cargo fleets.
Between 2019 and 2040 the number of jets in the U.S. mainline carrier fleet is forecast to grow from 4,388 to 5,310, a net average of 44 aircraft a year as carriers continue to re-move older, less fuel efficient narrow body aircraft. The narrow-body fleet (including E-series aircraft as well as A220-series at Jet-Blue and A220-series at Delta) is projected to grow 35 aircraft a year as carriers replace the 757 fleet and current technology 737 and A320 family aircraft with the next generation MAX and Neo families. The wide-body fleet grows by an average of 12 aircraft a year as carriers add 777-8/9, 787’s, A350’s to the fleet while retiring 767-300 and 777-200 air-craft. In total the U.S. passenger carrier wide-body fleet increases by 1.8 percent over the forecast period.
The regional carrier fleet is forecast to de-cline from 2,361 aircraft in 2019 to 2,320 in
2040 as the fleet shrinks by 1.7 percent (41 aircraft) between 2019 and 2040. Carriers remove 50 seat regional jets and retire older small turboprop and piston aircraft, while adding 70-90 seat jets, especially the E-2 family after 2020. By 2031 only a handful of 50 seat regional jets remain in the fleet. By 2040, the number of jets in the regional car-rier fleet totals 2,192, up from 1,846 in 2019. The turboprop/piston fleet is forecast to shrink by 71% from 515 in 2019 to 128 by 2040. These aircraft account for just 5.5 per-cent of the fleet in 2040, down from 21.8 per-cent in 2019.
The cargo carrier large jet aircraft fleet is forecast to increase from 879 aircraft in 2019 to 1,791 aircraft in 2040 driven by the growth in freight RTMs. The narrow-body cargo jet fleet is projected to increase by 11 aircraft a year as 757’s and 737-800’s are converted from passenger use to cargo service. The wide body cargo fleet is forecast to increase 33 aircraft a year as new 747-800, 777-200, and new and converted 767-300 aircraft are added to the fleet, replacing older MD-11, A300/310, and 767-200 freighters.

33
01,0002,0003,0004,0005,0006,0007,0008,0009,000
10,000
2009 2019 2029 2040Calendar Year
U.S. Carrier Fleet
Mainline NB Mainline WB
Cargo Jet Regionals