fa ji7d0 report 3 - us department of energywipp.energy.gov/library/information_repository_a...site...
TRANSCRIPT
!t,.
FA 7 ji7d0
SAPIDIA REPORT SAND^^-2922 Unlimited Release UC-70 3 g s 5$7 272 - Printed April 1983 2 9 2
FA &d4dJ-+
. \ Waste Isolation Pilot Plant (WIPP) Site
- Gravity Survey and Interpretation
w
+C Lawrence J. Barrows, Sue-Ellen Shaffer, Warren 6. Miller, John D. Fett
IY Prepared by Sandia Natlonal Laboratorler Albuquerque. New Mexico 87 185 and Livermore. Calltornia 94550 tor the United Stater Department ot Energy under Contract DE-ACO4-76DW0789
Inued by 9.ndi. Natiod hbamtoria, o p e d for tbo United Shtu Ikpuramnt d Emrw by SudL Cmmuoa
mentmor m v urnev tkmmf. nor m v of their w n l ~ ~ d ~ nor m v of tlmir ""Orr &&n* & the@ eployaa, +;py -6, e r p r a or un~lrd or rarma m v W Wty or n n w w r b i W for the accumcv. mmpi- or w& d i y infomUt i~a . ' . ~~ ,& p e w % or PI& coudrrfowdor rsorrvntathtiUum would not d m ~nvataly owned righa Rd& k i n tn m y spocific commerdrl p;odiut, p h or -2 t r d e nuno, t n b m u ~ mmufammr, or othurls, dona not y anutituta w imply it.edonemsnt, tion. on. or fayo- bv lb. United St.- Covenmenh m y r a s ~ ~ tbmof or m y of their &fnctnn w arboootr&on Tb. viewi 4 op-him --henin do not mcwunly nut. or nfloct tkaa of tb. United S U - Cavsrnmrnh m y
Rinted in the United Shtu d America AvliLbl. from NatioMl Tdulial Infomation Senice U.S. Depnrtauut of Commslrs 5286 Port h y d Rod Springikld, VA 22161
NTIS pria coda Priatad copy A06 Microfieha cow: A01

Sandia National Laboratories
date: May 16, 1983 Albuquerque. New Mexico 87185
10: D i s t r i b u t i o n f o r SAND82-2922 Report
from: L. J. Barrows - 7111
subject: E r r a t a i n SAND82-2922, Vaste I s o l a t i o n P i l o t P l a n t (WIPP) . S i t e Gravi ty Survey and I n t e r p r e t a t i o n , d t d Apr i l 1983
The fol lowing informat ion i s missing from t h e f i g u r e capt ion of Figure 2.1-4 on p 43 o f t h e referenced r epo r t :
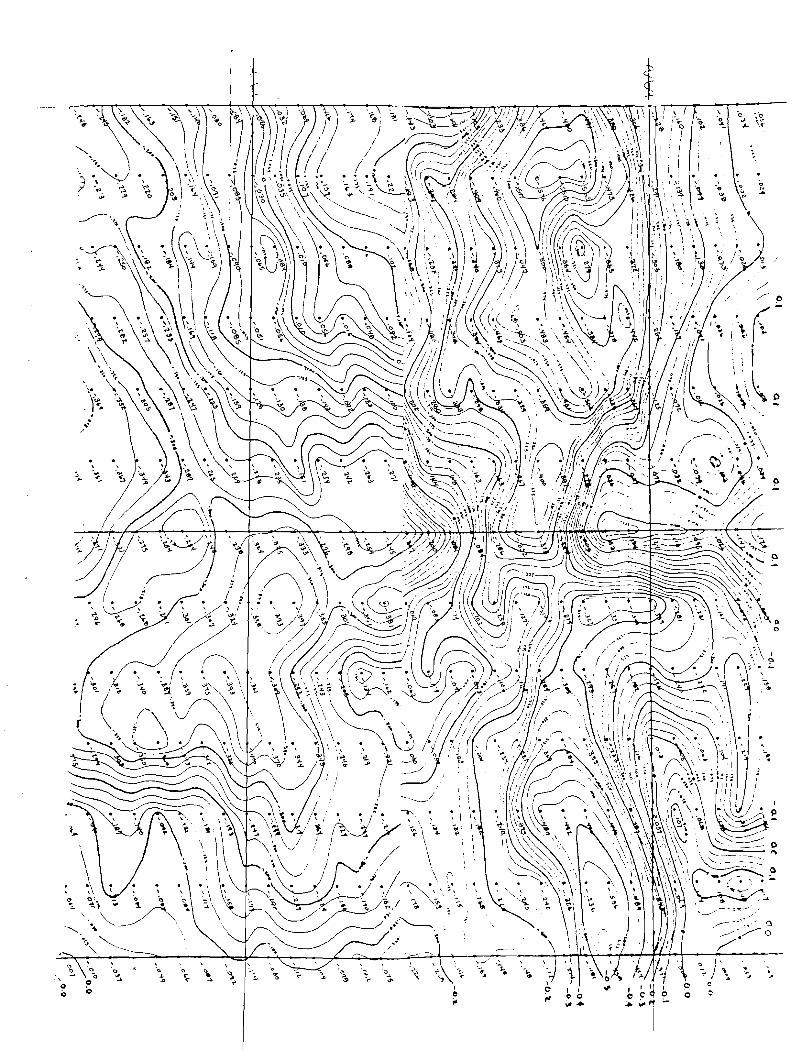
Simple Bouguer Gravi ty L e s s Linear Regional3& Pa rabo l i c Trend S l ab Density 2.3 g/c 0.05-Mill igal Contour I n t e r v a l Contours Within 20.025 mg
This informat ion has been p r i n t e d on sticky-back paper f o r easy placement on Figure 2.1-4.
F igures 1.2.1-4, 1.2.1-5, 1.2.1-6, 1.2.2-8 and 1.2.3-1 are adapted from prel iminary maps prepared by R. P. Snyder o f t h e US Geological Survey. F i n a l USGS maps have been published i n Borns et a1 (1983) .
Slrnple Bouguer Qravlty Lerr Llnear Reglonal & Parabolic Trend Slab Denrlty 2.3 g/c3 1 0.05-MIIIlgal Contour Interval
" Contour0 Wlthln 20.025 rng

date: May 16 , 19 83
Sandia National Laboratories Albuquerque. N e w Mexico 871.85
to: D i s t r i b u t i o n f o r SAND82-2922 Report
from: L. J. Barrows - 7111
subject: E r r a t a i n SAND82-2922, Waste I s o l a t i o n P i l o t P l a n t (WIPP) S i t e Grav i ty Survey and I n t e r p r e t a t i o n , d t d A p r i l 1983
The fo l lowing informat ion i s miss ing from t h e f i g u r e cap t ion of F igure 2.1-4 on p 43 of t h e re fe renced r e p o r t :
Simple Bouguer Gravi ty Less Linear Regional3& P a r a b o l i c Trend S l a b Densi ty 2.3 g/c 0.05-Mil l igal Contour I n t e r v a l Contours Within 20.025 mg
- T h i s informat ion h a s been p r i n t e d on sticky-back paper f o r easy placement on F igure 2.1-4.
F i g u r e s 1.2.1-4, 1.2.1-5, 1.2.1-6, 1.2.2-8 and 1.2.3-1 a r e adapted from pre l iminary maps prepared by R. P. Snyder of t h e US Geologica l Survey. F i n a l USGS maps have been published i n Borns e t a 1 (1983) .
Slmplo Bouguar Gravlty La88 Llnoar Roglonal & Parabolic Trend Slab Donrlty 2.3 g/ca 0.01-Mllllgal Contour Intorval Contour8 Wlthln f 0.025 mg
'

Sandia National Laboratories
date: May 16, 1983 Albuquerque. N e w Mexico 871 85 .
to: D i s t r i b u t i o n f o r SAND82-2922 Report
from: L. J. Barrows - 7111
subject: E r r a t a i n SAND82-2922, Waste I s o l a t i o n P i l o t P l a n t (WIPP) S i t e Gravi ty Survey and I n t e r p r e t a t i o n , d t d Apr i l 1983
The fol lowing informat ion is missing from t h e f i g u r e capt ion of F igure 2.1-4 on p 43 of t h e referenced r epo r t :
Simple Bouguer Gravity Less Linear Regional3& Parabo l ic Trend S l ab Density 2.3 g/c 0.05-Mill igal Contour I n t e r v a l Contours Within kO.025 mg
Th i s informat ion has been p r i n t e d on sticky-back paper f o r easy placement on Figure 2.1-4.
F igures 1.2.1-4, 1.2.1-5, 1.2.1-6, 1.2.2-8 and 1.2.3-1 are adapted from prel iminary maps prepared by R. P. Snyder of t h e US Geological Survey. F i n a l USGS maps have been published i n Borns e t a 1 (1983) .
Simple Bouguer Gravity Less Linear Regional & Parabolic Trend Slab Density 2.3 g/c3 I 0.05-UIHIgaI Contour Interval Contours Within k0.025 mg

date: May 16, 1983
Sandia National Laboratories Albuquerque. New Mexico 87185
to: D i s t r i b u t i o n f o r SAND82-2922 Report
- from: L. J. Barrows - 7111
subject: E r r a t a i n SAND82.-2922, Waste I s o l a t i o n P i l o t P l a n t '(WIPP) S i t e Grav i ty Survey and I n t e r p r e t a t i o n , d t d Apr i l 1983
The fo l lowing informat ion i s missing from t h e f i g u r e cap t ion of F igure 2.1-4 on p 43 of t h e re fe renced r epo r t :
Simple Bouguer Gravi ty Less L inear Regional3& Pa rabo l i c Trend S l a b Densi ty 2.3 g /c 0.05-Mill igal Contour I n t e r v a l Contours Within L0.025 mg
T h i s informat ion has been p r i n t e d on st icky-back paper f o r easy placement on F igure 2.1-4.
F igures 1.2.1-4, 1.2.1-5, 1.2.1-6, 1.2.2-8 and 1.2.3-1 a r e adapted from pre l iminary maps prepared by R. P. Snyder of t h e US Geologica l Survey. F i n a l USGS maps have been publ ished i n Borns e t a 1 (1983) .
Slmple Bouguer aravlty Lor8 Llnear Reglonal & Parabolic Trend Slab Denrlty 2.3 g/cJ
7+Mllllgal Contour Interval .ntourr Wlthln f 0.025 mg
date: May 16, 1983
Sandia National Laboratories Albuquerque. New Mexico 8 7 1 8 5
to: D i s t r i b u t i o n f o r SAND82-2922 Report
from: L. J. Barrows - 7111
subject: E r r a t a i n SAND82-2922, Waste I s o l a t i o n P i l o t P l an t (iVIPP) S i t e Gravity Survey and I n t e r p r e t a t i o n , d t d Apr i l 1983
The fol lowing information is missing from t h e f i g u r e caption of Figure 2.1-4 on p 43 o f t h e referenced r epo r t : .
Simple Bouguer Gravity Less Linear Regional3& Parabol ic Trend S l ab Density 2.3 g/c 0.05-Milligal Contour I n t e r v a l Contours Within L0.025 m g
Th i s information has been p r i n t e d on sticky-back paper f o r easy placement on Figure 2.1-4.
F igures 1 .2 .1 -4 , 1.2.1-5, 1.2.1-6, 1.2.2-8 and 1.2.3-1 a r e adapted from prel iminary maps prepared by R. P. Snyder of t h e US Geological Survey. F i n a l USGS maps have been published i n Borns e t a 1 (1983).
I Slmple Bouguer Gravltv Lam@ Linear Reglonal 6 Parrbollc Trend Clab Denrlty 2.3 a/cJ
36Mllllgal contour Interval sntourm Wlthln 2 0.025 mg

SAND82-2922 Unlimited Release Printed April 1983
Distribution Category UC-70
Waste Isolation Pilot Plant (WIPP) Site Gravity Survey and Interpretation
Lawrence J. Barrows Grouud Motion and Seismic Division "1 11
Sue-Ellen Shaffer and Warren B. Miller Earth Sciences Division 9731 Sandia National Laboratories
Albuquerque, NM 87185
John D. Fett Earth Science and Engineering, Inc.
Austin, TX 78759
Abstract A portion of the WIPP site has been extensively surveyed with high-precision gravity. The main survey (in T2%, R31E) covered a rectangular area 2 by 4-113 mi encompass- ing all of WIPP site Zone I1 and part of the disturbed zone to the north of the site. Sta- tions were at 29343 intervals along 13 north-muth lines 880 ft apart. The data are considered accurate to within a few huudredths of a milligal.
Long-wavelength gravity anomalies correlate well with seismic time structures on horizons below the Castile Formation. Both the gravity anomalies and the seismic time structures are interpreted ae resulting from related density and velocity variations within the Ochoan Series. Shorter wavelength negative gravity anomalies are interpret- ed as resulting from bulk density alteration in the vicinity of karst conduits.
The WrPP gravity survey was unable to resolve low-amplitude, long-wavelength anomalies that should result from the geologic structures within the disturbed zone. It did indicate the degree and character of karst development within the surveyed area.

Acknowledgment Appreciation is extended to the Sandia National Lab- oratories Applicon Graphics Personnel, Dept. 9761, for preparing appropriate base maps and to Carmen de Souza for patiently typing and retyping the manu- script. D. J. Borns and C. A. Searls reviewed the report and offered many helpful suggestions. The interpreta- tion is that of the authors and is not necessarily agreed to by the reviewers.

Contents 1 . Introduction .................................................................................................................................
1.1 Purpose and Scope of WIPP ............................................................................................ 1.2 Geologic Setting ..................................................................................................................
1.2.1 Stratigraphy ............................................................................................................. 1.2.2 Structure .................................................................................. : ............................... 1.2.3 Karst ..................................................................... .. ..................................................
.......................................................................................................... 1.3 The Gravity S w e y a 1.3.1 Background and Original Objectives ......................................................... .. ........ 1.3.2 S w e y Locations .................................................................................................... 1.3.3 Data Reduction .......................................................................................................
2 . Data ......................................................... .. .................................................................................... ......................... ..................................................................................... 2.1 Main Site S w e y ..
..................................................................................................... 2.2 The WIPP 14 Anomaly 2.3 R e c o ~ c e Profilea ..................................................................................................
2.3.1 The WIPP 33 Area ................................................................................................. ......................................................................................................... 2.3.2 Bell Lake Sink
3 . Interpretation ............................................................................................................................... 3.1 Broad Features .................................................................................................................... 3.2 Negative Anomalies ............................................................................................................
3.2.1 The WIPP 14 Anomaly ......................................................................................... 3.2.2 Seismic Line 7'7x2 .................................................................................................. 3.2.3 The WIPP 33 Anomaly .........................................................................................
4 . Summary ....................................................................................................................................... .............................................................................................................................................. Referencea
APPENDIX A - Gravity Data From the Main Site S w e y and Detailed Grid in the Southeast Comer of Section 28 ............................................................................................
APPENDIX B - Gravity Data Over the WIPP 14 Anomaly ...................................................... APPENDIX C - Gravity Data Along Reconnaissance Profilea Near WIPP 33 ....................... APPENDIX D - Gravity Data Over Bell Lake Sink ....................................................................
Figures 1.1.1 Conceptual drawing of an operational repository .............................................................. 1.1.2 WfPP site zonation ................................................................................................................ 1.2.1.1 Major regional structures ...................................................................................................... 1.2.1.2 Local stratigraphic section .................................................................................................... 1.2.1.3 Densilog of the Castile Formation at borehole AEC 8 ...................................................... 1.2.1 -4 Isopach of the Dewey Lake F@d Beds ................................................................................. 1.2.1.5 Isopach of the Dockum Group ............................................................................................. 1.2.1.6 Isopach of the Gatuna Formation ........................................................................................ 1.2.2-1 Location of seismic lines used to construct the seismic time-structure and isochron
......................................................................................................................................... maps 1.2.2-2 Seismic time-structure of a strong seismic horizon near the Anhydrite I1 member of the
Castile Formation ................................................................................................................... 1.2.2-3 Seismic time-structure of a seismic horizon near the top of the Cherry Canyon
Formation ................................................................................................................................ 1.2.2-4 Seismic isochron map of the two-way travel time between the mid-Castile and Cherry
Canyon seismic horizons ........................................................................................................ 1.2.2.5 Boreholes to the north of the WIPP site that penetrate the Castile Formation ..........
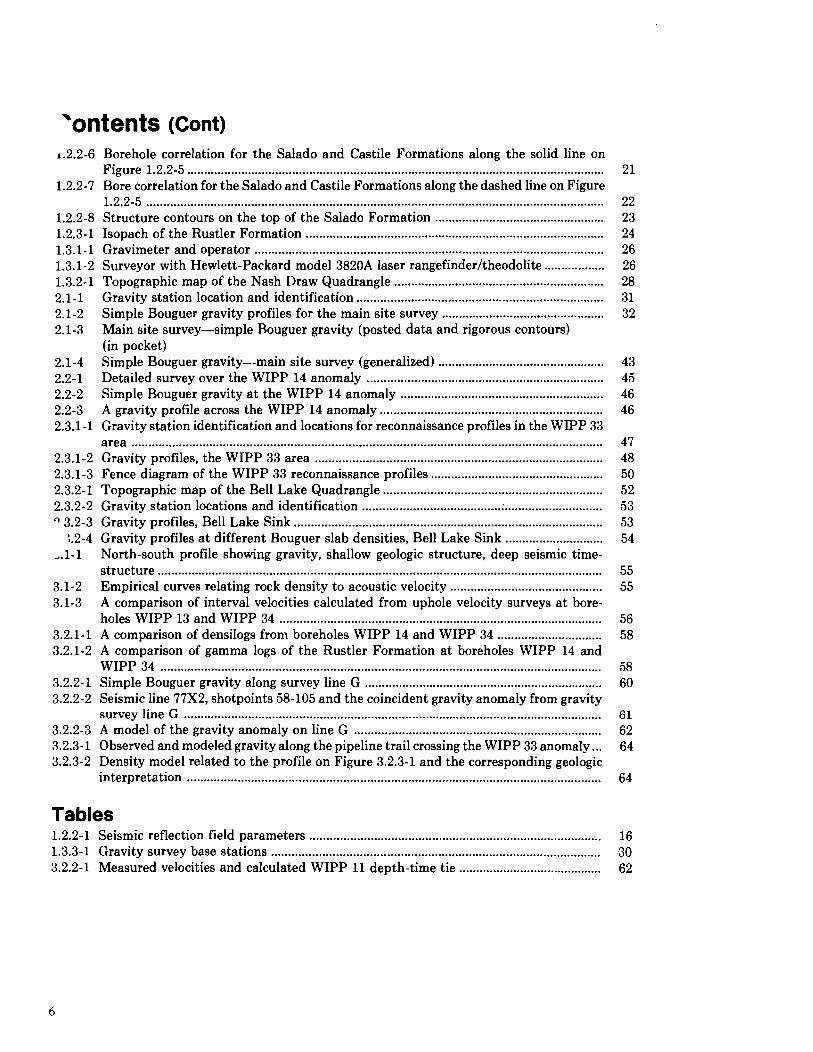
'ontents (Cont) 1.2.2-6 Borehole correlation for the Salado and Castile Formations along the solid line on
Figure 1.2.2.5 ........................................................................................................................... 1.2.2-7 Bore correlation for the Salado and Castile Formations along the dashed line on Figure
1.2.2.5 ....................................................................................................................................... .................................................. 1.2.2-8 Structure contours on the top of the Salado Formation
........................................................................................ 1.2.3-1 Isopach of the Rustler Formation ....................................................................................................... 1.3.1-1 Gravimeter and operator
.................. 1.3.1-2 Surveyor with Hewlett-Packard model 3820A laser rangefinderltheodolite 1.3.2.1 Topographic map of the Nash Draw Quadrangle ..............................................................
......................................................................... 2.1 -1 Gravity station location and identification ................................................ 2.1-2 Simple Bouguer gravity profiles for the main site survey
2.1-3 Main site survey-simple Bouguer gravity (posted data and rigorous contours) (in pocket)
2.1.4 Simple Bouguer gravity-main site survey (generalized) ................................................. ...................................................................... 2.2-1 Detailed survey over the WIPP 14 anomaly
2.2.2 Simple Bouguer gravity a t the WIPP 14 anomaly ............................................................ 2.2.3 A gravity profile across the WIPP 14 anomaly .................................................................. 2.3.1-1 Gravity station identification and locations for reconnaissance profiles in the WIPP 33
area ........................................................................................................................................... ..................................................................................... 2.3.1-2 Gravity profiles, the WIPP 33 area
2.3.1.3 Fence diagram of the WIPP 33 reconnaissance profiles ................................................... 2.3.2.1 Topographic map of the Bell Lake Quadrangle ................................................................. 2.3.2.2 Gravity station locations and identification .......................................................................
3.2.3 Gravity profiles, Bell Lake Sink ........................................................................................... 1.2.4 Gravity profiles a t different Bouguer slab densities, Bell Lake Sink .............................
,.I-1 North-south profile showing gravity, shallow geologic structure, deep seismic time- structure ...................................................................................................................................
3.1.2 Empirical curves relating rock density to acoustic velocity ............................................. 3.1-3 A comparison of interval velocities calculated from uphole velocity surveys a t bore-
............................................................................................... holes WIPP 13 and WIPP 34 3.2.1.1 A comparison of densilogs from boreholes WIPP 14 and WIPP 34 ............................... 3.2.1-2 A comparison of gamma logs of the Rustler Formation a t boreholes WIPP 14 and
WIPP 34 .................................................................................................................................. 3.2.2.1 Simple Bouguer gravity along survey line G ...................................................................... 3.2.2-2 Seismic line 77x2, shotpoints 58-105 and the coincident gravity anomaly from gravity
survey line G ........................................................................................................................... 3.2.2.3 A model of the gravity anomaly on line G ......................................................................... 3.2.3.1 Observed and modeled gravity along the pipeline trail crossing the WIPP 33 anomaly ... 3.2.3-2 Density model related to the profile on Figure 3.2.3-1 and the corresponding geologic
.......................................................................................................................... interpretation
Tables ...................................................................................... 1.2.2- 1 Seismic reflection field parameters
................................................................................................. 1.3.3-1 Gravity survey base stations 3.2.2.1 Measured velocities and calculated WIPP 11 depth-time tie ..........................................
Waste Isolation Pilot Plant (WIPP) Site Gravity Survey and Interpretation
1. Introduction
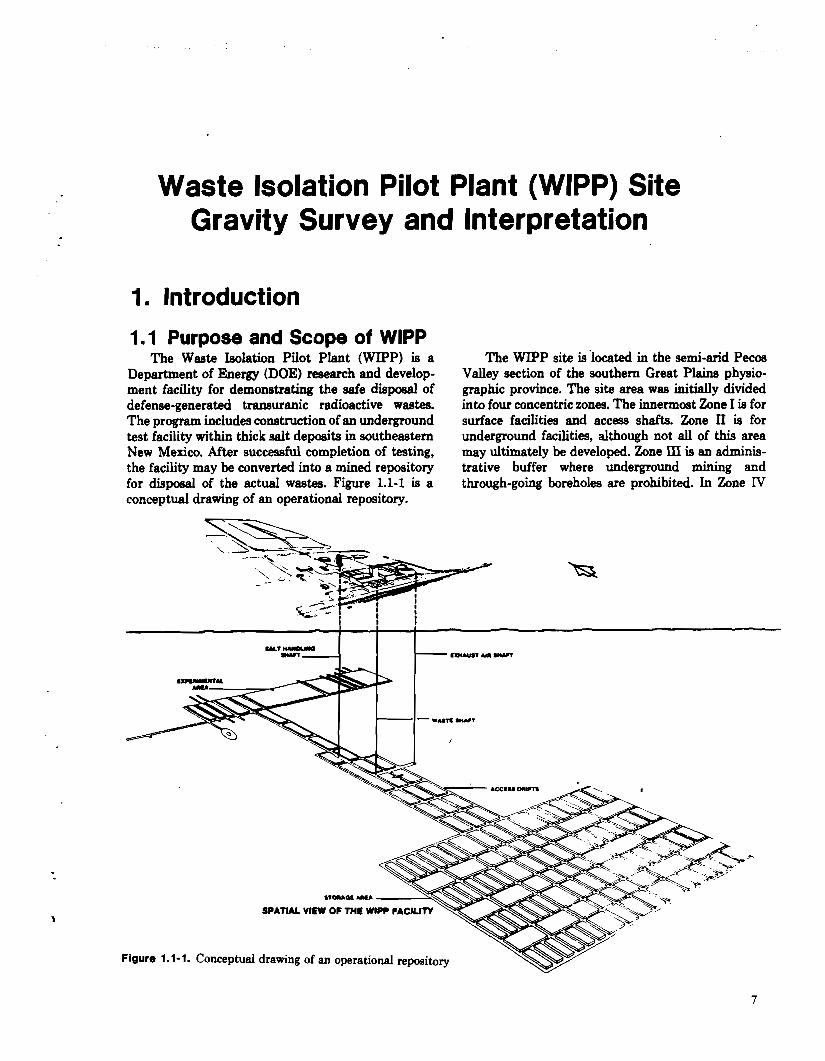
1 .I Purpose and Scope of WIPP The Weste Isolation Pilot Plant (WIPP) is a
Department of Energy (DOE) research and develop- ment facility for demonstrating the safe disposal of defense-generated tranauranic radioactive wastes. The program includes construction of an underground test facility within thick salt deposits in southeastern New Mexico. After successful completion of testing, the facility may be converted into a mined repository for disposal of the actual wastes. Figure 1.1-1 is a conceptual drawing of a . operational repository.
The WIPP site is 'located in the semi-arid Pecos Valley section of the southern Great Plains physio- graphic province. The site area was initially divided into four concentric zones. The hermoat Zone I is for surface facilities and access shafts. Zone II is for underground facilities, although not all of this area may ultimately be developed. Zone IXI is an adminis- trative buffer where underground mining and through-going boreholes are prohibited. In Zone IV
SPATIAL VIEW OF THE WIPP FACJUTT \:
Figure 1.1-1. Conceptual drawing of an operational repository
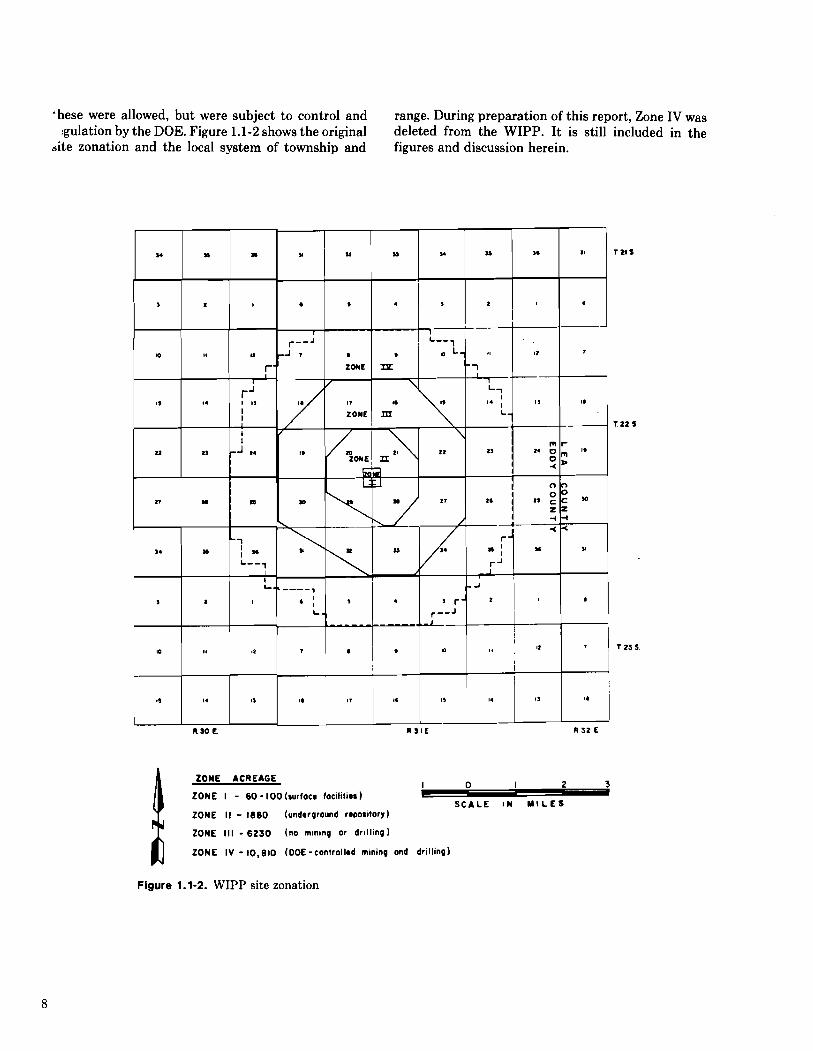
'hese were allowed, but were subject to control and range. During preparation of this report, Zone IV was :gulation by the DOE. Figure 1.1-2 shows the original deleted from the WIPP. It is still included in the
site zonation and the local system of township and figures and discussion herein.
ZONE ACREAGE I 0 I 2 3
ZONE I - 6 0 - 100 (wrfoca foc~litiar 1 S C A L E I N M I L E S
ZONE 11 - 1 8 6 0 (undarground raooritory)
ZONE 1 1 1 - 6 2 3 0 (no mlnlng or dr~ l l ing)
ZONE I V - 10,@10 (DOE -controllad mining ond drilling)
Figure 1.1-2. WIPP site zonation

The gravity survey is part of an ongoing effort to establish the geologic characteristics of the WIPP site. This report contains the gravity data and their inter- pretation. It assumes that the reader is familiar with general geologic principles and with techniques of geophysical investigation. The local geology is de- scribed sufficiently to support the gravity interpreta- tion. For further information on the geology, see Pow- ers et al (1978).
No attempt has been made in thia report to assess the implications of the gravity data and their interpre- tation upon the suitability of the site. Such assess- ment requires careful consideration of this material along with many other factors.
1.2 Geologic Setting
1.2.1 Stratigraphy The Delaware Basin is a broad, oval-shaped,
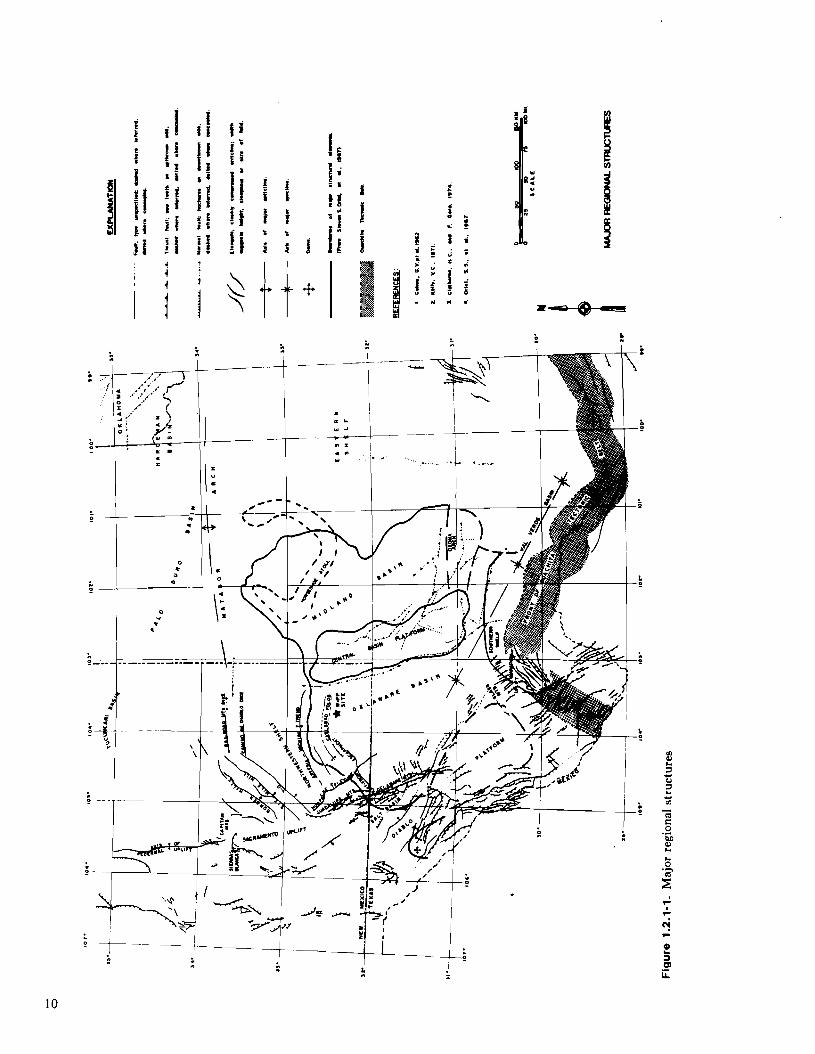
asymmetric sedimentary trough in southeastern New Mexico and west Texas. It was structurally initiated in the early Pennsylvanian, underwent minor adjust- ment in the late Pennsylvanian and early Permian, and then subsided regionally through the late Perm- ian. Basin subsidence ceased in the early Triassic. The subsequent environment ia one of general structural stability, epirogenic uplift and subsidence accompa- nied by widespread deposition and erosion, and no clear geologic record over long intervals of time. Fig- ure 1.2.1-1 shows the regional setting of the basin and, the location of the WIPP site within it.
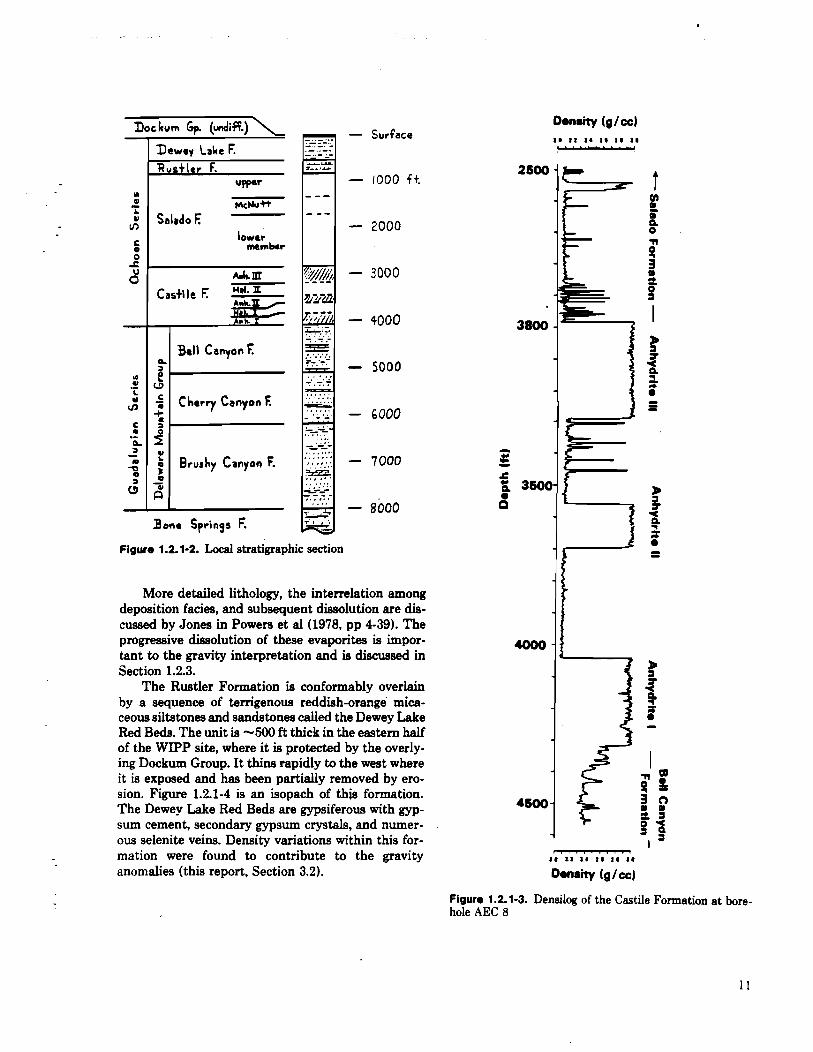
During the late Permian, a carbonate reef or bank grew up around the periphery of the slowly subsiding basin. Deposition within the basin was initially fme- grained clastics and subsidiary carbonates of the Dela- ware Mountain Group. The depositional environment changed to a partially restricted basin, and a thick section of evaporites was deposited. The underground facilities are being constructed within these evapor- ites. The evaporites, plus an overlying siltstone forma- tion, make up the Ochoan Series. Figure 1.2.1-2 is the local stratigraphic section.
For purposes of this report, the top of the Dela- ware Mountain Group directly underlying the Ochoan Series can be regarded as "basement." Near the WIPP site this surface now forms a generally smooth east- dipping homocline (Borns et al, 1983). Structures on this surface indicated by oil and gas wells in the basin are generally simple and of low amplitude. The WIPP seismic sections indicate that simple geologic struc- ture continues through the Delaware Mountain Group and the underlying Bone Spring Formation (Borns et al, 1983).
The Castile Formation is the oldest of the Ochoan Series. At the WIPP site, this formation consists of three massive anhydrite units separated by two mas- sive halite units. In ascending order, the units are informally identified as Anhydrite I, Halite I, Anhy- drite 11, Halite 11, and Anhydrite 111. These units are indicated on Figure 1.2.1-2.
The basal unit, Anhydrite I, consists of laminated anhydrite and bituminous calcite. Halite I is nearly pure halite. Anhydrite 11 is distinctly laminated layers of anhydrite and calcite. The individual laminae of this member have been correlated between wells 113 km apart (Kirkland and Anderson, 1970) and have been interpreted as seasonal varves (e.g., Anderson et . al, 1972). The next unit, Halite 11, consiats of nearly pure halite beds up to about 30 ft thick interlayered with five to seven thinner beds of anhydrite. The uppermost Anhydrite III is a generally maseive anhy- drite with some color layering of various shades of gray.
There is 6 distinct density contrast between the massive anhydrite and massive halite units. Figure 1.2.1-3 is the densilog of the Castile Formation in borehole AEC 8. The density contrast between the anhydrite and halite units was important in plenning the WIPP gravity survey as described later in this report. It may also be important in formation of structures within the Cmtile Formation. This struc- tural relation is discussed at length in Born et al (1983, Appendix A).
The Salado Formation is the second of three evaporite formations in the Ochoan Series. The for- mation is primarily halite interlayered with laterally continuous beds of anhydrite and polyhalite. I t is divided into a lower unnamed member, the middle McNutt Potash Zone, and an informal upper member. The McNutt Potash Zone locally contains economic potash minerals, mainly sylvite and langbeinite, and is the ore zone supporting the local potash industry.
At the WIPP site the Salado is conformably over- lain by the Rustler Formation. This formation h is been divided into five members largely on the basis of two conspicuous dolomite horizons. From bottom to top the members are: an unnamed lower member, the Culebra Dolomite, the Tamarisk Member, the Magen- ta Dolomite, and the Forty-Niner Member. The for- mation has been extensively altered by dissolution or karstification. In unleached areas the formation com- position is: 43% rock salt and other halides; 30% anhydrite, polyhalite, gypsum, and other sulfates; 17% clastics; and 10% dolomite, limestone, and mag- nesite.
Dockum Cp. (undiR.)
Dewey Lake F.
Y
Cherry Canyon F.
- Surface
- 1000 ft.
- 2000
- - 8000 Bone Springs F.
Figure 1.2.1-2. Local stratigraphic section
More detailed lithology, the interrelation among deposition facies, and subsequent dissolution are dis- cussed by Jones in Powers et al (1978, pp 4-39). The progressive dissolution of these evaporites is impor- tant to the gravity interpretation and is discussed in Section 1.2.3.
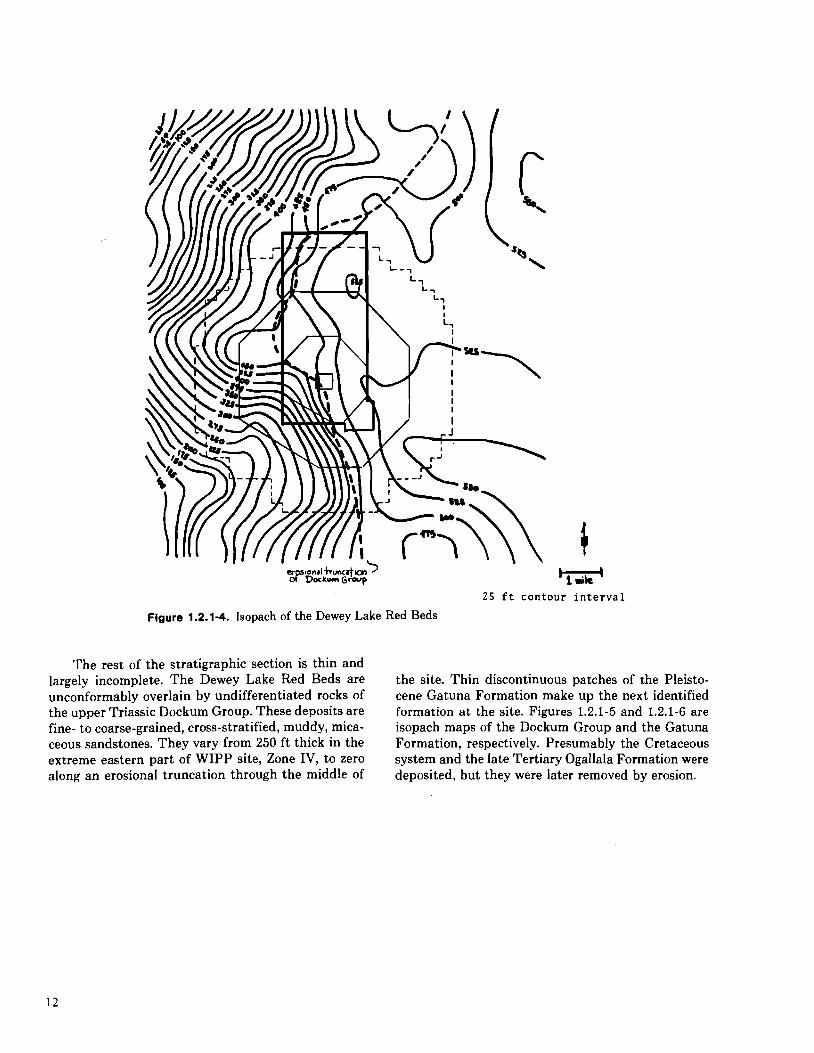
The Rustler Formation is conformably overlain by a sequence of terrigenous reddish-orange mica- ceous siltstones and sandstones called the Dewey Lake Red Beds. The unit is -500 ft thick in the eastern half of the WIPP site, where it is protected by the overly- ing Dockum Group. It thins rapidly to the west where it is exposed and has been partially removed by ero- sion. Figure 1.2.1-4 is an isopach of this formation. The Dewey Lake Red Beds are gypsiferous with gyp- sum cement, secondary gypsum crystals, and numer- ous selenite veins. Density variations within this for- mation were found to contribute to the gravity anomalies (this report, Section 3.2).
Figure 1.2.1-3. Densilog of the Castile Formation a t bore- hole AEC 8
2 5 f t cont
Figure 1.2.1-4. Isopach of the Dewey Lake Red Beds
w :our interval
The rest of the stratigraphic section is thin and largely incomplete. The Dewey Lake Red Beds are the site. Thin discontinuous patches of the Pleisto- unconformably overlain by undifferentiated rocks of cene Gatuna Formation make up the next identified the upper Triassic Dockum Group. These deposits are formation a t the site. Figures 1.2.1-5 and 1.2.1-6 are fine- to coarse-grained, cross-stratified, muddy, mica- isopach maps of the Dockum Group and the Gatuna ceous sandstones. They vary from 250 f t thick in the Formation, respectively. Presumably the Cretaceous extreme eastern part of WIPP site, Zone IV, to zero system and the late Tertiary Ogallala Formation were along an erosional truncation through the middle of deposited, but they were later removed by erosion.

Figure 1.2.1-5. h p a c h of the Dockum Group

10 ft contour interval
Figure 1.2.1-6. Isopach of the Gatuna Formation

1.2.2 Structure Mapping of geologic structures was the primary
motivation for the WIPP gravity survey. It was thought that the gravity data would help establish the form and extent of structures in the northern part of the site and help ensure that additional undetected structures are not present in the rest of the site. During the survey it was found that the gravity field is dominated by effects of lateral density variations within fairly flat-lying strata The structures were found to be an inconsequential part of the interpreta- tion. They are reviewed here because of their role in planning the gravity suivey and because they form the 'structural framework of the area
As previously noted, the Delaware Mountain Group near the WIPP site form a simple east-dipping homocline. This dip is --I00 ft/mi; it was formed during the Plio-Pleistocene tilting of the Delaware Basin and surrounding areas (Borns et al. 1983).
The WIPP site has been extensively explored with the seismic reflection technique. Figure 1.2.2-1 shows line locations of the seismic sections used to construct the following time structure and isochron mapa. Addi- tional redundant lines and linee gathered earlier with petroleum exploration field parameters were checked for consistency with the interpretation but were not worked into the maps.
Figure 1.2.2-1. Location of seismic lines used to construct the seismic time-structure and isochron maps

The field parameters for the lines on Figure 1.2.2-1 are given in Table 1.2.2-1. Further information Table 1.2.2-1. Seismic reflection field 3n the seismic surveys is available in Bell and Murphy Parameters (77X and 78GG surveys) and Assoc., Inc. (1979) and in Hern et a1 (1979). The lines have good resolution from the top of the Castile Formation through the Delaware Mountain Group. Seismic events from shallower and deeper horizons are considered too unreliable to map. Figures 1.2.2-2 and 1.2.2-3 are time-structure maps on events near the Anhydrite I1 member of the Castile Formation and near the top of the Cherry Canyon Formation in the middle of the Delaware Mountain Group. Figure 1.2.2-4 is an isochron map on the interval between
Description
Source 3 or 4 vibrators stepped over 220 ft 12-s, 25- to 100-HZ
Receiver 36 geophones per receiver in a 6-arm fan 24 receivers 1650-440-0-440-1650 split spread 2-ms sample rate
these horizons. These maps show the seismic features Processing 12-fold CDP stack of interest on and near the WIPP site. Both the maps and structures are discussed in further detail in Borns et al, 1983.
Figure 1.2.2-2. Seismic time-structure of a strong seismic horizon near the Anhydrite I1 member of the Castile Formation
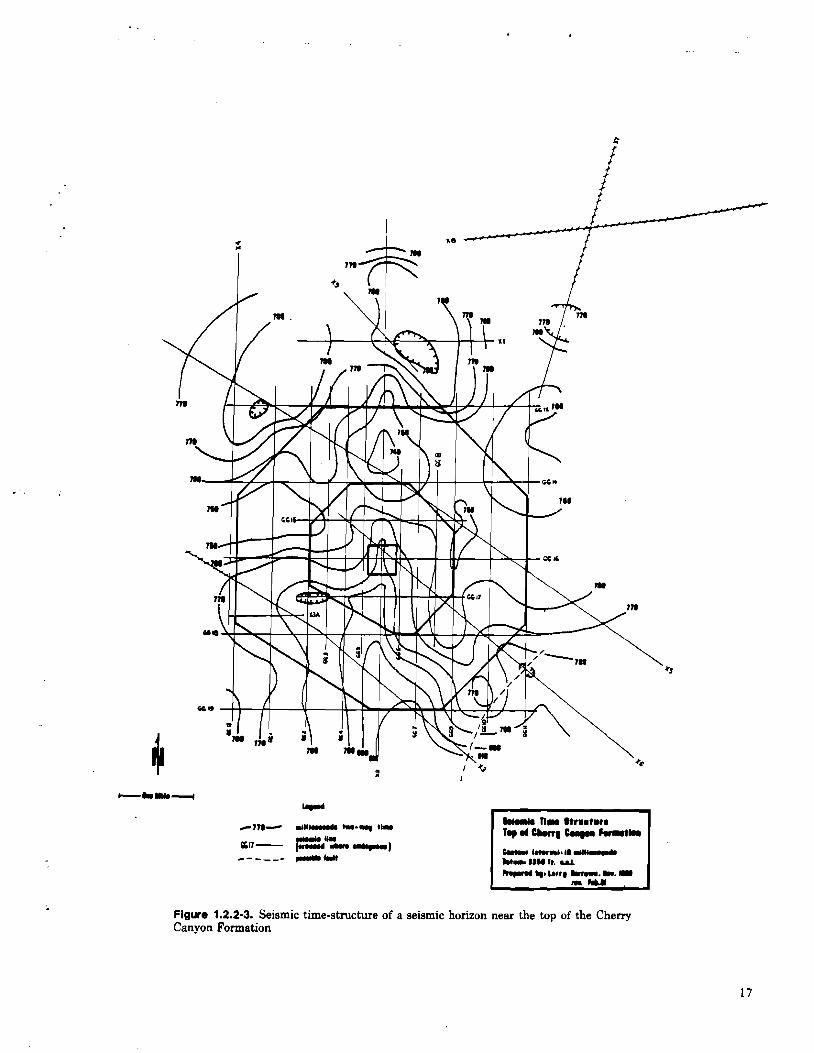
Figure 1.2.2-3. Seismic time-structure of a seismic horizon near the top of the Cherry Canyon Formation

M t d
1W. l
+)nu, mllllmmmn(r t n - n u tlmm [bmkblmm mm tblmur mllm j
0517 - *DM 11.1 m N m m m l wbrm mmblmrmrm 1 I"
...a * ..... mrmm dmmylm8 firrmtrrm
Figure 1.2.2-4. Seismic isochron map of the two-way travel time between the mid-Castile and Cherry Canyon seismic horizons
The seismic time-structure maps on the mid- Castile and Cherry' Canyon reflections indicate smooth continuous structure over most of the WIPP site. There is an arcuate fault to the southeast of Zone I11 and a possibly faulted syncline (graben?) in the southwest. Neither of these features indicates much displacement (5 to 10 ms @ 14000 ftls = 70 to 140 ft).
The largest feature of interest is the disturbed zone (DZ) in the northern part of the site. In the DZ, the seismic sections indicate a blocky, discontinuous structure in the Castile Formation with abrupt offsets or changes in dip between units (faults?). The seismic character or wiggle shape changes, indicating varia- tions in thickness and/or acoustic properties. The map on the mid-Castile event shows increased dips and faults around the periphery of the DZ and an un- mapped area of complex structure in the middle. The seismic data in this unmapped are are valid, but the geologic structures are too complex to map with these data. The map on the Cherry Canyon event is contin- uous through the DZ. The seismic isochron map indi- cates thickness variations within members of the Cas- tile Formation.
The seismic indications of complex geologic struc- ture in the northern part of the site have been verified with boreholes. Figure 1.2.2-5 shows locations of bore- holes that penetrate the Castile Formation. Figures 1.2.2-6 and 1.2.2-7 are borehole correlations along the lines indicated on Figure 1.2.2-5. On the borehole correlations, the Cowden Anhydrite marker bed in the lower part of the Salado Formation is used to separate two methods of log correlation. Above the Cowden Anhydrite, the horizons are convenient markers on the logs. Below the Cowden, the dark intervals are primarily anhydrite and the light intervals are halite.
Structural deformation is intense within the Cas- tile Formation. There are vertical displacements of hundreds of feet and thickness variations of hundreds of percent. In AEC 7 there are four massive anhy- drites; in POGO Fed. 1 there are two (the latter may be a depositional pinchout of Halite I1 along the basin margin). In ERDA 6 the uppermost anhydrite was identified from core as Anhydrite II, and Anhydrite I11 may be missing (Anderson, 1976).
The complex deformation within the Castile For- mation does not extend through the overlying Salado Formation. Figure 1.2.2-8 is a structure contour map of the top of the Salado Formation prepared from borehole control. There is a broad gentle syncline in the area of the DZ, but no indication of deformation as complex as that in the underlying Castile Formation. At this stratigraphic level there are sufficient bore- holes to reliably define the structure.
1.2.3 Karst Evaporite and carbonate rocks dissolve, or cor-
rode, when they contact chemically undersaturated water. Karst refers to a distinctive surface morphology and groundwater hydrology resulting from such disso- lution. Karst surface morphology is characterized by collapse sinks, alluvial dolines, caves, grikes, and vari- ous domes and mounds. The hydrology is character- ized by sinking streams, swallow holes, the absence of surface runoff, an integrated arterial system of sub- surface conduits, and a few large irregular springs. The general principles of karst morphology are dis- cussed by M. Sweeting (1973), and karst hydrology is discussed by A. Bogli (1980).
A large area of southeastern New Mexico and west Texas, including the Delaware Basin, is underlain by soluble carbonates and evaporite. Much of thie mate- rial has been removed by dissolution, and the area is recognized as one of the karstlands of the United States (Davies and LeGrand, 1972; LeGrand et al, 1976). Regional karst is described by G. 0. Bachman (1980) in his report on the geology and Cenozoic history of the Pecos Region, and by Powers et a1 (1978).
The regional dissolution history is complex. The stratigraphic sequence above the Permian is discon- tinuous, presumably indicating periods of uplift, ero- sion, and dissolution. Even intervals of active deposi- tion, such as during Gatuna time, may be accompanied by groundwater dissolution and collapse of the new deposits into solution cavities. Despite the complexity, the present episode of dissolution can be related to development of the Pecoa drainage system and the associated demise of Ogallala deposition (King, 1948, p 152). The Ogallala was deposited as complex overlapping alluvial fans shed from the up- lifted Rocky Mountains to the west. During the Pleis- tocene, the Pecos River extended to the north by headward erosion and captured the easterly flowing Ogallaia streams. Subsequent excavation of the Pecoe River basin is a combined result of normal fluvial erosion and the dissolution of halite, gypsum, and limestone (Morgan, 1941). The west-sloping topogra- phy at the site, Nash Draw to the west, and San Simon Swale to the east are all products of the present geomorphic cycle.
The easterly structural tilt of the Delaware Basin, along with incising of the Pecos Drainage, has exposed progressively older formations to the west. The Castile Formation outcrops along the west side of the basin near White city'and farther south into the gypsum plains of west Texas. The area of outcrop has a series of elongated east-west troughs and ridges that Olive
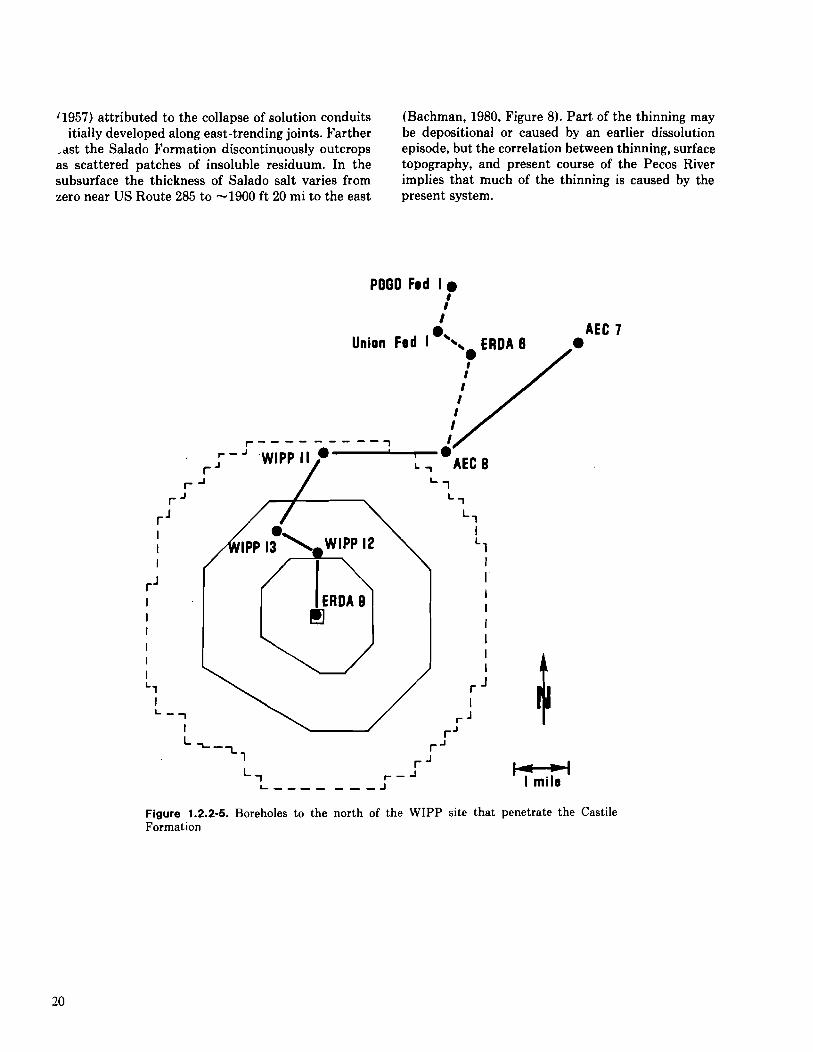
l1957) attributed to the collapse of solution conduits (Bachman, 1980, Figure 8). Part of the thinning may itially developed along east-trending joints. Farther be depositional or caused by an earlier dissolution
,ast the Salado Formation discontinuously outcrops episode, but the correlation between thinning, surface as scattered patches of insoluble residuum. In the topography, and present course of the Pecos River subsurface the thickness of Salado salt varies from implies that much of the thinning is caused by the zero near US Route 285 to -1900 ft 20 mi to the east present system.
POGO h d I I t
- - - 'WIPP
r Union ~ l d I
AEC 7
I - - - - - - 1 @-a
I I/ L AEC 8
-L,
x l r J
r J '-1 r--I
I - - - - - - - - J
w I mils
Figure 1.2.2-5. Boreholes to the north of the WIPP site that penetrate the Castile Formation
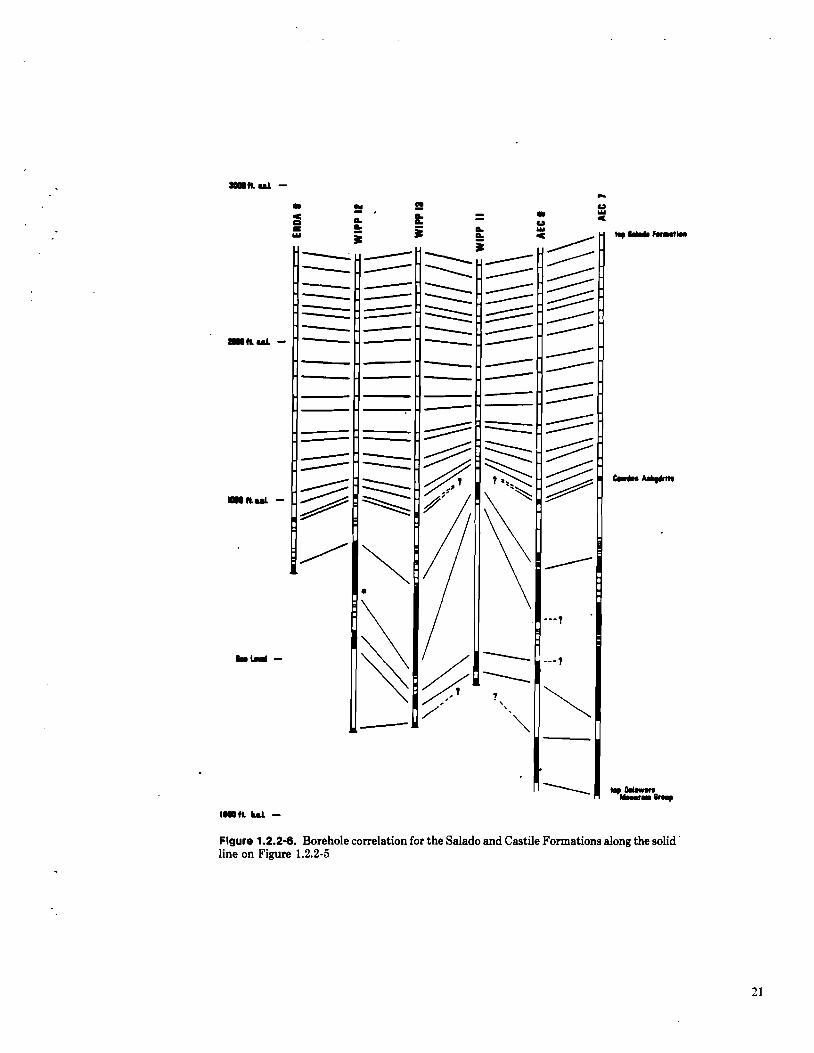
Figure 1.2.2-6. Borehole correlation for the Salado and Castile Formations along the solid line on Figure 1.2.2-5

LO00 ft. ul. -
loo0 tt. ul. -
Figure 1.2.2-7. Bore correlation for the Salado and Castile Formations along the dashed line on Figure 1.2.2-5

25 ft contour interval
Figure 1.2.2-8. Structure contours on the top of the Salado Formation
The Rustler Formation outcrops in scattered areas of Nash Draw. In outcrop, it is generally gypsum with interbedded dolomite and reddish-brown clayey insoluble residues. The gypsum supports the openings of caves and swallow holes, some of which are large enough to enter. In the subsurface, dissolution has formed a complex of tunnels and caves. Many of the cavities have filled with alluvium washed in from the surface, and many have collapsed, forming complex breccias. The surface exhibits collapse sinks, grikes, and vanishing arroyos.
At the WIPP site, the Rustler Formation is over- lain by the Dewey Lake Red Bedi It is here an example of an interstratal phreatic karst. Figure 1.2.3-1 is a borehole-controlled isopach of the Rustler
Formation. The formation thins from 450 ft in the southeast comer of WIPP site Zone IV to 300 ft along the western side. Isopach thinning is accompanied by the downward progression of surfaces defined by bore- hole encounters with the uppermost halite, the upper- most anhydrite, and the deepest gypsum. These rela- tions are reasonably attributed .to dissolution by groundwater infiltrating from above (e.g., Powers et al, 1978, pp 6-38; Snyder in Borns et al, 1983). The occurrence of anhydrite stratigraphically above disso- lution residues implies that the infiltration is areally discontinuous. As noted previously, farther to the west the Rustler is both closer to the surface and progressively more dissolved.

25 f t countour i n t e r v a l
Figure 1.2.3-1. Isopach of the Rustler Formation
The detailed lithologic character of the Rustler is considerably more complex than suggested by the WIPP site isopach map. Ferrall and Gibbons (1980) documented a study of this formation based on core photographs, core inspection, borehole logs, and brief field trips. Their report is summarized here a t length because it describes the geologic variations responsi- ble for a t least some of the observed gravity anomalies.
The Rustler Formation was never a simple homo- geneous rock unit. I t was deposited as silty evaporites, silts, and lime muds during the final irregular stages of the Permian evaporite basin. Pseudomorphic gypsum rosettes suggest that the calcium sulfate was initially deposited as gypsum and later dehydrated to anhy- drite. The lime mud was diagenetically altered to
>mite. Both these processes and the normal com- ,ion of clastic sediments affect the physical volume
or the deposit.
Ferrall and Gibbons described core from WIPP 19 and then contrasted it with cored intervals of other holes. The lithologies identified include anhydrite, gypsum, halite, doiomite, siltstone, and solution resi- dues. The solution residues are layers of generally unstructured clay or silt, lacking original bedding, and often containing breccia clasts. Fractures, in some cases breccia, occur in adjacent units and are attribut- ed to collapse into dissolution voids. Also, since the solution residues represent former paths of migrating groundwater, they have acted as centers for the hydra- tion of anhydrite to gypsum in adjacent units.
At WIPP 19 Ferrall and Gibbons identified one solution residue a t the top of the Salado Formation, three in the unnamed lower member, one at the base of the Tamarisk Member, and one within the Forty- Niner Member. A generally similar sequence of solu- tion residues was identified in other holes, but their

degree of development, cementation, and exact strati- graphic position varied.
The residue at the base of the Rustler was inter- preted as representing the leached top of the Salado Formation. The next two are adjacent to a halite layer within the lower member. At WIPP 19, these are cemented by halite and are not extensively leached. However, in the other holes studied (WIPP 25,26,30), this halite layer has been removed by solution, and a single dissolution residue is present. The third residue in the lower member is at the base of the Culebra Dolomite.
At WIPP 19, 15 ft of solution residue in the Tamarisk Member immediately overlie the Culebra Dolomite. The lower foot of this particular residue is layered, and Ferrall and Gibbons (1980) suggest it may have been deposited in the bottom of a solution cavity. In other holes, the residue in the Tamarisk Member varies between 6 and 18 ft in thickness and is separated from the Culebra Dolomite by up to 22 ft of gypsum. The Forty-Niner Member residue in WIPP 19 is 10 f t thick. The calcium sulfate is gypsified out to a few feet of both the top and bottom of this residue.
In addition to the solution residues, Ferrall and Gibbons identified leached zones in the lower member and in the Forty-Niner Member in which bedding plane breaks resulted from solution activity of groundwater traveling along the laminae.
Karst, or groundwater alteration of the Rustler Formation, is important to the gravity interpretation, but its effect on rock densities is not necessarily simple. Dissolution may decrease the bulk density of the formation if the voids remain open or are filled with less dense material. Alternately, it may increase the bulk density if removal of a low-density evaporite (e.g., halite) is compensated for by compaction of the formation.
The removal of calcium sulfate can be even more complex. In unaltered areas, calcium sulfate in the Rustler occurs as anhydrite (density 2.9 to 3.0 glcc). During dissolution, the anhydrite is normally hydrat- ed to gypsum (density 2.2 to 2.6 glcc) with up to a 38% increase in volume. In at least some instances the increased volume is compensated for by removed ma- terial. In other instances, the volume increase causes
'
significant distortion in the rock. These mechanical effects are discussed by Ferrall and Gibbons (1980, Section 2.3.1).
1.3 The Gravity Surveys
1.3.1 Background and Original Objectives
The gravity method is based on the measurement and interpretation of small variations in the earth's gravity field. These variations (or anomalies) result from lateral variations in the subsurface distribution of mass or rock density. In a layered sequence of sedimentary rocks, the lateral density variations nor- mally, but not always, result from structural displace- ment of strata of differing density. Examples would be a high-angle fault that juxtaposes a heavy anhydrite layer against a lighter halite, or a piercement diapir in which the less dense halite is rising through a more dense overburden.
The gravity data can be used to detect subsurface density structures and to place constraints on the allowable interpretations of those structures. By itself, the detailed shape of a gravity anomaly can be used to establish the maximum depth to the top of the caus- ative density structure and the minimum amount of missing, or excess, mass in the structure. Used. in conjunction with other forms of data (such as seismic sections, boreholes, regional geology, and magnetics), gravity can help establish the most likely form of the structures, infer lithologies, and extend the interpre- tation into areas of deficient information. The gravity technique is a very useful and relatively inexpensive exploration tool. However, its application requires careful consideration of all available data.
During a gravity survey, measurements are made with a sensitive gravimeter at discrete locations or stations. Figure 1.3.1-1 shows the gravimeter and op- erator at one of the WIPP survey stations. The instru- ment is a LaCoste and Romberg model D geodetic meter.
Because gravity is sensitive to both elevation and geographic latitude, station surveying is as important as the actual gravity metering. Surveying generally requires more than half the total field effort. Figure 1.3.1-2 shows the operator adjusting the Hewlett- Packard 3820A laser rangefinderltheodolite used for the survey.
To locate stations, the surveyor sets op the range- finderltheodolite on a topographic high with a resona- ble field of view along the survey line. The rodwoman

:ed off the approximate distance and then was .ked to within a couple of inches of the correct
,ocation by the surveyor. The station was leveled with a garden trowel, and a foot-square board was embed- ded in the sand. The survey rod was then centered on the board and the station elevation recorded. When the station was subsequently metered, the gravimeter baseplate was centered on the board. The operator could tell from the sand packed around its edges whether the board had been inadvertently moved during the interim.
'gure 1.3.1-1. Gravimeter and operator
Figure 1.3.1-2. Surveyor with Hewlett-Packard model 3820A laser rangefinderltheodolite
Gravity data are expressed in milligals, where a gal is an acceleration of 1 cm/s/s. The WIPP high- precision survey approched a relative accuracy of -+ 0.02 mgal, or about 2 x lo-' of the earth's total field (980 cm/s2).
The WIPP survey was originally planned to re- solve anomalies originating within the DZ and to help assure that additional structures are not present a t the site. Models of representative DZ structures produced anomalies of a few tenths of a milligal, with double half-widths of 2 km. (The double half-width is the distance between points at one-half the maximum amplitude of the anomaly and is a measure of the spatial wavelength.) I t was felt that the relatively simple geologic structure of strata above and below the Castile Formation would allow spatial wavelength discrimination of the DZ anomalies.
The WIPP project had previously purchased use of a regional gravity survey of the northern Delaware Basin from Exploration Surveys, Inc. of Dallas, Texas. These data are proprietary and cannot be released. The regional survey had stations a t quarter-mile in- tervals along a grid of lines -1 mi apart. The map indicated gravity anomalies in the vicinity of the DZ, but neither the station spacing nor data accuracy are sufficient to resolve the shape of the anomalies. I t provided definition of the regional gradient associated with the Delaware Basin and demonstrated a strong correlation between the longer wavelength anomalies and the seismic time structure maps prepared from the WIPP Vibroseis surveys.
As the WIPP gravity data became available, the density structure of the site was found to differ sub- stantially from that anticipated. Instead of gravity anomalies originating within DZ structures of the Castile Formation, the field is dominated by effects of lateral density variations within shallower and rela- tively flat-lying strata.
These results are consistent with those reported from gravity surveys in other karstlands. Colley (1963) discussed the gravity effect of air- and water-filled cavities of differing dimensions and depths below the surface. This paper includes examples of sharp nega- tive anomalies of -112 to 1 mgal delineated during detailed gravity surveys in Iraq. The region is part of an anhydrite karstland noted for its topographic de- pressions. The gravity anomalies are attributed to solution caverns and the related hydration of anhy- drite to gypsum.
In a more recent paper, Omnes (1977) discussed the fairly extensive use of microgravity to detect sub- surface cavities in karstlands. Examples are given of sharp negative anomalies of a few tenths of a milligal that were found, by drilling, to be associated with

either cavities or.10~-density fill in local sinks. In their surveys, the measured anomalies were always at least several times larger than the anomalies calculated on the basis of the geometrical dimensions of the cavities. This phenomenon is attributed by Omnes to stress relief, jointing, and dissolution induced by the exis- tence of a cavity.
1.3.2 Survey Locations The initial plan was to survey a rectangular area 2
by 5 mi covering all of WIPP site Zone 11. and 6 sq mi of' the DZ to the north. Stations were located on a imiform square grid because spatial filtering -.vould be used to resolve low-amplitude, long-wavelength anomalies originating within the Castile Formation.
As the survey progressed and data became avail- able, modifications were made to the original field plan. First the station spacing was changed from a grid 116 by 116 mi square to 13 north-south lines spaced 116 mi apart with stations a t 1118-mi intervals. This change was made because the entire lines would have to be surveyed and walked either way, and because the work associated with the additional stations was not great. The additional stations were later found neces- sary to resolve the gravity anomalies. A second change was to delete the northern 213 mi from the survey area. This northern area was covered with steep sand dunes, and both surveying and data reduction (terrain cor- rections) would be excessively difficult. The area actu- ally surveyed, and additional detailed sun7eys, are indicated on Figure 1.3.2-1.
Two small areas were surveyed in fine detail be- fore the main portion of the WIPP site was surveyed. The purpose of these two detail surveys was to estab- lish the short-wavelength character of the gravity field to assure the adequacy of planned station spacing. One of the detailed areas was in the southeast corner of' Section 21, R31E, T22S. This area has a fairly uniform smoothly dipping field and is not of further concern. The second detailed area was centered over a closed topographic depression along the east-west line hetween Sections 9 and 16. This area has one of the most distinctive short-wavelength negative anomalies a t the site. Borehole WIPP 14 was drilled to investi- gate the anomaly; it is subsequently referred to as "the \VIPP 14 Anomaly."
The main WIPP survey indicated two positive elliptical gravity anomalies in the southeast quarter of Section 18. These anomalies were near the soi~thern elids of survey lines L and M on the flanks of a topographic hill. There was no reasonable geologic iiiterpretation of the anomalies. The area was detailed later with a close spaced grid of gravity stations. Also, alternate lines of the close spaced grid were surveyed
with a hand-held total-intensity magnetometer. The new data showed that the gravity anomalies were not as extensive as originally interpreted, and that the magnetic field was relatively flat. Some inconsisten- cies were also noted between the two surveys. In an effort to resolve the inconsistencies, we rechecked the station elevations. The new elevation survey showed that the anomalies were caused by two sequential er- roneous instrument setups on the original survey. The area is now known to have almost flat gravity and magnetic fields.
Two additional projects were undertaken during the gravity survey. These were a network of reconnais- sance profiles over and around borehole WIPP 3.3, and two Reconnaissance profiles over Bell Lake Sink in R33E, T24S. These additional surveys were to explore the relation between the gravity anomalies and karsti- fication. The location of the WIPP 33 profiles are indicated on Figure 1.3.2-1 and the Bell Lake Sink profiles on Figure 2.3.2-1.
1.3.3 Data Reduction The force of gravity at the surface of the earth
depends on solar and lunar tides, on latitude, and on elevation. These effects are comparable to, or larger than, the effect of subsurface density structures. Thus the gravity measurements must be corrected before they can be interpreted. The corrections require addi- tional data. Latitude and elevation are from the sur- veying. Tides are calculated from the position of the sun and the moon at the time of the meter reading. In addition, the meter readings are corrected for instrrr- ment drift prorated over the time between base sta- tion readings. The corrections were made by the con- tractor and are tabulated in the contractor's report.
The Bouguer correction accounts for the attrac- tion of a flat-layered slab of material between the station and sealevel. The value of the Bouguer correc- tion depends on average density beneath the station (which is in general unknown). Fortunately, gravity interpretation depends on the relative gravity be- tween stations in the survey area and is independent of any constant offset in the data. The Bouguer slab density of interest is then the average density over the elevation range of the topography in the survey area. For the WIPP survey the contractor calculated gravi- ty for a family of Bouguer slab densities between 1.7 and 2.67 glcc. Inspection of the gravity profiles o\,er the topographic hill in the southeast corner of Section 28 indicated that the slab density ranges from 2.1 to 2.5 glcc; 2.3 glcc was selected for making the Bouguer. slab corrections. The data set used in the following interpretation was reduced with a Bouguer slab densi- ty of 2.3 glcc.

r- - NASH DRAW N HEX -- . ,,:,~.,*",,,> ,.- _. ..",".,.,<,, .
,L).YL, .." I L,OLmT.L .u.rcr DI.11. ~OLo..DO~ano.1.,"11610" 0 i mu -a .wr-
." ,., . . , . .O ,m.m~" . ,~>o - .... .c ".-..03..-c., .... ,,..,a C-.'MS.
Flgure 1.3.2-1. Topographic map of the Nash Draw Quadrangle
Topogiaphy near a station affects the gravity. Nearby hills or ridges exert an upward pull, and the missing mass of valleys results in leas downward at- traction. In areas of steep topography, the net effect can be large and is compensated for with a terrain correction calculated from topographic maps. At the WIPP site, terrain features include sand dunes, shal- low topographic depressions, and the hill in the south- east comer of Section 28. The local terrain is closely controlled through a set of detailed topographic con- tour maps prepared by Bohannan Hueton Inc. for Bechtel International (1 in. a 100 ft, 2-ft contour interval). These maps were inspected to select six sites showing the greatest topography. The terrain correc- tions of these sitee were calculated with the high- precision method described in Hammer (1982). The largest value was 0.041 mgal (top of hill in the south- east corner of Section 28). Terrain corrections for the gravity survey should not exceed this and are general- ly less than 0.02 mgaL
Considering the relatively large size of the gravity anomalies (several tenths of a milligal), detailed ter- rain corrections were not justified for the WIPP gravi- ty survey. (The local terrain introduces an uncertainty of several hundredths of milligal into the gravity data.)
The strongest component of the gravity field in the area of the WIPP site is the regional gradient oseociated with the Delaware Basin. This regional gradient is partially due to the thick sediments within the basin. According to Djeddi (1979), it is also par2 t i d y due to density variations between basement rocks within the Central Basin Platform and those on the eastern periphery of the basin. For large-scale structural studies, the gravity anomaly of the Dela- ware Basin is the "signaLw For detailed study of a s m d area within the basin, it is another form of noise that muet be removed before the data are interpreted. The gravity effect of the Delaware Basin is clearly shown on the proprietary regional swey . These data were used to determine a plane regional gradient that was subtracted from the WIPP survey gravity data. The WIPP site survey, the detailed areas, and the . WIPP 33 reconnaissance profiles were reduced with a regional gradient of 1.28 mgal/mi, increasing N34OE. The Bell Lake Sink reconnaissance profiles were re- duced with a regional gradient of 1.32 mgdmi, in- creasing N56OE.
It is also necessary to consider subjective data editing. Gravity sweying requires the very careful, repetitive setup, adjustment, and reading of sensitive instruments, often under less than optimal field con- ditions. Gages, meters, and clocks, must be read and recorded in field notebooks. These data are tran- scribed and entered onto computer cards, processed along with supporting information, and f d y print- ed out as a gravity value. The gravity values are again transcribed, filtered, and plotted. Even in the hest of conditions, some errors are bound to creep into the data set.
Editing consisted of the following:
Single-etation anomalies that were obviously dis- cordant with respect to the rest of a line were deleted. Stations occupied more than once were averaged. Some sets of readings were adjusted as a block so that their end points tie the adjacent sets. Some questionable areas were resurveyed and the newer data used.
All editing is identified on the data tables in the appendices to this report.
Three semipermanent base stations were estab- lished during the WIPP survey. Each semipermanent base is a small square pad of poured concrete, level on top, with three notches for the legs of the gravimeter base plate. They are located near (1) borehole WIPP 12 at the northern edge of WIPP site Zone II, (2) borehole P-4 in the southeast corner of Section 28, and (3) borehole P-12 along the road to H6 (the WIPP 33 reconnaissance profiles). Three additional temporary base stations were established on station survey boards near the two initial detail surveys and at Bell Lake Sink. Base station data are in Table 1.3.3-1.
The base near borehole WIPP 12 is tied to the eastern end of the front porch of the Chamber of Commerce Visitors Center in downtown Carlsbad. This location is near and at the same elevation as a prime gravity base station of the world gravity net- work [inside the building and not readily accessible). Reference code numbers of the prime base are ACIC 0431-3 and IGB 11924B. The 1970 value of prime base of 979,203.120 mgal was assumed for the corner of the porch.
All other WIPP s w e y base stations were tied to the one near borehole WIPP 12.

- - -
~ b l e 1.3.3-1. Gravity survey base stations
I. D. Gravity Base No. No. (Mgal) Location/Elevation Description
1 (prime)
2 (semipermanent)
3 (temporary)
4 (temporary)
5 (semipermanent)
6 (temporary)
4 (new) !mipermanent)
Carlsbad Chamber of commerce Visitors Center East end of porch
Near borehole WIPP 12 Northwest of the SE corner of Sec 17 0.87 ft below benchmark 2347
Near detailed survey in SE corner of Sec 21 293.33 ft due south of NE corner of Sec 28
Near WIPP 14 detailed survey Middle of line between Sec 9 and 16
Area of the WIPP 33 reconnaissance profiles Near borehole P-12 along N-S road to H6
Bell Lake Sink Station #BL 50
Near borehole P-4 In detailed survey in SE corner of Sec 28
2. Data
2.1 Main Site Survey The main site survey had stations a t 1118-mi
intervals along 13 north-south lines spaced 116 mi apart. From west to east the lines are identified as A through M; from south to north the stations are numbered 1 through 79. Figure 2.1-1 shows the station locations. Also shown on Figure 2.1-1 are stations of a detailed grid in the southeast corner of the site. This detailed grid covers the southeast quarter of Section 28 plus an additional 116 mi to the south and east. Within the detailed area, stations are on a 1118-mi square grid.
The data for the main site survey and for the detailed area in the southeast corner are here handled as profiles along the north-south survey lines. Appen- dix A gives for each line:
station number elevation Bouguer gravity Bouguer gravity less regional
Bouguer gravity less regional and parabolic trend editing
Figure 2.1-2 are north-south profiles of the simple Bouguer gravity. These data have been reduced with the linear regional trend discussed in Section 1.3.3 and with the parabolic trend indicated on the figures. The linear trend is related to the structure of the Delaware Basin. The parabolic trend correlates well with a seismic time-structure anticline on reflection horizons below the Castile Formation. In Section 3.1, these broad features are interpreted as resulting from relat- ed lateral variations in seismic velocity and bulk den- sity in the Ochoan Series.
Figure 2.1-3 (in pocket) is a contour map of the Bouguer gravity less regional and parabolic trend. On this map the contours are constrained to rigorously honor the posted data. Figure 2.1-4 is a generalized contour map of the same data, except the contours are within k0.025 mgal of the data. This map shows the - location and general form of significant anomalies detected by the survey. The original data points should be used for calculations (e.g., minimum miss- ing mass, max depth to top of body) or for modeling.

Line Identitlcation
Figure 2.1-1. Gravity station location and identification
z z s t
Y . . . . . . . . . . . . . . . . . . .
"" . . . . . . . . . . - 1 mile y . . . . . . . . . . . . ,, . . . . . . . : . . . .
. . . . . . . . . . . . . . . . . . . . . . . . .
. . . . . . . . . . . . . . . . . . . . . . . . . . . . . . . . . . . . . . . . . . . . . . . . . . . . . . . . . . . . . . . . . . . . . . . . . . . . . . . . . . . . .
. . . . . . . . . . . . . . . . . . . . . . . . . . . . . . . . . . . . . . . . . . . . . . . . . . . . . . . . . . . . . . . . . . . . . . . . . . . . . . . . . . . . . .
. . . . . . . . . . . . . . . . . . . . . . . . . . . . . . . . . . . . . . . . . . . . . . . . . . . . . . . . . . . . . . . . . . . . . . . . . . . . . . . . . . . . .
. . . . . . . . . . . . . . . . . . . . . . . . . . . . . . . . . . - = b - A = : x 4 .5X'Ld a x . . . . . . . . . . . . . . . . . . . . . . . . . . . . . . . . . . . . . . . . . . . . . . . . . . . . . . . . . . . . . . . . . . . . . . . . . . . . . . . . . . . . . . . . . . . . . . . . . .
. . . . . . . . . . . . . .
1 0 0
I r
. . . . . . . . . . . . . . . . . . . . . . . . .
. . . . . . . . . . . . . . . . . . . . . . . . . . . . . . . . . . . . . . . . . . . . . . . . . . . . . . . . . . . . . . . . . . . . . . . . . . . . . . . . . . . . . .
. . . . . . . . . . . . . . . . . . . . . . . . . . . . . . . . . . . . . . . . . . . . . . . . . . . . . . . . . . . . . . . . . . . . . . . . . . . . . . . . . . . . .
. . . . . . . . . . . . . . . . . . . . . . . . . . . . . . . . . . . . . . . . . . . . . . . . . . . . . . . . . . . . . . . . . . . . . . . . . . . . . . . . . . . . . .
. . . . . . . . . . . . . . . . . . . . . . . . . . . . . . . . . . . . . . . . . . . . . . . . . . . . . . . . . . . . . . . . . . . . . . . . . . . . . . . .

(b)
Figure 2.1-2. Simple Bouguer gravity profiles for the main site survey


(f)
Figure 2.1-2. (Cont)


(i)
Figure 2.1-2. (Cont)

Figure 2.1-2. (Cont)
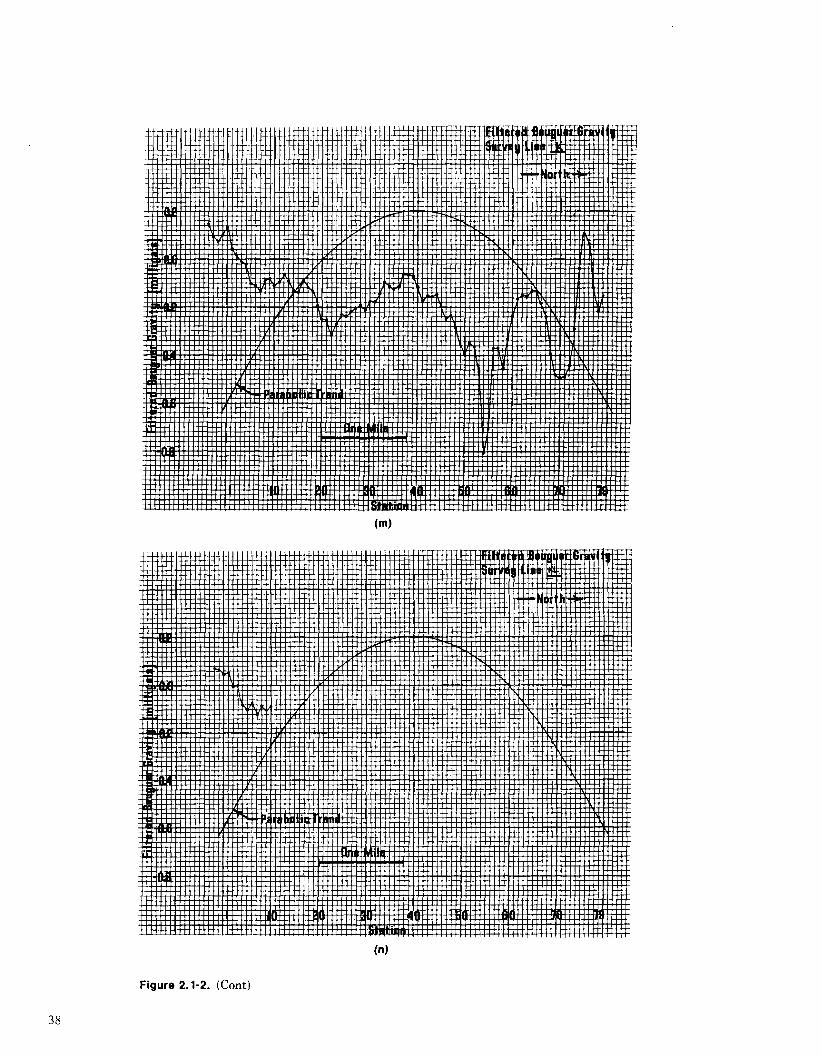
(n )
Figure 2.1-2. (Cont)

(PI
Figure 2.1-2. (Cont)
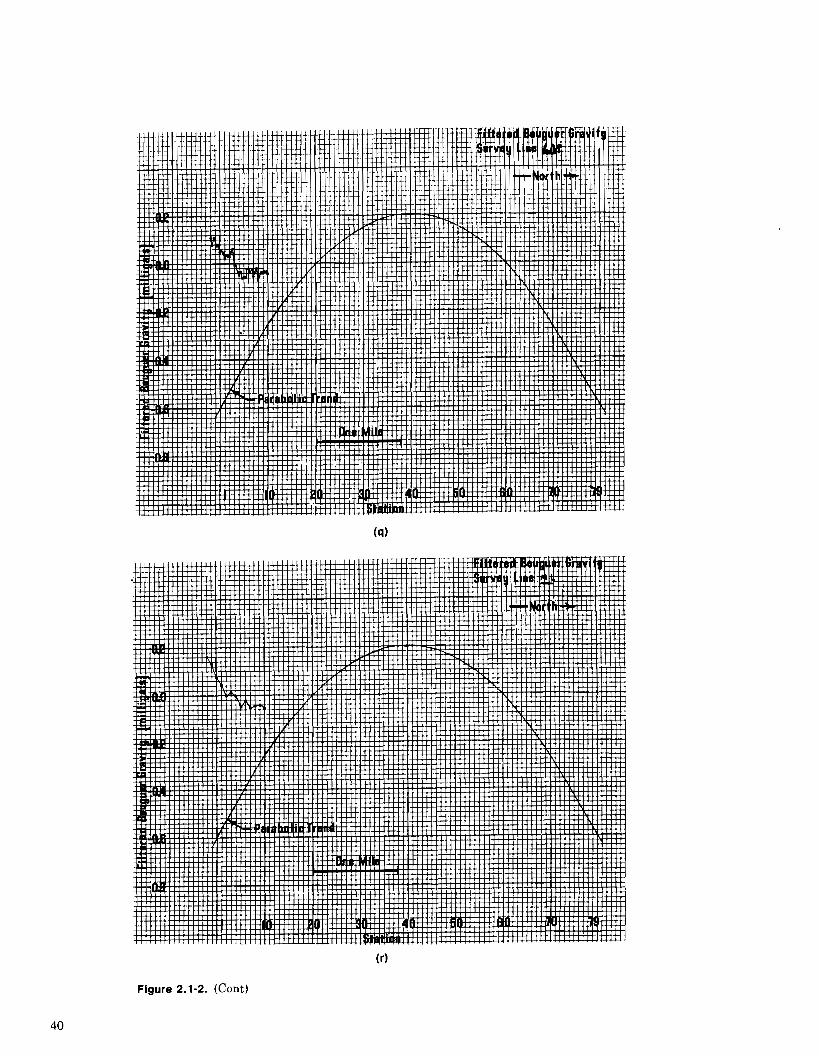
(r)
Figure 2.1-2. (Cont)


(4
Figure 2.1-2. (Concluded)

- -- - - 1
Simple Bouguer Gravity Less Linear Regional & Parabolic Trend Slab Density 2.3 g/c3 0.05-Milligal Contour Interval Contours Within 1 0 . 0 2 5 mg
4. Simple Bouguer gavity-main site survey (generdizd)