f o rm 10-q s e curi t i e s and e xch ang e co m m i s s
TRANSCRIPT

UNITED STATESSECURITIES AND EXCHANGE COMMISSION
Washington, D.C. 20549FORM 10-Q
☒ QUARTERLY REPORT PURSUANT TO SECTION 13 OR 15(D) OF THE SECURITIES EXCHANGE ACT OF 1934
For the quarterly period ended March 31, 2021OR
☐ TRANSITION REPORT PURSUANT TO SECTION 13 OR 15(D) OF THE SECURITIES EXCHANGE ACT OF 1934
Commission file number 001-34057
AGNC INVESTMENT CORP.(Exact name of registrant as specified in its charter)
__________________________________________________Delaware 26-1701984
(State or Other Jurisdiction ofIncorporation or Organization)
(I.R.S. EmployerIdentification No.)
2 Bethesda Metro Center, 12th FloorBethesda, Maryland 20814
(Address of principal executive offices)(301) 968-9315
(Registrant’s telephone number, including area code) __________________________________________________
Securities registered pursuant to Section 12(b) of the Act:Title of Each Class Trading Symbol(s) Name of Exchange on Which Registered
Common Stock, par value $0.01 per share AGNC The Nasdaq Global Select MarketDepositary shares of 7.000% Series C Fixed-to-Floating Rate Cumulative Redeemable Preferred
Stock AGNCN The Nasdaq Global Select Market
Depositary shares of 6.875% Series D Fixed-to-Floating Rate Cumulative Redeemable PreferredStock AGNCM The Nasdaq Global Select Market
Depositary shares of 6.50% Series E Fixed-to-Floating Rate Cumulative Redeemable PreferredStock AGNCO The Nasdaq Global Select Market
Depositary shares of 6.125% Series F Fixed-to-Floating Rate Cumulative Redeemable PreferredStock AGNCP The Nasdaq Global Select Market
Securities Registered Pursuant to Section 12(g) of the Act: NoneIndicate by check mark whether the registrant (1) has filed all reports to be filed by Section 13 or 15(d) of the Securities Exchange Act of 1934 during the preceding 12 months (or for such
shorter period that the registrant was required to file such reports), and (2) has been subject to such filing requirements for the past 90 days. Yes x No ☐Indicate by check mark whether the registrant has submitted electronically every Interactive Data File required to be submitted pursuant to Rule 405 of Regulation S-T during the preceding
12 months (or for such shorter period that the registrant was required to submit such files). Yes x No ☐Indicate by check mark whether the registrant is a large accelerated filer, an accelerated filer, a non-accelerated filer, a smaller reporting company, or an emerging growth company. See
definitions of "large accelerated filer," "accelerated filer," "smaller reporting company" and "emerging growth company" in Rule 12b-2 of the Exchange Act.Large accelerated filer ☒ Accelerated filer ☐
Non-accelerated filer ☐ Smaller Reporting Company ☐
Emerging growth company ☐
If an emerging growth company, indicate by check mark if registrant has elected not to use the extended transition period for complying with any new or revised financial accountingstandards provided pursuant to Section 13(a) of the Exchange Act. ☐
Indicate by check mark whether the registrant is a shell company (as defined in Rule 12b-2 of the Exchange Act). Yes ☐ No xThe number of shares of the issuer's common stock, $0.01 par value, outstanding as of April 30, 2021 was 524,907,212.

AGNC INVESTMENT CORP.
TABLE OF CONTENTS PART I. FINANCIAL INFORMATIONItem 1. Financial Statements 2Item 2. Management's Discussion and Analysis of Financial Condition and Results of Operations 23Item 3. Quantitative and Qualitative Disclosures About Market Risk 40Item 4. Controls and Procedures 43
PART II. OTHER INFORMATIONItem 1. Legal Proceedings 44Item 1A. Risk Factors 44Item 2. Unregistered Sales of Equity Securities and Use of Proceeds 44Item 3. Defaults upon Senior Securities 44Item 4. Mine Safety Disclosures 44Item 5. Other Information 44Item 6. Exhibits 44
Signatures 47
1
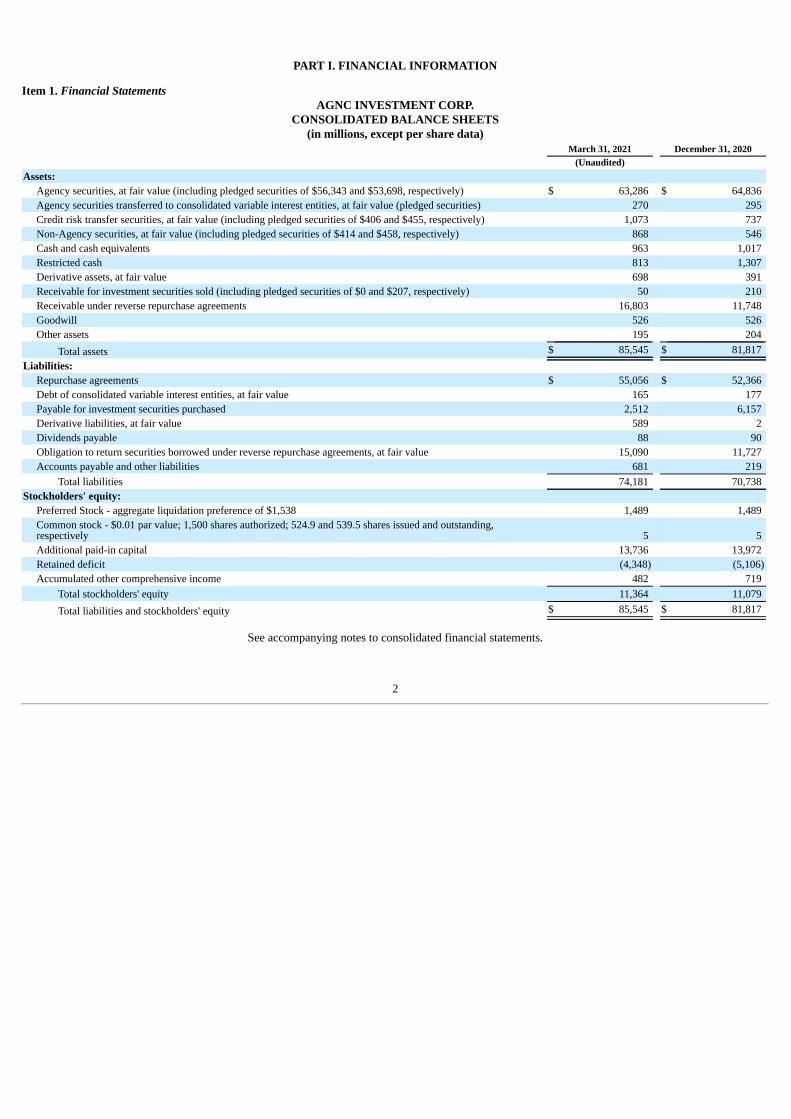
PART I. FINANCIAL INFORMATION
Item 1. Financial StatementsAGNC INVESTMENT CORP.
CONSOLIDATED BALANCE SHEETS(in millions, except per share data)
March 31, 2021 December 31, 2020(Unaudited)
Assets:Agency securities, at fair value (including pledged securities of $56,343 and $53,698, respectively) $ 63,286 $ 64,836 Agency securities transferred to consolidated variable interest entities, at fair value (pledged securities) 270 295 Credit risk transfer securities, at fair value (including pledged securities of $406 and $455, respectively) 1,073 737 Non-Agency securities, at fair value (including pledged securities of $414 and $458, respectively) 868 546 Cash and cash equivalents 963 1,017 Restricted cash 813 1,307 Derivative assets, at fair value 698 391 Receivable for investment securities sold (including pledged securities of $0 and $207, respectively) 50 210 Receivable under reverse repurchase agreements 16,803 11,748 Goodwill 526 526 Other assets 195 204
Total assets $ 85,545 $ 81,817 Liabilities:
Repurchase agreements $ 55,056 $ 52,366 Debt of consolidated variable interest entities, at fair value 165 177 Payable for investment securities purchased 2,512 6,157 Derivative liabilities, at fair value 589 2 Dividends payable 88 90 Obligation to return securities borrowed under reverse repurchase agreements, at fair value 15,090 11,727 Accounts payable and other liabilities 681 219
Total liabilities 74,181 70,738 Stockholders' equity:
Preferred Stock - aggregate liquidation preference of $1,538 1,489 1,489 Common stock - $0.01 par value; 1,500 shares authorized; 524.9 and 539.5 shares issued and outstanding,respectively 5 5 Additional paid-in capital 13,736 13,972 Retained deficit (4,348) (5,106)Accumulated other comprehensive income 482 719
Total stockholders' equity 11,364 11,079 Total liabilities and stockholders' equity $ 85,545 $ 81,817
See accompanying notes to consolidated financial statements.
2

AGNC INVESTMENT CORP.CONSOLIDATED STATEMENTS OF COMPREHENSIVE INCOME
(Unaudited)(in millions, except per share data)
Three Months Ended
March 31, 2021 2020Interest income:
Interest income $ 557 $ 491 Interest expense 29 426
Net interest income 528 65 Other gain (loss), net:
Gain (loss) on sale of investment securities, net (13) 494 Unrealized gain (loss) on investment securities measured at fair value through net income, net (955) 197 Gain (loss) on derivative instruments and other securities, net 1,439 (3,154)
Total other gain (loss), net: 471 (2,463)Expenses:
Compensation and benefits 16 13 Other operating expense 8 10
Total operating expense 24 23 Net income (loss) 975 (2,421)
Dividends on preferred stock 25 21 Net income (loss) available (attributable) to common stockholders $ 950 $ (2,442)
Net income (loss) $ 975 $ (2,421)Unrealized gain (loss) on investment securities measured at fair value through othercomprehensive income (loss), net (237) 464
Comprehensive income (loss) 738 (1,957)Dividends on preferred stock 25 21
Comprehensive income (loss) available (attributable) to common stockholders $ 713 $ (1,978)
Weighted average number of common shares outstanding - basic 533.7 548.0
Weighted average number of common shares outstanding - diluted 535.6 548.0
Net income (loss) per common share - basic $ 1.78 $ (4.46)
Net income (loss) per common share - diluted $ 1.77 $ (4.46)
Dividends declared per common share $ 0.36 $ 0.48
See accompanying notes to consolidated financial statements.
3

AGNC INVESTMENT CORP.CONSOLIDATED STATEMENTS OF STOCKHOLDERS' EQUITY
(Unaudited)(in millions)
PreferredStock
Common Stock AdditionalPaid-inCapital
Retained Deficit
AccumulatedOther
ComprehensiveIncome (Loss) TotalShares Amount
Balance, December 31, 2019 $ 932 540.9 $ 5 $ 13,893 $ (3,886) $ 97 $ 11,041 Net loss — — — — (2,421) — (2,421)Other comprehensive income:
Unrealized gain on available-for-sale securities, net — — — — — 464 464 Stock-based compensation, net — 0.1 — 3 — — 3 Issuance of preferred stock, net of offering cost 557 — — — — — 557 Issuance of common stock, net of offering cost — 26.7 1 438 — — 439 Preferred dividends declared — — — — (21) — (21)Common dividends declared — — — — (264) — (264)
Balance, March 31, 2020 $ 1,489 567.7 $ 6 $ 14,334 $ (6,592) $ 561 $ 9,798
Balance, December 31, 2020 $ 1,489 539.5 $ 5 $ 13,972 $ (5,106) $ 719 $ 11,079 Net income — — — — 975 — 975 Other comprehensive loss:
Unrealized loss on available-for-sale securities, net — — — — — (237) (237)Stock-based compensation, net — 0.4 — 3 — — 3 Repurchase of common stock — (15.0) — (239) — — (239)Preferred dividends declared — — — — (25) — (25)Common dividends declared — — — — (192) — (192)
Balance, March 31, 2021 $ 1,489 524.9 $ 5 $ 13,736 $ (4,348) $ 482 $ 11,364
See accompanying notes to consolidated financial statements.
4

AGNC INVESTMENT CORP.CONSOLIDATED STATEMENTS OF CASH FLOWS
(Unaudited)(in millions)
Three Months EndedMarch 31,
2021 2020Operating activities:Net income (loss) $ 975 $ (2,421)Adjustments to reconcile net income (loss) to net cash provided by operating activities:
Amortization of premiums and discounts on mortgage-backed securities, net (76) 384 Stock-based compensation, net 3 3 (Gain) loss on sale of investment securities, net 13 (494)Unrealized (gain) loss on investment securities measured at fair value through net income, net 955 (197)(Gain) loss on derivative instruments and other securities, net (1,439) 3,154 Decrease in other assets 9 78 Decrease in accounts payable and other accrued liabilities (12) (160)
Net cash provided by operating activities 428 347 Investing activities:
Purchases of Agency mortgage-backed securities (14,029) (23,339)Purchases of credit risk transfer and non-Agency securities (497) (347)Proceeds from sale of Agency mortgage-backed securities 6,366 49,596 Proceeds from sale of credit risk transfer and non-Agency securities 137 492 Principal collections on Agency mortgage-backed securities 4,317 3,743 Principal collections on credit risk transfer and non-Agency securities 9 11 Payments on U.S. Treasury securities (4,313) (17,907)Proceeds from U.S. Treasury securities 8,474 8,795 Net proceeds from (payments on) reverse repurchase agreements (5,055) 5,275 Net proceeds from (payments on) derivative instruments 1,395 (2,742)
Net cash provided by (used in) investing activities (3,196) 23,577 Financing activities:
Proceeds from repurchase arrangements 526,319 1,162,934 Payments on repurchase agreements (523,629) (1,185,576)Payments on debt of consolidated variable interest entities (12) (16)Net proceeds from preferred stock issuances — 557 Net proceeds from common stock issuances — 439 Payments for common stock repurchases (239) — Cash dividends paid (219) (277)
Net cash provided by (used in) financing activities 2,220 (21,939)Net change in cash, cash equivalents and restricted cash (548) 1,985 Cash, cash equivalents and restricted cash at beginning of period 2,324 1,282 Cash, cash equivalents and restricted cash at end of period $ 1,776 $ 3,267
See accompanying notes to consolidated financial statements.
5

AGNC INVESTMENT CORP.
NOTES TO CONSOLIDATED FINANCIAL STATEMENTS
(Unaudited)
Note 1. Organization
AGNC Investment Corp. (referred throughout this report as the "Company," "we," "us" and "our") was organized in Delaware on January 7, 2008 andcommenced operations on May 20, 2008 following the completion of our initial public offering. Our common stock is traded on The Nasdaq Global SelectMarket under the symbol "AGNC."
We invest primarily in Agency residential mortgage-backed securities ("Agency RMBS") for which the principal and interest payments areguaranteed by a U.S. Government-sponsored enterprise ("GSE") or a U.S. Government agency. We also invest in other types of mortgage and mortgage-related securities, such as credit risk transfer ("CRT") securities and non-Agency residential and commercial mortgage-backed securities ("non-AgencyRMBS" and "CMBS," respectively), where repayment of principal and interest is not guaranteed by a GSE or U.S. Government agency, and other assetsrelated to the housing, mortgage or real estate markets. We fund our investments primarily through collateralized borrowings structured as repurchaseagreements.
We operate to qualify to be taxed as a real estate investment trust ("REIT") under the Internal Revenue Code of 1986, as amended (the "InternalRevenue Code"). As a REIT, we are required to distribute annually 90% of our taxable income, and we will generally not be subject to U.S. federal or statecorporate income tax to the extent that we distribute our annual taxable income to our stockholders on a timely basis. It is our intention to distribute 100%of our taxable income, after application of available tax attributes, within the limits prescribed by the Internal Revenue Code, which may extend into thesubsequent tax year.
We are internally managed with the principal objective of providing our stockholders with attractive risk-adjusted returns through a combination ofmonthly dividends and tangible net book value accretion. We generate income from the interest earned on our investments, net of associated borrowing andhedging costs, and net realized gains and losses on our investment and hedging activities.
Note 2. Summary of Significant Accounting Policies
Basis of Presentation
Our accompanying consolidated financial statements and related notes have been prepared in accordance with U.S. generally accepted accountingprinciples ("GAAP") for interim financial information and pursuant to the requirements for reporting on Form 10-Q and Article 10 of Regulation S-X. Theaccompanying consolidated financial statements and related notes are unaudited and include the accounts of all our wholly-owned subsidiaries and variableinterest entities for which we are the primary beneficiary. Significant intercompany accounts and transactions have been eliminated. The accompanyingconsolidated financial statements and related notes should be read in conjunction with the audited consolidated financial statements included in our mostrecent Annual Report on Form 10-K for the fiscal year ended December 31, 2020.
The preparation of consolidated financial statements in conformity with GAAP requires management to make estimates and assumptions that affectthe reported amounts of assets and liabilities and disclosure of contingent assets and liabilities at the date of the consolidated financial statements and thereported amounts of income and expenses during the reporting period. In the opinion of management, all adjustments, consisting solely of normal recurringaccruals, necessary for the fair presentation of consolidated financial statements for the interim period have been included. The current period’s results ofoperations are not necessarily indicative of results that ultimately may be achieved for the year.
Investment Securities
Agency RMBS consist of residential mortgage pass-through securities and collateralized mortgage obligations ("CMOs") guaranteed by the FederalNational Mortgage Association ("Fannie Mae"), Federal Home Loan Mortgage Corporation ("Freddie Mac," and together with Fannie Mae, the "GSEs") orthe Government National Mortgage Association ("Ginnie Mae").
CRT securities are risk sharing instruments issued by the GSEs, and similarly structured transactions issued by third-party market participants, thatsynthetically transfer a portion of the risk associated with credit losses within pools of conventional residential mortgage loans from the GSEs and/or thirdparties to private investors. Unlike Agency RMBS, full repayment of the original principal balance of CRT securities is not guaranteed by a GSE or U.S.Government agency; rather, "credit risk transfer" is achieved by writing down the outstanding principal balance of the CRT securities if credit losses on arelated pool
6
of loans exceed certain thresholds. By reducing the amount that they are obligated to repay to holders of CRT securities, the GSEs and/or other third partiesoffset credit losses on the related loans.
Non-Agency RMBS and CMBS (together, "Non-Agency MBS") are backed by residential and commercial mortgage loans, respectively, packagedand securitized by a private institution, such as a commercial bank. Non-Agency MBS typically benefit from credit enhancements derived from structuralelements, such as subordination, overcollateralization or insurance, but nonetheless carry a higher level of credit exposure than Agency RMBS.
All of our securities are reported at fair value on our consolidated balance sheet. Accounting Standards Codification ("ASC") Topic 320, Investments—Debt and Equity Securities, requires that at the time of purchase, we designate a security as held-to-maturity, available-for-sale or trading, depending onour ability and intent to hold such security to maturity. Alternatively, we may elect the fair value option of accounting for securities pursuant to ASC Topic825, Financial Instruments. Prior to fiscal year 2017, we primarily designated our investment securities as available-for-sale. On January 1, 2017, we beganelecting the fair value option of accounting for all investment securities newly acquired after such date. Unrealized gains and losses on securities classifiedas available-for-sale are reported in accumulated other comprehensive income ("OCI"), whereas unrealized gains and losses on securities for which weelected the fair value option, or are classified as trading, are reported in net income through other gain (loss). Upon the sale of a security designated asavailable-for-sale, we determine the cost of the security and the amount of unrealized gain or loss to reclassify out of accumulated OCI into earnings basedon the specific identification method. In our view, the election of the fair value option simplifies the accounting for investment securities and moreappropriately reflects the results of our operations for a reporting period by presenting the fair value changes for these assets in a manner consistent withthe presentation and timing of the fair value changes for our derivative instruments.
We generally recognize gains or losses through net income on available-for-sale securities only if the security is sold; however, if the fair value of asecurity declines below its amortized cost and we determine that it is more likely than not that we will incur a realized loss on the security when we sell theasset, we will recognize the difference between the amortized cost and the fair in net income as a component of other gain (loss). Since all of our available-for-sale designated securities consist of Agency RMBS, we do not have an allowance for credit losses. We have not recognized impairment losses on ouravailable-for-sale securities through net income for the periods presented in our consolidated financial statements.
Interest Income
Interest income is accrued based on the outstanding principal amount of the investment securities and their contractual terms. Premiums or discountsassociated with the purchase of Agency RMBS and non-Agency MBS of high credit quality are amortized or accreted into interest income, respectively,over the projected lives of the securities, including contractual payments and estimated prepayments, using the effective interest method in accordance withASC Subtopic 310-20, Receivables—Nonrefundable Fees and Other Costs.
We estimate long-term prepayment speeds of our mortgage securities using a third-party service and market data. The third-party service providerestimates prepayment speeds using models that incorporate the forward yield curve, primary to secondary mortgage rate spreads, current mortgage rates,mortgage rates of the outstanding loans, age and size of the outstanding loans, loan-to-value ratios, interest rate volatility and other factors. We review theprepayment speeds estimated by the third-party service for reasonableness with consideration given to both historical prepayment speeds and currentmarket conditions. If based on our assessment, we believe that the third-party model does not fully reflect our expectations of the current prepaymentlandscape, such as during periods of elevated market uncertainty or unique market conditions, we may make adjustments to the models. We review ouractual and anticipated prepayment experience on at least a quarterly basis and effective yields are recalculated when differences arise between (i) ourprevious estimate of future prepayments and (ii) actual prepayments to date and our current estimate of future prepayments. We are required to record anadjustment in the current period to premium amortization / discount accretion for the cumulative effect of the difference in the effective yields as if therecalculated yield had been in place as of the security's acquisition date through the reporting date.
At the time we purchase CRT securities and non-Agency MBS that are not of high credit quality, we determine an effective yield based on ourestimate of the timing and amount of future cash flows and our cost basis. Our initial cash flow estimates for these investments are based on ourobservations of current information and events and include assumptions related to interest rates, prepayment rates and the impact of default and severityrates on the timing and amount of credit losses. On at least a quarterly basis, we review the estimated cash flows and make appropriate adjustments basedon inputs and analysis received from external sources, internal models, and our judgment regarding such inputs and other factors. Any resulting changes ineffective yield are recognized prospectively based on the current amortized cost of the investment adjusted for credit impairments, if any.
7
Repurchase Agreements
We finance the acquisition of securities for our investment portfolio primarily through repurchase agreements with financial institutions. Repurchasearrangements involve the sale and a simultaneous agreement to repurchase the transferred assets at a future date. We maintain a beneficial interest in thespecific securities pledged during the term of each repurchase arrangement and we receive the related principal and interest payments. Pursuant to ASCTopic 860, Transfers and Servicing, we account for repurchase agreements as collateralized financing transactions, which are carried at their contractualamounts (cost), plus accrued interest. Our repurchase agreements typically have maturities of less than one year but may extend up to five years or more.
Reverse Repurchase Agreements and Obligation to Return Securities Borrowed under Reverse Repurchase Agreements
We borrow securities to cover short sales of U.S. Treasury securities through reverse repurchase transactions under our master repurchase agreements(see Derivative Instruments below). We account for these as securities borrowing transactions and recognize an obligation to return the borrowed securitiesat fair value on the balance sheet based on the value of the underlying borrowed securities as of the reporting date. We may also enter into reverserepurchase agreements to earn a yield on excess cash balances. The securities received as collateral in connection with our reverse repurchase agreementsmitigate our credit risk exposure to counterparties. Our reverse repurchase agreements typically have maturities of 30 days or less.
Derivative Instruments
We use a variety of derivative instruments to hedge a portion of our exposure to market risks, including interest rate, prepayment, extension andliquidity risks. The objective of our risk management strategy is to reduce fluctuations in net book value over a range of interest rate scenarios. Inparticular, we attempt to mitigate the risk of the cost of our variable rate liabilities increasing during a period of rising interest rates. The primaryinstruments that we use are interest rate swaps, options to enter into interest rate swaps ("swaptions"), U.S. Treasury securities and U.S. Treasury futurescontracts. We also use forward contracts in the Agency RMBS "to-be-announced" market, or TBA securities, to invest in and finance Agency securities andto periodically reduce our exposure to Agency RMBS.
We account for derivative instruments in accordance with ASC Topic 815, Derivatives and Hedging ("ASC 815"). ASC 815 requires an entity torecognize all derivatives as either assets or liabilities in our accompanying consolidated balance sheets and to measure those instruments at fair value. Noneof our derivative instruments have been designated as hedging instruments for accounting purposes under the provisions of ASC 815, consequently changesin the fair value of our derivative instruments are reported in gain (loss) on derivative instruments and other securities, net in our consolidated statements ofcomprehensive income.
Our derivative agreements generally contain provisions that allow for netting or setting off derivative assets and liabilities with the counterparty;however, we report related assets and liabilities on a gross basis in our consolidated balance sheets. Derivative instruments in a gain position are reported asderivative assets at fair value and derivative instruments in a loss position are reported as derivative liabilities at fair value in our consolidated balancesheets. Changes in fair value of derivative instruments and periodic settlements related to our derivative instruments are recorded in gain (loss) onderivative instruments and other securities, net in our consolidated statements of comprehensive income. Cash receipts and payments related to derivativeinstruments are classified in our consolidated statements of cash flows according to the underlying nature or purpose of the derivative transaction, generallyin the investing section.
Interest rate swap agreements
We use interest rate swaps to economically hedge the variable cash flows associated with our borrowings made under repurchase agreements. Underour interest rate swap agreements, we typically pay a fixed rate and receive a floating rate ("payer swaps") based on a short-term benchmark rate, such asthe Secured Overnight Financing Rate ("SOFR"), Overnight Index Swap Rate ("OIS") or three-month London Interbank Offered Rate ("LIBOR"). Ourinterest rate swaps typically have terms from one to 10 years but may extend up to 20 years or more. Our interest rate swaps are centrally cleared through aregistered commodities exchange. The clearing exchange requires that we post an "initial margin" amount determined by the exchange, which is generallyintended to be set at a level sufficient to protect the exchange from the interest rate swap's maximum estimated single-day price movement. We alsoexchange daily settlements of "variation margin" based upon changes in fair value, as measured by the exchange. Pursuant to rules governing centralclearing activities, we recognize variation margin settlements as a direct reduction of the carrying value of the interest rate swap asset or liability.
8

Interest rate swaptions
We purchase interest rate swaptions to help mitigate the potential impact of larger, more rapid changes in interest rates on the performance of ourinvestment portfolio. Interest rate swaptions provide us the option to enter into an interest rate swap agreement for a predetermined notional amount, statedterm and pay and receive interest rates in the future. Our interest rate swaption agreements are not subject to central clearing. The premium paid for interestrate swaptions is reported as an asset in our consolidated balance sheets. The difference between the premium paid and the fair value of the swaption isreported in gain (loss) on derivative instruments and other securities, net in our consolidated statements of comprehensive income. If a swaption expiresunexercised, the realized loss on the swaption would be equal to the premium paid. If we sell or exercise a swaption, the realized gain or loss on theswaption would be equal to the difference between the cash or the fair value of the underlying interest rate swap and the premium paid.
TBA securities
A TBA security is a forward contract for the purchase or sale of Agency RMBS at a predetermined price, face amount, issuer, coupon and statedmaturity on an agreed-upon future date. The specific Agency RMBS to be delivered into the contract are not known until shortly before the settlement date.We may choose, prior to settlement, to move the settlement of these securities out to a later date by entering into an offsetting TBA position, net settling theoffsetting positions for cash, and simultaneously purchasing or selling a similar TBA contract for a later settlement date (together referred to as a "dollarroll transaction"). The Agency securities purchased or sold for a forward settlement date are typically priced at a discount to equivalent securities settling inthe current month. This difference, or "price drop," is the economic equivalent of interest income on the underlying Agency securities, less an impliedfunding cost, over the forward settlement period (referred to as "dollar roll income"). Consequently, forward purchases of Agency securities and dollar rolltransactions represent a form of off-balance sheet financing.
We account for TBA contracts as derivative instruments since either the TBA contracts do not settle in the shortest period of time possible or wecannot assert that it is probable at inception and throughout the term of the TBA contract that we will physically settle the contract on the settlement date.We account for TBA dollar roll transactions as a series of derivative transactions.
U.S. Treasury securities
We use U.S. Treasury securities and U.S. Treasury futures contracts to mitigate the potential impact of changes in interest rates on the performance ofour portfolio. We borrow U.S. Treasury securities under reverse repurchase agreements to cover short sales of U.S. Treasury securities. We account forthese as securities borrowing transactions and recognize an obligation to return the borrowed securities at fair value on our accompanying consolidatedbalance sheets based on the value of the underlying U.S. Treasury security as of the reporting date. Gains and losses associated with U.S. Treasurysecurities and U.S. Treasury futures contracts are recognized in gain (loss) on derivative instruments and other securities, net in our consolidated statementsof comprehensive income.
Fair Value Measurements
We determine the fair value of financial instruments based on our estimate of the price that would be received to sell the asset or paid to transfer theliability in an orderly transaction between market participants at the measurement date. We utilize a three-level valuation hierarchy for disclosure of fairvalue measurements based upon the transparency of inputs to the valuation of the instrument as of the measurement date. We categorize a financialinstrument within the hierarchy based upon the lowest level of input that is significant to the fair value measurement.
The three levels of valuation hierarchy are defined as follows:
• Level 1 Inputs —Quoted prices (unadjusted) for identical unrestricted assets and liabilities in active markets that are accessible at the measurementdate.
• Level 2 Inputs —Quoted prices for similar assets and liabilities in active markets; quoted prices for identical or similar instruments in markets thatare not active; and model-derived valuations whose inputs are observable or whose significant value drivers are observable.
• Level 3 Inputs —Instruments with primarily unobservable market data that cannot be corroborated.
The majority of our financial instruments are classified as Level 2 inputs. The availability of observable inputs can be affected by a wide variety offactors, including the type of instrument, whether the instrument is new and not yet established in the marketplace and other characteristics particular to theinstrument. We typically obtain price estimates from multiple third-
9

party pricing sources, such as pricing services and dealers, or, if applicable, the registered clearing exchange. We make inquiries of third-party pricingsources to understand the significant inputs and assumptions they used to determine their prices and that they are derived from orderly transactions,particularly during periods of elevated market turbulence and reduced market liquidity. We also review third-party price estimates and perform proceduresto validate their reasonableness, including an analysis of the range of estimates for each position, comparison to recent trade activity for similar securitiesand for consistency with market conditions observed as of the measurement date. While we do not adjust prices we obtain from pricing sources, we willexclude prices for securities from our estimation of fair value if we determine based on our validation procedures and our market knowledge and expertisethat the price is significantly different from what observable market data would indicate and we cannot obtain an understanding from the third-party sourceas to the significant inputs used to determine the price.
The following is a description of the valuation methodologies used for instruments measured at fair value on a recurring basis classified as Level 2inputs. These instruments trade in active markets such that participants transact with sufficient frequency and volume to provide transparent pricinginformation on an ongoing basis. The liquidity of these markets and the similarity of our securities and derivative instruments to those actively tradedenable our pricing sources and us to observe quoted prices in the market and utilize those prices as a basis for formulating fair value measurements.
Investment securities - are valued based on prices obtained from multiple third-party pricing sources. The pricing sources utilize various valuationapproaches, including market and income approaches. For Agency RMBS, the pricing sources primarily utilize a matrix pricing technique that interpolatesthe estimated fair value based on observed quoted prices for forward contracts in the Agency RMBS "to-be-announced" market ("TBA securities") of thesame coupon, maturity and issuer, adjusted to reflect the specific characteristics of the pool of mortgages underlying the Agency security, such as maximumloan balance, loan vintage, loan-to-value ratio, geography and other characteristics as may be appropriate. For other investment securities, the pricingsources primarily utilize discounted cash flow model-derived pricing techniques to estimate the fair value. Such models incorporate market-based discountrate assumptions based on observable inputs such as recent trading activity, credit data, volatility statistics, benchmark interest rate curves, spreadmeasurements to benchmark curves and other market data that are current as of the measurement date and may include certain unobservable inputs, such asassumptions of future levels of prepayment, defaults and loss severities.
TBA securities - are valued using prices obtained from third-party pricing sources based on pricing models that reference recent trading activity.
Interest rate swaps - are valued using the daily settlement price, or fair value, determined by the clearing exchange based on a pricing model thatreferences observable market inputs, including current benchmark rates and the forward yield curve.
Interest rate swaptions - are valued using prices obtained from the counterparty and other third-party pricing models. The pricing models are basedon the value of the future interest rate swap that we have the option to enter into as well as the remaining length of time that we have to exercise the optionbased on observable market inputs, adjusted for non-performance risk, if any.
U.S. Treasury securities and futures are valued based on quoted prices for identical instruments in active markets and are classified as Level 1 assets.None of our financial instruments are classified as Level 3 inputs.
Recent Accounting Pronouncements
We consider the applicability and impact of all ASUs issued by the FASB. There are no unadopted ASUs that are expected to have a significantimpact on our consolidated financial statements when adopted or other recently adopted ASUs that had a significant impact on our consolidated financialstatements upon adoption.
Note 3. Investment Securities
As of March 31, 2021 and December 31, 2020, our investment portfolio consisted of $65.5 billion and $66.4 billion of investment securities, at fairvalue, respectively, and $24.8 billion and $31.5 billion of net TBA securities, at fair value, respectively. Our net TBA position is reported at its net carryingvalue of $(576) million and $275 million as of March 31, 2021 and December 31, 2020, respectively, in derivative assets / (liabilities) on our accompanyingconsolidated balance sheets. The net carrying value of our TBA position represents the difference between the fair value of the underlying Agency securityin the TBA contract and the cost basis or the forward price to be paid or received for the underlying Agency security.
As of March 31, 2021 and December 31, 2020, our investment securities had a net unamortized premium balance of $2.5 billion and $2.4 billion,respectively.
10

The following tables summarize our investment securities as of March 31, 2021 and December 31, 2020, excluding TBA securities, (dollars inmillions). Details of our TBA securities as of each of the respective dates are included in Note 5.
March 31, 2021 December 31, 2020
Investment SecuritiesAmortized
Cost Fair ValueAmortized
Cost Fair ValueAgency RMBS:
Fixed rate $ 61,659 $ 63,122 $ 61,977 $ 64,615 Adjustable rate 61 62 69 70 CMO 249 259 289 301 Interest-only and principal-only strips 96 113 105 126 Multifamily — — 17 19
Total Agency RMBS 62,065 63,556 62,457 65,131 Non-Agency RMBS 487 495 178 188 CMBS 356 373 333 358 CRT securities 1,067 1,073 733 737 Total investment securities $ 63,975 $ 65,497 $ 63,701 $ 66,414
March 31, 2021Agency RMBS Non-Agency
Investment Securities Fannie Mae Freddie MacGinnieMae RMBS CMBS CRT Total
Available-for-sale securities:Par value $ 8,375 $ 2,845 $ 2 $ — $ — $ — $ 11,222 Unamortized discount (4) (1) — — — — (5)Unamortized premium 405 144 — — — — 549 Amortized cost 8,776 2,988 2 — — — 11,766 Gross unrealized gains 369 113 — — — — 482 Gross unrealized losses — — — — — — —
Total available-for-sale securities, at fair value 9,145 3,101 2 — — — 12,248 Securities remeasured at fair value through earnings:
Par value 32,513 15,801 3 493 354 1,068 50,232 Unamortized discount (19) (1) — (12) (4) (12) (48)Unamortized premium 1,312 690 — 6 6 11 2,025 Amortized cost 33,806 16,490 3 487 356 1,067 52,209 Gross unrealized gains 875 463 — 10 18 13 1,379 Gross unrealized losses (228) (101) — (2) (1) (7) (339)
Total securities remeasured at fair value through earnings 34,453 16,852 3 495 373 1,073 53,249
Total securities, at fair value $ 43,598 $ 19,953 $ 5 $ 495 $ 373 $ 1,073 $ 65,497
Weighted average coupon as of March 31, 2021 3.20 % 3.27 % 4.71 % 3.16 % 4.06 % 3.30 % 3.23 %Weighted average yield as of March 31, 2021 2.35 % 2.36 % 2.53 % 1.56 % 4.31 % 3.79 % 2.39 %
________________________________1. Incorporates a weighted average future constant prepayment rate assumption of 11.3% based on forward rates as of March 31, 2021.
1
11

December 31, 2020Agency RMBS Non-Agency
Investment SecuritiesFannie
Mae Freddie MacGinnie
Mae RMBS CMBS CRT TotalAvailable-for-sale securities:
Par value $ 9,325 $ 3,416 $ 2 $ — $ — $ — $ 12,743 Unamortized discount (4) (1) — — — — (5)Unamortized premium 389 152 — — — — 541 Amortized cost 9,710 3,567 2 — — — 13,279
Gross unrealized gains 539 180 — — — — 719 Gross unrealized losses — — — — — — —
Total available-for-sale securities, at fair value 10,249 3,747 2 — — — 13,998 Securities remeasured at fair value through earnings:
Par value 32,824 14,447 3 187 331 735 48,527 Unamortized discount (18) (1) — (12) (3) (12) (46)Unamortized premium 1,314 607 — 4 6 10 1,941 Amortized cost 34,120 15,053 3 179 334 733 50,422 Gross unrealized gains 1,280 683 — 11 28 12 2,014 Gross unrealized losses (5) (1) — (2) (4) (8) (20)
Total securities remeasured at fair value through earnings 35,395 15,735 3 188 358 737 52,416
Total securities, at fair value $ 45,644 $ 19,482 $ 5 $ 188 $ 358 $ 737 $ 66,414
Weighted average coupon as of December 31, 2020 3.30 % 3.56 % 4.73 % 4.28 % 4.13 % 3.43 % 3.39 %Weighted average yield as of December 31, 2020 2.25 % 2.39 % 2.46 % 4.33 % 4.29 % 3.71 % 2.33 %
________________________________1. Incorporates a weighted average future constant prepayment rate assumption of 17.6% based on forward rates as of December 31, 2020.
As of March 31, 2021 and December 31, 2020, our investments in CRT and non-Agency securities had the following credit ratings (in millions): March 31, 2021 December 31, 2020CRT and Non-Agency Security Credit Ratings CRT RMBS CMBS CRT RMBS CMBSAAA $ — $ 302 $ 20 $ — $ — $ 35 AA — 20 167 — 20 190 A — 33 34 — 32 28 BBB 71 81 63 28 83 55 BB 224 42 58 167 36 43 B 447 6 31 304 6 7 Not Rated 331 11 — 238 11 — Total $ 1,073 $ 495 $ 373 $ 737 $ 188 $ 358
________________________________1. Represents the lowest of Standard and Poor's ("S&P"), Moody's, Fitch, DBRS, Kroll Bond Rating Agency ("KBRA") and Morningstar credit ratings, stated in terms of the S&P
equivalent rating as of each date.
Our CRT securities reference the performance of loans underlying Agency RMBS issued by Fannie Mae or Freddie Mac, which were subject to theirunderwriting standards.
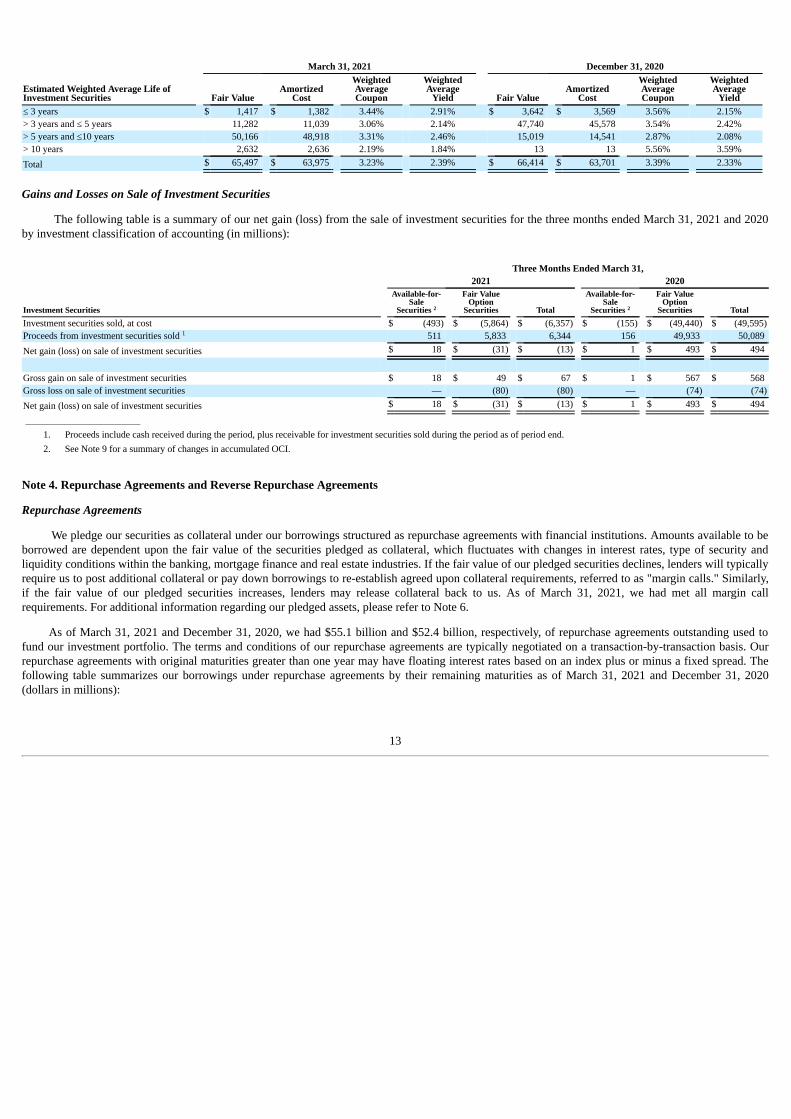
The actual maturities of our investment securities are generally shorter than their stated contractual maturities. The actual maturities of our Agencyand high credit quality non-Agency RMBS are primarily affected by principal prepayments and to a lesser degree the contractual lives of the underlyingmortgages and periodic contractual principal repayments. The actual maturities of our credit-oriented investments are primarily impacted by theircontractual lives and default and loss recovery rates. As of March 31, 2021 and December 31, 2020, the weighted average expected constant prepaymentrate ("CPR") over the remaining life of our Agency and high credit quality non-Agency RMBS investment portfolio was 11.3% and 17.6%, respectively.Our estimates can differ materially for different securities and thus our individual holdings have a wide range of projected CPRs. The following tablesummarizes our investments as of March 31, 2021 and December 31, 2020 according to their estimated weighted average life classification (dollars inmillions):
1
1
12
March 31, 2021 December 31, 2020
Estimated Weighted Average Life ofInvestment Securities Fair Value
AmortizedCost
WeightedAverageCoupon
WeightedAverage
Yield Fair ValueAmortized
Cost
WeightedAverageCoupon
WeightedAverage
Yield≤ 3 years $ 1,417 $ 1,382 3.44% 2.91% $ 3,642 $ 3,569 3.56% 2.15%> 3 years and ≤ 5 years 11,282 11,039 3.06% 2.14% 47,740 45,578 3.54% 2.42%> 5 years and ≤10 years 50,166 48,918 3.31% 2.46% 15,019 14,541 2.87% 2.08%> 10 years 2,632 2,636 2.19% 1.84% 13 13 5.56% 3.59%Total $ 65,497 $ 63,975 3.23% 2.39% $ 66,414 $ 63,701 3.39% 2.33%
Gains and Losses on Sale of Investment Securities
The following table is a summary of our net gain (loss) from the sale of investment securities for the three months ended March 31, 2021 and 2020by investment classification of accounting (in millions):
Three Months Ended March 31,2021 2020
Investment Securities
Available-for-Sale
Securities
Fair ValueOption
Securities Total
Available-for-Sale
Securities
Fair ValueOption
Securities TotalInvestment securities sold, at cost $ (493) $ (5,864) $ (6,357) $ (155) $ (49,440) $ (49,595)Proceeds from investment securities sold 511 5,833 6,344 156 49,933 50,089 Net gain (loss) on sale of investment securities $ 18 $ (31) $ (13) $ 1 $ 493 $ 494
Gross gain on sale of investment securities $ 18 $ 49 $ 67 $ 1 $ 567 $ 568 Gross loss on sale of investment securities — (80) (80) — (74) (74)Net gain (loss) on sale of investment securities $ 18 $ (31) $ (13) $ 1 $ 493 $ 494
________________________________
1. Proceeds include cash received during the period, plus receivable for investment securities sold during the period as of period end.2. See Note 9 for a summary of changes in accumulated OCI.
Note 4. Repurchase Agreements and Reverse Repurchase Agreements
Repurchase Agreements
We pledge our securities as collateral under our borrowings structured as repurchase agreements with financial institutions. Amounts available to beborrowed are dependent upon the fair value of the securities pledged as collateral, which fluctuates with changes in interest rates, type of security andliquidity conditions within the banking, mortgage finance and real estate industries. If the fair value of our pledged securities declines, lenders will typicallyrequire us to post additional collateral or pay down borrowings to re-establish agreed upon collateral requirements, referred to as "margin calls." Similarly,if the fair value of our pledged securities increases, lenders may release collateral back to us. As of March 31, 2021, we had met all margin callrequirements. For additional information regarding our pledged assets, please refer to Note 6.
As of March 31, 2021 and December 31, 2020, we had $55.1 billion and $52.4 billion, respectively, of repurchase agreements outstanding used tofund our investment portfolio. The terms and conditions of our repurchase agreements are typically negotiated on a transaction-by-transaction basis. Ourrepurchase agreements with original maturities greater than one year may have floating interest rates based on an index plus or minus a fixed spread. Thefollowing table summarizes our borrowings under repurchase agreements by their remaining maturities as of March 31, 2021 and December 31, 2020(dollars in millions):
2 2
1
13

March 31, 2021 December 31, 2020
Remaining MaturityRepurchaseAgreements
WeightedAverageInterest
Rate
WeightedAverage Daysto Maturity
RepurchaseAgreements
WeightedAverageInterest
Rate
WeightedAverage Daysto Maturity
Agency repo:≤ 1 month $ 31,193 0.12 % 14 $ 29,505 0.22 % 12 > 1 to ≤ 3 months 11,357 0.23 % 65 13,434 0.27 % 57 > 3 to ≤ 6 months 5,552 0.18 % 139 7,317 0.28 % 142 > 6 to ≤ 9 months 3,850 0.14 % 270 660 0.24 % 208 > 9 to ≤ 12 months 2,479 0.17 % 316 1,450 0.15 % 354 > 12 to ≤ 24 months 625 0.19 % 406 — — % —
Total $ 55,056 0.15 % 73 $ 52,366 0.24 % 54
As of March 31, 2021 and December 31, 2020, $4.3 billion and $11.2 billion, respectively, of our repurchase agreements had a remaining maturity ofone business day and none of our repurchase agreements were due on demand. As of March 31, 2021, we had no forward commitments to enter intorepurchase agreements. As of December 31, 2020, we had $2.9 billion of forward commitments to enter into repurchase agreements, with a weightedaverage forward start date of 4 days and a weighted average interest rate of 0.12%. As of March 31, 2021 and December 31, 2020, 45% and 47%,respectively, of our repurchase agreement funding was sourced through our wholly-owned captive broker-dealer subsidiary, Bethesda Securities, LLC("BES"). Amounts sourced through BES include funding from the General Collateral Finance Repo service ("GCF Repo") offered by the Fixed IncomeClearing Corporation ("FICC"), which totaled 44% and 46% of our repurchase agreement funding outstanding as of March 31, 2021 and December 31,2020, respectively.
Reverse Repurchase Agreements
As of March 31, 2021 and December 31, 2020, we had $16.8 billion and $11.7 billion, respectively, of reverse repurchase agreements outstandingused primarily to borrow securities to cover short sales of U.S. Treasury securities, for which we had associated obligations to return borrowed securities atfair value of $15.1 billion and $11.7 billion, respectively. As of March 31, 2021 and December 31, 2020, $3.3 billion and $3.6 billion, respectively, of ourreverse repurchase agreements were with the FICC sourced through BES.
Note 5. Derivative and Other Hedging Instruments
We hedge a portion of our interest rate risk primarily utilizing interest rate swaps, interest rate swaptions, U.S. Treasury securities and U.S. Treasuryfutures contracts. We utilize TBA securities primarily as a means of investing in the Agency securities market. For additional information regarding ourderivative instruments and our overall risk management strategy, please refer to the discussion of derivative and other hedging instruments in Note 2.
14

Derivative and Other Hedging Instrument Assets (Liabilities), at Fair Value
The table below summarizes fair value information about our derivative and other hedging instrument assets/(liabilities) as of March 31, 2021 andDecember 31, 2020 (in millions):
Derivative and Other Hedging Instruments Balance Sheet LocationMarch 31,
2021December 31,
2020Interest rate swaps Derivative assets, at fair value $ 45 $ — Swaptions Derivative assets, at fair value 607 116 TBA securities Derivative assets, at fair value 13 275 U.S. Treasury futures - short Derivative assets, at fair value 33 —
Total derivative assets, at fair value $ 698 $ 391
TBA securities Derivative liabilities, at fair value (589) — U.S. Treasury futures - short Derivative liabilities, at fair value — (2)
Total derivative liabilities, at fair value $ (589) $ (2)
U.S. Treasury securities - shortObligation to return securities borrowed under reverserepurchase agreements, at fair value (15,090) (11,727)
Total U.S. Treasury securities, net at fair value $ (15,090) $ (11,727)
The following tables summarize certain characteristics of our derivative and other hedging instruments outstanding as of March 31, 2021 andDecember 31, 2020 (dollars in millions):
March 31, 2021 December 31, 2020
Pay Fixed / Receive Variable InterestRate Swaps
NotionalAmount
AverageFixed Pay
Rate
AverageReceive
Rate
AverageMaturity(Years)
NotionalAmount
AverageFixed Pay
Rate
AverageReceive
Rate
AverageMaturity(Years)
≤ 3 years $ 14,000 0.12% 0.02% 2.4 $ 8,750 0.04% 0.08% 2.4> 3 to ≤ 5 years 17,750 0.11% 0.03% 3.9 17,000 0.10% 0.08% 4.1> 5 to ≤ 7 years 9,800 0.21% 0.02% 5.6 9,800 0.21% 0.08% 5.8> 7 to ≤ 10 years 6,700 0.36% 0.02% 8.3 6,200 0.28% 0.07% 8.5> 10 years 1,475 0.47% 0.02% 13.9 1,475 0.47% 0.07% 14.2Total $ 49,725 0.18% 0.02% 4.7 $ 43,225 0.15% 0.08% 5.1
Pay Fixed / Receive Variable Interest Rate Swaps byReceive Index (% of Notional Amount)
March 31,2021 December 31, 2020
SOFR 74 % 71 %OIS 26 % 29 %Total 100 % 100 %
15

Swaptions Option Underlying Payer Swap
Current Option Expiration Date Cost Basis Fair Value
AverageMonths to
Current OptionExpiration Date
NotionalAmount
Average FixedPay
Rate
AverageTerm
(Years)March 31, 2021≤ 1 year $ 116 $ 110 6 $ 5,400 2.17% 9.0> 1 year ≤ 2 years 62 182 20 2,750 1.39% 10.0> 2 year ≤ 3 years 129 292 33 4,750 1.96% 10.0> 3 year ≤ 4 years 8 23 37 250 1.43% 10.0Total $ 315 $ 607 19 $ 13,150 1.92% 9.6
December 31, 2020≤ 1 year $ 123 $ 15 5 $ 5,900 2.17% 9.2> 1 year ≤ 2 years 41 33 20 2,000 1.38% 10.0> 2 year ≤ 3 years 65 60 33 2,250 1.40% 10.0> 3 year ≤ 4 years 8 8 40 250 1.43% 10.0Total $ 237 $ 116 15 $ 10,400 1.84% 9.5
________________________________1. As of March 31, 2021 and December 31, 2020, ≤ 1 year notional amount includes $700 million of Bermudan swaptions where the options may be exercised on predetermined dates up
to their final exercise date, which is six months prior to the underlying swaps' maturity date.2. As of March 31, 2021, 20% and 80% of the underlying swap receive rates were tied to 3-Month LIBOR and SOFR, respectively. As of December 31, 2020, 33% and 67% of the
underlying payer swap receive rates were tied to 3-Month LIBOR and SOFR, respectively.
U.S. Treasury Securities March 31, 2021 December 31, 2020
MaturityFace AmountLong/(Short) Cost Basis Fair Value
Face AmountLong/(Short) Cost Basis Fair Value
5 years $ (1,965) $ (1,946) $ (1,921) $ (425) $ (425) $ (425)7 years (1,333) (1,323) (1,282) (1,083) (1,081) (1,089)10 years (12,229) (12,269) (11,887) (9,780) (9,862) (10,213)Total U.S. Treasury securities $ (15,527) $ (15,538) $ (15,090) $ (11,288) $ (11,368) $ (11,727)
________________________________1. As of March 31, 2021 and December 31, 2020, short U.S. Treasury securities had a weighted average yield of 1.17% and 1.20%, respectively.
U.S. Treasury Futures March 31, 2021 December 31, 2020
Maturity
Notional Amount
Long (Short)CostBasis
FairValue
Net CarryingValue
Notional Amount
Long (Short)CostBasis
FairValue
Net CarryingValue
10 years $ (1,000) $ (1,342) $ (1,309) $ 33 $ (1,000) $ (1,379) $ (1,381) $ (2)
________________________________1. Net carrying value represents the difference between the fair market value and the cost basis (or the forward price to be paid/(received) for the underlying U.S. Treasury security) of the
U.S. Treasury futures contract as of period-end and is reported in derivative assets/(liabilities), at fair value in our consolidated balance sheets.
1 2
1 1
1 1
16

March 31, 2021 December 31, 2020
TBA Securities by Coupon
Notional Amount
Long (Short)CostBasis
FairValue
Net CarryingValue
Notional Amount
Long (Short)CostBasis
FairValue
Net CarryingValue
15-Year TBA securities:≤ 2.0% $ (2,584) $ (2,695) $ (2,699) (4) $ 6,540 $ 6,708 $ 6,771 $ 63 2.5% 328 343 341 (2) 200 208 209 1
Total 15-Year TBA securities (2,256) (2,352) (2,358) (6) 6,740 6,916 6,980 64 30-Year TBA securities:
≤ 2.0% 10,346 10,778 10,294 (484) 19,805 20,314 20,480 166 2.5% 14,524 14,932 14,855 (77) 3,167 3,291 3,335 44 3.0% 1,503 1,571 1,565 (6) 528 552 553 1 3.5% 401 426 423 (3) 124 131 131 —
Total 30-Year TBA securities, net 26,774 27,707 27,137 (570) 23,624 24,288 24,499 211 Total TBA securities, net $ 24,518 $ 25,355 $ 24,779 $ (576) $ 30,364 $ 31,204 $ 31,479 $ 275
________________________________1. Net carrying value represents the difference between the fair market value and the cost basis (or the forward price to be paid/(received) for the underlying Agency security) of the TBA
contract as of period-end and is reported in derivative assets/(liabilities), at fair value in our consolidated balance sheets.
Gain (Loss) From Derivative Instruments and Other Securities, Net
The following table summarizes changes in our derivative and other hedge portfolio and their effect on our consolidated statements of comprehensiveincome for the three months ended March 31, 2021 and 2020 (in millions):
Derivative and Other Hedging InstrumentsBeginning
Notional Amount Additions
Settlement,Termination,Expiration or
ExerciseEnding
Notional Amount
Gain/(Loss)on Derivative
Instruments andOther Securities,
Net Three months ended March 31, 2021:TBA securities, net $ 30,364 93,336 (99,182) $ 24,518 $ (926)Interest rate swaps - payer $ 43,225 7,000 (500) $ 49,725 1,124 Payer swaptions $ 10,400 4,250 (1,500) $ 13,150 387 U.S. Treasury securities - short position $ (11,287) (7,261) 3,021 $ (15,527) 807 U.S. Treasury securities - long position $ — 1,315 (1,315) $ — (10)U.S. Treasury futures contracts - short position $ (1,000) (1,000) 1,000 $ (1,000) 61
$ 1,443 Three months ended March 31, 2020:TBA securities, net $ 7,322 37,750 (24,793) $ 20,279 $ 693 Interest rate swaps - payer $ 79,075 49,975 (82,575) $ 46,475 (2,795)Payer swaptions $ 8,850 2,000 (1,300) $ 9,550 (134)U.S. Treasury securities - short position $ (9,224) (6,045) 11,024 $ (4,245) (937)U.S. Treasury securities - long position $ 95 6,461 (2,987) $ 3,569 97 U.S. Treasury futures contracts - short position $ (1,000) (1,000) 1,000 $ (1,000) (104)
$ (3,180)
________________________________1. Amounts exclude other miscellaneous gains and losses recognized in gain (loss) on derivative instruments and other securities, net in our consolidated statements of comprehensive
income.
Note 6. Pledged Assets
Our funding agreements require us to fully collateralize our obligations under the agreements based upon our counterparties' collateral requirementsand their determination of the fair value of the securities pledged as collateral, which fluctuates with changes in interest rates, credit quality and liquidityconditions within the investment banking, mortgage finance and real estate industries. Our derivative contracts similarly require us to fully collateralize ourobligations under such agreements, which will vary over time based on similar factors as well as our counterparties' determination of the value of thederivative contract. We are typically required to post initial margin upon execution of derivative transactions, such as under our
1 1
1
17

interest rate swap agreements and TBA contracts, and subsequently post or receive variation margin based on daily fluctuations in fair value. Our brokerageand custody agreements and the clearing organizations utilized by our wholly-owned captive broker-dealer subsidiary, Bethesda Securities, LLC, alsorequire that we post minimum daily clearing deposits. If we breach our collateral requirements, we will be required to fully settle our obligations under theagreements, which could include a forced liquidation of our pledged collateral.
Our counterparties also apply a "haircut" to our pledged collateral, which means our collateral is valued at slightly less than market value and limitsthe amount we can borrow against our securities. This haircut reflects the underlying risk of the specific collateral and protects our counterparty against achange in its value. Our agreements do not specify the haircut; rather, haircuts are determined on an individual transaction basis. Consequently, our fundingagreements and derivative contracts expose us to credit risk relating to potential losses that could be recognized if our counterparties fail to perform theirobligations under such agreements. We minimize this risk by limiting our counterparties to major financial institutions with acceptable credit ratings or toregistered clearinghouses and U.S. government agencies, and we monitor our positions with individual counterparties. In the event of a default by acounterparty, we may have difficulty obtaining our assets pledged as collateral to such counterparty and may not receive payments as and when due to usunder the terms of our derivative agreements. In the case of centrally cleared instruments, we could be exposed to credit risk if the central clearing agencyor a clearing member defaults on its respective obligation to perform under the contract. However, we believe that the risk is minimal due to the clearingexchanges' initial and daily mark-to-market margin requirements, clearinghouse guarantee funds and other resources that are available in the event of aclearing member default.
As of March 31, 2021, our maximum amount at risk with any counterparty related to our repurchase agreements, excluding the Fixed IncomeClearing Corporation, was less than 2% of our tangible stockholders' equity (or the excess/shortfall of the value of collateral pledged/received over ourrepurchase agreement liabilities/reverse repurchase agreement receivables). As of March 31, 2021, approximately 9% of our tangible stockholder's equitywas at risk with the Fixed Income Clearing Corporation.
Assets Pledged to Counterparties
The following tables summarize our assets pledged as collateral under our funding, derivative and brokerage and clearing agreements by type,including securities pledged related to securities sold but not yet settled, as of March 31, 2021 and December 31, 2020 (in millions):
March 31, 2021
Assets Pledged to Counterparties Repurchase
Agreements Debt of
Consolidated VIEsDerivative
Agreements
Brokerage andClearing
Agreements TotalAgency RMBS - fair value $ 55,977 $ 270 $ 319 $ 153 $ 56,719 CRT - fair value 406 — — — 406 Non-Agency - fair value 414 — — — 414 U.S. Treasury securities - fair value 342 — — 1,039 1,381 Accrued interest on pledged securities 145 1 1 — 147 Restricted cash 34 — 779 — 813
Total $ 57,318 $ 271 $ 1,099 $ 1,192 $ 59,880
December 31, 2020
Assets Pledged to Counterparties Repurchase
Agreements Debt of
Consolidated VIEsDerivative
Agreements
Brokerage andClearing
Agreements TotalAgency RMBS - fair value $ 53,401 $ 295 $ 365 $ 258 $ 54,319 CRT - fair value 455 — — — 455 Non-Agency - fair value 458 — — — 458 Accrued interest on pledged securities 147 1 1 1 150 Restricted cash 417 — 890 — 1,307
Total $ 54,878 $ 296 $ 1,256 $ 259 $ 56,689
________________________________1. Includes repledged assets received as collateral from counterparties and securities sold but not yet settled.2. Includes $106 million and $119 million of retained interests in our consolidated VIEs pledged as collateral under repurchase agreements as of March 31, 2021 and December 31, 2020,
respectively.3. Includes margin for TBAs cleared through prime brokers and other clearing deposits.
1 2 3
1 2 3
18

The following table summarizes our securities pledged as collateral under our repurchase agreements by the remaining maturity of our borrowings,including securities pledged related to sold but not yet settled securities, as of March 31, 2021 and December 31, 2020 (in millions). For the correspondingborrowings associated with the following amounts and the interest rates thereon, refer to Note 4.
March 31, 2021 December 31, 2020
Securities Pledged by Remaining Maturity of RepurchaseAgreements
Fair Value ofPledged Securities
AmortizedCost ofPledged
Securities
AccruedInterest on
PledgedSecurities
Fair Value ofPledged Securities
AmortizedCost ofPledged
Securities
AccruedInterest on
PledgedSecurities
≤ 30 days $ 31,543 $ 30,658 $ 81 $ 29,674 $ 28,208 $ 82 > 30 and ≤ 60 days 4,205 4,080 12 8,438 8,013 23 > 60 and ≤ 90 days 6,975 6,797 17 5,782 5,495 16 > 90 days 14,074 13,786 35 10,420 10,068 26
Total $ 56,797 $ 55,321 $ 145 $ 54,314 $ 51,784 $ 147
________________________________1. Includes $106 million and $119 million of retained interests in our consolidated VIEs pledged as collateral under repurchase agreements as of March 31, 2021 and December 31, 2020,
respectively.2. Excludes $1.4 billion of repledged U.S. Treasury securities received as collateral from counterparties as of March 31, 2021.
Assets Pledged from Counterparties
As of March 31, 2021 and December 31, 2020, we had assets pledged to us from counterparties as collateral under our reverse repurchase andderivative agreements summarized in the tables below (in millions).
March 31, 2021 December 31, 2020
Assets Pledged to AGNC
ReverseRepurchaseAgreements
DerivativeAgreements
RepurchaseAgreements Total
ReverseRepurchaseAgreements
DerivativeAgreements
RepurchaseAgreements Total
U.S. Treasury securities - fair value $ 16,633 $ — $ 10 $ 16,643 $ 11,727 $ — $ 13 $ 11,740 Cash — 594 10 604 — 107 3 110
Total $ 16,633 $ 594 $ 20 $ 17,247 $ 11,727 $ 107 $ 16 $ 11,850
________________________________1. As of March 31, 2021, $1.4 billion of U.S. Treasury securities received from counterparties were repledged as collateral. As of March 31, 2021 and December 31, 2020, $15.1 billion
and $11.7 billion, respectively, of U.S. Treasury securities received from counterparties were used to cover short sales of U.S. Treasury securities.
Offsetting Assets and Liabilities
Certain of our repurchase agreements and derivative transactions are governed by underlying agreements that generally provide for a right of setoffunder master netting arrangements (or similar agreements), including in the event of default or in the event of bankruptcy of either party to the transactions.We present our assets and liabilities subject to such arrangements on a gross basis in our consolidated balance sheets. The following tables presentinformation about our assets and liabilities that are subject to master netting arrangements and can potentially be offset on our consolidated balance sheetsas of March 31, 2021 and December 31, 2020 (in millions):
1,2
1
19
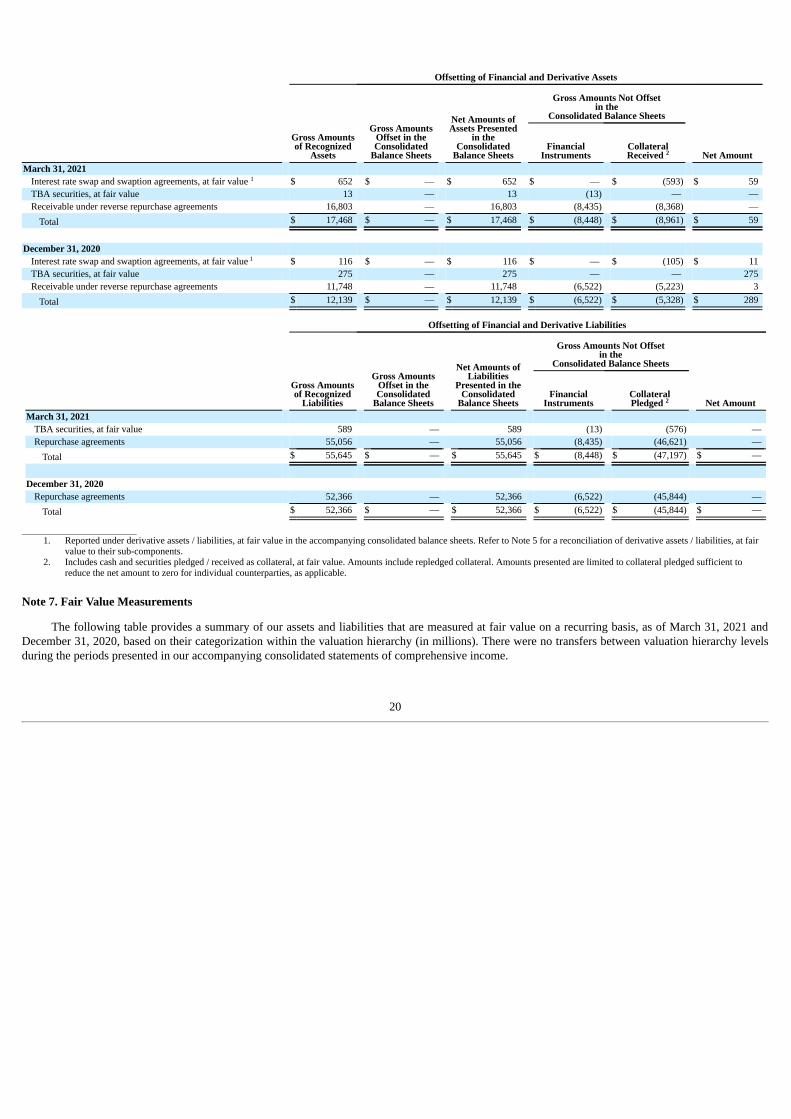
Offsetting of Financial and Derivative Assets
Gross Amountsof Recognized
Assets
Gross AmountsOffset in theConsolidated
Balance Sheets
Net Amounts ofAssets Presented
in theConsolidated
Balance Sheets
Gross Amounts Not Offset in the
Consolidated Balance Sheets
Net AmountFinancial
InstrumentsCollateralReceived
March 31, 2021Interest rate swap and swaption agreements, at fair value $ 652 $ — $ 652 $ — $ (593) $ 59 TBA securities, at fair value 13 — 13 (13) — — Receivable under reverse repurchase agreements 16,803 — 16,803 (8,435) (8,368) —
Total $ 17,468 $ — $ 17,468 $ (8,448) $ (8,961) $ 59
December 31, 2020Interest rate swap and swaption agreements, at fair value $ 116 $ — $ 116 $ — $ (105) $ 11 TBA securities, at fair value 275 — 275 — — 275 Receivable under reverse repurchase agreements 11,748 — 11,748 (6,522) (5,223) 3
Total $ 12,139 $ — $ 12,139 $ (6,522) $ (5,328) $ 289
Offsetting of Financial and Derivative Liabilities
Gross Amountsof Recognized
Liabilities
Gross AmountsOffset in theConsolidated
Balance Sheets
Net Amounts ofLiabilities
Presented in theConsolidated
Balance Sheets
Gross Amounts Not Offset in the
Consolidated Balance Sheets
Net AmountFinancial
InstrumentsCollateralPledged
March 31, 2021TBA securities, at fair value 589 — 589 (13) (576) — Repurchase agreements 55,056 — 55,056 (8,435) (46,621) —
Total $ 55,645 $ — $ 55,645 $ (8,448) $ (47,197) $ —
December 31, 2020Repurchase agreements 52,366 — 52,366 (6,522) (45,844) —
Total $ 52,366 $ — $ 52,366 $ (6,522) $ (45,844) $ —
________________________________1. Reported under derivative assets / liabilities, at fair value in the accompanying consolidated balance sheets. Refer to Note 5 for a reconciliation of derivative assets / liabilities, at fair
value to their sub-components.2. Includes cash and securities pledged / received as collateral, at fair value. Amounts include repledged collateral. Amounts presented are limited to collateral pledged sufficient to
reduce the net amount to zero for individual counterparties, as applicable.
Note 7. Fair Value Measurements
The following table provides a summary of our assets and liabilities that are measured at fair value on a recurring basis, as of March 31, 2021 andDecember 31, 2020, based on their categorization within the valuation hierarchy (in millions). There were no transfers between valuation hierarchy levelsduring the periods presented in our accompanying consolidated statements of comprehensive income.
2
1
1
2
20
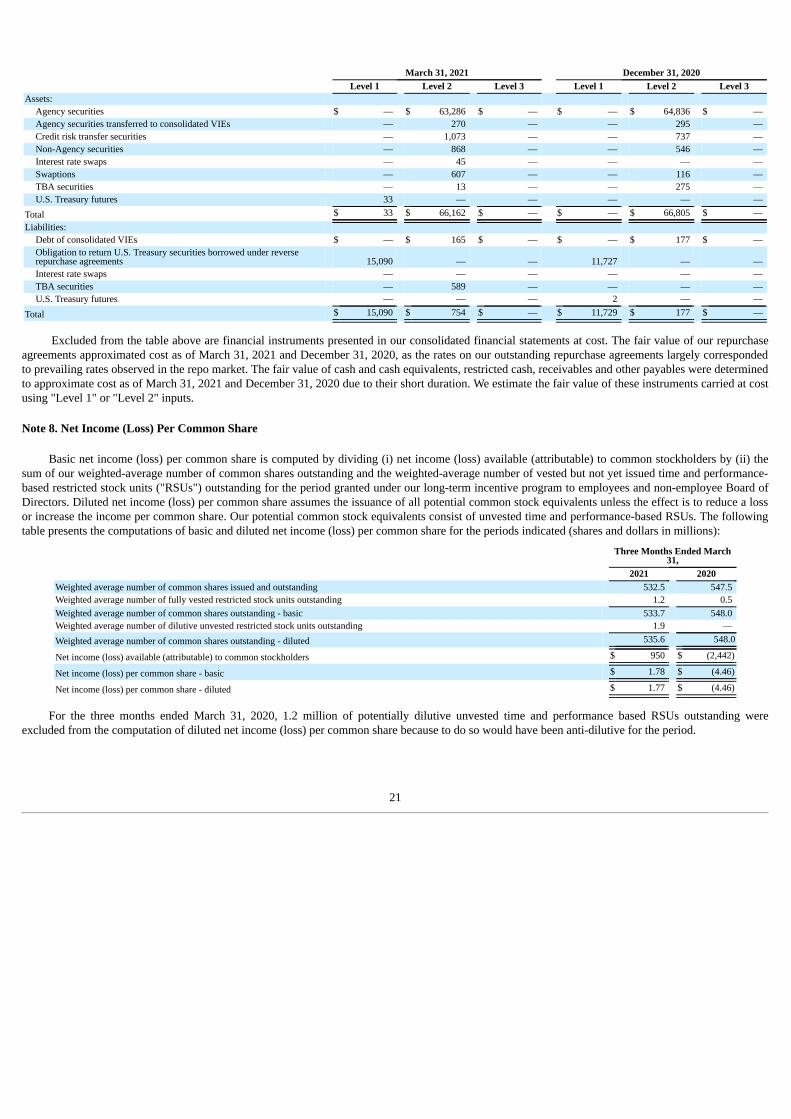
March 31, 2021 December 31, 2020Level 1 Level 2 Level 3 Level 1 Level 2 Level 3
Assets:Agency securities $ — $ 63,286 $ — $ — $ 64,836 $ — Agency securities transferred to consolidated VIEs — 270 — — 295 — Credit risk transfer securities — 1,073 — — 737 — Non-Agency securities — 868 — — 546 — Interest rate swaps — 45 — — — — Swaptions — 607 — — 116 — TBA securities — 13 — — 275 — U.S. Treasury futures 33 — — — — —
Total $ 33 $ 66,162 $ — $ — $ 66,805 $ — Liabilities:
Debt of consolidated VIEs $ — $ 165 $ — $ — $ 177 $ — Obligation to return U.S. Treasury securities borrowed under reverserepurchase agreements 15,090 — — 11,727 — — Interest rate swaps — — — — — — TBA securities — 589 — — — — U.S. Treasury futures — — — 2 — —
Total $ 15,090 $ 754 $ — $ 11,729 $ 177 $ —
Excluded from the table above are financial instruments presented in our consolidated financial statements at cost. The fair value of our repurchaseagreements approximated cost as of March 31, 2021 and December 31, 2020, as the rates on our outstanding repurchase agreements largely correspondedto prevailing rates observed in the repo market. The fair value of cash and cash equivalents, restricted cash, receivables and other payables were determinedto approximate cost as of March 31, 2021 and December 31, 2020 due to their short duration. We estimate the fair value of these instruments carried at costusing "Level 1" or "Level 2" inputs.
Note 8. Net Income (Loss) Per Common Share
Basic net income (loss) per common share is computed by dividing (i) net income (loss) available (attributable) to common stockholders by (ii) thesum of our weighted-average number of common shares outstanding and the weighted-average number of vested but not yet issued time and performance-based restricted stock units ("RSUs") outstanding for the period granted under our long-term incentive program to employees and non-employee Board ofDirectors. Diluted net income (loss) per common share assumes the issuance of all potential common stock equivalents unless the effect is to reduce a lossor increase the income per common share. Our potential common stock equivalents consist of unvested time and performance-based RSUs. The followingtable presents the computations of basic and diluted net income (loss) per common share for the periods indicated (shares and dollars in millions):
Three Months Ended March31,
2021 2020Weighted average number of common shares issued and outstanding 532.5 547.5 Weighted average number of fully vested restricted stock units outstanding 1.2 0.5 Weighted average number of common shares outstanding - basic 533.7 548.0 Weighted average number of dilutive unvested restricted stock units outstanding 1.9 — Weighted average number of common shares outstanding - diluted 535.6 548.0
Net income (loss) available (attributable) to common stockholders $ 950 $ (2,442)
Net income (loss) per common share - basic $ 1.78 $ (4.46)
Net income (loss) per common share - diluted $ 1.77 $ (4.46)
For the three months ended March 31, 2020, 1.2 million of potentially dilutive unvested time and performance based RSUs outstanding wereexcluded from the computation of diluted net income (loss) per common share because to do so would have been anti-dilutive for the period.
21
Note 9. Stockholders' Equity
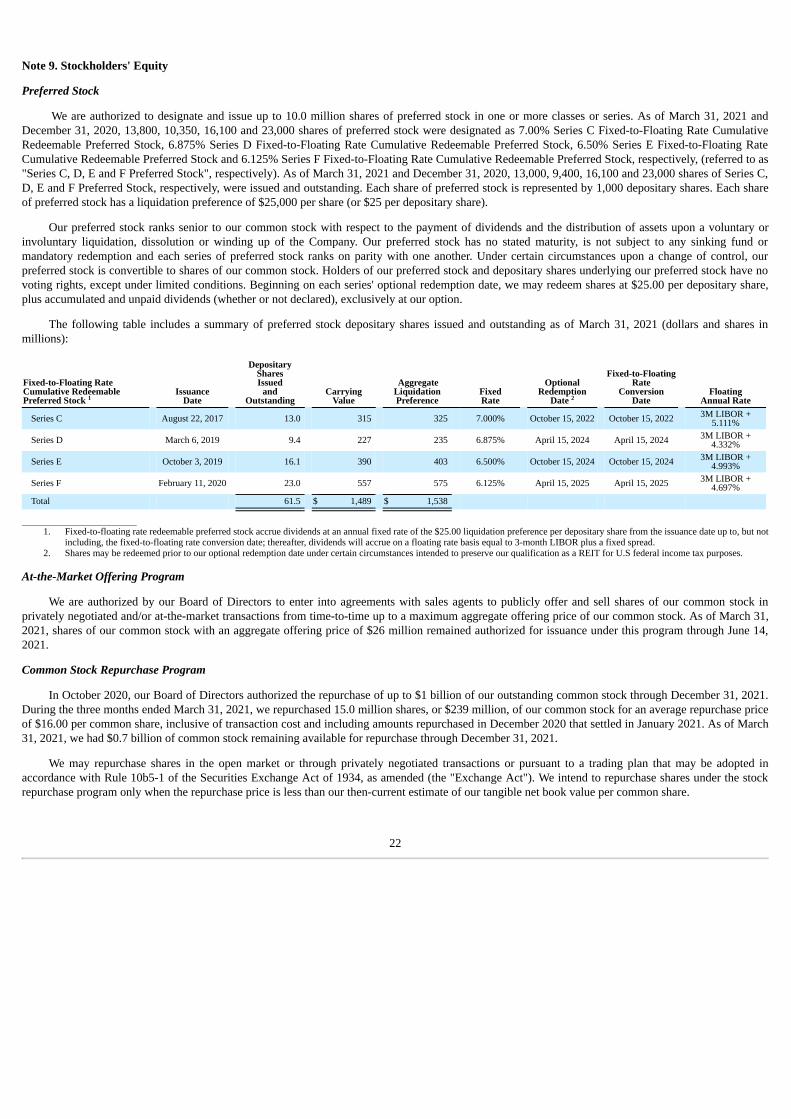
Preferred Stock
We are authorized to designate and issue up to 10.0 million shares of preferred stock in one or more classes or series. As of March 31, 2021 andDecember 31, 2020, 13,800, 10,350, 16,100 and 23,000 shares of preferred stock were designated as 7.00% Series C Fixed-to-Floating Rate CumulativeRedeemable Preferred Stock, 6.875% Series D Fixed-to-Floating Rate Cumulative Redeemable Preferred Stock, 6.50% Series E Fixed-to-Floating RateCumulative Redeemable Preferred Stock and 6.125% Series F Fixed-to-Floating Rate Cumulative Redeemable Preferred Stock, respectively, (referred to as"Series C, D, E and F Preferred Stock", respectively). As of March 31, 2021 and December 31, 2020, 13,000, 9,400, 16,100 and 23,000 shares of Series C,D, E and F Preferred Stock, respectively, were issued and outstanding. Each share of preferred stock is represented by 1,000 depositary shares. Each shareof preferred stock has a liquidation preference of $25,000 per share (or $25 per depositary share).
Our preferred stock ranks senior to our common stock with respect to the payment of dividends and the distribution of assets upon a voluntary orinvoluntary liquidation, dissolution or winding up of the Company. Our preferred stock has no stated maturity, is not subject to any sinking fund ormandatory redemption and each series of preferred stock ranks on parity with one another. Under certain circumstances upon a change of control, ourpreferred stock is convertible to shares of our common stock. Holders of our preferred stock and depositary shares underlying our preferred stock have novoting rights, except under limited conditions. Beginning on each series' optional redemption date, we may redeem shares at $25.00 per depositary share,plus accumulated and unpaid dividends (whether or not declared), exclusively at our option.
The following table includes a summary of preferred stock depositary shares issued and outstanding as of March 31, 2021 (dollars and shares inmillions):
Fixed-to-Floating RateCumulative RedeemablePreferred Stock
IssuanceDate
DepositarySharesIssued
andOutstanding
CarryingValue
AggregateLiquidationPreference
FixedRate
OptionalRedemption
Date
Fixed-to-FloatingRate
ConversionDate
FloatingAnnual Rate
Series C August 22, 2017 13.0 315 325 7.000% October 15, 2022 October 15, 2022 3M LIBOR +5.111%
Series D March 6, 2019 9.4 227 235 6.875% April 15, 2024 April 15, 2024 3M LIBOR +4.332%
Series E October 3, 2019 16.1 390 403 6.500% October 15, 2024 October 15, 2024 3M LIBOR +4.993%
Series F February 11, 2020 23.0 557 575 6.125% April 15, 2025 April 15, 2025 3M LIBOR +4.697%
Total 61.5 $ 1,489 $ 1,538
________________________________1. Fixed-to-floating rate redeemable preferred stock accrue dividends at an annual fixed rate of the $25.00 liquidation preference per depositary share from the issuance date up to, but not
including, the fixed-to-floating rate conversion date; thereafter, dividends will accrue on a floating rate basis equal to 3-month LIBOR plus a fixed spread.2. Shares may be redeemed prior to our optional redemption date under certain circumstances intended to preserve our qualification as a REIT for U.S federal income tax purposes.
At-the-Market Offering Program
We are authorized by our Board of Directors to enter into agreements with sales agents to publicly offer and sell shares of our common stock inprivately negotiated and/or at-the-market transactions from time-to-time up to a maximum aggregate offering price of our common stock. As of March 31,2021, shares of our common stock with an aggregate offering price of $26 million remained authorized for issuance under this program through June 14,2021.
Common Stock Repurchase Program
In October 2020, our Board of Directors authorized the repurchase of up to $1 billion of our outstanding common stock through December 31, 2021.During the three months ended March 31, 2021, we repurchased 15.0 million shares, or $239 million, of our common stock for an average repurchase priceof $16.00 per common share, inclusive of transaction cost and including amounts repurchased in December 2020 that settled in January 2021. As of March31, 2021, we had $0.7 billion of common stock remaining available for repurchase through December 31, 2021.
We may repurchase shares in the open market or through privately negotiated transactions or pursuant to a trading plan that may be adopted inaccordance with Rule 10b5-1 of the Securities Exchange Act of 1934, as amended (the "Exchange Act"). We intend to repurchase shares under the stockrepurchase program only when the repurchase price is less than our then-current estimate of our tangible net book value per common share.
1 2
22

Accumulated Other Comprehensive Income (Loss)
The following table summarizes changes to accumulated OCI for the three months ended March 31, 2021 and 2020 (in millions):
Three Months Ended March31,
Accumulated Other Comprehensive Income (Loss) 2021 2020Beginning Balance $ 719 $ 97
OCI before reclassifications (219) 465 Net loss amounts for available-for-sale securities reclassified from accumulated OCI to realized gain (loss) on sale ofinvestment securities, net (18) (1)
Ending Balance $ 482 $ 561
Item 2. Management's Discussion and Analysis of Financial Condition and Results of Operations
Management's Discussion and Analysis of Financial Condition and Results of Operations ("MD&A") is designed to provide a reader of AGNCInvestment Corp.'s consolidated financial statements with a narrative from the perspective of management and should be read in conjunction with theconsolidated financial statements and accompanying notes included in this Quarterly Report on Form 10-Q for quarterly period ended March 31, 2021. OurMD&A is presented in six sections:
• Executive Overview• Financial Condition• Results of Operations• Liquidity and Capital Resources• Off-Balance Sheet Arrangements• Forward-Looking Statements
EXECUTIVE OVERVIEW
We are a leading provider of private capital to the U.S. housing market, enhancing liquidity in the residential real estate mortgage markets and, inturn, facilitating home ownership in the U.S. We invest primarily in Agency residential mortgage-backed securities ("Agency RMBS") on a leveragedbasis. These investments consist of residential mortgage pass-through securities and collateralized mortgage obligations for which the principal and interestpayments are guaranteed by a U.S. Government-sponsored enterprise, such as Federal National Mortgage Association ("Fannie Mae") and Federal HomeLoan Mortgage Corporation ("Freddie Mac," and together with Fannie Mae, the "GSEs"), or by a U.S. Government agency, such as Government NationalMortgage Association ("Ginnie Mae"). We may also invest in other assets related to the housing, mortgage or real estate markets that are not guaranteed bya GSE or U.S. Government agency.
We are internally managed with the principal objective of providing our stockholders with attractive risk-adjusted returns through a combination ofmonthly dividends and tangible net book value accretion. We generate income from the interest earned on our investments, net of associated borrowing andhedging costs, and net realized gains and losses on our investment and hedging activities. We fund our investments primarily through collateralizedborrowings structured as repurchase agreements. We operate in a manner to qualify to be taxed as a REIT under the Internal Revenue Code.
The size and composition of our investment portfolio depends on the investment strategies we implement, availability of attractively pricedinvestments, suitable financing to appropriately leverage our investment portfolio and overall market conditions. Market conditions are influenced by avariety of factors, including interest rates, prepayment expectations, liquidity, housing prices, unemployment rates, general economic conditions,government participation in the mortgage market, regulations and relative returns on other assets.
Trends and Recent Market Impacts
Optimism regarding the potential for a strong economic recovery in the second half of 2021 pushed most risk-asset prices higher in the first quarter of2021. The improved economic outlook and additional fiscal stimulus led to a substantial increase in longer term interest rates and a material steepening ofthe yield curve during the quarter, with the 10-year U.S. Treasury yield increasing 82 basis points to close the first quarter at 1.74%, nearly 125 basis pointsabove its historical low in August 2020. Despite the sharp rise in rates, Agency RMBS performed well during the quarter, outperforming interest ratehedges. Residential credit performance was mixed and ranged from largely flat to modest increases in valuations.
23

For the first quarter, we earned an economic return of 8.2%, comprised of $1.01 increase in tangible net book value per common share and $0.36 ofdividends per common share. Our performance in the first quarter marks our fourth consecutive quarter of economic returns of 7.5% or more and brings ourlast twelve-month cumulative economic return to 40.7%.
Asset positioning remained an important factor in driving our favorable performance during the first quarter. Similar to prior quarters, we benefitedfrom the differing risk profiles of the two primary components of our asset portfolio: low coupon generic securities and higher coupon specified poolsecurities, which together have bolstered our performance across a wide range of interest rate and spread scenarios over the past twelve months. During thefirst quarter, our higher coupon specified pools benefited from the steep rise in rates and corresponding reduction in prepayment expectations. Thiscontrasts with the third and fourth quarters of 2020, during which our lower coupon generic securities outperformed as mortgage rates declined to historiclows and drove mortgage prepayment rates to a 20-year high. Our hedge portfolio, which was mainly comprised of intermediate and longer-term hedges,also contributed significantly to our positive first quarter results as hedge gains exceeded the aggregate price declines on our asset portfolio.
As of March 31, 2021, our investment portfolio totaled $90.3 billion, compared to $97.9 billion as of December 31, 2020 and consisted of $63.6billion Agency RMBS, $24.8 billion net TBA securities, and $1.9 billion of CRT and non-Agency securities. Our "at risk" leverage, as of March 31, 2021,was 7.7x our tangible equity, compared to 8.5x as of December 31, 2020. Our liquidity position, consisting of unencumbered Agency RMBS, US Treasurysecurities and cash and excluding both unencumbered credit assets and assets held at our broker-dealer subsidiary, was largely unchanged during the firstquarter at $5.2 billion as of March 31, 2021, compared to $5.4 billion as of December 31, 2020, or 48% and 51%, respectively, of our tangible equity. Theaverage prepayment rate on our Agency RMBS holdings during the first quarter was 24.6%, down from 27.6% for the fourth quarter of 2020. Consistentwith the significant increase in primary mortgage rates of approximately 50 basis points over the first quarter, our average CPR forecast for the remaininglife of our Agency RMBS decreased to 11.3% as of March 31, 2021, from 17.6% as of December 31, 2020.
Our interest rate exposure remained limited during the first quarter as we managed the size and composition of our hedge position in response tochanging market conditions. We proactively increased our interest rate hedge portfolio during the first quarter to $79 billion through the addition of interestrate swaps, swaptions and U.S. Treasury hedges to provide incremental protection against rising interest rates. As of March 31, 2021, our interest ratehedges totaled 98% of our funding liabilities, up from 80% as of December 31, 2020 and from a twelve-month low of 66% at the end of the second quarterof 2020. As of March 31, 2021, 72% of our hedges had a maturity of four years or more, which was a significant contributor to our first quarter hedgeperformance given the sharp rise in longer term rates. Consistent with the increase in interest rates and the corresponding extension of mortgage durationsduring the quarter, our duration gap, which is a measure of the difference between the interest rate sensitivity of our assets and liabilities, inclusive of ourinterest rate hedges, increased to 0.6 years as of March 31, 2021 from -0.5 years as of December 31, 2020.
Net spread and dollar roll income (a non-GAAP measure) was $0.76 per diluted common share for the first quarter, which excludes a "catch-up"premium amortization benefit of $0.40 per diluted common share due to changes in CPR projections for securities acquired prior to the first quarter. Thiscompares to net spread and dollar roll income of $0.75 and $0.57 per diluted common share for the fourth and first quarters of 2020, respectively, excluding$0.44 and $0.20 of "catch-up" premium amortization expense, respectively. The marginal improvement in net spread and dollar roll income for the firstquarter was due to the combination of lower funding costs, the sharp decline in CPR projections, and earnings accretion due to common stock sharerepurchases, which more than offset our lower operating leverage and an overall decline in asset yields during the quarter. (Please refer to Results ofOperations below for further information regarding non-GAAP measures.)
Our average asset yield, excluding "catch-up" amortization and including the implied yield on our TBA securities, declined to 2.02% for the firstquarter, compared to 2.07% for the fourth quarter and to 2.97% for the first quarter 2020, as lower prevailing yields on new asset purchases outweighed theyield improvement due to lower CPR projections.
The funding environment for Agency RMBS remained very favorable during the first quarter, with our average repo funding cost declining to 21basis points from 38 basis points for the fourth quarter and 180 basis points for the first quarter 2020. As of March 31, 2021, our average repo rate was0.15%, compared to 0.24% as of December 31, 2020. Favorable repo rates, and even lower implied financing rates in the TBA dollar roll market, more thanoffset a modest increase in our interest rate swap costs during the first quarter. Our aggregate cost of funds, including implied TBA dollar roll funding andinterest rate swap costs, for the first quarter was 0.02%, compared to 0.05% for the fourth quarter and 1.67% for the first quarter of 2020.
Looking ahead, we expect that the near zero short-term interest rate environment is likely to remain in place through at least 2023 and the FederalReserve ("Fed") is unlikely to begin tapering its Agency RMBS purchases before 2022, with any such tapering likely to gradually occur over a multi-monthperiod. The Fed has also indicated it will communicate its intentions well in advance of taking any such action to reduce market uncertainty. Importantly,even after the Fed completes the taper
24

process, it has indicated that it intends to continue to reinvest portfolio paydowns for an extended period of time. Against this backdrop, we believe theAgency RMBS sector remains attractive, particularly when compared on a relative value basis to other asset classes. Nonetheless, given the significantspread tightening that has occurred in the sector relative to benchmark interest rates, we chose to operate with sequentially lower leverage in recentquarters. Going forward, we may choose to operate at somewhat lower leverage levels than the first quarter of 2021 to mitigate the potential downside riskto our tangible net book value associated with reduced Fed purchases and future spread widening, as well as to provide capacity for us to increase leverageopportunistically when expected return levels are more favorable.
Market Information
The following table summarizes interest rates and prices of generic fixed rate Agency RMBS as of each date presented below:
Interest Rate/Security Price Mar. 31,
2020June 30,
2020Sept. 30,
2020Dec. 31,
2020Mar. 31,
2021
Mar. 31, 2021vs
Dec. 31, 2020Target Federal Funds Rate:
Target Federal Funds Rate - Upper Band 0.25% 0.25% 0.25% 0.25% 0.25% — bpsSOFR:
SOFR Rate 0.01% 0.10% 0.08% 0.07% 0.01% -6 bpsSOFR Interest Rate Swap Rate:
2-Year Swap 0.09% —% 0.03% 0.06% 0.12% +6 bps5-Year Swap 0.24% 0.08% 0.13% 0.24% 0.82% +58 bps10-Year Swap 0.45% 0.38% 0.47% 0.71% 1.52% +81 bps30-Year Swap 0.61% 0.63% 0.86% 1.15% 1.92% +77 bps
U.S. Treasury Security Rate:2-Year U.S. Treasury 0.25% 0.15% 0.13% 0.12% 0.16% +4 bps5-Year U.S. Treasury 0.38% 0.29% 0.28% 0.36% 0.94% +58 bps10-Year U.S. Treasury 0.67% 0.66% 0.69% 0.92% 1.74% +82 bps30-Year U.S. Treasury 1.32% 1.41% 1.46% 1.65% 2.41% +76 bps
30-Year Fixed Rate Agency Price:1.5% N/A N/A $100.66 $101.05 $96.59 -$4.462.0% $100.91 $102.33 $103.39 $103.88 $99.70 -$4.182.5% $103.59 $104.26 $104.90 $105.41 $102.55 -$2.863.0% $104.83 $105.33 $104.75 $104.77 $104.13 -$0.643.5% $105.70 $105.18 $105.40 $105.66 $105.63 -$0.034.0% $106.67 $105.98 $106.64 $106.78 $107.31 +$0.53
15-Year Fixed Rate Agency Price:1.5% N/A N/A $102.31 $102.89 $100.40 -$2.492.0% $102.66 $103.46 $103.95 $104.55 $102.61 -$1.942.5% $103.72 $104.70 $104.44 $104.30 $104.06 -$0.243.0% $104.61 $105.09 $104.94 $104.97 $105.59 +$0.623.5% $105.19 $105.06 $105.81 $106.03 $106.69 +$0.664.0% $105.56 $105.75 $106.15 $106.28 $106.34 +$0.06
________________________________
1. Price information is for generic instruments only and is not reflective of our specific portfolio holdings. Price information is as of 3:00 p.m. (EST) on such date and can vary by source.Prices in the table above were obtained from Barclays. Interest and LIBOR rates were obtained from Bloomberg.
1
25

FINANCIAL CONDITION
As of March 31, 2021 and December 31, 2020, our investment portfolio consisted of $65.5 billion and $66.4 billion of investment securities, at fairvalue, respectively, and $24.8 billion and $31.5 billion of TBA securities, at fair value, respectively. The following table is a summary of our investmentportfolio as of March 31, 2021 and December 31, 2020 (dollars in millions):
March 31, 2021 December 31, 2020
Investment Portfolio (Includes TBAs)Amortized
Cost Fair ValueAverageCoupon %
AmortizedCost Fair Value
AverageCoupon %
Fixed rate Agency RMBS and TBA securities: ≤ 15-year:
≤ 15-year RMBS $ 15,402 $ 15,469 2.24 % 17 % $ 9,256 $ 9,482 2.48 % 10 %15-year TBA securities, net (2,352) (2,358) 2.38 % (3)% 6,916 6,980 1.74 % 7 %
Total ≤ 15-year 13,050 13,111 2.22 % 15 % 16,172 16,462 2.16 % 17 %20-year RMBS 2,626 2,627 2.49 % 3 % 2,409 2,470 2.58 % 3 %30-year:
30-year RMBS 43,631 45,026 3.58 % 50 % 50,312 52,663 3.55 % 54 %30-year TBA securities, net 27,707 27,137 2.35 % 30 % 24,288 24,499 2.05 % 25 %
Total 30-year 71,338 72,163 3.10 % 80 % 74,600 77,162 3.06 % 79 %Total fixed rate Agency RMBS and TBA securities 87,014 87,901 2.95 % 97 % 93,181 96,094 2.89 % 98 %Adjustable rate Agency RMBS 61 62 2.30 % — % 69 70 2.35 % — %Multifamily — — — % — % 17 19 3.31 % — %CMO Agency RMBS:
CMO 249 259 3.23 % — % 289 301 3.30 % 1 %Interest-only strips 42 55 5.59 % — % 45 59 5.57 % — %Principal-only strips 54 58 — % — % 60 67 — % — %
Total CMO Agency RMBS 345 372 4.10 % 1 % 394 427 4.10 % 1 %Total Agency RMBS and TBA securities 87,420 88,335 2.95 % 98 % 93,661 96,610 2.90 % 99 %Non-Agency RMBS 487 495 3.16 % 1 % 178 188 4.28 % — %CMBS 356 373 4.06 % — % 333 358 4.13 % — %CRT 1,067 1,073 3.30 % 1 % 733 737 3.43 % 1 %Total investment portfolio $ 89,330 $ 90,276 2.96 % 100 % $ 94,905 $ 97,893 2.91 % 100 %
________________________________1. TBA securities are presented net of long and short positions. For further details of our TBA securities refer to Note 5 of our Consolidated Financial Statements in this Form 10-Q.
TBA securities are recorded as derivative instruments in our accompanying consolidated financial statements, and our TBA dollar roll transactionsrepresent a form of off-balance sheet financing. As of March 31, 2021 and December 31, 2020, our TBA positions had a net carrying value of $(576)million and $275 million, respectively, reported in derivative assets /(liabilities) on our accompanying consolidated balance sheets. The net carrying valuerepresents the difference between the fair value of the underlying Agency security in the TBA contract and the contract price to be paid or received for theunderlying Agency security.
As of March 31, 2021 and December 31, 2020, the weighted average yield on our investment securities (excluding TBA securities) was 2.39% and2.33%, respectively.
1
1
26

The following tables summarize certain characteristics of our fixed rate Agency RMBS portfolio, inclusive of TBAs, as of March 31, 2021 andDecember 31, 2020 (dollars in millions):
March 31, 2021Includes Net TBA Position Excludes Net TBA Position
Fixed Rate Agency RMBS and TBASecurities Par Value
AmortizedCost Fair Value
Specified Pool%
AmortizedCost Basis
Weighted Average
ProjectedCPR WAC Yield Age (Months)
Fixed rate ≤ 15-year:
1.5% $ 3,462 $ 3,518 $ 3,474 —% 102.4% 2.31% 0.99% 4 10%2.0% 5,593 5,794 5,747 1% 103.3% 2.55% 1.30% 3 9%2.5% 771 812 807 58% 105.7% 3.06% 1.22% 17 11%3.0% 1,082 1,099 1,153 94% 101.6% 3.55% 2.47% 47 14%3.5% 1,147 1,171 1,240 100% 102.1% 4.03% 2.76% 43 16%≥ 4.0% 637 656 690 91% 103.0% 4.61% 2.93% 42 17%
Total ≤ 15-year 12,692 13,050 13,111 27% 103.0% 2.82% 1.53% 11 11%20-year:
≤ 2.0% 1,454 1,500 1,473 —% 103.1% 2.87% 1.51% 5 6%2.5% 560 583 579 —% 104.2% 3.28% 1.74% 9 9%3.0% 45 46 48 98% 103.3% 3.78% 2.26% 20 12%3.5% 209 213 225 81% 101.8% 4.05% 2.96% 92 13%≥ 4.0% 273 284 302 96% 104.1% 4.74% 3.13% 52 15%
Total 20-year: 2,541 2,626 2,627 20% 103.4% 3.27% 1.87% 18 9%30-year:
2.0% 13,606 14,076 13,545 1% 101.2% 2.80% 1.85% 1 6%2.5% 19,072 19,723 19,531 1% 105.4% 3.44% 1.76% 7 8%3.0% 4,119 4,280 4,314 13% 103.5% 3.74% 2.38% 36 10%3.5% 11,575 12,102 12,543 87% 104.5% 4.06% 2.64% 70 11%4.0% 12,596 13,235 13,851 92% 105.1% 4.51% 2.93% 56 13%≥ 4.5% 7,482 7,922 8,379 98% 105.9% 5.01% 3.21% 42 15%
Total 30-year 68,450 71,338 72,163 45% 104.7% 4.19% 2.66% 46 12%Total fixed rate $ 83,683 $ 87,014 $ 87,901 42% 104.2% 3.81% 2.34% 36 11%
________________________________1. Specified pools include pools backed by lower balance loans with original loan balances of up to $200K, HARP pools (defined as pools that were issued between May 2009 and
December 2018 and backed by 100% refinance loans with original LTVs ≥ 80%), and pools backed by loans 100% originated in New York and Puerto Rico. As of March 31, 2021,lower balance specified pools had a weighted average original loan balance of $119,000 and $116,000 for 15-year and 30-year securities, respectively, and HARP pools had a weightedaverage original LTV of 127% and 137% for 15-year and 30-year securities, respectively.
2. WAC represents the weighted average coupon of the underlying collateral.3. Portfolio yield incorporates a projected life CPR based on forward rate assumptions as of March 31, 2021.
1 32 3
27
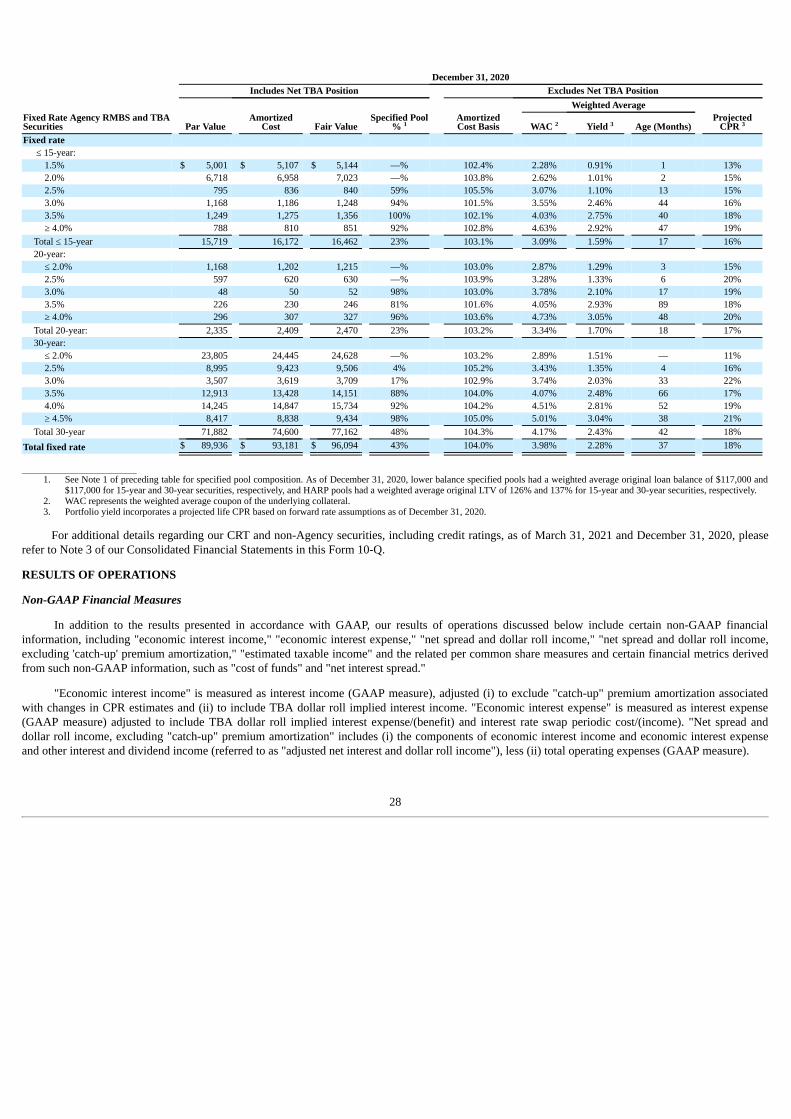
December 31, 2020Includes Net TBA Position Excludes Net TBA Position
Fixed Rate Agency RMBS and TBASecurities Par Value
AmortizedCost Fair Value
Specified Pool%
AmortizedCost Basis
Weighted AverageProjected
CPR WAC Yield Age (Months)Fixed rate
≤ 15-year:1.5% $ 5,001 $ 5,107 $ 5,144 —% 102.4% 2.28% 0.91% 1 13%2.0% 6,718 6,958 7,023 —% 103.8% 2.62% 1.01% 2 15%2.5% 795 836 840 59% 105.5% 3.07% 1.10% 13 15%3.0% 1,168 1,186 1,248 94% 101.5% 3.55% 2.46% 44 16%3.5% 1,249 1,275 1,356 100% 102.1% 4.03% 2.75% 40 18%≥ 4.0% 788 810 851 92% 102.8% 4.63% 2.92% 47 19%
Total ≤ 15-year 15,719 16,172 16,462 23% 103.1% 3.09% 1.59% 17 16%20-year:
≤ 2.0% 1,168 1,202 1,215 —% 103.0% 2.87% 1.29% 3 15%2.5% 597 620 630 —% 103.9% 3.28% 1.33% 6 20%3.0% 48 50 52 98% 103.0% 3.78% 2.10% 17 19%3.5% 226 230 246 81% 101.6% 4.05% 2.93% 89 18%≥ 4.0% 296 307 327 96% 103.6% 4.73% 3.05% 48 20%
Total 20-year: 2,335 2,409 2,470 23% 103.2% 3.34% 1.70% 18 17%30-year:
≤ 2.0% 23,805 24,445 24,628 —% 103.2% 2.89% 1.51% — 11%2.5% 8,995 9,423 9,506 4% 105.2% 3.43% 1.35% 4 16%3.0% 3,507 3,619 3,709 17% 102.9% 3.74% 2.03% 33 22%3.5% 12,913 13,428 14,151 88% 104.0% 4.07% 2.48% 66 17%4.0% 14,245 14,847 15,734 92% 104.2% 4.51% 2.81% 52 19%≥ 4.5% 8,417 8,838 9,434 98% 105.0% 5.01% 3.04% 38 21%
Total 30-year 71,882 74,600 77,162 48% 104.3% 4.17% 2.43% 42 18%Total fixed rate $ 89,936 $ 93,181 $ 96,094 43% 104.0% 3.98% 2.28% 37 18%
________________________________1. See Note 1 of preceding table for specified pool composition. As of December 31, 2020, lower balance specified pools had a weighted average original loan balance of $117,000 and
$117,000 for 15-year and 30-year securities, respectively, and HARP pools had a weighted average original LTV of 126% and 137% for 15-year and 30-year securities, respectively.2. WAC represents the weighted average coupon of the underlying collateral.3. Portfolio yield incorporates a projected life CPR based on forward rate assumptions as of December 31, 2020.
For additional details regarding our CRT and non-Agency securities, including credit ratings, as of March 31, 2021 and December 31, 2020, pleaserefer to Note 3 of our Consolidated Financial Statements in this Form 10-Q.
RESULTS OF OPERATIONS
Non-GAAP Financial Measures
In addition to the results presented in accordance with GAAP, our results of operations discussed below include certain non-GAAP financialinformation, including "economic interest income," "economic interest expense," "net spread and dollar roll income," "net spread and dollar roll income,excluding 'catch-up' premium amortization," "estimated taxable income" and the related per common share measures and certain financial metrics derivedfrom such non-GAAP information, such as "cost of funds" and "net interest spread."
"Economic interest income" is measured as interest income (GAAP measure), adjusted (i) to exclude "catch-up" premium amortization associatedwith changes in CPR estimates and (ii) to include TBA dollar roll implied interest income. "Economic interest expense" is measured as interest expense(GAAP measure) adjusted to include TBA dollar roll implied interest expense/(benefit) and interest rate swap periodic cost/(income). "Net spread anddollar roll income, excluding "catch-up" premium amortization" includes (i) the components of economic interest income and economic interest expenseand other interest and dividend income (referred to as "adjusted net interest and dollar roll income"), less (ii) total operating expenses (GAAP measure).
1 32 3
28

By providing such measures, in addition to the related GAAP measures, we believe we give greater transparency into the information used by ourmanagement in its financial and operational decision-making. We also believe it is important for users of our financial information to consider informationrelated to our current financial performance without the effects of certain measures and one-time events that are not necessarily indicative of our currentinvestment portfolio performance and operations.
Specifically, in the case of "adjusted net interest and dollar roll income," we believe the inclusion of TBA dollar roll income is meaningful as TBAs,which are accounted for under GAAP as derivative instruments with gains and losses recognized in other gain (loss) in our consolidated statement ofcomprehensive income, are economically equivalent to holding and financing generic Agency RMBS using short-term repurchase agreements. Similarly,we believe that the inclusion of periodic interest rate swap settlements in "economic interest expense" is meaningful as interest rate swaps are the primaryinstrument we use to economically hedge against fluctuations in our borrowing costs and it is more indicative of our total cost of funds than interestexpense alone. In the case of "economic interest income" and "net spread and dollar roll income, excluding 'catch-up' premium amortization," we believethe exclusion of "catch-up" adjustments to premium amortization cost or benefit is meaningful as it excludes the cumulative effect from prior reportingperiods due to current changes in future prepayment expectations and, therefore, exclusion of such cost or benefit is more indicative of the current earningspotential of our investment portfolio. In the case of estimated taxable income, we believe it is meaningful information because it directly relates to theamount of dividends that we are required to distribute to maintain our REIT qualification status.
However, because such measures are incomplete measures of our financial performance and involve differences from results computed inaccordance with GAAP, they should be considered as supplementary to, and not as a substitute for, results computed in accordance with GAAP. In addition,because not all companies use identical calculations, our presentation of such non-GAAP measures may not be comparable to other similarly-titledmeasures of other companies. Furthermore, estimated taxable income can include certain information that is subject to potential adjustments up to the timeof filing our income tax returns, which occurs after the end of our fiscal year.
Selected Financial Data
The following selected financial data is derived from our interim consolidated financial statements and the notes thereto. The tables below presentour condensed consolidated balance sheets as of March 31, 2021 and December 31, 2020 and condensed consolidated statements of comprehensive incomeand key statistics for the three months ended March 31, 2021 and 2020 (in millions, except per share amounts):
March 31, December 31,Balance Sheet Data 2021 2020
(Unaudited)Investment securities, at fair value $ 65,497 $ 66,414 Total assets $ 85,545 $ 81,817 Repurchase agreements and other debt $ 55,221 $ 52,543 Total liabilities $ 74,181 $ 70,738 Total stockholders' equity $ 11,364 $ 11,079 Net book value per common share $ 18.72 $ 17.68 Tangible net book value per common share $ 17.72 $ 16.71
1
2
29

Three Months EndedMarch 31,
Statement of Comprehensive Income Data (Unaudited) 2021 2020Interest income $ 557 $ 491 Interest expense 29 426 Net interest income 528 65 Other gain (loss), net 471 (2,463)Operating expenses 24 23 Net income (loss) 975 (2,421)Dividends on preferred stock 25 21 Net income (loss) available (attributable) to common stockholders $ 950 $ (2,442)
Net income (loss) $ 975 $ (2,421)Other comprehensive income (loss), net (237) 464 Comprehensive income (loss) 738 (1,957)Dividends on preferred stock 25 21 Comprehensive income (loss) available (attributable) to common stockholders $ 713 $ (1,978)
Weighted average number of common shares outstanding - basic 533.7 548.0
Weighted average number of common shares outstanding - diluted 535.6 548.0
Net income (loss) per common share - basic $ 1.78 $ (4.46)
Net income (loss) per common share - diluted $ 1.77 $ (4.46)
Comprehensive income (loss) per common share - basic $ 1.34 $ (3.61)
Comprehensive income (loss) per common share - diluted $ 1.33 $ (3.61)
Dividends declared per common share $ 0.36 $ 0.48
Three Months EndedMarch 31,
Other Data (Unaudited) * 2021 2020Average investment securities - at par $ 56,641 $ 94,933 Average investment securities - at cost $ 58,948 $ 97,889 Average net TBA portfolio - at cost $ 32,022 $ 7,487 Average total assets - at fair value $ 79,415 $ 113,930 Average repurchase agreements and other debt outstanding $ 54,602 $ 93,538 Average stockholders' equity $ 11,312 $ 10,735 Average tangible net book value "at risk" leverage 8.0:1 9.9:1Tangible net book value "at risk" leverage (as of period end) 7.7:1 9.4:1Economic return on tangible common equity - unannualized 8.2 % (20.2)%Expenses % of average total assets - annualized 0.12 % 0.08 %Expenses % of average assets, including average net TBA position - annualized 0.09 % 0.08 %Expenses % of average stockholders' equity - annualized 0.85 % 0.86 %
________________________________* Except as noted below, average numbers for each period are weighted based on days on our books and records.1. Net book value per common share is calculated as total stockholders' equity, less preferred stock liquidation preference, divided by number of common shares outstanding as of period
end.2. Tangible net book value per common share excludes goodwill.3. Amount excludes U.S. Treasury repurchase agreements and TBA contracts. Other debt includes debt of consolidated VIEs.4. Average stockholders' equity calculated as average month-ended stockholders' equity during the period.5. Average tangible net book value "at risk" leverage is calculated by dividing the sum of daily weighted average repurchase agreements used to fund our investment securities, other debt
and TBA securities (at cost) (together "mortgage borrowings") outstanding for the period by the sum of average stockholders' equity adjusted to exclude goodwill for the period.Leverage excludes U.S. Treasury repurchase agreements.
6. Tangible net book value "At risk" leverage as of period end is calculated by dividing the sum of mortgage borrowings outstanding and receivable/payable for unsettled investmentsecurities as of period end (at cost) by the sum of total stockholders' equity adjusted to exclude goodwill as of period end. Leverage excludes U.S. Treasury repurchase agreements.
7. Economic return on tangible common equity represents the sum of the change in tangible net book value per common share and dividends declared per share of common stock duringthe period over beginning tangible net book value per common share.
3
4
5
6
7
30

Economic Interest Income and Asset Yields
The following table summarizes our economic interest income (a non-GAAP measure) for the three months ended March 31, 2021 and 2020, whichincludes the combination of interest income (a GAAP measure) on our holdings reported as investment securities on our consolidated balance sheets,adjusted to exclude estimated "catch-up" premium amortization adjustments for the cumulative effect from prior reporting periods of changes in our CPRforecast, and implied interest income on our TBA securities (dollars in millions):
Three Months Ended March 31,2021 2020
Amount Yield Amount YieldInterest income:
Cash/coupon interest income $ 481 3.40 % $ 875 3.68 %Net premium amortization benefit (cost) 76 0.38 % (384) (1.67)%
Interest income (GAAP measure) 557 3.78 % 491 2.01 %Estimated "catch-up" premium amortization cost (benefit) due to change in CPR forecast (213) (1.45)% 243 0.99 %
Interest income, excluding "catch-up" premium amortization 344 2.33 % 734 3.00 %TBA dollar roll income - implied interest income 116 1.44 % 48 2.54 %
Economic interest income, excluding "catch-up" amortization (non-GAAP measure) $ 460 2.02 % $ 782 2.97 %
Weighted average actual portfolio CPR for investment securities held during the period 24.6 % 12.2 %Weighted average projected CPR for the remaining life of investment securities held as of periodend 11.3 % 14.5 %Average 30-year fixed rate mortgage rate as of period end 3.17 % 3.50 %10-year U.S. Treasury rate as of period end 1.74 % 0.67 %
________________________________1. Reported in gain (loss) on derivatives instruments and other securities, net in the accompanying consolidated statements of operations.2. Implied interest income from TBA dollar roll transactions is computed as the sum of (i) TBA dollar roll income and (ii) estimated TBA implied funding cost (see Economic Interest
Expense and Aggregate Cost of Funds below). TBA dollar roll income represents the price differential, or "price drop," between the TBA price for current month settlement versus theTBA price for forward month settlement and is the economic equivalent to interest income on the underlying Agency securities, less an implied funding cost, over the forwardsettlement period. Amount is net of TBAs used for hedging purposes. Amount excludes TBA mark-to-market adjustments.
3. The combined asset yield is calculated on a weighted average basis based on our average investment and TBA balances outstanding during the period and their respective yields.4. Source: Freddie Mac Primary Fixed Mortgage Rate Mortgage Market Survey
The principal elements impacting our economic interest income are the size of our average investment portfolio and the yield (actual and implied) onour securities. The following table includes a summary of the estimated impact of each of these elements on our economic interest income for the threemonths ended March 31, 2021 compared to the prior year period (in millions):
Impact of Changes in the Principal Elements Impacting Economic Interest IncomeThree Months Ended March 31, 2021 vs. March 31, 2020
Due to Change in Average
Total Increase /
(Decrease)Portfolio
SizeAssetYield
Three months ended:Interest Income (GAAP measure) $ 66 $ (195) $ 261 Estimated "catch-up" premium amortization due to change in CPR forecast (456) — (456)Interest income, excluding "catch-up" premium amortization (390) (195) (195)TBA dollar roll income - implied interest income 68 156 (88)Economic interest income, excluding "catch-up" amortization (non-GAAP measure) $ (322) $ (39) $ (283)
Our average investment portfolio, inclusive of TBAs (at cost), decreased 14% for the three months ended March 31, 2021, compared to the prior yearperiod, largely due to lower operating leverage and a decline in our total stockholders' equity outstanding as a result of common stock repurchases. Thedecrease in the average yield on our investment portfolio of 95 basis points, compared to the prior year period, was largely due to changes in assetcomposition and lower prevailing yields on new asset purchases.
1,2
3
4
31

Leverage
Our primary measure of leverage is our tangible net book value "at risk" leverage ratio, which is measured as the sum of our repurchase agreementsand other debt used to fund our investment securities and net TBA position (at cost) (together referred to as "mortgage borrowings") and our netreceivable/payable for unsettled investment securities, divided by our total stockholders' equity adjusted to exclude goodwill.
We include our net TBA position in our measure of leverage because a forward contract to acquire Agency RMBS in the TBA market carries similarrisks to Agency RMBS purchased in the cash market and funded with on-balance sheet liabilities. Similarly, a TBA contract for the forward sale of Agencysecurities has substantially the same effect as selling the underlying Agency RMBS and reducing our on-balance sheet funding commitments. (Refer toLiquidity and Capital Resources for further discussion of TBA securities and dollar roll transactions). Repurchase agreements used to fund short-terminvestments in U.S. Treasury securities ("U.S. Treasury repo") are excluded from our measure of leverage due to the temporary and highly liquid nature ofthese investments. The following table presents a summary of our leverage ratios for the periods listed (dollars in millions):
Repurchase Agreements
and Other Debt Net TBA Position
Long/(Short) Average Tangible Net
Book Value"At Risk" Leverageduring the Period
Tangible Net BookValue "At Risk"
Leverageas of
Period End Quarter EndedAverage Daily
AmountMaximum
Daily AmountEndingAmount
Average DailyAmount
EndingAmount
March 31, 2021 $ 54,602 $ 57,153 $ 55,221 $ 32,022 $ 25,355 8.0:1 7.7:1December 31, 2020 $ 53,645 $ 55,249 $ 52,543 $ 33,753 $ 31,204 8.4:1 8.5:1March 31, 2020 $ 93,538 $ 104,773 $ 63,241 $ 7,487 $ 20,648 9.9:1 9.4:1
________________________________1. Other debt includes debt of consolidated VIEs. Amounts exclude U.S. Treasury repo agreements.2. Daily average and ending net TBA position outstanding measured at cost.3. Average tangible net book value "at risk" leverage during the period represents the sum of our daily weighted average repurchase agreements and other debt used to fund acquisitions
of investment securities and net TBA position outstanding divided by the sum of our average month-ended stockholders' equity, adjusted to exclude goodwill.4. Tangible net book value "at risk" leverage as of period end represents the sum of our repurchase agreements and other debt used to fund acquisitions of investments securities, net TBA
position (at cost) and net receivable/payable for unsettled investment securities outstanding as of period end divided by total stockholders' equity, adjusted to exclude goodwill as ofperiod end.
Economic Interest Expense and Aggregate Cost of Funds
The following table summarizes our economic interest expense and aggregate cost of funds (non-GAAP measures) for the three months ended March31, 2021 and 2020 (dollars in millions), which includes the combination of interest expense on Agency repurchase agreements and other debt (GAAPmeasure), implied financing cost (benefit) of our TBA securities and interest rate swap periodic interest cost (income):
Three Months Ended March 31,2021 2020
Economic Interest Expense and Aggregate Cost of Funds AmountCost ofFunds Amount
Cost ofFunds
Repurchase agreement and other debt - interest expense (GAAP measure) $ 29 0.21 % $ 426 1.80 %TBA dollar roll income - implied interest expense (benefit) (38) (0.48)% 32 1.67 %
Economic interest expense - before interest rate swap periodic cost (income), net (9) (0.04)% 458 1.79 %Interest rate swap periodic interest cost (income), net 12 0.06 % (31) (0.12)%
Total economic interest expense (non-GAAP measure) $ 3 0.02 % $ 427 1.67 %
________________________________1. Amounts exclude interest rate swap termination fees and variation margin settlements paid or received, forward starting swaps and the impact of other supplemental hedges, such as
swaptions and U.S. Treasury positions.2. Reported in gain (loss) on derivative instruments and other securities, net in our consolidated statements of comprehensive income.3. The implied funding cost (benefit) of TBA dollar roll transactions is determined using the price differential, or "price drop," between the TBA price for current month settlement
versus the TBA price for forward month settlement and market based assumptions regarding the "cheapest-to-deliver" collateral that can be delivered to satisfy the TBA contract, suchas the anticipated collateral’s weighted average coupon, weighted average maturity and projected 1-month CPR. The average implied funding cost (benefit) for all TBA transactions isweighted based on our daily average TBA balance outstanding for the period.
4. The combined cost of funds for total mortgage borrowings outstanding, before interest rate swap costs, is calculated on a weighted average basis based on average repo, other debt andTBA balances outstanding during the period and their respective cost of funds.
5. Interest rate swap periodic interest (income) cost is measured as a percent of average mortgage borrowings outstanding for the period.
The principal elements impacting our economic interest expense are (i) the size of our average mortgage borrowings and interest rate swap portfoliooutstanding during the period, (ii) the average interest rate (actual and implied) on our mortgage borrowings and (iii) the average net interest ratepaid/received on our interest rate swaps. The following table includes a
1 2
3 4
1
2,3
4
2,5
32

summary of the estimated impact of these elements on our economic interest expense for the three months ended March 31, 2021 compared to the prioryear period (in millions):
Impact of Changes in the Principal Elements of Economic Interest ExpenseThree Months Ended March 31, 2021 vs. March 31, 2020
Due to Change in Average
Total Increase /
(Decrease)Borrowing / Swap
BalanceBorrowing / Swap
RateThree months ended:Repurchase agreements and other debt interest expense $ (397) $ (177) $ (220)TBA dollar roll income - implied interest benefit/expense (70) 103 (173)Interest rate swap periodic interest expense/benefit 43 11 32 Total change in economic interest expense $ (424) $ (63) $ (361)
Our average mortgage borrowings, inclusive of TBAs, decreased 14% for the three months ended March 31, 2021, compared to the prior year period,consistent with the decline in our average investment portfolio due to lower operating leverage and a decline in our total stockholders' equity outstanding asa result of common stock repurchases.
The decline in the average interest rate (actual and implied) on our mortgage borrowings for the three months ended March 31, 2021 was due to thecombination of very low financing rates available in the Agency repo market and even lower implied financing rates available in the TBA dollar rollmarket, as repo and dollar roll funding levels benefited from favorable technical supply and demand factors.
The increase in our interest rate swap periodic cost for the three months ended March 31, 2021 was primarily due to a decline in the average floatingrate received on our interest rate swaps, consistent with lower short-term interest rates, which was partly offset by a decline in the average fixed rate paidon our interest rate swaps. The following table presents a summary of the ratio of our average interest rates swaps outstanding, excluding forward startingswaps, to our average mortgage borrowings and the weighted average pay-fixed / receive-floating rates on our interest rate swaps for the three monthsended March 31, 2021 and 2020 (dollars in millions):
Three Months EndedMarch 31,
Average Ratio of Interest Rate Swaps (Excluding Forward Starting Swaps) to Mortgage BorrowingsOutstanding 2021 2020Average Agency repo and other debt outstanding $ 54,602 $ 93,538 Average net TBA portfolio outstanding - at cost $ 32,022 $ 7,487 Average mortgage borrowings outstanding $ 86,624 $ 101,025 Average notional amount of interest rate swaps outstanding (excluding forward starting swaps) $ 45,211 $ 71,659 Ratio of average interest rate swaps to mortgage borrowings outstanding 52 % 71 %
Average interest rate swap pay-fixed rate (excluding forward starting swaps) 0.16 % 1.22 %Average interest rate swap receive-floating rate (0.05)% (1.39)%Average interest rate swap net pay/(receive) rate 0.11 % (0.17)%
For the three months ended March 31, 2021 and 2020, we had an average forward starting swap balance of $0.3 billion and $1.5 billion, respectively.Forward starting interest rate swaps do not impact our economic interest expense and aggregate cost of funds until they commence accruing net interestsettlements on their forward start dates. Including forward starting swaps, our average ratio of interest rate swaps outstanding to our average mortgageborrowings for the three months ended March 31, 2021 and 2020 was 53% and 72%, respectively.
Net Interest Spread
The following table presents a summary of our net interest spread (including the impact of TBA dollar roll income, interest rate swaps and excluding"catch-up" premium amortization) for the three months ended March 31, 2021 and 2020:
33

Three Months EndedMarch 31,
Investment and TBA Securities - Net Interest Spread 2021 2020Average asset yield, excluding "catch-up" premium amortization 2.02 % 2.97 %Average aggregate cost of funds (0.02)% (1.67)%Average net interest spread, excluding "catch-up" premium amortization 2.00 % 1.30 %
Net Spread and Dollar Roll Income
The following table presents a summary of our net spread and dollar roll income, excluding estimated "catch-up" premium amortization, per dilutedcommon share (a non-GAAP financial measure) and a reconciliation to our net interest income (the most comparable GAAP financial measure) for thethree months ended March 31, 2021 and 2020 (dollars in millions):
Three Months EndedMarch 31,
2021 2020Net interest income (GAAP measure) $ 528 $ 65
TBA dollar roll income, net 154 16 Interest rate swap periodic (cost) income, net (12) 31 Other interest and dividend income — 2
Adjusted net interest and dollar roll income 670 114 Operating expense (24) (23)
Net spread and dollar roll income 646 91 Dividend on preferred stock 25 21
Net spread and dollar roll income available to common stockholders (non-GAAP measure) 621 70 Estimated "catch-up" premium amortization cost (benefit) due to change in CPR forecast (213) 243
Net spread and dollar roll income, excluding "catch-up" premium amortization, available to common stockholders (non-GAAPmeasure) $ 408 $ 313
Weighted average number of common shares outstanding - basic 533.7 548.0
Weighted average number of common shares outstanding - diluted 535.6 549.2
Net spread and dollar roll income per common share - basic $ 1.16 $ 0.13
Net spread and dollar roll income per common share - diluted $ 1.16 $ 0.13
Net spread and dollar roll income, excluding "catch-up" premium amortization, per common share - basic $ 0.76 $ 0.57
Net spread and dollar roll income, excluding "catch-up" premium amortization, per common share - diluted $ 0.76 $ 0.57
________________________________1. Reported in gain (loss) on derivative instruments and other securities, net in our consolidated statements of comprehensive income
Gain (Loss) on Investment Securities, Net
The following table is a summary of our net gain (loss) on investment securities for the three months ended March 31, 2021 and 2020 (in millions): Three Months Ended
March 31,Gain (Loss) on Investment Securities, Net 2021 2020Gain (loss) on sale of investment securities, net $ (13) $ 494 Unrealized gain (loss) on investment securities measured at fair value through net income, net (955) 197 Unrealized gain (loss) on investment securities measured at fair value through other comprehensive income, net (237) 464 Total gain (loss) on investment securities, net $ (1,205) $ 1,155
________________________________1. Amounts exclude gain (loss) on TBA securities, which are reported in gain (loss) on derivative instruments and other securities, net in our Consolidated Statements of Comprehensive
Income.2. Investment securities acquired after fiscal year 2016 are measured at fair value through net income (see Note 2 of our Consolidated Financial Statements in this Form 10-Q).
1
1
1
1
2
34

Gain (Loss) on Derivative Instruments and Other Securities, Net
The following table is a summary of our gain (loss) on derivative instruments and other securities, net for the three months ended March 31, 2021and 2020 (in millions):
Three Months EndedMarch 31,
2021 2020Interest rate swap periodic income (cost), net $ (12) $ 31 Realized gain (loss) on derivative instruments and other securities, net:
TBA securities - dollar roll income, net 154 16 TBA securities - mark-to-market net gain (loss) (228) 129 Payer swaptions (24) (22)U.S. Treasury securities - long position (10) 60 U.S. Treasury securities - short position 1 (634)U.S. Treasury futures - short position 27 (21)Interest rate swaps - termination fees and variation margin settlements, net 1,090 (2,806)Other — 27
Total realized gain (loss) on derivative instruments and other securities, net 1,010 (3,251)Unrealized gain (loss) on derivative instruments and other securities, net:
TBA securities - mark-to-market net gain (loss) (852) 548 Interest rate swaps 46 (20)Payer swaptions 411 (112)U.S. Treasury securities - long position — 37 U.S. Treasury securities - short position 806 (303)U.S. Treasury futures - short position 34 (83)Other (4) (1)
Total unrealized gain (loss) on derivative instruments and other securities, net 441 66 Total gain (loss) on derivative instruments and other securities, net $ 1,439 $ (3,154)
For further details regarding our use of derivative instruments and related activity refer to Notes 2 and 5 of our Consolidated Financial Statements inthis Form 10-Q.
Estimated Taxable Income (Loss)
For the three months ended March 31, 2021 and 2020, we had estimated taxable income (loss) available (attributable) to common stockholders of$(164) million and $111 million, respectively, or $(0.31) and $0.20 per diluted common share, respectively. Income determined under GAAP differs fromincome determined under U.S. federal income tax rules because of both temporary and permanent differences in income and expense recognition. Theprimary differences are (i) unrealized gains and losses on investment securities and derivative instruments marked-to-market in current income for GAAPpurposes, but excluded from taxable income until realized, settled or amortized over the instrument's original term, (ii) timing differences, both temporaryand potentially permanent, in the recognition of certain realized gains and losses and (iii) temporary differences related to the amortization of premiumsand discounts on investments. Furthermore, our estimated taxable income is subject to potential adjustments up to the time of filing our appropriate taxreturns, which occurs after the end of our fiscal year. The following is a reconciliation of our GAAP net income to our estimated taxable income for thethree months ended March 31, 2021 and 2020 (dollars in millions, except per share amounts):
35

Three Months EndedMarch 31,2021 2020
Net income/(loss) $ 975 $ (2,421)Book to tax differences:
Premium amortization, net (269) 237 Realized gain/loss, net (1,494) 2,555 Net capital loss/(utilization of net capital loss carryforward) 89 32 Unrealized (gain)/loss, net 545 (263)Other (10) (8)
Total book to tax differences (1,139) 2,553 REIT taxable income (loss) (164) 132
REIT taxable income attributed to preferred stock — 21 REIT taxable income (loss), attributed to common stock $ (164) $ 111
Weighted average common shares outstanding - basic 533.7 548.0
Weighted average common shares outstanding - diluted 533.7 549.2
REIT taxable income (loss) per common share - basic $ (0.31) $ 0.20
REIT taxable income (loss) per common share - diluted $ (0.31) $ 0.20
Beginning net capital loss carryforward $ — $ 394 Increase (decrease) in net capital loss carryforward 89 32 Ending net capital loss carryforward $ 89 $ 426 Ending net capital loss carryforward per common share $ 0.17 $ 0.75
36

LIQUIDITY AND CAPITAL RESOURCES
Our business is dependent on our ability to maintain adequate levels of liquidity and capital resources to fund day-to-day operations, fulfill collateralrequirements under our funding and derivative agreements, and to satisfy our dividend distribution requirement of at least 90% of our taxable income tomaintain our qualification as a REIT. Our primary sources of liquidity are unencumbered cash and securities, borrowings available under repurchaseagreements, TBA dollar roll financing and monthly receipts of principal and interest payments. We may also conduct asset sales, change our asset orfunding mix, issue equity or undertake other capital enhancing actions to maintain adequate levels of liquidity and capital resources.
We believe that we have sufficient liquidity and capital resources available to meet our obligations and execute our business strategy. In assessing ourliquidity, we consider a number of factors, including our current leverage, collateral levels, access to capital markets, overall market conditions, and thesensitivity of our tangible net book value over a range of scenarios. However, these and other factors impacting our liquidity are subject to numerous risksand uncertainties, including as described in the Quantitative and Qualitative Disclosures of Market Risks and Risk Factors sections of this Form 10-Q.
Leverage and Financing Sources
Our leverage will vary depending on market conditions and our assessment of relative risks and returns, but we generally expect our leverage to bebetween six and twelve times the amount of our tangible stockholders' equity, measured as the sum of our total mortgage borrowings and net payable /(receivable) for unsettled investment securities, divided by the sum of our total stockholders' equity adjusted to exclude goodwill. Our tangible net bookvalue "at risk" leverage ratio was 7.7x and 8.5x as of March 31, 2021 and December 31, 2020, respectively. The following table includes a summary of ourmortgage borrowings outstanding as of March 31, 2021 and December 31, 2020 (dollars in millions). For additional details of our mortgage borrowingsrefer to Notes 2, 4 and 5 to our Consolidated Financial Statements in this Form 10-Q.
March 31, 2021 December 31, 2020Mortgage Borrowings Amount % Amount %Repurchase agreements $ 55,056 68 % $ 52,366 63 %Debt of consolidated variable interest entities, at fair value 165 — % 177 — %Total debt 55,221 69 % 52,543 63 %Net TBA position, at cost 25,355 31 % 31,204 37 %Total mortgage borrowings $ 80,576 100 % $ 83,747 100 %
________________________________1. As of March 31, 2021 and December 31, 2020, 44% and 46%, respectively, of our repurchase agreement funding was through the GCF Repo service.
Our primary financing sources are collateralized borrowings structured as repurchase agreements. We enter into repurchase agreements, or "repo,"through bi-lateral arrangements with financial institutions and independent dealers. We also enter into third-party repurchase agreements through ourwholly-owned registered broker-dealer subsidiary, Bethesda Securities, LLC, such as tri-party repo offered through the FICC's GCF Repo service. Wemanage our repurchase agreement funding position through a variety of methods, including diversification of counterparties, maintaining a staggeredmaturity profile and utilization of interest rate hedging strategies. We also use TBA dollar roll transactions as a means of synthetically financing AgencyRMBS.
The terms and conditions of our repurchase agreements are determined on a transaction-by-transaction basis when each such borrowing is initiated orrenewed and, in the case of GCF Repo, by the variable margin requirements calculated by the FICC, which acts as the central counterparty. The amountborrowed is generally equal to the fair value of the securities pledged, as determined by the lending counterparty, less an agreed-upon discount, referred toas a "haircut," which reflects the underlying risk of the specific collateral and protects the counterparty against a change in its value. Interest rates aregenerally fixed based on prevailing rates corresponding to the term of the borrowing. None of our repo counterparties are obligated to renew or otherwiseenter into new borrowings at the conclusion of our existing borrowings.
The use of TBA dollar roll transactions increases our funding diversification, expands our available pool of assets, and increases our overall liquidityposition, as TBA contracts typically have lower implied haircuts relative to Agency RMBS pools funded with repo financing. However, if it were tobecome uneconomical to roll our TBA contracts into future months it may be necessary to take physical delivery of the underlying securities and fundthose assets with cash or other financing sources, which could reduce our liquidity position.
1
37

Collateral Requirements and Unencumbered Assets
Amounts available to be borrowed under our repurchase agreements are dependent upon prevailing interest rates, the lender’s "haircut" requirementsand collateral value. Each of these elements may fluctuate with changes in interest rates, credit quality and liquidity conditions within the financial markets.To help manage the adverse impact of interest rate changes on our borrowings, we utilize an interest rate risk management strategy involving the use ofderivative financial instruments. In particular, we attempt to mitigate the risk of the cost of our short-term funding liabilities increasing at a faster rate thanthe earnings of our long-term fixed rate assets during a period of rising interest rates.
The collateral requirements, or haircut levels, under our repo agreements are typically determined on an individual transaction basis or by theprevailing requirements established by the FICC for GCF tri-party repo. Consequently, haircut levels and minimum margin requirements can change overtime and may increase during periods of elevated market volatility. If the fair value of our collateral declines, our counterparties will typically require thatwe post additional collateral to re-establish the agreed-upon collateral levels, referred to as "margin calls." Similarly, if the estimated fair value of ourinvestment securities increases, we may request that counterparties release collateral back to us. Our counterparties typically have the sole discretion todetermine the value of pledged collateral but are required to act in good faith in making determinations of value. Our agreements generally provide that inthe event of a margin call, collateral must be posted on the same business day, subject to notice requirements. As of March 31, 2021, we had met all ourmargin requirements.
The value of Agency RMBS collateral is impacted by market factors and is reduced by monthly principal pay-downs on the underlying mortgagepools. Fannie Mae and Freddie Mac publish monthly security pay-down factors for their mortgage pools on the fifth day after month-end, but do not remitpayment to security holders until generally the 25th day after month-end. Bi-lateral repo counterparties assess margin to account for the reduction in valueof Agency collateral when factors are released. The FICC assesses margin on the last day of each month, prior to the factor release date, based on itsinternally projected pay-down rates (referred to as the "blackout period exposure adjustment" or "blackout margin"). On the factor release date, theblackout margin is released and collateralization requirements are adjusted to actual factor data. Due to the timing difference between associated margincalls and our receipt of principal pay-downs, our liquidity is temporarily reduced each month for principal repayments. We attempt to manage the liquidityrisk associated with principal pay-downs by monitoring conditions impacting prepayment rates and through asset selection. As of March 31, 2021, ourportfolio largely consisted of lower coupon 30 and 15-year TBA securities, which are not subject to monthly principal pay-downs, and higher couponholdings concentrated in high quality, specified Agency RMBS pools, which have a lower risk of prepayment than similar coupon generic Agency RMBS.
Collateral requirements under our derivative agreements are subject to our counterparties' assessment of their maximum risk of loss associated withthe derivative instrument measured over a certain period of time, referred to as the initial or minimum margin requirement. We are also subject to dailyvariation margin requirements based on changes in the value of the derivative instrument and/or collateral pledged. Daily variation margin requirementsalso entitle us to receive collateral if the value of amounts owed to us under the derivative agreement exceeds the minimum margin requirement. Thecollateral requirements under our TBA contracts are governed by the Mortgage-Backed Securities Division ("MBSD") of the FICC and, if applicable, byour third-party brokerage agreements, which may establish margin levels in excess of the MBSD. Collateral levels for interest rate derivative agreementsare typically governed by the central clearing exchange and the associated futures commission merchants ("FCMs"), which may establish margin levels inexcess of the clearing exchange. Collateral levels for interest rate derivative agreements not subject to central clearing are established by the counterpartyfinancial institution.
Haircut levels and minimum margin requirements imposed by our counterparties reduce the amount of our unencumbered assets and limit the amountwe can borrow against our investment securities. During the three months ended March 31, 2021, haircuts remained stable, and, as of March 31, 2021, theweighted average haircut on our repurchase agreements was approximately 4.2% of the value of our collateral, compared to 4.6% as of December 31, 2020.
To mitigate the risk of future margins calls, we seek to maintain excess liquidity by holding unencumbered liquid assets that can be used to satisfycollateral requirements, collateralize additional borrowings or sold for cash. As of March 31, 2021, our unencumbered assets totaled 62% of our tangiblenet equity, compared to 60% as of December 31, December 31, 2020. The majority of our liquidity is held at AGNC, but we also maintain capital andexcess liquidity at Bethesda Securities to meet regulatory standards, satisfy counterparty and clearing organization expectations, and for risk managementpurposes. As of March 31, 2021, we had cash and unencumbered Agency RMBS and U.S. Treasury securities totaling $5.2 billion, or 48% of our tangibleequity, which excludes unencumbered CRT securities, non-Agency securities and assets held at Bethesda Securities, compared to $5.4 billion and 51%,respectively, as of December 31, 2020.
38

Counterparty Risk
Collateral requirements imposed by counterparties subject us to the risk that the counterparty does not return pledged assets to us as and whenrequired. We attempt to manage this risk by monitoring our collateral positions and limiting our counterparties to registered clearinghouses and majorfinancial institutions with acceptable credit ratings. We also diversify our funding across multiple counterparties and by region.
As of March 31, 2021, our maximum amount at risk (or the excess/shortfall of the value of collateral pledged/received over our repurchaseagreement liabilities/reverse repurchase agreement receivables) with any of our repurchase agreement counterparties, excluding the FICC, was less than 2%of our tangible stockholders' equity, with our top five repo counterparties, excluding the FICC, representing less than 5% of our tangible stockholders'equity. As of March 31, 2021, approximately 9% of our tangible stockholder's equity was at risk with the FICC. Excluding central clearing exchanges, as ofMarch 31, 2021, our amount at risk with any counterparty to our derivative agreements was less than 1% of our stockholders' equity.
Asset Sales
Agency RMBS securities are among the most liquid fixed income securities, and the TBA market is the second most liquid market (after the U.S.Treasury market). The vitality of these markets enables us to sell assets under most market conditions to generate liquidity through direct sales or deliveryinto TBA contracts, subject to "good delivery" provisions promulgated by the Securities Industry and Financial Markets Association ("SIFMA"). Undercertain market conditions, however, we may be unable to realize the full "pay-up" value of our specified pool securities, or premium relative to genericAgency RMBS. We attempt to manage this risk by maintaining a minimum level of securities that trade at or near TBA values that in our estimationenhances our portfolio liquidity across a wide range of market conditions.
Capital Markets
The equity capital markets serve as a source of capital to grow our business and to meet potential liquidity needs of our business. The availability ofequity capital is dependent on market conditions and investor demand for our common and preferred stock. We will typically not issue common stock whenthe price of our common stock trades below our tangible net book value or issue preferred equity when its cost exceeds acceptable hurdle rates of return onour equity. There can be no assurance that we will be able to raise additional equity capital at any particular time or on any particular terms. Furthermore,when the trading price of our common stock is less than our estimate of our current tangible net book value per common share, among other conditions, wemay repurchase shares of our common stock. Please refer to Note 9 of our Consolidated Financial Statements in this Form 10-Q for further detailsregarding our recent equity capital transactions and our stock repurchase plan.
OFF-BALANCE SHEET ARRANGEMENTS
As of March 31, 2021, we did not maintain relationships with unconsolidated entities or financial partnerships, such as entities often referred to asstructured finance, or special purpose or variable interest entities, established to facilitate off-balance sheet arrangements or other contractually narrow orlimited purposes. Additionally, as of March 31, 2021, we had not guaranteed obligations of unconsolidated entities or entered into a commitment or intentto provide funding to such entities.
FORWARD-LOOKING STATEMENTS
The statements contained in this Quarterly Report that are not historical facts, including estimates, projections, beliefs, expectations concerningconditions, events, or the outlook for our business, strategy, performance, operations or the markets or industries in which we operate, are forward-lookingstatements within the meaning of the Private Securities Litigation Reform Act. Forward-looking statements are typically identified by words such as“believe,” “plan,” “expect,” “anticipate,” “see,” “intend,” “outlook,” “potential,” “forecast,” “estimate,” “will,” “could,” “should,” “likely” and othersimilar, correlative or comparable words and expressions.
Forward looking statements are based on management’s assumptions, projections and beliefs as of the date of this Quarterly Report, but they involvea number of risks and uncertainties. Actual results may differ materially from those anticipated in forward-looking statements, as well as from historicalperformance. Factors that could cause actual results to vary from our forward-looking statements include, but are not limited to, the following:
• the impact of the COVID-19 pandemic and of measures taken in response to the COVID-19 pandemic by various governmental authorities,businesses and other third parties;
• actions by the federal, state, or local governments to stabilize the economy, the housing sector or financial markets;• changes in U.S. monetary policy or interest rates, including Fed purchases of Agency RMBS;• fluctuations in the yield curve;
39

• fluctuations in mortgage prepayment rates on the loans underlying our Agency RMBS;• the availability and terms of financing;• changes in the market value of our assets, including from changes in net interest spreads, and changes in market liquidity or depth;• the effectiveness of our risk mitigation strategies;• conditions in the market for Agency RMBS and other mortgage securities;• legislative or regulatory changes that affect our status as a REIT, our exemption from the Investment Company Act of 1940 or the mortgage
markets in which we participate; and• other risks discussed under the heading “Risk Factors” herein and in our Annual Report on Form 10-K.
Forward-looking statements speak only as of the date made, and we do not assume any duty and do not undertake to update forward-lookingstatements. A further discussion of risks and uncertainties that could cause actual results to differ from any of our forward-looking statements is included inour most recent Annual Report on Form 10-K and this document under Item 1A. Risk Factors. We caution readers not to place undue reliance on ourforward-looking statements.
Item 3. Quantitative and Qualitative Disclosures about Market Risk
Market risk is the exposure to loss resulting from changes in market factors such as interest rates, foreign currency exchange rates, commodity pricesand equity prices. The primary market risks that we are exposed to are interest rate, prepayment, spread, liquidity, extension and credit risk.
Interest Rate Risk
We are subject to interest rate risk in connection with the fixed income nature of our assets and the short-term, variable rate nature of our financingobligations. Our operating results depend in large part on differences between the income earned on our assets and our cost of borrowing and hedgingactivities. The costs associated with our borrowings are generally based on prevailing market interest rates. During a period of rising interest rates, ourborrowing costs generally will increase while the yields earned on our existing portfolio of leveraged fixed-rate assets will largely remain static. This canresult in a decline in our net interest spread. Changes in the level of interest rates can also affect the rate of mortgage prepayments and the value of ourassets.
Interest rates are highly sensitive to many factors, including fiscal and monetary policies and domestic and international economic and politicalconsiderations, as well as other factors beyond our control. Subject to maintaining our qualification as a REIT, we engage in a variety of interest ratemanagement techniques to mitigate the influence of interest rate changes on our net interest income and fluctuations of our tangible net book value. Theprincipal instruments that we use to hedge our interest rate risk are interest rate swaps, swaptions, U.S. Treasury securities and U.S. Treasury futurescontracts. Our hedging techniques are highly complex and are partly based on assumed levels of prepayments of our assets. If prepayments are slower orfaster than assumed, the maturity of our investments will also differ from our expectations, which could reduce the effectiveness of our hedging strategiesand may cause losses on such transactions and adversely affect our cash flow.
The severity of potential declines in our tangible net book value due to fluctuations in interest rates would depend on our asset, liability, and hedgecomposition at the time, as well as the magnitude and duration of the interest rate change. Primary measures of an instrument's price sensitivity to interestrate fluctuations are its duration and convexity. Duration measures the estimated percentage change in market value of an instrument that would be causedby a parallel change in short and long-term interest rates. The duration of our assets will vary with changes in interest rates and tends to increase wheninterest rates rise and decrease when interest rates fall. This "negative convexity" generally increases the interest rate exposure of our investment portfolioin excess of what is measured by duration alone.
We estimate the duration and convexity of our assets using a third-party risk management system and market data. We review the duration estimatesfrom the third-party model and may make adjustments based on our judgment to better reflect any unique characteristics and market trading conventionsassociated with certain types of securities.
The table below quantifies the estimated changes in the fair value of our investment portfolio (including derivatives and other securities used forhedging purposes) and in our tangible net book value per common share as of March 31, 2021 and December 31, 2020 should interest rates go up or downby 50, 75 and 100 basis points, assuming instantaneous parallel shifts in the yield curve and including the impact of both duration and convexity. All valuesin the table below are measured as percentage changes from the base interest rate scenario. The base interest rate scenario assumes interest rates andprepayment projections as of March 31, 2021 and December 31, 2020.
40

To the extent that these estimates or other assumptions do not hold true, which is likely in a period of high volatility, actual results could differmaterially from our projections. Moreover, if different models were employed in the analysis, materially different projections could result. Lastly, while thetable below reflects the estimated impact of interest rate changes on a static portfolio, we actively manage our portfolio and we continuously adjust the sizeand composition of our asset and hedge portfolio.
Interest Rate Sensitivity March 31, 2021 December 31, 2020
Change in Interest Rate
Estimated Changein Portfolio Market
Value
Estimated Change inTangible Net BookValue Per Common
Share
Estimated Change inPortfolio Market
Value
Estimated Change inTangible Net BookValue Per Common
Share-100 Basis Points -0.6% -5.8% -1.2% -12.6%-75 Basis Points -0.3% -2.6% -0.9% -9.7%-50 Basis Points 0.0% -0.4% -0.5% -5.8%+50 Basis Points -0.5% -4.6% -0.1% -1.1%+75 Basis Points -0.8% -8.1% -0.4% -4.0%+100 Basis Points -1.2% -12.0% -0.8% -8.1%
________________________________1. Derived from models that are dependent on inputs and assumptions provided by third parties, assumes there are no changes in mortgage spreads and assumes a static portfolio. Actual
results could differ materially from these estimates.2. Includes the effect of derivatives and other securities used for hedging purposes. Interest rates are assumed to be floored at 0% in down rate scenarios.
Prepayment Risk
Prepayment risk is the risk that our assets will be repaid at a faster rate than anticipated. Interest rates and numerous other factors affect the rate ofprepayments, such as housing prices, general economic conditions, loan age, size and loan-to-value ratios, and GSE buyouts of delinquent loans underlyingour securities. Generally, prepayments increase during periods of falling mortgage interest rates and decrease during periods of rising mortgage interestrates. However, this may not always be the case.
If our assets prepay at a faster rate than anticipated, we may be unable to reinvest the repayments at acceptable yields. If the proceeds are reinvestedat lower yields than our existing assets, our net interest income would be negatively impacted. We also amortize or accrete premiums and discounts we payor receive at purchase relative to the stated principal of our assets into interest income over their projected lives using the effective interest method. If theactual and estimated future prepayment experience differs from our prior estimates, we are required to record an adjustment to interest income for theimpact of the cumulative difference in the effective yield.
Extension Risk
Extension risk is the risk that our assets will be repaid at a slower rate than anticipated and generally increases when interest rates rise. In a rising orhigher interest rate environment, we may be required to finance our investments at potentially higher costs without the ability to reinvest principal intohigher yielding securities as a result of borrowers prepaying their mortgages at a slower pace than originally anticipated, adversely impacting our netinterest spread, and thus our net interest income.
As of March 31, 2021 and December 31, 2020, our investment securities (excluding TBAs) had a weighted average projected CPR of 11.3% and17.6%, respectively, and a weighted average yield of 2.39% and 2.33%, respectively. The table below presents estimated weighted average projected CPRsand yields for our investment securities should interest rates go up or down instantaneously by 50, 75 and 100 basis points. Estimated yields exclude theimpact of retroactive "catch-up" premium amortization adjustments for prior periods due to changes in the projected CPR assumption.
1,2
41
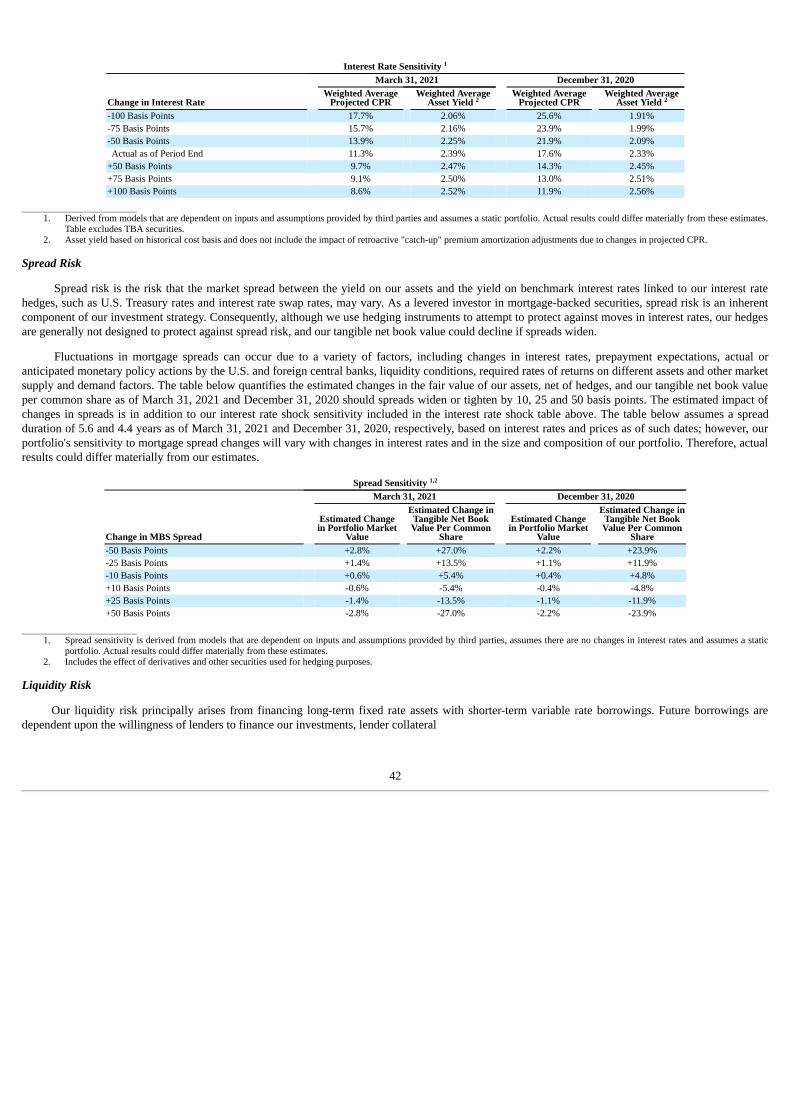
Interest Rate Sensitivity March 31, 2021 December 31, 2020
Change in Interest RateWeighted Average
Projected CPRWeighted Average
Asset Yield Weighted Average
Projected CPRWeighted Average
Asset Yield -100 Basis Points 17.7% 2.06% 25.6% 1.91%-75 Basis Points 15.7% 2.16% 23.9% 1.99%-50 Basis Points 13.9% 2.25% 21.9% 2.09% Actual as of Period End 11.3% 2.39% 17.6% 2.33%+50 Basis Points 9.7% 2.47% 14.3% 2.45%+75 Basis Points 9.1% 2.50% 13.0% 2.51%+100 Basis Points 8.6% 2.52% 11.9% 2.56%
________________________________1. Derived from models that are dependent on inputs and assumptions provided by third parties and assumes a static portfolio. Actual results could differ materially from these estimates.
Table excludes TBA securities.2. Asset yield based on historical cost basis and does not include the impact of retroactive "catch-up" premium amortization adjustments due to changes in projected CPR.
Spread Risk
Spread risk is the risk that the market spread between the yield on our assets and the yield on benchmark interest rates linked to our interest ratehedges, such as U.S. Treasury rates and interest rate swap rates, may vary. As a levered investor in mortgage-backed securities, spread risk is an inherentcomponent of our investment strategy. Consequently, although we use hedging instruments to attempt to protect against moves in interest rates, our hedgesare generally not designed to protect against spread risk, and our tangible net book value could decline if spreads widen.
Fluctuations in mortgage spreads can occur due to a variety of factors, including changes in interest rates, prepayment expectations, actual oranticipated monetary policy actions by the U.S. and foreign central banks, liquidity conditions, required rates of returns on different assets and other marketsupply and demand factors. The table below quantifies the estimated changes in the fair value of our assets, net of hedges, and our tangible net book valueper common share as of March 31, 2021 and December 31, 2020 should spreads widen or tighten by 10, 25 and 50 basis points. The estimated impact ofchanges in spreads is in addition to our interest rate shock sensitivity included in the interest rate shock table above. The table below assumes a spreadduration of 5.6 and 4.4 years as of March 31, 2021 and December 31, 2020, respectively, based on interest rates and prices as of such dates; however, ourportfolio's sensitivity to mortgage spread changes will vary with changes in interest rates and in the size and composition of our portfolio. Therefore, actualresults could differ materially from our estimates.
Spread Sensitivity March 31, 2021 December 31, 2020
Change in MBS Spread
Estimated Changein Portfolio Market
Value
Estimated Change inTangible Net BookValue Per Common
Share
Estimated Changein Portfolio Market
Value
Estimated Change inTangible Net BookValue Per Common
Share-50 Basis Points +2.8% +27.0% +2.2% +23.9%-25 Basis Points +1.4% +13.5% +1.1% +11.9%-10 Basis Points +0.6% +5.4% +0.4% +4.8%+10 Basis Points -0.6% -5.4% -0.4% -4.8%+25 Basis Points -1.4% -13.5% -1.1% -11.9%+50 Basis Points -2.8% -27.0% -2.2% -23.9%
________________________________1. Spread sensitivity is derived from models that are dependent on inputs and assumptions provided by third parties, assumes there are no changes in interest rates and assumes a static
portfolio. Actual results could differ materially from these estimates.2. Includes the effect of derivatives and other securities used for hedging purposes.
Liquidity Risk
Our liquidity risk principally arises from financing long-term fixed rate assets with shorter-term variable rate borrowings. Future borrowings aredependent upon the willingness of lenders to finance our investments, lender collateral
1
2 2
1,2
42
requirements and the lenders’ determination of the fair value of the securities pledged as collateral, which fluctuates with changes in interest rates andliquidity conditions within the commercial banking and mortgage finance industries.
As of March 31, 2021, we believe that we have sufficient liquidity and capital resources available to execute our business strategy (see Liquidity andCapital Resources in this Form 10-Q for additional details). However, should the value of our collateral or the value of our derivative instruments suddenlydecrease, margin calls relating to our funding liabilities and derivative agreements could increase, causing an adverse change in our liquidityposition. Furthermore, there is no assurance that we will always be able to renew (or roll) our short-term funding liabilities. In addition, our counterpartieshave the option to increase our haircuts (margin requirements) on the assets we pledge against our funding liabilities, thereby reducing the amount that canbe borrowed against an asset even if they agree to renew or roll our funding liabilities. Significantly higher haircuts can reduce our ability to leverage ourportfolio or may even force us to sell assets, especially if correlated with asset price declines or faster prepayment rates on our assets.
Credit Risk
Our credit sensitive investments, such as CRT and non-Agency securities, expose us to the risk of nonpayment of principal, interest or otherremuneration we are contractually entitled to. We are also exposed to credit risk in the event our repurchase agreement counterparties default on theirobligations to resell the underlying collateral back to us at the end of the repo term or in the event our derivative counterparties do not perform under theterms of our derivative agreements.
We accept credit exposure related to our credit sensitive assets at levels we deem prudent within the context of our overall investment strategy. Weattempt to manage this risk through careful asset selection, pre-acquisition due diligence, post-acquisition performance monitoring, and the sale of assetswhere we identify negative credit trends. We may also manage credit risk with credit default swaps or other financial derivatives that we believe areappropriate. Additionally, we may vary the mix of our interest rate and credit sensitive assets or our duration gap to adjust our credit exposure and/orimprove the return profile of our assets, such as when we believe credit performance is inversely correlated with changes in interest rates. Our credit riskrelated to derivative and repurchase agreement transactions is largely mitigated by limiting our counterparties to major financial institutions with acceptablecredit ratings or to registered central clearinghouses and monitoring concentration levels with any one counterparty. We also continuously monitor andadjust the amount of collateral pledged based on changes in market value.
There is no guarantee that our efforts to manage credit risk will be successful and we could suffer losses if credit performance is worse than ourexpectations or our counterparties default on their obligations. Excluding central clearing exchanges, as of March 31, 2021, our maximum amount at riskwith any counterparty related to our repurchase agreements was less than 2% of tangible stockholders' equity and related to our derivative agreements wasless than 1% of tangible stockholders' equity.
Item 4. Controls and Procedures
We maintain disclosure controls and procedures that are designed to ensure that information required to be disclosed in our Exchange Act reports isrecorded, processed, summarized and reported within the time periods specified in the SEC's rules and forms, and that such information is accumulated andcommunicated to our management, including our Chief Executive Officer and Chief Financial Officer, as appropriate, to allow timely decisions regardingrequired disclosure based on the definition of "disclosure controls and procedures" as promulgated under the Exchange Act and the rules and regulationsthereunder. In designing and evaluating the disclosure controls and procedures, management recognized that any controls and procedures, no matter howwell designed and operated, can provide only reasonable assurance of achieving the desired control objectives, and management necessarily was required toapply its judgment in evaluating the cost-benefit relationship of possible controls and procedures.
We, including our Chief Executive Officer and Chief Financial Officer, evaluated the effectiveness of the design and operation of our disclosurecontrols and procedures as of March 31, 2021. Based on the foregoing, our Chief Executive Officer and Chief Financial Officer concluded that ourdisclosure controls and procedures were effective.
Changes in Internal Control over Financial Reporting
There have been no changes in our "internal control over financial reporting" (as defined in Rule 13a-15(f) of the Exchange Act) that occurred duringthe last fiscal quarter that have materially affected, or are reasonably likely to materially affect, our internal control over financial reporting.
43
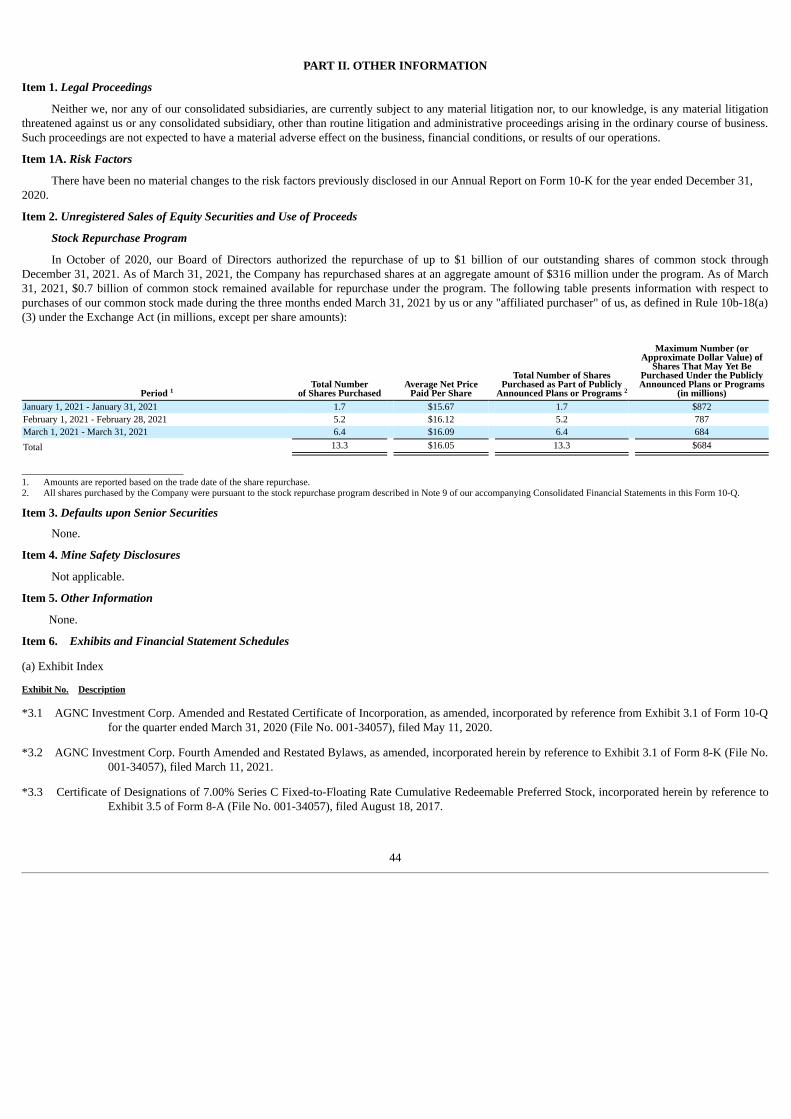
PART II. OTHER INFORMATION
Item 1. Legal Proceedings
Neither we, nor any of our consolidated subsidiaries, are currently subject to any material litigation nor, to our knowledge, is any material litigationthreatened against us or any consolidated subsidiary, other than routine litigation and administrative proceedings arising in the ordinary course of business.Such proceedings are not expected to have a material adverse effect on the business, financial conditions, or results of our operations.
Item 1A. Risk Factors
There have been no material changes to the risk factors previously disclosed in our Annual Report on Form 10-K for the year ended December 31,2020.
Item 2. Unregistered Sales of Equity Securities and Use of Proceeds
Stock Repurchase Program
In October of 2020, our Board of Directors authorized the repurchase of up to $1 billion of our outstanding shares of common stock throughDecember 31, 2021. As of March 31, 2021, the Company has repurchased shares at an aggregate amount of $316 million under the program. As of March31, 2021, $0.7 billion of common stock remained available for repurchase under the program. The following table presents information with respect topurchases of our common stock made during the three months ended March 31, 2021 by us or any "affiliated purchaser" of us, as defined in Rule 10b-18(a)(3) under the Exchange Act (in millions, except per share amounts):
Period Total Number
of Shares PurchasedAverage Net Price
Paid Per Share
Total Number of SharesPurchased as Part of Publicly
Announced Plans or Programs
Maximum Number (orApproximate Dollar Value) of
Shares That May Yet BePurchased Under the PubliclyAnnounced Plans or Programs
(in millions)January 1, 2021 - January 31, 2021 1.7 $15.67 1.7 $872February 1, 2021 - February 28, 2021 5.2 $16.12 5.2 787March 1, 2021 - March 31, 2021 6.4 $16.09 6.4 684Total 13.3 $16.05 13.3 $684
___________________________1. Amounts are reported based on the trade date of the share repurchase.2. All shares purchased by the Company were pursuant to the stock repurchase program described in Note 9 of our accompanying Consolidated Financial Statements in this Form 10-Q.
Item 3. Defaults upon Senior Securities
None.
Item 4. Mine Safety Disclosures
Not applicable.
Item 5. Other Information
None.
Item 6. Exhibits and Financial Statement Schedules
(a) Exhibit Index
Exhibit No. Description
*3.1 AGNC Investment Corp. Amended and Restated Certificate of Incorporation, as amended, incorporated by reference from Exhibit 3.1 of Form 10-Qfor the quarter ended March 31, 2020 (File No. 001-34057), filed May 11, 2020.
*3.2 AGNC Investment Corp. Fourth Amended and Restated Bylaws, as amended, incorporated herein by reference to Exhibit 3.1 of Form 8-K (File No.001-34057), filed March 11, 2021.
*3.3 Certificate of Designations of 7.00% Series C Fixed-to-Floating Rate Cumulative Redeemable Preferred Stock, incorporated herein by reference toExhibit 3.5 of Form 8-A (File No. 001-34057), filed August 18, 2017.
1 2
44
*3.4 Certificate of Elimination of 8.000% Series A Cumulative Redeemable Preferred Stock, incorporated herein by reference to Exhibit 3.1 of Form 8-K(File No 001-34057), filed October 26, 2017.
*3.5 Certificate of Designations of 6.875% Series D Fixed-to-Floating Rate Cumulative Redeemable Preferred Stock, incorporated herein by reference toExhibit 3.5 of Form 8-A (File No 001-34057), filed March 6, 2019.
*3.6 Certificate of Designations of 6.50% Series E Fixed-to-Floating Rate Cumulative Redeemable Preferred Stock, incorporated herein by reference toExhibit 3.6 of Form 8-A (File No 001-34057), filed October 3, 2019.
*3.7 Certificate of Elimination of 7.750% Series B Cumulative Redeemable Preferred Stock, incorporated herein by reference to Exhibit 3.1 of Form 8-K(File No 001-34057), filed December 13, 2019.
*3.8 Certificate of Designations of 6.125% Series F Fixed-to-Floating Rate Cumulative Redeemable Preferred Stock, incorporated herein by reference toExhibit 3.6 of Form 8-A (File No 001-34057), filed February 11, 2020.
*4.1 Instruments defining the rights of holders of securities: See Article IV of our Amended and Restated Certificate of Incorporation, as amended,incorporated herein by reference to Exhibit 3.1 of Form 10-Q for the quarter ended March 31, 2018 (File No. 001-34057) filed May 7,2018.
*4.2 Instruments defining the rights of holders of securities: See Article VI of our Third Amended and Restated Bylaws, as amended, incorporated hereinby reference to Exhibit 3.2 of Form 10-Q for the quarter ended September 30, 2016 (File No. 001-34057) filed November 7, 2016.
*4.3 Form of Certificate for Common Stock, incorporated herein by reference to Exhibit 4.3 of Form 10-Q for the quarter ended September 30, 2016(File No. 001-34057), filed November 7, 2016.
*4.4 Specimen 7.00% Series C Fixed-to-Floating Rate Cumulative Redeemable Preferred Stock Certificate, incorporated herein by reference to Exhibit4.1 of Form 8-A (File No. 001-34057), filed August 18, 2017.
*4.5 Specimen 6.875% Series D Fixed-to-Floating Rate Cumulative Redeemable Preferred Stock Certificate, incorporated herein by reference to Exhibit4.1 of Form 8-A (File No. 001-34057), filed March 6, 2019.
*4.6 Specimen 6.50% Series E Fixed-to-Floating Rate Cumulative Redeemable Preferred Stock Certificate, incorporated herein by reference to Exhibit4.1 of Form 8-A (File No. 001-34057), filed October 3, 2019.
*4.7 Specimen 6.125% Series F Fixed-to-Floating Rate Cumulative Redeemable Preferred Stock Certificate, incorporated herein by reference to Exhibit4.1 of Form 8-A (File No 001-34057), filed February 11, 2020.
*4.8 Deposit Agreement relating to 7.00% Series C Fixed-to-Floating Rate Cumulative Redeemable Preferred Stock, dated August 22, 2017, amongAGNC Investment Corp., Computershare Inc. and Computershare Trust Company, N.A., jointly as depositary, incorporated herein byreference to Exhibit 4.2 of Form 8-K (File No. 001-34057) filed August 22, 2017.
*4.9 Form of Depositary Receipt representing 1/1,000th of a share of 7.00% Series C Fixed-to-Floating Rate Cumulative Redeemable Preferred Stock(included as part of Exhibit 4.8), incorporated herein by reference to Exhibit A of Exhibit 4.2 of Form 8-K (File No. 001-34057) filedAugust 22, 2017.
*4.10 Deposit Agreement relating to 6.875% Series D Fixed-to-Floating Rate Cumulative Redeemable Preferred Stock, dated March 6, 2019, amongAGNC Investment Corp., Computershare Inc. and Computershare Trust Company, N.A., jointly as depositary, incorporated herein byreference to Exhibit 4.2 of Form 8-K (File No. 001-34057) filed March 6, 2019.
*4.11 Form of Depositary Receipt representing 1/1,000th of a share of 6.875% Series D Fixed-to-Floating Rate Cumulative Redeemable Preferred Stock(included as part of Exhibit 4.10), incorporated herein by reference to Exhibit A of Exhibit 4.2 of Form 8-K (File No. 001-34057) filedMarch 6, 2019.
*4.12 Deposit Agreement relating to 6.50% Series E Fixed-to-Floating Rate Cumulative Redeemable Preferred Stock, dated October 3, 2019, amongAGNC Investment Corp., Computershare Inc. and Computershare Trust Company, N.A., jointly as depositary, incorporated herein byreference to Exhibit 4.2 of Form 8-K (File No. 001-34057) filed October 3, 2019.
45

*4.13 Form of Depositary Receipt representing 1/1,000th of a share of 6.50% Series E Fixed-to-Floating Rate Cumulative Redeemable Preferred Stock(included as part of Exhibit 4.12), incorporated herein by reference to Exhibit A of Exhibit 4.2 of Form 8-K (File No. 001-34057) filedOctober 3, 2019.
*4.14 Deposit Agreement relating to 6.125% Series F Fixed-to-Floating Rate Cumulative Redeemable Preferred Stock, dated February 11, 2020, amongAGNC Investment Corp., Computershare Inc. and Computershare Trust Company, N.A., jointly as depositary, incorporated herein byreference to Exhibit 4.1 of Form 8-K (File No. 001-34057) filed February 11, 2020.
*4.15 Form of Depositary Receipt representing 1/1,000th of a share of 6.125% Series F Fixed-to-Floating Rate Cumulative Redeemable Preferred Stock(included as part of Exhibit 4.14), incorporated herein by reference to Exhibit A of Exhibit 4.1 of Form 8-K (File No. 001-34057) filedFebruary 11, 2020.
31.1 Certification of CEO Pursuant to Section 302(a) of the Sarbanes-Oxley Act of 2002.
31.2 Certification of CFO Pursuant to Section 302(a) of the Sarbanes-Oxley Act of 2002.
32 Certification of CEO and CFO Pursuant to Section 906 of the Sarbanes-Oxley Act of 2002.
101.INS** The instance document does not appear in the interactive data file because its XBRL tags are embedded within the inline XBRL document
101.SCH** XBRL Taxonomy Extension Schema Document
101.CAL** XBRL Taxonomy Extension Calculation Linkbase Document
101.LAB** XBRL Taxonomy Extension Labels Linkbase Document
101.PRE** XBRL Taxonomy Extension Presentation Linkbase Document
101.DEF** XBRL Taxonomy Extension Definition Linkbase Document________________________________
* Previously filed** This exhibit is being furnished rather than filed, and shall not be deemed incorporated by reference into any filing, in accordance with Item 601 of
Regulation S-K† Management contract or compensatory plan or arrangement
(b) Exhibits See the exhibits filed herewith. (c) Additional financial statement schedules None.
46

SIGNATURES
Pursuant to the requirements of Section 13 or 15(d) of the Securities Exchange Act of 1934, the Company has duly caused this report to be signed onits behalf by the undersigned, thereunto duly authorized.
AGNC INVESTMENT CORP.By: /s/ GARY D. KAIN
Gary D. KainChief Executive Officer and
Chief Investment Officer (Principal Executive Officer)Date: May 7, 2021
By: /s/ BERNICE E. BELLBernice E. Bell
Senior Vice President and Chief Financial Officer (Principal Financial Officer and Principal Accounting
Officer)Date: May 7, 2021
47
Exhibit 31.1AGNC Investment Corp.
Certification Pursuant to Section 302(a)of the Sarbanes-Oxley Act of 2002
I, Gary D. Kain, certify that:
1. I have reviewed this Quarterly Report on Form 10-Q of AGNC Investment Corp.;
2. Based on my knowledge, this report does not contain any untrue statement of a material fact or omit to state a material fact necessary to make thestatements made, in light of the circumstances under which such statements were made, not misleading with respect to the period covered bythis report;
3. Based on my knowledge, the financial statements, and other financial information included in this report, fairly present in all material respectsthe financial condition, results of operations and cash flows of the registrant as of, and for, the periods presented in this report;
4. The registrant's other certifying officer and I are responsible for establishing and maintaining disclosure controls and procedures (as defined inExchange Act Rules 13a-15(e) and 15d-15(e)) and internal control over financial reporting (as defined in Exchange Act Rules 13a-15(f) and15d-15(f)) for the registrant and have:
(a) Designed such disclosure controls and procedures, or caused such disclosure controls and procedures to be designed under oursupervision, to ensure that material information relating to the registrant, including its consolidated subsidiaries, is made known to us byothers within those entities, particularly during the period in which this report is being prepared;
(b) Designed such internal control over financial reporting, or caused such internal control over financial reporting to be designed under oursupervision, to provide reasonable assurance regarding the reliability of financial reporting and the preparation of financial statementsfor external purposes in accordance with generally accepted accounting principles;
(c) Evaluated the effectiveness of the registrant's disclosure controls and procedures and presented in this report our conclusions about theeffectiveness of the disclosure controls and procedures, as of the end of the period covered by this report based on such evaluation; and
(d) Disclosed in this report any change in the registrant's internal control over financial reporting that occurred during the registrant's mostrecent fiscal quarter (the registrant's fourth fiscal quarter in the case of an Annual Report) that has materially affected, or is reasonablylikely to materially affect, the registrant's internal control over financial reporting; and
5. The registrant's other certifying officer and I have disclosed, based on our most recent evaluation of internal control over financial reporting, tothe registrant's auditors and the audit committee of the registrant's board of directors:
(a) All significant deficiencies and material weaknesses in the design or operation of internal control over financial reporting which arereasonably likely to adversely affect the registrant's ability to record, process, summarize and report financial information; and
(b) Any fraud, whether or not material, that involves management or other employees who have a significant role in the registrant's internalcontrol over financial reporting.
Date: May 7, 2021 /s/ GARY D. KAIN
Gary D. KainChief Executive Officer and Chief InvestmentOfficer (Principal Executive Officer)

Exhibit 31.2AGNC Investment Corp.
Certification Pursuant to Section 302(a)of the Sarbanes-Oxley Act of 2002
I, Bernice E. Bell, certify that:
1. I have reviewed this Quarterly Report on Form 10-Q of AGNC Investment Corp;
2. Based on my knowledge, this report does not contain any untrue statement of a material fact or omit to state a material fact necessary to make thestatements made, in light of the circumstances under which such statements were made, not misleading with respect to the period covered bythis report;
3. Based on my knowledge, the financial statements, and other financial information included in this report, fairly present in all material respectsthe financial condition, results of operations and cash flows of the registrant as of, and for, the periods presented in this report;
4. The registrant's other certifying officer and I are responsible for establishing and maintaining disclosure controls and procedures (as defined inExchange Act Rules 13a-15(e) and 15d-15(e)) and internal control over financial reporting (as defined in Exchange Act Rules 13a-15(f) and15d-15(f)) for the registrant and have:
(a) Designed such disclosure controls and procedures, or caused such disclosure controls and procedures to be designed under oursupervision, to ensure that material information relating to the registrant, including its consolidated subsidiaries, is made known to us byothers within those entitles, particularly during the period in which this report is being prepared;
(b) Designed such internal control over financial reporting, or caused such internal control over financial reporting to be designed under oursupervision, to provide reasonable assurance regarding the reliability of financial reporting and the preparation of financial statementsfor external purposes in accordance with generally accepted accounting principles;
(c) Evaluated the effectiveness of the registrant's disclosure controls and procedures and presented in this report our conclusions about theeffectiveness of the disclosure controls and procedures, as of the end of the period covered by this report based on such evaluation; and
(d) Disclosed in this report any change in the registrant's internal control over financial reporting that occurred during the registrant's mostrecent fiscal quarter (the registrant's fourth fiscal quarter in the case of an Annual Report) that has materially affected, or is reasonablylikely to materially affect, the registrant's internal control over financial reporting; and
5. The registrant's other certifying officer and I have disclosed, based on our most recent evaluation of internal control over financial reporting, tothe registrant's auditors and the audit committee of the registrant's board of directors:
(a) All significant deficiencies and material weakness in the design or operation of internal control over financial reporting which arereasonably likely to adversely affect the registrant's ability to record, process, summarize and report financial information; and
(b) Any fraud, whether or not material, that involves management or other employees who have a significant role in the registrant's internalcontrol over financial reporting.
Date: May 7, 2021 /s/ BERNICE E. BELL
Bernice E. BellSenior Vice President and Chief Financial Officer(Principal Financial Officer)

Exhibit 32
AGNC Investment Corp.Certification of CEO and CFO Pursuant to 18 U.S.C. Section 1350,
as Adopted Pursuant to Section 906 of the Sarbanes-Oxley Act of 2002
We, Gary D. Kain, Chief Executive Officer and Chief Investment Officer, and Bernice E. Bell, Senior Vice President and Chief Financial Officer ofAGNC Investment Corp. (the “Company”), certify pursuant to Section 906 of the Sarbanes-Oxley Act of 2002, 18 U.S.C. Section 1350 that:
1. The Quarterly Report on Form 10-Q of the Company for the quarter ended March 31, 2021 (the “Report”) fully complies with the requirements ofSection 13(a) of the Securities Exchange Act of 1934 (15 U.S.C. 78m); and
2. The information contained in the Report fairly presents, in all material respects, the financial condition and results of operations of the Company.
/s/ GARY D. KAINName: Gary D. KainTitle: Chief Executive Officer and
Chief Investment Officer (Principal Executive Officer)Date: May 7, 2021
/s/ BERNICE E. BELLName: Bernice E. BellTitle: Senior Vice President and
Chief Financial Officer (Principal Financial Officer)Date: May 7, 2021
A signed original of this written statement required by Section 906 has been provided to the Company and will be retained by the Company and furnishedto the Securities and Exchange Commission or its staff upon request.