f g g t v mcgill university
TRANSCRIPT
McGill University
Physics 131
Experiment 2
Measuring the gravitational acceleration, g
#»
F = m #»g g = ∆v∆t
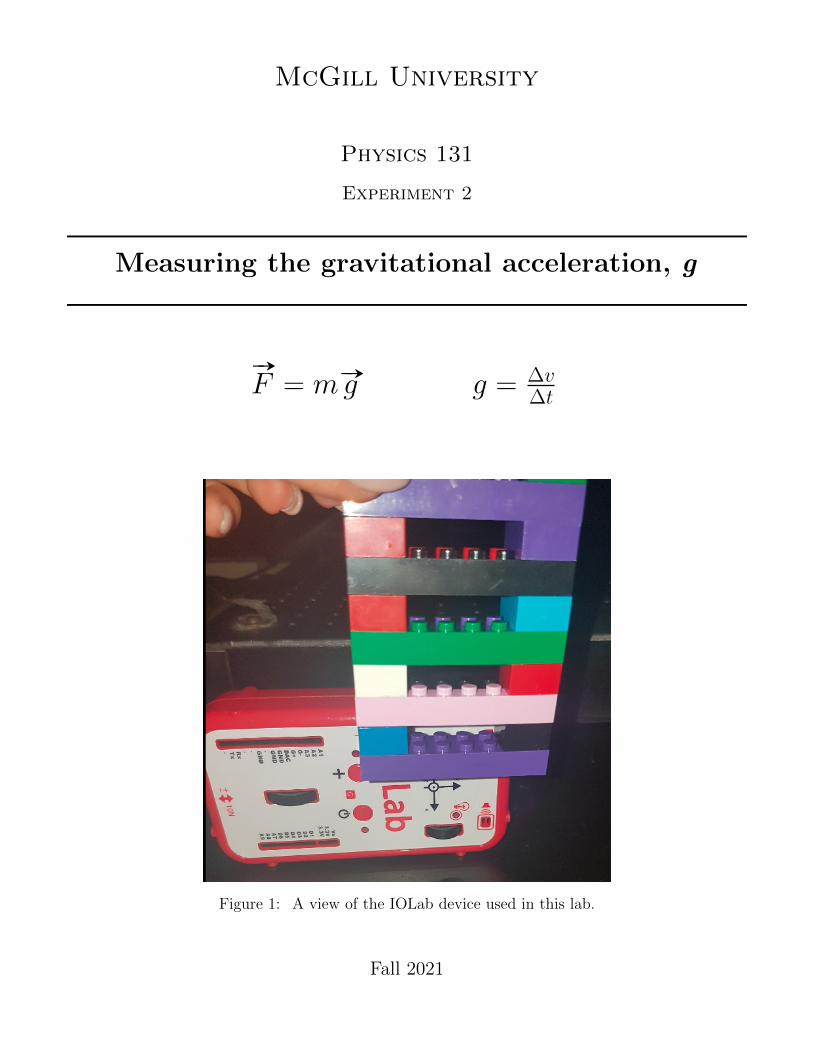
Figure 1: A view of the IOLab device used in this lab.
Fall 2021

Introduction
The gravitational acceleration, g, is the acceleration of an object in free-fall near the surface of theEarth caused by the force of gravitation. Regardless of the mass, the acceleration of the center ofmass of objects in the Earth’s gravitational field near the surface is always the same, as long as airresistance is neglected. The conventional standard value used for g is 9.80655 m/s2.
In this experiment, you will measure the gravitational acceleration g by analyzing the free fall of a‘ladder’ made of Lego blocks. A flashlight and the light sensor on the IOLab device will be used totrack the position of the falling ladder as a function of time. Calculating the change in the speed ofthe ladder will allow you to measure g.
In addition to your measured value of g, you will be estimating its uncertainty. Note that thisuncertainty is not the difference between your value and the known, high-precision (“true”) valueof g = 9.80655 m/s2. The uncertainty we want you to estimate arises from uncertainties on yourmeasured data (distances and times). How precisely can you do? You’ll get a chance to compareyour results to others, at the end of this lab.
Apparatus
• IOLab device (light sensor)
• Lego blocks
• Flashlight
• Ruler
Procedure
1. Using Lego blocks, construct a ladder with equally-spaced steps and a length of your choice,similar to that shown in Figure 2 (left).
2. Measure the separation between the bottom edges of successive ladder steps and estimate theuncertainty on that measurement. Record the step heights (and their uncertainties) in a table.
3. While shining the flashlight on the light sensor, align the bottom of the ladder with the sensor,as shown in Figure 2 (right).
Figure 2: Left : Example of a Lego ladder. Right : The Lego ladder aligned to the IOLab light sensor.
1

4. On the IOLab software, select the light sensor and start recording.
5. Release the ladder and let it fall vertically in front of the IOLab. Note: you may have to repeatsteps 4 and 5 to ensure that the ladder falls vertically, parallel to the IOLab. An acceptabletrial should show relatively similar light intensities between each non-eclipsed part, as shownin Figure 3. Take multiple trials until your data looks similar to Figure 3 with multiple sharp‘transitions’ (shoulders).
6. On the plot showing the light intensity as a function of time produced by the IOLab software,determine the times where the bottom edges of the ladder steps align with the centre of thesensor, as shown in Figure 3. Estimate the uncertainty on these time values. Record the timevalues (and their uncertainties) in your table.
1 2 3 4 5 6
Figure 3: “Eclipses” recorded by the IOLab as the free-falling ruler blocks light from the flashlight.Record the times at the same light intensity value, approximately halfway down the steps, as indicatedby the numbered points (x’s).
7. From your step height (a.k.a. distance) and time measurements, calculate the ladder velocity(and uncertainty) at each time value. Record these in your table.
8. Create a graph of your results: Type “curve.fit” into an internet browser to access the plottingsoftware we would like you to use for this lab. Set the fit type to “Linear” and choose “Table”for the uncertainty (δx and δy) inputs. Enter your time values and uncertainties as x and δx,and your velocity values and uncertainties as y and δy. Enter a graph title and x- and y-axeslabels, and press “Fit” for a fitted curve.
9. Repeat steps 4-8 so that you have a total of at least three trials. Record a separate table andcreate a separate graph for each trial. Include all of your results in your report. (Note: Samplecalculations are only needed for one trial.)
2

Questions
1. Describe qualitatively the light intensity curves you obtained and provide a physical interpre-tation for the changing spacing between the eclipses.
2. How would the light intensity curves change if the ladder does not fall vertically? Reflect onhow this information can be used to produce a better measurement of g.
3. How do you extract the gravitational acceleration g from the linear fit equation (y = mx+ b)?What value and uncertainty of g did you measure for each trial?
4. From your three (or more) measurements, calculate a weighted average of g. Show your calcula-tion in your report. (Refer to Section 3.2 of the “Measurements and Uncertainties” document.)
5. Compare the uncertainty of g for each trial to the uncertainty of the weighted average g. Whatis the purpose of calculating a weighted average?
6. Is your weighted average measurement of g consistent with the local value, 9.8069 m/s2?
7. In what way could you change the experiment in order to improve the precision of your mea-surement of g? Explain how this will help to reduce the uncertainty on g.
One final step
After you have submitted your lab report through Crowdmark, go to the following website:www.physics.mcgill.ca/u0-g-page. Submit your value (and uncertainty) of g at “Submit Value”.
Helpful Information
Summary of content to be included in your report:
1. Screenshots of the IOLab-generated plots of the light intensity for which you have measured g.
2. Tables showing your experimental measurements and calculated results (step heights, timevalues, velocities, and their uncertainties), with sample calculations for all calculated valuesand uncertainties. You should have one table for each trial (at least three).
3. A discussion of the uncertainty estimates. How did you measure uncertainties?
4. Screenshots of the graphs you plotted with curve.fit, along with the residuals, fit parameters,and the χ2
reduced value. You should have one graph for each trial (at least three).
5. Answers to the questions above.
3

Uncertainty Equations:
Rule Mathematical Relation Uncertainty
Addition/Subtraction z = x+ y δz =√δ2x + δ2y
Multiplication with a constant A z = Ax δz = |A|δx
Multiplication (2 independent variables) z = xyδz|z|
=
√(δxx
)2
+
(δyy
)2
Division z =x
y
δz|z|
=
√(δxx
)2
+
(δyy
)2
Power (including square roots) z = xnδz|z|
= |n| δx|x|
Weighted Average zavg =
∑i ziwi∑iwi
, wi =1
δ2iδavg =
1√∑iwi
4