f. department ofcivil engineering, katho/ieke universiteit ... · geo-electrical techniques as a...
TRANSCRIPT

Structural Analysis of Historical Constructions - Modena, Lourenço & Roca (eds) © 2005 Taylor & Francis Group, London, ISBN 04 1536 379 9
Geo-electrical techniques as a non-destructive appliance for restoration purposes
R. Keersmaekers, F. Van Rickstal & D. Van Gemert Department ofCivil Engineering, Katho/ieke Universiteit Leuven, Belgium
ABSTRACT: The use of geo-electrical survey techniques for restoration purposes proved useful as a nondestructive tool for the diagnosis of a deteriorated masonry structure. A short overview of the development of the technique is given, starting with apparent resistivity maps and continuing with the relative difference maps. In the recent past new developments in geophysics were adapted and implemented for the conditions ofmasonry structures. The measurements are carried out to construct a pseudo-section, which is the graphical representation ofthe apparent resistivity values for a 2D-section ofthe wall. Inverse modelling enables to reproduce the resistivity distribution in the masonry structure that matches with the obtained data of apparent resistivity. Two on site measuring campaigns are presented in this paper. Finally, to parallel actual research areas are elucidated. The aim is to combine an automated measuring system with AC-current power supply creating realistic expectations for the on-line validation of mortar injections in the near future.
lNTRODUCTlON
1.1 Importance
Destructive research of materiaIs has important disadvantages in the field of restoration. First of ali, the authenticity of the material is not respected. Secondly, from a scientific point ofview, the information obtained is very locally and therefore not representative for the overall situation of the construction.
Geo-electrical survey of masonry is a suitable nondestructive tool for the diagnosis of a deteriorated structure, for judging the need of restoration, for controlling the efficacy of injections. The limited dimensions of masonry structures, contrary to the situation at soil investigation and the high degree ofheterogeneity complicate the interpretation ofthe measurements.
This paper first briefly formulates the research done in the past in a way that the incorporation ofnew ideas and the results from implemented experiments based in these ideas becomes clear and useful for restoration specialists.
1.2 Measurement principie: Ohm s law
Two current electrodes (CI and C2 in Figs. I & 2) create an electrical field inside the assessed material. Two other probes (PI and P2) measure the resulting potential. Ohrn's law allows calculating the apparent resistivity value Pa.
Dipole - Dipole
C2 a C1 na P1 a P2 • ~ ...... I-----.~ • ~.
k = x n (n + 1) (n + 2) a
Figure I. Dipole-dipole electrode configuration with k the geometrical factor.
In CI PI P2 C2
I J I I
I ao 1 50
Figure 2. Resulting potentiallines in a halfinfinite medium as the result of the injected curren!. Wenner-alfa electrode configuration.
The word "apparent resistivity" is used because this value is the resistivity value that would be measured in case of a perfectly homogeneous material. In reality this is not the case. The underground and the wall both have a heterogeneous resistivity distribution.
Various combinations of current and potential electrodes are applied. For each electrode configuration
343

a different value of the geometrical facto r k gives the relation between the resistivity, the il\iected current and the measured potential difference between P I and P2. Figure I shows the dipole-dipole configuration and its geometrical factor.
2 CURRENT STATE OF TECHNOLOGY
2.1 Relative difference map: filtering of unwanted influences
The history of the development of a specific geoelectrical technique for restoration purposes started with apparent resistivity maps, on which the diagnosis of a deteriorated masonry structure was made.
The problem hereby is that unwanted boundary conditions such as changing moisture content, the presence of soluble sa/ts and geometric boundaries have a big influence on the measurements and are able to completely scatter the interesting information about the present anomalies. The interpretation of the internai state ofthe structure becomes ambiguous.
In the past two doctoral theses were finished at the Reyntjens laboratory dealing with the filtering of the measurements so that only the relevant anomalies in the masonry wall remain (Janssens 1993, Venderickx 2000). Figure 3 shows an example of a relative difference map which prevails the location ofthe anomalies in the wall.
The most disturbing factors are the geometric boundaries, changing moisture content and the presence of soluble salts in the masonry. To exclude the influence of the geometry, the resistivity values are numerically calculated in the presumption that ali material is perfectly homogeneous. The rei ative difference map is then the visual representation of the difference between measured and calculated theoretical resistivity values, relative to the theoretical values.
Only the present anomalies are visualized now. The influence of the changing moisture content is fi ltered out in a similar way.
2.2 Pseudo-section
In the recent past new developments in geophysics within the field of geo-electrical survey of soils, were adapted and implemented for the conditions of masonry structures (Van Rickstal2003, Keersmaekers 2003). The measurements are carried out to construct a pseudo-section, which is the graphical representation of the apparent resistivity values for a 20-section of the masonry wall.
This technique was developed in geo-physics to get an image of the different layers of the underground. A number of electrodes are placed into the ground. Every electrode can be either a current or a potential electrode.
Reslstivity map (Ohmm) ~ Measuring dlstance 0.3 m
Map 01 relative differences (%) Measuring distance 0.3 m lr-r---~~~~~-'
Figure 3. The present anomalies in the masonry of the wall around the park Arenberg (Leuven) are completely lost by the influence ofthe interface between two ditferent kinds of masonry (Ieft). The relevant anomalies c1early show up using the relative difference map (right) (Janssens 1993).
Stalion 32 I I
~' 38 ~' ~ P2 C2 I 311 I
Statioo 18
I
~' 2a ~' ~~ 7 2a ~2 Station1
r--'""-l Cl p , P2 C2 Electrode Number
Laptop Computar
Data 1 2 3 4 5 6 7 8 9 10 11 12 13 14 15 16 17 18 19 20 Levei a a a 0"'1 ,................
0=2 10 . • • • • • • • • • • • • 0::3 32. • • • • • • • • • n::4 43. • • • • • • n=5 51 . • • • n=6 56. •
Figure 4. 2D electrical survey; electrode configuration (array) Wenner-alfa; necessary measurements to build up a pseudo-section of the underground.
The line of electrodes is called the survey line. The further apart the electrodes are positioned, the deeper the measured zone ofthe wall. The measured resistivity value is assigned to a fixed point that depends on the electrode configuration and the electrode spacing. First a series of measurements is made scanning the survey line using a small electrode spacing (n = 1 on Figure 4). Then the electrode spacing is doubled every time the survey line is scanned (n = 2, 3, 4, ... ), thus producing a pseudo-section (Fig. 4).
The general problem of this method is the direct interpretation of the 20 pseudo-section because this section is the result of apparent resistivity values. Therefore, it is not possible to draw conclusions about the real resistivity distribution of the underground (internaI structure of the masonry) based on the measured pseudo-section.
The following example illustrates this. With the Res20mod programme (Geotomo software 2002) a model of a typical historic masonry wall is created (Fig.5b).
The air behind the wall and the cavity in the wall are modeled as high resistivity material. The software is able to calculate the pseudo-section for any electrode configuration. In this example the dipoledipole array is used (Fig. I) with 30 electrodes,
344
9l~"~-''''Ir .. l _d ..... ~ _ '<f'ArI,., 1. 11 .. .
b ,
1Jr'IOIIIK"cdetp.ac..-.gO'O",
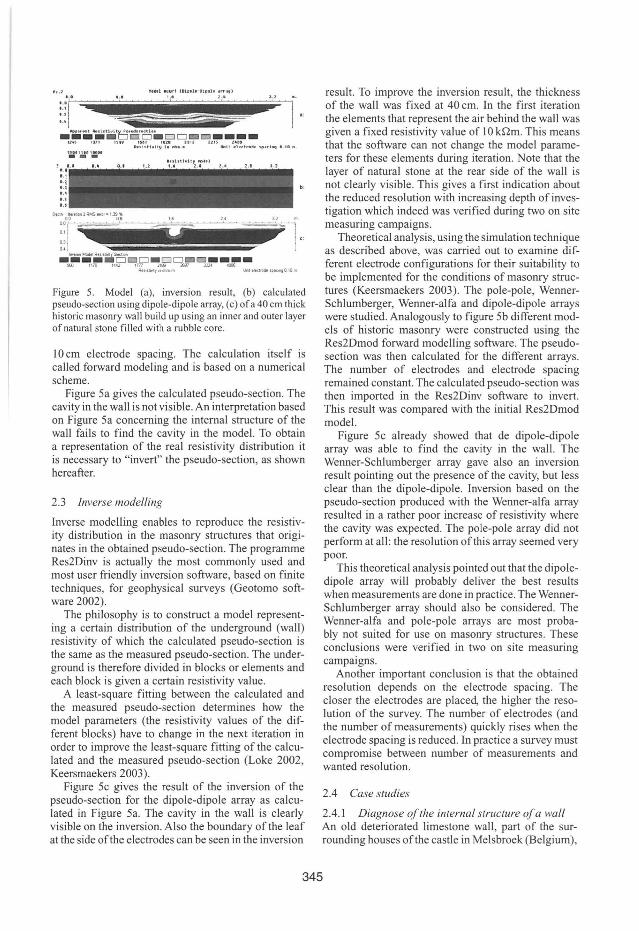
Figure 5. Model (a), inversion result, (b) ealculated pseudo-seetion using dipole-dipole array, (c) of a 40 em thiek historie masonry wall bui ld up using an inner and outer layer of natural stone filled with a rubble core.
10 em eleetrode spaeing. The ealculation itself is ealled forward modeling and is based on a numerieal seheme.
Figure 5a gives the calculated pseudo-seetion. The eavity in the wall is not visible. An interpretation based on Figure 5a eoneerning the internaI structure of the wall fails to find the eavity in the mode!. To obtain a representation of the real resistivity distribution it is neeessary to "invert" the pseudo-seetion, as shown hereafter.
2.3 [nverse modelling
Inverse modelling enables to reproduee the resistivity distribution in the masonry struetures that originates in the obtained pseudo-seetion. The programme Res2Dinv is aetually the most eommonly used and most user friendly inversion software, based on finite teehniques, for geophysieal surveys (Geotomo software 2002).
The philosophy is to eonstruet a model representing a eertain distribution of the underground (wall) resistivity of whieh the ealeulated pseudo-seetion is the same as the measured pseudo-seetion. The underground is therefore divided in bloeks or elements and eaeh bloek is given a certa in resistivity value.
A least-square fitting between the ealculated and the measured pseudo-seetion determines how the model parameters (the resistivity values of the different bloeks) have to ehange in the next iteration in order to improve the least-square fitting of the calculated and the measured pseudo-seetion (Loke 2002, Keersmaekers 2003).
Figure 5e gives the result of the inversion of the pseudo-section for the dipole-dipole array as ealculated in Figure 5a. The eavity in the wall is clearly visible on the inversion. AIso the boundary of the leaf at the side ofthe eleetrodes ean be seen in the inversion
resulto To improve the inversion result, the thiekness of the wall was fixed at 40 em. In the first iteration the elements that represent the air behind the wall was given a fixed resistivity value of 10 kQm. This means that the software ean not ehange the model parameters for these elements during iteration. Note that the layer of natural stone at the rear side of the wall is not clearly visible. This gives a first indieation about the redueed resolution with inereasing depth of investigation whieh indeed was verified during two on site measuring eampaigns.
Theoretieal analysis, using the simulation teehnique as deseribed above, was earried out to examine different eleetrode eonfigurations for their suitability to be implemented for the conditions of masonry struetures (Keersmaekers 2003). The pole-pole, WennerSehlumberger, Wenner-alfa and dipole-dipole arrays were studied. Analogously to figure 5b different modeis of historie masonry were construeted using the Res2Dmod forward modelling software. The pseudoseetion was then ealculated for the different arrays. The number of eleetrodes and eleetrode spaeing remained eonstant. The calculated pseudo-section was then imported in the Res2Dinv software to invert. This result was eompared with the initial Res2Dmod mode!.
Figure 5e already showed that de dipole-dipole array was able to find the eavity in the wal!. The Wenner-Sehlumberger array gave also an inversion result pointing out the presenee of the eavity, but less elear than the dipole-dipole. Inversion based on the pseudo-seetion produeed with the Wenner-alfa array resulted in a rather poor inerease of resistivity where the eavity was expeeted. The pole-pole array did not perform at ali: the resolution ofthis array seemed very poor.
This theoretieal analysis pointed out that the dipoledipole array will probably deliver the best results when measurements are done in practiee. The WennerSehlumberger array should also be considered. The Wenner-alfa and pole-pole arrays are most probably not suited for use on masonry structures. These conelusions were verified in two on site measuring eampaigns.
Another important eonelusion is that the obtained resolution depends on the eleetrode spacing. The closer the electrodes are plaeed, the higher the resolution of the survey. The nurnber of eleetrodes (and the number of measurements) quiekly rises when the eleetrode spaeing is redueed. In praetiee a survey must eompromise between number of measurements and wanted resolution.
2.4 Case studies
2.4.1 Diagnose of the internai structure of a wall An old deteriorated limestone wall , par! of the surrounding houses ofthe eastle in Melsbroek (Belgium),
345
was the subject of a first series of surveys. The aim was the determination of the internai structure of the 40 cm thick wall. Three different arrays were examined: the Wenner-alfa, the Wenner-Schlumberger and the dipole-dipole array. AlI arrays used the same survey line consisting of30 electrodes (steel nails in the joints) with O, I m spacing. The totallength ofthe survey line is2,9m.
The model, constructed for simulation purposes in Figure Sb, is an abstract representation of this limestone wall. The same model was used to compare the surveys and to determine the most convenient measurement configuration.
During the survey, some interesting observations were made:
First, there is the problem ofthe "self-potential" of the wall. This means that when no current is injected in the walI, there is a smalI potential difference measured over the potential electrodes. Subtracting this potential from the potential measured with current injected eliminates its influence. The self-potential can also be excluded by changing the polarity of the injected current. The latter gave better inversion results.
The origin of this phenomenon can be electrostatic charging due to the wind. AIso differences in salt and moisture content can cause small differences in electronegative values resulting in small galvanic cell leading to potential differences measured when no current is injected.
The best known origin for this "self-potential" is de polarisation of the electrodes (se e Dahlin 2000 for a good overall description). This happens when an electrode recently used to inject current, is used to measure potential differences. The interface between the electrode and the wall is charged up when DC-current is injected. The discharge of the electrode can take a few minutes. The effect ofthis discharge can be taken into account by alternating the polarity of the current injected (Fig. 6).
What is measured are the potential differences ti. V I , ti. V 2 , ti. V 3 ... What is necessary to caIculate a proper value of the apparent resistivity are ti. V I - s.p., ti. V 2 - s.p., ti. V 3 - s.p. Mathematical reduction delivers a simple equation for the wanted
6. V(V)
"Sf' Ir-I)ott"ntiõd"
"s-p"
Tnnr (s)
Figure 6. Superposition of potential difference and self-potent ial.
potential difference ti. V. The influence of the sei fpotential is filtered out (Venderickx 2000).
ÔV = M'; - 2.ôV2 + ÔV, 4
(1)
Note that the above equation is only valid when the charge or discharge of the self-potential is linear.
Another problem is the limited current that can be injected. The reason is probably the capacitive action ofthe walI but this phenomenon has to be investigated more detailed. Ifthe voltage over the current electrodes is increased, suddenly the wall reacts as a huge resistivity and the injected current drops to zero. This leads to unnaturally high apparent resistivity values that have a negative effect on the inversion result. Therefore, the current must be evaluated closely when increasing the voltage.
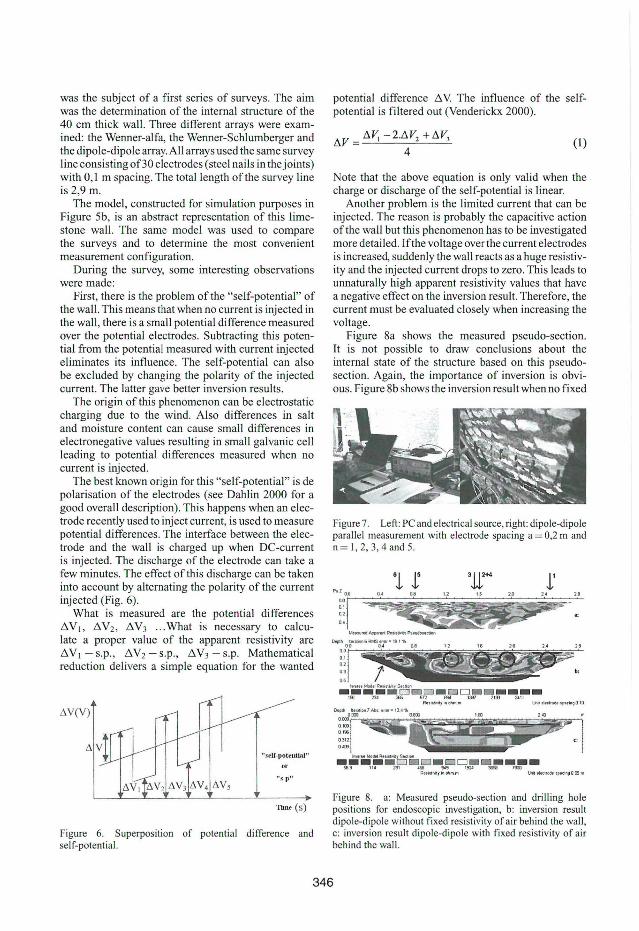
Figure 8a shows the measured pseudo-section. lt is not possible to draw conclusions about the internai state of the structure based on this pseudosection. Again, the importance of inversion is obviouso Figure 8b shows the inversion result when no fixed
Figure 7. Left: PC and electrical source, right: dipole-dipole parallel measurement with electrode spacing a = 0,2 m and n=I , 2,3,4and5.
Figure 8. a: Measured pseudo-section and drilling hole positions for endoscopic investigation, b: inversion result dipole-dipole without fixed resistivity of air behind the wall , c: inversion result dipole-dipole with fixed resistivity of air behind the wall.
346

resistivity region is implemented before inversion. The black tine shows that the dipole-dipole array is able to give a satisfactory idea ofthe thickness ofthe wall. In reatity the wall is indeed 40 cm thick.
The black arrow on Figure 8b indicates that the found thickness ofthe wall decreases in the left zone of the measured region. In reatity, the wall has a constant thickness of 40 cm.
The reason for this is shown in Figure 9. At the rear side ofthe wall a big hole beneath the survey tine leads to an increased resistivity in the inversion result. Due to the fact that the current distribution in the structure is 3D, this geometrical boundary influences the resulto
The high resistivity values of Figure 8b at x-positions 2,0 m and 2,4 m were not verified by endoscopic examination. At x-position 1,2 m and 1,6 m drill holes in the wall showed indeed the presence of cavities that explain the higher resistivity values in the inversion result (Fig. 9 left).
A better result of the inversion was obtained by fixing the resistivity of the area behind the wall (Figure 8c). The influence ofthe hole remains present in the inversion. Nevertheless, endoscopic examination confirmed the inversion result for driltings I to 4. Drilling hole I showed a good consolidated masonry.
Driltings 2 to 41earned that this area is heavily deteriorated resulting in a series of cavities present in the centre ofthe wall (for example Figure 9 left).
The result of the Wenner-alfa and the WennerSchlumberger arrays were rather poor and will not be discussed here. This confirms the theoretical analysis (Keersmaekers 2003).
2.4.2 Handbogenhof Leuven: finding the buttresses ai lhe rear side of a historical rampart
Another measuring campaign was made on the 12th century city wall "Handbogenhof" in Leuven. Figure 10 shows the front side and the rear side of this wall. Also the survey lines are indicated as the red and black lines on the pictures. The aim ofthe experiment was not to determine the inner state ofthe structure, but to find the buttresses at the rear side of the historical rampart.
Two survey tines were measured. The red measurement tine is designed to find the two buttresses in the inversion result. This line has a length of 11,6 m
Figure 9. Left: endoscopy of drilling hole 4, right: the hole under the survey line influences the measurements.
using 30 electrodes with 40 cm spacing. The second survey tine concentrates on one buttress in the middle of the tine. This line has a length of 9,6 m using 25 electrodes with 40-cm spacing. In the latter case the number of measurements is reduced. Simulations as in chapter 3 indicated that the dipole-dipole array would give the best results. Based on the positive practical experience, this array was selected to carry out this experiment. Simulations indicated that an electrode spacing of 40 cm should be sufficient to detect the contours of the wall with a timited number of measurements (Keersmaekers 2003).
The influence of the self-potential is excluded by changing the polarity ofthe injected current. This gave better inversion results compared to subtraction ofthe zero potential. Again, the current was closely monitored to prevent current drop out (capacitive action of the wall) so that normal apparent resistivity values could be measured.
The pseudo-section (Fig. I la) fails to show the buttresses at the rear side of the wall. Inversion is required. Comparing Figures I I b and I I c learns that the method proved capable to indicate the presence of both buttresses (yellow areas of lower resistivity), but their contours do not match perfectly with the real horizontal section ofthe wall (Fig. Ilc).
Two drilling holes were endoscopically examined. As expected, the electrodes were too far apart (40 cm) to get relevant information about the inner state ofthe masonry. For aiming to find the contours of the wall,
Figure 10. Front side (left) and rear side (right) of the city rampart Handbogenhof.
PIZOO
021~~~~~~ 06
" "
M .. ,U/IId~p ... ",R'II!.t"""JP .. udoSle1lOl'l
_ 1:::10 _____ _
, 28B . 75 /'SI 1295 .!.1 R'Slll""'l 111 ohm", J,.2 UnI. Nctrode Ipaung o lO m
180 em 180 em
Figure 11. a: Measured pseudo-section, b: inversion result; both buttresses are found, c: on scale section of the real wall.
347
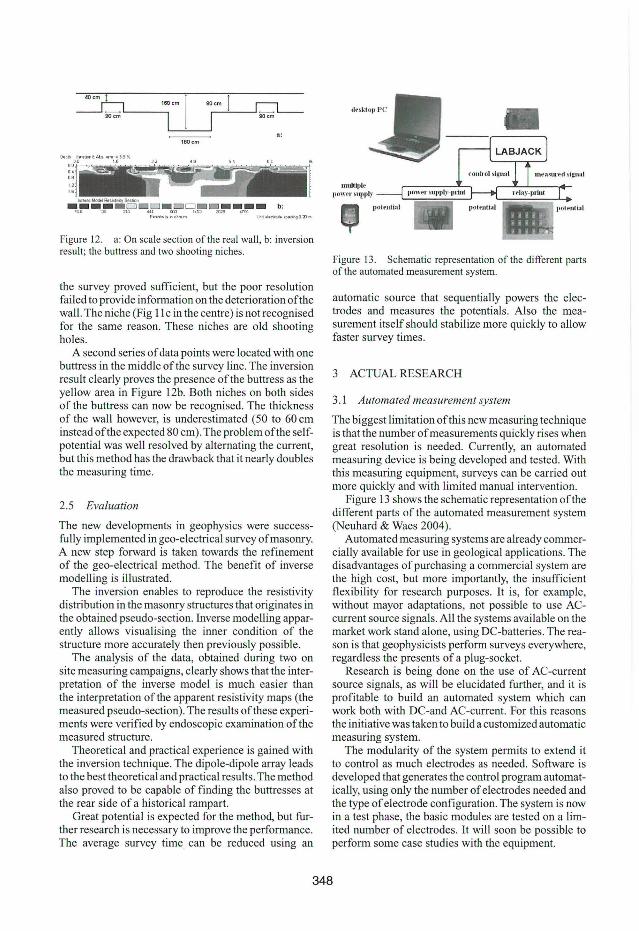
Figure 12. a: On scale section ofthe real wall, b: inversion result; the buttress and two shooting niches.
the survey proved sufficient, but the poor resolution failed to provide information on the deterioration ofthe wall. The niche (Fig II c in lhe centre) is not recognised for the same reason. These niches are old shooting holes.
A second series of data points were located with one buttress in the middle ofthe survey line. The inversion result clearly proves the presence of the buttress as the yellow area in Figure 12b. Both niches on both sides of the buttress can now be recognised. The thickness of the wall however, is underestimated (50 to 60 cm instead ofthe expected 80 cm). The problem ofthe selfpotential was well resolved by alternating the current, but this method has the drawback that it nearly doubles the measuring time.
2.5 Evaluation
The new developments in geophysics were successfully implemented in geo-electrical survey of masonry. A new step forward is taken towards the refinement of the geo-electrical method. The benefit of inverse modelling is illustrated.
The inversion enables to reproduce the resistivity distribution in the masonry structures that originates in the obtained pseudo-section. Inverse modelling apparently allows visualising the inner condition of the structure more accurately then previously possible.
The analysis of the data, obtained during two on site measuring campaigns, clearly shows that the interpretation of the inverse model is much easier than the interpretation ofthe apparent resistivity maps (the measured pseudo-section). The results ofthese experiments were verified by endoscopic examination ofthe measured structure.
Theoretical and practical experience is gained with the inversion technique. The dipole-dipole array leads to the best theoretical and practical results. The method also proved to be capable of finding the buttresses at the rear side of a historical rampart.
Great potential is expected for the method, but further research is necessary to improve the performance. The average survey time can be reduced using an
multiplE'I'0Wf'1' SUPI)I~·
Figure 13. Schematic representation of the different parts ofthe automated measurement system.
automatic source that sequentially powers the electrodes and measures the potentials. AIso the measurement itself should stabilize more quickly to allow faster survey times.
3 ACTUAL RESEARCH
3.1 Automated measurement system
The biggest limitation ofthis new measuring technique is that the number of measurements quickly rises when great resolution is needed. Currently, an automated measuring device is being developed and tested. With this measuring equipment, surveys can be carried out more quickly and with limited manual intervention.
Figure 13 shows the schematic representation ofthe different parts of the automated measurement system (Neuhard & Waes 2004).
Automated measuring systems are already commercially available for use in geological applications. The disadvantages of purchasing a commercial system are the high cost, but more importantly, the insufficient flexibility for research purposes. It is, for example, without mayor adaptations, not possible to use ACcurrent source signals. Ali the systems available on the market work stand alone, using DC-batteries. The reason is that geophysicists perform surveys everywhere, regardless the presents of a plug-socket.
Research is being done on the use of AC-current source signals, as will be elucidated further, and it is profitable to build an automated system which can work both with DC-and AC-current. For this reasons the initiative was taken to build a customized automatic measuring system.
The modularity of the system permits to extend it to control as much electrodes as needed. Software is developed that generates the control program automatically, using only the number of electrodes needed and the type of electrode configuration. The system is now in a test phase, the basic modules are tested on a limited number of electrodes. lt will soon be possible to perform some case studies with the equipment.
348

Figure 14. Masonry wall. The two outside electrodes measure lhe potential difference. The two inner electrodes inject lhe currenl coming from lhe Tesla transformator.
3.2 AC-current
Another problem is that when using the conventional DC-current as power supply, the polarization effect of the electrodes and the capacitive effect of the masonry structure itself, as described before, both contribute to the inaccuracy of the measurement by means of scattering the measurements.
To obtain good data it is necessary to wait until both effects stabilize. This can take a few minutes and extends the survey time considerably. Fundamental research examining AC-current as power supply shows that a measurement immediately stabilizes instead of drifting for a few minutes. The polarisation effect of the electrodes and the capacitive effect of the masonry structure can be diminished using AC-current signals.
First the aim was to find an electrical equivalent scheme of the measuring situation. The Cole-Cole model is frequently used to describe dielectrical phenomena and proved useful in geophysical situations (Cole & Cole 1941 , Oldenburg & Li 1994, Oldenburg & Yuval 1997, Pelton et aI. 1978, Welter et aI. 1996).
The validity of this Cole-Cole model for geoelectrical measurements on masonry structures is not proven yet, but some interesting results were already made. A masonry wall was build for use in laboratory circumstances. A special transformer, called a Tesla-transformer, was used to generate a high frequent power signal with high amplitude (several kV at a frequency of 240 kHz).
Figure 14 shows the masonry wall. Figure 15 clearly shows that the applied voltage (5 kV peak-to-peak) and the resulting current are shifted for 90°. It was unsuspected that the wall reacts as a perfect AC-capacitance when high frequency current is applied. The equivalent scheme certainly has to take this into account. This phenomenon was not yet recorded for masonry structures. More research is necessary in this field.
Figure 15. Waveforms of lhe differenl signals visualized with an oscilloscope.
Promising is that, during the experiments, it was observed that the problem of self-potential due to polarisation of the electrodes, was not detected. This polarisation presents itself as a DC-offset on the measured potential, but is eliminated when measurements are made with anAC-voltage meter (Verboomen 2004).
4 CONCLUSIONS
The use of geo-electrical survey techniques is a widely known tool in subsoil investigations. In the field of restoration the technique has been proved useful as a suitable non-destructive tool for the diagnosis of a deteriorated masonry structure. The technique was found suitable for judging the need of restoration and for controlling the efficacy of injections.
The history of the development of a specific geoelectrical technique for restoration purposes started with apparent resistivity maps, on which the diagnosis of a deteriorated masonry structure was made. The problem hereby is that unwanted boundary conditions such as changing moisture content, the presence of soluble salts and geometric boundaries have a big influence on the measurements and are able to completely scatter the interesting information about the present anomalies. Further research made it possible to improve the interpretation of the measurements using relative difference maps to exclude the influence of geometric boundaries .
In the recent past new developments in geophysics within the field of geo-electrical survey of soils, were adapted and implemented for the conditions of masonry structures. The measurements are carried out to construct a pseudo-section, which is the graphical representation of the apparent resistivity values for a 2D-section of the masonry wall.
Inverse modelling enables to reproduce the resistivity distribution in the masonry Structure that matches
349

with the obtained data of apparent resistivity (pseudosection). Inverse modelling apparently allows visualising the inner condition ofthe structure more accurately then previously possible. The analysis of the data, obtained during two on site measuring campaigns, c1early shows that the interpretation of the inverse model is many times easier than the interpretation of the apparent resistivity maps (the measured pseudosection). The results ofthese experiments were verified by endoscopic survey of the measured structure.
The biggest limitation of this new measuring technique is that the number of measurements quickly rises when great resolution is needed. Currently, an automated measuring device is being developed and tested. With this measuring equipment surveys can be carried out more quickly and with limited manual intervention.
Another problem using the conventional DCcurrent as power supply is the polarisation effect of the electrodes and the capacitive effect ofthe masonry structure itself, both contributing to the inaccuracy of the measurement. To obtain good data it is necessary to wait until both effects stabilize. This can take a few minutes and extends the survey time considerably. Fundamental research examining AC-current as power supply shows that a measurement immediately stabilizes in stead of drifting for a few minutes. The polarisation effect of the electrodes and the capacitive effect ofthe masonry structure can be diminished using AC-current signals.
Combining the automated measuring system with AC-current power supply creates realistic expectations for the on-line validation of mortar injections in the near future.
REFERENCES
Cole, K.S. & Cole, R.H. 1941. Dispersion and absorption in dielectrics. L alternating current fie ld. Journal of Chemical Physics I, p 341- 351 , 1941.
Dahlin, T. 2000. Short note on electrode charge-up effects in DC resistivity data acqu isition using multi -electrode arrays. Geophysical Prospecting, 48, p 181 ± 187.
Geotomo software, 2002. Guide of the software Res2Dmod and Res2Dinv version 3.5. Download from http://www.geoelectrical. coml
Janssens, H. 1993. Geo-elektrische controle van consolidatieinjecties bij metselwerk, Ph.D. Thesis, KULeuven, Department of Civil Engineering.
Keersmaekers, R. 2003. De geo-elektrische methode toegepast op metselwerk-structuren: implementatie van recente ontwikkelingen. Masterthesis, KULeuven, Department ofCivil Engineering.
Loke, M.H. 2002 Tutorial: 2D and 3D electrical imaging surveys. Download from http://www.geoelectrical.coml
Neuhard, J. & Waes, T. 2004. Geo-Electrical Measuring Module. Masterthesis, ACE-GROEPT Polytechnic academy, Departrnent of automatisation.
Oldenburg, D. W & Li, Y. 1994. Inversion of induced polarization data. Geophysics, 59, 1994, P 1327- 1341.
Oldenburg, D.W & Yuval. 1997. Computation of ColeCole parameters from IP data. Geophysics, 62, 1997, P 436--448.
Pelton, WH. et a!. 1978. Mineral discrimination and removal of inductive coupling from multifrequency IP Geophysics Vo143, 1978, p 588-609.
Van Rickstal , F.; Keersmaekers, R. & Van Gemert, D. 2003. Geo-electrical investigation of masonry walls: developments and case studies. Department ofCivi l Engineering, KULeuven, Belgium. Paper presented at the 6th meeting of the Materiais Science and Restoration Society - Sept. 2003, Karlsruhe, Germany.
Van Rickstal, F. & Vanhellemont, Y. 2002 . Niet-destructief opzoeken van scheuren in metselwerk en pleisters. Technieken en case studies. WTA, NLIVL, Seminar, Sint-Truiden, ed. D. Van Gemert, KULeuven.
Venderickx, K. 2000. Evaluatie van geo-elektrische metingen op metselwerkstructuren. Ph.D. Thesis, KULeuven, Department ofCivi l Engineering.
Verboomen, J. 2004. gedetailleerde studie van de Teslatransformator: Optimalisatie en Toepassingen. Masterthesis , KULeuven, Department ofElectrical Engineering.
Welter, A.; Seichter, M. & Kampe, A. 1996. InducedPolarization modelling using comp1ex electrical conductivities. Geophysical Journal International, 127, p 387- 398.
350