f-cdm-mr monitoring report form (version 0 3 .1 )
TRANSCRIPT

F-CDM-MR
Version 03.1 Page 1 of 13
Monitoring report form
(Version 03.1)
Monitoring report
Title of the project activity Akbük Wind Farm Project - Turkey
Reference number of the project activity GS 436
Version number of the monitoring report 3.0
Completion date of the monitoring report 19/07/2013
Registration date of the project activity 17/03/2009
Monitoring period number and duration of this
monitoring period
Fourth monitoring period 01/01/2012-31/12/2012 (first and last days included)
Project participant(s) Ayen Enerji A.S.
Host Party(ies) Turkey
Sectoral scope(s) and applied methodology(ies) Sectoral scope 1 ACM0002 “Consolidated baseline methodology for grid connected electricity generation from renewable sources” version 7
Estimated amount of GHG emission reductions
or net anthropogenic GHG removals by sinks for
this monitoring period in the registered PDD
67,570 tCO2e
Actual GHG emission reductions or net
anthropogenic GHG removals by sinks achieved
in this monitoring period
65,266 tCO2e

F-CDM-MR
Version 03.1 Page 2 of 13
SECTION A. Description of project activity
A.1. Purpose and general description of project activity
>>
1. Purpose of the project activity and the measures taken to reduce greenhouse gas emissions:
The Akbük Wind Farm Project involves a 31.5 MW onshore wind farm in the region of Aydın Province, Didim District in Turkey. The generated electricity is delivered to the Turkish national grid, and it reduced therefore the greenhouse gases emissions that would have else happened through the operation of the existing and new Turkish grid connected power plants (as described in the ex-ante calculation of emission factor of the grid).
2. Description of the installed technology and equipments: The Project comprises 15 turbines of 2.1 MW each and a high voltage transmission line between the project area and the national grid. Wind turbines The selected wind turbines are SUZLON S88 model turbines with 2.1 MW capacity each. Technical description of turbines is presented in more detail in table 1 below. Table 1: Technical details of SUZLON wind turbines
1
Model of
turbine
Rated
power [kW]
Number of
blades
Rotor
diameter
[m]
Rotor
swept area
[m2]
Hub height
[m]
S88 2100 3 Horizontal
axis
88 6082 79
Turbines have been transported from India to the project site. However, the other components (such as transformers, switchboards, substation components, cabling) have been supplied from local manufacturers. Grid connection The proposed project activity further involves the development of a connection to the national grid. The grid connection consists of 2.7 km transmission line. The sub transformer station at the project area, is connected to the 154 kV HV national grid from Akbük transformer station.
3. Relevant dates for the project activity (e.g. construction, commissioning, continued operation periods, etc.):
30.06.2008: start of construction 19.03.2009: commissioning of phase 1 (first 8 turbines) 03.04.2009: commissioning of phase 2 (remaining 7 turbines)
4. Total emission reductions achieved in this monitoring period: A net electricity of 101,345 MWh is produced by the project activity in the current monitoring period and it is delivered to the national grid. The corresponding emission reductions are calculated as 65,266 tCO2-eq.
1 Reference: www.suzlon.com

F-CDM-MR
Version 03.1 Page 3 of 13
A.2. Location of project activity
>> The Akbük Wind Farm Project is located in Aydın Province, Didim District. The project area is 30 km away from the Didim District centre. The closest residential area is 2.5 km away from the project location where several summer houses are located. The project area is not favourable for agricultural use and there are no private owned lands within the project boundary.
Figure 1. General map of Turkey and identification of the project area
Figure 2. Map of Didim District and the project location (37026’53.70” E / 27023’53.95” N)
A.3. Parties and project participant(s)
Party involved
((host) indicates
a host Party)
Private and/or public
entity(ies) project
participants
(as applicable)
Indicate if the Party involved
wishes to be considered as
project participant
(Yes/No)
Turkey (Host Country) Ayen Enerji A.S. No
F-CDM-MR
Version 03.1 Page 4 of 13
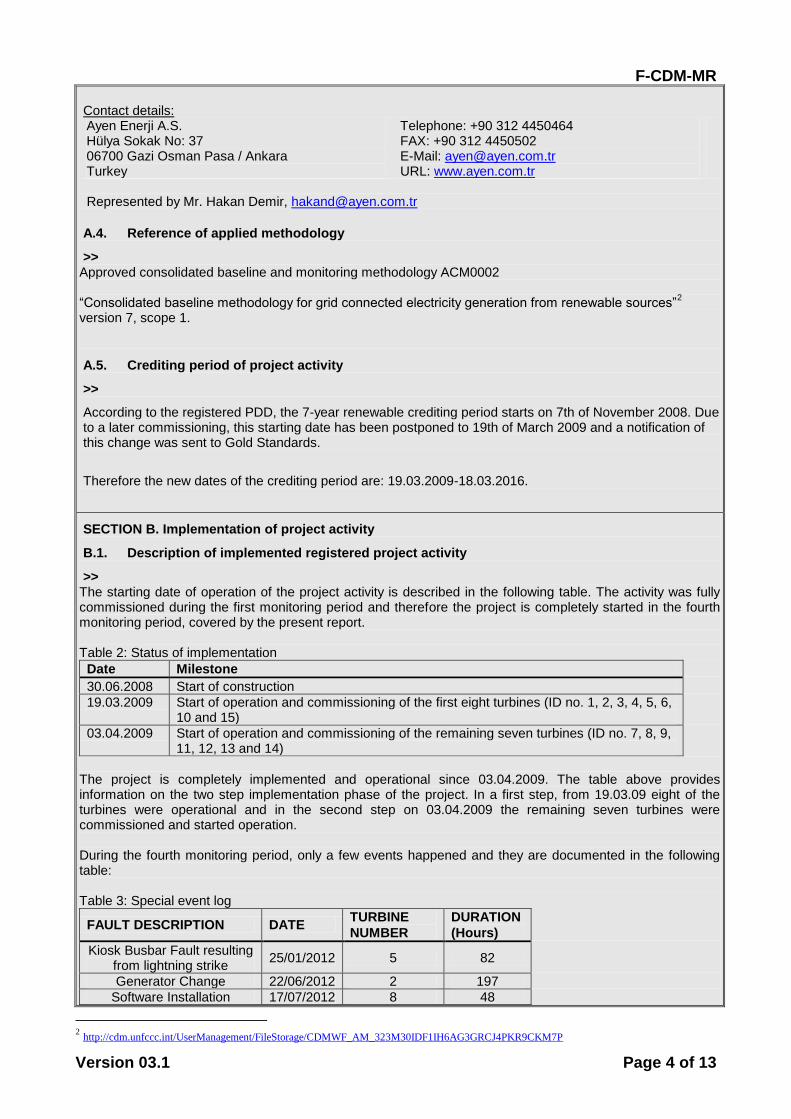
Contact details: Ayen Enerji A.S. Hülya Sokak No: 37 06700 Gazi Osman Pasa / Ankara Turkey
Telephone: +90 312 4450464 FAX: +90 312 4450502 E-Mail: [email protected] URL: www.ayen.com.tr
Represented by Mr. Hakan Demir, [email protected]
A.4. Reference of applied methodology
>> Approved consolidated baseline and monitoring methodology ACM0002 “Consolidated baseline methodology for grid connected electricity generation from renewable sources”
2
version 7, scope 1.
A.5. Crediting period of project activity
>>
According to the registered PDD, the 7-year renewable crediting period starts on 7th of November 2008. Due to a later commissioning, this starting date has been postponed to 19th of March 2009 and a notification of this change was sent to Gold Standards.
Therefore the new dates of the crediting period are: 19.03.2009-18.03.2016.
SECTION B. Implementation of project activity
B.1. Description of implemented registered project activity
>> The starting date of operation of the project activity is described in the following table. The activity was fully commissioned during the first monitoring period and therefore the project is completely started in the fourth monitoring period, covered by the present report. Table 2: Status of implementation
Date Milestone
30.06.2008 Start of construction
19.03.2009 Start of operation and commissioning of the first eight turbines (ID no. 1, 2, 3, 4, 5, 6, 10 and 15)
03.04.2009 Start of operation and commissioning of the remaining seven turbines (ID no. 7, 8, 9, 11, 12, 13 and 14)
The project is completely implemented and operational since 03.04.2009. The table above provides information on the two step implementation phase of the project. In a first step, from 19.03.09 eight of the turbines were operational and in the second step on 03.04.2009 the remaining seven turbines were commissioned and started operation. During the fourth monitoring period, only a few events happened and they are documented in the following table: Table 3: Special event log
FAULT DESCRIPTION DATE TURBINE
NUMBER
DURATION
(Hours)
Kiosk Busbar Fault resulting from lightning strike
25/01/2012 5 82
Generator Change 22/06/2012 2 197
Software Installation 17/07/2012 8 48
2 http://cdm.unfccc.int/UserManagement/FileStorage/CDMWF_AM_323M30IDF1IH6AG3GRCJ4PKR9CKM7P

F-CDM-MR
Version 03.1 Page 5 of 13
These events do not impact the applicability of the methodology. These situations were addressed according to the internal operational procedures.
B.2. Post registration changes
B.2.1. Temporary deviations from registered monitoring plan or applied methodology
>>
Not applicable
B.2.2. Corrections
>>
Not applicable
B.2.3. Permanent changes from registered monitoring plan or applied methodology
>>
Not applicable
B.2.4. Changes to project design of registered project activity
>>
Not applicable
B.2.5. Changes to start date of crediting period
>>
According to the registered PDD, the 7-year renewable crediting period starts on 7th of November 2008. Due to a later commissioning, this starting date has been postponed to 19th of March 2009 and a notification of this change was sent to Gold Standards.
Therefore the new dates of the crediting period are: 19.03.2009-18.03.2016.
B.2.6. Types of changes specific to afforestation or reforestation project activity
>>
Not applicable
SECTION C. Description of monitoring system
>>
Data processing and archiving: The data processing and archiving was performed in accordance with the PDD. The collected data will be archived for at least two years after the last issuance of VER credits in the crediting period. The officials from TEIAŞ performed monthly the measurements for both the primary and secondary device, under the control of the plant personnel of Ayen. A reading protocol was signed by both parties. An invoice (receipt of sale) is prepared by Ayen and delivered to TEIAŞ.
Metering: The delivered electricity is being metered at 154 kV high voltage side of the step up transformer (154/34,5kV) installed at the project site. The meters measure the net electricity delivered to the grid, which is
F-CDM-MR
Version 03.1 Page 6 of 13
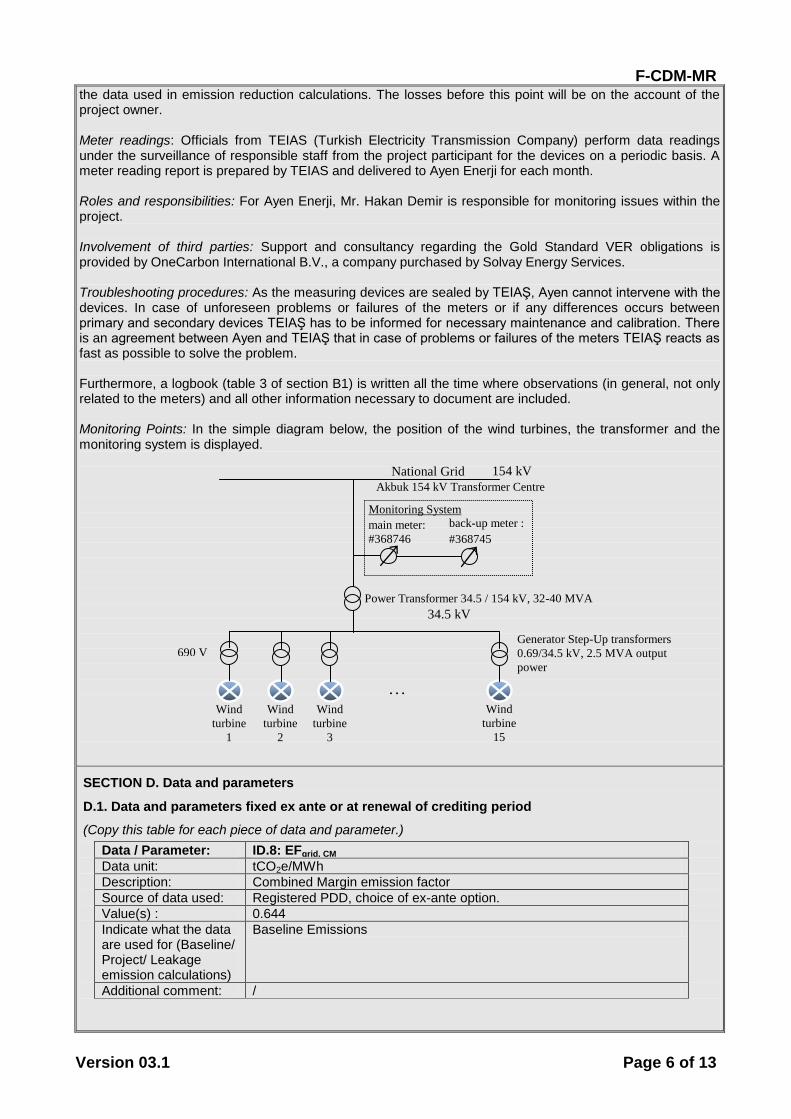
the data used in emission reduction calculations. The losses before this point will be on the account of the project owner. Meter readings: Officials from TEIAS (Turkish Electricity Transmission Company) perform data readings under the surveillance of responsible staff from the project participant for the devices on a periodic basis. A meter reading report is prepared by TEIAS and delivered to Ayen Enerji for each month. Roles and responsibilities: For Ayen Enerji, Mr. Hakan Demir is responsible for monitoring issues within the project. Involvement of third parties: Support and consultancy regarding the Gold Standard VER obligations is provided by OneCarbon International B.V., a company purchased by Solvay Energy Services. Troubleshooting procedures: As the measuring devices are sealed by TEIAŞ, Ayen cannot intervene with the devices. In case of unforeseen problems or failures of the meters or if any differences occurs between primary and secondary devices TEIAŞ has to be informed for necessary maintenance and calibration. There is an agreement between Ayen and TEIAŞ that in case of problems or failures of the meters TEIAŞ reacts as fast as possible to solve the problem. Furthermore, a logbook (table 3 of section B1) is written all the time where observations (in general, not only related to the meters) and all other information necessary to document are included. Monitoring Points: In the simple diagram below, the position of the wind turbines, the transformer and the monitoring system is displayed.
SECTION D. Data and parameters
D.1. Data and parameters fixed ex ante or at renewal of crediting period
(Copy this table for each piece of data and parameter.)
Data / Parameter: ID.8: EFgrid, CM
Data unit: tCO2e/MWh
Description: Combined Margin emission factor
Source of data used: Registered PDD, choice of ex-ante option.
Value(s) : 0.644
Indicate what the data are used for (Baseline/ Project/ Leakage emission calculations)
Baseline Emissions
Additional comment: /
690 V
34.5 kV
Monitoring System
main meter:
#368746 back-up meter :
#368745
National Grid 154 kV
Wind
turbine
1
Wind
turbine
2
Wind
turbine
3
Wind
turbine
15
Generator Step-Up transformers
0.69/34.5 kV, 2.5 MVA output
power
. . .
Power Transformer 34.5 / 154 kV, 32-40 MVA
Akbuk 154 kV Transformer Centre
F-CDM-MR
Version 03.1 Page 7 of 13
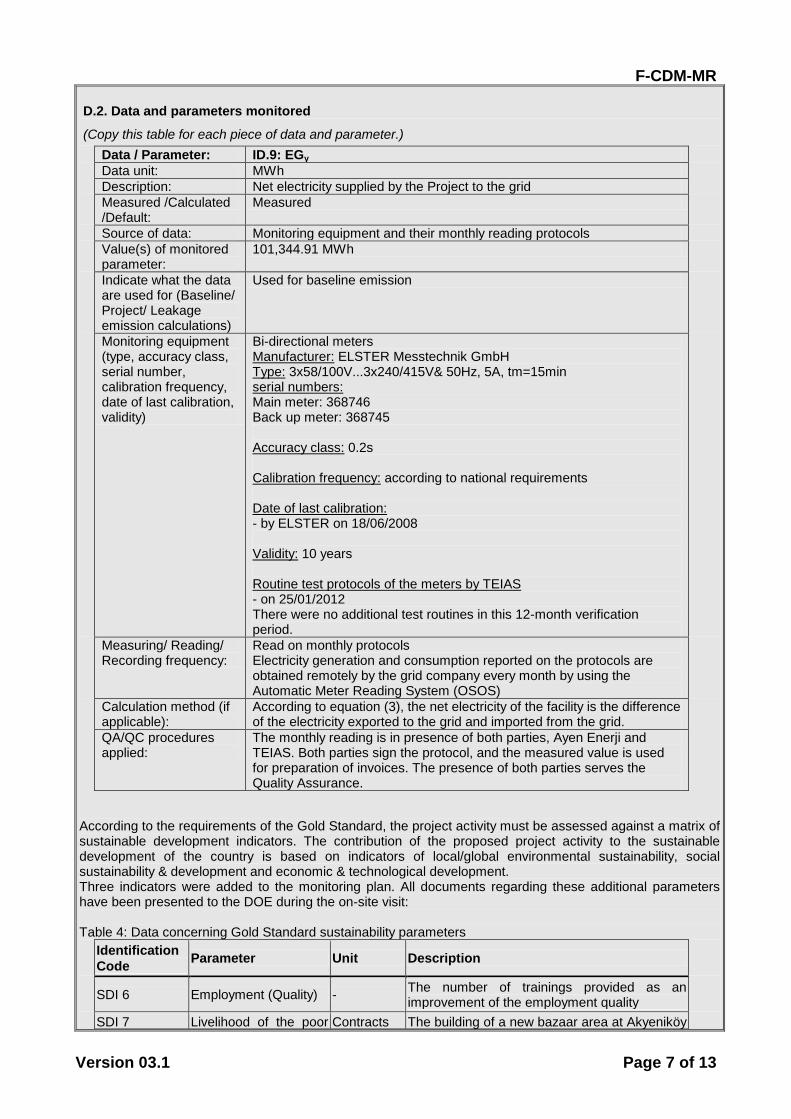
D.2. Data and parameters monitored
(Copy this table for each piece of data and parameter.)
Data / Parameter: ID.9: EGy
Data unit: MWh
Description: Net electricity supplied by the Project to the grid
Measured /Calculated /Default:
Measured
Source of data: Monitoring equipment and their monthly reading protocols
Value(s) of monitored parameter:
101,344.91 MWh
Indicate what the data are used for (Baseline/ Project/ Leakage emission calculations)
Used for baseline emission
Monitoring equipment (type, accuracy class, serial number, calibration frequency, date of last calibration, validity)
Bi-directional meters Manufacturer: ELSTER Messtechnik GmbH Type: 3x58/100V...3x240/415V& 50Hz, 5A, tm=15min serial numbers: Main meter: 368746 Back up meter: 368745 Accuracy class: 0.2s Calibration frequency: according to national requirements Date of last calibration: - by ELSTER on 18/06/2008 Validity: 10 years Routine test protocols of the meters by TEIAS - on 25/01/2012 There were no additional test routines in this 12-month verification period.
Measuring/ Reading/ Recording frequency:
Read on monthly protocols Electricity generation and consumption reported on the protocols are obtained remotely by the grid company every month by using the Automatic Meter Reading System (OSOS)
Calculation method (if applicable):
According to equation (3), the net electricity of the facility is the difference of the electricity exported to the grid and imported from the grid.
QA/QC procedures applied:
The monthly reading is in presence of both parties, Ayen Enerji and TEIAS. Both parties sign the protocol, and the measured value is used for preparation of invoices. The presence of both parties serves the Quality Assurance.
According to the requirements of the Gold Standard, the project activity must be assessed against a matrix of sustainable development indicators. The contribution of the proposed project activity to the sustainable development of the country is based on indicators of local/global environmental sustainability, social sustainability & development and economic & technological development. Three indicators were added to the monitoring plan. All documents regarding these additional parameters have been presented to the DOE during the on-site visit: Table 4: Data concerning Gold Standard sustainability parameters
Identification
Code Parameter Unit Description
SDI 6 Employment (Quality) - The number of trainings provided as an improvement of the employment quality
SDI 7 Livelihood of the poor Contracts The building of a new bazaar area at Akyeniköy
F-CDM-MR
Version 03.1 Page 8 of 13
(Access to essential services)
is a measure to improve the livelihood of the poor
SDI 10 Employment (Numbers)
Contracts Jobs are created due to the project activity
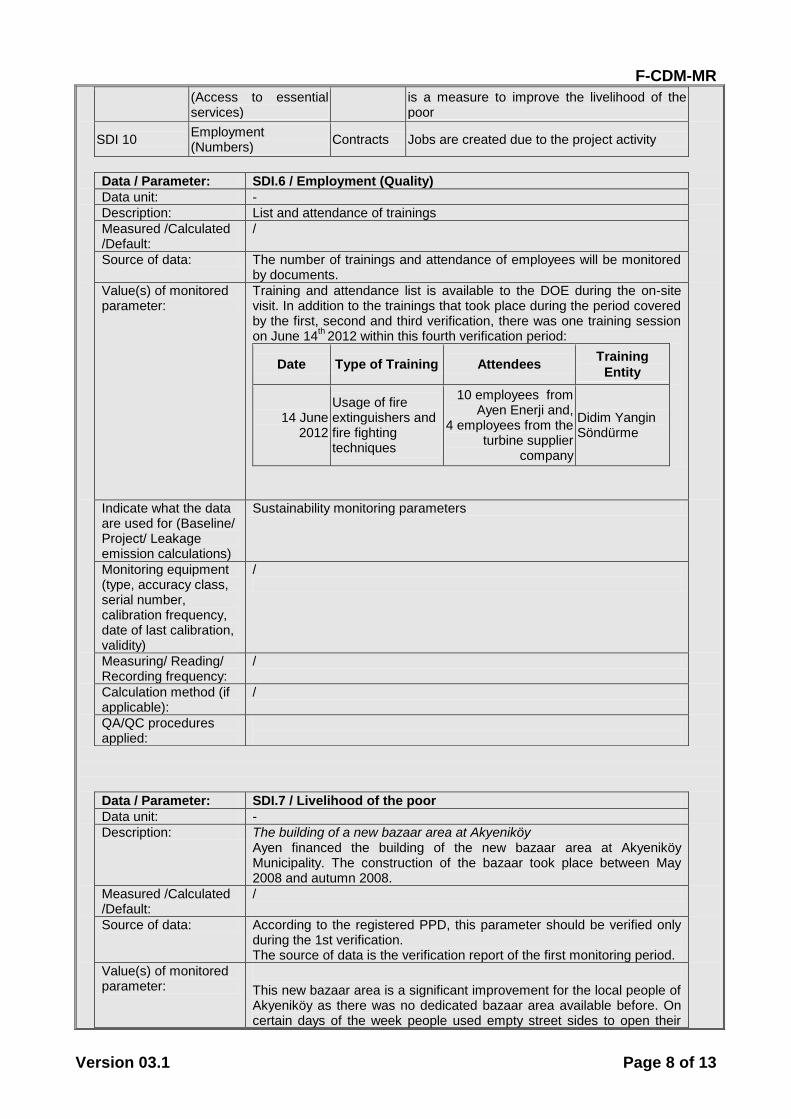
Data / Parameter: SDI.6 / Employment (Quality)
Data unit: -
Description: List and attendance of trainings
Measured /Calculated /Default:
/
Source of data: The number of trainings and attendance of employees will be monitored by documents.
Value(s) of monitored parameter:
Training and attendance list is available to the DOE during the on-site visit. In addition to the trainings that took place during the period covered by the first, second and third verification, there was one training session on June 14
th 2012 within this fourth verification period:
Date Type of Training Attendees Training
Entity
14 June 2012
Usage of fire extinguishers and fire fighting techniques
10 employees from Ayen Enerji and,
4 employees from the turbine supplier
company
Didim Yangin Söndürme
Indicate what the data are used for (Baseline/ Project/ Leakage emission calculations)
Sustainability monitoring parameters
Monitoring equipment (type, accuracy class, serial number, calibration frequency, date of last calibration, validity)
/
Measuring/ Reading/ Recording frequency:
/
Calculation method (if applicable):
/
QA/QC procedures applied:
Data / Parameter: SDI.7 / Livelihood of the poor
Data unit: -
Description: The building of a new bazaar area at Akyeniköy Ayen financed the building of the new bazaar area at Akyeniköy Municipality. The construction of the bazaar took place between May 2008 and autumn 2008.
Measured /Calculated /Default:
/
Source of data: According to the registered PPD, this parameter should be verified only during the 1st verification. The source of data is the verification report of the first monitoring period.
Value(s) of monitored parameter:
This new bazaar area is a significant improvement for the local people of Akyeniköy as there was no dedicated bazaar area available before. On certain days of the week people used empty street sides to open their

F-CDM-MR
Version 03.1 Page 9 of 13
stalls. Only after the construction of the bazaar area the Akyeniköy community is in possession of an area for trading, which is a contribution to the livelihood of the poor.
Figure 3. The bazaar at Akyeniköy
Indicate what the data are used for (Baseline/ Project/ Leakage emission calculations)
Sustainability monitoring parameters
Monitoring equipment (type, accuracy class, serial number, calibration frequency, date of last calibration, validity)
/
Measuring/ Reading/ Recording frequency:
/
Calculation method (if applicable):
/
QA/QC procedures applied:
Data / Parameter: SDI.10 / Employment (quantity)
Data unit: -
Description: Number of jobs created
Measured /Calculated /Default:
/
Source of data: The monthly salary payment sheet or the web portal of the Social Security Institution SSK.
Value(s) of monitored parameter:
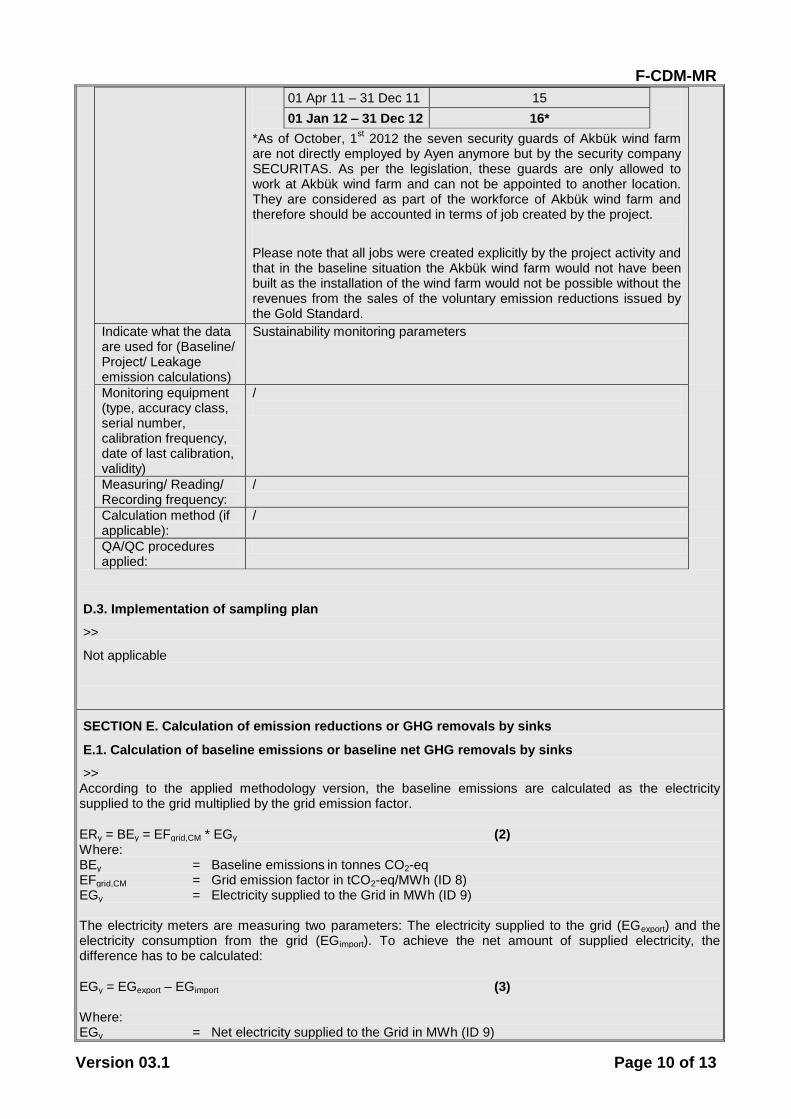
Ayen established work for currently 16 employees; one engineer in charge, one personnel manager, six technicians serving as operators, one driver and seven security guards. The project employs in particular local employees and contributes therefore to sustainable development as nine local people are employed in the project.
Period Number of people employed by the project in specific period, as at the end of the monitoring period:
19 Mar 09 – 31 Mar 10 17
01 Apr 10 – 31 Mar 11 18
F-CDM-MR
Version 03.1 Page 10 of 13
01 Apr 11 – 31 Dec 11 15
01 Jan 12 – 31 Dec 12 16*
*As of October, 1st 2012 the seven security guards of Akbük wind farm
are not directly employed by Ayen anymore but by the security company SECURITAS. As per the legislation, these guards are only allowed to work at Akbük wind farm and can not be appointed to another location. They are considered as part of the workforce of Akbük wind farm and therefore should be accounted in terms of job created by the project.
Please note that all jobs were created explicitly by the project activity and that in the baseline situation the Akbük wind farm would not have been built as the installation of the wind farm would not be possible without the revenues from the sales of the voluntary emission reductions issued by the Gold Standard.
Indicate what the data are used for (Baseline/ Project/ Leakage emission calculations)
Sustainability monitoring parameters
Monitoring equipment (type, accuracy class, serial number, calibration frequency, date of last calibration, validity)
/
Measuring/ Reading/ Recording frequency:
/
Calculation method (if applicable):
/
QA/QC procedures applied:
D.3. Implementation of sampling plan
>>
Not applicable
SECTION E. Calculation of emission reductions or GHG removals by sinks
E.1. Calculation of baseline emissions or baseline net GHG removals by sinks
>> According to the applied methodology version, the baseline emissions are calculated as the electricity supplied to the grid multiplied by the grid emission factor.
ERy = BEy = EFgrid,CM * EGy (2) Where: BEy = Baseline emissions in tonnes CO2-eq EFgrid,CM = Grid emission factor in tCO2-eq/MWh (ID 8) EGy = Electricity supplied to the Grid in MWh (ID 9) The electricity meters are measuring two parameters: The electricity supplied to the grid (EGexport) and the electricity consumption from the grid (EGimport). To achieve the net amount of supplied electricity, the difference has to be calculated:
EGy = EGexport – EGimport (3) Where: EGy = Net electricity supplied to the Grid in MWh (ID 9)

F-CDM-MR
Version 03.1 Page 11 of 13
EGexport = Electricity supplied to the Grid in MWh EGimport = Electricity consumption from the Grid in MWh Table 5: Baseline emissions during this monitoring period
Year Month
(A)
Electricity
supplied to
the grid
[MWh]
(B)
Electricity
consumption
from the grid
[MWh]
(C) = (A) - (B)
EG (ID 9)
Net electricity
supplied to
the grid
[MWh]
Baseline
emission:
ER = EG * EF)
[t CO2e]
2012
January 2012 11,311.09 21.35 11,289.74 7,270.59
February 2012 8,958.71 20.68 8,938.03 5,756.09
March 2012 9,125.44 25.31 9,100.13 5,860.48
April 2012 6,985.73 22.30 6,963.43 4,484.45
May 2012 4,472.30 31.80 4,440.50 2,859.68
June 2012 6,885.29 29.23 6,856.06 4,415.30
July 2012 11,684.43 14.01 11,670.42 7,515.75
August 2012 13,790.62 12.29 13,778.33 8,873.24
September 2012 5,720.97 34.94 5,686.03 3,661.80
October 2012 4,979.75 42.66 4,937.09 3,179.49
November 2012 9,154.90 23.54 9,131.36 5,880.60
December 2012 8,572.51 18.72 8,553.79 5,508.64
Total 01.01.2012 until
31.12.2012: 101,641.74 296.83 101,344.91 65,266.12
E.2. Calculation of project emissions or actual net GHG removals by sinks
>> Project emissions are negligible.
E.3. Calculation of leakage
>> No leakage has to be taken into account
E.4. Summary of calculation of emission reductions or net anthropogenic GHG removals by sinks
The total emission reductions can be calculated with the results of the following equation:
ERy = BEy – PEy - LEy (1) Where: ERy = Emission reduction in year y (tCO2e/yr) BEy = Baseline emissions in year y (tCO2e/yr) PEy = Project emissions in year y (tCO2e/yr) LEy = Leakage in year y (tCO2e/yr) Table 6: Emission Reductions during this monitoring period
Month
Baseline
emission (BE)
[t CO2e]
Project
emission (PE)
[t CO2e]
Leakage
emission (LE)
[t CO2e]
Emission
Reduction:
ER = BE-PE-LE
[t CO2e]
January 2012 7,270.59 0.00 0.00 7,270.59
February 2012 5,756.09 0.00 0.00 5,756.09
March 2012 5,860.48 0.00 0.00 5,860.48
April 2012 4,484.45 0.00 0.00 4,484.45

F-CDM-MR
Version 03.1 Page 12 of 13
May 2012 2,859.68 0.00 0.00 2,859.68
June 2012 4,415.30 0.00 0.00 4,415.30
July 2012 7,515.75 0.00 0.00 7,515.75
August 2012 8,873.24 0.00 0.00 8,873.24
September 2012 3,661.80 0.00 0.00 3,661.80
October 2012 3,179.49 0.00 0.00 3,179.49
November 2012 5,880.60 0.00 0.00 5,880.60
December 2012 5,508.64 0.00 0.00 5,508.64
Total 01.01.2012
until 31.12.2012: 65,266.12 0.00 0.00 65,266.12
E.5. Comparison of actual emission reductions or net anthropogenic GHG removals by sinks with
estimates in registered PDD
The following table compares the emission reductions achieved during the monitoring period with the estimations in the registered CDM-PDD.
Item Values estimated in ex-ante
calculation of registered PDD
Actual values achieved during
this monitoring period
Emission
reductions or
GHG removals
by sinks
(t CO2e)
67,570 65,266
E.6. Remarks on difference from estimated value in registered PDD
>>
According to the PDD a volume of 67,570 tCO2e was expected to be reduced by the project activity per year. The project in operation reached 65,266 tCO2e in this period, which is almost exactly in line with the PDD and the expectations.
E.7. Actual emission reductions or net anthropogenic GHG removals by sinks during the first
commitment period and the period from 1 January 2013 onwards
Item Actual values achieved
up to 31 December 2012
Actual values achieved
from 1 January 2013
onwards
Emission reductions or
GHG removals by sinks
(t CO2e)
65,266 Not applicable
- - - - -

F-CDM-MR
Version 03.1 Page 13 of 13
Document information
Version Date Description
03.1 2 January 2013 Editorial revision to correct table in section E.5.
03.0 3 December 2012 Revision required to introduce a provision on reporting actual emission reductions or net anthropogenic GHG removals by sinks for the period up to 31 December 2012 and the period from 1 January 2013 onwards (EB70, Annex 11).
02.0 13 March 2012 Revision required to ensure consistency with the "Guidelines for completing the monitoring report form" (EB 66, Annex 20).
01 28 May 2010 EB 54, Annex 34. Initial adoption.
Decision Class: Regulatory Document Type: Form Business Function: issuance Keywords: monitoring report, performance monitoring