f appendix - escribe meetings
TRANSCRIPT

December 2017
WATER BALANCE
Parker Stormwater Management Facility Subdivision and Woodlot London, Ontario
APPE
NDIX
F
Report Number: 1542040-3000-R01 Distribution: 1 E-Copy - Development Engineering (London) Limited 1 E-Copy - Golder Associates Ltd.
Submitted to: Mr. Ryan Hern, P.Eng. Development Engineering (London) Limited 41 Adelaide Street North, Unit 71 London, Ontario N6B 3P4

APPENDIX F - WATER BALANCE
Table of Contents
1.0 INTRODUCTION .................................................................................................................................................... 1
1.1 Scope of Work .......................................................................................................................................... 1
2.0 SITE SETTING ....................................................................................................................................................... 1
3.0 WATER BALANCE................................................................................................................................................ 2
3.1 Concept and Procedure ............................................................................................................................ 2
3.2 Results ...................................................................................................................................................... 4
3.3 Implications ............................................................................................................................................... 5
3.4 Mitigative Options ..................................................................................................................................... 5
4.0 CONCLUSIONS AND RECOMMENDATIONS ...................................................................................................... 6
TABLES
Table I: Water Balance Summary
FIGURES
Figure 1: Location Plan
Figure 2: Pre-Development Catchments
Figure 3: Hydrologic Soils – Pre-Development
Figure 4: Ground Cover – Pre-Development
Figure 5: Post-Development Catchments – Interim Development Scenario
Figure 6: Post-Development Catchments – Ultimate Development Scenario
Figure 7: Interim Hydrologic Soils – Post-Development
Figure 8: Ultimate Hydrologic Soils – Post-Development
Figure 9: Ground Cover – Post-Development – Interim Development Scenario
Figure 10: Ground Cover – Post-Development – Ultimate Development Scenario
APPENDICES APPENDIX A Water Balance – Entire Study Area
Table A-I: Existing Conditions – Entire Study Area
Table A-II: Post-Development Conditions – Entire Study Area – Interim Scenario
Table A-III: Post-Development Conditions – Entire Study Area – Ultimate Scenario
December 2017 Report No. 1542040-3000-R01 i

APPENDIX F - WATER BALANCE
Table B-I: Existing Conditions - Woodlot
Table B-II: Post-Development Interim Scenario With 10% Reduction to Woodlot
Table B-III: Post-Development Ultimate Scenario With 10% Reduction to Woodlot
December 2017 Report No. 1542040-3000-R01 ii
APPENDIX B Water Balance – Woodlot

APPENDIX F - WATER BALANCE
1.0 INTRODUCTION Golder Associates Ltd. (“Golder”) was retained by Development Engineering (London) Limited (“Development Engineering”) on behalf of the City of London (“City”) to carry out a water balance for the proposed site of the Parker Subdivision in London, Ontario, in support of the Parker stormwater management facility (SWMF) Functional Design Report (prepared by others). The approximate location of the study area is shown on the Key Plan on Figure 1. The purpose of the water balance was to estimate the potential changes in groundwater recharge and runoff resulting from the proposed development and to identify the corresponding implications for nearby receptors. As requested by Development Engineering and the City, the study area for the water balance analysis included the SWMF and also the surrounding proposed development (hereinafter referred to as the “Study Area”).
1.1 Scope of Work The requested scope of work consisted of:
preparation of pre- and post-development water balances for the entire Study Area;
preparation of a detailed pre- and post-development water balance to assess the potential impacts on the woodlot as a result of the proposed development; as requested, the assessment was based on two scenarios, targeting a maximum 10 per cent (%)reduction in water reporting to the woodlot for an “interim” development scenario (given current proposed plans) and an “ultimate” development scenario (including consideration of future developments as prescribed by the City); and
completion of a report summarizing the results of the water balance, including any recommendations for design, mitigation or construction.
2.0 SITE SETTING The Study Area is located approximately 850 metres south of Commissioners Road and the proposed subdivision is located southeast of the intersection of Commissioners Road and Jackson Road in the southeastern region of the City of London, as shown on Figure 1. The current land use within the Study Area is predominantly woodlot and agricultural land. The woodlot area that is located east of the proposed SWMF includes a designated Provincially Significant Wetland (PSW) according to the City’s Official Plan. The woodlot and its associated catchment are shown on Figure 1 as “Open Space”.
The existing topography in the vicinity of the Study Area is relatively flat with a gentle slope southwards towards Tributary ‘J’ (also known as the Hampton-Scott Drain) of Dingman Creek. The ground surface elevations in the vicinity of the Study Area range from approximately 282 metres above mean sea level (m amsl) in the northern portion to approximately 270 m amsl near the southern boundary. The topography in the vicinity of the Study Area is shown on Figure 1.
As illustrated on the Ontario Ministry of the Environment and Climate Change (MOECC) Preliminary Map S116 entitled “Susceptibility of Ground Water to Contamination, St. Thomas Sheet (East Half)” a drainage basin divide is present in the north portion of the Study Area, generally parallel to Commissioners Road East. The surface water drainage features located on the northern part of the Study Area flow in a northerly direction before discharging to the south branch of the Thames River. The surface water drainage features located in the woodlot,
December 2017 Report No. 1542040-3000-R01 1

APPENDIX F - WATER BALANCE
in addition to the SWMF and related tributaries south of the site, flow in a generally southerly direction before discharging to Dingman Creek. At their closest approaches, Dingman Creek and the south branch of the Thames River are located approximately 2.9 kilometres (km) southeast and 600 m north of the site boundary, respectively.
3.0 WATER BALANCE The water balance for the Study Area was estimated using the procedure and associated assumptions provided in the following sections.
3.1 Concept and Procedure Within a drainage basin, all infiltration to the basin joins the groundwater flow system and, under steady state conditions, eventually discharges to surface watercourses as baseflow. The steady state assumption also dictates that no long-term changes occur in the volume of water stored in the surface water and groundwater reservoirs. This assumption implies that no significant interflow occurs and no significant withdrawal of groundwater (abstraction) is occurring within the drainage basin. It follows that the sum of the average annual precipitation, P, is equal to the sum of the average annual stream flow, Q, and average annual evapotranspiration, E, as follows:
P = Q + E (Freeze and Cherry, 1979)1
If the discharge area within a drainage basin represents an insignificant area relative to the entire watershed, the average annual total stream flow (Q) from a drainage basin should also represent the combined total of the average direct runoff (Qs) and the average annual baseflow (QG) to the stream, as follows:
Q = Qs + QG (Freeze and Cherry, 1979)
These equations provide only a preliminary means to evaluate a water balance since there is variability in the spatial and temporal distributions of precipitation, evapotranspiration, runoff and baseflow (Freeze and Cherry, 1979).
The water balance for the Study Area was estimated in general accordance with Section 3.2 of the MOECC Stormwater Management Planning and Design Manual.2
Based on previously determined sub-catchment mapping for the Study Area, the inferred areal extent of the combined on-site portions of the sub-catchments is approximately 106 hectares. The subcatchments are identified on Figures 2 and 5 and their respective on-site areas and imperviousness values are provided in Tables A-I and A-II.
The average annual precipitation measured at the London Airport Climate Station (Climate ID 6144475) for the period from 1981 to 2010 was 1012 millimetres per year (mm/yr).3
The average annual evapotranspiration rates for each of the inferred soil water holding capacities present within the Study Area were obtained from Environment Canada for the London Airport Climate Station. The soil water
1 Freeze, R.A. and J.A. Cherry, Groundwater, Prentice-Hall, New Jersey, USA, 1979. 2 Ontario Ministry of the Environment, Stormwater Management Planning and Design Manual, March 2003. 3 Based on the Canadian Climate Normals available from Environment Canada for the period from 1981 to 2010.
December 2017 Report No. 1542040-3000-R01 2

APPENDIX F - WATER BALANCE
holding capacities were determined using the MOECC Stormwater Management Planning and Design Manual, which provides a range of values depending on ground and vegetative cover and the hydrologic soil group. The ground and vegetative cover for the Study Area was inferred from available orthophotography and the hydrologic soil groups were determined using available soils mapping4,5 and based on the soils encountered during the drilling investigation for the concurrent geotechnical exploration and hydrogeological assessments.
Following the MOECC Stormwater Management and Design Manual, site-specific infiltration factors were estimated based on assumptions of soil type, ground and vegetative cover and topography for the pre- and post-development scenarios.
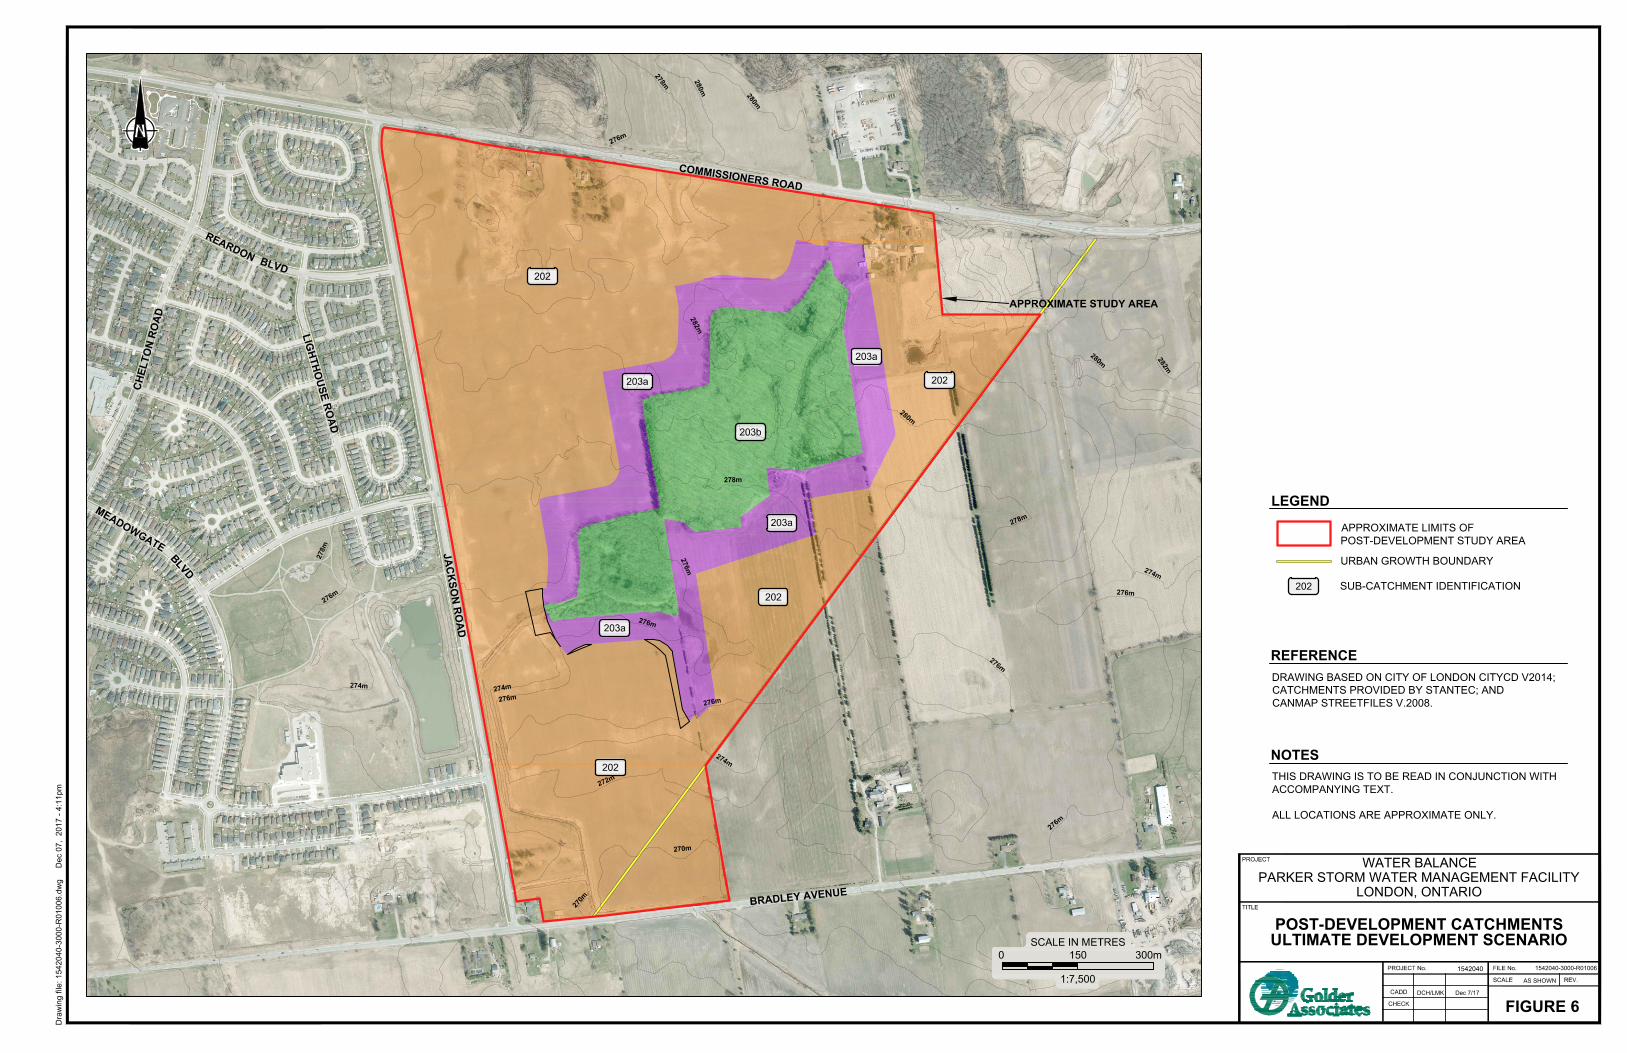
An iterative “goal-seeking” type of approach was used to create two post-development scenarios (interim and ultimate) that would achieve a maximum reduction of near 10% of the water reporting to the woodlot. Within the iterative approach for each scenario, ground cover and impervious areas were varied to account for low-impact development (LID) measures and buffer drainage area in the currently proposed subdivision design and external future (ultimate) development area (Subcatchment 203a). The ultimate scenario includes potential future external development inside the urban growth boundary (UGB), as prescribed by the City, which could be reasonably diverted to the Parker SWMF (Subcatchment 202), although topographically may drain away from the woodlot and upper reaches of the Hampton-Scott Drain under existing and interim development conditions.
The post-development water balance assumed the following:
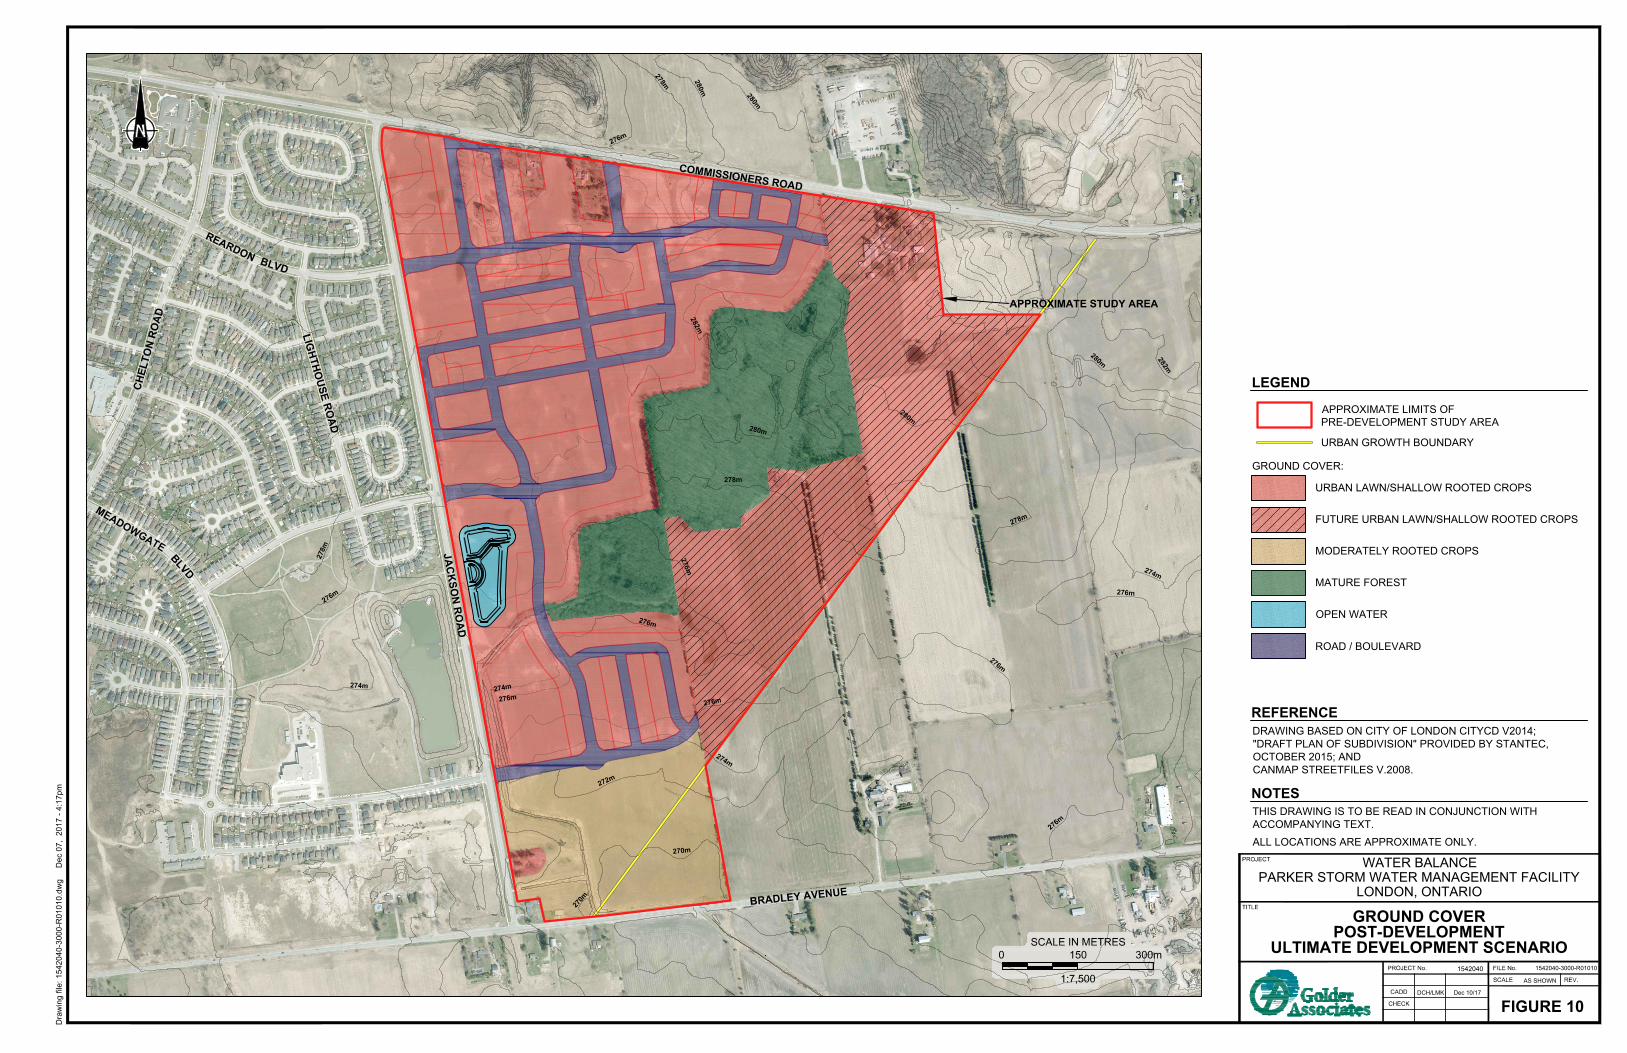
Pre-development ground and vegetative cover will be supplanted by “urban lawn”, with the exception of the existing woodlots present in areas designated as park land or open space, as specified on Drawing 1 “Draft Plan of Subdivision, Phase 1”, prepared by Stantec (October 13, 2015);
The development will be fully serviced with stormwater directed to on-site stormwater management ponds;
Services and buildings will be constructed in such a manner as to prevent the mining of groundwater;
The post-development drainage area will be comprised of urban lawn LID areas, features or measures as well as directly connected “buffer” and indirectly connected rear yard areas surrounding the woodlot (Figure 5);
Surface runoff volumes directed to the woodlot (existing and all developed conditions) are largely retained and translated to interflow (recharge) to the Hampton-Scott Drain, i.e. the woodlot provides an intermediary flow function;
Surface water in the developed subdivision (Subcatchment 202) will be directed to the proposed Parker SWMF and therefore, ultimately to the Thames River;
Groundwater recharge and interflow in the developed subdivision (Subcatchment 202) is anticipated to flow towards and discharge into the Hampton-Scott Drain and ultimately to Dingman Creek; and,
4 Ontario Centre for Soil Resource Evaluation, The Soils of Middlesex County, Report Number 56, Ontario Ministry of Agriculture and Food, Agriculture Canada and the University of Guelph Department of Land Resource Science, 1992. 5 Ontario Ministry of Agriculture, Food and Rural Affairs, Drainage Guide For Ontario, Publication 29, Queen’s Printer for Ontario, 2007.
December 2017 Report No. 1542040-3000-R01 3
APPENDIX F - WATER BALANCE
The woodlot, while it is generally the main focal point of the water balance, is not the ultimate receptor of baseflow that enters and/or is transmitted through the Study Area.
3.2 Results Based on the pre- and post-development imperviousness values and subcatchment areas provided to Golder by Development Engineering, the areal extent of on-site impervious surfaces (e.g. buildings, driveways, sidewalks, walkways, patios, roads, etc.) will increase from approximately 0 to 43% of the total land area following development, thus reducing the available surface area for infiltration. The pre- and post- development water balance has been estimated for the Study Area through the use of visualization and spreadsheet-based methods. Water balance results, including pre- and post-development catchments (for both interim and ultimate development scenarios), hydrologic soils and ground cover are shown on Figures 2 through 10. Tabular summaries of the water balance calculations are provided in Appendices A and B. The overall water balance is summarized in Table I.
From Table I, it is noted that for the entire Study Area, the proposed development (interim scenario) is anticipated to result in a post-development decrease in groundwater recharge (infiltration) of approximately 43,100 cubic metres per year (m3/yr), or approximately 13%; however, the ultimate post-development scenario will reduce the recharge deficit to 26,612 m3/yr or approximately 8%. Overland flow (runoff) is anticipated to increase by approximately 275,600 m3/yr, or approximately 234% for the interim development scenario and by 387,054 m3/yr, or approximately 328% for the ultimate development scenario (directed to the SWMF).
An iterative water balance process targeting a maximum 10% reduction in the volume of water reporting to the woodlot was undertaken for the interim and ultimate development scenarios to assess the input of the development with focus on the woodlot’s hydrologic regime (Subcatchments 203a through 203c on Figures 5 and 6). These results are provided on Table B-II and B-III and summarized on Table I. Subcatchment 203a represents a designated urban lawn area of 11.8 Hectares (ha) with an impervious surface area of 40% for the Parker subdivision, which is expanded under the ultimate development scenario to include a further 7.3 ha area with 45% impervious surface area to account for the future easterly external development (Van Hie lands). This adjustment reduces the available water (recharge and directed runoff) to the woodlot by 10% for the ultimate development scenario. The 10% maximum reduction in water reporting to the woodlot follows the MOECC guidance for LID6. It is assumed that any surface runoff from the area (Subcatchment 203a) would be directed to the woodlot via directly connected “buffer” zones in rear yards, via indirectly connected LID measures, or via a piped diversion system to offset the infiltration deficit. The woodlot is assumed to provide an intermediary function to largely translate surface runoff volumes retained within it to infiltrate.
It is our understanding that the Study Area will be fully serviced with municipal infrastructure (i.e. water, storm and sanitary sewers). The granular pipe bedding material and granular backfill used for the service trenches may act as a preferential pathway for groundwater flow. The impacts from dewatering by on-site services or foundation drains were not included in the analysis described herein.
With the expansion of Subcatchment 202 from the interim to the ultimate post-development scenario, the additional developed recharge area is anticipated to be directed towards the upper reaches of the Hampton-Scott Drain along
6 Ministry of the Environment and Climate Change, Low Impact Development (LID) Stormwater Management Guidance Manual, Draft Version 1.0, April 20, 2017.
December 2017 Report No. 1542040-3000-R01 4
APPENDIX F - WATER BALANCE
with the volume contributed by the woodlot. As such, the ultimate post-development recharge deficit should approach the MOECC water balance target of no more than a 10% change (deficit).
3.3 Implications Due to the increase of impermeable surfaces (e.g. roads, buildings, etc.), development of the Study Area will inevitably lead to an increase in surface runoff and a decrease in evapotranspiration and infiltration (i.e. groundwater recharge/baseflow). This theoretical reduction in post-development groundwater recharge is not anticipated to significantly impact groundwater users in the area, which predominantly rely on the deeper overburden or bedrock aquifers for their water supply. The decrease in groundwater recharge may lead to relatively minor localized reductions in baseflow to the woodlot. It is likely that practical measures can be implemented at the Study Area to enhance post-development recharge and minimize impacts on the pre-development conditions. Possible mitigative options are discussed below.
3.4 Mitigative Options Appropriate mitigation measures may significantly compensate for the potential reduction in post-development groundwater recharge and related baseflow to the woodlot as well as the corresponding decrease in water quality within the watercourse. In this regard, it is suggested that the following management strategies be implemented:
1) Reduce the amount of impervious surface areas, where feasible, to reduce stormwater runoff;
2) Promote diffused infiltration of stormwater so that, where feasible, runoff from impervious surfaces sheet flows over adjacent pervious surfaces that are managed to maximize infiltration capacity; and,
3) Utilize the landscape and soils to naturally move, store and filter stormwater runoff before it leaves the developed site.
Subject to site limitations, specific mitigation measures may include the following:
Collection of roof top runoff in rain barrels or cisterns for subsequent urban irrigation applications, with overflow to grassed areas graded with swales to promote infiltration, thereby maximizing the recharge of precipitation from roof tops; this could include topsoil thickening to enhance vegetation growth and coverage to improve initial abstraction.
Installation of appropriate concrete trench plugs at strategic locations and use of watertight pipe connections in sewer services to mitigate the potential for preferential groundwater flow through the granular pipe bedding material and granular trench backfill, if used.
Construction of water gardens and/or vegetated swales at the rear of suitable residential lots and/or within boulevards or other open spaces to allow for the collection of overland flow (including runoff from roof downspouts) and subsequent infiltration through appropriately sized infiltration galleries. Plans for grading of the development should take into consideration the requirements for the infiltration system to ensure overland flow is allowed to flow more easily through these structures.
Diversion of minor drainage from rear-yards and buffer areas to the woodlot via LID measures or a piped diversion system.
Use of permeable pavements, where feasible (i.e., driveways, parking lots, sidewalks, etc.).
December 2017 Report No. 1542040-3000-R01 5

APPENDIX F - WATER BALANCE
Further enhancements may be realized post-development that are difficult to quantify but would nonetheless partially counteract the effect of development on infiltration. For example, lawn watering activities in a dawn or dusk application program in the post-development subdivision have the potential to contribute significant quantities of recharge.
4.0 CONCLUSIONS AND RECOMMENDATIONS Due to an anticipated increase in impermeable surfaces (e.g. roads, buildings, etc.) and general “flattening”
of the natural depressions, the development will inevitably lead to some increase in surface runoff (both volume and rate) with a corresponding decrease in infiltration (groundwater recharge/baseflow).
The theoretical reduction in post-development infiltration (groundwater recharge/baseflow) is not anticipated to significantly impact groundwater users in the area, which predominantly rely on the deeper overburden aquifers as the water supply.
The anticipated decrease in groundwater recharge may lead to a localized reduction in available water to the woodlot; although the reduction should be largely offset through maintenance of surface runoff via directly connected “buffer” zones in rear yards and/or indirectly connected LID measures.
It is recommended that suitable mitigation measures be implemented (including, but not limited to, diversion of minor drainage from rear-yards and buffer areas to the woodlot via LID measures or a piped diversion system) with a post-development objective of allowing a maximum 10% reduction of flow to the woodlot (i.e., maintaining a minimum of 90% of the pre-development infiltration value) for the Study Area (to be confirmed during detailed subdivision design).
Any further reduction in annual post-development infiltration volume to the woodlot (greater than 10%, if required) should be reviewed during an environmental impact study or assessment.
Although it is considered unlikely that groundwater-dependent vegetation is present within the woodlot, as part of the subdivision developer’s due diligence it is suggested that an assessment of the potential groundwater dependence of the vegetation within the woodlot be carried out by a qualified biologist prior to development.
December 2017 Report No. 1542040-3000-R01 6

APPENDIX F - WATER BALANCE
Report Signature Page
GOLDER ASSOCIATES LTD.
Steve Hales, B.Sc., P.Geo. John McNeil, M.Sc., P.Geo. Hydrogeologist Associate, Senior Hydrogeologist
RM/STH/JM/ly
Golder, Golder Associates and the GA globe design are trademarks of Golder Associates Corporation.
n:\active\2015\3 proj\1542040 dev eng_inv parker swmf_london\ph 3000-water balance\2-correspondence\5-rpts\1542040-3000-r01 dec 2017 (revised final) water balance - parker
swm.docx
December 2017 Report No. 1542040-3000-R01 7

December 2017 TABLE I
WATER BALANCE SUMMARY
Parker SWMF-SubdivisionLondon, Ontario
1542040-3000Page 1 of 1
Golder Associates
PARAMETER EXISTING POST-CONSTRUCTION1
(m3/yr) (m3/yr) (m3/yr) (%)Entire Study Area (Interim Development Scenario)Precipitation (P) 1,068,100 1,079,500 11,400 1
Evapotranspiration (E) 617,900 397,000 -220,900 -36Recharge (QG) + (QSW) 332,200 289,100 -43,100 -13Runoff (QS) 117,900 393,500 275,600 234
Entire Study Area (Ultimate Development Scenario)Precipitation (P) 1,068,100 1,201,912 133,812 13Evapotranspiration (E) 617,900 391,370 -226,530 -37Recharge (QG) + (QSW) 332,200 305,588 -26,612 -8Runoff (QS) 117,900 504,954 387,054 328
Woodlot - 10% Reduction Target (Interim Development Scenario)Precipitation (P) 539,400 435,900 -103,500 -19Evapotranspiration (E) 313,000 225,100 -87,900 -28Recharge (QG) 109,300 85,800 -23,500 -22Runoff (QSw) 117,100 124,900 7,800 7
Total to Woodlot (QG + QSW) 226,400 210,700 -15,700 -7
Woodlot - 10% Reduction Target (Ultimate Development Scenario)Precipitation (P) 539,400 371,900 -167,500 -31Evapotranspiration (E) 313,000 168,600 -144,400 -46Recharge (QG) 109,300 70,800 -38,500 -35Runoff (QSw) 117,100 132,400 15,300 13
Total to Woodlot (QG + QSW) 226,400 203,200 -23,200 -10
NOTES: 1. Post-Construction water balance for the entire study area assumes recharge is all directed to both the Woodlot and ultimately the Hampton-Scott Drain and that seepage in or out of the SWMF will not occur2. Negative value indicates a decrease following construction.3. QSW Runoff is directed from buffer area to recharge woodlot for water balance
4. Table to be read in conjunction with accompanying report.
% DIFFERENCE2
Prepared By: RMChecked By: STH

CITY OF
LONDON
EX
ET
ER
R
O
AD
O
X
F
O
R
D
S
T
R
E
E
T
H
I
G
H
B
U
R
Y
A
V
E
N
U
E
C
L
A
R
K
E
R
O
A
D
H
A
M
IL
T
O
N
R
O
A
D
C
O
M
M
IS
S
IO
N
E
R
S
R
O
A
D
W
E
L
L
IN
G
T
O
N
R
O
A
D
H
I
G
H
W
A
Y
4
0
1
BR
AD
LE
Y A
VE
NU
E
SITE
M
E
A
D
O
W
G
A
T
E
2
7
4
m
2
8
2
m
C
H
E
L
T
O
N
R
O
A
D
R
E
A
R
D
O
N
B
L
V
D
B
L
V
D
APPROXIMATE STUDY AREA
276m
2
8
0
m
J
A
C
K
S
O
N
R
O
A
D
L
IG
H
T
H
O
U
S
E
R
O
A
D
BR
AD
LE
Y A
VE
NU
E
C
O
M
M
IS
S
IO
N
E
R
S
R
O
A
D
2
7
0
m
2
7
2
m
274m
2
7
4
m
276m
2
7
6
m
2
7
8
m
2
8
0
m
2
8
2
m
2
8
0
m
2
7
8
m
2
7
6
m
2
7
6
m
2
7
6
m
2
7
8
m
2
8
0
m
2
8
0
m
274m
2
7
6
m
2
7
8
m
2
7
0
m
270m
2
7
2
m
274m
2
7
6
m
2
7
6
m
2
7
4
m
276m
2
7
6
m
2
7
8
m
2
8
0
m
2
8
2
m
2
8
2
m
2
8
0
m
2
7
8
m
2
7
6
m
2
7
6
m
2
7
4
m
276m
2
8
0
m
2
8
2
m
2
7
6
m
2
7
8
m
2
8
0
m
2
8
0
m
274m
2
7
6
m
2
7
8
m
1:7,500
0 150 300m
SCALE IN METRES
CITY OF
CITY OF
CITY OF
CITY OF
CITY OF
CITY OF
CITY OF
CITY OF
CITY OF
LOCATION PLAN
TITLE
PROJECT No. FILE No.
CADD
CHECK
SCALE
PROJECT
REV.
KEY PLAN
REFERENCE
DRAWING BASED ON CITY OF LONDON CITYCD V2014;
"DRAFT PLAN OF SUBDIVISION" PROVIDED BY STANTEC,
OCTOBER 2015; AND
CANMAP STREETFILES V.2008.
NOTES
LEGEND
Dra
win
g file
: 1
54
20
40
-3
00
0-R
01
00
1.d
wg
D
ec 0
7, 2
01
7 - 3
:0
4p
m
1542040-3000-R01001
1542040
AS SHOWN
DCH/LMK Dec 7/17
WATER BALANCE
PARKER STORM WATER MANAGEMENT FACILITY
LONDON, ONTARIO
FIGURE 1
THIS DRAWING IS TO BE READ IN CONJUNCTION WITH
ACCOMPANYING TEXT.
APPROXIMATE LIMITS OF
PRE-DEVELOPMENT STUDY AREA
LOW DENSITY
HOUSING
PROPOSED DEVELOPMENT LANDUSE:
MEDIUM DENSITY
HOUSING
OPEN SPACE
PARK
SCHOOL
ALL LOCATIONS ARE APPROXIMATE ONLY.
SWM FACILITY
COMMERCIAL
ROADS
AGRICULTURAL
LANDS / FUTURE
DEVELOPMENT
URBAN GROWTH BOUNDARY

J
A
C
K
S
O
N
R
O
A
D
L
IG
H
T
H
O
U
S
E
R
O
A
D
BR
AD
LE
Y A
VE
NU
E
C
O
M
M
IS
S
IO
N
E
R
S
R
O
A
D
C
H
E
L
T
O
N
R
O
A
D
M
E
A
D
O
W
G
A
T
E
R
E
A
R
D
O
N
B
L
V
D
B
L
V
D
2
7
0
m
270m
2
7
2
m
274m
2
7
6
m
2
7
6
m
2
7
4
m
276m
2
7
6
m
2
7
8
m
2
8
0
m
2
8
2
m
2
8
2
m
2
8
0
m
2
7
8
m
2
7
6
m
2
7
6
m
2
7
4
m
276m
2
8
0
m
2
8
2
m
2
7
6
m
2
7
8
m
2
8
0
m
2
8
0
m
274m
2
7
6
m
2
7
8
m
102a
102a
102b
101
APPROXIMATE STUDY AREA
1:7,500
0 150 300m
SCALE IN METRES
PRE-DEVELOPMENT CATCHMENTS
TITLE
PROJECT No. FILE No.
CADD
CHECK
SCALE
PROJECT
REV.
REFERENCE
DRAWING BASED ON CITY OF LONDON CITYCD V2014;
CATCHMENTS PROVIDED BY STANTEC; AND
CANMAP STREETFILES V.2008.
NOTES
Dra
win
g file
: 1
54
20
40
-3
00
0-R
01
00
2.d
wg
D
ec 0
7, 2
01
7 - 3
:2
0p
m
1542040-3000-R01002
1542040
AS SHOWN
DCH Dec 7/17
WATER BALANCE
PARKER STORM WATER MANAGEMENT FACILITY
LONDON, ONTARIO
FIGURE 2
THIS DRAWING IS TO BE READ IN CONJUNCTION WITH
ACCOMPANYING TEXT.
ALL LOCATIONS ARE APPROXIMATE ONLY.
APPROXIMATE LIMITS OF
PRE-DEVELOPMENT STUDY AREA
101 SUB-CATCHMENT IDENTIFICATION
LEGEND
URBAN GROWTH BOUNDARY

J
A
C
K
S
O
N
R
O
A
D
L
IG
H
T
H
O
U
S
E
R
O
A
D
BR
AD
LE
Y A
VE
NU
E
C
O
M
M
IS
S
IO
N
E
R
S
R
O
A
D
C
H
E
L
T
O
N
R
O
A
D
M
E
A
D
O
W
G
A
T
E
R
E
A
R
D
O
N
B
L
V
D
B
L
V
D
2
7
0
m
270m
2
7
2
m
274m
2
7
6
m
2
7
6
m
2
7
4
m
2
7
6
m
2
7
6
m
2
7
8
m
2
8
0
m
2
8
2
m
2
8
2
m
2
8
0
m
2
7
8
m
2
7
6
m
2
7
6
m
2
7
4
m
276m
2
8
0
m
2
8
2
m
2
7
6
m
2
7
8
m
2
8
0
m
2
8
0
m
274m
2
7
6
m
2
7
8
m
APPROXIMATE STUDY AREA
1:7,500
0 150 300m
SCALE IN METRES
CITY OF
CITY OFHYDROLOGIC SOILS
PRE-DEVELOPMENT
TITLE
PROJECT No. FILE No.
CADD
CHECK
SCALE
PROJECT
REV.
REFERENCE
DRAWING BASED ON CITY OF LONDON CITYCD V2014;
AND CANMAP STREETFILES V.2008.
NOTES
LEGEND
Dra
win
g file
: 1
54
20
40
-3
00
0-R
01
00
3.d
wg
D
ec 0
7, 2
01
7 - 3
:2
2p
m
1542040-3000-R01003
1542040
AS SHOWN
DCH/LMK Dec 7/17
WATER BALANCE
PARKER STORM WATER MANAGEMENT FACILITY
LONDON, ONTARIO
FIGURE 3
THIS DRAWING IS TO BE READ IN CONJUNCTION WITH
ACCOMPANYING TEXT.
ALL LOCATIONS ARE APPROXIMATE ONLY.
APPROXIMATE LIMITS OF
PRE-DEVELOPMENT STUDY AREA
B
CD
HYDROLOGIC SOIL GROUP:
URBAN GROWTH BOUNDARY

J
A
C
K
S
O
N
R
O
A
D
L
IG
H
T
H
O
U
S
E
R
O
A
D
BR
AD
LE
Y A
VE
NU
E
C
O
M
M
IS
S
IO
N
E
R
S
R
O
A
D
C
H
E
L
T
O
N
R
O
A
D
M
E
A
D
O
W
G
A
T
E
R
E
A
R
D
O
N
B
L
V
D
B
L
V
D
2
7
0
m
270m
2
7
2
m
274m
2
7
6
m
2
7
6
m
2
7
4
m
276m
2
7
6
m
2
7
8
m
2
8
0
m
2
8
2
m
2
8
2
m
2
8
0
m
2
7
8
m
2
7
6
m
2
7
6
m
2
7
4
m
276m
2
8
0
m
2
8
2
m
2
7
6
m
2
7
8
m
2
8
0
m
2
8
0
m
274m
2
7
6
m
2
7
8
m
APPROXIMATE STUDY AREA
1:7,500
0 150 300m
SCALE IN METRES
CITY OFCITY OFCITY OFCITY OF
GROUND COVER
PRE-DEVELOPMENT
TITLE
PROJECT No. FILE No.
CADD
CHECK
SCALE
PROJECT
REV.
REFERENCE
DRAWING BASED ON CITY OF LONDON CITYCD V2014;
AND CANMAP STREETFILES V.2008.
NOTES
LEGEND
Dra
win
g file
: 1
54
20
40
-3
00
0-R
01
00
4.d
wg
D
ec 0
7, 2
01
7 - 3
:2
6p
m
1542040-3000-R01004
1542040
AS SHOWN
DCH/LMK Dec 7/17
WATER BALANCE
PARKER STORM WATER MANAGEMENT FACILITY
LONDON, ONTARIO
FIGURE 4
THIS DRAWING IS TO BE READ IN CONJUNCTION WITH
ACCOMPANYING TEXT.
ALL LOCATIONS ARE APPROXIMATE ONLY.
APPROXIMATE LIMITS OF
PRE-DEVELOPMENT STUDY AREA
MATURE FOREST
GROUND COVER:
PASTURE AND SHRUBS
MODERATELY ROOTED CROPS
URBAN LAWN/SHALLOW ROOTED CROPS
URBAN GROWTH BOUNDARY

274m
2
7
8
m
J
A
C
K
S
O
N
R
O
A
D
L
IG
H
T
H
O
U
S
E
R
O
A
D
BR
AD
LE
Y A
VE
NU
E
C
O
M
M
IS
S
IO
N
E
R
S
R
O
A
D
C
H
E
L
T
O
N
R
O
A
D
M
E
A
D
O
W
G
A
T
E
R
E
A
R
D
O
N
B
L
V
D
B
L
V
D
2
7
0
m
270m
2
7
2
m
2
7
4
m
2
7
6
m
2
7
6
m
2
7
4
m
2
7
6
m
2
7
6
m
278m
2
8
0
m
2
8
2
m
2
8
0
m
2
7
8
m
2
7
6
m
2
7
6
m
2
7
4
m
276m
2
8
0
m
2
8
2
m
2
7
6
m
2
7
8
m
2
8
0
m
2
7
6
m
2
8
0
m
APPROXIMATE STUDY AREA
203c
203c
203b
203a
203a
202
202
1:7,500
0 150 300m
SCALE IN METRES
POST-DEVELOPMENT CATCHMENTS
INTERIM DEVELOPMENT SCENARIO
TITLE
PROJECT No. FILE No.
CADD
CHECK
SCALE
PROJECT
REV.
REFERENCE
DRAWING BASED ON CITY OF LONDON CITYCD V2014;
CATCHMENTS PROVIDED BY STANTEC; AND
CANMAP STREETFILES V.2008.
NOTES
LEGEND
Dra
win
g file
: 1
54
20
40
-3
00
0-R
01
00
5.d
wg
D
ec 0
7, 2
01
7 - 3
:2
7p
m
1542040-3000-R01005
1542040
AS SHOWN
DCH/LMK Dec 7/17
WATER BALANCE
PARKER STORM WATER MANAGEMENT FACILITY
LONDON, ONTARIO
FIGURE 5
THIS DRAWING IS TO BE READ IN CONJUNCTION WITH
ACCOMPANYING TEXT.
ALL LOCATIONS ARE APPROXIMATE ONLY.
APPROXIMATE LIMITS OF
POST-DEVELOPMENT STUDY AREA
202 SUB-CATCHMENT IDENTIFICATION
URBAN GROWTH BOUNDARY
274m
2
7
8
m
J
A
C
K
S
O
N
R
O
A
D
L
IG
H
T
H
O
U
S
E
R
O
A
D
BR
AD
LE
Y A
VE
NU
E
C
O
M
M
IS
S
IO
N
E
R
S
R
O
A
D
C
H
E
L
T
O
N
R
O
A
D
M
E
A
D
O
W
G
A
T
E
R
E
A
R
D
O
N
B
L
V
D
B
L
V
D
2
7
0
m
270m
2
7
2
m
2
7
4
m
2
7
6
m
2
7
6
m
2
7
4
m
2
7
6
m
2
7
6
m
278m
2
8
0
m
2
8
2
m
2
8
0
m
2
7
8
m
2
7
6
m
2
7
6
m
2
7
4
m
276m
2
8
0
m
2
8
2
m
2
7
6
m
2
7
8
m
2
8
0
m
2
7
6
m
2
8
0
m
APPROXIMATE STUDY AREA
203b
203a
203a
202
202
202
202
203a
203a
1:7,500
0 150 300m
SCALE IN METRES
POST-DEVELOPMENT CATCHMENTS
ULTIMATE DEVELOPMENT SCENARIO
TITLE
PROJECT No. FILE No.
CADD
CHECK
SCALE
PROJECT
REV.
REFERENCE
DRAWING BASED ON CITY OF LONDON CITYCD V2014;
CATCHMENTS PROVIDED BY STANTEC; AND
CANMAP STREETFILES V.2008.
NOTES
LEGEND
Dra
win
g file
: 1
54
20
40
-3
00
0-R
01
00
6.d
wg
D
ec 0
7, 2
01
7 - 4
:1
1p
m
1542040-3000-R01006
1542040
AS SHOWN
DCH/LMK Dec 7/17
WATER BALANCE
PARKER STORM WATER MANAGEMENT FACILITY
LONDON, ONTARIO
FIGURE 6
THIS DRAWING IS TO BE READ IN CONJUNCTION WITH
ACCOMPANYING TEXT.
ALL LOCATIONS ARE APPROXIMATE ONLY.
APPROXIMATE LIMITS OF
POST-DEVELOPMENT STUDY AREA
202 SUB-CATCHMENT IDENTIFICATION
URBAN GROWTH BOUNDARY

J
A
C
K
S
O
N
R
O
A
D
L
IG
H
T
H
O
U
S
E
R
O
A
D
BR
AD
LE
Y A
VE
NU
E
C
O
M
M
IS
S
IO
N
E
R
S
R
O
A
D
C
H
E
L
T
O
N
R
O
A
D
M
E
A
D
O
W
G
A
T
E
R
E
A
R
D
O
N
B
L
V
D
B
L
V
D
2
7
0
m
270m
2
7
2
m
2
7
4
m
2
7
6
m
2
7
6
m
2
7
4
m
2
7
6
m
2
7
6
m
278m
2
8
0
m
2
8
2
m
2
8
0
m
2
7
8
m
2
7
6
m
2
7
6
m
2
7
4
m
276m
2
8
0
m
2
8
2
m
2
7
6
m
2
7
8
m
2
8
0
m
2
8
0
m
274m
2
7
6
m
2
7
8
m
APPROXIMATE STUDY AREA
1:7,500
0 150 300m
SCALE IN METRES
CITY OF
CITY OF
INTERIM HYDROLOGIC SOILS
POST-DEVELOPMENT
TITLE
PROJECT No. FILE No.
CADD
CHECK
SCALE
PROJECT
REV.
REFERENCE
DRAWING BASED ON CITY OF LONDON CITYCD V2014;
AND CANMAP STREETFILES V.2008.
NOTES
LEGEND
Dra
win
g file
: 1
54
20
40
-3
00
0-R
01
00
7.d
wg
D
ec 0
7, 2
01
7 - 4
:1
3p
m
1542040-3000-R01007
1542040
AS SHOWN
DCH/LMK Dec 7/17
WATER BALANCE
PARKER STORM WATER MANAGEMENT FACILITY
LONDON, ONTARIO
FIGURE 7
THIS DRAWING IS TO BE READ IN CONJUNCTION WITH
ACCOMPANYING TEXT.
ALL LOCATIONS ARE APPROXIMATE ONLY.
APPROXIMATE LIMITS OF
PRE-DEVELOPMENT STUDY AREA
B
CD
HYDROLOGIC SOIL GROUP:
NOTE: POST-DEVELOPMENT GROUND SURFACE
INFORMATION NOT AVAILABLE AT TIME OF
WATER BALANCE ANALYSIS,
URBAN GROWTH BOUNDARY

J
A
C
K
S
O
N
R
O
A
D
L
IG
H
T
H
O
U
S
E
R
O
A
D
BR
AD
LE
Y A
VE
NU
E
C
O
M
M
IS
S
IO
N
E
R
S
R
O
A
D
C
H
E
L
T
O
N
R
O
A
D
M
E
A
D
O
W
G
A
T
E
R
E
A
R
D
O
N
B
L
V
D
B
L
V
D
2
7
0
m
270m
2
7
2
m
2
7
4
m
2
7
6
m
2
7
6
m
2
7
4
m
2
7
6
m
2
7
6
m
278m
2
8
0
m
2
8
2
m
2
8
0
m
2
7
8
m
2
7
6
m
2
7
6
m
2
7
4
m
276m
2
8
0
m
2
8
2
m
2
7
6
m
2
7
8
m
2
8
0
m
2
8
0
m
274m
2
7
6
m
2
7
8
m
APPROXIMATE STUDY AREA
1:7,500
0 150 300m
SCALE IN METRES
CITY OF
CITY OF
ULTIMATE HYDROLOGIC SOILS
POST-DEVELOPMENT
TITLE
PROJECT No. FILE No.
CADD
CHECK
SCALE
PROJECT
REV.
REFERENCE
DRAWING BASED ON CITY OF LONDON CITYCD V2014;
AND CANMAP STREETFILES V.2008.
NOTES
LEGEND
Dra
win
g file
: 1
54
20
40
-3
00
0-R
01
00
8.d
wg
D
ec 0
7, 2
01
7 - 4
:2
3p
m
1542040-3000-R01008
1542040
AS SHOWN
DCH/LMK Dec 7/17
WATER BALANCE
PARKER STORM WATER MANAGEMENT FACILITY
LONDON, ONTARIO
FIGURE 8
THIS DRAWING IS TO BE READ IN CONJUNCTION WITH
ACCOMPANYING TEXT.
ALL LOCATIONS ARE APPROXIMATE ONLY.
APPROXIMATE LIMITS OF
PRE-DEVELOPMENT STUDY AREA
B
CD
HYDROLOGIC SOIL GROUP:
NOTE: POST-DEVELOPMENT GROUND SURFACE
INFORMATION NOT AVAILABLE AT TIME OF
WATER BALANCE ANALYSIS,
URBAN GROWTH BOUNDARY

M
E
A
D
O
W
G
A
T
E
C
H
E
L
T
O
N
R
O
A
D
R
E
A
R
D
O
N
B
L
V
D
B
L
V
D
J
A
C
K
S
O
N
R
O
A
D
L
IG
H
T
H
O
U
S
E
R
O
A
D
BR
AD
LE
Y A
VE
NU
E
C
O
M
M
IS
S
IO
N
E
R
S
R
O
A
D
2
7
0
m
270m
2
7
2
m
2
7
4
m
2
7
6
m
2
7
6
m
2
7
4
m
2
7
6
m
2
7
6
m
278m
2
8
0
m
2
8
2
m
2
8
0
m
2
7
8
m
2
7
6
m
2
7
6
m
2
7
4
m
276m
2
8
0
m
2
8
2
m
2
7
6
m
2
7
8
m
2
8
0
m
2
8
0
m
274m
2
7
6
m
2
7
8
m
APPROXIMATE STUDY AREA
1:7,500
0 150 300m
SCALE IN METRES
GROUND COVER
POST-DEVELOPMENT
INTERIM DEVELOPMENT SCENARIO
TITLE
PROJECT No. FILE No.
CADD
CHECK
SCALE
PROJECT
REV.
REFERENCE
DRAWING BASED ON CITY OF LONDON CITYCD V2014;
"DRAFT PLAN OF SUBDIVISION" PROVIDED BY STANTEC,
OCTOBER 2015; AND
CANMAP STREETFILES V.2008.
NOTES
LEGEND
Dra
win
g file
: 1
54
20
40
-3
00
0-R
01
00
9.d
wg
D
ec 0
7, 2
01
7 - 4
:1
6p
m
1542040-3000-R01009
1542040
AS SHOWN
DCH/LMK Dec 7/17
WATER BALANCE
PARKER STORM WATER MANAGEMENT FACILITY
LONDON, ONTARIO
FIGURE 9
THIS DRAWING IS TO BE READ IN CONJUNCTION WITH
ACCOMPANYING TEXT.
APPROXIMATE LIMITS OF
PRE-DEVELOPMENT STUDY AREA
ALL LOCATIONS ARE APPROXIMATE ONLY.
OPEN WATER
MATURE FOREST
GROUND COVER:
MODERATELY ROOTED CROPS
URBAN LAWN/SHALLOW ROOTED CROPS
ROAD / BOULEVARD
URBAN GROWTH BOUNDARY
M
E
A
D
O
W
G
A
T
E
C
H
E
L
T
O
N
R
O
A
D
R
E
A
R
D
O
N
B
L
V
D
B
L
V
D
J
A
C
K
S
O
N
R
O
A
D
L
IG
H
T
H
O
U
S
E
R
O
A
D
BR
AD
LE
Y A
VE
NU
E
C
O
M
M
IS
S
IO
N
E
R
S
R
O
A
D
2
7
0
m
270m
2
7
2
m
2
7
4
m
2
7
6
m
2
7
6
m
2
7
4
m
2
7
6
m
2
7
6
m
278m
2
8
0
m
2
8
2
m
2
8
0
m
2
7
8
m
2
7
6
m
2
7
6
m
2
7
4
m
276m
2
8
0
m
2
8
2
m
2
7
6
m
2
7
8
m
2
8
0
m
2
8
0
m
274m
2
7
6
m
2
7
8
m
1:7,500
0 150 300m
SCALE IN METRES
APPROXIMATE STUDY AREA
GROUND COVER
POST-DEVELOPMENT
ULTIMATE DEVELOPMENT SCENARIO
TITLE
PROJECT No. FILE No.
CADD
CHECK
SCALE
PROJECT
REV.
REFERENCE
DRAWING BASED ON CITY OF LONDON CITYCD V2014;
"DRAFT PLAN OF SUBDIVISION" PROVIDED BY STANTEC,
OCTOBER 2015; AND
CANMAP STREETFILES V.2008.
NOTES
LEGEND
Dra
win
g file
: 1
54
20
40
-3
00
0-R
01
01
0.d
wg
D
ec 0
7, 2
01
7 - 4
:1
7p
m
1542040-3000-R01010
1542040
AS SHOWN
DCH/LMK Dec 10/17
WATER BALANCE
PARKER STORM WATER MANAGEMENT FACILITY
LONDON, ONTARIO
FIGURE 10
THIS DRAWING IS TO BE READ IN CONJUNCTION WITH
ACCOMPANYING TEXT.
APPROXIMATE LIMITS OF
PRE-DEVELOPMENT STUDY AREA
ALL LOCATIONS ARE APPROXIMATE ONLY.
OPEN WATER
MATURE FOREST
GROUND COVER:
MODERATELY ROOTED CROPS
URBAN LAWN/SHALLOW ROOTED CROPS
ROAD / BOULEVARD
URBAN GROWTH BOUNDARY
FUTURE URBAN LAWN/SHALLOW ROOTED CROPS

APPENDIX F - WATER BALANCE
APPENDIX A Water Balance – Entire Study Area Table A-I: Existing Conditions – Entire Study Area Table A-II: Post-Development Conditions – Entire Study Area – Interim Scenario Table A-III: Post-Development Conditions – Entire Study Area – Ultimate Scenario
December 2017 Report No. 1542040-3000-R01

December 2017 TABLE A-I
EXISTING CONDITIONS - ENTIRE STUDY AREA
Parker SWMF-SubdivisionLondon, Ontario
1542040-3000Page 1 of 1
Golder Associates
Catchment
Ground Cover Urban LawnModerately Rooted
Crops Mature Forest Urban LawnsModerately Rooted
CropsHydrologic Soil Group B CD B CD CD CD CDArea m2 121,000 237,000 3,400 356,000 177,000 11,000 150,000Water Holding Capacity mm 150 200 75 200 400 100 200
Precipitation, P m/year 1.012 1.012 1.012 1.012 1.012 1.012 1.012Evapotranspiration, E m/year 0.580 0.585 0.577 0.585 0.592 0.577 0.585Surplus m/year 0.432 0.427 0.435 0.427 0.420 0.435 0.427
Ground Cover Factor - 0.10 0.10 0.10 0.10 0.20 0.10 0.10Soils Factor - 0.25 0.15 0.25 0.15 0.15 0.15 0.15Topography Factor - 0.20 0.20 0.20 0.20 0.20 0.15 0.20Infiltration Factor (sum) - 0.55 0.45 0.55 0.45 0.55 0.40 0.45
Recharge, QG m/year 0.238 0.192 0.239 0.192 0.231 0.174 0.192Runoff, QS m/year 0.194 0.235 0.196 0.235 0.189 0.261 0.235
Annual volumePrecipitation m3/year 122,452 239,844 3,441 360,272 179,124 11,132 151,800
Evapotranspiration m3/year 70,180 138,645 1,962 208,260 104,784 6,347 87,750Recharge m3/year 28,750 45,540 813 68,405 40,887 1,914 28,823
Runoff m3/year 23,522 55,659 666 83,607 33,453 2,871 35,228
102 Total 101 TotalPrecipitation, P 905,133 m3/year Precipitation, P 162,932 m3/yearEvapotranspiration, E 523,831 m3/year Evapotranspirat 94,097 m3/yearRecharge, QG 184,395 m3/year Recharge, QG 30,737 m3/yearRunoff, QSW <=Surface Runoff to Woodlot 117,060 m3/year Runoff, QS 38,099 m3/yearRunoff, QS <=Surface Runoff to Hampton-Scott 79,847 m3/year
TotalPrecipitation, P 1,068,065 m3/yearEvapotranspiration, E 617,928 m3/yearRecharge, QG + QSW 332,191 m3/yearRunoff, QS 117,946 m3/year
NOTES: 1. Table to be read in conjunction with accompanying report.
Moderately Rooted Crops
102b 101102a
Prepared By: RM Checked By: STH

December 2017 TABLE A-II
POST-DEVELOPMENT CONDITIONS - ENTIRE STUDY AREA - INTERIM SCENARIO
Parker SWMF-SubdivisionLondon, Ontario
1542040-3000Page 1 of 1
Golder Associates
Catchment 203a 203b 203c
Ground Cover
Moderately Rooted Crops Urban Lawns Open Water Roads Urban Lawns
(Parker) Mature ForestModerately
Rooted Crops (Van Hie)
Hydrologic Soil Group B CD -- -- CD CD CDArea m2 121,000 366,000 16,000 133,000 117,700 177,000 136,000Impervious % 0% 55% 100% 100% 40% 0% 0%Water Holding Capacity mm 150 125 -- 5 125 400 200
Precipitation, P m/year 1.012 1.012 1.012 1.012 1.012 1.012 1.012Evapotranspiration, E m/year 0.580 0.260 0.000 0.050 0.346 0.592 0.585Surplus m/year 0.432 0.752 1.012 0.962 0.666 0.420 0.427
Ground Cover Factor - 0.10 0.10 -- -- 0.10 0.20 0.10Soils Factor - 0.25 0.10 -- -- 0.10 0.15 0.15Topography Factor - 0.20 0.20 -- -- 0.20 0.20 0.20Infiltration Factor (sum) - 0.55 0.40 0.00 0.00 0.40 0.55 0.45
Recharge, QG m/year 0.238 0.135 0.000 0.000 0.160 0.231 0.192Runoff, QS m/year 0.194 0.617 1.012 0.962 0.506 0.189 0.235
Annual volumePrecipitation m3/year 122,452 370,392 16,192 134,596 119,112 179,124 137,632
Evapotranspiration m3/year 70,180 95,032 0 6,650 40,748 104,784 79,560Recharge m3/year 28,750 49,565 0 0 18,808 40,887 26,132
Runoff m3/year 23,522 225,795 16,192 127,946 59,557 33,453 31,940
202 Total - Interim 203 Total - InterimPrecipitation, P 643,632 m3/year Precipitation, P 435,868 m3/yearEvapotranspiration, E 171,862 m3/year Evapotranspiration, E 225,092 m3/yearRecharge, QG 78,314 m3/year Recharge, QG 85,827 m3/yearRunoff, QS <= Runoff Directed to Parker SWMF 393,456 m3/year Runoff, QSW <= Runoff to Woodlot for Balance 124,950 m3/year
Total - InterimPrecipitation, P 1,079,500 m3/yearEvapotranspiration, E 396,954 m3/yearRecharge, QG + QSW 289,091 m3/yearRunoff, QS 393,456 m3/year
NOTES: 1. Table to be read in conjunction with accompanying report.2. Area 203a is based on the -10% infiltration scenario.
202
Prepared By: RM Checked By: STH

December 2017 TABLE A-III
POST-DEVELOPMENT CONDITIONS - ENTIRE STUDY AREA - ULTIMATE SCENARIO
Parker SWMF-SubdivisionLondon, Ontario
1542040-3000Page 1 of 1
Golder Associates
Catchment 203a 203a 203b
Ground CoverModerately
Rooted Crops Urban Lawns Open Water Roads Urban Lawns (Parker)
Urban Lawns (Van Hie) Mature Forest
Hydrologic Soil Group B CD -- -- CD CD CDArea m2 148,630 494,940 16,000 160,630 117,700 72,760 177,000Impervious % 0% 55% 100% 100% 40% 45% 0%Water Holding Capacity mm 150 125 -- 5 125 125 400
Precipitation, P m/year 1.012 1.012 1.012 1.012 1.012 1.012 1.012Evapotranspiration, E m/year 0.580 0.260 0.000 0.050 0.346 0.317 0.592Surplus m/year 0.432 0.752 1.012 0.962 0.666 0.695 0.420
Ground Cover Factor - 0.10 0.10 -- -- 0.10 0.10 0.20Soils Factor - 0.25 0.10 -- -- 0.10 0.10 0.15Topography Factor - 0.20 0.20 -- -- 0.20 0.20 0.20Infiltration Factor (sum) - 0.55 0.40 0.00 0.00 0.40 0.40 0.55
Recharge, QG m/year 0.238 0.135 0.000 0.000 0.160 0.153 0.231Runoff, QS m/year 0.194 0.617 1.012 0.962 0.506 0.542 0.189
Annual volumePrecipitation m3/year 150,414 500,879 16,192 162,558 119,112 73,633 179,124
Evapotranspiration m3/year 86,205 128,511 0 8,032 40,748 23,090 104,784Recharge m3/year 35,314 67,026 0 0 18,808 11,119 40,887
Runoff m3/year 28,894 305,342 16,192 154,526 59,557 39,423 33,453
202 Total - Ultimate 203 Total - UltimatePrecipitation, P 830,042 m3/year Precipitation, P 371,870 m3/yearEvapotranspiration, E 222,748 m3/year Evapotranspiration, E 168,622 m3/yearRecharge, QG 102,341 m3/year Recharge, QG 70,814 m3/yearRunoff, QS <= Runoff Directed to Parker SWMF 504,954 m3/year Runoff, QSW <= Runoff to Woodlot for Balance 132,433 m3/year
Total - UltimatePrecipitation, P 1,201,912 m3/yearEvapotranspiration, E 391,370 m3/yearRecharge, QG + QSW 305,588 m3/yearRunoff, QS 504,954 m3/year
NOTES: 1. Table to be read in conjunction with accompanying report.2. Area 203a is based on the -10% infiltration scenario.
202
Prepared By: RM Checked By: STH

APPENDIX F - WATER BALANCE
APPENDIX B Water Balance – Woodlot Table B-I: Existing Conditions – Woodlot Table B-II: Post-Development Interim Scenario With 10% Target Reduction to Woodlot Table B-III: Post-Development Ultimate Scenario With 10% Target Reduction to Woodlot
December 2017 Report No. 1542040-3000-R01

December 2017 TABLE B-I
EXISTING CONDITIONS - WOODLOT
Parker SWMF-SubdivisionLondon, Ontario
1542040-3000Page 1 of 1
Catchment 102 102
Ground CoverModerately Rooted Crops -
Parker & Van Hie lands Mature Forest
Hydrologic Soil Group CD CDArea m2 356,000 177,000Water Holding Capacity mm 200 400
Precipitation, P m/year 1.012 1.012Evapotranspiration, E m/year 0.585 0.592Surplus m/year 0.427 0.420
Ground Cover Factor - 0.10 0.20Soils Factor - 0.15 0.15Topography Factor - 0.20 0.20Infiltration Factor (sum) - 0.45 0.55
Recharge, QG m/year 0.192 0.231Runoff, QS m/year 0.235 0.189
Annual volumePrecipitation m3/year 360,272 179,124
Evapotranspiration m3/year 208,260 104,784Recharge m3/year 68,405 40,887
Runoff m3/year 83,607 33,453
TotalPrecipitation, P 539,396 m3/yearEvapotranspiration, E 313,044 m3/yearRecharge, QG 109,292 m3/yearRunoff, QSW 117,060 m3/year
NOTES: 1. Table to be read in conjunction with accompanying report.
Prepared By: RM Checked By: STH

December 2017 TABLE B-II
POST-DEVELOPMENT INTERIM SCENARIOWITH 10% REDUCTION TO WOODLOT
Parker SWMF-SubdivisionLondon, Ontario
1542040-3000Page 1 of 1
Catchment 203a 203b 203c
Ground Cover
Urban Lawns (Parker) Mature Forest
Moderately Rooted Crops
(Van Hie)Hydrologic Soil Group CD CD CDArea m2 117,700 177,000 136,000Impervious % 40% 0% 0%Water Holding Capacity mm 125 400 200
Precipitation, P m/year 1.012 1.012 1.012Evapotranspiration, E m/year 0.346 0.592 0.585Surplus m/year 0.666 0.420 0.427
Ground Cover Factor - 0.10 0.20 0.10Soils Factor - 0.10 0.15 0.15Topography Factor - 0.20 0.20 0.20Infiltration Factor (sum) - 0.40 0.55 0.45
Recharge, QG m/year 0.160 0.231 0.192Runoff, QS m/year 0.506 0.189 0.235
Annual volumePrecipitation m3/year 119,112 179,124 137,632
Evapotranspiration m3/year 40,748 104,784 79,560Recharge m3/year 18,808 40,887 26,132
Runoff m3/year 59,557 33,453 31,940
TotalPrecipitation, P 435,868 m3/yearEvapotranspiration, E 225,092 m3/yearRecharge, QG 85,827 m3/yearRunoff, QSW 124,950 m3/year
NOTES: 1. Table to be read in conjunction with accompanying report.
Prepared By: RM Checked By: STH

December 2017 TABLE B-III
POST-DEVELOPMENT ULTIMATE SCENARIOWITH 10% REDUCTION TO WOODLOT
Parker SWMF-SubdivisionLondon, Ontario
1542040-3000Page 1 of 1
Catchment 203a 203a 203b
Ground CoverUrban Lawns -
ParkerUrban Lawns -
Van Hie Mature Forest
Hydrologic Soil GroupCD CD CD
Area m2 117,700 72,760 177,000Impervious % 40% 45% 0%Water Holding Capacity mm 125 125 400
Precipitation, P m/year 1.012 1.012 1.012Evapotranspiration, E m/year 0.346 0.317 0.592Surplus m/year 0.666 0.695 0.420
Ground Cover Factor - 0.10 0.10 0.20Soils Factor - 0.10 0.10 0.15Topography Factor - 0.20 0.20 0.20Infiltration Factor (sum) - 0.40 0.40 0.55
Recharge, QG m/year 0.160 0.153 0.231Runoff, QS m/year 0.506 0.542 0.189
Annual volumePrecipitation m3/year 119,112 73,633 179,124
Evapotranspiration m3/year 40,748 23,090 104,784Recharge m3/year 18,808 11,119 40,887
Runoff m3/year 59,557 39,423 33,453
TotalPrecipitation, P 371,870 m3/yearEvapotranspiration, E 168,622 m3/yearRecharge, QG 70,814 m3/yearRunoff, QSW 132,433 m3/year
NOTES: 1. Table to be read in conjunction with accompanying report.
Prepared By: RM Checked By: STH

Golder Associates Ltd. 309 Exeter Road, Unit #1 London, Ontario, N6L 1C1 Canada T: +1 (519) 652 0099