f a o j e c f a m o n o g r a p h s veterinary … · residue evaluation of certain veterinary...
TRANSCRIPT

Joint FAO/WHO Expert Committee on Food Additives
75th meeting 2011
Joint FAO/WHO Expert Committee on Food Additives
75th meeting 2011
RESIDUE EVA LUATIONOF CERTA IN V ETERINA RY DRUGS
RESIDU
E EVALU
ATION
OF CERTA
IN VETERIN
ARY D
RUG
S
RESIDUE EVA LUATION OF CERTA IN V ETERINA RY DRUGS
F A O J E C F A M o n o g r a p h s
This document contains monographs on residue evaluations of certain
veterinary drugs, prepared at the seventy-fifth meeting of the Joint
FAO/WHO Expert Committee on Food Additives (JECFA), which was held
in Rome , Italy from 8 to 17 November 2011. Four substances were
evaluated for the first time for the animal species concerned -
amoxicillin, apramycin, derquantel and monepantel. Three substances
were reassessed, monensin, narasin and triclabendzole. Specifically,
narasin was reassessed for an analytical method in cattle tissues only
and triclabendazole for consideration only of extending the MRLs in
sheep to goat tissues. The residue monographs provide information on
chemical identity and properties of the compounds, pharmacokinetics
and metabolism, residue depletion studies and analytical methods
validated and used for the detection and quantification of the
compounds. This publication and other documents produced by JECFA
contain information that is useful to those who work with or are
involved with recommending or controlling maximum residue limits for
veterinary drugs in foods of animal origin.
ISSN 1817-7077
FAO
/ WH
O
12
12
I2766E/1/05.12
ISBN 978-92-5-107255-4 ISSN 1817-7077
9 7 8 9 2 5 1 0 7 2 5 5 4

FAO JECFA Monographs12
RESIDUE EVALUATION OF CERTAIN
VETERINARY DRUGS
Joint FAO/WHO Expert Committee on Food Additives
75th MeetingRome, Italy, 8–17 November 2011
FOOD AND AGRICULTURE ORGANIZATION OF THE UNITED NATIONSWORD HEALTH ORGANIZATION
Rome, 2012

The designations employed and the presentation of material in this information product do not imply the expression of any opinion whatsoever on the part of the Food and Agriculture Organization of the United Nations (FAO) concerning the legal or development status of any country, territory, city or area or of its authorities, or concerning the delimitation of its frontiers or boundaries. The mention of specific companies or products of manufacturers, whether or not these have been patented, does not imply that these have been endorsed or recommended by FAO in preference to others of a similar nature that are not mentioned.
The views expressed in this information product are those of the author(s) and do not necessarily reflect the views of FAO.
ISBN 978-92-5-107255-4
All rights reserved. FAO encourages reproduction and dissemination of material in this information product. Non-commercial uses will be authorized free of charge, upon request. Reproduction for resale or other commercial purposes, including educational purposes, may incur fees. Applications for permission to reproduce or disseminate FAO copyright materials, and all queries concerning rights and licences, should be addressed by e-mail to [email protected] or to the Chief, Publishing Policy and Support Branch, Office of Knowledge Exchange, Research and Extension, FAO, Viale delle Terme di Caracalla, 00153 Rome, Italy.
© FAO 2012

CONTENTS
List of participants v
Abbreviations vii
Introduction ix
1. Amoxicillin 1
2. Apramycin 35
3. Derquantel 71
4. Monensin 101
5. Monepental 113
6. Narasin. 133
7. Triclabendazole 151Annex 1. Summary of JECFA evaluations of veterinary drug residues from the 32nd
meeting to the present 167
Use of JECFA reports and evaluations by registration authorities
Most of the evaluations and summaries contained in this publication are based on unpublished proprietary data submitted to JECFA for use when making its assessment. A registration authority should not consider granting a registration based on an evaluation published herein unless it has first received authorization for such use from the owner of the data or any second party that has received permission from the owner for using the data.


v
LIST OF PARTICIPANTS
Seventy-fifth Meeting of the Joint FAO/WHO Expert Committee on Food Additives (JECFA)
Rome, Italy, 8–17 November 2011
Members Professor A. Anadón, Department of Toxicology and Pharmacology, Faculty of Veterinary Medicine,
Universidad Complutense de Madrid, Madrid, SpainDr D. Arnold, Consultant, Berlin, Germany (Vice-Chair) Professor A.R. Boobis, Centre for Pharmacology and Therapeutics, Department of Experimental Medicine,
Division of Medicine, Faculty of Medicine, Imperial College London, London, England, UK (Chair)Dr R. Ellis, Consultant, Myrtle Beach, SC, USA (Joint Rapporteur)Dr A. Fernández Suárez, Ciencias Veterinarias, Universidad del Salvador, Buenos Aires, ArgentinaDr L.G. Friedlander, Office of New Animal Drug Evaluation, Center for Veterinary Medicine, Food and Drug
Administration, Department of Health and Human Services, Rockville, MD, USA Dr K.J. Greenlees, Office of New Animal Drug Evaluation, Center for Veterinary Medicine, Food and Drug
Administration, Department of Health and Human Services, Rockville, MD, USA (Joint Rapporteur)Professor J. Palermo-Neto, Department of Pathology, Faculty of Veterinary Medicine, University of São Paulo,
São Paulo, BrazilProfessor Emeritus L. Ritter, University of Guelph, Guelph, Ontario, Canada Dr P. Sanders, Agence nationale de sécurité sanitaire de l’alimentation, de l’environnement et du travail
(ANSES) [National Reference Laboratory for Veterinary Drug Residues and Antimicrobial Resistance],Fougères, France
Professor G.E. Swan, Faculty of Veterinary Science, University of Pretoria, Onderstepoort, South Africa1
SecretariatDr J. Boison, Centre for Veterinary Drug Residues, Canadian Food Inspection Agency, Saskatoon,
Saskatchewan, Canada (FAO Expert)Dr A. Bruno, Joint FAO/WHO Food Standards Programme, Nutrition and Consumer Protection Division, Food
and Agriculture Organization of the United Nations, Rome, Italy (FAO Codex Secretariat)Dr C.E. Cerniglia, Division of Microbiology, National Center for Toxicological Research, Food and Drug
Administration, Department of Health and Human Services, Jefferson, AR, USA (WHO Temporary Adviser)Dr P.L. Chamberlain, Office of the Chief/Office of the Chief Scientist/Office of Counterterrorism and Emerging
Threats, Food and Drug Administration, Department of Health and Human Services, Silver Spring, MD, USA (WHO Temporary Adviser)
Dr S. Ghimire, Veterinary Drugs Directorate, Health Canada, Ottawa, Ontario, Canada (WHO Temporary Adviser)
Dr N. Jarrett, European Medicines Agency, London, England, UK (WHO Temporary Adviser)Professor S.H. Jeong, Department of Applied Biotoxicology, Hoseo University, Hoseo Toxicology Research
Centre, Asan City, Chungnam, Republic of Korea (WHO Temporary Adviser)Professor B. Le Bizec, Laboratoire d’Étude des Résidus et des contaminants dans les aliments (LABERCA),
École Nationale Vétérinaire, Agroalimentaire et de l’Alimentation Nantes Atlantique (ONIRIS), Nantes, France (FAO Expert)
Dr K. Ogawa, Division of Pathology, Biological Safety Research Center, National Institute of Health Sciences, Tokyo, Japan (WHO Temporary Adviser)
Dr F. Ramos, Bromatology, Pharmacognosy and Analytical Sciences Group, Pharmacy Faculty, Coimbra University, Coimbra, Portugal (FAO Expert)
1. Dr Swan was invited but unable to attend the meeting.

vi
Dr G. Roberts, Consultant, Preston, Victoria, Australia (WHO Temporary Adviser)Ms M. Sheffer, Orleans, Ontario, Canada (FAO/WHO Editor) Dr A. Tritscher, Department of Food Safety and Zoonoses, World Health Organization, Geneva, Switzerland
(WHO Joint Secretary)Dr P. Verger, Department of Food Safety and Zoonoses, World Health Organization, Geneva, Switzerland
(WHO Joint Secretary to JMPR)Dr A. Wennberg, Nutrition and Consumer Protection Division, Food and Agriculture Organization of the United
Nations, Rome, Italy (FAO Joint Secretary)

vii
ABBREVIATIONS
ADI Acceptable daily intakeADME Absorption, distribution, metabolism and excretionAOAC AOAC InternationalAUC Area under the curveBLQ Below limit of quantitationbw body weightCAC Codex Alimentarius CommissionCAS Chemical Abstracts ServiceCCRVDF Codex Committee on Residues of Veterinary Drugs in FoodsCL Clearance rateCmax Maximum concentrationCR Clearance (Renal)CV Coefficient of variationCvr ReproducabiltyCRC Controlled Release CapsuleECD Electron capture detectorEDI Estimated daily intakeF Bioavailability FAO Food and Agriculture Organization of the United NationsGC Gas chromatographyGLP Good laboratory practiceh hourHPLC High pressure liquid chromatographyi.m. intramuscular [injection]IR InfraredIUPAC International Union of Pure and Applied Chemistryi.v. intravenousJECFA Joint FAO/WHO Expert Committee on Food AdditivesJMPR Joint FAO/WHO Meeting on Pesticide Residueskg kilogram (103 g)L litreLC Liquid chromatographyLOD Limit of detectionLOQ Limit of quantitationLSC liquid scintillation countingμg microgram (10-6 g)mg milligram (10-3 g)min minimum or minuteml millilitreMRL maximum residue limit

viii
MRT mean residence timeMS mass spectrometryMW molecular weightng nanogram (10-9 g)NOAEL No observed adverse effect levelNQ Non-quantifiableQA Quality assuranceQC Quality controlRP Reverse phasersd Repeatability standard deviationRt retention times.c. subcutaneous [injection]SD Standard deviationSPE Solid phase extractiont½ Half lifeTR Total residueTMDI Theoretical maximum daily intakeTRR total radiolabelled residuesUV ultravioletVD volume of distributionVDSS volume of distribution at steady-stateWHO World Health Organization

ix
INTRODUCTION
The monographs in this volume of the FAO JECFA Monographs on the residues of, statements on, or other parameters of the veterinary drugs on the agenda were prepared by the invited experts for the Seventy-fifth Meeting of the Joint FAO/WHO Expert Committee on Food Additives (JECFA), held in Rome, Italy, 7–17-November 2011. This was the nineteenth meeting of JECFA convened specifically to consider residues of veterinary drugs in food-producing animal species. The Committee hadevaluated residues of veterinary drugs at its 12th, 26th, 27th, 32nd, 34th, 36th, 38th, 40th,42nd, 43rd, 45th, 47th, 48th, 50th, 52nd, 54th, 58th, 60th, 62nd, 66th and 70th meetings (JECFA, various dates 1969–2010). The tasks for the Committee were to further elaborate principles for evaluating the safety of residues of veterinary drugs in food and for establishing acceptable daily intakes (ADIs) and recommend maximum residue limits (MRLs) for substances on the agenda when they are administered to food-producing animals in accordance with good veterinary practice in the use of veterinary drugs. The enclosed monographs provided the scientific basis for the recommendations of MRLs.
There is an important feature to bring to the attention of readers. This volume of the FAO JECFA Monographs is the third in a new format for the presentation of monographs from meetings of the Committee specifically devoted to residues of specific veterinary drugs in food. It was also the seventh meeting of JECFA subsequent to the completion of the workshop to update the principles and methods of risk assessment for MRLs for pesticides and veterinary drugs, held jointly by FAO/RIVM/WHO, in Bilthoven, The Netherlands, 7–11 November 2005. The outcomes of this workshop are incorporated in the Environmental Health Criteria, No. 240, publication Principles and methods for the risk assessment of chemicals in food, WHO, 2009. Specifically, the Committee continued to implement some of the more significant recommendations in the workshop report, including the concept of using median residue values to estimate daily intakes of residues of veterinary drugs in food for chronic exposure intake estimates.
BackgroundIn response to the growing use of veterinary medicines in food animal production systems internationally and the potential implications for human health and fair trading practices, a Joint FAO/WHO Expert Consultation on Residues of Veterinary Drugs was convened in Rome inNovember 1984 (FAO/WHO, 1985). One of the major recommendations of this consultation was the establishment of the Codex Committee on Residues of Veterinary Drugs in Foods (CCRVDF) and the periodic convening of an appropriate expert body to provide independent scientific advice to this Committee and to member countries of FAO and WHO. At its first session, in Washington, DC, in November 1986, the CCRVDF reaffirmed the need for such a scientific body and made a number of recommendations and suggestions to be considered by JECFA (CCRVDF, 1986). In response to these recommendations, the 32nd JECFA meeting was devoted entirely to the evaluation of residues of veterinary drugs in food—a new responsibility for the Joint FAO/WHO Expert Committee on Food Additives. Nineteen such meetings of JECFA have been held prior to the meeting of JECFA reported here.
75th Meeting of JECFAThe present volume, in the new format, contains monographs on the residue data of seven of the substances scheduled for evaluation at the 75th Meeting of the Committee. Of the substances on the agenda, four were new evaluations (amoxicillin, apramycin, derquantel and monepental) and three were re-evaluations (monensin, narasin and triclabendazole). The re-evaluation of narasin was for a suitable analytical method in cattle tissues only. One substance, ivermectin, was originally scheduled for review by the Committee; however, there was no submission of new information regarding residues in food-producing animals on which to base any reconsideration of MRLs. The Committee noted that before it would re-evaluate the residue depletion of ivermectin and propose updated MRLs, it would need a submission indicating that a suitably validated analytical method with a limit of quantitation (LOQ) in the low μg/kg range for the marker residue has been used in the conduct of

x
depletion studies in fat, kidney, liver and muscle tissues of animals for which MRLs are requested. Aliterature review on the relevant toxicology to reconsider the acceptable daily intake (ADI) of ivermectin was conducted and a toxicological summary report was prepared for the Committee.
The monographs are prepared in a uniform format consistent with the data provided and the specific request for risk assessment by CCRVDF. The format includes identity of substance, residues in food and their evaluation, metabolism studies, tissue residue depletion studies, methods of residue analysis, a final appraisal of the study results, and if appropriate, recommendations on MRLs. A summary of the recommendations on compounds on the agenda and further information required is included in Annex 1. In addition, a summary of JECFA evaluations of residues of veterinary drugs in foods from the 32nd meeting to the present 75th meeting can be found in Annex 2.
The monographs and general considerations on risk assessment principles of this volume must be considered in the context of the full report of the meeting, which will be published in the WHO Technical Report Series.
On-line editions of Residues of some veterinary drugs in animals and foods (from FAO JECFA Monographs and FAO Food and Nutrition Paper, No. 41) are available. The monographs and statements that have been published in FAO JECFA Monographs No. 2 and this volume, as well as those published in FAO Food and Nutrition Paper, No. 41 (sixteen volumes since 1988) are all available online at http://www.fao.org/ag/agn/jecfa-vetdrugs/search.html. The search interface is available in five languages (Arabic, Chinese, English, French and Spanish) and allows searching for compounds, functional classes, ADI and MRL status.
Contact and feedbackMore information on the work of the Committee is available from FAO.
REFERENCES
CCRVDF. 1986. Report of the First Session of the Codex Committee on Residues of Veterinary Drugs in Foods. Washington, D.C., 27–31 October 1986.
FAO/WHO. 1985. Residues of Veterinary Drugs in Foods. Report of a Joint FAO/WHO Consultation, Rome, 29 October–5 November 1984. FAO Food and Nutrition Paper, No. 32.
JECFA [Joint FAO/WHO Expert Committee on Food Additives]. 1969. Specifications for the Identity and Purity of Food Additives and their Toxicological Evaluation: Some antibiotics (Twelfth Report of the Joint FAO/WHO Expert Committee on Food Additives). FAO Nutrition Meetings Report Series, No. 45; WHO Technical Report Series, No. 430.
JECFA. 1982. Evaluation of Certain Food Additives and Contaminants (Twenty-sixth Report of the Joint FAO/WHO Expert Committee on Food Additives). WHO Technical Report Series, No. 683.
JECFA. 1983. Evaluation of Certain Food Additives and Contaminants (Twenty-seventh Report of the Joint FAO/WHO Expert Committee on Food Additives). WHO Technical Report Series, No. 696.
JECFA. 1988. Evaluation of Certain Veterinary Drug Residues in Foods (Thirty-second Report of the Joint FAO/WHO Expert Committee on Food Additives). WHO Technical Report Series, No. 763.
JECFA. 1989. Evaluation of Certain Veterinary Drug Residues in Foods (Thirty-fourth Report of the Joint FAO/WHO Expert Committee on Food Additives). WHO Technical Report Series, No. 788.
JECFA. 1990. Evaluation of Certain Veterinary Drug Residues in Foods (Thirty-sixth Report of the Joint FAO/WHO Expert Committee on Food Additives). WHO Technical Report Series, No. 799.
JECFA. 1991. Evaluation of Certain Veterinary Drug Residues in Foods (Thirty-eighth Report of the Joint FAO/WHO Expert Committee on Food Additives). WHO Technical Report Series, No. 815.
JECFA. 1993. Evaluation of Certain Veterinary Drug Residues in Foods (Fortieth Report of the Joint FAO/WHO Expert Committee on Food Additives). WHO Technical Report Series, No. 832.
JECFA. 1995. Evaluation of Certain Veterinary Drug Residues in Foods (Forty-second Report of the Joint FAO/WHO Expert Committee on Food Additives). WHO Technical Report Series, No. 851.
JECFA. 1995. Evaluation of Certain Veterinary Drug Residues in Foods (Forty-third Report of the Joint FAO/WHO Expert Committee on Food Additives). WHO Technical Report Series, No. 855.

xi
JECFA. 1996. Evaluation of Certain Veterinary Drug Residues in Foods (Forty-fifth Report of the Joint FAO/WHO Expert Committee on Food Additives). WHO Technical Report Series, No. 864.
JECFA. 1998. Evaluation of Certain Veterinary Drug Residues in Foods (Forty-seventh Report of the Joint FAO/WHO Expert Committee on Food Additives). WHO Technical Report Series, No. 876.
JECFA. 1998. Evaluation of Certain Veterinary Drug Residues in Foods (Forty-eighth Report of the Joint FAO/WHO Expert Committee on Food Additives). WHO Technical Report Series, No. 879.
JECFA. 1999. Evaluation of Certain Veterinary Drug Residues in Foods (Fiftieth Report of the Joint FAO/WHO Expert Committee on Food Additives). WHO Technical Report Series, No. 888.
JECFA. 2000. Evaluation of Certain Veterinary Drug Residues in Foods (Fifty-second Report of the Joint FAO/WHO Expert Committee on Food Additives). WHO Technical Report Series, No. 893.
JECFA. 2001. Evaluation of Certain Veterinary Drug Residues in Foods (Fifty-fourth Report of the Joint FAO/WHO Expert Committee on Food Additives). WHO Technical Report Series, No. 900.
JECFA. 2001. Evaluation of Certain Veterinary Drug Residues in Foods (Fifty-eighth report of the Joint FAO/WHO Expert Committee on Food Additives). WHO Technical Report Series, No. 900.
JECFA. 2003. Evaluation of Certain Veterinary Drug Residues in Foods (Sixtieth report of the Joint FAO/WHO Expert Committee on Food Additives). WHO Technical Report Series, No. 918.
JECFA. 2004. Evaluation of Certain Veterinary Drug Residues in Animals and Foods (Sixty-second report of the Joint FAO/WHO Expert Committee on Food Additives). WHO Technical Report Series, No. 925.
JECFA. 2006. Evaluation of Certain Veterinary Drug Residues in Animals and Foods (Sixty-sixth report of the Joint FAO/WHO Expert Committee on Food Additives). WHO Technical Report Series, No. 939.
JECFA. 2009. Residue Evaluation of Certain Veterinary Drugs in Animals and Foods (Seventieth report of the Joint FAO/WHO Expert Committee on Food Additives). WHO Technical Report Series, No. 954.
JECFA. 2010. Residue Evaluation of Certain Veterinary Drugs (Meeting 2010 – Evaluation of data on ractopamine residues in pig tissues – Joint FAO/WHO Expert Committee on Food Additives). FAO JECFA Monographs, No. 9.


AmoxicillinFirst draft prepared by
Fernando Ramos, Coimbra, PortugalJoe Boison, Saskatoon, Canada
andLynn G. Friedlander, Rockville, MD, USA
IDENTITY
International Non-proprietary names (INN): Amoxicillin, formerly AmoxycillinSynonyms: Amox; AMC; Amoxicillin trihydrate; Amoxicillin anhydrous; Amoxycillin trihydrate; D-
Amoxicillin; p-Hydroxyampicillin IUPAC Names: (2S,5R,6R)- 6-{[(2R)-2-amino- 2-(4-hydroxyphenyl)- acetyl]amino}- 3,3-dimethyl-
7-oxo- 4-thia- 1-azabicyclo[3.2.0]heptane- 2-carboxylic acid[2S - [2 ,5 ,6 (S*)]] - 6 - [[Amino (4 - hydroxyphenyl)acetyl]amino] - 3,3 - dimethyl - 7 -
oxo - 4 - thia - 1 – azabicyclo [3.2.0] heptane - 2 - carboxylic acidChemical Abstract Service No.: Amoxicillin: 26787-78-0, Amoxicillin trihydrate: 61336-70-7Structural formula of main components:
Molecular formula: C16H19N3O5SMolecular weight: Amoxicillin: 365.40; Amoxicillin trihydrate: 419.41
OTHER INFORMATION ON IDENTITY AND PROPERTIES
Pure active ingredient: AmoxicillinAppearance: Powder/Crystalline solidMelting point: 194°CpH: 4.4–4.9 (0.25% w/v solution)Optical rotation: +290°–315°Solubility: 3430 mg/L waterUVmax: 272 nm (water)Partition coefficient: -2.69Stability to acids and bases: Amoxicillin is stable in the presence of gastric acid

2
RESIDUES IN FOOD AND THEIR EVALUATION
Conditions of useAmoxicillin is a broad-spectrum, pharmacologically active beta-lactam antibiotic effective against Gram-positive and Gram-negative bacteria. Amoxicillin is stable in the gastro-intestinal tract and has higher absorption than naturally occurring penicillins when administrated orally. Amoxicillin is a widely used antibiotic in human and veterinary medicine for the treatment and prevention of respiratory, gastrointestinal, urinary and skin bacterial infections due to its pharmacological and pharmacokinetic properties (Sousa, 2005). Amoxicillin is de-activated by bacterial -lactamase or penicillinases. In human medicine amoxicillin is commonly used in combination with clavulanic acid, a penicillinase inhibitor; it is not normally used with clavulanic acid in veterinary use.
Amoxicillin is used in many domestic and food animals, including cats, dogs, pigeons, horses, broiler chickens, pigs, goats, sheep, pre-ruminating calves (including veal calves) and cattle. In dogs and cats, amoxicillin is used in respiratory and urinary infections and in soft tissue wounds caused by Gram-positive and Gram-negative pathogenic bacteria (Pfizer, 2004). In poultry, amoxicillin is used for the treatment of susceptible infections of the alimentary, urogenital and respiratory tracts (APVMA, 2007). In pigs, amoxicillin is used to treat major respiratory tract pathogens, mainly caused by Actinobacillus pleuropneumoniae, Streptococcus suis and Pasteurella multocida. Amoxicillin also is used against some digestive and urinary tract pathogens, such as Escherichia coli and Streptococcus suis (Hernandez et al., 2005; Reyns et al., 2008a). In sheep, amoxicillin is used for the treatment of bacterial pneumonia due to Pasteurella spp. and Haemophilus spp. (FDA, 1999). In goats, amoxicillin is indicated for the treatment of respiratory tract infections caused by, among other microorganisms, Mannheimia haemolytica, P. multocida, H. somnus, but not for penicillinase-producing S. aureus(Baggot, undated). Amoxicillin also is used in pre-ruminating calves for treatment of bacterial enteritis due to E. coli, and in cattle for treatment of respiratory tract infections, including shipping fever and pneumonia due to P. multocida, M. haemolytica, Haemophilus spp., Streptococcus spp. and Staphylococcus spp., and for acute necrotic pododermititis (foot rot) due to Fusobacterium necrophorum (FDA, 2011). Amoxicillin is also approved for use in lactating dairy cows by intramammary infusion with a suspension of amoxicillin trihydrate containing the equivalent of 62.5 mg of amoxicillin per disposable syringe for each infected quarter (Schering-Plough, 2007).
DosageIn food-producing animals, amoxicillin is approved for use as amoxicillin trihydrate for oral suspensions equivalent to 40 mg amoxicillin twice daily for piglets under 4.5 kg; a soluble powder of amoxicillin trihydrate at 400 mg/45.5 kg body weight (bw) twice daily for pre-ruminating calves,including veal calves, administered by drench or by mixing in milk; amoxicillin trihydrate boluses containing 400 mg of amoxicillin per 45.5 kg bw for pre-ruminating calves, including veal calves; and as a sterile amoxicillin trihydrate powder for use as a suspension at 6.6–11 mg/kg bw once a day, administered by intramuscular (i.m.) or subcutaneous (s.c.) injection in cattle. For sheep, amoxicillin is approved for use as a sterile i.m. injection suspension containing 50 mg/ml at a dose rate of 7 mg/kg bw once a day; as a 150 mg/ml long-acting amoxicillin trihydrate oily i.m. injection suspension at 15 mg/kg bw every two days; and as a 200 mg/ml i.m. injection at 1 ml/20 kg bw for cattle, sheep and pigs (Virbac, 2008, 2011).
PHARMACOKINETICS AND METABOLISM
Pharmacokinetics in laboratory animals Rats Amoxicillin was administered to 11 rats at 50 mg/kg bw as a bolus dose. Microdialysis samples were collected over 180 minutes to determine the amount of unbound drug in blood and muscle (Marchand et al., 2005). A two-compartment pharmacokinetic model adequately described the unbound amoxicillin concentration-time profiles in both matrices. The results obtained are represented in

3
Figure 1.1. Amoxicillin was distributed rapidly and extensively within muscle and interstitial fluid,indicating that alterations in muscle blood flow seem unlikely to have a major effect on drug distribution characteristics.
Figure 1.1. Unbound amoxicillin concentrations in blood and muscle of rats after intravenous (i.v.) bolus administration of amoxicillin at 50 mg/kg bw.NOTES: Concentrations (mean ± SD) in blood (solid circles and solid line, n=11) and in muscle (open circles and dashed line, n=11)
Two pharmacokinetic studies were conducted to investigate the distribution of amoxicillin in rat tissues. In a Good Laboratory Practice (GLP)-compliant study using 12 healthy male Wistar rats, 3 hafter a single oral administration of amoxicillin (15 or 60 mg/kg) the drug was distributed extensively in the microvilli, nuclei and cytoplasm of the absorptive epithelial cells of the intestine, in the cytoplasm and nuclei of the hepatocytes and on the luminal surface of the capillaries, intercalated portions, and interlobular bile ducts. Although almost no amoxicillin could be detected 6 h post-administration in either the intestine or the liver, it persisted until 12 h in the kidney (Fujiwara et al.,2011). The second study (non-GLP-compliant) reported that, after a single oral dose of amoxicillin at 100 mg/kg to 6 rats, the drug distributed preferentially to liver and kidney (Sakamoto, Hirose andMine, 1985).
DogsSix dogs were dosed orally with three formulations of amoxicillin to evaluate the effect of drug formulation on oral bio-availability: a 60 ml suspension administered by an intragastric tube; 3 ml ofamoxicillin drops; or in tablet form. The liquid forms of the drug tended to be more readily absorbed than the tablets (i.e. higher bio-availability) in comparison with that calculated for the suspension (76.8 ± 16.7%) and the drops (68.2 ± 25.8%) versus the tablets (64.2 ± 17%). However, the differences between their pharmacokinetic parameters (Cmax, tmax and AUC) were not statistically significant. The drops and tablets had similar pharmacokinetic profiles in the dogs and are regarded as equivalent in this species (Kung and Wanner, 1994).
Among a variety of species tested, amoxicillin distribution was independent of the binding percentage to plasma proteins (<40% in human, dog, rabbit, rat and mouse) (Sakamoto, Hirose andMine, 1985).
Pharmacokinetics in food-producing animalsFish A study was conducted to determine amoxicillin residues in catfish muscle after oral administration (Ang et al., 2000). Fish weighing 0.5–1.0 kg were maintained in indoor tanks prior to treatment. Using

4
a plastic pipette, 110 mg of amoxicillin/kg bw was administrated. Five fish were collected at each time interval for depletion periods up to 72 h post-dosing. Table 1.1 indicates the amoxicillin contents of individual fish after oral administration of the drug and depletion. All samples were analysed by a HPLC-Fluorescence method with a limit of quantitation limit (LOQ) of 1.2 μg/kg. Amoxicillin residues depleted rapidly from catfish during the first 24 h. After that the concentrations were <10 μg/kg, decreasing to <1.2 μg/kg after 72 h.
Table 1.1. Amoxicillin concentration in individual fish after oral administration of 110 mg/kg bw
Depletion time (h) Fish weight (kg) Mean concentration of amoxicillin (μg/kg)6 0.76 64.2
0.56 50.60.38 60.50.48 40.00.66 297
24 0.38 <LOQ0.36 7.30.32 3.70.44 7.00.52 7.9
48 0.50 <LOQ0.46 1.40.54 6.90.70 2.80.38 1.9
72 0.48 <LOQ0.30 <LOQ0.44 <LOQ0.36 <LOQ0.36 <LOQ
ChickenAmoxicillin was given to two groups of eight chickens at a dose of 10 mg/kg bw, intravenously or orally (Anadón et al., 1996). Blood samples were collected at 0.25, 0.5, 1, 2, 4, 6, 8, 10, 12 and 24 hafter drug administration. Plasma was separated and analysed by HPLC with UV detection. As can be seen in Figure 1.2, elimination profiles of amoxicillin were similar when administrated either i.v. or oral.
Figure 1.2. Plasma concentration of amoxicillin in chickens after intravenous ( ) or oral ( ) administration of 10mg/kg bw

5
Following oral administration, the maximum plasma concentration occurred at 1.00 ± 0.06 h with a Cmax of 160.40 ± 4.67 μg/ml (Table 1.2). Amoxicillin concentrations in plasma declined slowly and concentrations greater than 15 μg/ml persisted up to 24 h after oral administration (Figure 1.2). The values of the kinetic parameters that describe the absorption and disposition kinetics of amoxicillin are given in Table 1.2.
Table 1.2. Pharmacokinetic parameters (mean ± SD) of amoxicillin in eight chickens after intravenous or oral dosing of 10 mg/kg bw
Parameter Intravenous OralA1 (μg/ml) 850.23 ± 21.95 220.04 ± 43.30A2 (μg/ml) 182.12 ± 8.72 107.53 ± 7.56A3 (μg/ml) 342.54 ± 44.79
(h-1) 3.05 ± 0.11 0.77 ± 0.11
(h-1) 0.086 ± 0.003 0.078 ± 0.005
Ka (h-1) 2.39 ± 0.13t½ (h) 0.23 ± 0.01* 1.00 ± 0.10t½ (h) 8.17 ± 0.31 9.16 ± 0.60t½a (h) 0.30 ± 0.02Vd(area) (L/kg) 0.049 ± 0.002 0.054 ± 0.003Vd(ss) (L/kg) 0.042 ± 0.002K12 (h-1) 2.09 ± 0.09 0.31 ± 0.07K21 (h-1) 0.61 ± 0.03 0.37 ± 0.04K10 (h-1) 0.43 ± 0.03 0.16 ± 0.01AUC (mg/h/L) 2449.3 ± 174.8 1534.6 ± 114.9F (%) 63.00 ± 4.58MRT (h) 10.46 ± 0.51 12.26 ± 0.81CL (L/h/kg) 0.004 ± 0.001 0.004 ± 0.001K12/K21 3.45 ± 0.12 0.83 ± 0.12K12/K10 5.02 ± 0.50 1.91 ± 0.30K21/K10 1.48 ± 0.17 2.40 ± 0.28Cmax (μg/ml) 160.40 ± 4.67Tmax (h) 1.00 ± 0.06
NOTES: * = Significantly different between dosing routes (P<0.05)
CattleSix calves were fed milk replacer containing 0.25, 1.0 or 2.0 g of amoxicillin/ml at 6% body weight twice daily, for three consecutive feedings (Musser et al., 2001). Amoxicillin was quantified in serum and urine 3, 6, 9 and 15 h after drinking medicated milk replacer. By 24 h after the final feeding, no amoxicillin was detected in urine.
In a study with 8 pre-ruminating calves, three amoxicillin sodium preparations were compared for urinary excretion related to serum concentrations following i.m. administration (Palmer, 1975a).Although the serum profiles were different, renal clearance of approximately 200 ml/minute was observed at 2–8 h post-treatment and 48–52% of the administrated dose was recovered in the urine collected from 0–8 h post-treatment.
In the first formulation (aqueous suspension), 3 pre-ruminating calves received a dose of 7 mg/kg bw. An additional 3 pre-ruminating calves were treated with a 10.5 mg/kg bw oily suspension and the other 2 pre-ruminating calves were treated with a 7 mg/kg bw aqueous solution. Urine samples were collected at 0.25, 0.5, 1, 2, 4, 6, 8 and 24 h. Total urine was collected for time periods 1–2 h, 4–6 h, 6–8 h and 8–24 h. Blood concentrations from the aqueous suspension produced mean peak serum concentrations of 2.0–2.5 μg/ml that was sustained for 6 h, declining to 1.5 μg/ml at 8 h. Animals

6
treated with the oily suspension showed a similar profile, with peak mean serum levels of 3.0 μg/ml at 2–3 h post dosing.
Pre-ruminating calves treated with the aqueous solution showed a peak mean serum concentration of 7.0–7.5 μg/ml 15 minutes post-treatment, and rapidly declined below the other formulations at 3 hpost-treatment. Urine collections showed that 50–60% of the drug could be recovered from the urine in the 24 h following i.m. administration independent of the formulation used, with the majority of the excreted dose recovered in the first 8 h (48–52%). The quantity of amoxicillin excreted was proportional to the serum amount for a given urine collection period. Rates of renal plasma clearance were calculated (approximately 200 ml/min in plasma) for each product tested.
In a study of 16 pre-ruminating calves, amoxicillin was administered orally at 7 mg/kg bw. Two animals were slaughtered at each time point (0.5, 1, 2, 3, 4, 6, 8, 12 and 24 h) and serum concentrations determined. Peak serum concentrations were 1.92–2.06 μg/ml at 2–3 h, declining to 0.2–0.4 μg/ml at 6–8 h post-treatment. Highest concentrations occurred in the alimentary tract. Concentrations persisted throughout the small intestine and colon for at least 8 h. Urine concentrations ranged from 6 μg/ml at 30 minutes to a peak concentration of 160 μg/ at 4 h. Amoxicillin concentrations were above 50 μg/ml from 1–12 h post-treatment (Palmer, 1975b; Palmer, Bywater and Francis, 1977).
Six calves were treated with an i.m. injection of amoxicillin at 7 mg/kg bw. Serum samples were collected at 0.25, 0.5, 1, 2, 3, 4 and 6 h post-treatment. Highest residues were in body fluids, bile and urine. Mean peak serum concentrations were 3.5–3.6 μg/ml at 1–2 h post treatment. High concentrations persisted in the small intestine for prolonged periods (Palmer, 1975c).
Sixteen pre-ruminating calves received an amoxicillin oral dose of 7 mg/kg bw administered with an oral doser using a 50 mg/ml formulated concentration. Two calves were slaughtered at 0.5, 1, 2, 3, 4, 6, 8, 12 and 24 h post dose. Peak serum concentrations of 0.7–1.6 μg/ml were found at 4 h and declined to 0.3–0.4 μg/ml at 8 h post-treatment. High amoxicillin concentrations persisted in the small intestine for prolonged periods. Concentrations were approximately ten-fold higher in urine than in serum, although at maximum serum concentration, at approximately 4 h, the ratio was approximately six-fold higher. Peak urine concentration occurred at 8 h. Data indicate that only a small proportion of the dose is absorbed and distributed throughout the tissues when using the oral doser (Palmer, 1975d).
In another pharmacokinetic study in pre-ruminating calves, five animals were treated intravenously with sodium amoxicillin or sodium ampicillin at a dose of 7 mg/kg bw. Blood samples were collected from 15 min to 8 h and assayed using a microbiological method. Results were best fitted by a bi-exponential curve and a two compartmental model. The total volume of distribution was the same for amoxicillin or ampicillin (96%). The serum half-life for the terminal phase for amoxicillin (91 ± 5 min) was longer than for ampicillin (73 ± 7 min) (Palmer, 1976).
PigsSeveral pharmacokinetic studies were conducted in pigs in which animals were treated withamoxicillin by different routes of administration: intravenous (i.v.), i.m. or oral. After i.v.administration, amoxicillin is rapidly distributed and eliminated, as suggested by the low values forvolume of distribution at steady-state (VDSS) and its low mean residence times (MRT). Different absolute bio-availability percentages were calculated after oral administration, ranging from 11 to 50%, depending on the formulation type and administration under fed or fasting conditions.
A GLP-compliant comparative cross-over trial was performed in pigs treated with amoxicillin by i.v., i.m. and oral routes in order to investigate the bio-availability of various drug formulations, including: a sodium salt for reconstitution in water and administered intravenously, a trihydrate salt in an oil base administered intramuscularly to produce a conventional duration of plasma concentrations;a trihydrate salt in oil base administered intramuscularly to product a prolonged duration of plasma concentrations; and a trihydrate powder for oral administration as a solution. The concentrations of amoxicillin in plasma were measured by HPLC-Fluorescence and its pharmacokinetic variables were assessed for the individual pigs, using non-compartmental methods. Following i.v. administration (8.6 mg/kg bw), amoxicillin was rapidly eliminated with a MRT of 1.4 h. After i.m. administration of the conventional formulation (14.7 mg/kg bw), the plasma amoxicillin concentration peaked at 2 h at
7
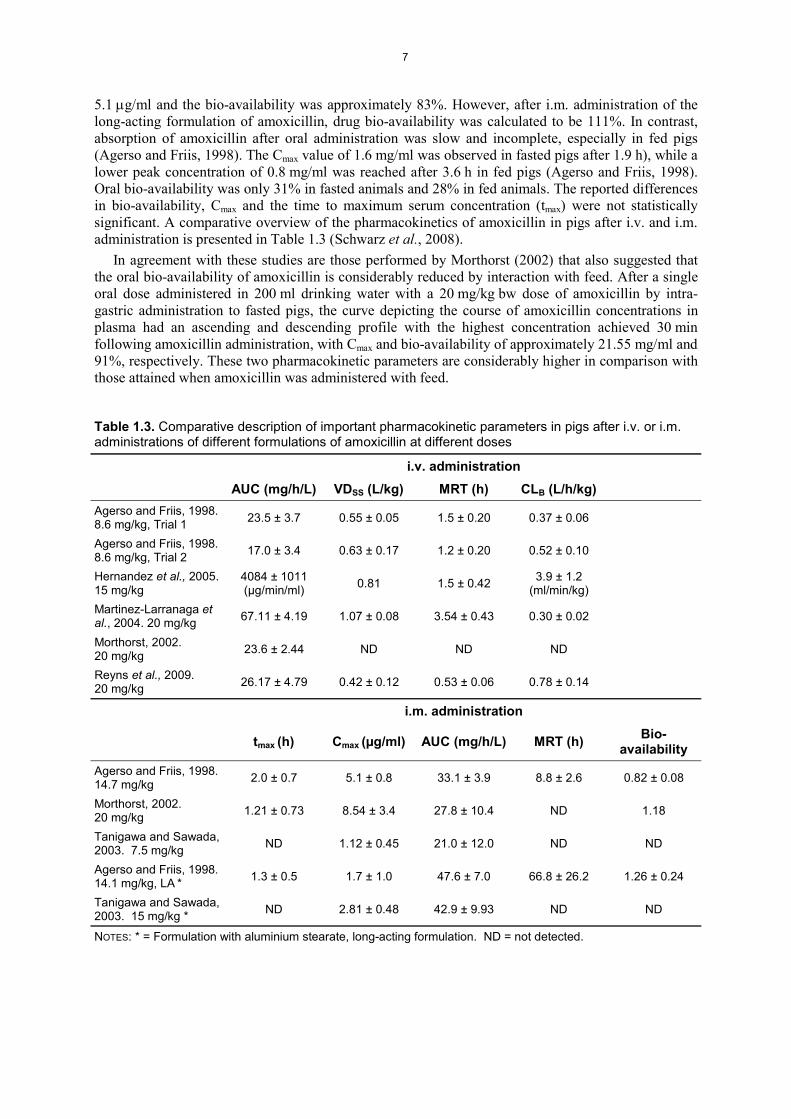
5.1 g/ml and the bio-availability was approximately 83%. However, after i.m. administration of the long-acting formulation of amoxicillin, drug bio-availability was calculated to be 111%. In contrast, absorption of amoxicillin after oral administration was slow and incomplete, especially in fed pigs (Agerso and Friis, 1998). The Cmax value of 1.6 mg/ml was observed in fasted pigs after 1.9 h), while a lower peak concentration of 0.8 mg/ml was reached after 3.6 h in fed pigs (Agerso and Friis, 1998). Oral bio-availability was only 31% in fasted animals and 28% in fed animals. The reported differences in bio-availability, Cmax and the time to maximum serum concentration (tmax) were not statistically significant. A comparative overview of the pharmacokinetics of amoxicillin in pigs after i.v. and i.m.administration is presented in Table 1.3 (Schwarz et al., 2008).
In agreement with these studies are those performed by Morthorst (2002) that also suggested that the oral bio-availability of amoxicillin is considerably reduced by interaction with feed. After a single oral dose administered in 200 ml drinking water with a 20 mg/kg bw dose of amoxicillin by intra-gastric administration to fasted pigs, the curve depicting the course of amoxicillin concentrations in plasma had an ascending and descending profile with the highest concentration achieved 30 min following amoxicillin administration, with Cmax and bio-availability of approximately 21.55 mg/ml and 91%, respectively. These two pharmacokinetic parameters are considerably higher in comparison with those attained when amoxicillin was administered with feed.
Table 1.3. Comparative description of important pharmacokinetic parameters in pigs after i.v. or i.m. administrations of different formulations of amoxicillin at different doses
i.v. administrationAUC (mg/h/L) VDSS (L/kg) MRT (h) CLB (L/h/kg)
Agerso and Friis, 1998.8.6 mg/kg, Trial 1 23.5 ± 3.7 0.55 ± 0.05 1.5 ± 0.20 0.37 ± 0.06
Agerso and Friis, 1998.8.6 mg/kg, Trial 2 17.0 ± 3.4 0.63 ± 0.17 1.2 ± 0.20 0.52 ± 0.10
Hernandez et al., 2005.15 mg/kg
4084 ± 1011(μg/min/ml) 0.81 1.5 ± 0.42 3.9 ± 1.2
(ml/min/kg)Martinez-Larranaga et al., 2004. 20 mg/kg 67.11 ± 4.19 1.07 ± 0.08 3.54 ± 0.43 0.30 ± 0.02
Morthorst, 2002.20 mg/kg 23.6 ± 2.44 ND ND ND
Reyns et al., 2009.20 mg/kg 26.17 ± 4.79 0.42 ± 0.12 0.53 ± 0.06 0.78 ± 0.14
i.m. administration
tmax (h) Cmax (μg/ml) AUC (mg/h/L) MRT (h) Bio-availability
Agerso and Friis, 1998.14.7 mg/kg 2.0 ± 0.7 5.1 ± 0.8 33.1 ± 3.9 8.8 ± 2.6 0.82 ± 0.08
Morthorst, 2002.20 mg/kg 1.21 ± 0.73 8.54 ± 3.4 27.8 ± 10.4 ND 1.18
Tanigawa and Sawada,2003. 7.5 mg/kg ND 1.12 ± 0.45 21.0 ± 12.0 ND ND
Agerso and Friis, 1998.14.1 mg/kg, LA * 1.3 ± 0.5 1.7 ± 1.0 47.6 ± 7.0 66.8 ± 26.2 1.26 ± 0.24
Tanigawa and Sawada,2003. 15 mg/kg * ND 2.81 ± 0.48 42.9 ± 9.93 ND ND
NOTES: * = Formulation with aluminium stearate, long-acting formulation. ND = not detected.

8
Sheep and goatsThe disposition of amoxicillin was studied after i.v. administration of 20 mg/kg bw single doses to 10 lactating goats. Blood samples were collected at 0, 0.05, 0.10, 0.15, 0.25, 0.5, 0.75, 1, 1.25, 1.5, 2, 3, 4, 5, 7 and 9 h post-dosing (Escudero, Carceles and Vicente, 1996). The plasma concentration-time data were analysed by compartmental pharmacokinetics and non-compartmental methods. The results are depicted in Table 1.4. The disposition curves for both were best described by a bi-exponential equation (two-compartment open model). The study demonstrated that amoxicillin is rapidly distributed and slowly eliminated. Additionally, the half-lives and body clearances of amoxicillin and clavulanic acid did not differ significantly when administered alone or in combination.
Table 1.4. Pharmacokinetic parameters of amoxicillin after i.v. administration to goats at 20mg/kg bw
Pharmacokinetic parameter Mean ± SDAUC (mg/h/L) 163.18 ± 22.15MRT (h) 1.47 ± 0.19CL (L/h/kg) 0.12 ± 0.01VDSS (L/kg) 0.16 ± 0.02
A study using 10 sheep was designed to examine the pharmacokinetics of amoxicillin sodium salt after i.v. and i.m. administration and after i.m. administration of a suspension of the trihydrate salt to sheep. Animals were allocated to sequences of treatment according to a crossover design: a single dose of 10 mg/kg of a solution of sodium amoxicillin for i.v. and i.m. administration and the same dose of a suspension of trihydrate amoxicillin for i.m. administration. Sampling was done before treatment and 1, 5, 10, 15, 30 and 45 min and 1, 1.5, 2, 2.5 and 3 h after the i.m. administration; before treatment and 5, 10, 15, 30 and 45 min and 1, 1.5, 2, 3, 4 and 5 h after the i.m. administration of sodium amoxicillin;and before treatment and 15, 30 and 45 min and 1, 1.5, 2, 4, 6, 8, 10 and 12 h after the i.m.administration of amoxicillin trihydrate. Amoxicillin disposition was best described by a bi-exponential equation. The results are summarized in Table 1.5. The rapid disposition constant ( ) of 14.36 ± 5.30/h and the slow disposition constant ( ) of 1.92 ± 0.48/h indicate a rapid distribution and elimination of the drug following i.v. administration. Following i.m. administration of sodium amoxicillin, a greater antibiotic persistence was observed in plasma in comparison with i.v.administration. A slower disappearance was observed with the trihydrate amoxicillin suspension relative to the sodium amoxicillin administered by the same route. The absolute bio-availability of trihydrate amoxicillin suspension was 73%, which was similar to that obtained with sodium amoxicillin (69%) (Fernandez et al., 2007).
Table 1.5. Pharmacokinetic parameters of amoxicillin in sheep after i.v. and i.m. administration at a dose of 10 mg/kg bw
i.v. administration i.m. administrationSodium amoxicillin Sodium amoxicillin Trihydrate amoxicillin
Parameter Mean ± SD Parameter Mean ± SD Parameter Mean ± SDAUC0-(μg/h/L) 21.83 ± 8.00 AUC0-
(μg/h/L) 15.05 ± 1.82 AUC0-(μg/h/L) 15.40 ± 1.05
MRT (h) 0.48 ± 0.15 MRT (h) 1.07 ± 0.30 MRT (h) 8.57 ± 2.78(h-1) 14.36 ± 5.30 Cmax (μg/L) 13.42 ± 5.36 Cmax (μg/L) 2.48 ± 0.54(h-1) 1.92 ± 0.48 tmax(h) 0.36 ± 0.21 tmax(h) 0.98 ± 0.15
t1/2 (h) 0.38 ± 0.09 t1/2 (h) 0.55 ± 0.15
Two comparative pharmacokinetic studies were performed to investigate whether inter-species differences in amoxicillin disposition could exist after drug i.v. administration (single dose of 10 mg/kg) to sheep and goats (Craigmill, Pass and Wetzlich, 1992.; Elsheikh et al., 1999). Results are

9
summarized in Tables 1.6 and 1.7, respectively. Both studies revealed no significant differences between any of the pharmacokinetic parameters measured in sheep and goats.
Table 1.6. Pharmacokinetic parameters of amoxicillin in sheep and goats after i.v. administration of a single amoxicillin dose at 10 mg/kg bw (Craigmill, Pass and Wetzlich, 1992)
Pharmacokinetic parameter Sheep (n=6) Mean ± SD Goats (n=5) Mean ± SDAUC (μg/min/ml) 1004 ± 111 895 ± 129CL (ml/min/kg) 10.1 ± 1.1 11.41 ± 1.61VD (ml/kg) 667 ± 106 953 ± 350VDSS (ml/kg) 220 ± 20 470 ± 259t1/2 (min) 11. ± 7- 10. ± 5-t1/2 (min) 46. ± 3 66 ± .9-
Table 1.7. Pharmacokinetic parameters of amoxicillin in sheep and goats after i.v. administration of single amoxicillin dose at 10 mg/kg bw (Elsheikh et al., 1999)
Pharmacokinetic parameter Sheep (n=5) Mean ± SD Goats (n=5) Mean ± SDAUC (μg.min/ml) 1603.47 ± 233.03 1832.73 ± 289.68CL (ml/min.kg) 6.34 ± 1.03 5.42 ± 0.78VDSS (L/kg) 0.46 ± 0.08 0.39 ± 0.06t1/2l (min) (harmonic mean) 8.38 ± 1.39 6.43 ± 0.85t1/2z (min) (harmonic mean) 76.01 ± 10.58 61.22 ± 12.79
No differences between pharmacokinetic parameters obtained after i.m. administration at 10 mg/kg to animals from either species were found (Table 1.8). While plasma drug concentrations versus time after i.v. administration were better fitted to a two-compartmental model, plasma drug concentrations obtained after i.m. administration were better fitted to a one-compartmental model with first order absorption and elimination rates. The bio-availability of amoxicillin, more than 90% for goats and sheep, indicated almost complete absorption of amoxicillin when it was intramuscularly administered.
Table 1.8. Pharmacokinetic parameters of amoxicillin in sheep and goats after i.m. administration of single amoxicillin dose at 10 mg/kg bw (Elsheikh et al., 1999)
Pharmacokinetic Parameter Sheep (n=5) Mean ± SD Goats (n=5) Mean ± SDCmax (μg/ml) 9.47 ± 1.33 11.03 ± 0.97Tmax (h) 54.1 ± 7.6 50.9 ± 6.4MRT (h) 128.8 ± 9.4 121.9 ± 14.8AUC (μg/min/ml) 1512.7 ± 128.8 1685.9 ± 182.0F 0.95 ± 0.06 0.91 ± 0.09
NOTES: F = Bioavailability

10
Figure 1.3. Principle metabolic pathway of amoxicillin.KEY: (1) Amoxicillin; (2) Amoxicilloic acid; (3) Amoxilloic acid; (4) 4-Hydroxyphenylglycyl amoxicillin; (5) Amoxicillin piperazine-2’,5’-dione.
MetabolismThe two major metabolites of amoxicillin are amoxicilloic acid and amoxicillin piperazine-2,5-dione (diketopiperazine). These metabolites have lost the antibacterial activity of the parent component, but the amoxicilloic acid could have potential allergic properties (Reyns et al., 2008a). Figure 1.3 shows the degradation of amoxicillin to its major metabolites, amoxicilloic acid and amoxicillin piperazine-2’,5’-dione, and two minor inactive metabolites, after the addition of 1 ml 0.1 M HCl solution to 1 ml of amoxicillin solution (25 mg/ml in Dimethyl sulphoxide [DMSO]) (Nagele and Moritz, 2005).
Metabolism in laboratory animalsRatsIn healthy adult male Wistar rats orally dosed with amoxicillin (once at 15 or 60 mg/kg bw), amoxicillin was not substantially metabolized, as 60–75% was excreted unchanged in urine within24 h. Some amoxicillin was transformed to amoxicilloic acid and amoxicillin diketopiperazine-2,5-dione (Fujiwara et al., 2011).
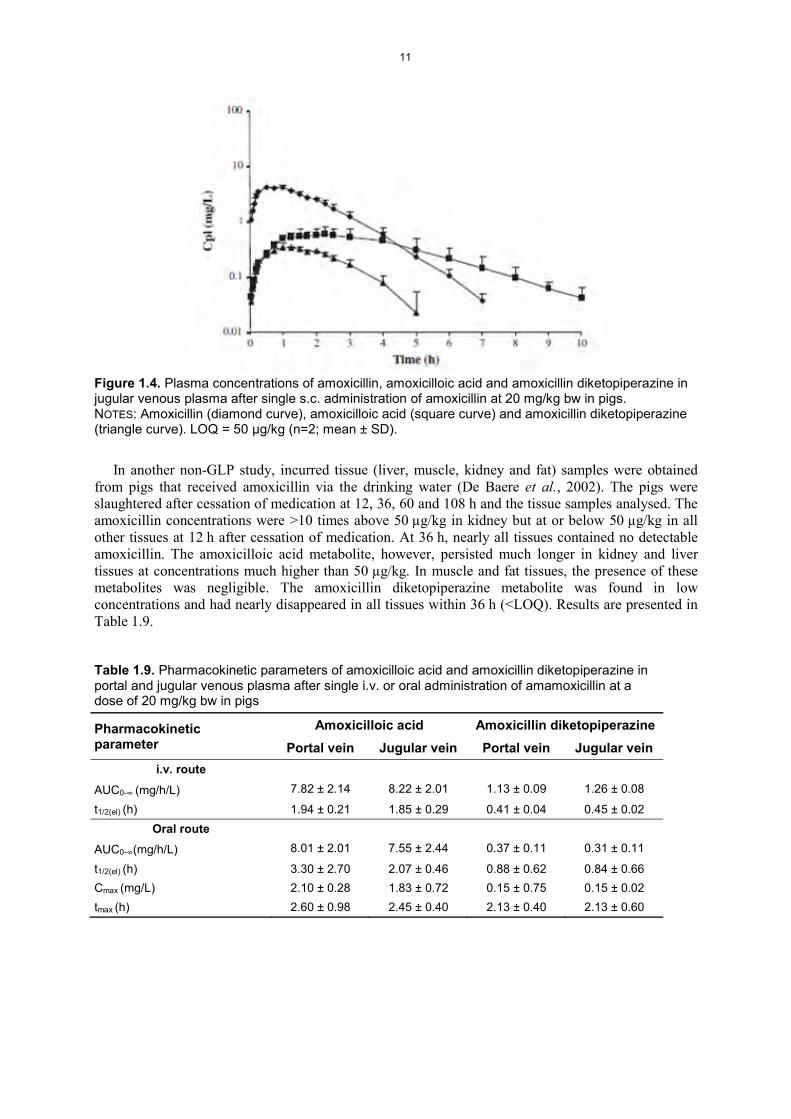
Metabolism in food-producing animalsPigsIn pigs, amoxicillin is rapidly metabolized to amoxicilloic acid and amoxicillin diketopiperazine after i.v., oral and s.c. administrations, as shown in Table 1.9 and Figure 1.4 (Reyns et al., 2009). The absence of a hepatic first-pass effect of amoxicillin in pigs was demonstrated, and pre-systemic degradation of amoxicillin in the gut and liver and hydrolysis of amoxicillin by blood enzymes do not seem to be responsible for bio-transformation or for the low oral bio-availability.
11
Figure 1.4. Plasma concentrations of amoxicillin, amoxicilloic acid and amoxicillin diketopiperazine in jugular venous plasma after single s.c. administration of amoxicillin at 20 mg/kg bw in pigs. NOTES: Amoxicillin (diamond curve), amoxicilloic acid (square curve) and amoxicillin diketopiperazine (triangle curve). LOQ = 50 μg/kg (n=2; mean ± SD).
In another non-GLP study, incurred tissue (liver, muscle, kidney and fat) samples were obtained from pigs that received amoxicillin via the drinking water (De Baere et al., 2002). The pigs were slaughtered after cessation of medication at 12, 36, 60 and 108 h and the tissue samples analysed. The amoxicillin concentrations were >10 times above 50 μg/kg in kidney but at or below 50 μg/kg in all other tissues at 12 h after cessation of medication. At 36 h, nearly all tissues contained no detectable amoxicillin. The amoxicilloic acid metabolite, however, persisted much longer in kidney and liver tissues at concentrations much higher than 50 μg/kg. In muscle and fat tissues, the presence of these metabolites was negligible. The amoxicillin diketopiperazine metabolite was found in low concentrations and had nearly disappeared in all tissues within 36 h (<LOQ). Results are presented in Table 1.9.
Table 1.9. Pharmacokinetic parameters of amoxicilloic acid and amoxicillin diketopiperazine in portal and jugular venous plasma after single i.v. or oral administration of amamoxicillin at a dose of 20 mg/kg bw in pigs
Pharmacokinetic parameter
Amoxicilloic acid Amoxicillin diketopiperazinePortal vein Jugular vein Portal vein Jugular vein
i.v. routeAUC0- (mg/h/L) 7.82 ± 2.14 8.22 ± 2.01 1.13 ± 0.09 1.26 ± 0.08
t1/2(el) (h) 1.94 ± 0.21 1.85 ± 0.29 0.41 ± 0.04 0.45 ± 0.02Oral route
AUC0- (mg/h/L) 8.01 ± 2.01 7.55 ± 2.44 0.37 ± 0.11 0.31 ± 0.11
t1/2(el) (h) 3.30 ± 2.70 2.07 ± 0.46 0.88 ± 0.62 0.84 ± 0.66Cmax (mg/L) 2.10 ± 0.28 1.83 ± 0.72 0.15 ± 0.75 0.15 ± 0.02tmax (h) 2.60 ± 0.98 2.45 ± 0.40 2.13 ± 0.40 2.13 ± 0.60

12
TISSUE RESIDUE DEPLETION STUDIES
Radiolabelled residue depletion studiesThere were no amoxicillin radiolabel residue depletion studies in cattle, pigs or sheep for evaluation. The only microbiological active residue is the parent drug using microbiological agar gel assays with either Sarcina lutea or Bacillus subtilis as the test organism (Acred et al., 1970).
Residue depletion studies with unlabelled drugPre-ruminating calvesEighteen 1–2-week-old calves weighing 34–45.5 kg (mean body weight = 39.7 kg) were treated orally with 500 mg amoxicillin soluble powder twice daily for five days in milk replacer. All the animals, regardless of weight, were treated with the same 500 mg dose. Three animals were assigned to each treatment group. Samples of muscle, liver, kidney, fat and blood serum were collected at 1, 3, 5, 7, 9 and 11 days post-treatment. The group slaughtered at day 1 contained animals with the lowest mean body weight, 35.9 kg; animals slaughtered at day 3, 41.4 kg; day 5 slaughter, 38.8 kg; day 7 slaughter, 42.4 kg; day 9 slaughter, 39.7 kg; and day 11 slaughter, 37.3 kg. Results were determined by a microbiological assay and are summarized in Table 1.10 (Keefe, 1976a).
Thirty pre-ruminating calves were treated orally with a 400 mg amoxicillin bolus twice daily for five days. Three animals were sampled in each group at 4 h, 1, 3, 5, 7, 9, 11, 12, 14 and 16 days. Mean body weights for the ten groups of animals were: group 1, 46.3 kg; group 2, 41.7 kg; group 3, 40.6 kg; group 4, 40.5 kg; Group 5, 45.2 kg; group 6, 41.2 kg; group 7, 41.1 kg; group 8, 43.9 kg; group 9, 41.7 kg; and group l0, 47.0 kg. Results are shown in Table 1.11 (Smith et al., 1975a).

13
Table 1.10. Residue depletion in pre-ruminating calves treated with 500 mg twice daily of soluble powder (mg/kg)
Tissue Day 1 Day3 Day 5 Day 7 Day 9 Day11Muscle <0.01
<0.01<0.01
<0.01<0.01<0.01
<0.01<0.01<0.01
<0.01<0.01<0.01
<0.01<0.01<0.01
<0.01<0.01<0.01
Liver <0.01<0.01<0.01
<0.01<0.01<0.01
<0.01<0.01<0.01
<0.01<0.01<0.01
<0.01<0.010.01
<0.01<0.01<0.01
Kidney 0.090.120.12
<0.01<0.01<0.01
<0.01<0.01<0.01
No sample <0.01<0.01<0.01
<0.01<0.01<0.01
Fat <0.01<0.01<0.01
<0.01<0.01<0.01
<0.01<0.01<0.01
<0.01<0.01<0.01
<0.01<0.01<0.01
<0.01<0.01<0.01
Table 1.11. Depletion study in pre-ruminating calves with a 400 mg twice daily bolus (mg/kg)
Tissue 4 h Day 1 Day 3 Day 5 Day 7 Day 9 Day 11 Day 12 Day 14Muscle 0.01
0.03<0.01
<0.01<0.01<0.01
0.02<0.01<0.01
0.01<0.01<0.01
0.02<0.010.05
0.01<0.01<0.01
0.020.020.02
<0.01<0.01<0.01
<0.01<0.01<0.01
Liver 0.030.040.01
0.020.020.02
0.01 0.01<0.01
0.010.010.01
<0.01<0.010.02
0.060.030.05
0.040.040.07
<0.01<0.01<0.01
<0.01<0.01<0.01
Kidney 0.160.160.05
0.010.110.02
<0.01 <0.01 <0.01
<0.010.03
<0.01
<0.01<0.01<0.01
0.02<0.01<0.01
0.010.01
<0.01
0.02<0.010.01
<0.01<0.01<0.01
Fat <0.01<0.01<0.01
<0.01<0.01<0.01
<0.01 <0.01 <0.01
<0.01<0.01<0.01
<0.01<0.010.04
<0.01<0.01<0.01
<0.01<0.01<0.01
<0.01<0.01<0.01
<0.01<0.01<0.01
Table 1.12. Depletion study in non-ruminating calves dosed with 400 mg twice daily for 5 days with a soluble powder formulation (mg/kg)
Tissue Day 15 Day 18 Day 20Muscle <0.010 <0.010
<0.010<0.010
<0.010<0.010<0.010
Liver <0.010 <0.010<0.010<0.010
<0.010<0.010<0.010
Kidney <0.010 <0.0100.2100.010
<0.010<0.010<0.010
Fat <0.016 <0.0100.2440.020
<0.010<0.010<0.010
Twelve pre-ruminating calves were treated with amoxicillin soluble powder at 400 mg twice daily for five days. There were three animals per group, and sampling was done at 15, 18 and 20 days. Mean body weights were not provided. However, calves weighing 36.4–45.5 kg were used in this study. Results are in Table 1.12. Two animals in group one expired prior to slaughter (Keefe, 1976b).

14
In a residue depletion study in pre-ruminating calves (Keefe, 1976c), 21 animals (36.4–45.5 kg bw)were treated with an amoxicillin suspension by deep i.m. injection using a 250 mg/ml suspension at a dose rate of 17.6 mg/kg bw once a day for seven days. The recommended dose is 400 mg/ml for a 45.5 kg bw, equivalent to 8.8 mg/kg bw. The first six days of dosing was in the right leg and the seventh dosing was in the left leg, and referred to as the injection site for sampling. Animals in groups of three were slaughtered at days 1, 5, 9, 12, 15, 18 and 21 after drug administration. The shoulder was sampled as the non-injection site muscle. The assay organism in this study was Bacillusstearothermophilus. Sensitivity of the assay was 0.010 mg/kg. Results are presented in Table 1.13. As the data show, there are some values reported as approximate and a substantial number are non-sampled data points.
Table 1.13. Depletion study in pre-ruminating calves dosed at 17.6 mg/kg bw once a day by i.m. injection (mg/kg)
Tissue Day 1 Day 5 Day 9 Day 12 Day 15 Day18 Day 21Injection site muscle
6.4~4.50.2
0.270.196.4
~1.2<0.01n.s.
<0.010.12~2.0
<0.01n.s.n.s.
0.18n.s.
<0.01
<0.01<0.01<0.01
Muscle ~0.40~0.400.31
~0.4<0.01<0.01
<0.01<0.01n.s.
<0.01<0.01<0.01
<0.01n.s.n.s.
<0.01n.s
<0.01
<0.01<0.01<0.01
Liver ~1.2~1.2~1.2
0.020.010.02
<0.01<0.01n.s.
<0.01<0.01<0.01
<0.01n.s.n.s.
<0.01n.s
<0.01
<0.01<0.01<0.01
Kidney ~10~10~10
0.090.030.05
0.01<0.01n.s.
<0.010.02
<0.01
<0.01n.s.n.s.
<0.01n.s
<0.01
<0.01<0.01<0.01
Fat ~0.40.20.2
<0.010.02
<0.01
<0.01<0.01n.s.
<0.01<0.01<0.01
<0.01n.s.n.s.
<0.01n.s
<0.01
<0.01<0.01<0.01
NOTES: n.s. = not sampled.
Ruminating calvesThirty-three ruminating calves weighing 159–363.6 kg were treated with amoxicillin (250 mg/ml) by deep muscular injection at a dose of 17.6 mg/kg bw once daily for seven days, with no more than 15 ml administered in one injection site. For the first six days, drug was administered in the right leg. The seventh injection was in the left leg, serving as the injection site for muscle sampling. Three animals were sacrificed at each time point: 3 h, 1, 3, 5, 6, 7, 8, 9, 11, 13 and 15 days. Results are shown in Table 1.14 (Smith et al., 1975a).
In another residue depletion study for ruminating calves, 15 animals (body weights ranging from 136.4 to 204.5 kg) were treated with an amoxicillin trihydrate suspension (250 mg/ml) using deep muscle injection daily at a dose rate of 17.6 mg/kg body weight for seven days. Injection protocol was as described in the previous study with sampling times post treatment at 13, 16, 19, 22 and 25 days. Results are summarized in Table 1.15 (Smith et al., 1976).
Fifteen ruminating calves, weighing 136.4-204.5 kg, were treated with amoxicillin suspension (250 mg/ml) administered by s.c. injection at 17.6 mg/kg bw for seven days. In this study, the injection was in the right side of the neck for six days and the seventh injection in the left side, for measuring the injection site residues. Sampling was at 2, 15, 18, 21 and 25 days. However, the microbial culture from samples taken on days 2, 15 and 18 did not grow, and the 0.01 mg/kg samples did not give a zone of inhibition. Results from all tissue samples collected on days 21 and day 25 were all reported as containing less than 0.01 mg/kg (Smith and Moore, 1976).

15
Table 1.14. Tissue residues in ruminating calves after i.m. treatment with 17.6 mg/kg bw dose once daily for seven days (mg/kg)
Withdrawal time Mean b.w. Injection
site Muscle Liver Kidney Fat
3 hours 228.0 kg >0.16>0.16>0.16
>0.16>0.16>0.16
>0.16>0.16>0.16
>0.16>0.16>0.16
>0.16>0.16>0.16
1 day 157.6 kg >0.16>0.16>0.16
>0.160.11
>0.16
>0.16>0.16>0.16
>0.16>0.160.13
>0.16>0.16>0.16
3 days 159.1 kg >0.16>0.16>0.16
0.010.020.02
0.130.110.09
0.050.040.03
0.040.020.01
5 days 209.0 kg >0.160.01
>0.16
<0.010.01
<0.01
>0.16<0.010.09
0.060.02
<0.01
<0.01<0.01<0.01
6 days 213.6 kg >0.16<0.010.03
<0.01<0.01<0.01
0.070.070.11
0.840.030.04
<0.01<0.010.02
7 days 179.5 kg >0.16<0.01<0.01
<0.01<0.01<0.01
0.120.060.11
<0.01<0.010.02
0.010.010.01
8 days 304.5 kg 0.05>0.16>0.16
<0.01<0.01<0.01
0.080.11
>0.16
<0.01<0.01<0.01
<0.01<0.01<0.01
9 days 333.3 kg <0.01>0.16<0.01
<0.01<0.01<0.01
0.12>0.16>0.16
<0.01<0.01<0.01
<0.01<0.01<0.01
11 days13 days15 days
152.3 kg142.2 kg134.8 kg
<0.01<0.01<0.01
<0.01<0.01<0.01
<0.01<0.01<0.01
<0.01<0.01<0.01
<0.01<0.01<0.01
Table 1.15. Tissue residues in ruminating calves after i.m. treatment with 17.6 mg/kg amoxicillin suspension once daily for seven days (mg/kg)
Withdrawal time (days)
Injection site muscle Muscle Liver Kidney Fat
13 <0.020.230.07
0.030.140.03
<0.04<0.04<0.04
0.010.01
<0.01
<0.01<0.01<0.01
16 <0.02<0.02<0.03
0.040.040.03
<0.04<0.04<0.04
<0.01<0.01<0.01
<0.01<0.010.04
19 <0.01<0.01
0.01<0.01
<0.01<0.01
<0.01<0.01
0.05<0.01
22 0.040.09
<0.01
0.03<0.01<0.01
<0.01<0.01<0.01
0.04<0.01<0.01
0.150.060.10
25 <0.01<0.01<0.01
<0.01<0.01<0.01
<0.01<0.01<0.01
<0.01<0.01<0.01
<0.01<0.01<0.01
A GLP-compliant residue depletion study was performed with 10 treatment groups of 4 animals each with a single i.m. injection per day for five consecutive days at 24-hour intervals (Connolly, Prough and Lesman, 2006a). The dose administered was 7 mg amoxicillin equivalents per kg bw. Upon necropsy, liver, kidneys, muscle, fat, 2nd and 5th injection sites and tissue surrounding the 2nd and 5th injection sites were assayed using a validated method (LOQ = 50 g/kg). Because the 2nd and

16
5th injection sites were collected and these injections had been administered three days apart, the final withdrawal time data were generated at 2, 5, 6, 9, 10, 13, 14, 17, 21, 24, 28, 31, 35, 38, 42, 45, 49, 52, 56 and 59 days post 5th dose. The results are presented in Table 1.16. Amoxicillin residues in liver, muscle, kidney and fat fell below 50 g/kg by 2 days following treatment and were below the method LOQ for all subsequent sampling times. After 28 days, the amoxicillin residues fell below 50 g/kg at the injection site. For the 42-day injection site sample from one animal the amoxicillin residues were >50 g/kg.
Table 1.16. Mean amoxicillin residues in cattle (μg/kg) treated with five daily i.m. injections at a dose rate of 7 mg amoxicillin equivalents/kg bw
Group Days post treatment
Primary injection site
Surrounding injection site Liver Muscle Kidney Fat
12 70 981 22 550 ND < 10.0 40.9 < LOQ5 6 854 < 3 350
26 5 977 < 783 ND ND ND ND9 1 264 < 164
310 691 < 94.9 NA NA ND NA13 < 315.4 < LOQ
414 522 < 92.4 NA NA NA NA17 < 17.7 < 30.8
521 < 55.6 < 106 NA NA NA NA24 < 14.0 ND
628 38.4 < 20.6 NA NA NA NA31 < 10.5 ND
735 < 14.8 < 10.3 NA NA NA NA38 NA NA
842 < 20.4 < LOQ NA NA NA NA45 NA NA
949 < LOQ NA NA NA NA NA52 < LOQ NA
1056 < LOQ NA NA NA NA NA59 ND NA
LOD 0.98 0.98 3.2 0.98 2.10 1.40LOQ 10 10 25 10 25 10
NOTES: LOD = Limit of detection; LOQ = Limit of quantitation; NA = not analysed; ND not detected.

17
Lactating dairy cowsMilk samples from a non-GLP compliant study were taken 3, 4, 5 and 6 days after intramammary administration of 5 g of amoxicillin to one cow. Results indicated that 2.7 ng/ml of amoxicillin were present at 3 days post-treatment and that this concentration slowly decreased with time. At 6 days post-treatment, residues of 1.2 ng/ml of amoxicillin persisted in milk (Bruno et al., 2001).
Five lactating dairy cows in at least their 2nd to 6th lactation were selected for the first (Keefe and Kennedy, 1983a) of several studies. Cows were milked out prior to the i.m. administration of amoxicillin trihydrate (250 mg/ml) at 11 mg/kg bw once a day for five days. Sampling of milk began at 12 h post-treatment and continued for eight subsequent milkings. Milk production was recorded. All zero hour milk samples were negative for amoxicillin. Results are summarized in Table 1.17.
The second study (Keefe and Kennedy, 1983b) followed the same protocol, using five lactating dairy cows in their 2nd to 6th lactation. Cows were treated with amoxicillin trihydrate (250 g/ml) at 11 mg/kg bw once a day subcutaneously, with no more than 30 ml per injection site. Milk sampling began at 12 h post-treatment and continued for eight subsequent milkings. Milk production was recorded. Results are summarized in Table 1.18.
Table 1.17. Milk residues following i.m. administration of 11 mg/kg once daily of amoxicillin trihydrate (mg/l) (Keefe and Kennedy, 1983a)
Cow 12 h 24 h 36 h 48 h 60 h 72 h 84 h 96 h13 0.02 <0.01 <0.01 <0.01 <0.01 n.s. <0.01 <0.0126 0.02 <0.01 <0.01 <0.01 n.s. <0.01 <0.01 <0.0128 0.02 <0.01 <0.01 <0.01 <0.01 <0.01 <0.01 <0.01507 0.02 <0.01 <0.01 <0.01 <0.01 <0.01 <0.01 <0.01510 0.02 <0.01 <0.01 <0.01 <0.01 <0.01 <0.01 <0.01NOTES: n.s. = not sampled.
Table 1.18. Milk residues following s.c. administration of 11 mg/kg once daily of amoxicillin trihydrate (mg/l) (Keefe and Kennedy, 1983b)
Cow 12 h 24 h 36 h 48 h 60 h 72 h 84 h 96 h86 0.01 0.17 <0.01 <0.01 <0.01 <0.01 <0.01 <0.0193 0.02 <0.01 <0.01 <0.01 n.s. <0.01 <0.01 <0.01511(1) 0.10 0.07 0.05 0.04 0.02 0.02 0.02 0.02588 0.03 0.02 <0.01 <0.01 <0.01 <0.01 <0.01 <0.01595 0.02 <0.01 <0.01 <0.01 <0.01 <0.01 <0.01 <0.01
NOTES: (1) Animal 511 had a positive zero-hour sample which remained positive in the penicillinase-treated sample. All other zero-hour samples were negative.
A study was carried out with six lactating dairy cows treated by i.m. injection with amoxicillin aqueous injectable suspension (250 mg/ml) at a dose rate of 6.6 mg/kg bw (Buswell and Lay, 1974). Although blood samples and milk samples were collected, only the milk residues were reported. Sampling was done at 15, 30, 45 and 60 minutes post-treatment, followed by 1.5, 2, 3, 4, 6, 8 and 24 hour sampling. This study implies that there are very low concentrations in milk even for very short post-treatment periods. Milk residue concentrations are summarized in Table 1.19.
Table 1.19. Milk amoxicillin residues following 6.6 mg/kg bw once daily i.m. administration to lactating cows (mg/l) (Buswell and Lay, 1974)
Milk yield (kg)
mg/l amoxicillin at post-treatment intervals15 min 30 min 45 min 60 min 1½ h 2 h 3 h 4 h 6 h 8 h 24 h

18
10.9 <0.01 <0.01 <0.01 <0.01 <0.01 <0.01 <0.01 0.01 0.02 0.02 <0.018.2 0.02 0.08 <0.01 <0.01 <0.01 <0.01 <0.01 0.01 0.02 0.02 <0.019.1 0.07 0.11 0.02 0.01 <0.01 <0.01 0.03 0.04 0.03 0.05 <0.017.3 0.02 <0.01 <0.01 <0.01 <0.01 <0.01 <0.01 <0.01 0.01 0.01 <0.016.4 <0.01 <0.01 <0.01 <0.01 <0.01 <0.01 <0.01 <0.01 0.03 0.07 <0.01
In a study conducted by Barr (1977), five lactating dairy cows were treated with amoxicillin trihydrate (250 mg/ml) by deep i.m. injection at 11 mg/kg bw once a day for five days. Dosing was done following complete milking out of each cow. Sampling began at 12 h post dose and continued for eight milkings. Results are summarized in Table 1.20. Another study was conducted using the same protocol as described above, with treatment by s.c. injection (Keefe, 1976d). Results are shown in Table 1.21.
Table 1.20. Milk residues following i.m. administration of 11 mg/kg once daily of amoxicillin trihydrate (mg/L) (Barr, 1977)
Cow 0 h 12 h 24 h 36 h 48 h 60 h 72 h 84 h 96 h108 <0.01 0.83 0.01 0.14 0.17 <0.01 0.15 <0.01 <0.01129 <0.01 0.04 0.21 0.27 0.07 <0.01 0.15 0.12 <0.01263 0.20 0.02 0.05 0.19 0.14 0.02 0.26 <0.01 0.01341 0.18 0.15 0.02 0.10 0.15 0.02 0.14 <0.01 0.96349 0.11 0.05 0.03 0.14 <0.01 1.57 0.20 0.17 0.79
Table 1.21. Milk residues following s.c. administration of 11 mg/kg once daily of amoxicillin trihydrate (mg/l) (Keefe, 1976d)
Cow 0 h 12 h 24 h 36 h 48 h 60 h 72 h 84 h 96 h8 <0.01 0.04 0.06 0.07 0.02 0.05 <0.01 <0.01 <0.0110 <0.01 0.08 0.60 0.01 0.01 0.01 <0.01 0.09 <0.0113 0.01 0.07 0.13 <0.01 <0.01 0.16 <0.01 <0.01 <0.0116 <0.01 0.02 0.01 0.01 0.01 0.01 <0.01 <0.01 <0.0130 <0.01 0.06 0.22 0.02 0.09 0.15 0.02 <0.01 <0.01
Table 1.22. Amoxicillin concentrations present in milk of a lactating cow treated in all four quarters with amoxicillin trihydrate at 62.5 mg/10 ml per quarter
Hours post-dosing Amoxicillin in milk (ng/ml)8 968
24 12.632 10.048 5.556 5.572 < LOD
A lactating cow was given amoxicillin trihydrate (62.5 mg/10 ml of in plastet form ), infusing one plastet into each quarter of the udder, for a total of 250 mg of drug administered (intra-mammary infusion). Milk samples were collected at 8, 24, 32, 48, 56 and 72 h post-dosing and analysed using a HPLC-UV method with a detection limit of 1.1 ng/ml (Ang et al., 1997). Table 1.22 presents the results.

19
In a GLP-compliant study, twenty randomly selected dairy cows received five daily i.m. injections of 7 mg amoxicillin equivalents/kg bw at 24-hour intervals (Connolly, Prough and Lesman, 2006b).Pre-dose samples were collected for analytical control purposes from all animals. Raw milk samples were collected at 12-hour intervals for a period of 8 days (16 milkings). The mean amoxicillin concentrations were 9.42 g/kg at 12 h post-dose, declining to 3.17 g/kg at 24 h post-dose. Mean residues increased after each of the remaining 4 doses, and subsequently declined rapidly to below 4 g/kg by 24 h after each respective dose. There was no evidence of bio-accumulation upon repeated dosing. At 12 h following the 5th dose, amoxicillin concentrations averaged 5.84 g/kg and declined to concentrations below 4 g/kg at 36 h after the fifth dose, and all samples obtained after 72 hpresented concentrations of approximately 0.46 g/kg. Table 1.23 summarizes the data.
Table 1.23. Mean concentration of amoxicillin residues in milk after treatment of lactating dairy cows with amoxicillin i.m. at 7 mg/kg bw
Sample Hours postdose 1
Hours post dose 2
Hours post dose 3
Hours post dose 4
Hours post dose 5 Average (μg/kg)
1 0 0.002 12 9.423 24 3.174 36 12 6.615 48 24 3.766 60 36 12 6.797 72 48 24 3.638 84 60 36 12 7.039 96 72 48 24 3.3510 108 84 60 36 12 5.8411 120 96 72 48 24 3.4012 132 108 84 60 36 2.0813 144 120 96 72 48 1.3214 156 132 108 84 60 0.4615 168 144 120 96 72 0.4616 180 156 132 108 84 0.4617 192 168 144 120 96 0.4618 204 180 156 132 108 0.4619 216 192 168 144 120 0.4620 228 204 180 156 132 0.4621 240 216 192 168 144 0.4622 252 228 204 180 156 0.4623 264 240 216 192 168 0.4624 276 252 228 204 180 0.4625 288 264 240 216 192 0.46

20
Amoxicillin trihydrate was administered at an extra-label dosage of 22 mg/kg bw, i.m., once daily to six cows in a non GLP-compliant study. Milk samples were collected at milking prior to drug administration and up to 156 h post-administration. Analyses performed on incurred milk drug concentrations demonstrated that even at the extra-label dosage of 22 mg/kg, no milk residues higher than 10 μg/L were detected beyond the label milk with holding times for amoxicillin (96 h) (Andersonet al., 1996).
PigsIn a pig tissue residue study, 33 suckling pigs (2.3–3.6 kg) were treated orally by syringe with amoxicillin oil suspension (50 mg/ml) at 22 mg/kg body weight twice daily for five days. Three pigs were slaughtered at 1 hour, 1, 2, 3, 4, 5, 6, 7, 9, 12 and 15 days. (Keefe, 1979). Results are summarized in Table 1.24.
In another pig residue study, nine suckling pigs (2.3–5.9 kg) were treated orally by syringe with amoxicillin oil suspension (50 mg/ml) at 22 mg/kg bw twice daily for five days. Three pigs were slaughtered at 9, 11 and 14 days (Keefe, 1976e). Results are summarized in Table 1.25.
Table 1.24. Residues in suckling pigs following oral administration of 22 mg/kg bw amoxicillin oil suspension twice daily
TissueTime post-treatment (days)
1 h 1 2 3 4 5 6 7 9 12 15Muscle 0.04
0.040.08
<0.01<0.01<0.01
0.03<0.01<0.01
<0.01<0.01<0.01
0.020.01
<0.01
0.03<0.010.02
<0.01<0.010.01
0.020.01
<0.01
<0.01<0.01<0.01
<0.01<0.01<0.01
<0.01<0.01<0.01
Liver <0.01<0.010.01
<0.01<0.01<0.01
<0.01<0.01<0.01
<0.01<0.01<0.01
<0.01<0.01<0.01
<0.01<0.01<0.01
<0.01<0.01<0.01
0.01<0.01<0.01
<0.01<0.01<0.01
<0.01<0.01<0.01
<0.01<0.01<0.01
Kidney >0.16>0.16>0.16
0.07>0.160.03
<0.01<0.01<0.01
<0.01<0.01<0.01
<0.01<0.01<0.01
0.010.030.02
<0.01<0.01<0.01
<0.01<0.01<0.01
<0.01<0.01<0.01
<0.01<0.01<0.01
<0.01<0.01<0.01
Fat 0.02<0.010.01
<0.01<0.01<0.01
<0.01<0.01<0.01
0.03<0.010.03
<0.01<0.01<0.01
0.020.020.04
0.02<0.01n.s.
<0.010.04
<0.01
<0.01<0.01<0.01
<0.01<0.01<0.01
<0.01<0.01<0.01
Skin >0.160.060.12
0.07>0.160.03
0.010.040.06
<0.01<0.01<0.01
<0.01<0.01<0.01
0.030.070.02
<0.010.01
<0.01
0.020.02
<0.01
<0.01<0.01<0.01
<0.01<0.01<0.01
<0.01<0.01<0.01
Table 1.25. Residues in suckling pigs following oral administration of amoxicillin oil suspension
TissueTime post-treatment
9 days 11 days 14 daysMuscle 0.04
0.02<0.01
<0.010.040.01
<0.01<0.01<0.01
Liver 0.02<0.01<0.01
<0.010.020.01
<0.01<0.01<0.01
Kidney 0.02<0.01<0.01
<0.01<0.01<0.01
<0.01<0.01<0.01
Fat + Skin >0.16<0.05<0.05
<0.010.010.01
<0.01<0.01<0.01
A GLP-compliant study was conducted to evaluate residue depletion of amoxicillin in tissues of pigs (Adam and Roberts, 2008). Eleven groups (4 animals each) of healthy pigs were subjected to

21
either no treatment or a single i.m. injection per day for five consecutive days at 24 h intervals. The dose administered was 7 mg amoxicillin-equivalent/kg bw as determined from pre-treatment weighing. Animals were slaughtered 2, 6, 10, 14, 21, 28, 35, 42, 49, 56 and 63 days post 5th injection. Upon necropsy, liver, kidneys, muscle, fat, 4th and 5th injection sites and tissue surrounding the 4th and 5th injection sites were assayed using a validated method. Because the 4th and 5th injection sites were collected and these injections were administered one day apart, the final withdrawal time data were generated at 2, 3, 6, 7, 10, 11, 14, 15, 21, 22, 28, 29, 35, 36, 42, 43, 49, 50, 56, 57, 63 and 64 days post 5th dose. Injection site residues depleted rapidly at the early withdrawal times from a group mean concentration of 11 344 g/kg at 3 days withdrawal, to less than 180 g/kg at 11 days withdrawal. Mean residues as well as residues in all individual animals were <LOQ (25 g/kg) at withdrawal times
35 days post-treatment. Mean amoxicillin residues in liver, muscle, kidney and fat fell below 50 g/kg at 2 days following treatment and were below 50 g/kg for all subsequent sampling times.Results are summarized in Table 1.26.
Table 1.26. Mean amoxicillin residues (μg/kg) in pigs treated with five daily i.m. injections of 7 mg amoxicillin/kg bw
GroupDays post
last treatment
Primary Injection Site
Surrounding Injection
SiteLiver Muscle Kidney Fat
12 2782 191 ND ND < 45.3 ND3 11344 4.67
26 1595 252 ND ND < LOQ ND7 531 2.1
310 431 215 ND ND < LOQ ND11 <180 143
414 438 36.2 ND < LOQ < LOQ < LOQ15 313 21.9
521 < 121 34.1 ND < LOQ < LOQ ND22 < 44.1 35.8
628 < 47.9 3.60 NA NA NA NA29 < 27.0 13.1
735 < LOQ 24.8 NA NA NA NA36 < LOQ 0.00
842 < LOQ 0.40 NA NA NA NA43 < LOQ 0.00
9-11 49-64 NA NA NA NA NA NALOD 2.19 2.19 5.75 2.19 1.68 3.84LOQ 25 25 25 25 25 25
NOTES: NA = not analysed; ND = not detected; LOQ = Limit of quantitation; LOD = Limit of detection.
A non-GLP residue depletion study was conducted in Belgian Landrace stress-negative pigs. Twenty animals received an i.v. bolus of amoxicillin at a dosage of 20 mg/kg bw through a catheter in an ear vein. Animals (n=4) were slaughtered at 12, 48, 60, 72 and 84 h post-dosing. Amoxicillin and its major metabolites, amoxicilloic acid and amoxicillin diketopiperazine, were quantified in kidney, liver, fat and muscle tissues. Similarly, 20 animals received the same dose of amoxicillin by oral administration through a stomach tube. Samples were collected at the same time points (Reyns et al., 2008a). Table 1.27 summarizes the data obtained. Twelve hours after both oral and i.v. administration, amoxicillin concentrations in kidney samples were relatively high, but decreased rapidly, and 36–48 hafter treatment, amoxicillin concentrations were below the LOQ of 25 μg/kg in all tissue samples. The amoxicilloic acid metabolite remained much longer in kidney tissue and also in liver, consistent with

22
other in vivo residue depletion tissue studies in pigs (De Baere et al., 2002). The prolonged presence of amoxicilloic acid in the present study leads to a question regarding the risk assessment for amoxicillin because allergic reactions in humans could be a concern in relation to its metabolites.
Table 1.27. Mean tissue concentrations (ng/g) (and Standard Deviations) of amoxicillin (AMO), amoxicilloic acid (AMA) and amoxicillin diketopiperazine (DIKETO) in pig tissue after i.v. and oral administration of amoxicillin at 20 mg/kg bw
Tissue ChemicalTime and route of administration
12 h 48 h 60 h72 h 84 h
oral i.v. oral i.v. oral i.v.Kidney AMO 618 (359) 915 (148) <LOD <LOD <LOD <LOD <LOD <LOD
AMA 10 3132 (1)
(3 096)5 575 (1)
(744)205 (115) 100 (79) 213 (115) 120 (40) <LOD <LOD
DIKETO 88 (61) 47 (23) <LOD <LOD <LOD <LOD <LOD <LODLiver AMO <LOQ <LOQ <LOD <LOD <LOD <LOD <LOD <LOD
AMA 1 379 (2)
(201)546 (2)
(198)35 (14) <LOQ 42 (24) <LOQ <LOD <LOD
DIKETO <LOQ <LOQ <LOD <LOD <LOD <LOD <LOD <LODFat AMO <LOQ 39 (20) <LOD <LOD <LOD <LOD <LOD <LOD
AMA 127 (68) 118 (66) <LOD <LOD <LOD <LOD <LOD <LODDIKETO <LOD <LOD <LOD <LOD <LOD <LOD <LOD <LOD
Muscle AMO <LOQ 35 (18) <LOD <LOD <LOD <LOD <LOD <LODAMA 30 (17) 32 (22) <LOD <LOD <LOD <LOD <LOD <LODDIKETO <LOQ <LOQ <LOD <LOD <LOD <LOD <LOD <LOD
NOTES: LOD = 1.7, 7.1 and 2.0 μg/kg for AMO, AMA and DIKETO, respectively, in pig kidney; 3.5, 14.2 and 1.6 μg/kg for AMO, AMA and DIKETO, respectively, in liver; 1.5, 11.1 and 0.9 μg/kg for AMO, AMA and DIKETO, respectively, in muscle; and 1.7, 10.6 and 0.8 for AMO, AMA and DIKETO, respectively, in fat. LOQ at least 25 μg/kg for all components in all tissue matrices. (1) Significant at P = 0.025. (2) Significant at P = 0.001.
Martínez-Larrañaga and co-workers (2004) also performed a study in twelve pigs treated with daily oral doses of 20 mg/kg amoxicillin for five days. The mean concentration (n=4) of amoxicillin in thepig kidneys six days after the last dose was 21.4 μg/kg, and in the liver it was 12.32 μg/kg, but noamoxicillin could be detected in fat or muscle.
SheepA GLP-compliant tissue residue depletion study was conducted in 38 crossbred sheep (49–69 kg) randomized into 9 groups of 4 (2 rams + 2 ewes) with one male and one female acting as controls. Each treated sheep received a single i.m. injection per day for five consecutive days at a nominal rate of 7 mg amoxicillin/kg bw (Adam and Roberts, 2007a). Animals were slaughtered at withdrawal times of 2, 6, 10, 14, 21, 28, 35, 42, 49, 56 and 63 days post 5th injection, while tissues (liver, kidneys, muscle, fat) were harvested at 2, 3, 6, 7, 10, 11, 14, 15, 21, 22, 28, 29, 35, 36, 42, 43, 49, 50, 56, 57, 63 and 64 days post 5th dose. All samples were assayed according to a validated method. Amoxicillin concentrations at the injection site depleted from 5, 736 g/kg at 48 h following the final dose administration to less than 50 g/kg after 28 days withdrawal. At 64 days, mean residues were at the LOQ (25.6 g/kg), with one animal having residues <LOD. However, 1 of the 4 animals in this group had an amoxicillin concentration of 60.3 g/kg. Residues of amoxicillin in liver, kidney, muscle and fat depleted rapidly and 48 h post-dosing all amoxicillin concentrations were lower than 50 g/kg. Mean amoxicillin residues at the injection site are depicted in Table 1.28.

23
Table 1.28. Summary of injection site residue data from sheep treated with five daily i.m. injections of amoxicillin at 7 mg/kg bw
Withdrawal time (days)
Mean amoxicillin residues ( g/kg)
Number of animals with >50 g/kg
Maximum Individual Concentration ( g/kg)
2 5 736 4 of 4 12 7003 1 558 4 of 4 2 6406 1 129 4 of 4 2 0737 813 4 of 4 1 50010 667 4 of 4 83311 819 4 of 4 1 91814 347 4 of 4 91615 347 4 of 4 66021 70.7 2 of 4 19822 58.0 2 of 4 11028 41.9 1 of 4 84.329 28.1 0 of 4 35.335 45.4 1 of 4 95.736 31.7 1 of 4 72.742 31.4 0 of 4 42.543 30.8 0 of 4 38.549 < LOQ 0 of 4 28.650 71.7 1 of 4 14256 < LOQ 0 of 4 25.157 < LOQ 0 of 4 34.263 < LOQ 0 of 4 26.064 25.6 1 of 4 60.3
Lactating dairy sheepA GLP-compliant study was performed in 20 lactating dairy sheep that were treated five times intramuscularly with 7 mg amoxicillin-equivalent/kg bw at 24 h (Adam and Roberts, 2006). Raw milk samples were collected at 12-hourly intervals for a period of 10 days (20 milkings). Amoxicillin mean milk residues increased from 23.1 g/kg at 12 h following the first dose, to 33.0 g/kg 12 h following the second dose. These mean concentrations were maintained following doses 3 to 5. The mean values obtained for milking samples after the 5th injection are depicted in Table 1.29.
Table 1.29. Amoxicillin residues in milk from sheep administered five consecutive daily i.m. injections of 7 mg/kg bw
Hours after 5th dose12 24 36 48 60 72 84 96 108 120
Mean concentration ( g/kg) 33.2 17.1 8.68 4.87 2.76 2.33 2.26 2.08 2.09 2.09
The overall results indicate that there was no tendency for bio-accumulation of residues in milk upon repeated dosing. Amoxicillin milk residues declined steadily following cessation of dosing and mean concentrations were <4 g/kg at 60 h following the final dose administration.
In another study, a solution of 35 mg of clavulanic acid (as the potassium salt) and 140 mg of amoxicillin (amoxicillin trihydrate) per ml was administered to ten sheep. One syringe per udder-half was infused at five consecutive milkings. All animals also received two i.m. infusions at 24 h
24
intervals. In each animal the first milk sample was taken immediately after the final antibiotic treatment and the subsequent samples were taken at 24 h intervals for 8 days (192 h). As shown in Table 1.30, amoxicillin residues in milk exceeding 4 g/kg concentrations were detected up to 192 h(8 days) after the last treatment, regardless of the applied preparation (mastitis treatment with two commercial products lactating cows) (Pengov and Kirbis, 2009).
Table 1.30. Mean concentration of amoxicillin in sheep milk
Hours post-final infusion Concentration mean (μg/kg) Concentration range (μg/kg)0 64.0 64.024 19.1 15.1–30.548 10.2 6.1–21.072 9.1 5.6–17.996 7.0 4.8–13.1
120 5.9 4.0–8.4144 5.0 3.5–12.0168 6.0 4.0192 4.5 0
A similar study was performed in six lactating ewes. Animals were treated by intramammary infusion with a formulation of 200 mg amoxicillin trihydrate, 50 mg potassium clavulanate and 10 mgprednisolone in a quick release base in a total volume of 3 ml. At 120 h post-treatment, the mean amoxicillin concentration was 0.01 (±0.01) μg/ml. By the final sampling (168 h), the mean concentration was 0.0025 (±0.002) g/ml (Buswell and Barber, 1989).
Lactating dairy goats Six lactating Saanen goats, routinely milked, received amoxicillin three times over 24 h by intramammary infusion. The highest concentration of amoxicillin in milk was measured 16 h after the final infusion, 83.3 ± 46.1 g/ml. By 64 h after the final infusion, milk concentrations were 0.06 ± 0.04 g/ml (Buswell, Knight and Barber, 1989).
METHODS OF ANALYSIS FOR RESIDUES IN TISSUES AND MILK
Single analytical methods for amoxicillinSeveral suitably validated single analyte HPLC methods with fluorescence, UV or mass spectrometry detection for the determination of amoxicillin residues in edible tissues of cattle, pig, sheep and goat,as well as for cow and sheep milk, are available. The performance characteristics are described for some of the methods described by Adam and Roberts (2007b), Neeley and Connolly (2004) and Doran and Adam (2005), including selectivity, LOQ, LOD, robustness, precision and accuracy, that were used for some of the pivotal residue depletion studies in cattle, sheep, pig and goat.
An LC-MS/MS method was validated under GLP-compliant conditions and used for the analysis of edible tissue samples and milk in sheep (Doran and Adam, 2005). Samples of control sheep tissue fortified with amoxicillin were extracted using water followed by a liquid-liquid clean-up using dichloromethane. The final extracts were analysed by a validated LC-MS/MS method. The assay LOQ for amoxicillin was 25 g/kg for liver, kidney, fat and muscle, and 2 g/kg for milk. The assay LOD for amoxicillin was 3, 5, 2, 10 and 0.14 g/kg for ovine liver, kidney, muscle, fat and milk, respectively. The linearity of the method was acceptable over the range 25–100 g/kg for liver, kidney, fat and muscle and over the range 2–8 g/kg for milk. The intra-day and inter-day accuracy at concentrations corresponding to approximately 25, 50 and 100 μg/kg and the corresponding precision

25
were acceptable for all analytes at each concentration. The mean recoveries were all between 67–112% with coefficients of variation of 2–29%.
The stability of amoxicillin was assessed in each matrix at room temperature, freeze/thaw, auto-sampler and extended frozen storage conditions. Liver, kidney and muscle samples were stable following storage at room temperature for approx. 4 h. Skin with fat was not stable, indicating that this matrix should be extracted immediately after thawing. Muscle samples were stable following 3freeze/thaw cycles. Liver, kidney and skin with fat were not stable, indicating that if additional assays are anticipated, the initial bulk samples should be subdivided prior to storage to provide a new sample for each assay occasion. Liver, kidney and skin with fat samples were stable following storage under auto-sampler conditions (about 4°C) for 48 h; muscle samples were stable following storage under auto-sampler conditions (about 4°C) for 72 h. The extended storage stability data indicate that amoxicillin is stable in muscle for 2 months. Amoxicillin showed limited stability in liver and kidney. No incurred residue stability data were generated as part of this validation study. However, incurred stability was assessed as part of tissue residue depletion studies conducted under separate protocols. The standard solutions were stable for 2 weeks when stored at about 4°C.
A validated analytical method that measured amoxicillin residues in cattle tissues and milk was reported in a GLP-compliant study (Neeley and Connolly, 2004). In this method, tissue samples were extracted in water and cleaned up using methylene chloride. Milk samples were separated into phases and purified using solid phase extraction. Aliquots of the final extracts (liver, kidney, muscle, fat, surrounding injection sites and injection sites) were analysed for amoxicillin. The LOQ was 25 μg/kg for amoxicillin in liver and kidney, 10 g/kg for muscle and fat and 1.0 μg/kg in milk. At the LOQ of 10 μg/kg, the intra-day accuracy for muscle was 81–84%, 91–94% for fat, and 73–80% for milk. The corresponding precision was 6–15% for muscle, 6–11% for fat and 10–12% for milk at the LOQ of 1 μg/kg. The inter-day precision and accuracy data were similar to those obtained for the intra-day assay precision and accuracy. This validated method was considered to be suitable for use as a routine assay procedure for cattle residue monitoring in edible tissues and milk.
An analytical method developed in 1979 (Melilea and Desai, 1979) determined amoxicillin residues in cattle and pig tissues. The method was validated following existing late-1970 criteria using muscle, liver, kidney and skin tissues. The method had the required sensitivity, selectivity and linearity. Other penicillins did not interfere in the selectivity of the assay. Amoxicillin was extracted from cattle and pig tissues and potential interfering substances were removed by precipitation and extraction. Amoxicillin was converted to a fluorescent compound by heating in an acid medium then separatedfrom other constituents by HPLC and measured quantitatively with a fluorescence detector. The selectivity of the method was demonstrated by the analysis of other penicillins such as ampicillin, penicillin G and cloxacillin. When treated as directed in the method, these substances did not exhibit any fluorescent activity corresponding to the retention time of the amoxicillin derivative. The LOD for amoxicillin was 0.01 mg/kg.
A validation study of an analytical method for the determination of amoxicillin in pig liver, kidney, muscle and skin with fat was reported (Adam and Roberts, 2007b). In this method, control pig tissueswere fortified with amoxicillin and extracted using water followed by a liquid-liquid cleanup using dichloromethane. The samples were then further cleaned up using a cation exchange column (WCXSPE) and the final extracts were analysed by LC-MS/MS. The chromatographic system was satisfactory in terms of column efficiency, tailing factor, system precision, linearity of detection and system limit of detection. The LOQ for amoxicillin was 25 g/kg for liver, kidney, muscle and skin with fat, with mean recoveries between 60 and 95% with coefficients of variation of 2–15%. The LOD for amoxicillin was 6, 2, 2 and 4 g/kg for pig liver, kidney, muscle and skin with fat, respectively. The method was linear over the range 25–100 g/kg for liver, kidney, muscle and skin with fat. Significant matrix effects were found in some of the matrices.
The stability of amoxicillin was assessed in each matrix at room temperature, freeze-thaw, autosampler and extended frozen storage conditions. Liver, kidney and muscle samples were stable following storage at room temperature for approx. 4 h. Skin with fat was not stable, indicating that this matrix should be extracted immediately after thawing. Muscle samples were stable following 3 freeze-thaw cycles. Liver, kidney and skin with fat were not stable indicating that if additional assays are

26
anticipated, the initial bulk samples should be subdivided prior to storage to provide a new sample for each assay occasion. Liver, kidney and skin with fat samples were stable following storage under autosampler conditions (about 4°C) for 48 h; muscle samples were stable following storage under autosampler conditions (about 4°C) for 72 h. The extended storage stability data indicate that amoxicillin is stable in muscle for 2 months. Amoxicillin showed limited stability in liver and kidney. No incurred residue stability data were generated as part of this validation study. However, incurred stability was assessed as part of tissue residue depletion studies conducted under separate protocols. The standard solutions were stable for 2 weeks when stored at about 4°C.
The open literature contains numerous suitably validated single analyte methods (Table 1.31), methods that measure residues of amoxicillin and its two major metabolites, amoxicilloic acid and the DIKETO residues (Table 1.32), and multi-analyte methods for the simultaneous determination of amoxicillin and other veterinary drug residues (Table 1.33). Each of these suitably validated methods whose performance parameters have been summarized in Tables 1.31–1.33 can be used to measure amoxicillin residues in food animal production.
A LC-MS/MS method for the confirmation of amoxicillin residues at the LOQ of 50 μg/kg was also validated. The method showed no matrix effect for muscle or fat. However, MS signal suppression of 18% and 25% was evident in liver and kidney, respectively. MS suppression from the milk matrix occurred to a lesser extent (about 16%).
Suitably validated analytical methods with acceptable performance parameters were used to generate depletion studies in pigs, sheep, cattle and cattle milk. However, because the metabolites of amoxicillin also fluoresce under the acidic conditions used to generate the fluorescent derivative for amoxicillin, analytical methods that use fluorescence for detection cannot be used to make regulatory decisions because those methods tend to overestimate the concentration of residual amoxicillin in treated samples.
Table 1.31. Summary of amoxicillin parent compound analytical methods
Method Species and tissues LOD / LOQ Reported
validation Reference
HPLC Fluorescence
Pig and cattle liver, kidney, muscle, fat
LOD=10 μg/kg Internal validation on existing criteria
Melilea and Desai, 1979.
HPLC Fluorescence
Pig, cattle and chicken muscle
LOQ=5 μg/kg FDA guidelines Luo and Ang, 2000.
LC-MS/MS Bovine muscle CC =61.2 μg/kgCC =72.4 μg/kg
EU guidelines Lugoboni et al., 2011.
LC-MS/MS Chicken liver, kidney, muscle, fat and skin+fat
CC =51.6-57.0 μg/kgCC =72.4 μg/kg
EU guidelines de Baere et al., 2005.
LC-MS/MS Pig liver, kidney, muscle, and skin+fat
LOQ=25 μg/kgLOD=1.7-5.8 μg/kg
OECD guidelines Adam and Roberts, 2007b.
LC-MS/MS Sheep liver, kidney, muscle and fat
LOQ=25 μg/kgLOD=2.1-9.7 μg/kg
OECD guidelines Doran and Adam, 2005.
LC-MS/MS Bovine liver, kidney, muscle and fat
LOQ=25 μg/kg (liver and kidney) and 10 μg/kg (muscle and fat)LOD=0.98-3.2 μg/kg
OECD guidelines Neeley and Connolly, 2004.
LC-MS/MS Bovine milk LOQ=1 μg/kg LOD=0.08 μg/kg
OECD guidelines Neeley and Connolly, 2004.
LC-MS/MS Sheep milk LOQ=2 μg/kgLOD=0.14 μg/kg
OECD guidelines Doran and Adam, 2005.
NOTES: CC = Decision limit; CC = Detection capability. European Community, 2002.

27
Table 1.32. Summary of amoxicillin (Amox), amoxicilloic acid (AMA) and amoxicillin diketopiperazine (Diketo) analytical methods
Method Species and tissues LOD / LOQ Reported
validation Reference
LC-MS/MS Pig liver, kidney, muscle and fat
LOQ = 25 μg/kgLOD Amox = 1.5–3.5 μg/kgLOD AMA = 7.1–14.2 μg/kgLOD Diketo = 0.8–2.7 μg/kg
EU guidelines Reyns et al., 2008b.
LC-MS/MS Pig liver, kidney, muscle and fat
LOQ = 25 μg/kgLOD Amox = 2.3–12 μg/kgLOD AMA = 1.1–15 μg/kgLOD Diketo = 0.2–2.4 μg/kg
EU guidelines De Baere et al., 2002.
UHPLC-MS/MS
Bovine milk LOQ = 5 ng/mlLOD Amox = 1.0 ng/mlLOD AMA = 1.0 ng/mlLOD Diketo = 0.2 ng/ml
EU guidelines Liu et al., 2011.
HPLC-UV Human urine LOD = 1.0 ng/ml Internal validation on existing criteria
Haginaka and Wakai, 1987.
LC-MS/MS Chicken liver and muscle
CC = 56 μg/kgCC = 67 μg/kg
EU guidelines Freitas et al., in press.
NOTES: CC = Decision limit; CC = Detection capability.
Table 1.33. Summary of amoxicillin multi-residue analytical methods
Method Drugs and tissues Amoxicillin LOD/LOQ
Reported validation Reference
LC-MS/MS Ampicillin and amoxicillin in bovine muscle, liver, kidney and milk
LOQmilk = 0.8 μg/kgLODmilk = 0.5 μg/kgLOQtissues = 3 μg/kgLODtissues = 2 μg/kg
EU guidelines Bogialli et al., 2004.
HPLC-UV Penicillins in pig muscle including amoxicillin
LOD = 20 μg/kg Internal validation on existing criteria
McGrane, O’Keeffe and Smyth, 1998.
HPLC-UV Penicillins in pig muscle including amoxicillin
LOQ = 35 μg/kgLOD = 10 μg/kg
EU guidelines Verdon and Couëdor, 1999.
HPLC-Fluorescence
Penicillins in bovine serum, kidney and liver including amoxicillin
LOD = 0.02 μg/kg Internal validation on existing criteria
Hong et al., 1995.
HPLC-UV Penicillins in bovine muscle including amoxicillin
LOD = 10 μg/kg Internal validation on existing criteria
Boison and Keng, 1998.
HPLC-UV Penicillins in bovine and pig muscle, liver and kidney including amoxicillin
LOD = 10.1–10.5 μg/kg
Internal validation on existing criteria
Sørensen et al., 1999.
HPLC-UV-MS -lactam antibiotics in bovine milkincluding amoxicillin
LOD = 0.2 μg/L Internal validation on existing criteria
Tyczkowska et al., 1994.
HPLC-UV Ampicillin and amoxicillin in bovine muscle and liver
LOQmuscle = 50 μg/kg LOQliver = 100 μg/kg
Internal validation on existing criteria
Rose et al.,1997.
LC-MS-MS -lactam antibiotics in bovine kidney including amoxicillin
LOD = 10 μg/kg FDA guidelines Fagerquist, Lightfield and Lehotay, 2005.

28
Method Drugs and tissues Amoxicillin LOD/LOQ
Reported validation Reference
LC-MS-MS Antibiotics in pig, cattle, sheep, deer, horse and reindeer muscle and kidney, including amoxicillin
LOD = 12 μg/kg EU guidelines Granelli and Branzell, 2007.
LC-MS/MS Penicillins and cephalosporins in bovine muscle, kidney and milk, including amoxicillin
Milk CC = 4.7 μg/kgCC = 5.6 μg/kgMuscle CC =53.7 μg/kgCC = 57.7 μg/kgKidney CC =58.9 μg/kgCC = 69.3 μg/kg
EU guidelines Becker, Zittlau and Petz, 2004.
NOTES: CC = Decision limit; CC = Detection capability.
APPRAISAL
Amoxicillin is an old compound with a long history of use and has not been previously reviewed by the Committee. Amoxicillin is a beta-lactam antibiotic effective against Gram-positive and Gram-negative bacteria. It is widely used in human and veterinary medicine for the treatment and prevention of respiratory, gastrointestinal, urinary and skin bacterial infections. Amoxicillin is used in a variety of food animals including broiler chickens, pigs, goats, sheep, pre-ruminating calves, including veal calves, and cattle. In human medicine, amoxicillin is widely used in combination with clavulanic acid as a -lactamase inhibitor. In veterinary medicine, amoxicillin is not commonly used in combination with clavulanic acid.
Pharmacokinetic data on amoxicillin are available for a variety of animal species using various routes of administration and product formulations. In general, amoxicillin is rapidly distributed and eliminated. Relative bio-availability is dependent on formulation and route of administration.
Metabolism data also are available for a variety of animal species. Amoxicillin is moderately to rapidly metabolized to amoxicilloic acid and amoxicillin diketopiperazine, the two major identified metabolites. No antibacterial activity is recognized for these metabolites, but amoxicilloic acid could have potential allergic properties.
No amoxicillin radiolabelled residue depletion data were available for evaluation.Residue depletion data are available for 5, 4, 6 and 9 studies for pre-ruminating calves, ruminating
calves, pigs, lactating dairy cows, respectively, and 1 lactating sheep study. In all studies, amoxicillin residues deplete rapidly. Residues in muscle are universally low, irrespective of species, route of administration or product formulation used. Residues may persist in liver and kidney and in milk for hours to weeks following treatment, depending on the product formulation, dose and route of administration. Only one study, in pigs, provided tissue residue data for amoxicillin, amoxicilloic acid and amoxicillin diketopiperazine simultaneously. In this study, amoxicillin depleted rapidly but amoxicilloic acid is just below LOD in kidney (<7.1 g/kg) and in liver (<14.2 g/kg) 72 h post-treatment. For many studies in all three species, the sampling time frames are too long to permit a detailed analysis of residue depletion in tissues and, consequently, there are a substantial number of reported findings <LOQ.
Qualitative and quantitative single or multi-residue methods are available to determine residues of amoxicillin, the main microbiologically active residue identified in edible tissues and milk.Additionally, the two metabolites, amoxicilloic acid and amoxicillin diketopiperazine, can be simultaneously determined by some of the LC-MS/MS methods. Most of the methods have been validated according to internationally accepted standards and would be expected to be suitable for use in regulatory programmes.

29
MAXIMUM RESIDUE LIMITS
In recommending MRLs for amoxicillin, the Committee considered the following factors: An ADI of 0–0.7 g/kg bw was established by the Committee based on a microbiological end-point, equivalent to an upper bound of 42 g for a 60 kg person.Amoxicillin is primarily metabolized to amoxicilloic acid and amoxicillin diketopiperazine, which have no microbiological activity.Amoxicillin is the only microbiologically active residue and is suitable as a marker residue.Amoxicillin residues are consistently highest in kidney, and kidney is a suitable target tissue.Suitable validated routine analytical methods were available for monitoring purposes. The MRLs were based on twice the LOQ of 25 μg/kg for amoxicillin in edible tissues (including skin plus fat in pigs) and of 2 μg/kg for amoxicillin in sheep milk.
The Committee recommended MRLs for amoxicillin in cattle, sheep and pig tissues of 50 μg/kg and in cattle and sheep milk of 4 μg/kg, determined as amoxicillin parent compound. The Committee did not calculate an estimated daily intake (EDI) for amoxicillin owing to the small number of quantifiable residue data points. Using the model diet of 300 g muscle, 100 g liver, 50 g kidney, 50 gfat and 1.5 litre of milk with the MRLs recommended above, the theoretical maximum daily intake (TMDI) is 31 g/person per day, which represents 74% of the upper bound of the ADI.
REFERENCES
Acred, P., Hunter, A., Mizen, L. & Rolinson, G.N. 1970. -Amino-p-hydroxybenzylpenicillin (BRL 2333), a new broad-spectrum semisynthetic penicillin: in vivo evaluation. Antimicrobial Agents and Chemotherapy,9: 416–422.
Adam, G. & Roberts, S. 2006. Report 1541N-03-04-164. Depletion of milk residues following i.m.administration of clamoxyl RTU (amoxicillin) to sheep. Unpublished report submitted to FAO by Pfizer Animal Health.
Adam, G. & Roberts, S. 2007a. Report No. 1541N-03-04-165. Depletion of tissue residues following i.m.administration of clamoxyl RTU (amoxicillin) to sheep. Unpublished report submitted to FAO by Pfizer Animal Health
Adam, G. & Roberts, S. 2007b. Report No. 1820N-03-04-219. Development and validation of an analytical method for the determination of amoxicillin in swine liver, kidney, muscle and skin with fat. Unpublished report submitted to FAO by Pfizer Animal Health.
Adam, G. & Roberts, S. 2008. Report 1521N-03-05-242. Depletion of tissue residues following i.m.administration of clamoxyl RTU (amoxicillin) to swine. Unpublished report submitted to FAO by Pfizer Animal Health.
Agerso, H. & Friis, C. 1998. Bio-availability of amoxicillin in pigs. Journal of Veterinary Pharmacology and Therapeutics, 21: 41–46.
Anadón, A., Martinez-Larranaga, M.R., Diaz, M.J., Bringas, P., Fernandez, M.C., Martinez, M.A. & Fernandez-Cruz, M.L. 1996. Pharmacokinetics of amoxicillin in broiler chickens. Avian Pathology,25: 449–458.
Anderson, K.L., Moats, W.A., Rushing, J.E., Wesen, D.P. & Papich, M.G. 1996. Ampicillin and amoxicillinresidue detection in milk, using microbial receptor assay (Charm II) and liquid chromatography methods, after extra-label administration of the drugs to lactating cows. American Journal of Veterinary Research,57: 73–78.
Ang, C.Y.W., Luo, W., Call, V. & Righter, H.F. 1997. Comparison of liquid chromatography with microbial inhibition assay for determination of incurred amoxicillin and ampicillin residues in milk. Journal of Agricultural and Food Chemistry, 45: 4351–4356.
Ang, C.Y.W., Liu, F.F., Lay, J.O. Jr., Luo, W., McKim, K., Gehring, T. & Lochmann, R. 2000. Liquid chromatography analysis of incurred amoxicillin residues in catfish muscle following oral administration of the drug, Journal of Agricultural and Food Chemistry, 48: 1673–1677.
APVMA. 2007. Vetrimoxin 50 Soluble Powder. See: http://www.apvma.gov.au/advice_summaries/40946.pdf Accessed 22 October 2011.

30
Baggot, J.D. Undated. Pharmacokinetics of amoxicillin in dairy goats. Veterinary Pharmacology andToxicology, School of Veterinary Medicine, University of California, Davis, California, USA.
Barr, F.S. 1977. Intramuscular infusion protocol. Trial 110. Milk levels of amoxicillin following intramuscular injection. Beecham Research Laboratories, Surrey, England. Unpublished report submitted to FAO by the U.S. Food and Drug Administration, Center for Veterinary Medicine.
Becker, M., Zittlau, E. & Petz, M. 2004. Residue analysis of 15 penicillins and cephalosporins in bovine muscle, kidney and milk by liquid chromatography-tandem mass spectrometry. Analytica Chimica Acta,520: 3286–3291.
Bogialli, S., Capitolino, V., Curini, R., di Corcia, A., Nazzari, M. & Sergi, M. 2004. Simple and rapid liquid chromatography-tandem mass spectrometry confirmatory assay for determining amoxicillin and ampicillin in bovine tissues and milk. Journal of Agricultural and Food Chemistry, 52: 3286–3291.
Boison, J.O. & Keng, L.J.-Y. 1998. Multiresidue liquid chromatographic method for determining residues of mono- and dibasic penicillins in bovine muscle tissues. Journal of AOAC International, 81: 1113–1120.
Bruno, F., Curini, R., Di Corcia, A., Nazzari, M. & Samperi, R. 2001. Solid-phase extraction followed by liquid chromatography-mass spectrometry for trace determination of -lactam antibiotics in bovine milk.Journal of Agricultural and Food Chemistry, 49: 3463–3470.
Buswell, J. & Barber, D.M. 1989. Antibiotic persistence and tolerance in the lactating sheep following a course of intramammary therapy. British Veterinary Journal, 145: 552–557.
Buswell, J., Knight, C.H. & Barber, D.M. 1989. Antibiotic persistence and tolerance in the lactating goat following intramammary therapy. Veterinary Record, 125: 301–303.
Buswell, J.F. & Lay, S.J. 1974. Amoxicillin blood and milk level study in the lactating bovine following parenteral intramuscular injection. Beecham Research Laboratories, Surrey, England. Unpublished report submitted to FAO by the U.S. Food and Drug Administration, Center for Veterinary Medicine.
Connolly, P., Prough, M.J. & Lesman, S.P. 2006a. Report 1531N-60-04-453. Determination of amoxicillin residues in bovine tissues after 5 i.m. injections of clamoxyl RTU (amoxicillin) at 7 mg/kg at 24-hour intervals. Unpublished report submitted to FAO by Pfizer Animal Health.
Connolly, P., Prough, M.J. & Lesman, S.P. 2006b. Report 1531N-60-04-455. Depletion of tissue and milk residues following i.m. administration of clamoxyl RTU (amoxicillin) to cattle. Unpublished report submitted to FAO by Pfizer Animal Health.
Craigmill A.L., Pass, M.A. & Wetzlich, S. 1992. Comparative pharmacokinetics of amoxicillin administered intravenously to sheep and goats. Journal of Veterinary Pharmacology and Therapeutics, 15: 72–77.
De Baere, S., Cherlet, M., Baert, K. & De Backer, P. 2002. Quantitative analysis of amoxycillin and its major metabolites in animal tissues by liquid chromatography combined with electrospray ionization tandem mass spectrometry. Analytical Chemistry, 74: 1393–1401.
De Baere, S., Wassink, P., Croubels, S., De Boever, S., Baert, K. & De Backer, P. 2005. Quantitative liquid chromatographic-mass spectrometric analysis of amoxycillin in broiler edible tissues. Analytica Chimica Acta, 529: 221–227.
Doran, A. & Adam, G. 2005. Report No. 1840N-03-03-154. Development and validation of an analytical method for the determination of amoxicillin in ovine liver, kidney, muscle, fat and milk. Unpublished report submitted to FAO by Pfizer Animal Health.
Elsheikh, H.A., Taha, A.A., Khalafalla, A.E., Osman, I.A. & Wasfi, I.A. 1999. Pharmacokinetics of amoxicillin trihydrate in desert sheep and Nubian goats. V Veterinary Research Communications,23(8): 507–514.
Escudero, E., Carceles, C.M. & Vicente, S. 1996. Pharmacokinetics of amoxicillin/clavulanic acid combination and both drugs alone after intravenous administration to goats, British Veterinary Journal,152: 551–559.
European Commission. 2002. Commission Decision 2002/657/EC of 12 August 2002, Implementing Council directive 96/23/EC concerning the performance of analytical methods and the interpretation of results. Official Journal of the European Union, L221: 8–36.
Fagerquist, C.K., Lightfield, A.R. & Lehotay, S.J. 2005. Confirmatory and quantitative analysis of beta-lactam antibiotics in bovine kidney tissue by dispersive solid-phase extraction and liquid chromatography-tandem mass spectrometry. Analytical Chemistry, 77: 1473–1482.
FDA. 1999. Amoxicillin Injection for Sheep; Availability of Data, See: http://www.federalregister.gov/articles/1999/08/06/99-20255/amoxicillin-injection-for-sheep-availability-of-data Accessed 22 October 2011.
FDA. 2011. U.S. CFR, Title 21 Sections 520 and 522, 2010. See:http://www.accessdata.fda.gov/scripts/cdrh/cfdocs/cfcfr/cfrsearch.cfm Accessed 22 October 2011.

31
Fernandez, C., Modamio, P., Mestorino, N., Errecalde, J.O. & Mariño, E.L. 2007. Pharmacokinetics of sodium and trihydrate amoxicillin in sheep after intravenous and intramuscular administration. Journal of Veterinary Pharmacology and Therapeutics, 30: 263–266.
Freitas, A., Barbosa, J. & Ramos, F. In press. Determination of amoxicillin stability in chicken meat by liquid chromatography-tandem mass spectrometry. Food Analytical Methods, in press.
Fujiwara, K., Shin, M., Miyazaki, T. & Maruta, Y. 2011. Immunocytochemistry for amoxicillin and its use for studying uptake of the drug in the intestine, liver, and kidney of rats. Antimicrobial Agents and Chemotherapy, 55(1): 62–71.
Granelli, K. & Branzel, C. 2007. Rapid multi-residue screening of antibiotics in muscle and kidney by liquid chromatography-electrospray ionization-tandem mass spectrometry. Analytica Chimica Acta, 586: 289–295.
Haginaka, J. & Wakai, J. 1987. Liquid chromatographic determination of amoxicillin and its metabolites in human urine by post-column degradation with sodium hypochlorite. Journal of Chromatography, 413: 219–226.
Hernandez, E., Rey, R., Puig, M., Garcia, M.A., Solans, C. & Bregante, M.A. 2005. Pharmacokinetics and residues of a new oral amoxicillin formulation in piglets: preliminary study. Veterinary Journal,170(2): 237–242.
Hong. C.-C., Lin, C.-L., Tsai, C.-E. & Kondo, F. 1995. Simultaneous identification and determination of residual penicillins by use of high-performance liquid chromatography with spectrophotometric or fluorometric detectors. American Journal of Veterinary Research, 56: 297–303.
Keefe, T.J. 1976a. Tissue protocol. Trial 100. Non-ruminating calves. Beecham Research Laboratories, Surrey, England. Unpublished report submitted to FAO by the U.S. Food and Drug Administration, Center for Veterinary Medicine.
Keefe, T.J. 1976b. Tissue protocol. Trial 103. Non-ruminating calves. Beecham Research Laboratories, Surrey, England. Unpublished report submitted to FAO by the U.S. Food and Drug Administration, Center for Veterinary Medicine.
Keefe, T.J. 1976c. Tissue residue protocol. Trial 105. Non-ruminating calves. Beecham Research Laboratories, Surrey, England. Unpublished report submitted to FAO by the U.S. Food and Drug Administration, Center for Veterinary Medicine.
Keefe, T.J. 1976d. Intramuscular infusion protocol. Trial 111. Normal lactating cows. Beecham Research Laboratories, Surrey, England. Unpublished report submitted to FAO by the U.S. Food and Drug Administration, Center for Veterinary Medicine.
Keefe, T.J. 1976e. Tissue residue protocol Trial 101 – Swine. Beecham Research Laboratories, Surrey, England. Unpublished report submitted to FAO by the U.S. Food and Drug Administration, Center for Veterinary Medicine.
Keefe, T.J. 1979. Tissue residue protocol Trial 100 – Swine. Beecham Research Laboratories, Surrey, England. Unpublished report submitted to FAO by the U.S. Food and Drug Administration, Center for Veterinary Medicine.
Keefe, T.J. & Kennedy, T. 1983a. Infusion protocol. VMD267 Normal lactating cows. Amoxi-inject. Beecham Research Laboratories, Surrey, England. Unpublished report submitted to FAO by the U.S. Food and Drug Administration, Center for Veterinary Medicine.
Keefe, T.J. & Kennedy, T. 1983b. Infusion protocol. VMD268 Normal lactating cows. Amoxi-inject. Beecham Research Laboratories, Surrey, England. Unpublished report submitted to FAO by the U.S. Food and Drug Administration, Center for Veterinary Medicine.
Kung, K. & Wanner, M. 1994. Bio-availability of different forms of amoxycillin administered orally to dogs. Veterinary Record, 135: 552–554.
Liu, C., Wang, H., Jiang, Y. & Du, Z. 2011. Rapid and simultaneous determination of amoxicillin, penicillin G, and their major metabolites in bovine milk by ultra-high-performance liquid chromatography–tandem mass spectrometry. Journal of Chromatograpy B, 879: 533–540.
Lugoboni, B., Gazzotti, T., Zironi, E., Barbarossa, A. & Pagliuca, G. 2011. Development and validation of a liquid chromatography/tandem mass spectrometry method for quantitative determination of amoxicillin in bovine muscle. Journal of Chromatography B, 879: 1980–1986.
Luo, W. & Ang, C.Y.W. 2000. Determination of amoxicillin residues in animal tissues by solid-phase extraction and liquid chromatography with fluorescence detection. Journal of AOAC International, 83: 20–25.
Marchand, S., Chenel, M., Lamarche, I. & Couet, W. 2005. Pharmacokinetic modelling of free amoxicillin concentrations in rat muscle extracellular fluids determined by microdialysis. Antimicrobial Agents and Chemotherapy, 49(9): 3702–3706.

32
Martinez-Larranaga, M.R., Anadón, A., Martinez, M.A., Díaz, M.J., Frejo, M.T., Castellano, V.J., Isea, G. & de La Cruz, C.O. 2004. Pharmacokinetics of amoxicillin and the rate of depletion of its residues in pigs. Veterinary Record, 154: 627–632.
McGrane, M., O’Keeffe, M. & Smyth, M.R. 1998. Multi-residue analysis of penicillin residues in porcine tissue using matrix solid phase dispersion. Analyst, 123: 2779–2783.
Melilea, L. & Desai, B. 1979. Report No. 249. Determination of amoxicillin residue in swine and beef tissue Beecham Research Laboratories, Surrey, England. Unpublished report submitted to FAO by the U.S. Food and Drug Administration, Center for Veterinary Medicine.
Morthorst, D. 2002. Bio-availability of amoxicillin in weaning piglets after oral and parenteral administration by feed and water under different conditions [in German, with English Abstract]. Inaugural-Dissertation, Tierärztliche Hochschule, Hannover.
Musser, J.M.B., Anderson, K.L., Rushing, J.E. & Moats, W.A. 2001. Potential for milk containing penicillinG or amoxicillin to cause residues in calves. Journal of Dairy Science, 84: 126–133.
Nagele E. & Moritz, R. 2005. Structure elucidation of degradation products of the antibiotic amoxicillin with ion trap MSn and accurate mass determination by ESI TOF. Journal of the American Society for Mass Spectrometry, 16(10): 1670–1676.
Neeley, M. & Connolly P. 2004. Report No. 1830N-60-03-405. Validation of analytical methods for the determination of amoxicillin in bovine tissues (liver, kidney, muscle, fat) and milk. Unpublished report submitted to FAO by Pfizer Animal Health.
Palmer, G.H. 1975a. Report 159. Amoxil injectables-oily, aqueous suspension and sodium salt. Urinary excretion following intramuscular injection in calves. Beecham Research Laboratories, Surrey, England. Unpublished report submitted to FAO by the U.S. Food and Drug Administration, Center for Veterinary Medicine.
Palmer, G.H. 1975b. Report 175. The distribution of amoxicillin p.f.a. in calves following oral administration with amoxicillin dispersible powder at 7 mg/kg. Beecham Research Laboratories, Surrey, England. Unpublished report submitted to FAO by the U.S. Food and Drug Administration, Center for Veterinary Medicine.
Palmer, G.H. 1975c. Report 210. Distribution of amoxicillin in calves following intramuscular injection with aqueous suspension – dose 7 mg/kg amoxicillin p.f.a. Beecham Research Laboratories, Surrey, England. Unpublished report submitted to FAO by the U.S. Food and Drug Administration, Center for Veterinary Medicine.
Palmer, G.H. 1975d. Report 211. The distribution of amoxicillin p.f.a. in calves following treatment with amoxicillin oral doser at 7 mg/kg. Beecham Research Laboratories, Surrey, England. Unpublished report submitted to WHO by the U.S. Food and Drug Administration, Center for Veterinary Medicine.
Palmer, G.H. 1976. Report ADD 360. Pharmacokinetics in pre-ruminant calves. Beecham Research Laboratories, Surrey, England. Unpublished report submitted to FAO by the U.S. Food and Drug Administration, Center for Veterinary Medicine.
Palmer, G.H., Bywater, R.J. & Francis, M.E. 1977. Amoxicillin: Distribution and clinical efficacy in calves.Veterinary Record, 100: 487–491.
Pengov, A. & Kirbis, A. 2009. Risks of antibiotic residues in milk following intramammary and intramuscular treatments in dairy sheep. Analytica Chimica Acta, 637(1-2): 13–17.
Pfizer. 2004. Clavamox® for cats and dogs. See: http://animalhealth.pfizer.com/sites/pahweb/US/EN/Products/Documents/AIF0504022.pdf Accessed 15 October 2011.
Reyns, T., De Boever, S., De Baere, S., De Backer, P. & Croubels, S. 2008a. Tissue depletion of amoxicillin and its major metabolites in pigs: influence of the administration route and the simultaneous dosage of clavulanic acid. Journal of Agricultural and Food Chemistry, 56: 448–454.
Reyns, T., Cherlet, M., De Baere, S., De Backer, P. & Croubels, S. 2008b. Rapid method for the quantification of amoxicillin and its major metabolites in pig tissues by liquid chromatography-tandem mass spectrometry with emphasis on stability issues. Journal of Chromatography, B, 861: 108–116.
Reyns, T., de Boever, S., Schauvliege, S., Gasthuys, F., Meissonnier, G., Oswald, I., de Backer, P. &Croubels, S. 2009. Influence of administration route on the biotransformation of amoxicillin in the pig. Journal of Veterinary Pharmacology and Therapeutics, 32(3): 241–248.
Rose, M.D., Tarbin, J., Farrington, W.H.H. & Shearer, G. 1997. Determination of penicillins in animal tissues at trace residue concentrations, II. Determination of amoxicillin and ampicillin in liver and muscle using cation exchange and porous graphitic carbon solid phase extraction and high-performance liquid chromatography. Food Additives and Contaminants, 14(2): 127–133.

33
Sakamoto, H., Hirose, T. & Mine, Y. 1985. Pharmacokinetics of FK023 in rats and dogs. Journal of Antibiotics, 38: 496–504.
Schering-Plough. 2007. Amoxi-Mast, lactating cow formula. Intramammary infusion. Union, NJ 07083, USA. Available at: http://www.merck-animal-health-usa.com/binaries/Amoxi-Mast_tcm130-164276.pdf Accessed 15 October 2011.
Schwarz, S., Bottner, A., Goosens, L., Hafez, H.M., Hartmann, K., Kaske, M., Kehrenberg, C., Kietzmann, M., Klarmann, D., Klein, G., Krabisch, P., Luhofer, G., Richter, A., Schulz, B., Sigge, C., Waldmann, K.-H., Wallman. J. & Werckenthin, C. 2008. A proposal of clinical breakpoints for amoxicillin applicable to porcine respiratory tract pathogens. Veterinary Microbiology, 126: 178–188.
Smith, T.A. & Moore, G.W. 1976. Tissue residue protocol. Trial 106. Ruminating calves. Beecham Research Laboratories, Surrey, England. Unpublished report submitted to FAO by the U.S. Food and Drug Administration, Center for Veterinary Medicine.
Smith, T.A., Moore, G.W., Dawson, S.K., Robinson, D.K. & Barr, F.S. 1975a. Tissue residue protocol. Trial 101. Non-ruminating calves. Beecham Research Laboratories, Surrey, England. Unpublished report submitted to FAO by the U.S. Food and Drug Administration, Center for Veterinary Medicine.
Smith, T.A., Moore, G.W., Dawson, S.K., Robinson, D.K. & Barr, F.S. 1975b. Tissue residue protocol. Trial 100. Ruminating calves. Beecham Research Laboratories, Surrey, England. Unpublished report submitted to FAO by the U.S. Food and Drug Administration, Center for Veterinary Medicine.
Smith, T.A., Moore, G.W., Dawson, S.K., Robinson, D.K. & Barr, F.S. 1976. Tissue residue protocol. Trial 105. Ruminating calves. Beecham Research Laboratories, Surrey, England. Unpublished report submitted to FAO by the U.S. Food and Drug Administration, Center for Veterinary Medicine.
Sørensen, L.K., Snor, L.K., Elkaer, T. & Hansen, H. 1999. Simultaneous determination of seven penicillins in muscle, liver and kidney tissues from cattle and pigs by a multiresidue high-performance liquid chromato-graphic method. Journal of Chromatography, B 734: 307–318.
Sousa, J.C. (editor). 2005. Manual de antibióticos antibacterianos. Fernando Pessoa University, Oporto, Portugal. See pp. 219–221.
Tanigawa, M. & Sawada, T. 2003. Exposure time-dependent bactericidal activities of amoxicillin against Actinobacillus pleuropneumoniae; an in vitro and in vivo pharmacodynamic model. Journal of Veterinary Medicine Series B-Infectious Diseases and Veterinary Public Health, 50(9): 436–442.
Tyczkowska, K.L., Voyksner, R.D., Straub, R.F. & Aronson, R.F. 1994. Simultaneous multiresidue analysis of beta-lactam antibiotics in bovine milk by liquid chromatography with ultraviolet detection and confirmation by electrospray mass spectrometry. Journal of AOAC International, 77: 1122–1131.
Verdon, E. & and Couëdor, P. 1999. Multiresidue analytical method for the determination of eight penicillin antibiotics in muscle tissue by ion-pair reversed-phase HPLC after pre-column derivatization. Journal of AOAC International, 82: 1083–1095.
Virbac. 2008. Suramox 15% LA and its associated name Stabox 15% LA. http://www.ema.europa.eu/ema/index.jsp?curl=pages/medicines/veterinary/referrals/Suramox/vet_referral_000012.jsp&mid=WC0b01ac05800986a1&murl=menus/regulations/regulations.jsp&jsenabled=true Accessed 15 October 2011.
Virbac. 2011. Suramox® 50% Pó Solúvel, Premix. http://www.virbac.com.br/linhas/producao/produto/suramox/Accessed 15 October, 2011.


ApramycinFirst draft prepared by
Adriana Fernandez Suarez, Buenos Aires, ArgentinaRichard Ellis, Myrtle Beach, USA,
andBruno Le Bizec, Nantes, France
IDENTITY
International Non-proprietary names (INN): ApramycinSynonyms: Laboratory Code EL-820 (EL-857, free base). Compound 47657.
Apralan® is the registered trademark for Elanco® products containing apramycinIUPAC Names: D-Streptamine, 4-0- [(8R)-2-amino-8-0-(4-amino-4-deoxy-a-D-glucopyranosyl)-2, 3,
7-trideoxy-7-(methylamino)-D-glycero-a-D-allo-octodialdo-1,5: 8, 4-dipyranos-1-yl] -2-deoxy-sulphuric acid salt
Chemical Abstracts Service Number: 41194-16-5Structural formula of main components:
Molecular formula: C21H 41N5O11. 5/2 H2SO4
Molecular weight of the salt: 784.8 Molecular weight of the base: 539.6

36
OTHER INFORMATION ON IDENTITY AND PROPERTIES
Pure active ingredient Apramycin is a broad-spectrum aminocyclitol antibiotic produced by a strain of Streptomyces tenebrarius. It is extracted from the fermentation medium as apramycin sulphate with a purity of at least 85%. A microbiological assay is used to determine activity as equivalents of apramycin base. Apramycin is synthesized stereospecifically by Streptomyces tenebrarius. It exists as a single enantiomer for which absolute configurations have been determined.
Degree of impurity of Apramycin (produced by Elanco Animal Health)Total impurities described below are not to exceed 15% (specifications for the release of the product).Qualitative and quantitative composition of impurities3 O-Hydroxyapramycin (C21H41N5O12) has a biological spectrum which is very similar to apramycin; microbiological activity is one-half to one-quarter that of apramycin.Lividimine (C21H41N5O12) is structurally related to apramycin, containing 2-deoxystreptamine and part of the bicyclic portion of the apramycin molecule. Its contribution to the biological activity of apramycin is negligible.2-Deoxystreptamine (C6H14N2O3) is a structural unit of most common aminocyclitol antibiotics, and is biologically inactive.Compounds A and B are defined on the basis of their thin-layer chromatography. These compounds have not been identified.Caerulomycin (C12H11N3O3) is determined as a dipyridyl, as the dipyridyl moiety is a more suitable measurement for the caerulomycin content since a part may be complexed or bound.Solubility: >300 g/L in water.
RESIDUES IN FOOD AND THEIR EVALUATION
Conditions of useThe Committee evaluated apramycin to establish an ADI and recommend MRLs in cattle, pig and chicken tissues at the request of the 19th session of the Codex Committee on Residues of Veterinary Drugs in Foods (CCRVDF). The request for MRLs in rabbits was not addressed as there was no approved use of apramycin in rabbits.
DosageIndications, recommended doses and duration of treatment for apramycin are presented in Table 2.3,below, in the tissue residue depletion studies section. An injectable form for use in cattle and an oral dose form for use in neonatal lambs, calves and pigs are no longer marketed. Apramycin is not used in human medicine.
Registered usesApramycin is registered for use in more than twenty countries in cattle, pigs and chickens. Individual country withdrawal periods for the three species exhibit substantial differences. In cattle, withdrawal periods vary between zero and 42 days. For pigs, the withdrawal periods are 10 to 42 days, and for chickens the withdrawal periods are zero to 14 days.

37
PHARMACOKINETICS AND METABOLISM
Pharmacokinetics in food-producing animalsCattleCalves weighing 38 to 52 kg were administered 20 or 40 mg apramycin activity/kg bw in milk replacer once per day for 5 days (3 male and 3 female calves per dose level) (Van Duyn and Handy, 1978). Following the first, third and fifth doses, blood samples were analysed for apramycin by a microbiological assay up to 24 h post-treatment for the first and third treatments and until 48 hfollowing the fifth treatment. Serum concentrations were broadly similar for each treatment level in both dosages. With the 20 mg/kg bw dose, serum levels peaked at 4 to 6 h after treatment, with mean values from 0.38 to 0.88 μg/ml. Values at 24 h after treatment ranged from undetectable to 0.13 μg/ml.After the fifth and last dose, apramycin serum levels were undetectable 24 h post treatment. After the 40 mg/kg bw dose, serum levels of apramycin were higher than those for the 20 mg/kg treatment. Serum levels peaked at approximately 6 h after treatment, with mean values of 2.49 and 2.40 μg/ml for the first and fifth daily doses, respectively. Mean values 24 h after treatment ranged from 0.15-0.31 μg/ml and duration of activity following the fifth and last dose was between 24 and 36 h.
Male and female Israeli-Friesian calves, 3 to 5 weeks of age, were fed an antibiotic-free milk replacer once a day (Ziv et al., 1985). Apramycin was administered orally as a drench at 20, 30 and 40 mg/kg bw to 10, 9 and 10 calves, respectively. Blood samples were taken 0.5, 1, 2, 3, 4, 6, 8 and 12 h after treatment. Six calves were placed in metabolism cages that facilitated total collection of urine and were administered 20 mg/kg bw apramycin in milk replacer. Maximum serum levels occurred 1 hour after administration. The oral dose of 20 mg/kg bw resulted in mean serum drug levels lower than 0.25 μg/ml and the drug was not detected 12 h post-treatment. After oral dosing of 30 and 40 mg/kg bw, mean peak serum drug concentrations were 1.42 and 1.84 μg/ml, respectively.
Apramycin is very poorly absorbed by the oral route in calves. Even where the area under the serum curves was not reported, it is evident from inspection of the curves that availability of apramycin by the oral route was low. Concentration of apramycin in urine was determined by a microbiological assay. Urine concentrations were very low, i.e. 2.5 μg/ml, but the drug was still detected at 128 h post-treatment. Only 11% of the dose was recovered in urine.
PigsA series of studies was conducted in which pigs were administered single doses of apramycin sulphatein aqueous solution by oral gavage and blood levels measured during the next 24 h (Van Duyn and Kline, undated). The pigs ranged in weight from approximately 1.3 to 21 kg and doses ranged from 2.27 to 100 mg apramycin activity per kg bw. Blood levels, determined by a microbiological assay, were low and highly variable. Generally, where measurable levels were found, they peaked between 30 minutes and 4 h after dosing, and declined to below the sensitivity of the assay within 12 to 24 h. In one of the studies, blood levels were compared in 2-day, 4- and 8-week old piglets after dosing with the same (mg/kg bw) apramycin doses. Absorption of apramycin appeared to be most efficient in neonatal pigs, and to decline with age.
Another study (Shang et al., 2004) reported pharmacokinetics of apramycin after single oral or intravenous (i.v.) dosing of pigs with 20 mg apramycin/kg bw. Blood levels fitted a one-compartment open model and a two-compartment open model after oral and i.v. dosing, respectively. For oraltreatment, the half-life of elimination was 7.36 h and area under the curve was 4.14, while for i.v.treatment, the half-life of elimination was 3.17 h and area under the curve was 130.62. Oral availability was 3.2%.
One female and two castrated male pigs, weighing approximately 10 kg, were given 25 mg 14C-apramycin/kg bw by oral gavage daily for 5 days (Zornes, Herberg and Donoho, 1979), and 82% to 92% of the dose was recovered in excreta, mostly in faeces. Less than 10% of the dose was found in urine.
Two female and four castrated male pigs, weighing approximately 8 kg, were given 25 mg 14C-apramycin/kg bw by oral gavage daily for 5 days (Herberg et al., 1979). Groups of 1 female and 2 castrated males were slaughtered 4 h or 7 days after the last dose. Balance-excretion data were
38
collected for the female in the 7-day withdrawal group; 86.9% of the dose was recovered in excreta, of which 81.6% in faeces and 5.3% in urine.
ChickensFive chickens were administered a single dose of 75 mg/kg apramycin orally into the crop and another five were administered the same dose intramuscularly (i.m.) (Afifi and Ramadan, 1997). Two weeks later, all of the chickens were administered 75 mg/kg i.v. to study drug availability and protein binding. Apramycin was rapidly absorbed when it was administered orally or i.m.; mean times to reach maximum serum concentration after the dose were 0.2 and 0.76 h, respectively. Average half lives for elimination were 1.22 and 2.31 h for the same respective treatments. The maximum concentration reached after oral treatment was only 0.79 μg/ml, compared with 11.6 μg/ml for i.m. treatment, and the respective areas under the curve were 0.81 μg/h/ml and 23.18 μg/h/ml. Bio-availability of apramycin was approximately 2% by the oral route and 58% by the i.m. route.
No excreta data were presented for chickens.
Pharmacokinetics in other speciesRatsAdult rats were given single oral or s.c. doses of 4 mg 14C-apramycin (Donoho et al., 1976). Following oral treatment, 99.5% of the dose was recovered in faeces and 0.5% in urine, while 93% was recovered in urine and 7% in faeces after s.c. dosing.
DogsMale and female Beagle dogs with initial weights of 7.2 to 14.6 kg were administered apramycin at 0, 25, 50 or 100 mg/kg bw/day for 6 months (Howard et al., 1977). Dogs were dosed orally with apramycin in gelatin capsules. Blood samples, collected from 2 males and 2 females per treatment group on days 1, 64, 119 and 182 of the study, were analysed for apramycin using a microbiological assay. Mean peak serum levels occurred 2 h after dosing and were 2.2, 5.5 and 11.0 μg/ml for the 25, 50 and 100 mg/kg bw treatments, respectively. All samples collected 24 h after dosing contained <0.5 μg/ml. There was no evidence of accumulation or altered plasma concentrations after prolonged treatment. Urine voided over a 24-hour period was collected from 2 males and 2 females per treatment group on test days 1, 64, 119 and 182 and analysed for apramycin using a microbiological assay. Theaverage proportion of the daily dose that was recovered in urine was 4.0% (standard deviation = 2.6%) with a range of 0.3 to 10.5%.
Summary of pharmacokinetic studiesIn calves, pigs, chickens, rats and dogs, apramycin is rapidly yet poorly absorbed by the oral route and quickly eliminated. Mean levels in serum are found a few hours after treatment (up to 6 h) and undetectable at times between 24 and 36 h, depending on the study. Reported availability is poor (3.2% in pigs; < 2% in chickens). More than 80% is primarily recovered in excreta in pigs and rats. The main excreta is in faeces for the mentioned species (more than 82% in pigs and 99.5% in rats), with very low concentrations in urine (11% for cattle; less than 10% for pigs, rats and dogs). Binding of apramycin to serum proteins was 26%, similar to the value found for cows, sheep and goats by Zivet al. (1995).
Metabolism in food-producing animalsCattleA calf of approximately 40 kg body weight was given 20 mg/kg 14C-apramycin by i.m. injection on two successive days (Donoho et al., 1976). Total radiolabel dose of apramycin for the calf was 18 μCi. The calf was slaughtered 5 days after the last dose, with the bulk of the radioactivity collected by the end of day 2. Kidney contained the most radioactivity (40.9 mg apramycin equivalent/kg), followed by liver (4.7 mg/kg) and muscle (0.3 mg/kg); fat contained no radioactivity above background. Residues determined by the microbiological assay were compared with the radiolabel results, and 71% of the radioactivity in kidney and 62% of radioactivity in liver was un-metabolized apramycin as determined by the microbiological assay. In blood, levels of radioactivity reached a peak at approximately 30

39
minutes after injection (maximum concentration was approximately 35 mg/kg-equivalents) and declined to near baseline levels by 24 h. Of the total radioactive dose administered, 84% was recovered in excreta by the end of 5 days following the last dose. More than 93% of the excreted radioactivity was found in the urine within 24 h, and microbiological assay indicated that 90–91% the radioactivity was accounted for as apramycin.
PigsA 1979 two-part radiolabel study was conducted by Herberg et al. (1979) and Zornes, Herberg and Donoho (1979). In the first part, six piglets weighing approximately 8 kg each were given 25 mg 14C-apramycin/kg by oral gavage daily for 5 days (Herberg et al., 1979). One female and two castrated males were slaughtered at 4 h withdrawal and a similar group was terminated at 7 days withdrawal.Edible tissues were assayed for total radioactivity and selected samples were assayed for apramycin. At 4 h withdrawal, all of the radioactivity in kidney samples was characterized as apramycin After 7 days withdrawal, 80% of the radioactivity in one kidney sample was apramycin, while the other samples contained too little residue for analysis. At 4 h withdrawal, liver samples of the two male piglets contained approximately 85% of unchanged apramycin, while the liver from the female contained at least 50% of apramycin. None of the other tissues contained sufficient radioactivity for apramycin characterization.
In the second part of the study, one female and two castrated male piglets, weighing approximately 10 kg, were given 25 mg 14C-apramycin/kg bw by oral gavage daily for 5 days; they were slaughtered 14 days after the last dose (Zornes, Herberg and Donoho, 1979). Approximately 66% of the kidney residue was unchanged apramycin. In the one liver sample that contained enough residue for characterization, approximately 36% of the total residue was apramycin. In both the faeces and the urine collected, radioactivity was predominantly accounted for by unchanged apramycin (75%)
ChickensBroiler chickens that were approximately 4 weeks old were given 14C-apramycin (500 mg/L) in the drinking water for five days (Zornes, Herberg and Thomson, 1985). Three chickens were slaughtered 6 h, 7, 10 and 14 days after withdrawal from treatment. Samples with sufficient total activity (all kidney samples and the 6-hour liver samples) were analysed for parent apramycin by bio-autography.Apramycin accounted for 80% or more of total activity in all of the samples.
Summary of metabolism studiesIn cattle, pigs and chicken, levels of radioactivity are highest in kidney, followed by liver, with very low quantities in muscle and fat. Little biotransformation occurs; the drug remains in tissues mostly as unchanged apramycin. In general, tissues contained insufficient residues for characterization.
In calf studies, 71% of the radioactivity in kidney and 62% in liver were unchanged apramycin. In pigs, apramycin in kidney ranged from 66–80% of the radioactivity and 85% in the liver samples tested, with exception of two animals where levels of 50% and 36% were found. In chickens, in kidney and liver samples analysed, unchanged apramycin accounted for 80% or more of total activity. It is excreted mainly as unmetabolized apramycin in cattle (>90%) and pigs (75%).
TISSUE RESIDUE DEPLETION STUDIES
Radiolabelled residue depletion studiesPigsIn radiolabel depletion studies, sampling in the first part was at 4 h and 7 days with six piglets weighing about 8 kg (Herberg et al., 1979), and in the second part, sampling was only done at 14 days,with 6 piglets weighing about 10 kg (Zornes, Herberg and Donoho, 1979). Analysis of fortified 14Capramycin for all control tissues fortified at 0.5, 0.1 and 0.05 mg/kg gave recoveries of all tissues of 98, 107 and 135%, respectively. Balance excretion data at 7 days was 86.9% with 81.6% in faeces and 5.3% in urine. At 14 days the total excreted radioactivity was 82–92% with less than 10% in urine.

40
Approximately 66% of the radioactivity in kidney was apramycin. None of the other samples contained sufficient residue for characterization. Results are presented in Table 2.1.
Table 2.1. Residues in pig tissues following administration of 14C-apramycin in water (25 mg/kg bw) for 5 days
Withdrawal time14C Residue (mg apramycin-equivalents/kg)
Muscle Liver Kidney Fat4 hours(1) 0.06 0.20 1.39 0.13
0.22 4.01 70.99 0.300.11 1.94 9.74 0.13
7 days(1) 0.04 0.10 0.11 0.090.06 0.19 0.52 0.120.04 0.08 0.17 0.11
14 days(2) 0.02 0.08 0.17 0.060.02 0.04 0.05 0.100.05 0.14 0.29 0.15
SOURCES: (1) Herberg et al., 1979. (2) Zornes, Herberg and Donoho, 1979.
ChickensZornes, Herberg and Thomson (1985) gave twelve 4-week old Hubbard × White Mountain broiler chickens 500 mg/L 14C-apramycin in the drinking water for five days (maximum recommended dose).Three birds (two male and one female in each group) were terminated at each sampling time of 0 (6 h), 7, 10 and 14 days (body weights of the chickens were not provided). Total radioactivity was determined by direct solubilization followed by liquid scintillation counting. All residue samples were adjusted to 100% counting efficiency. Detection and recovery of radioactivity was checked by fortifying control tissues digested in the same manner as the treated chickens with a nominal radio-activity equivalent to 0.1 mg/kg bw from a solution with a mean value of 109.35 dpm/ml. At zero day withdrawal, average total residues were 3.23, 0.42, 0.20 and 0.07 mg apramycin equivalent/kg in kidney, liver, skin and muscle, respectively. After 14 days, average total residue had declined to 0.47, 0.08, 0.03 and 0.02 mg/kg in the same respective tissues. Apramycin accounted for more than 80% of the total residue in the samples that contained sufficient residue for assay (all kidney samples and the 6 h liver samples). Results are summarized in Table 2.2.
Table 2.2. Residues in chicken tissues following administration of 14C-apramycin in drinking water (500 mg/L) for 5 days
Withdrawal time14C-Apramycin (mg apramycin equivalents/kg)
Muscle Liver Kidney Fat+Skin0 (6 hours) 0.07 0.24 2.35 0.22
0.08 0.51 4.47 0.260.07 0.50 2.87 0.13
7 days 0.02 0.20 1.93 0.050.03 0.21 1.60 0.060.02 0.05 0.88 0.06
10 days 0.02 0.14 1.32 0.050.02 0.18 0.70 0.040.02 0.07 0.70 0.04
14 days 0.01 0.11 0.37 0.03

41
0.02 0.02 0.50 0.040.02 0.11 0.55 0.03
Residue depletion studies with unlabelled drugTo assist in the evaluation of the residue depletion studies it is relevant to consider the approved treatments and use of apramycin in pigs, cattle and poultry (Elanco, 2011). The relevant information is provided in Table 2.3 (revised apramycin sponsor submission, 24 October 2011). In some pig studies, the maximum recommended doses in the original dossier did not appear to have been used. The sponsor provided updated information on maximum dose rates in pigs based on regulatory approvals (e.g. Australia and New Zealand) where the highest label dose rate is 25 mg/kg bw/day for neonatal piglets and 12.5 mg/kg bw/day for weanlings. For feed medication in pigs, the maximum dose rate of 8 mg/kg bw/day, using a maximum feed inclusion of 200 mg/kg, implies a voluntary feed intake of 4% of body weight. The sponsor noted that this is a very good estimate for pigs weighing from about 50 kg to slaughter weight. Younger pigs will regularly consume more than 6% of body weight, and asa consequence, higher mg/kg bw/day doses may be found in studies that used younger animals. For example, in the study of Kido et al. (1983) noted below, the average weight of the pigs during the period of medication was approximately 26 kg. The pigs consumed approximately 6% of body weight daily, giving average daily doses of 12 and 36 mg/kg bw/day for feed inclusion levels of 200 and 600 mg/kg. As a result, reported studies using neonate or weanling pigs represent considerably higher doses on a mg/kg bw/day basis than would normally be encountered in pigs of market weight.

42
Table 2.3. Indications and posologies for apramycin
Species Indication FormulationDose (mg/kg bw/d;
inclusion rate in water or feed)
Duration (days)
Calves*Colibacillosis,Salmonellosis and other bacterial infections
Soluble powder; incorporated in drinking water or milk replacer 20–40 5
Premix; incorporated in feed 20–40 5
PigsColibacillosis Salmonellosis and other bacterial infections
Soluble powder; incorporated in drinking water 7.5–12.5 (1) 7
Premix; incorporated in feed 4–8(80–200 mg/kg feed) 28
Poultry(2)
E. coli septicaemia, Colibacillosis,Salmonellosis and other bacterial infections
Soluble powder; incorporated in drinking water
20–80 (250–500 mg/L) 5–7
Premix; incorporated in feed (2–5mg/kg feed) 5
Rabbits Bacterial enteritis,including colibacillosis
Soluble powder; incorporated in drinking water
10–15(50–100 mg/L) 5–8
Premix; incorporated in feed 5–10(50–100 mg/kg feed) 21
NOTES: (1) Correction to maximum dose for market-ready pigs. (2) Not for use in animals producing milk or eggs for human consumption.
Additional comment regarding posology of apramycin.The highest label dose rate for pigs is 25 mg/kg/day in Australia and New Zealand for neonatal piglets. This dose reverts to 12.5 mg/kg/day for weanlings.Most labels require dosing to an inclusion rate in feed or water. Dose rates in terms of mgapramycin per kg per day are typically calculated from “consumption” data, which is often skewed by spillage and waste, particularly in the case of pigs. Older animals eat and drink less per body weight than younger animals. Thus, typical market-weight animals will tend toward the lower end of the dose rate range.
It is also relevant to consider the effects of the reported limit of detection (LOD) and limit of quantitation (LOD). The analytical method LOD and LOQ as reported in the sponsor dossier provide preliminary guidance to interpret the results in the residue depletion studies for each animal species and tissue (See Table 2.4). The LOD values were determined in accord with EC directive 93/256EEC, while the LOD values were based on lowest concentration of fortified control tissues used in the method validation and may not reflect true LOQs. Studies conducted in the early 1970s may be reported as analytical range values based on bio-autography and/or paper chromatography. Details regarding the analytical methods are presented in the methods section of this report.

43
Table 2.4. Limits of detection (μg/kg) and limits of quantitation (μg/kg) of apramycin for different species×matrix combinations (analytical method based on HPLC separation and fluorimetric detection)
Species Tissue LOD (μg/kg) LOQ (μg/kg) Ratio LOQ/LODCattle Muscle 268 500 1.9Cattle Liver 396 5000 12.6Cattle Kidney 229 5000 21.8Cattle Fat 129 500 3.9Pig(1), (2) Muscle 280/314 500/500 1.8/1.6Pig Liver 250/253 5000/500 20.0/2.0Pig Kidney 220/212 5000/2500 22.7/11.8Pig Fat 20/23 500/500 25.0/21.7Pig Skin+Fat 50/60 500/500 10.0/8.3Poultry Muscle 319 500 1.6Poultry Liver 470 500 1.1Poultry Kidney 133 500 3.8Poultry Skin+Fat 32 500 15.6Rabbit(3), (4) Muscle 54/500 500/500 9.2/1.0Rabbit Liver 57/100 500/500 8.8/5.0Rabbit Kidney 24/600 2500/2500 105/4.2Rabbit Fat 38/200 500/500 13.3/2.5
NOTES: (1) Values reported in validation study by Parker, 1995b. (2) Values reported in validation study by Parker, 1995c. (3) Values reported in method validation study by Heal, 2007. (4) Values reported in method validation study by Villa and Brightwell, 1998.
CattleTwo early studies used a semi-quantitative microbiological method to determine tissue residues after oral administration of apramycin to Holstein bull calves for five days. The calf body weights were 36–52 kg. In each study, three or four calves were terminated at intervals of approximately 1 h, 7, 14, 21 and 28 days after the last dose.
Van Duyn and Handy (1977) treated 16 Holstein dairy calves (body weights 36.3–46.7, mean = 42.1 kg) with bolus doses of 39 mg apramycin/kg bw/day by gavage (maximum recommended dose). Residues in kidney were 50–100 mg/kg at zero day withdrawal, depleting to 1–4 mg/kg after 28 days. Residues in liver were 2–8 mg/kg at zero day withdrawal, depleting to 0.4 mg/kg or less by 21 days. The maximum residue in any muscle sample was 0.5–1.0 mg/kg at zero withdrawal and no residues were detectable by 28 days. Results are summarized in Table 2.5. ND means no residue detected at test sensitivity of <0.1 mg/kg and IS means insufficient sample

44
Table 2.5. Residues in calf tissues after administration of bolus doses of apramycin (39 mg/kg bw/day) for 5 days
Withdrawal timeApramycin (mg/kg)
Muscle Liver Kidney Fat
0 (ca. 1 h)<0.5 2.0 to 4.0 50.0 to 100.0<0.5 4.0 to 8.0 50.0 to 100.0 IS
0.5 to 1.0 4.0 to 8.0 50.0 to 100.0
7 days<0.1 <0.2 2.5 to 5.0
0.1 to 0.2 4.0 to 8.0 40.0 to 80.0 IS0.1 to 0.2 4.0 to 8.0 20.0 to 40.0
14 days0.1 to 0.2 1 to 2 8.0 to 16.0
<0.1 2.0 to 4.0 5.0 to 10.0 IS<0.1 2.0 to 4.0 8.0 to 16.0
21 days0.1 to 0.2 0.2 to 0.4 10.0 to 20.0
ND <0.2 5.0 to 10.0 ISND <0.2 5.0 to 10.0
28 days
ND <0.2 4.0ND Lost sample 1.0 to 2.0 ISND <0.2 4.0ND <0.2 4.0
NOTES: ND means no residue detected at test sensitivity of <0.1 mg/kg. and IS means insufficient sample
Table 2.6. Residues in calf tissues after administration of apramycin in milk replacer once daily (40 mg/kg bw/day) for 5 days
Withdrawal timeApramycin (mg/kg)
Muscle Liver Kidney Fat0 (1 hour) 0.1–0.2 2.0–4.0 40.0–80.0
1.0–2.00.1–0.2 2.0–4.0 40.0–80.00.1–0.2 2.0–4.0 40.0–80.0
7 days ND 0.4–0.8 10.0–20.00.1–0.2<0.05 2.0–4.0 5.0–10.0
ND 2.0–4.0 5.0–10.014 days ND 0.2–0.4 4.0–8.0
IS<0.05 1.0 4.0–8.0ND 2.0–4.0 4.0–8.0
21 days ND 1.0 1.6–3.2<0.05ND 1.0–2.0 1.6–3.2
ND 1.0–2.0 1.6–3.228 days ND 1.6 2.0–4.0
0.1–0.2ND 0.8–1.6 2.0–4.0ND 0.8–1.6 2.0–4.0
NOTES: ND = no residue detected at the method sensitivity of <0.05– <0.10 mg/kg; IS = insufficient sample.

45
Handy and Van Duyn (1978) treated 25 × 2–7-day-old calves with apramycin dissolved in reconstituted milk replacer, which was bottle-fed once per day at a dose rate of 40 mg/kg bw(maximum recommended dose). Weights of the calves were 37–52 kg (mean = 42.9 kg) at the beginning of the study. Three animals were sampled at each withdrawal time of 0, 7, 14, 21 and 28 days. Analysis was done using bioautography. Residues in kidney were 40–80 mg/kg at zero withdrawal, depleting to 4 mg/kg or less after 28 days. Residues in liver at zero withdrawal were 2–4 mg/kg, depleting to 1.6 mg/kg or less after 28 days. In muscle, the highest level was 0.2 mg/kg at zero withdrawal and residues were not detected after 21 days. Because of insufficient fat in each animal, a composite fat sample was analysed at each withdrawal time. At zero withdrawal, the residue in fat was 1–2 mg/kg and declined approximately 10-fold by 28 days. The very young age of the animals may not be representative of calves in general because of their immature metabolic status. Results are shown in Table 2.6.
Table 2.7. Residues in male calves following oral dosing with apramycin (40 mg/kg- body weight/day) for 5 days
Withdrawal time Apramycin (mg/kg)
Muscle Liver Kidney Fat0 (4 h) ND 2.80 118.7 0.900
ND 0.90 161.8ND 2.00 153.6ND 0.60 75.3
7 days ND ND 12.4 0.100ND ND 15.5ND 1.20 21.7ND ND 2.80
14 days ND 0.40 3.50 NDND 0.40 17.3ND ND 2.90ND 0.50 3.00
21 days 0.80 0.60 9.40 NDND 0.60 2.00ND 0.40 3.60ND 0.70 4.40
28 days ND ND 3.90 NDND ND 1.50ND ND 1.50ND ND 0.90
35 days ND 0.40 9.20 NDND ND 2.70ND ND 0.40ND ND 1.40
Tissue LOQ 0.50 5.00 5.00 0.50Tissue LOD 0.27 0.40 0.23 0.13
NOTES: ND = not detected.

46
A GLP-compliant residue depletion study in calf tissues was conducted by Parker (1995a). In the two-part study, one group of 20 calves was given 20 mg/kg bw by i.m. injection (Group A) and one group of 24 male Friesian crossbred calves were given oral doses of 40 mg/kg bw apramycin daily (maximum recommended dose for oral treatment) for five consecutive days (Group B). Because oraltreatment is the only approved treatment for use, results are only provided for group B (with animals weighing 48–68 kg, mean = 55.5 kg). Groups of four calves were sacrificed at withdrawal intervals of zero (4 h), 7, 14, 21, 28 and 35 days. Apramycin residues in edible tissues were determined using a validated HPLC method (Parker, 1995d). Laboratory analysis provided estimates of residue concen-trations that were between the LOQ and the LOD. Residues in liver were always less than the LOQ (5 mg/kg); estimated concentrations were less than 1 mg/kg by 14 days and residues were detected in only one sample collected at 28 and 35 days withdrawal. Because of limited fat, samples at each withdrawal time were composited for analysis. Apramycin was not detected in fat at or beyond the 14 day sample (LOD = 0.13 mg/kg). Residues were not detected in muscle (LOD = 0.27 mg/kg) except one sample at 21 days (<1 mg/kg). Apramycin residues in kidneys were less than 20 mg/kg at 14 days and the majority of the residues were below the limit of quantitation (LOQ = 5.0 mg/kg) by 21 days. Results below the LOQ are estimated values. Results are shown in Table 2.7.
Table 2.8. Residues in calf tissues following oral dosing with apramycin (40 mg/kg bw/day) for 5 days
Withdrawal timeApramycin (mg/kg)
Muscle Liver Kidney Fat7 days 0.35
0.29ND0.60
1.471.711.811.48
4.406.526.477.16
0.330.460.140.14
14 days 0.39 1.51 1.57 0.390.52 1.74 1.89 0.84ND 1.58 2.21 0.160.43 1.42 3.97 0.62
21 days ND 2.20 2.97 0.130.27 2.02 2.35 0.230.29 1.77 1.95 0.140.40 1.20 3.37 0.17
28 days 0.35 1.35 1.86 ND0.46 1.02 1.79 ND0.47 1.48 2.48 ND0.58 1.34 2.42 ND
35 days ND 1.51 2.02 NDND 1.27 2.20 NDND 1.80 3.22 NDND 1.43 1.92 ND
42 days ND 1.31 1.41 NDND 1.50 1.82 NDND 1.42 2.64 NDND 1.68 3.25 ND
Tissue LOQ 0.50 5.00 5.00 0.50Tissue LOD 0.27 0.40 0.23 0.13
NOTES: ND = not detected.
An additional GLP-compliant residue study was carried out in young calves (Parker, 1999b), with 24 male and female Friesian crossbred calves given oral doses of 40 mg/kg bw apramycin daily for five days (maximum recommended dose) and groups of four calves were sacrificed at withdrawal intervals of 7, 14, 21, 28, 35 and 42 days. Animal weights were 38–69 kg (mean = 49.0 kg).

47
Apramycin residues were determined using a validated HPLC method (Parker, 1995d). Apramycin was detected at all withdrawal times in liver and kidney, although residues in liver were all below the LOQ. In kidney, three of the four samples collected at 7 days withdrawal contained apramycin above the LOQ, but no residues above the LOQ were found at 14 days or later withdrawal times. A limited number of muscle and fat samples contained residues above the LOQ at 7 or 14 days or both. Residues were undetectable in fat from 28 days and in muscle from 35 days. Results reported below the validated LOQ are estimated values. Results are shown in Table 2.8.
Residue studies in calves provide some useful data for residue depletion analysis as doses were at the maximum recommended amounts; however, as in the pig studies described below, the time frames are generally too long to provide useful information for residue depletion analysis.
PigsIn a very old study, 27 pigs were treated with apramycin in drinking water at the recommended
dose with 12 serving as controls (and three sacrificed in each sampling timeframe at 4, 7, 14, 28 and 42 days). Pigs were given unlabelled apramycin at 1 g activity per US gallon (approximately 264 mgactivity/L) as the sole source of drinking water for 7 days (VPR-164-766, 1972). Body weights of the pigs were not provided, thus dose per kg bw was not reported. Residues in tissues were analysed with a semi-quantitative microbiological assay. No apramycin residues were detected in muscle, skin or fat at any withdrawal interval. The study report shows that the zones of inhibition on the bio-autography plates for these tissues were similar to controls, but the sensitivity of the assay was not defined. There was approximately 0.1 mg/kg in liver at zero withdrawal and <0.1 mg/kg at subsequent time points.Kidney contained ca. 1.3–1.7 mg/kg at zero withdrawal, declining to <0.1 mg/kg by 28 days. Results are tabulated in Table 2.9.
In a similar study, Van Duyn and Johnson (undated) administered apramycin in drinking water at 1 g activity per US gallon (264 mg/l) to 50 piglets for 7 days, with 18 pigs serving as controls and two groups of 16 provided apramycin in the drinking water. The mean initial weight of the piglets was approximately 13 kg. Based on the weight of the piglets and average water consumption, the average daily dose was calculated to be 11.4 mg/lb bw/day, or approximately 25 mg/kg bw/day (200% of maximum recommended dose of 12.5 mg/kg bw/day). Following the seven days of treatment, the medicated pigs were combined into one group of 32 pigs. At days 14, 28, 35 and 42 post-treatment, three randomly selected medicated pigs and two control pigs were sacrificed and tissues collected for residue analysis. No residue above approximately 0.1 mg/kg was found in liver or muscle at any withdrawal interval. One skin+fat sample contained a residue estimated at 0.1–0.2 mg/kg at zero withdrawal (immediately off-treatment), but the other two zero-day samples, and all subsequent withdrawal samples, contained no measurable residue. Kidney contained approximately 1.3 to 5 mg/kg at zero withdrawal, 0.1 to 1 mg/kg at 14 days and <0.1 mg/kg at subsequent withdrawal intervals. Results are in Table 2.10.
Table 2.9. Residues in pig tissues following treatment with apramycin in drinking water (264 mg/l) for 7 days
Withdrawal timeApramycin (mg/kg)
Muscle Liver Kidney Skin/Fat
0 days ND 0.10 1.29 NDND 0.08 1.43 NDND 0.12 1.74 ND
4 days ND 0.03 1.01 NDND 0.02 0.53 NDND 0.02 0.59 ND
7 days ND NDa 0.44 NDND 0.03 0.31 ND

48
Table 2.10. Residues in pig tissues following treatment with apramycin in drinking water (264 mg/L) for 7 days
Withdrawal timeApramycin (mg/kg)
Muscle Liver Kidney Fat0 days ND NDa 2.5–5.0 0.1–0.2
ND ND 2.5–5.0 NDND ND 1.25–2.5 ND
14 days ND ND 0.5–1.0 NDND ND 0.5–1.0 NDND ND 0.1–0.2 ND
28 days ND ND ND NDND ND ND NDND ND ND ND
35 days NA ND ND NANA ND ND NANA ND ND NA
42 days NA NA ND NANA NA ND NANA NA ND NA
NOTES: ND = residue not detected (limit of detection 0.1 mg/kg); NA = not analysed.
An additional study that used a microbiological assay was conducted in Japan (Kido et al., 1983).Thirty-six castrated male crossbred pigs were medicated with two levels of apramycin in drinking water for 7 days. Actual doses, based on average water consumption and body weights, were approximately 10 and 29 mg/kg bw/day (80% and 230% of the maximum recommended dose). For each treatment level, 3 pigs were slaughtered at 0 (2 h), 7, 14, 21, 28 and 35 days after withdrawal from medication. The sensitivity of the assay was 0.06 mg/kg for all tissues. No residues above the assay sensitivity were detected in muscle or fat from any pig regardless of medication level or withdrawal time. Only one of the liver samples at the 29 mg/kg bw/day treatment level (2 hwithdrawal time) contained a residue above the assay sensitivity. Mean kidney residues at 2 hwithdrawal time were 0.62 and 1.57 mg/kg for the 10 and 29 mg/kg bw/day dose levels, respectively, while mean levels at 7 days withdrawal were 0.10 and 0.25 mg/kg for the same respective doses. All kidney samples from later withdrawal intervals were below the sensitivity of the assay. Results are provided in Table 2.11.
ND 0.06 0.44 ND14 days ND 0.01 0.17 ND
ND 0.04 0.28 NDND ND 0.16 ND
28 days ND ND ND NDND ND Negligible NDND ND 0.05 ND
42 days ND ND ND NDND ND 0.03 ND
NOTES: ND = residue not detected (limit of detection not defined)

49
Table 2.11. Residues in pig tissues following treatment with apramycin in drinking water (10 or 29 mg/kg bw/day) for 7 days
Withdrawal time Apramycin (mg/kg)
Muscle Liver Kidney FatDosed at 10 mg/kg bw/day
0 (2 h) ND NDa 0.52 NDND ND 1.06 NDND ND 0.27 ND
7 days ND ND 0.09 NDND ND 0.12 NDND ND 0.08 ND
14 days ND ND ND NDND ND ND NDND ND ND ND
Dosed at 29 mg/kg bw/day0 (2 h) ND ND 1.22 ND
ND 0.28 1.52 NDND ND 1.96 ND
7 days ND ND 0.20 NDND ND 0.20 NDND ND 0.36 ND
14 days ND ND ND NDND ND ND NDND ND ND ND
A GLP-compliant study was conducted in 1995 using 24 (12 barrow and 12 gilts) Duroc ×Landrace piglets medicated with a single daily dose of apramycin in water at 20 mg/kg bw (160% maximum recommended dose, see sponsor comments above on piglets up to 26 kg) by stomach tube for 7 days (Parker, 1995b). Body weights at the beginning of the study were 15–20 kg. Samples of muscle, liver, kidney and skin with fat were collected from four animals at each of the withdrawal periods (1, 4, 7, 14, 21 and 28 days) and residues were determined using a validated HPLC method (Parker, 1995c and addendum). No residues were detected at any withdrawal interval for muscle, liver or fat samples. The validated LOQ for apramycin in kidney was 5 mg/kg, but the authors of the report provided estimates of concentrations that were between the LOD and LOQ. Residues in kidney declined to below the limit of quantitation by 7 days withdrawal. Results are summarized in Table 2.12.
Table 2.12. Residues in pig tissues following administration of apramycin in water (20 mg/kg bw) for 7 days
Withdrawal time Apramycin (mg/kg)Muscle Liver Kidney Skin+fat
1 day ND ND 5.80 NDND ND 6.90 NDND ND 15.30 NDND ND 6.30 ND
4 days ND ND 4.50 ND

50
ND ND 3.60 NDND ND 5.80 NDND ND 6.40 ND
7 days ND ND 2.60 NDND ND 2.90 NDND ND 3.10 NDND ND 2.50 ND
14 days ND ND ND NDND ND ND NDND ND 0.70 (1) NDND ND ND ND
21 and 28 days ND ND ND NDND ND ND NDND ND ND NDND ND ND ND
Tissue LOQ 0.50 5.00 5.00 0.50Tissue LOD 0.28 0.25 0.20 0.05
Notes: ND = not detected. (1) Estimated value.
The results of these studies show that oral treatment of pigs with apramycin results in very low concentrations of residues in edible tissues. The older studies that used microbiological assays are in general agreement with newer studies that used HPLC methods of analysis. Zero-day withdrawal kidney residues were lower after natural intake of drinking water containing apramycin, compared with single daily bolus doses given by gavage.
In an early study, 27 pigs were fed a ration medicated with 100 g apramycin activity per U.S. ton (110 mg/kg) for 56 days (Experiment SW-396, 1971) (55% of maximum recommended treatment in feed). Two males and one female were terminated at 0, 4, 7, 14, 28, 37 and 42 days after withdrawal of the medicated ration; six pigs served as controls. Body weights of the pigs were not reported. Analysis of tissues using a semi-quantitative microbiological assay found no detectable residue of apramycin in muscle, fat or skin at any withdrawal time. Residues in kidney were estimated to be approximately 2–3.4 mg/kg at zero withdrawal, depleting to negligible or undetectable levels by 28 days. Residues in liver were always less than 0.1 mg/kg; they were detected in all samples through 7 days withdrawal, in none of the pigs at 14 days, in one pig at 28 days and in no animals at 37 or 42 days. Results are provided in Table 2.13.
Table 2.13. Residues in pig tissues following treatment with apramycin in feed (110 mg activity/kg) for 56 days
Withdrawal timeApramycin (mg/kg)
Muscle Liver Kidney Fat0 day ND 0.07 3.40 ND
ND 0.09 3.40 NDND 0.08 2.00 ND
4 days ND 0.04 0.50 NDND 0.04 0.85 NDND 0.05 0.38 ND
7 days ND 0.03 0.19 NDND 0.03 0.30 NDND 0.04 0.27 ND

51
14 days ND ND 0.09 NDND ND 0.03 NDND ND 0.25 ND
28 days ND ND ND NDND Negligible ND NDND ND ND ND
37 days ND ND ND NDND ND Negligible NDND ND ND ND
42 days ND ND ND NDND ND ND NDND ND ND ND
Notes: (1) Limit of detection in liver not defined.
In another study (Handy and Van Duyn, 1979), pigs of mixed breed and sex, ranging in weight from 8 to 22 kg, were fed a ration medicated with 110 mg/kg apramycin activity for 28 days (55% of maximum recommended treatment in feed). Six randomly selected pigs were slaughtered at 0 (approximately 1 h) 7, and 14 days after withdrawal of the medicated ration and three randomly selected pigs were terminated at 21, 28 and 35 days after withdrawal. For the 0, 14 and 28 day intervals, tissue samples from two pigs were composited before analysis. Apramycin residues were determined using a semi-quantitative assay involving thin layer chromatography and bio-autographic detection with Bacillus subtilis. No residues were found above the test sensitivity of 0.1 mg/kg in fat+skin or muscle tissues at any withdrawal time. Kidneys contained 0.5 to 1.0 mg apramycin/kg at zero withdrawal, depleting to 0.2 mg/kg at 7 and 14 days; no residue was detected in kidney after 21, 28 or 35 days withdrawal. Liver contained <0.1 mg/kg at zero withdrawal; except for a trace of residue in one of the 3 samples analysed after 7 day withdrawal, no other liver sample contained a detectable apramycin residue. The report states that, based on the average feed consumption during 28 days andthe final weight of the pigs, the average dose of apramycin was 2.83 mg/kg bw/day (23% of the maximum recommended dose/kg bw/day). However, if the calculation is based on the average weight of the pigs during medication, the mean dose is approximately 4.65 mg/kg bw/day. Results are presented in Table 2.14.
Table 2.14. Residues in pig tissues following treatment with apramycin in feed (110 mg activity/kg feed) for 28 days
Withdrawal timeApramycin (mg/kg) LOD = 0.1 mg/kg
Muscle Liver Kidney Fat0 (1 hour) ND <0.1 0.5–1.0 ND
ND <0.1 0.5–1.0 NDND <0.1 0.5–1.0 ND
7 days ND ND 0.1 NDND <0.05 0.1–0.2 NDND ND 0.1–0.2 ND
14 days ND ND 0.1–0.2 NDND ND 0.1 -0.2 NDND ND 0.1 -0.2 ND
21, 28 and 35 days NA ND ND NANA ND ND NANA ND ND NA

52
NOTES: ND = not detected; NA = not analysed.
The study of Kido et al. (1983), discussed earlier, also included treatment groups given apramycin in feed. Thirty-six castrated male crossbred pigs were fed a ration medicated with 200 or 600 mg/kg apramycin ad libitum (100% or 300% of the maximum recommended treatment in feed). Actual doses, based on average feed consumption and average body weights, were 12 and 36 mg/kg bw/day (150 and 450% of the maximum recommended dose). Three pigs were slaughtered at 0 (2 h), 7, 14, 21, 28 and 35 days after withdrawal from treatment. The sensitivity of the assay was 0.06 mg/kg for all tissues. No residue was detected in muscle or fat from any pig regardless of dose level or withdrawal time. In kidney, residues at 2 h withdrawal were 0.38–0.54 mg/kg for the 12 mg/kg bw/day dose and from 0.97–1.63 mg/kg for the 36 mg/kg bw/day dose. No residues were detected in kidney at 7 days or later withdrawal intervals. No residues were detected in liver from pigs that received the 12 mg/kg bw/day dose at any withdrawal time. Liver samples from two of the pigs that received 36 mg/kg bw/day and terminated at 2 h withdrawal contained 0.18 or 0.07 mg/kg apramycin. Liver from the third pig terminated at 2 h and from all pigs at later withdrawal intervals contained no residue above the sensitivity of the assay. Results are provided in Table 2.15.
A GLP marker residue study was conducted in pigs using apramycin premix at the highest recommended dose (Parker, 1999a). Sixteen Large White Cross pigs, 12 weeks old (plus one control pig) with body weights 19–31 kg (mean = 21.9 kg) at the initiation of the study were dosed at a nominal rate of 200 mg apramycin/kg of feed for 28 days (body weights of 28–52 kg [mean = 34.7 kg] at the end of the study). Estimated daily doses based on feed consumption ranged from 13.1 to 16.7 mg/kg bw (105–134% of the maximum recommended dose/kg bw/day). Samples of muscle, liver, kidney and skin with fat were collected from four animals at withdrawal periods of 3, 6, 9 and 12 days. Residues were determined using the validated HPLC method that reported the LOQ in liver tissue at 0.5 mg/kg, lower than in other studies. In this study, in contrast to other pig studies, the highest residues were found in liver tissue. The results are summarized in Table 2.16.

53
Table 2.15. Residues in pig tissues following treatment with apramycin in feed (12 or 36 mg/kg bw/day) for 7 days
Withdrawal timeApramycin (mg/kg)Muscle Liver Kidney Fat
12 mg/kg bw/day dosage0 (2 h) ND ND 0.43 ND
ND ND 0.54 NDND ND 0.38 ND
7 and 14 days ND ND ND NDND ND ND NDND ND ND ND
36 mg/kg bw/day dosage0 (2 h) ND 0.18 0.97 ND
ND ND 1.11 NDND 0.07 0.63 ND
7 and 14 days ND ND ND NDND ND ND NDND ND ND ND
NOTES: ND = not detected.
Table 2.16. Residues of apramycin in pig tissues following administration of apramycin in feed (200 mg/kg feed) for 28 days
Withdrawal timeApramycin (mg/kg)
Muscle Liver Kidney Skin/Fat3 days ND 1.2 8 0.39 ND
ND 1.31 0.83 NDND 1.25 ND NDND 1.40 ND ND
6 days ND 1.55 ND NDND 1.41 ND 0.16ND 1.62 ND 0.17ND 1.43 1.31 0.14
9 days ND 1.37 0.41 NDND 1.20 1.39 0.16ND 1.22 0.79 0.14ND 1.09 ND 0.13
12 days ND 1.14 ND 0.19ND 0.99 ND 0.18ND 1.02 ND 0.33ND 1.22 0.53 0.19
Tissue LOQ 0.50 0.50 2.50 0.50Tissue LOD 0.31 0.25 0.21 0.06
NOTES: ND = not detected

54
The apramycin residue studies of pigs following treatment in feed are in general agreement with the pattern of distribution observed in studies with apramycin through drinking water or by gavage dosing, with residues monitored through 14C-labelling, HPLC or microbiological assay. Residues are usually highest in kidney, followed by liver (see, however, Table 2.16) with residues depleting rapidly after withdrawal of treatment. Residues are generally not detectable or very low in muscle and skin+fat. Each of the studies, however, is deficient in the multiple day selection of withdrawal times, compromising assessment of residue depletion studies.
ChickensThirty-six Hubbard crossbred broiler chickens (12 males and 12 females in trial; 12 birds as controls),approximately 30 days old, were administered apramycin in drinking water (559 mg/L, 110% maximum recommended treatment, in drinking water) for five days (Handy and Thomson, 1985).Three males and three females were terminated at 0 (5 h), 7, 10, 14, 21 and 28 days after withdrawal of medication, and residues in edible tissues were determined using a microbiological assay. Based on use of medicated water and the total pen bird weights on the day before treatment was initiated, the average dose was estimated to be 102 mg/kg bw/day (127% of maximum recommended dose). Weights of the individual groups of chickens were 1.36 kg at day 0; 1.75 kg at day 7; 2.02 kg at day 10; 2.12 kg at day 14; 2.71 kg at day 21; and 2.93 kg at day 28. Five hours after withdrawal, residues of apramycin in kidney were 2.7–6.9 mg/kg; these declined to 1 mg/kg after 7 days, and to
0.48 mg/kg after 28 days. Residues in liver were 0.26–0.54 mg/kg after 5 h withdrawal, 0.21 mg/kg after 7 days and <0.05 mg/kg by 21 and 28 days. Residues in skin were 0.06–0.2 kg/kg after 5 h and no residues were detected at later withdrawal intervals. In this study the authors used a method labelled as AM-AA-CA-R100-AA-775. The reported LOQ was 0.05 mg/kg in all tissues with the exception of 7 and 10 day withdrawal skin samples with a LOQ of 0.1 kg/kg. These LOQs are notably lower than other apramycin methods and studies. One fat sample at 5 h withdrawal contained 0.15 mg/kg; the remaining samples, and all samples from subsequent samplings, contained no detectable residue. Residues in muscle were <LOQ at all withdrawal intervals. An earlier study using a less developed microbiological assay gave similar results (Handy, 1985). Results are presented in Table 2.17.
Because of limited sample sizes, tissues from chickens were sometimes pooled before analysis. Skin and fat were analysed separately and the value shown in the table is the higher of the two values. Below LOQ means <0.05 mg/kg, except 7-day skin tissue samples where the LOQ = 0.01 mg/kg. No residue detected (ND) means no response below the LOQ (0.01 mg/kg).
In a GLP-compliant study, apramycin was administered in drinking water at 500 mg/L to 48 four-week-old Ross broiler chickens for 5 days (Parker, 1998a). Body weights were tabulated for each of the four sampling points (day 3 birds, 0.98 kg; day 6 birds, 0.95 kg; day 9 birds, 1.03 kg; and day 12 birds, 0.92 kg). Delivery of medicated water was also calculated: day 1, 118.7 mg/kg bw; day 2, 94.4 kg/kg bw; day 3, 112.0 mg/kg bw; day 4, 132.1 mg/kg bw; day 5, 134.3 mg/kg bw). The average dose was estimated to be 118 mg/kg bw/day (about 150% of the maximum recommended dose). Tissues from ten birds were analysed for apramycin using a validated HPLC method (Parker, 1998b).The reported LOQ was 5 mg/kg for all tissues (see Table 2.4). Allowing for the differences in withdrawal times and the precision of the assays, the results of the chicken radiometric residue studies and the microbiological method studies are in general agreement with the Parker (1998a) study using the HPLC assay. Results are reported in Table 2.18.
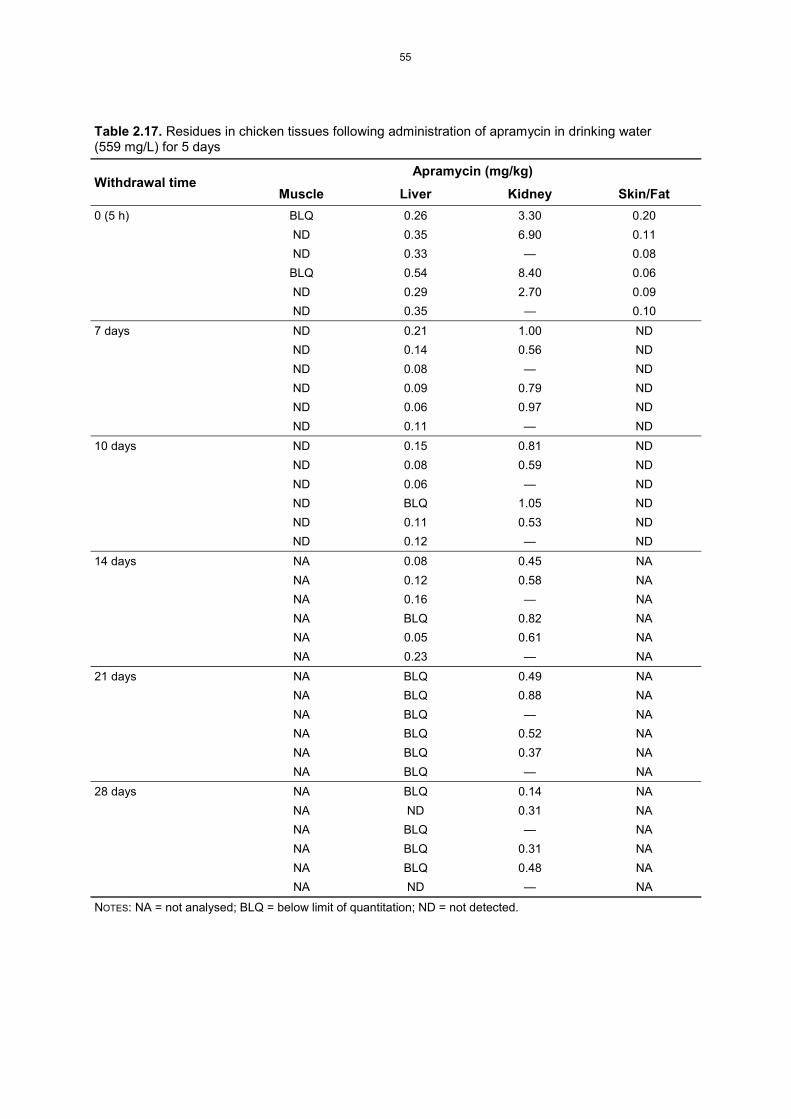
55
Table 2.17. Residues in chicken tissues following administration of apramycin in drinking water (559 mg/L) for 5 days
Withdrawal timeApramycin (mg/kg)
Muscle Liver Kidney Skin/Fat0 (5 h) BLQ 0.26 3.30 0.20
ND 0.35 6.90 0.11ND 0.33 — 0.08
BLQ 0.54 8.40 0.06ND 0.29 2.70 0.09ND 0.35 — 0.10
7 days ND 0.21 1.00 NDND 0.14 0.56 NDND 0.08 — NDND 0.09 0.79 NDND 0.06 0.97 NDND 0.11 — ND
10 days ND 0.15 0.81 NDND 0.08 0.59 NDND 0.06 — NDND BLQ 1.05 NDND 0.11 0.53 NDND 0.12 — ND
14 days NA 0.08 0.45 NANA 0.12 0.58 NANA 0.16 — NANA BLQ 0.82 NANA 0.05 0.61 NANA 0.23 — NA
21 days NA BLQ 0.49 NANA BLQ 0.88 NANA BLQ — NANA BLQ 0.52 NANA BLQ 0.37 NANA BLQ — NA
28 days NA BLQ 0.14 NANA ND 0.31 NANA BLQ — NANA BLQ 0.31 NANA BLQ 0.48 NANA ND — NA
NOTES: NA = not analysed; BLQ = below limit of quantitation; ND = not detected.

56
Table 2.18. Residue in chicken tissues following administration of apramycin in drinking water (500 mg/L) for 5 days
Withdrawal timeApramycin (mg/kg)
Muscle Liver Kidney Skin+fat3 days ND ND BLQ BLQ
ND ND BLQ 0.62ND ND 0.85 BLQND ND 0.58 BLQND ND 1.48 BLQND ND 0.62 BLQND ND 0.90 BLQND BLQ 1.10 0.55ND ND BLQ BLQND ND 0.66 ND
6 days ND ND 1.03 NDND ND BLQ NDND ND 1.40 NDND ND 0.77 BLQND ND 0.62 NDND ND 0.54 BLQND ND BLQ BLQND ND BLQ BLQND ND BLQ NDND ND BLQ BLQ
9 days ND ND BLQ NDND ND 0.56 NDND ND BLQ NDND ND BLQ NDND ND BLQ NDND ND 0.60 NDND ND BLQ NDND ND BLQ NDND ND ND NDND ND BLQ ND
12 days ND ND BLQ NDND ND ND NDND ND ND NDND ND BLQ NDND ND BLQ NDND ND ND NDND ND ND BLQND ND BLQ NDND ND 0.58 NDND ND BLQ ND
Notes: ND = not detected; BLQ = below limit of quantitation.

57
RabbitsIn a GLP-compliant study, apramycin was administered in the drinking water at 100 mg/L (maximum recommended dose) for 7 days to 30 New Zealand White rabbits. Weight ranges at the beginning of the study for males was 2.2–2.5 kg and for females, 2.2–2.6 kg. The estimated mean concentration of medicated water was determined to be 108.6 mg/L/day for the 7-day study. Liver, kidney, muscle and fat were analysed for apramycin using a validated HPLC method with a LOQ of 0.50 mg/kg (Villa and Brightwell, 1998). One liver sample at day zero withdrawal had a value of 0.6 mg/kg; all other samples at day zero were <LOD. All day 3 and subsequent withdrawal time samples were <LOD.Results are in Table 2.19
Table 2.19. Residues in rabbit tissues following administration of apramycin in drinking water (100 mg/L) for 7 days
Withdrawal timeApramycin (mg/kg)
Muscle Liver Kidney Fat0 ND 0.600 BLQ ND
ND ND BLQ NDND ND BLQ NDND ND BLQ NDND ND ND ND
3, 7, 14 and 21 days ND ND ND NDND ND ND NDND ND ND NDND ND ND NDND ND ND ND
Tissue LOQ 0.50 0.50 2.50 0.50Tissue LOD 0.50 0.10 0.60 0.20
NOTES: ND = not detected; BLQ = below limit of quantitation.
In a second GLP compliant study, 36 New Zealand White rabbits were medicated with apramycin at nominal rates of 100 mg/kg bw or 300 mg/kg bw in the feed (100% or 300% of the maximumrecommended treatment dose) for 21 days (Heal, 2008). Calculated medicated doses were 85.6 mg/kg and 258 mg/kg in feed. Body weights of the rabbits at the beginning for the study were 0.9–1.5 kg(mean 1.36 kg). The achieved apramycin dose was 6.6 ± 1.0 mg/kg bw/day for the low-dose group and 20.1 ± 2.3 mg/kg bw/day for the high-dose group. At the end of the 21-day study, mean body weight of the low-dose group was 2.07 kg and the high-dose group was 2.16 kg. Feed intakes were calculated for each group at day 21 of treatment: for the low-dose group the estimated daily feed intake was 138.1 g/day and the high-dose group was 139.7 g/day. The overall mean medicated daily intake of apramycin in the low-dose group was 11.82 mg/kg bw/day and for the high-dose group the mean was 37.0 mg/kg bw/day. Muscle, liver, kidney and fat were sampled from six animals at each of the withdrawal periods (0, 24 and 48 h). In both treatment groups, all samples were below the LOD for muscle (49.5 μg/kg), liver (51.7 μg/kg) and fat (34.3 μg/kg). In the high-dose group, all but three kidney samples contained residues between the LOD (21.7 μg/kg) and the LOQ (2.28 mg/kg), while the remaining three kidney samples residues were non-detectable. All kidney samples in the low-dose group had non-detectable residues. Residues were determined using a validated HPLC fluorescence method (Heal, 2007). Because of the limited number of positive residue findings, only those from the high treatment group are reported in Table 2.20.
These studies indicate that apramycin is very poorly absorbed by rabbits, either by medication in drinking water or in medicated feed.

58
Table 2.20. Residues in rabbit tissues following administration of apramycin in feed (300 mg/kg feed) for 7 days
Withdrawal time Apramycin (mg/kg)
Muscle Liver Kidney Fat0 hours ND ND BLQ ND
ND ND BLQ NDND ND BLQ NDND ND BLQ NDND ND BLQ NDND ND BLQ ND
24 hours ND ND ND NDND ND BLQ NDND ND BLQ NDND ND BLQ NDND ND BLQ NDND ND BLQ ND
48 hours ND ND BLQ NDND ND ND NDND ND BLQ NDND ND BLQ NDND ND BLQ NDND ND ND ND
Tissue LOQ 0.50 0.50 2.50 0.50Tissue LOD 0.05 0.06 0.02 0.04
NOTES: ND = not detected; BLQ = below limit of quantitation.
METHODS OF ANALYSIS FOR RESIDUES IN TISSUES
During the last decade, several laboratories have worked on the development of analytical methods for the analysis of aminoglycosides (e.g. Cheng et al., 2010; Ishii et al., 2008; Bogialli et al., 2005; van Holthoona et al., 2009; Stead, 2000). These methods cover a wide range of matrices (mainly for which MRLs have been established). Generally, most protocols use an extraction solvent containing trichloroacetic acid and sample clean-up is performed with solid phase extraction (SPE) on weak cation exchange cartridges such as CBA or CBX. Chromatographic separation is commonly performed using reversed-phase ion-pair principles. Although some groups describe the use of ultraviolet (UV) detection and fluorescence detection (FD), the lack of a suitable chromophore requires a derivatization step to detect aminoglycosides. Chemiluminescence has been described as a rapid and robust detection technique for aminoglycosides without the need for derivatization. Mass spectrometric detection has the same benefits as chemiluminescence but with higher selectivity and sensitivity especially in the selective reaction mode (SRM) of a triple quadrupole LC–MS system. Most methods use tobramycin as an internal standard, because deuterated or chemical analogues of the aminoglycosides are not available. Some research groups have synthesized internal standards (such as dimethylspectinomycin, methyldihydrostreptomycin and octamethylkanamycin A) that provide incomparable performance for quantification.
Methods used in absorption and bio-availability studiesRegarding methods submitted by the sponsor, blood levels (in relevant species) were investigated by a microbiological assay. This assay used Mueller-Hinton (Difco) media adjusted to pH 8.0 and Bacillus

59
subtilis ATCC 6633 as test organism, against apramycin residues in tissue. The paper disc procedure was used. Plates were kept overnight at ambient temperature and were then incubated at 37°C until distinct growth of the assay organism was apparent. Semi-logarithmic plots of known apramycin concentrations versus diameters of inhibition zones were linear with typical correlation coefficients (r) >0.93. The intra-day and inter-day variability were <7.5% and <2.5% through the concentration ranges studied. Few additional technical details are given in the experimental section of the studies. The semi-quantitative microbiological assay is adapted to produce qualitative data, i.e. ‘presence or absence’.No quantitative measurement is available by this approach [see Van Duyn and Johnson (undated) “…the assay for aprymicin … does not provide for the establishment of a finite residue level for each sample… The assay is more applicable to verifying the absence of apramcyin than the exact measurement of residue level…”]. The threshold of detection was established at 0.1 mg/kg (standard recovery samples fortified at 1.0 mg/kg could always be distinguished from negative control tissue samples), but details (e.g. number of replicates and concentrations studied) are lacking. The semi-quantitation is done by measuring the spot intensity onto the plate. The nature of the bio-autographic tissue residue procedure is more appropriately suited to the detection of antimicrobial residues rather than the estimation of amount present. The semi-quantitative residue activity estimations are frequently reported as activity ranges. It is difficult to know if the apramycin residues were found to be highly variable between animals (the dose response was difficult to assess) due to individual animal variability or to the analytical method itself. The specificity of the detection is not described; false negative and false positive rates are unknown.
Methods used in residue depletion studiesThe data used in the residue depletion (distribution) studies were provided mainly by a LC-fluorescence detection method. Tissue is treated with ammonium hydroxide/methanol solution to release apramycin. The methanolic solution is evaporated to dryness, re-suspended in aqueous buffer, and ion-pair extracted into ethyl acetate/di-(2-ethylhexyl)phosphate (DEHP). Apramycin is back extracted into 0.75M aqueous hydrochloric acid and subsequently neutralized with sodium hydroxide. The neutralized aqueous solution is then washed with toluene and aliquots transferred to vials for analysis. Apramycin is determined by HPLC with fluorescence detection after pre-column derivatization with o-phthaldehyde. The reaction acts on the apramycin primary amines to produce a fluorescent imine derivative (see Figure 2.1).
Figure 2.1. The reaction with the apramycin primary amine to produce a fluorescent imine derivative
All compounds bearing an amino group will be modified by the derivatization step, and will produce a detectable signal by the fluorescence detector. Any residual molecule from the clean-up procedure containing a similar primary amine will also undergo the derivatization step. No internal standard is used in the method.
The specificity is passable to medium, as attested by the chromatograms shown in Figure 2.2(copied from the sponsor submission) for different blank and fortified kidney extracts (0.5 mg/kg and 1.0 mg/kg of apramycin).

60
Figure 2.2. Chromatograms corresponding to pig kidney extracts (blank, 0.5 mg/kg and 1.0 mg/kg fortified samples, standard)
Limits of detection have been calculated as described in European Community Decision 93/256 (replaced in 2002 by the 2002/657/EC decision), i.e. on the calculation of the noise observed in blank tissues plus 3 standard deviations of the noise. Twenty chromatograms of negative control tissue were used to determine the LODs. They are generally good (see Table 2.4), especially for fat or skin+fat samples. LODs in liver and muscle are less satisfactory; sometimes the offset (20 mU in the region of elution of apramycin) is high for liver extracts (a complex matrix and the cleanliness of the extract being worse).
The LOQ for the sponsor-based methods used the lowest concentration for which the method has been validated to a stated level of confidence (first point of calibration). For this reason, LOQs are sometimes very high and are probably far from the true analytical LOQs. Reasonably, and without additional information provided by the studies, the Committee considered it possible to deduce (or estimate) LOQs from LODs by applying a basis of blank tissue mean residue finding plus ten standard deviations, resulting in a factor of approximately LOQ/LOD = 3. The Committee also critically reviewed the quality of the analytical tracings of the residue validation studies in its evaluation of method performance. Accordingly, the Committee re-calculated the LODs and LOQs in the different tissues for the different species for the studies provided by the sponsor. The analytical signal information was taken on representative chromatograms available in the submission. The method of calculation was performed according to the principle shown in Figures 2.3 and 2.4.
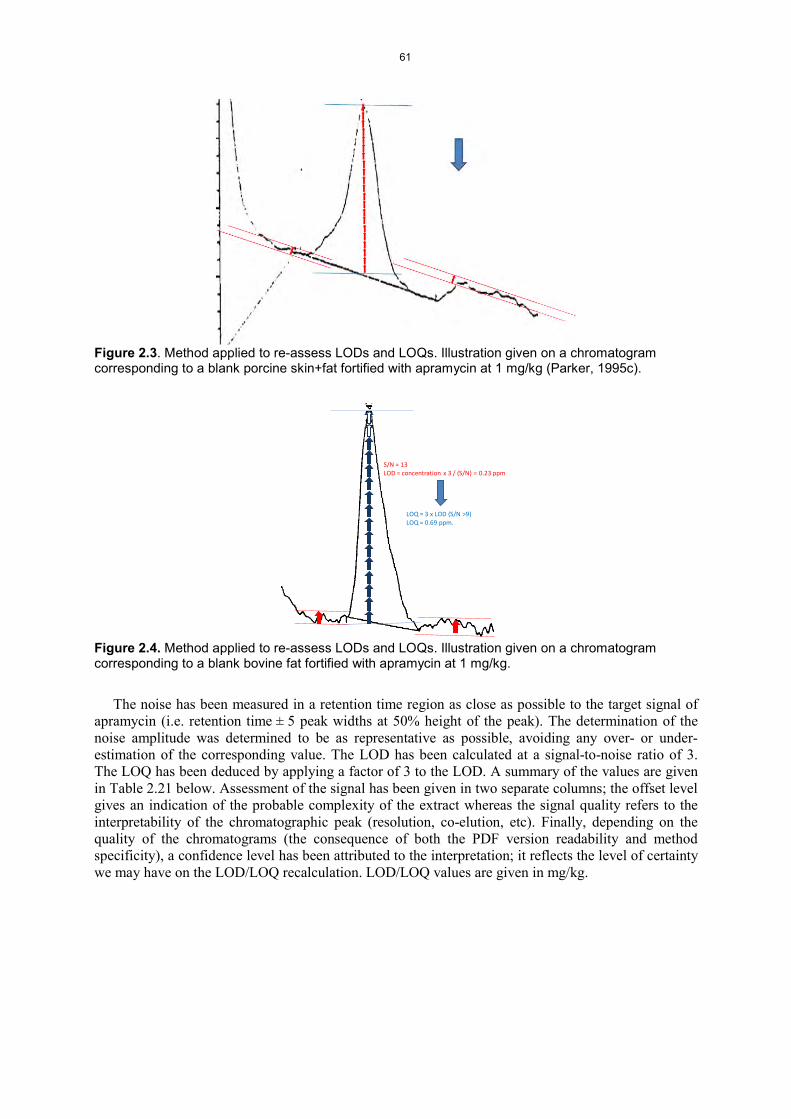
61
Figure 2.3. Method applied to re-assess LODs and LOQs. Illustration given on a chromatogram corresponding to a blank porcine skin+fat fortified with apramycin at 1 mg/kg (Parker, 1995c).
Figure 2.4. Method applied to re-assess LODs and LOQs. Illustration given on a chromatogram corresponding to a blank bovine fat fortified with apramycin at 1 mg/kg.
The noise has been measured in a retention time region as close as possible to the target signal of apramycin (i.e. retention time ± 5 peak widths at 50% height of the peak). The determination of the noise amplitude was determined to be as representative as possible, avoiding any over- or under-estimation of the corresponding value. The LOD has been calculated at a signal-to-noise ratio of 3. The LOQ has been deduced by applying a factor of 3 to the LOD. A summary of the values are given in Table 2.21 below. Assessment of the signal has been given in two separate columns; the offset level gives an indication of the probable complexity of the extract whereas the signal quality refers to the interpretability of the chromatographic peak (resolution, co-elution, etc). Finally, depending on the quality of the chromatograms (the consequence of both the PDF version readability and method specificity), a confidence level has been attributed to the interpretation; it reflects the level of certainty we may have on the LOD/LOQ recalculation. LOD/LOQ values are given in mg/kg.
S/N = 13LOD = concentration x 3 / (S/N) = 0.23 ppm
LOQ = 3 x LOD (S/N >9)LOQ = 0.69 ppm.

62
Table 2.21. Summary of the committee-calculated values of LODs and LOQs in representative blank tissues fortified in different species' chromatograms from the sponsor submission.
Reproducibility studies were not routinely carried out in the validation exercise. Repeatability (recovery) has been assessed through intra- and inter-batch variations. The recovery has been calculated at different concentration levels and in different batches of samples [64% in liver (Repeatability standard deviation (rsd) = 10%), 70% in kidney (rsd = 7%), 68% in muscle (rsd = 11%), 77% in fat (rsd = 9%) and 74% in skin+fat (rsd = 10%)]. The repeatability is generally acceptable.
Most recent methods are based on extraction by a solvent containing trichloroacetic acid; this method unexpectedly used ammonium hydroxide and methanol to release target residues from tissue. Instead of using an SPE ion exchange strategy, the method used a complex liquid-liquid extraction with an ion-pair agent. In conclusion, the analytical methods combine a non-specific purification followed by a weak specific detection (i.e. all co-extracted ‘amino interfering compounds’), derivatized generating a fluorescent signal resulting in a more complex chromatogram, and generating results that are more difficult to interpret. The only identification criterion is the chromatographicretention time. Internal standards are not used for identification and quantification of apramycin.
The quality of the data generated by the LC-fluorescence detector method is of medium quality, but may be used for the risk assessment exercise. The Committee is more reserved regarding use of the data generated from the microbiological assay.
A limited set of quality criteria (Table 2.22) were applied to each sample batch (retention time,repeatability of the standard signal, linearity of the calibration curve, recovery).
SPECIES TISSUESLOQ SPONSOR
LOQ REVISITED
LOD SPONSOR
LOD REVISITED
OFFSET LEVEL SIGNAL QUALITYCONFIDENCE IN ASSESSMENT STUDY REFERENCES
Cattle Liver 5000 5000 396 1700 LOW GOOD GOOD Parker 1995d
Cattle Kidney 5000 2600 229 900 LOW GOOD GOOD Parker 1995d
Cattle Muscle 500 750 268 250 VERY HIGH WEAK GOOD Parker 1995d
Cattle Fat 500 370 129 230 VERY HIGH GOOD GOOD Parker 1995d
Pig Liver 5000/500 2500/900 253/250 830/300 MEDIUM/LOW GOOD/GOOD GOOD/GOOD Parker 1995c/Parker 1995c Addendum
Pig Kidney 2500 1900 212 625 MEDIUM MEDIUM MEDIUM Parker 1995c
Pig Muscle 500 1800 314 600 HIGH BAD-COELUTION LOW Parker 1995c
Pig Skin/fat 500 450 60 150 HIGH MEDIUM MEDIUM Parker 1995c
Pig Fat 500 390 23 130 MEDIUM GOOD GOOD Parker 1995c
Poultry Liver 500 750 133 250 MEDIUM BAD-COELUTION MEDIUM Parker 1998b
Poultry Kidney 500 1300 470 430 MEDIUM BAD-COELUTION MEDIUM Parker 1998b
Poultry Muscle 500 1140 319 380 MEDIUM GOOD MEDIUM Parker 1998b
Poultry Skin/fat 500 480 32 160 LOW GOOD GOOD Parker 1998b
Rabbit Liver 500/500 1500/4500 57/100 500/1500 LOW/MEDIUM MEDIUM/WEAK GOOD/GOOD Heal(2008)/Villa and Brightwell (1998)
Rabbit Kidney 2500/2500 3750/9000 24/600 1250/3000 LOW/LOW MEDIUM/GOOD LOW/GOOD Heal(2008)/Villa and Brightwell (1998)
Rabbit Muscle 500/500 900 /9000 54/500 300 /3000 LOW/LOW MEDIUM/GOOD MEDIUM/WEAK Heal(2008)/Villa and Brightwell (1998)
Rabbit Fat 500/500 120/1800 38/200 40/600 LOW/LOW EXCELLENT/GOOD GOOD/WEAK Heal(2008)/Villa and Brightwell (1998)

63
Table 2.22. Acceptance criteria used to validate batches of samples
Acceptance criterion Action if unacceptable1. Retention time of analyte peak within 20 seconds ofnearest reference standard
Sample negative.
2. Percentage coefficient of variation of standards through run >10
Re-run HPLC. If still unacceptable, run batch again with fresh standards.
3. Regression of matrix curve <0.950 Re-extract batch.4. Percentage recovery within the acceptable range for that particular species+tissue type. (see validation reports)
Re-extract batch.
APPRAISAL
Apramycin is an old drug with a long history of use. It has not been reviewed previously by the Committee. Apramycin is a broad spectrum aminocyclitol antibiotic produced stereospecifically by a strain of Streptomyces tenebrarius. It is extracted from the fermentation medium as apramycin sulphateat a purity of at least 85% and total impurities are not to exceed 15%. Six impurities have been identified and one impurity, 3 O-hydroxyapramycin (C21H41N5O12), has a biological spectrum that is very similar to apramycin, with microbiological activity of one-half to one-quarter compared withapramycin. A microbiological assay was used to determine activity as equivalents of apramycin base.
Apramycin is used in veterinary medicine, effective against both Gram-positive and Gram-negative bacteria, some strains of mycoplasma and most field strains of E. coli and Salmonella spp.. It isbactericidal at minimum inhibitory concentrations. The drug exerts its antibacterial effect by inhibiting protein synthesis at the level of peptidyl translocation. It is mostly used for treating gastrointestinalinfections. Apramycin is available in soluble powder and feed premix formulations.
In calves, apramycin is intended to be administered at a dose of 20 to 40 mg/kg bw/day in drinking water, milk replacer or feed for 5 days. In pigs, it is intended to be administered at a dose of 7.5 to 12.5 mg/kg bw/day in drinking water or as premix incorporated in feed at a dose of 4 to 8 mg/kg bw/day (80–200mg/kg feed) for less than 28 days. In poultry, it is intended to be administered at a dose of 20 to 80 mg/kg bw/day (250 to 500 mg/L) in drinking water for 5–7 days or as premix incorporated in feed at a dose of 2 to 5 mg/kg feed for 5 days. In rabbits, it is intended to be administered at a dose of 10 to 15 mg/kg bw/day (50 to 100 mg/L) in drinking water for 5 to 8 days or as premix incorporated in feed at a dose of 5 to 10 mg/kg bw/day (50–100 mg/kg feed) for less than 21 days. It is not to be used in animals producing eggs or milk for human consumption.
Apramycin is a weak organic base which is highly polar with low solubility in lipids and a poor ability to penetrate membranes. Metabolism data are consistent across species. Levels in blood after oral dosing were much lower than after parenteral treatment, indicating low oral availability in pigs,calves and chickens. In calves, pigs, chicken, rabbits, rats and dogs, apramycin is rapidly and poorly absorbed by the oral route and quickly eliminated. Main levels in serum are found a few hours after treatment (until 6 h) and are undetectable between 24 and 36 h. Pharmacokinetic studies indicate oral availability of approximately 3% in pigs and 2% in chickens. Oral doses are extensively excreted in faeces (more than 82% in pigs and 99.5% in rats) while parenteral doses are mostly excreted in urine in a low percentage of the given dose (11% for cattle, less than 10% for pigs, rats and dogs). Binding of apramycin to serum proteins was 26%.
Chromatographic analysis of the studies with radiolabelled apramycin did not identify any major metabolites in blood, excreta or tissues. Most of the radioactivity in blood, urine, faeces and tissues was unmetabolized apramycin. The distribution of residues in edible tissues was similar for oral and

64
parenteral routes of administration, but levels were much lower with oral treatment. Kidney contained the highest concentration of residue, followed by liver. Muscle and fat (or skin+fat) contained little or no apramycin residue. Kidney was generally the tissue from which apramycin depleted most slowly.In cattle, pigs and chicken, levels of radioactivity are highest in kidney, followed by liver and very minor quantities in muscle and fat. Little biotransformation occurs, the drug remains in tissues mostly as unchanged apramycin. In general, tissues contained insufficient residues for characterization.
Sixteen residue depletion studies (both GLP-compliant and studies prior to GLP regulations) were provided by the sponsor: four in young calves, eight in young pigs, two in chickens and two in rabbits.However, as there were no regulatory approvals noted by the sponsor for rabbits, these are not included in the appraisal (i.e. 14 studies are considered). A summary of residue study findings at or above the reported LOQ is tabulated in Table 2.23, irrespective of the time points (see individual studies for details).
Table 2.23. Summary of residue findings above reported limits of quantitation in four9teen residue depletion studies
Animal Study report Muscle Liver Kidney Fat or Skin+fat
Calves Van Duyn and Handy, 1977
Values reported as ranges
Values reported as ranges
Values reported as ranges
0
Handy and Van Duyn, 1978
Values reported as ranges
Values reported as ranges
Values reported as ranges
Values reported as ranges
Parker, 1995a 1 0 10 1Parker 1995b 3 0 3 2
Pigs VPR-164-766, 1972 0 0 0 0
Van Duyn and Johnson, undated
0 0 0 0
Kido et al., 1983 (drinking water)
0 0 6 at 2.3× recom-mended dose
0
Parker 1995b 0 0 6 at 1.6× recom-mended dose
0
SW-396, 1971 0 0 0 0Handy and Van Duyn, 1979
0 0 0 0
Kido et al., 1983 (feed)
0 0 0 0
Parker, 1999a 0 16 0 0Chicken Handy and
Thompson, 1985(1)0 22 24 6
Parker, 1998a 0 0 0 0
NOTES: (1) Reported LOQs were 0.05 mg/kg for all tissues except 7 and 10 day skin+fat
In these fourteen studies, with the exception of one study, the majority of the positive residue values were in kidney tissues. Liver tissue contains the second highest concentrations of residues in tissue, and in one pig study liver contained the highest amounts of apramycin. Residues in muscle and fat or fat+skin were universally very low. These conclusions are consistent with the radiolabel studies. The studies indicate that apramycin is the suitable marker residue and kidney as the appropriate target tissue.
Of primary concern with the analytical methods is the disparity in how the limit of detection and limit of quantitation were determined. Limits of detection were based on the calculation of the noise observed in blank tissues plus 3 standard deviations of the noise. Twenty chromatograms of negative control tissue were used to determine the LODs. They are generally good expected values, especially for fat or skin+fat samples. LODs in liver and muscle are less good; sometimes the offset (20 mU in

65
the region of elution of apramycin) is high for liver extracts (a complex matrix) and the cleanliness of the extract is poor. The LOQ approach employed by the sponsor studies used the lowest concentration to which the method has been validated to a stated level of confidence, and consequently may not represent true limits of quantitation. This can be readily seen in Table 2.4. The Committee therefore re-calculated method performance LOD and LOQ values and re-assessed the positive residue findings in the studies. In reviewing the residue findings for estimating recommendations on MRLs, the Committee concluded that it was limited to applying the previously described statistical procedures from the 66th and 70th meetings of the Committee. Only two tissue residue data sets were available that provided sufficient positive residue findings greater than the reported LOQ. They were calf kidney and chicken kidney. The results are presented in the Figures 2.5 and 2.6, respectively.
The consequence of the concerns relating to the analytical methods and the limited set of residue determinations for the fourteen studies in calves, pigs and chickens present a complex determination of recommended MRLs for apramycin.
Figure 2.5. Tolerance limit considerations for calf kidney residues of apramycin
0.01
0.1
1
10
100
0 5 10 15
Days after treatment
Con
cent
ratio
n
Kidney linreg_all tollimit

66
Figure 2.6. Tolerance limit considerations for chicken kidney residues of apramycin
0.1
1
10
0 5 10 15 20 25 30
Conc
entr
atio
n
Days after treatmentKidney linreg_day 7-28 toll imit
67
MAXIMUM RESIDUE LIMITS
In recommending MRLs for apramycin, the Committee considered the following factors:A microbiological based acceptable daily intake (ADI) was established at 0–30 μg/kg bw,equivalent to an upper bound of 1800 μg per day for a 60 kg person.Apramycin is produced as a fermentation product and acceptable purity is 85%.Apramycin is poorly absorbed orally in calves, pigs and chickens.LOQs revised by the Committee were used to identify the values in the residue depletion studies which could be used for the assessment.Considering the revised LOQs, in four calf studies, 3 muscle, 24 kidney and 5 fat values were greater than the LOQ; in eight pig studies, 16 liver and 15 kidney samples were greater than the LOQ with almost all at doses of 1.6–2.3 times the recommended dose; in chicken, 24 kidney samples were above the LOQ.There are only sufficient residues above the LOQs in calf kidney and chicken kidney to estimate tolerance limits based on statistical approaches. In all other species and tissues, the low number of reported values above the respective LOQs made unachievable the assessment of tolerance limits based on statistical approaches. Residues are consistently highest in kidney tissues in the residue depletion studies, with the exception of one study. Kidney is the appropriate target tissue.Apramycin remains mostly unchanged and is therefore the appropriate marker residue.
The Committee recommended temporary MRLs at 5 mg/kg only in cattle and chicken kidney,measured as apramycin based on statistical approaches. If the MRLs were calculated according to the LOQs provided by the sponsor or the LOQs re-calculated by the Committee, the maximum estimated daily intake of apramycin residues in the worst case scenario would be around 1400 μg/day and would not exceed the upper bound of the ADI.
The sponsor is requested to provide improved analytical methods with better performance with lower LOQs, and residue depletion studies with appropriate sampling points close to the zero withdrawal periods for all tissues and species. The validated analytical method(s) and residue depletion studies are requested by the end of 2014.

68
REFERENCES
Afifi, N.A. & Ramadan, A. 1997. Kinetic disposition, systemic bio-availability and tissue distribution of apramycin in broiler chickens. Research in Veterinary Science, 62: 249–252.
Bogialli, S., Curini, R., Di Corcia, A., Lagana, A., Mele, M. & Nazzari, M. 2005. Simple confirmatory assay for analysing residues of aminoglycoside antibiotics in bovine milk: hot water extraction followed by liquid chromatography–tandem mass spectrometry. Journal of Chromatography A, 1067(1-2): 93–100.
Cheng, C., Liu, S.R., Xiao, D.Q. and Hansel, S. (2010). The application of trichloroacetic acid as an ion pairing reagent in LC-MS-MS method development for highly polar aminoglycoside compounds. Chromatographia 72(1-2): 133–139.
Donoho, A.L., Handy, P.R., Herberg, R.J. & Van Duyn, R.L. 1976. Excretion and tissue residues in the pig and calf. Lilly Research Laboratories report.
Elanco [Animal Health]. 2011. Information for establishment of MRLs for Apramycin. Summary report on residues.
Handy, P.R. & Thomson, T.D. 1985. Determination of the depletion profile of apramycin from tissues of broiler chickens treated with apramycin in the drinking water for five days. Lilly Research Laboratories report on study number AAC8503.
Handy, P.R. & Van Duyn, R.L. (1978). Apramycin tissue residue depletion study in dairy calves, Experiment T1B757806. Lilly Research Laboratory, Greenfield, IN, USA.
Handy, P.R. & Van Duyn, R.L. 1979. A tissue residue depletion study in pigs following administration of 110 PPM Apramycin in the feed for 28 days. Lilly Research Laboratories report on study number T1B757815.
Handy, P.R. 1985. A semi-quantitative determination of apramycin residues in tissues of broiler chickens treated with apramycin in drinking water for five days. Lilly Research Laboratories report on study number AAC8413.
Heal, B. 2007. Development and validation of an HPLC method for the assay of apramycin in rabbit tissues. Avogadro Laboratories, Toulouse, France.
Heal, B. 2008. Establishment of apramycin concentration in caecal digesta and residue depletion study of apramycin in the edible tissues of rabbits treated with a target in-feed dose level of apramycin at 100 or 300 mg per kg of feed for 21 consecutive days. Avogadro Laboratories, Toulouse, France. Report on study number A061607.
Herberg, R.J., Zornes, L.L., Van Duyn, R.L. & Donoho, A.L. 1979. 14C Apramycin tissue residue levels in swine at zero time and seven days following oral dosing. Lilly Research Laboratories report on experiment ABC-0024.
Howard, L.C., Owen, N.V., Handy, P.R., Griffing, W.J., Hoffman, D.G. & Morton, D.M. 1977. A 6-month toxicity study of apramycin administered orally to Beagle dogs. Lilly Research Laboratories report on study number D-3136.
Ishii, R., Horie, M., Chan, W. & MacNeil, J. 2008. Multi-residue quantitation of aminoglycoside antibiotics in kidney and meat by liquid chromatography with tandem mass spectrometry. Food Additives and Contaminants, Part A – Chemistry Analysis Control Exposure and Risk Assessment, 25(12): 1509–1519.Also in Proceedings of the SaskVal Conference, Saskatoon, Canada, 3–7 June 2007.
Kido, Y., Nakamura, A., Kikuchigahara, T., Nakamura, H., Asanuma, K., Fukui, Y., Satake, A., Nadai, H.& Ohtomo, Y. 1983. Apramycin premix/soluble tissue residue study in swine. Translated report from Japanese Research Institute for Animal Science in Biochemistry and Toxicology.
Parker, R.M. 1995a. Apramycin: residues in cattle after oral or parenteral administration. Central Veterinary Laboratory, United Kingdom report on study number CVLS/64/93.
Parker, R.M. 1995b. Apramycin residues in pigs after oral administration. Central Veterinary Laboratory, United Kingdom, report on study number CVLS/89/93.
Parker, R.M. 1995c. Method validation for the determination of apramycin in pig tissues by high performance liquid chromatography. Central Veterinary Laboratory, United Kingdom, report on study number CVLS/90/93.
Parker, R.M. 1995c Addendum. Method validation for the determination of apramycin in pig tissues by high performance liquid chromatography. Addendum to final study report. Lower limit of quantification in kidney and liver. Central Veterinary Laboratory, United Kingdom, report on study number CVLS/90/93.

69
Parker, R.M. 1995d. Method validation for the determination of apramycin in cattle tissues by high performance liquid chromatography. Central Veterinary Laboratory, United Kingdom, report on study number CVLS/63/93.
Parker, R.M. 1998a. Apramycin residue study in chickens after its oral administration in water. Central Veterinary Laboratory, United Kingdom, report on study number CVLS/143/97.
Parker, R.M. 1998b. Apramycin: method validation for the determination of apramycin in chicken tissues by HPLC. Central Veterinary Laboratory, United Kingdom, report on study number CVLS/142/97.
Parker, R.M. 1999a. Apramycin: Residues in pigs after its oral administration in feed. Central Veterinary Laboratory, United Kingdom, report on study number CVLS/49/98.
Parker, R.M. 1999b. Apramycin: residues in calves after its oral administration. Central Veterinary Laboratory, United Kingdom, report on study number CVLS/5/99.
Shang, R., Hu, Z., Zhang, X., Li, S., Shi, Y., Xu, Z. & Song, Z. 2004. Pharmacokinetics and bio-availability of apramycin sulphate by oral administration in pigs. Chinese Journal of Veterinary Medicine, 2004-03.
Stead, D.A. 2000. Review: Current methodologies for the analysis of aminoglycosides. Journal of Chroma-tography B, 747: 69–93.
SW-396. 1971. Tissue residue analysis experiment SW-396 apramycin sulfate. Lilly Research Laboratories report.
Van Duyn, R.L. & Handy, P.R. 1977. An apramycin tissue residue depletion study in dairy calves following oral administration of apramycin boluses for five days at dose rates of 40 mg/kg. Lilly Research Laboratories report on experiment T1B757702.
Van Duyn, R.L. & Johnson, W.S. Undated. Apramycin swine tissue residue study. Lilly Research Laboratories report on experiment VPR-319-766.
Van Duyn, R.L. & Handy, P.R. 1978. Apramycin serum levels from dairy calves following oral administration in milk replacer once a day for five days at dose rates of 20 and 40 mg/kg. Lilly Research Laboratories report on experiment T1B757804.
Van Duyn, R.L. & Kline, R.M. Undated. Pharmacology of apramycin in swine following oral administration. Lilly Research Laboratories report on experiments VPR-121-766, VPR-124-766, VPR-134-766 and VPR-196-766.
van Holthoon, F.L., Essers, M.L., Mulder, P.J., Stead, S.L., Caldow, M., Ashwin, H.M. & Sharman, M. 2009. A generic method for the quantitative analysis of aminoglycosides (and spectinomycin) in animal tissue using methylated internal standards and liquid chromatography tandem mass spectrometry. Analytica Chimica Acta, 637(1-2): 135–143.
Villa S. & Brightwell, J. 1998. Apramycin in rabbit tissues: Set up and validation of the analytical method. Report on RTC study number 6081. Research Toxicology Centre, Rome, Italy.
VPR-164-766. 1972. Tissue residue analysis experiment VPR-164-766 apramycin sulfate. Lilly Research Laboratories report.
Ziv, G., Bor, A., Soback, S., Elad, D. & Nouws, J.F.M. 1985. Clinical-pharmacology of Apramycin in calves.Journal of Veterinary Pharmacology and Therapeutics,8(1): 95–104.
Ziv, G., Kurtz, B., Risenberg, R. & Glickman, A. 1995. Serum and milk concentrations of apramycin in lactating cows, ewes and goats. Journal of Veterinary Pharmacological Therapeutics, 18:346-351.
Zornes, L.L., Herberg, R.J. & Donoho, A.L. 1979. Excretion and tissue distribution of 14C apramycin in swine following oral dosing. Lilly Research Laboratories report on experiment ABC-0013.
Zornes, L.L., Herberg, R.J. & Thomson, T.D. 1985. 14C Apramycin tissue depletion study in chickens. Lilly Research Laboratories report on experiment ABC-0294.


DerquantelFirst draft prepared by
Lynn G. Friedlander, Rockville, MD, USABruno Le Bizec, Nantes, France
andGerald E. Swan, Pretoria, Republic of South Africa
IDENTITY
International Non-proprietary names (INN): DerquantelSynonyms: PF-00520904, PNU-141962, 2-DOPH, 2-desoxyparaherquamide,
2-deoxyparaherquamide, Startect® (derquantel + abamectin) IUPAC Name: (1R,3S,5R,7S,12R)-12-Hydroxy-4,4,4',4',12,14-hexamethyl-9',10'-dihydro-
4'Hspiro[9,14-diazatetracyclo [5.5.2.01,9.03,7]tetradecane-5,8'-[1,4]dioxepino[2,3-g]indol]-13-one
Chemical Abstract Service Number: 187865-22-1Structural formula of main components:
ON
O
ONH
NOH
Derquantel
Chiral
O
O
NHN
OH
N
HO
12
3
98
4
56
724
25
26 27
28
21
22
23
1011
20
19
1314
15
16
1229
18
17
Molecular formula: C28H37N3O4
Molecular weight: 479.6
OTHER INFORMATION ON IDENTITY AND PROPERTIES
Appearance: White to tan coloured powder, essentially free from foreign matterMelting point: 196.5–197.5 °C

72
Solubility:
From Gottschall, 2010a From MSDS, 2009125 mg/L in water at 25°C 0.1–1 mg/L in water
0.1–1 mg/ml in n-heptane21.6 mg/ml in isopropanol at 25°C 10–33 mg/ml in propanol29.1 mg/ml in tert-amyl alcohol at 25°C 33–100 mg/ml10.0 mg/ml in tert-butylmethylether at 25°C 1-10 mg/ml55.9 mg/ml in ethyl acetate at 25°C54.8 mg/ml in methanol at 25°C 100–1000 mg/ml39.6 mg/ml in acetonitrile at 25°C0.1 mg/ml in isooctane at 25°C79.4 mg/ml in toluene at 25°C
33–100 mg/ml in acetone
RESIDUES IN FOOD AND THEIR EVALUATION
Conditions of useDerquantel, a spiroindole, is an oral anthelmintic for use in sheep. It is registered only in combination with abamectin. The combination product contains 10 mg/ml derquantel and 1 mg/ml abamectin.Derquantel, in combination with abamectin, is used to treat and control a broad range of adult and immature (L4) gastrointestinal nematodes of sheep, including parasites resistant to macrocyclic lactone-, levamisole-, benzimidazole- and closantel-based drenches (and combinations of these) (Kaminsky et al., 2011; Little et al., 2010, 2011).
DosageThe dose for sheep and lambs is 2 mg derquantel and 0.2 mg abamectin/kg bw.
PHARMACOKINETICS AND METABOLISM
Pharmacokinetics in laboratory animals and humansNo in vivo pharmacokinetic studies are provided for derquantel in laboratory animals or humans. Areport from the published literature (Aloysius et al., 2008) describes the comparative pharmacokinetics of paraherquamide, a closely related compound, in dogs, gerbils and sheep (Tables 3.1 and 3.2). The GLP status of this study cannot be determined from the literature report.
Table 3.1. Pharmacokinetics of paraherquamide and total drug related material (DRM) in sheep and dogs following a single 0.5 mg/kg oral dose of 3H-paraherquamide
Pharmacokinetic parameterSheep Dog
PHQ Total DRM PHQ Total DRMCmax (ng/ml) 38 46 73 167Tmax (h) 0.5 8 0.5 1AUC0-last (ng-h/ml) 547 1192 136 1387t1/2 (h) 8.5 13 1.5 23

73
Table 3.2. Excretion of radioactivity in sheep, dogs and gerbils following a single oral dose of 3H-paraherquamide
Sheep Dog GerbilDose (mg/kg) 0.5 0.5 20Collection time (h) 0–96 0–72 0–72Urine 9% 23% 17%Faeces 81% 58% 67%Total 90% 81% 84%
Pharmacokinetics in food-producing animalsSheepTwo GLP-compliant pharmacokinetic studies were conducted in sheep, the target species for the commercial combination product (derquantel plus abamectin).
A GLP-compliant pharmacokinetic study (Walker, 2009b) was conducted in Texel and Texel-cross sheep to compare pharmacokinetic parameters after oral or intravenous dosing. Twelve sheep were assigned (3 castrated males, 3 intact males and 6 females) per dose group. Group 1 received the final commercial formulation (2 mg derquantel/kg bw and 0.2 mg abamectin/kg bw) by drench. Group 2received an i.v. injection of derquantel alone at a dose of 1.0 mg/kg bw, equivalent to half the dose of derquantel in the commercial combination product formulation. Group 3 received an i.v. injection of abamectin at a dose level of 0.1 mg/kg bw, again equivalent to half the dose of abamectin in the commercial combination product formulation. Plasma samples were collected at pre-dose and for 168 hours post-dose. A validated LC-MS/MS method, with an LOQ of 0.5 ng/ml for each analyte, was used to quantify derquantel and abamectin in plasma. The pharmacokinetic parameter estimates for derquantel and abamectin are presented in Tables 3.3 and 3.4, respectively.
Table 3.3. Pharmacokinetic parameters of derquantel in plasma of sheep (males+females) following i.v. (derquantel alone) and drench (commercial combination product) administration
Parameter
Oral commercial combination product i.v. Derquantel
Mean95% Confidence Interval
Mean95% Confidence
IntervalLower Upper Lower Upper
Cmax (ng/ml) 108 80.8 145 959 716 1280Tmax (hours) 4.17 3.25 5.10 0.182 -0.741 1.11t1/2 (hours) 9.3 6.1 19.3 5.7 4.0 9.7AUC 0-last (ng-h/ml) 1760 1330 2340 1570 1390 1780
AUC 0- (ng-h/ml) 1790 1360 2360 1590 1410 1810
VDSS (ml/kg) NC NC NC 3220 2470 3970Clearance (ml/kg/min) NC NC NC 11.1 9.49 12.8Bio-availability (%) 56.3 44.3 71.4 NC NC NC
NOTES: NC = not calculated.
Table 3.4. Pharmacokinetic parameters of abamectin in plasma of sheep (males+females) following oral administration of abamectin alone or in the commercial combination formulation
ParameterOral commercial combination product i.v. Abamectin
Mean 95% Confidence Interval Mean 95% Confidence Interval

74
Lower Upper Lower UpperCmax (ng/ml) 31.1 22.5 42.9 109 79.0 150Tmax (hours) 23.8 17.8 29.8 0.122 0.029 0.216t1/2 (hours) 27.7 18.0 59.9 27.6 18.0 59.6AUC 0-last (ng-h/ml) 1660 1220 2260 1170 865 1590
AUC 0- (ng-h/ml) 1730 1250 2390 1240 898 1710
There was no statistically significant (P>0.05) sex-related differences in any pharmacokineticestimates between castrated males, intact males and females for derquantel or abamectin, and all data represent combined male+female results. The derquantel in the combination product had a Tmax of 4.17 h (range 3.25–5.10 h) and a Cmax of 108 ng/ml (range 80.8-145 ng/ml). The oral bio-availability of derquantel in the combination product was approximately 56% (range 44.3-71.3%). Following i.v. administration, derquantel was well distributed in the body with a volume of distribution at steady state (VDSS) of 3220 ml/kg (range 2470-3970 ml/kg) and a moderate clearance of 11.1 ml/kg/min (9.5-12.8 ml/kg/min). Derquantel, in the combination product, had a half-life of 9.3 h (range 6.1–19.3 h). The maximum plasma concentration of abamectin was reached in about 24 h after a single oral dose of the combination product. The oral bio-availability was about 70%. Abamectin was well distributed in the body with a VDSS of 3530 ml/kg. Clearance of abamectin was low, at 1.5 ml/kg/min. The half-life was 27.6 h.
In a second GLP-compliant plasma pharmacokinetic study (Walker, 2009a), the potential for interaction between derquantel and abamectin, when co-administered by oral drench as thecommercial combination product, was evaluated in Texel and Texel-cross sheep. Three treatment groups were evaluated: derquantel alone, abamectin alone, and the commercial combination product formulation containing 2 mg/kg bw derquantel and 0.2 mg/kg bw abamectin. Each treatment group contained 6 males and 6 females. Plasma samples were collected at pre-dose and at 0.25, 0.5, 1, 1.5, 2, 3, 4, 6, 8, 12, 18, 24, 36, 48, 72, 96, 120, 144 and 168 h after dosing. Samples were analysed using a validated LCMS/MS method. The method has an LOQ of 0.5 ng/ml for each analyte in plasma.
With the exception of Tmax derquantel, there were no statistically significant (P>0.05) sex differences in any pharmacokinetic parameters for either derquantel or abamectin. The Tmax for derquantel for males was 3.96 (2.84–5.07) h and for females was 2.65 (1.53–3.76) h. Although there was a statistically significant difference in derquantel plasma Tmax between males and females, Tmaxwas considered similar and did not result in a sex difference in overall exposure when defined by the AUC0-t(last), AUC0- , and Cmax.
All other comparisons were made using combined male and female data. There were no statistically significant differences (P>0.05) for any pharmacokinetic parameter between dose groups for either derquantel or abamectin with the exception of AUC0-t(last) for derquantel (P=0.044). The Tmax(combined) was 2.60 h (range 1.05–4.16 h) for derquantel in the combination product versus 4.00 for derquantel alone. For the commercial combination, the half-life for derquantel was 13.1 h (range 9.82–19.6 h) versus 10.4 h for derquantel alone. The AUC0– was 1250 ng-h/ml (range 1000–1570 ng-h/ml) for the combination product versus 1710 ng-h/ml for derquantel alone. The Cmax for derquantel in the combination product was 92.8 ng/ml (range 68.2–126 ng/ml) in the second study versus 105 ng/ml for the derquantel alone.
The half-life for abamectin in the combination product (27.7 h in the first study and 25.4 h in the second study) is consistent with that found during the evaluation of abamectin at the 45th Meeting of the Committee (1.2 ± 0.3 days) (FAO, 1995; 1996) and is generally consistent with the somewhat more variable half-life results reported in the scientific literature (Irish Medicines Board, 2007; Hongbo et al., 1998). See Table 3.4A.

75
Table 3.4A. Half-life values for abamectin reported in the literature
ParameterSource of data
Walker, 2009b. Hongbo et al., 1998. Irish Medicines Board, 2007
Dose (mg/kg) 0.2 0.2 0.2Cmax (ng/ml) 31.1 21.2 44Tmax (h) 24 14 24t1/2 (h) 28 (17.9-56.5)* 69.9 61.8 (12-192)
NOTES: * = mean (range)
Table 3.5. Pharmacokinetic parameters of derquantel in plasma of sheep (males+females) following oral administration of derquantel alone or in the commercial combination product formulation
Parameter
Oral commercial combination product Oral Derquantel
Mean95% Confidence Interval
Mean95% Confidence Interval
Lower Upper Lower UpperCmax (ng/ml) 92.8 68.2 126 105 76.9 143Tmax (hours) 2.60 1.05 4.16 4.00 2.45 5.55t1/2 (hours) 13.1 9.82 19.6 10.4 9.25 12.0AUC 0-last (ng-h/ml) 1210 974 1500 1680 1310 2140
AUC 0- (ng-h/ml) 1250 1000 1570 1710 1340 2180
Table 3.6. Pharmacokinetic parameters of abamectin in plasma of sheep (males+females) following oral administration of abamectin alone or in the commercial combination product formulation
Parameter
Oral commercial combination product Oral Abamectin
Mean95% Confidence Interval
Mean95% Confidence Interval
Lower Upper Lower UpperCmax (ng/ml) 26.5 21.9 32.1 26.1 21.5 31.6Tmax (hours) 23.5 17.1 29.9 16.8 7.8 25.9t1/2 (hours) 25.4 19.1 38.1 22.1 17.2 31.2AUC 0-last (ng-h/ml) 1670 1170 2400 1190 831 1700
AUC 0- (ng-h/ml) 1730 1190 2520 1240 849 1800

76
Taken together, the overall evidence indicates no significant interaction between derquantel and abamectin when dosed in combination. Pharmacokinetic parameters for derquantel are summarized in Table 3.5 (see also EMA, 2010). Pharmacokinetic parameters for abamectin are summarized in Table 3.6.
Two disposition studies using radioisotopically labelled derquantel (one non-GLP-compliant pilot study and one GLP-compliant study) in sheep were evaluated.
In the non-GLP pilot disposition study (Byrd and Liu, 2006), sheep were treated orally by capsule with 14C-derquantel to achieve a target dose of 2 mg derquantel/kg bw. In Phase 1 of the study (one female), 6 capsules were needed to achieve the target dose due to the low specific activity of the test article. In Phase 2 (four males, one per timepoint), material with a higher specific activity was used and only one capsule per sheep was needed. The Phase 1 animal was slaughtered 3 h after dosing. The Phase 2 animals were slaughtered 6, 12, 24 and 48 h after dosing.
Faeces, urine and cage rinse samples were collected beginning on day 1 (both phases) and continuing until slaughter. Blood was collected immediately prior to slaughter. Whole blood was combusted and analysed by liquid scintillation counting (LSC). Plasma, urine and cage rinse samples were analysed directly by LSC. Faeces were homogenized, combusted and analysed by LSC.
The majority of the radioactivity was eliminated in the faeces at each sacrifice interval after 12 h.In the first 24 h, approximately 50% of the radioactivity was recovered in the excreta: 42% in the faeces and 8% in the urine. By 48 h, approximately 85% of the radioactivity was recovered in the excreta: 55% in the faeces and 30% in the urine (Table 3.7).
Table 3.7. 14C-derquantel equivalent residues (μg/kg) from sheep treated with a single oral dose of 14C-derquantel at a dose of 2 mg/kg bw
GroupSlaughter interval after dosing
Urine Faeces Bile Whole blood Plasma Cage rinse
1 3 h — 20 NA 147.1 178.9 1.82 6 h 5 405 875.1 — 337.7 349.1 665.93 12 h 13 125 11 968 34 572 222.2 220.3 1 0154 24 h 6 160 47 975 26 682 58.3 49.1 925.65 48 h 2 128 28 584 8 323 17.9 14.0 427.6
NOTES: NA = not analysed.
In the GLP-compliant disposition study (Byrd and Liu, 2008), 20 crossbred sheep (n=3 per group) were treated orally by gastric tube with 14C-derquantel. The specific activity of the test article was adjusted so that animals in the later slaughter groups received derquantel with the higher specific activity. All animals received a single oral dose of approximately 2.10 mg derquantel/kg bw. Animals were slaughtered approximately 6, 12, 24, 48, 96 and 144 h after dosing. Samples were stored at -20°C until analysed.
Urine, faeces, plasma, blood, bile and cage rinses were collected from each sheep daily, beginning on day (-1) and continuing through slaughter. Urine, plasma, bile and cage rinses were analysed directly by LSC. Whole-blood samples were analysed directly by combustion and LSC. Faeces werehomogenized and submitted for combustion and LSC analysis.
The average total recovery of the administered dose in Groups 1, 2, 3, 4, 5 and 6 were 7.0%, 24.1%, 49.2%, 88.3%, 89.5% and 91.8%, respectively. Most of the administered radioactivity was recovered in the faeces, followed by urine and liver (for full tissue disposition, see Figure 3.1 and Table 3.8). The total radiolabelled residue (TRR) in urine (plus cage rinse) and faeces accounted for approximately 10% and 85% of the dose administered, respectively (see Figure 3.1 and Table 3.8).

77
Figure 3.1. Cumulative recovery of 14C-Derquantel equivalents ( g/kg)
No disposition data are provided for abamectin following use of the combination product. Although plasma and biliary data for abamectin were not included with the earlier Committee evaluation (FAO, 1995), it was concluded that, with 90% dose recovery, the majority (70%) was recovered in faeces. Both Committee evaluations (FAO, 1995, 1996) noted that abamectin, at the time it was reviewed, was registered only for use in beef cattle.
Table 3.8. Average total 14C-derquantel equivalents*(μg/kg) in urine, faeces, bile, whole blood, plasma and cage rinse in sheep given a single oral dose of 2.10 mg 14C-derquantel/kg bw
Group Slaughter intervalpost-dose Urine Faeces Bile Whole
blood Plasma Cage rinse
1 6 h 827.4 490.7 NA 176 217 474.22 12 h 3 161 28 339 34 572 106 119 348.33 24 h 1 996 45 128 26 682 84 89 705.34 48 h 2 701 43 513 8 323 11 10 8405 96 h 20.7 1 606 56 5 2 166 144 h 6.7 169 14 6 2 4.7
NOTES: * = Average is for the specific slaughter time only
Metabolism in rats, sheep, dogs and humansTwo GLP-compliant studies were conducted to evaluate the metabolism of derquantel in the rat, sheep, humans and dogs.
In a GLP-compliant metabolism study (Ma, 2006a), radiolabelled desoxoparaherquamide (derquantel) was incubated with rat, sheep, dog and human liver microsomes. Non-radiolabelled 7-ethoxycoumarin (7-EC) was included as a positive control to test the metabolic integrity of the enzymatic preparations. After a 1-hour incubation, 55.0, 67.6, 100.0, and 75.0% of 7-EC was metabolized by rat, sheep, dog and human liver microsomes, respectively. A significant amount of 7-hydroxycoumarin (7-HC), a metabolite of 7-EC, was observed in 1-hour incubation samples and, consequently, all microsomal preparations were determined to be enzymatically active.
Incubation mixtures of 14C-2-desoxoparaherquamide were extracted with methanol and analysed for metabolites using radio-HPLC. HPLC eluants were collected at 0.25 minute intervals using a fraction collector and were analysed for radioactivity using LSC. Radioactivity peaks were integrated to determine the percent distribution of individual metabolites in each sample.
The data show that 14C-2-desoxoparaherquamide (derquantel) was extensively metabolized by dog liver microsomes and moderately metabolized by rat, sheep and human liver microsomes (Tables 3.9and 3.10). After a 1-hour incubation, approximately 45.2, 39.8, 2.8 and 55.0% of the radioactivity was

78
attributable to unchanged drug in rat, sheep, dog and human liver microsomes, respectively. In addition to unchanged 14C-2-desoxoparaherquamide, 18 radioactive components were detected in rat, sheep, dog or human liver microsomal incubations. The predominant metabolites after 1-hour incubation included M1, M9, M10 and M12 and accounted for about 9.5, 3.6, 7.3 and 3.4% of the radioactivity in the rat; 12.9, 5.3, 6.1 and 4.0% in sheep; 2.6, 2.1, 5.5 and 2.9% in the dog; and 12.4, 7.1, 8.9, and 3.6% in humans, respectively. M2, which accounted for approximately 2.1, 3.9 and 1.7% of the radioactivity in 1-hour rat, sheep and human liver microsomal incubations, respectively, was not detected in 1-hour dog liver microsomal incubations. Similarly, M3, a predominant metabolite accounting for approximately 40.1% of radioactivity in 1-hour dog liver microsomal incubations, accounted for only 2.4 and 7.6% of radioactivity in 1-hour rat and sheep liver microsomal incubations.Recovery of radioactivity was high at all sampling times, 0.25–1.0 h, and in all species: greater than 98% in the rat; nearly 95% in sheep; greater than 95% in dogs; and greater than 97% in humans.
Table 3.9. Relative percentage distribution of radioactivity (%HPLC)(1) in methanol extracts from rat, sheep, human and dog liver microsomes incubated for 0.25 hours at 37 C with 14C-derquantel(2)
Metabolite SpeciesRt (min) Rat Sheep Human Dog2.6–3.6 ND 1.40 ND 2.28
11.4–12.4 ND ND ND 2.0513.4–14.5 0.73 2.28 ND 20.8514.0–15.6 ND 1.08 ND 6.5415.4–17.1 ND ND ND 4.5217.9–19.6 ND ND ND 7.1619.9–21.6 ND ND ND 1.4421.9–24.6 0.94 ND ND ND24.1–26.4 0.86 ND ND ND26.9–28.4 8.37 1.94 ND 10.2227.9–29.9 1.99 1.24 3.71 1.9329.4–31.9 3.59 2.87 3.96 3.3231.9–33.1 ND ND ND ND36.1–38.1 3.05 2.95 3.21 3.2839.4–41.1 1.62 1.08 1.92 1.1441.1–43.1 69.59 73.52 79.99 30.1345.1–47.1 7.06 7.67 5.17 3.7352.5–54.6 1.10 0.99 0.88 ND62.9–64.9 ND ND ND NDTotal (%) 98.90 97.02 98.84 98.59
Notes: (1) Average of triplicate samples. (2) 14C-derquantel at 1 M. ND = not detectable.
In a similarly designed GLP-compliant study (Ma, 2006b), 14C-2-desoxoparaherquamide (derquantel) was incubated with cryopreserved hepatocytes from rats, dogs and humans, and freshly prepared hepatocytes from sheep. Non-radiolabelled 7-ethoxycoumarin (7-EC) and 7-hydroxycoumarin (7-HC) were included as positive controls to test the metabolic integrity of the hepatocyte preparations. Derquantel incubated in the absence of hepatocytes served as a negative control. The viability of the control hepatocytes was checked after 0, 2 and 4 h of incubations. At the completion of the 4-hour incubation, 36.4% of the rat hepatocytes and 70.0% of the sheep, dog and human hepatocytes remained viable.
The stability of 14C-derquantel (1 μM and 25 μM concentrations) was assessed in incubations with media for 0 h and 4 h. At the 1 μM concentration, only 69.5% and 62.9% of unchanged parent

79
remained in the 0 and 4 h incubations, respectively. At the 25 μM concentration, 90.4% and 90.1% of unchanged parent remained in the 0 and 4 h incubations, respectively.
The positive controls were used to determine the enzymatic activity of the hepatocyte preparations. After a 4-hr incubation, 35.4, 94.6, 45.8, and 29.5% of 7-EC and 18.5, 100, 96.3, and 90.4% of 7-HC were metabolized by rat, sheep, dog, and human hepatocytes, respectively. Sulphate and glucuronide conjugates also were identified. The hepatocyte preparations were deemed enzymatically active.
Table 3.10. Relative percentage distribution of radioactivity (%HPLC)(1) in methanol extracts from rat, sheep, human and dog liver microsomes incubated for 1 hour at 37 C with 14C-derquantel(2)
Metabolite SpeciesRt (min) Rat Sheep Human Dog2.6–3.6 0.98 4.43 0.98 5.55
11.4–12.4 ND ND ND 2.99
13.4–14.5 2.39 7.62 ND 40.09
14.0–15.6 ND 2.10 ND 8.34
15.4–17.1 ND 1.02 ND 8.68
17.9–19.6 ND ND ND 7.58
19.9–21.6 ND ND ND 2.22
21.9–24.1 2.47 ND ND ND
24.1–26.4 1.44 1.44 ND ND
26.9–28.4 13.96 2.67 ND 4.21
27.9–29.9 3.57 5.25 7.05 2.14
29.4–31.9 7.33 6.06 8.89 5.47
31.9–33.1 1.85 ND 1.35 ND
36.1–38.1 3.44 3.96 3.58 2.94
39.4–41.1 3.18 2.47 4.87 ND
41.1–43.1 45.23 39.82 55.04 2.78
45.1–47.1 9.46 12.86 12.43 2.60
52.5–54.6 1.27 1.31 1.54 ND
62.9–64.9 2.09 3.88 1.69 ND
Total (%) 98.66 94.89 97.42 95.59
NOTES: (1) Average of triplicate samples. (2) 14C-derquantel at 1 M. ND = not detectable.
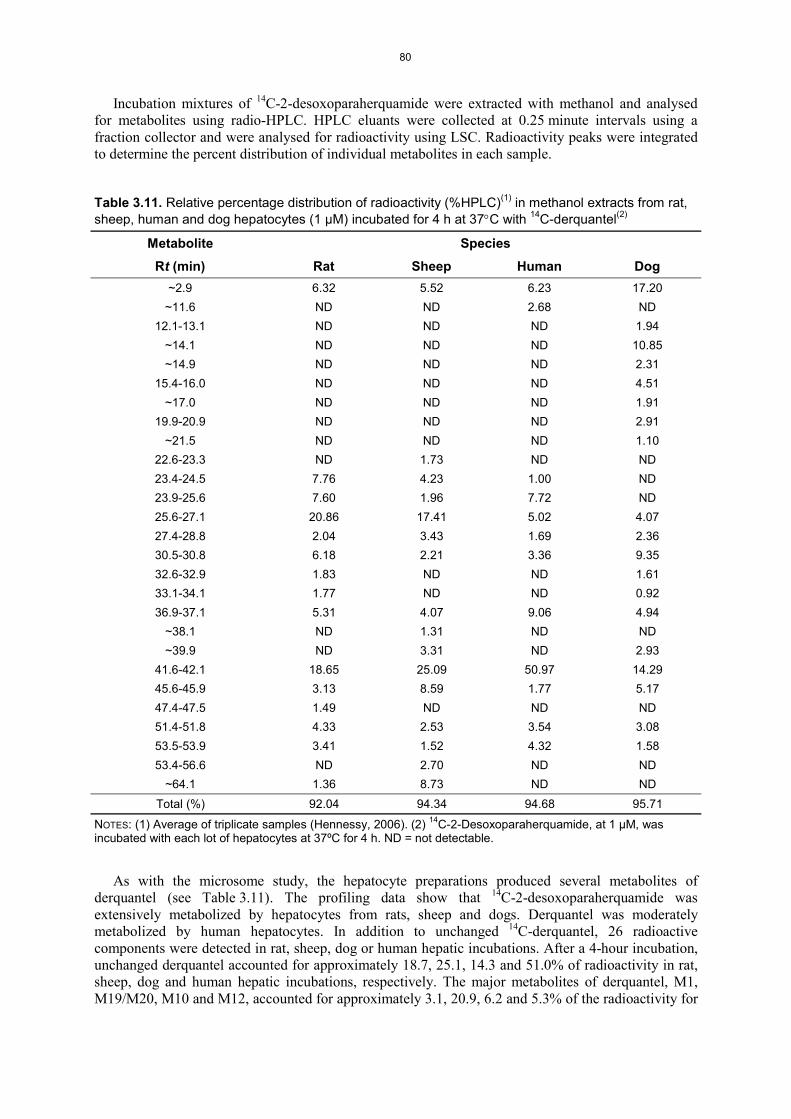
80
Incubation mixtures of 14C-2-desoxoparaherquamide were extracted with methanol and analysed for metabolites using radio-HPLC. HPLC eluants were collected at 0.25 minute intervals using a fraction collector and were analysed for radioactivity using LSC. Radioactivity peaks were integrated to determine the percent distribution of individual metabolites in each sample.
Table 3.11. Relative percentage distribution of radioactivity (%HPLC)(1) in methanol extracts from rat, sheep, human and dog hepatocytes (1 μM) incubated for 4 h at 37 C with 14C-derquantel(2)
Metabolite SpeciesRt (min) Rat Sheep Human Dog
~2.9 6.32 5.52 6.23 17.20~11.6 ND ND 2.68 ND
12.1-13.1 ND ND ND 1.94~14.1 ND ND ND 10.85~14.9 ND ND ND 2.31
15.4-16.0 ND ND ND 4.51~17.0 ND ND ND 1.91
19.9-20.9 ND ND ND 2.91~21.5 ND ND ND 1.10
22.6-23.3 ND 1.73 ND ND23.4-24.5 7.76 4.23 1.00 ND23.9-25.6 7.60 1.96 7.72 ND25.6-27.1 20.86 17.41 5.02 4.0727.4-28.8 2.04 3.43 1.69 2.3630.5-30.8 6.18 2.21 3.36 9.3532.6-32.9 1.83 ND ND 1.6133.1-34.1 1.77 ND ND 0.9236.9-37.1 5.31 4.07 9.06 4.94
~38.1 ND 1.31 ND ND~39.9 ND 3.31 ND 2.93
41.6-42.1 18.65 25.09 50.97 14.2945.6-45.9 3.13 8.59 1.77 5.1747.4-47.5 1.49 ND ND ND51.4-51.8 4.33 2.53 3.54 3.0853.5-53.9 3.41 1.52 4.32 1.5853.4-56.6 ND 2.70 ND ND
~64.1 1.36 8.73 ND NDTotal (%) 92.04 94.34 94.68 95.71
NOTES: (1) Average of triplicate samples (Hennessy, 2006). (2) 14C-2-Desoxoparaherquamide, at 1 M, was incubated with each lot of hepatocytes at 37ºC for 4 h. ND = not detectable.
As with the microsome study, the hepatocyte preparations produced several metabolites of derquantel (see Table 3.11). The profiling data show that 14C-2-desoxoparaherquamide was extensively metabolized by hepatocytes from rats, sheep and dogs. Derquantel was moderately metabolized by human hepatocytes. In addition to unchanged 14C-derquantel, 26 radioactive components were detected in rat, sheep, dog or human hepatic incubations. After a 4-hour incubation, unchanged derquantel accounted for approximately 18.7, 25.1, 14.3 and 51.0% of radioactivity in rat, sheep, dog and human hepatic incubations, respectively. The major metabolites of derquantel, M1, M19/M20, M10 and M12, accounted for approximately 3.1, 20.9, 6.2 and 5.3% of the radioactivity for

81
the rat hepatocyte preparations; 8.6, 17.4, 2.2 and 4.1% of the radioactivity for the sheep hepatocytes;5.2, 4.1, 9.4 and 4.9% of the radioactivity for the dog hepatocytes; and 1.8, 5.0, 3.4 and 9.1% of the radioactivity for the hepatocyte preparations from humans. M2 accounted for approximately 1.4 and 8.7% of the radioactivity in 4-hour rat and sheep hepatic incubations, respectively. M2 was not detected in the 4-hour hepatocyte incubation samples from dogs and humans. Conversely, M15 was detected in only the 4-hour dog hepatic incubations and accounted for approximately 10.9% of the radioactivity. Recovery of radioactivity was high for all species: >92% in the rat; >94% in sheep;>95% in dogs; and >94% in humans.
Paraherquamide (PHQ) was metabolized rapidly by microsomes from sheep, dogs, and gerbils. In sheep, 20% of the paraherquamide remained after a 1-hour incubation. Microsomal metabolism was even faster in dogs (10% remained after 30 minutes) and was fastest in gerbils (7% remained after just 15 minutes). PHQ and 8 metabolites were found in microsomal incubations from sheep and gerbils. Indogs, PHQ and 12 metabolites were found in microsomal incubations. M5 was absent from the radio-chromatogram of dog microsomal incubations. The various metabolites were structurally identified in dogs, gerbils and sheep (Figure 2).
The in vivo metabolism of PHQ was also evaluated in sheep, dogs and gerbils (Aloysius et al.,2008). Radiochromatograms show PHQ and 5 metabolites in sheep faeces, 5 metabolites but no PHQ in dog faeces, and PHQ and 6 metabolites in gerbil faeces. In urine, radiochromatograms reveal PHQ and 3 metabolites for sheep, 6 metabolites but no PHQ in dogs, and 4 metabolites and no PHQ in gerbils. In plasma, there were 5 metabolites and PHQ for sheep, 2 metabolites and PHQ for dogs, and 6 metabolites and PHQ for gerbils. The proposed metabolism of PHQ and formation of its major metabolites is provided in Figure 3.
Figure 3.2. Identified metabolites in dogs, gerbils and sheep

82
Figure 3.3. Proposed scheme for the metabolism of PHQ and formation of its major metabolites in gerbils, dogs and sheep
Metabolism in food-producing animalsSheepIn a non-GLP-compliant study (Liu, 2009), tissues, urine, faeces and bile from sheep treated in the total residue study (Byrd and Liu, 2008) were evaluated for derquantel-related metabolites using LC-MS/MS. Although metabolism in sheep was the primary focus of the study, additional analyses were conducted using bile-cannulated rats to better identify metabolites in sheep. Tissue samples were extracted with saline/acetonitrile. Faecal samples were extracted with saline/acetonitrile or methanol/water. Urine and bile samples were centrifuged prior to analysis. Tissue and faecal extracts and urine and bile samples were separated using HPLC radiochromatography and chromatographyeffluents were collect at 0.25 minute intervals. Fractions were analysed using 96-well plates and the radioactivity in each fraction was determined with microscintillation and luminescence counting.Selected urine and bile samples and tissue and faecal extracts were analysed by LC-RAM/ESI-MS and MS/MS to obtain structural information on derquantel and its metabolites. Metabolite identification focused on compounds present in sheep liver. To facilitate metabolite identification, other sheep tissue extracts, urine, faeces and bile from both sheep and rats treated with derquantel were analysed. Parent derquantel was detected in sheep liver, muscle, fat, urine, faeces and bile.
Metabolite 1 was a major radioactive peak in the radiochromatograms of sheep liver eluting at approximately 44 minutes. It also was detected in sheep kidney, muscle, fat, urine, faeces and bile.LC-MS/MS spectral data of M1 in urine, liver and faeces yielded a [M+H]+ at m/z 460. M1 was also found as a major metabolite in pooled rat bile collected from bile-cannulated rats treated orally with 14C-derquantel. A degradation product, D1, resulting from the instability of M1 during isolation, was also detected. Further analysis resulted in the identification of D1 as reference standard KXN-869. M1 and D1 had been detected previously in in vitro studies using rat, sheep, dog and human liver microsomes and hepatocytes (Ma, 2006a, b).

83
ON
O
ONH
N+
MW = 460O
N
O
ON
N
HH
M+H = 462+
Structure of M1 Structure of D1A second major radioactive peak, eluting at approximately 62 minutes, was found in sheep liver,
kidney, muscle and fat. This metabolite, designated as M2, yielded a [M+H]+ at m/z 476. M2 yielded [M-d+D]+ at m/z 478 after H/D exchange, suggesting that M2 contains one exchangeable proton. M2 previously had been detected in in vitro studies using rat, sheep, dog and human liver microsomes and hepatocytes (Ma, 2006a, b).
Another radioactive peak, eluting at approximately 63–64 minutes, was found in sheep liver, kidney, muscle and fat. This metabolite, designated M6, yielded a [M+H]+at m/z 474. M6 yielded a [M-d+D]+ at m/z 476 after H/D exchange, suggesting that M6 contains two exchangeable protons.Metabolite M2 was partially converted to M6 during the isolation and purification process (Ma, 2006a, b).
ON
O
ON
N
HH
O
+M+H = 476
ON
O
ON
HN
O
M+H = 474
+
Structure of M2 Structure of M6A major radioactive peak in muscle and fat, eluting at approximately 55 minutes, was also detected
in liver and kidney. This metabolite, designated M5, yielded a [M+H]+ at m/z 478. M5 previously had been detected in in vitro studies using rat, sheep, dog and human liver microsomes and hepatocytes but, in those studies, it was labelled as M14 (Ma, 2006a, b).
Another radioactive peak, eluting at approximately 37 minutes, was detected in sheep fat. This metabolite, designated M3, yielded a [M+H]+ at m/z 478 and was similar to M5. M3 was also detected in in vitro metabolism studies using rat, sheep, dog and human liver microsomes and hepatocytes, but in those studies was designated M12 (Ma, 2006a, b).
ON
O
ON
N
HH
OH +M+H = 478
ON
O
ON
HNOH
+
M+H = 478
Structure of M5 Structure of M3A radioactive peak, eluting at approximately 52.0 minutes, was detected in sheep fat, muscle, liver
and kidney. This metabolite, designated M4, yielded a [M+H]+ at m/z 458. M13, detected in in vitro metabolism studies using rat, sheep, dog and human liver microsomes and hepatocytes had the same [M+H]+ at m/z 458 (Ma, 2006a, b).
A final radioactive peak, eluting at approximately 30.0 minutes, was detected in sheep faeces. This metabolite, designated M7, yielded a [M+H]+ at m/z 494. M7 was also detected in in vitro metabolism studies using rat, sheep, dog and human liver microsomes and hepatocytes, but in those studies it was designated as M10 (Ma, 2006a, b).

84
ON
O
ON
HN+
M+H = 458O
N
O
ON
NOH
HH
O
+M+H = 494
Structure of M4 Structure of M7
A summary of the mass spectrometry (m/z) transitions (M + H) used to characterize derquantel and its metabolites is presented in Table 3.12.
M1 and D1 were isolated for NMR and D1 was derived from M1 during isolation of M1.The proposed metabolism scheme is shown in Figure 4. The bracketed structures indicate proposed
intermediates.
Table 3.12. Derquantel metabolites identified in sheep tissue, bile, urine and faeces
Metabolite [M+H] Metabolite [M+H]M1 m/z 460 M5 m/z 478M2 m/z 476 M6 m/z 474M3 m/z 478 M7 m/z 494M4 m/z 458 D1(KXN-869) m/z 462

85
ON
O
ON
NOH
Metabolite M3 ON
O
ONH
NOH
OHn O
N
O
ONH
N
OH Metabolite M5
ON
O
ON
N
Metabolite M4 ON
O
ONH
N+
Metabolite M1O
N
O
ONH
NOH
OH
n ON
O
ONH
NOH
Derquantel
ON
O
ON
N
O
Metabolite M6
O
ON
O
ONH
N
Metabolite M2 ON
O
ONH
NOH
O
Metabolite M7
ON
O
ONH
N
Metabolite D1
Figure 3.4. Proposed metabolism scheme in sheep. Bracketed structures indicate proposed intermediates.

86
TISSUE RESIDUE DEPLETION STUDIES
Radiolabelled residue depletion studiesSheepOne non-GLP- and two GLP-compliant studies were evaluated to assess total 14C-derquantel residues (total radiolabelled residues - TRR) in sheep tissues.
In a non-GLP-compliant pilot disposition study (Byrd and Liu, 2006), sheep were treated orally via capsule with 14C-derquantel to achieve a target dose of 2 mg derquantel/kg bw. The study was conducted in two phases. Phase 1 of the study (one female) required the use of 6 capsules to achieve the target dose due to the low specific activity of the test article. The radiopurity of the derquantel used in Phase 1 was approximately 90%. Phase 2 (four males; one per time point) used material with a higher specific activity and required only one capsule per sheep. The radiopurity of the derquantel used in Phase 2 was approximately 99%. The Phase 1 animal was slaughtered 3 h after dosing. The Phase 2 animals were slaughtered 6, 12, 24 and 48 h after dosing.
Although samples were available from one animal at 3 h withdrawal, data indicates that residues in tissues continue to increase until at least 6 h after dosing. The highest residues in each of the tissues were seen at the 6-hour sampling point. At all sampling times, total radiolabelled tissue residues were highest in liver. Residues also were high in fat and kidney, but declined more rapidly than did those in liver. Residues were consistently low in muscle. Results are summarized in Table 3.13.
Table 3.13. Total 14C-derquantel equivalent residues (μg/kg) measured in tissues from sheep that received a single oral dose of 2 mg/kg bw
Group No. Slaughter interval post-dosing Liver Kidney Muscle Fat
1 3 h 5133 611.4 122.7 351.82 6 h 6339 1461 420.5 18813 12 h 4549 983.6 267.1 838.04 24 h 2481 274.5 48.4 156.15 48 h 780.1 127.7 9.5 32.4
NOTES: The average value is reported for each specific time and tissue
The marker residue:total ratios were not specifically determined in this pilot study. In acetonitrile extracts of liver, derquantel represented 26.19%, 9.21% and 1.83% of the total radioactivity at 3, 12 and 24 h post-dosing. The acetonitrile extract from the 3-hour, 12-hour and 24-hour liver samples accounted for 76.0%, 79.5% and 58.6% of their TRR, respectively. In an acetonitrile extract of a 6-hour kidney sample, derquantel represented 26.29% of the total radioactivity. The acetonitrile extract from the 6-hour kidney sample accounted for 86.3% of the TRR.
In a GLP-compliant disposition study (Byrd and Liu, 2008), 20 crossbred sheep (3 per time point) were treated orally by gastric tube with 14C-derquantel. Radiopurity was greater than 98.5% for all batches used. Animals received a single oral dose of approximately 2.10 mg derquantel/kg bw.Animals were slaughtered approximately 6, 12, 24, 48, 96 and 144 h after dosing. Samples were stored at below -10°C until analysed.
As in the pilot study, total radiolabelled residues were highest in liver and lowest in muscle. Residues in kidney and fat were similar at the early sampling times. At later sampling times, residues were generally higher in kidney than in fat. There was little change in concentrations between the 96-and 144-hour sampling times (See Table 3.14 and Figure 3.5).
The study also provided the data needed to assess the ratio of marker residue to total radioactivity (See Table 3.15).

87
Table 3.14. Total 14C-derquantel equivalent residues (μg/kg) measured in tissues from sheep that received a single oral dose of 2 mg/kg bw
Group No. Slaughter interval post-dosing) Liver Kidney Muscle Fat
1 6 h 5769 770 236 7092 12 h 4155 549 131 4383 24 h 3490 486 129 5364 48 h 650 79 8 375 96 h 183 34 3 46 144 h 138 25 2 2
Figure 3.5. 14C-derquantel equivalent residues (μg/kg) in sheep tissues
Table 3.15. Percentage of derquantel to total radiolabelled residues measured in tissues from sheep that received a single oral dose of 2 mg/kg bw
Group No. Slaughter interval post-dosing
Liver(%)
Kidney(%)
Muscle(%)
Fat(%)
1 6 h 5.86 1.54 7.80 0.782 12 h 2.09 0.897 8.54 0.833 24 h 3.25 8.11 0.19 31.14 48 h 4.34 10.50 0 11.945 96 h NA6 144 h 0
NOTES: NA = not applicable.
In a second GLP-compliant study (Byrd, 2008), 6 sheep (one per time point) were treated once with 2 mg 14C-2-deoxyparaherquamide/kg bw orally by gastric tube. The study was designed to confirm the marker to total ratio for derquantel in sheep. The test material had a radiopurity of approximately 92.5%. Animals were slaughtered 12, 24, 48, 96 and 672 h (0.5, 1, 2, 4 and 28 days) post-dose. Based on information in both the study protocol and study report, the samples were stored at below -70°C, significantly colder than in the previous GLP-compliant study. As in the pilot and previous GLP
0 1 2 3 4 5 61
10
100
1000
10000LiverKidneyMuscleFat
Time (days)
Con
cent
ratio
n (
g/kg
)

88
studies, radiolabelled total residues were highest in liver and lowest in muscle. Residues in kidney were greater than residues in fat at all sampling times. Results are shown in Table 3.16 and Figure 3.6.
The study also was used to assess the ratio of marker residue to total radioactivity (See Table 3.17).
Table 3.16. Total 14C-derquantel equivalent residues (μg/kg) measured in tissues from sheep that received a single oral dose of 2 mg/kg bw
Group No. Slaughter interval post-dosing
Liver Kidney Muscle Fat
1 12 h 2546 339 49.8 1862 24 h 1254 145 17.8 1143 48 h 551 66.0 6.7 23.74 96 h 229 53.7 3.4 13.35 672 h 17.4 6.2 0.7 2.2
Figure 3.6. 14C-derquantel equivalent residues (μg/kg) in sheep tissues
Table 3.17. Percentage of derquantel to total radiolabelled residues measured in tissues from sheep that received a single oral dose of 2 mg/kg bw
Group No. Slaughter interval post-dosing
Liver(%)
Kidney(%)
Muscle(%)
Fat(%)
1 12 h 4.36 14.16 8.00 43.552 24 h 2.23 18.62 16.67 36.843 48 h 0.73 12.12 NA 16.674 96 h 0.44 0 NA 7.695 672 h NA NA NA NA
NOTES: NA = not analysed because of insufficient radioactivity to radioprofile
In samples collected from sheep, the TRR values are comparable between the two GLP-compliant studies, at time-points likely to be relevant to recommending an MRL, even though the samples in the two studies were stored at different temperatures (See Table 3.18).
Table 3.18. Total 14C-derquantel equivalent residues (μg/kg) in tissues from two different GLP-compliant total residue studies where tissues were stored at different temperatures
Slaughter interval
Liver Kidney Muscle FatByrd and Byrd, Byrd and Byrd, Byrd and Byrd, Byrd and Byrd,
0 4 8 12 16 20 24 280.1
1
10
100
1000
10000LiverKidneyMuscleFat
Time (days)
Conc
entra
tion
(g/
kg)

89
post-dosing Liu, 2008< -10°C
2008< -70°C
Liu, 2008< -10°C
2008< -70°C
Liu, 2008< -10°C
2008< -70°C
Liu, 2008< -10°C
2008< -70°C
6 h 5769 770 236 70912 h 4155 2546 549 339 131 49.8 438 18624 h 3490 1254 486 145 129 17.8 536 11448 h 650 551 79 66 8 6.7 37 23.796 h 183 229 34 53.7 3 3.4 4 13.3144 h 138 25 2 2672 h 17.4 6.2 0.7 2.2
The marker residue:total residue ratios from the two radiolabelled residue studies are variable. The combined results for the two GLP-compliant studies are summarized in Table 3.19 (Gottschall, 2010b).Based on the significantly lower sample storage temperature in the Byrd. (2008) study, the marker residue:total residue ratios from this second GLP-compliant study, where samples were stored at < -70°C, may be a more accurate reflection of the marker:total ratio. However, the samples stored at < -10°C may represent a marker residue:total residue ratio more applicable to samples collected under normal use and monitoring conditions.
Table 3.19. Summary of marker:total (M/T) residue ratios (%) from the GLP-compliant total residue studies in sheep
Withdrawal time (hours) Study ID
Derquantel Marker Residue:Total Residue (%)Liver Kidney Muscle Fat
6 1545N-60-05-171* 5.86 1.54 7.80 0.7812 1545N-60-05-171 2.09 0.897 8.54 0.8312 1545N-60-07-186** 4.36 14.16 8.00 43.5524 1545N-60-05-171 3.25 8.11 0.19 31.124 1545N-60-07-186 2.23 18.62 16.67 36.8448 1545N-60-05-171 4.34 10.50 0.0 11.9448 1545N-60-07-186 0.73 12.12 NA 16.6796 1545N-60-05-171 NA NA NA NA96 1545N-60-07-186 0.44 0.0 NA 7.69144 1545N-60-05-171 0.0 NA NA NAMean M/T 2.5 6.8 5.8 15.0
NOTES: * = Storage at between -10°C and -20°C; 3 animals per time point (Byrd and Liu, 2008). ** = Storage at between -70°C and -80°C; 1 animal per time point (Byrd, 2008). NA = not analysed.

90
To evaluate storage stability, fortified tissue samples containing 1 or 500 μg derquantel/kg were analysed after storage at below -20°C for one month (Carnevale, 2008). Significant changes from the theoretical concentrations were evident in all tissues, indicating that derquantel fortified into tissues is not stable when stored at below -20°C (Table 3.20).
Table 3.20. Stability of derquantel in fortified tissues stored at below -20°C
Tissue Theoretical concentration
( g/kg)
Concentration of Derquantel
% Change from theoretical
Mean % change from theoretical
Liver 1.00 0.47 ± 18.4 -53.0 -49.8500.0 266.9 ± 7.6 -46.6
Kidney 1.00 0.27 ± 12.8 -73.0 -64.5500.0 219.8 ± 8.0 -56.0
Muscle 1.00 0.2 ± 49.6 -80.0 -76.1500.0 139.7 ± 26.9 -72.1
Fat 1.00 0.7 ± 7.7 -30.0 -37.4500.0 276.1 ± 10.3 -44.8
As part of the validation for an ultraperformance liquid chromatographic (UPLC-MS/MS) procedure, an extended storage stability study was conducted using samples from the residue depletionstudy. Samples originally collected and analysed in Australia were shipped frozen to the method development laboratory. Samples were shipped, received and stored at below -70°C. The time from initial analysis to second analysis (re-analysis) was from 4 to 5 months, depending on the tissue.Results for the two analyses on the single overlapping analysis day (Sample day 4; 96 h withdrawal) compared favourably (Chambers, 2009). Results are shown in Table 3.21.
Table 3.21. Residues of derquantel (μg/kg) in sheep treated with 3 mg derquantel/kg bw and 0.3 mg abamectin/kg bw analysed at two different laboratories
Laboratory Liver Kidney Muscle Subcutaneous fat Perirenal fatOriginal* 2.98 ± 2.42 1.80 ± 1.54 <LOQ† 4.75 ± 8.47 3.99 ± 5.25Re-analysis** 2.64 ± 1.65 1.27 ± 1.46 0.45 ± 0.52 4.46 ± 4.45 3.50 ± 4.12
NOTES: * LOQ = 1.0 μg/kg. ** LOQ = 0.1 μg/kg. † = Reported by laboratory as 0.51 ± 0.58 μg/kg.
When samples fortified with derquantel are stored at below -20°C, there is a loss of approximately 50% from theoretical after 1 month of storage. When samples containing incurred derquantel residues are stored at below -70°C, the nominal concentrations are consistent after 4 to 5 months of storage,even when analysed at two different facilities. Taken together, these two studies indicate that derquantel requires storage at significantly lower temperatures than those usually employed in residue studies or for monitoring samples.
Residue depletion studies with unlabelled drugSheepIn the only residue depletion study (Chambers, 2009) provided, equal numbers of females and male castrate Merino sheep (38) and 2nd Cross Prime lambs (38), were randomly allocated to 12 slaughter groups (6 animals per group, with 4 controls). Animals in groups 2–13 were treated orally with the test formulation containing derquantel and abamectin. The dose delivered was 3 mg derquantel/kg bw and 0.3 mg abamectin/kg bw (150% of the label dose). Group 1 animals served as controls and received tap water orally.

91
Two control animals were slaughtered 6 h post treatment. At slaughter, the entire liver, both whole kidneys, gluteal muscle, perirenal and subcutaneous fat samples were collected. Tissues were weighedand diced, and frozen at approximately -70 to -80°C for 24 h. Further processing consisted of homogenization with dry ice to produce a fine powder. Additional gluteal muscle samples were collected, diced, and homogenized with a 0.9% saline solution. Samples were stored at -70 to -80°C pending analysis.
Analyses were conducted at two locations. Site 1 (original method; Table 3.22) analysed tissues from all animals for derquantel and abamectin in group order. Site 2 (UPLC-MS/MS; Table 3.23) re-analysed tissues for derquantel only, in reverse group order, and only for Groups 5 to 13 (96–840 hpost-dosing). The LOQ for all tissues is 1.0 μg/kg at Analytical Site 1 and 0.1 μg/kg at Analytical Site 2. The study results are summarized in Tables 3.22 and 3.23.
No tissue residue depletion information was provided for chickens, turkeys, rabbits or residues in milk and eggs.
Table 3.22. Residues of derquantel (μg/kg) in tissues of sheep treated with the combination product to deliver 3 mg derquantel/kg bw and 0.3 mg abamectin/kg bw
Slaughter time post-dose Liver Kidney Muscle SC Fat PR Fat
12 h 421.5 ± 131.7 211.3 ± 55.8 43.1 ± 29.0 720.9 ± 362.7 829.9 ± 340.224 h 247.9 ± 122.4 121.3 ± 49.1 24.7 ± 11.9 594.5 ± 297.2 461.8 ± 173.048 h 67.6 ± 60.8 22.3 ± 17.5 4.36 ± 4.86 125.5 ± 154.8 90.5 ± 61.296 h 2.98 ± 2.42 1.80 ± 1.54 <LOQ 4.75 ± 8.47 3.99 ± 5.25144 h <LOQ <LOQ <LOQ 1.93 <LOQ192 h <LOQ <LOQ <LOQ 1.08 <LOQ240 h <LOQ <LOQ <LOQ <LOQ <LOQ336 h <LOQ <LOQ <LOQ <LOQ <LOQ408 h <LOQ <LOQ <LOQ <LOQ <LOQ504 h <LOQ <LOQ <LOQ <LOQ <LOQ672 h <LOQ <LOQ <LOQ <LOQ <LOQ840 h <LOQ <LOQ <LOQ <LOQ <LOQ
NOTES: LOQ = 1μg/kg (Analytical Site 1). SC Fat = subcutaneous fat; PR Fat = perirenal fat.

92
Table 3.23. Residues of derquantel (μg/kg) in tissues of sheep treated with the combination product to deliver 3 mg derquantel/kg bw and 0.3 mg abamectin/kg bw
Slaughter time post-dose
Liver Kidney Muscle SC Fat PR Fat
12 h NM NM NM NM NM24 h NM NM NM NM NM48 h NM NM NM NM NM96 h 2.64 ± 1.65 1.27 ± 1.46 0.45 ± 0.52 4.46 ± 4.45 3.50 ± 4.12144 h 0.90 ± 0.38 0.12 <LOQ 0.37 ± 0.43 0.31 ± 0.16192 h 0.36 ± 0.16 0.14 <LOQ 0.39 ± 0.36 0.29 ± 0.21240 0.67 ± 0.33 <LOQ <LOQ <LOQ 0.34 ± 0.40336 0.36 ± 0.06 <LOQ <LOQ 0.114 0.16 ± 0.03408 0.31 ± 0.14 <LOQ <LOQ <LOQ 0.12 ± 0.02504 0.20 ± 0.10 <LOQ <LOQ <LOQ 0.11 ± 0.01672 h 0.32 ± 0.19 <LOQ <LOQ <LOQ 0.16 ± 0.03840 h 0.19 ± 0.11 <LOQ <LOQ <LOQ 0.13
NOTES: LOQ = 0.1 μg/kg (Analytical Site 2). SC Fat = subcutaneous fat; PR Fat = perirenal fat; NM = not measured.
METHODS OF ANALYSIS FOR RESIDUES IN TISSUES
Paraherquamide/PF-03198957Role: internal standard
Chemical Name: Paraherquamide CAS Registry Number: 77392-58-6
Chemical Formula: C28H35N3O5Molecular Weight: 493.6
2-DOPH(Derquantel)/PF-00520904Role: active pharmacological compound
Chemical Name: 2-deoxoparaherquamide CAS Registry Number: 187865-22-1
Chemical Formula: C28H37N3O4Molecular Weight: 479.6
Two different analytical methods have been developed for the detection of derquantel; validation was performed against OECD GLP (EU/VICH and Aus/New Zealand/SA) regulations. These methods comply with the requirements of Australian Veterinary Medicines Authority (APVMA) Residue Guideline No. 26 – Veterinary Drug Residue Analytical Method, and “The Rules Governing Medicinal Products in the European Community – Volume VIII October 2005– Established by the European Community of Maximum Residue Limits (MRLs) for Residues of Veterinary Medicinal

93
Products in Foodstuffs of Animal Origin” as well as with applicable Pfizer Animal Health Standard Operating Procedures.
The two analytical methods are based on a liquid extraction of homogenized ovine tissue followed by a solid-phase extraction (SPE) prior to reconstitution and quantitation by Liquid Chroma-tography/Mass Spectrometry (LC/MS). The most significant differences between the two methods are the treatment of muscle samples, the use (or not) of high-resolution chromatography for separation,and MS/MS (versus MS) for detection. The original method muscle assay used a saline homogenate and a matrix standard curve, whereas the revised method muscle assay used cryogenically processed muscle and a neat (matrix free) solution standard curve. All other tissues in both assays used cryogenically processed samples and neat solution standard curves. The original muscle method required these modifications because of significant ion enhancement during the electrospray ionization (ESI) process observed during method development. The original method is based on a conventional chromatographic separation followed by a single dimensional mass spectrometry characterization (MS1 on a single quadrupole), whereas the revised method used fast and high resolution chroma-tography coupled to multi-dimensional mass spectrometry (MS2 on a triple quadrupole) (See Guyton, 2009). The LC-MS system used by the original method is quantitative to 1 μg/kg whereas the UPLC-MS/MS method used by the revised method is quantitative to 0.1 μg/kg.
Original methodBlank liver, kidney and fat samples are prepared cryogenically as a powder homogenate. To prepare a homogenate, intact frozen tissue is sliced into thin sections and stored at -15ºC prior to homogenization. An approximately equivalent amount of dry ice is added to the tissue (1:1 v/v) and the mixture is transferred to a blending homogenizer and processed to a fine powder. Blank muscle is prepared as a saline homogenate. To prepare a homogenate, each intact tissue is sliced into wafer thin shavings and chilled physiological saline is added to the muscle tissue sections at a ratio of 2 parts tissue to 1 part saline. The sample is contained in an ice bath and homogenized to a smooth consistency using a homogenizer. All sample processing is performed in small batches to avoid unnecessary time that samples are exposed to temperatures above -80°C. Post processing, muscle homogenate is immediately transferred to -80°C storage. The tissue sample is fortified with the internal standard solution. The sample is left in ambient air for 15 min prior to the extraction with acetonitrile. After the addition of phosphate buffer, the extract is applied onto an MCX SPE cartridge.The column is eluted with acetonitrile/purified water (80/20, 6% NH4OH) solution. After evaporation, and reconstitution with acetonitrile and purified water, 5.0 l of the sample is injected onto the column (Xterra® MS C18 5 m 2.1 × 150 mm stainless steel column) for detection and analysis mass spectrometry (single quadrupole mass spectrometer detector). The mobile phase consists of methanol (0.075% formic acid) : purified water (0.075% formic acid) [36:64]. The analytes elutes under isocratic conditions at a flow rate of 0.25 ml/min. The chromatographic run time is 10 min with the target analyte eluting at approximately 6 min and the internal standard eluting at approximately 7.5 min. Positive electrospray (+ESI) is used to ionize target analytes. Signals are recorded using the selected ion monitoring (SIM) mode; m/z 480 and m/z 494 are monitored to characterize 2-DOPH and its internal standard, respectively. The quantity of 2-DOPH in each sample is calculated from standard curves based on linear least squares of the respective peak area response ratios of 2-DOPH and its internal standard. There is no weighting applied and calibration curves are not forced through zero.Curve ‘fit’ is accepted where the coefficient of determination (r2) is >0.995.
Revised methodTissue samples are extracted with acetonitrile, followed by sample clean-up with cation exchange solid phase extraction (MCX-SPE). The eluant from the SPE column is evaporated to dryness and reconstituted with 20% acetonitrile in 10 mM ammonium acetate prior to UPLC-MS/MS analysis. The analytes are eluted from the UPLC column by increasing the mobile phase B composition (0.1% ammonium hydroxide in methanol) linearly from 20% to 80% over 0.5 min (mobile phase A being 0.1% ammonium hydroxide in water), with a return to initial conditions at 1.75 min and holding at 20% Mobile Phase B until the end of the 2 min run. Injection volume is set at 5.0 μl, sample temperature is kept at 4°C, and column (UPLC BEH C18, 1.7 m, 2.1 × 50 mm) is maintained at

94
40°C. Electrospray ionization is preferred to other atmospheric pressure ionization techniques, and detection is conducted in the negative ion mode using acquisition of ions in the selected reaction monitoring (SRM) mode. 2-DOPH and paraherquamide transitions are m/z 480 405 and m/z 494 419, respectively. An internal standard calibration method is used for quantitation with paraherquamide as the internal standard. The plot of peak area ratio vs 2-DOPH concentration produces a line of best fit according to the chosen regression and weighting factor. For this validation the standard curves are fitted to a linear equation (y = mx+b), where m is the slope of the line and b is the y-intercept. The weighting factor used is 1/x. The concentrations are determined by back calculating against the fitted line from the peak area ratio. If back-calculated standards are more than±15% of their nominal concentration, that standard is dropped from the regression.
SPECIFICITY AND SELECTIVITY
The specificity is assessed by monitoring a large set on blank tissues; no response is detected in the retention time region of interest.
Original method
Figure 3.7. Example of an LC-MS trace of blank liver sample (DOPH at RT 4.98 min, internal standard at 6.37 min)

95
Figure 3.8. Example of an LC-MS trace of quality control (QC) liver sample fortified with 5 μg/kg with 2-DOPH (top trace) and the internal standard (bottom trace)
Figure 3.9. Example of an LC-MS trace of incurred residues in liver from animal 1336 (assay 1, 24 June 2008); 2-DOPH (top trace) and the internal standard (bottom trace)
Revised method2-DOPH transitions m/z 480 405 and m/z 494 419 for paraherquamide are not interfered with by abamectin under the chromatographic conditions employed and the mobile phase used to elute the target analyte and its internal standard, respectively.
Figure 3.10. Example of an LC-MS/MS trace of blank liver sample; 2-DOPH (top trace) and the internal standard (bottom trace)

96
Figure 3.11. Example of an LC-MS/MS trace of quality control (QC) liver sample fortified with 0.1 μg/kg with 2-DOPH (top trace) and the internal standard (bottom trace)
ACCURACY AND PRECISION
Original methodThe data in the validation study provided a fit for purpose accuracy and precision over the concentrations tested (1–500 μg/kg) for 2-DOPH quantitation in ovine tissue. An ad hoc linearity (r2
>0.998) is demonstrated; intra-day accuracy of the validation samples is in the ranges 84.3–99.7% (liver), 88.6-103.6% (kidney), 72.3-117.7% (muscle) and 88.4-111.2% (fat). The imprecision (%CV) for each tissue is in the ranges of 2.4-6.9% (liver), 3.2-11.5% (kidney), 3.2-24.0% (muscle) and 2.3-29.3% (fat). The inter-day accuracy is 86.1-108.6% across all tissue types and validation concentrations. The inter-day imprecision is 3.6-25.0% (but generally <15%) across all tissue types and validation concentrations.
Revised methodThe analysis of the provided validation data confirms very good accuracy and precision for 2-DOPH quantitation over the concentrations tested (0.1 to 1 μg/kg) in ovine tissue. An ad hoc linearity (r2 >0.990) is shown; intra-day accuracy of the validation samples was in the ranges 52.0-139.0% (liver), 48.4-113.6% (kidney), 58.4-92.9% (muscle) and 73.8-123.0% (fat). The imprecision (CV%) for each tissue was in the ranges 8.5-16.9% (liver), 4.6-19.9% (kidney), 4.3-11.3% (muscle) and 3.5-6.8% (fat). The inter-day accuracy is 68.3-102.3% across all tissue types and validation concentrations. The inter-day imprecision is 5.5-23.6% (but generally, <20%) across all tissue types and validation concentrations.
LODs and LOQsDeterminations of LODs and LOQs for 2-DOPH in ovine tissue are made from concentration responses from 20 ovine tissue blanks per matrix and from 6 different sources per matrix. The LOD is calculated considering the mean concentration response (at the retention time of 2-DOPH) in the 20 blank samples plus three standard deviation of the mean value. The original method LOD is 0.04-0.07 μg/kg. The revised method LOD is 0.007-0.022 μg/kg. The limits of quantitation are set at the lowest concentration used for the validation runs. For the original method, the LOQ is 1.0 μg/kg, whereas, for the revised method, the LOQ is 0.1 μg/kg.

97
Table 3.24. Summary of performance for 2-DOPH in different matrices (Original method)
Assay parameter Liver Kidney Muscle FatLinearity r2 >0.998 >0.999 >0.999 >0.999Estimated LOD (μg/kg) 0.07 0.05 0.04 0.05LOQ (μg/kg) 1.0 1.0 1.0 1.0Interday Accuracy ± Imprecision (%)
1.0 μg/kg 89.6 ± 5.1 98.7 ± 8.5 108.6 ± 15.6 100.3 ± 17.75.0 μg/kg 91.8 ± 4.9 91.9 ± 8.6 87.9 ± 25.0 91.1 ± 3.650 μg/kg 94.4 ± 6.5 93.3 ± 7.8 89.5 ± 11.8 98.3 ± 6.5500 μg/kg 86.1 ± 3.9 88.7 ± 6.3 88.6 ± 6.4 91.4 ± 4.0
Absolute Recovery (%)1.0 μg/kg 57.1 73.3 186.7 81.05.0 μg/kg 57.8 60.7 70.7 90.050 μg/kg 64.9 100.0 53.6 89.2500 μg/kg 68.6 64.8 58.4 93.3
Mean Abs Recovery (%) 62.1 74.7 92.4 88.4Int. Std Recovery 56.1-85.6 66.3-108.2 41.0-94.6 72.0-104.7
Table 3.25. Summary of performance for 2-DOPH in different matrices (Revised method)
Assay Parameter Liver Kidney Muscle FatLinearity r2 >0.996 >0.993 >0.990 >0.995Estimated LOD (μg/kg) 0.007 0.009 0.022 0.020LOQ (μg/kg) 0.1 0.1 0.1 0.1Interday Accuracy ± Imprecision (%)
0.1 μg/kg 91.9 ± 19.1 80.2 ± 18.9 75.5 ± 11.5 101.8 ± 17.20.5 μg/kg 102.3 ± 16.7 78.4 ± 23.6 72.0 ± 11.2 97.0 ± 6.41.0 μg/kg 82.2 ± 19.0 74.7 ± 17.5 68.3 ± 9.8 92.0 ± 5.5
STABILITY
The stability of the fortified tissue samples at -20 C was assessed and the results indicate that significant degradation of 2-DOPH residues (compared with freshly prepared samples) occurs upon extended frozen storage. An additional stability assessment concluded that 2-DOPH in ovine tissues is stable over the typical duration of an assay (including all steps of the analytical method, from sample preparation to injection into the autosampler).
The consequence of freeze-thaw cycles was investigated and assessed regarding the degradation of tissue samples. Results indicate that increasing the number of freeze-thaw cycles for incurred tissue samples or storing incurred samples at -20°C leads to a significant degradation of analyte in the matrix. 2-DOPH residues in the ovine matrix are most stable when stored at approximately -80°C and subjected to minimal freeze-thaw cycles. However, the mean 2-DOPH concentrations (μg/kg) in ovine muscle homogenate following extended storage stability at approximately -80°C over 3 and 6 months was outside the specified ±15% limits for most samples.

98
APPRAISAL
Derquantel has not been previously reviewed by the Committee. Derquantel, a spiroindole, is an oral anthelmintic for use in sheep. It is registered only as a combination product with abamectin. The combination product contains 10 mg/ml derquantel and 1 mg/ml abamectin. Derquantel, in combination with abamectin, is used to treat and control a broad range of adult and immature (L4) gastrointestinal nematodes of sheep. In the registered combination product, the withdrawal period is determined by the depletion of residues of the abamectin component. The 14-day withdrawal period identified on the registered labelling from New Zealand and the Republic of South Africa is consistent with the withdrawal period registered for abamectin alone in these countries and in Australia.
Derquantel is metabolized extensively; there are 8 principle metabolites in sheep. The metabolic profiles are qualitatively similar across the tested species. In studies using preparations of hepatocytes and microsomes, more than 20 metabolites were identified in test animals and sheep. Derquantel is eliminated relatively rapidly, primarily in the faeces. The terminal plasma half-life is approximately 10 h.
Depletion studies using radiolabelled derquantel were conducted in the sheep, the only species for which derquantel is registered. Radiolabelled total residues in muscle were uniformly low. At 6 hwithdrawal, radiolabelled residues were highest in liver, followed by kidney and fat. Residues decline rapidly over the next 24–48 h, but were still detectable in one study in all tissues at 28 days withdrawal.There are no residue data available for sheep milk.
Data from two total residue studies are available for determining the marker to total ratio for derquantel in sheep tissues. The first study used a large number of animals, but samples were stored only at < -10°C, a temperature subsequently determined to be insufficient for maintaining derquantel stability during storage. The second study, intended as a confirmatory study, utilized a much small number of animals but samples were stored at < -70°C, a temperature demonstrated to maintain derquantel stability in tissues. Effectively, neither study is ideal because the marker to total residue ratios are variable. As such, the marker to total residue ratios from both studies are used when estimating exposures.
Derquantel, although constituting a small percentage of the total residues, is an appropriate marker residue for derquantel residues in tissues.
A single residue depletion study using unlabelled derquantel was evaluated (as the commercial combination product formulation) in the target species, sheep. The dose was 150% of the labelled dosefor sheep (3 mg/kg bw derquantel and 0.3 mg abamectin /kg bw). As in the radiolabelled derquantel studies, residues in muscle were uniformly low. In this residue depletion study, the highest concentrations of derquantel residues at early sampling times were found in fat, followed by liver and kidney. At later sampling times, the highest residues were found in liver. Using an analytical method with an LOQ of 1 μg/kg, derquantel residues were below the LOQ at 8 days post-treatment in all tissues except subcutaneous fat. When the same samples were re-analysed using an analytical method with an LOQ of 0.1 μg/kg, derquantel residues were still quantifiable in liver and perirenal fat at 35 days withdrawal, the final time point in the study. Because derquantel is not registered for use in lactating sheep, there are no residue data for sheep milk.
The MRLs recommended for sheep liver and fat are based on the upper limit of the one-sided 95% confidence interval over the 95th percentile (“95/95 tolerance limit”) for the 8-day post-treatment data from the unlabelled residue depletion study. The MRLs recommended for sheep muscle and kidney are twice the LOQ of the UPLC-MS/MS method. No MRL is recommended for sheep milk as no residue data were provided for milk.
MAXIMUM RESIDUE LIMITS
In recommending MRLs for derquantel, the Committee considered the following factors:An ADI of 0–0.3 μg/kg of body weight was established by the Committee based on an acute toxicological endpoint. This ADI is equivalent to up to 18 μg for a 60 kg person.
99
Derquantel is extensively metabolized; derquantel represents, conservatively, 6% of total residues in muscle, 3% in liver, 7% in kidney and 15% in fat. Derquantel, although constituting a small percentage of total residues, is suitable as the marker residue in tissues. No data are provided for sheep milk.Liver contains the highest concentration of total radiolabelled residues at all sampling times. Fat contains the highest concentrations of derquantel residues in the unlabelled residue depletion studies at early sampling points. At times beyond the 4-day sampling time, residues are highest in liver. The highest concentration of the proposed marker residue, derquantel, at time points relevant to recommending MRLs is found in liver, followed by fat, then kidney and then muscle. Liver and fat can serve as the target tissues.A validated analytical procedure for the determination of derquantel in edible sheep tissues (liver, kidney, muscle and fat) is available and may be used for monitoring purposes.The MRLs recommended for sheep liver and fat are based on the upper limit of the one-sided 95% confidence interval over the 95th percentile (“95/95 tolerance limit”) for the 8-day post-treatment data from the unlabelled residue depletion study. The MRLs recommended for sheep muscle and kidney are twice the LOQ of the UPLC-MS/MS method.No MRLs were recommended for sheep milk as no residue data were provided for milk.
The Committee recommended MRLs for derquantel in sheep tissues of 0.2 μg/kg in muscle, 2.0 μg/kg in liver, 0.2 μg/kg in kidney and 0.7 μg/kg in fat, determined as derquantel. No MRLs are recommended for sheep milk.
Using the model diet and the ratio of the concentration of the marker residue to the concentration of the total residues noted above, these MRLs result in an intake of 8 μg/person, which represents 45% of the upper bound of the ADI.
REFERENCES
Aloysius, H.A., Silva Elipe, M.V., Arison, B.H., Faidley, T.D., Blizzard, T.A., Michael, B.F., Thompson, D.R., Shoop, W.L. & Tschirret-Guth, R.A. 2008. Comparative disposition and metabolism of paraherquamide in sheep, gerbils and dogs. Drug Metabolism and Disposition, 36: 1659–1669.
Byrd, J. (2008). Pfizer Reference Number: 1545N-60-07-186. Southwest Bio-Labs Study Number: 007-00963.Xenobiotic Laboratories Reference Number: 07035. [14C] PF-00520904 sheep tissue residues for marker ratio confirmation.
Byrd, J. & Liu, D. 2006). Pfizer Reference Number: 1545R-60-05-169. Southwest Bio-Labs Study Number: 205-0832. Xenobiotics Laboratories Reference Number: XBL05795. Pilot total residue depletion study in sheep: Generation and TRR determination of ovine excreta and tissue samples containing [14C] PF-520904 residues.
Byrd, J. & Liu, D. 2008. Pfizer Reference Number: 1545N-60-05-171. Southwest Bio-Labs Study Number: 005-00873. Xenobiotics Laboratories Reference Number: XBL0501330. Pivotal total residue depletion study in sheep: Generation and TRR determination of ovine excreta and tissue samples containing [14C] PF-520904residues.
Carnevale, J. 2008. Pfizer Reference Number: 1547N-14-06-178. Validation of the analytical methodology for the quantitation of 2-Desoxyparaherquamide in ovine tissue.
Chambers, M. 2009. Pfizer Reference Number: 1541N-14-07-184. Veterinary Health Research Pty Ltd Study Number: PFPO1934. Pivotal study for the determination of the PF-520904-00 (2-DOPH) and Abamectintissue residue profile in sheep following oral administration of the final formulation at 3 mg 2-DOPH/kg and 0.3 mg Abamectin/kg body weight.
EMA [European Medicines Agency]. 2010. Derquantel (ovine species). European public MRL assessment report. Committee for Veterinary Medicinal Products, EMA/CVMP/529651/2009.
FAO [Food and Agriculture Organization of the United Nations]. 1995. Residues of some veterinary drugs in animals and foods. FAO Food and Nutrition Paper, 41/8: 1–8.
FAO. 1996. Residues of some veterinary drugs in animals and foods. FAO Food and Nutrition Paper 41/9: 1–2.Gottschall, D. 2010a. MRL Submission to CVMP: Residue Expert Report – Part B.0.

100
Gottschall, D. 2010b. Application EU/09/168/PFZ for the establishment of MRLs for derquantel in sheep:Response to questions.
Guyton, M. 2009. Pfizer Reference Number: 1547R-60-08-201. Analysis of PF-00520904 residues in ovine liver, muscle, kidney, and fat: tissue assay method validation.
Hennessy, D. 2006. Pfizer Study Number: 6540R-14-05-161. VHR Study Number: PFPO1733. Definition of the pharmacokinetic behaviour of 2-DOPH (PF-520904) and Abamectin in sheep after administration of two combination PF520904 and Abamectin oral formulations.
Hongbo, H., Beilei, Z., Junsuo, L., Jiande, W., Hongcai, W., Yingjian, C. & Xiwang, L. 1998. The pharmacokinetics of avermectin B1 after oral administration to sheep and rabbits. Acta Veterinaria Zootechnia Sinica, 29: 469–473.
Irish Medicines Board. 2007. Irish Medicines Board Act 1995 (S.I. No. 144 of 2007). VPA:10915/0009/001; Case No: 7003116.
Kaminsky, R., Bapst, B., Stein, P.A., Strenhlau, G.A., Allan, B.A., Hosking, B.C., Rolfe, P.F. & Sager, H.2011. Differences in efficacy of monepantel, derquantel and abamectin against multi-resistant nematodes in sheep. Parasitology Research, 109: 19–23.
Little, P.R., Hodges, A., Watson, T.G., Seed, J.A. & Maeder, S.J. 2010. Field efficacy and safety of an oral formulation of the novel combination anthelmintic, derquantel-abamectin, in sheep in New Zealand. New Zealand Veterinary Journal, 58: 121–129.
Little, P.R., Hodges, A., Maeder, S.J., Wirtherle, N.C., Nicholas, D.R., Cox, G.G. & Conder, G.A. 2011. Efficacy of a combination oral formulation of derquantel-abamectin against the adult and larval stages of nematodes in sheep, including anthelmintic-resistant strains. Veterinary Parasitology, 27: 180–193.
Liu, D.D.W. 2009. Pfizer Study Number: 1575R-60-06-408. Isolation and identification of [14C] PF 00520904 metabolites from sheep and rats.
Ma, J. 2006a. Pfizer Study Number: 1576N-60-05-340. Xenobiotic Laboratories Study Number: 05011. In vitrometabolism of [14C] 2-Desoxoparaherquamide in rat, sheep, dog and human liver microsomes.
Ma, J. 2006b. Pfizer Study Number: 1576N-60-05-362. Xenobiotic Laboratories Study Number: 05012. In vitro metabolism of [14C] 2-Desoxoparaherquamide in rat, sheep, dog and human hepatocytes.
MSDS [Material Safety Data Sheet]. 2009. Pfizer Material Safety Data Sheet (MSDS). Revised 11 June 2009.Walker, A. 2009a. Pfizer Study Number 1542N-60-08-197. CRL Study Number: 285219. Definitive
determination, following oral administration in sheep, of the interaction between 2 Desoxoparaherquamide (2-DOPH) and Abamectin (ABA) when dosed in combination, compared with when dosed separately.
Walker, A. 2009b. Pfizer Study Number: 1542N-60-08-200. CRL Study Number: 285617. Pharmacokinetics and bio-availability of 2 Desoxoparaherquamide (2-DOPH) and Abamectin (ABA) in sheep.

MonensinFirst draft prepared by
Bruno Le Bizec, Nantes, Franceand
Pascal Sanders, Fougères, France
Addendum to the monograph prepared by the 70th meeting of the Committeeand published in FAO JECFA Monograph 6
IDENTITY
International Non-proprietary Name(s) (INN): Monensin sodiumSynonyms: Monensin A sodium salt; Monensin sodium; Monensin sodium salt; NSC 343257; Sodium
monensin; Elancoban®; Elancogran®, Coban®, Rumensin®, Coxidin®IUPAC Names: Stereoisomer of 2-[2-ethyloctahydro-3 methyl-5 [tetrahydro-6-hydroxy-6-
(hydroxymethyl)]-3,5-dimethyl-2Hpyran-2-yl] [2,2 -bifuran 5 yl] ]-9-hydroxy- -methoxy-a, ,2,8,-tetramethyl-1,6-dioxaspiro[4.5]decan-7-butanoic acid.
and: 4-[2-[5-ethyl-5-[5-[6-hydroxy-6-(hydroxymethyl)-3,5-dimethyl-oxan-2-yl]-3-methyl-oxolan-2-yl]oxolan-2-yl]-9-hydroxy-2,8-dimethyl-1,6-dioxaspiro[4.5]dec-7-yl]-3-methoxy-2-methyl-pentanoic acid
Chemical Abstracts Service Number: Monensin 17090-78-8; Monensin Sodium 22373-78-0Molecular Formula: Monensin A C36H61O11NaMolecular Mass: 693 g/molChemical structures: Monensin A as sodium salt (upper); nigericin as sodium salt used as internal standard (lower).

102
BACKGROUND
The Committee evaluated the residue safety of monensin in different species of food animals at its 70th meeting (FAO/WHO, 2009). In the evaluation, the Committee considered Monensin A (shown above) to be a suitable marker residue for monensin in milk and tissues in all species. At the 18th meeting of the Codex Committee on Residues of Veterinary Drugs in Foods (CCRVDF), draft maximum residue limits (MRLs) for monensin in various species as recommended by the 70th meeting of JECFA were proposed for Step 5/8 of the evaluation procedure. The Committee recommended permanent MRLs for monensin in poultry (chicken, turkey and quail) tissues of 10 g/kg in liver, kidney and muscle, and 100 g/kg in fat. The Committee recommended permanent MRLs for monensin in ruminant (cattle, sheep and goat) tissues of 10 g/kg in kidney and muscle, 20 g/kg in liver, 100 g/kg in fat and 2 g/kg in milk. The original assessment of the MRL was based on a limited dataset (Bassissi and Larvor, 2007; Bagg and Dick, 1999, 2000); much of the residue data were below the limit of quantitation (50 μg/kg or 25 μg/kg, depending on the method used). In consequence, a re-evaluation of the monensin MRL in cattle liver was requested and monensin was added to the priority list of veterinary drugs for evaluation or re-evaluation of the cattle liver MRL by JECFA.
The sponsor submitted additional data and requested that the new data and one previously submitted study be considered in conjunction with that of Bassissi and Larvor (2007). MacDougall and Roberts published in 2011 a paper indicating that the Codex MRL (20 μg/kg) would not be compatible with a zero time withdrawal period. Elanco has submitted a variation of the EU MRLs requesting an increase in the MRL for bovine liver from 30 μg/kg to 50 μg/kg and for kidney from 2 μg/kg to 10 μg/kg.
The sponsor submitted four main documents in support of the expected additional data for monensin in cattle tissues and milk. The first was a copy of the method formatted according to the ISO 78/2 format (Analytical Method 1775 ISO 78/2). This is an improved method for the determination and confirmation of marker residue (monensin A) in cattle tissues. The second document is a report for a GLP-compliant validation study conducted for monensin A in cattle tissues and milk (Bassissi and Larvor, 2007). The third document is a validation data of an analytical method for the determination of Monensin A in bovine liver, kidney, muscle, fat and milk by LC-MS/MS (MacDougall, 2011). The fourth document (presented in three volumes) corresponds to a non-clinical laboratory study (GLP) on tissue and milk residue in dairy cows following a single oral dose administration of monensin controlled release capsule (MacDougall and Roberts, 2011). Monensin is approved for administration to cattle in a variety of formulations, and including in particular an intra-ruminal controlled release capsule (CRC).
The sponsor requests that any proposed changes to the cattle liver MRL be extended to other ruminants (i.e. goats and sheep) as well.
APPROVED USES FOR MONENSIN IN CATTLE
The sponsor clarified the currently labelled uses for monensin. Canada, USA, Australia and New Zealand have label uses for monensin that could result in a monensin dose that exceeds 1 mg/kg bw,and under some circumstances be as high as 2 mg/kg bw.
Monensin Capsule The monensin CRC is a winged plastic delivery device for cattle which is introduced into the rumen via the mouth. It contains a stack of monensin tablets (total of 32 g of monensin) which slowly release monensin into the rumen via an orifice in the device. In most countries where the CRC is registered, the label stipulates a 200 kg minimum body weight for cattle that can be dosed with the capsule. This means that at the start of the treatment period, these 200-kg cattle would be receiving 320 mgmonensin/head/day or 1.6 mg/kg bw/day (based on an average payout period of 100 days). In Canada, differences in beef cattle breeds and diet has resulted in a labelled average capsule payout period of 80

103
days. Thus the dose for 200-kg beef cattle in Canada is almost 2 mg monensin/kg bw/day at the start of the treatment period.
In New Zealand, the CRC label has a minimum weight of 300 kg (to account for the smaller frames of Jersey cattle, a common dairying breed in New Zealand); this still delivers a monensin dose of 1.07 mg monensin/kg bw/day.
On the Australian CRC label, the restriction has been removed, allowing the capsule to be re-dosed at less than 100 days. The purpose of the removal of this restriction and the removal of other restrictions on some labels for concurrent use (see below) was to ensure continuous protection of cattle from bloat and ketosis during periods of high challenge. This means that cattle dosed with a monensin CRC, could be provided with a second CRC, at the same time as the first dose is completing its payout period, resulting in a short time where cattle could be getting twice the usual dose, or 640 mgmonensin/head/day, or up to 2 mg monensin/kg bw/day.
CONCURRENT USE OF MONENSIN CAPSULE AND MONENSIN PREMIX
In New Zealand, the monensin CRC label permits cattle in excess of 600 kg to receive additional monensin product (according to the New Zealand label for other monensin products, the additional dose would be 300 mg monensin/head/day). Thus a 600 kg animal could receive 620 mgmonensin/head/day or 1.03 mg monensin/kg bw/day.
In Canada, concurrent dosing of the monensin CRC with monensin premix is also permitted for dairy cattle. Thus, assuming a minimum weight of 550 kg for a Canadian dairy cow and an upper feed intake of 4.5% bw per day, concurrent use of monensin (95-day payout period for Canadian dairy cattle) and 396 mg monensin/head/day from the feed (16 ppm in the feed – upper limit). The total dose of monensin would be 1.3 mg monensin/kg bw/day.
The Australian CRC label also has no restrictions preventing concurrent use with in-feed monensin premix.
Monensin premixIn Canada, mature Holstein dairy cattle weigh approximately 800 kg and can have a daily feed intake greater than 4.0% body weight in dry matter. At the upper inclusion rate (24 ppm in the feed) on the Canadian premix label (monensin sodium) for dairy cattle, the intake of monensin in some cows could be about 800 mg/head/day, or approximately 1 mg monensin/kg bw/day. In the United States, dairy cattle may be dosed up to 660 mg monensin/head/day, which could result in a dose of approximately 1 mg/kg bw/day in smaller (600 kg) cattle. The upper dose limit for monensin in beef cattle in the United States is 480 mg/head/day, which also approximates to 1 mg/kg bw/day in many cattle at finishing.
Summary of approved usesThe permitted label uses for the monensin CRC and in-feed monensin premix could result in a significant number of cattle (beef and dairy) receiving doses of monensin from 1.0–2.0 mg/kg bw/day. Based on data submitted for evaluation to the 70th meeting of the Committee and submitted forevaluation by the 75th meeting of the Committee, there is a high probability that some cattle treated with monensin in accordance with approved uses will exceed the liver MRL currently adopted by Codex, although the ADI would not be exceeded. Given the safety of monensin in edible tissues, the current adopted Codex MRLs have a potential negative impact on beef trade for major cattle exporting countries. The maximum dose rate used in the world for monensin in cattle is estimated to be 2 mg/kg bw/day.

104
RESIDUE STUDIES
Two studies were conducted to determine the monensin milk and tissue residues in lactating dairy cattle at zero time withdrawal following the administration of two CRCs and the feeding of premix. In both studies, lactating dairy cows were treated intra-ruminally with two controlled release capsules (32 g monensin in a hexaglycerol distearate matrix in a plastic tube) at day 0. In the first study, previously submitted, cows were fed a medicated ration containing 24 mg monensin/kg feed from day 11 to day 20, and then fed a 36 mg monensin/kg feed for 21 days (Bagg and Dick, 1999). MISSING In the second study (Bagg, 2000) MISSING, submitted for the current evaluation, cows were fed a medicated ration containing 24 mg monensin/kg from day 14 to day 35. After measurement of the monensin release rate from the controlled release capsules, the resulting daily dose ranged from 1537 to 1804 mg monensin per cow (equivalent to 2.4 to 3 mg/kg bw) in the first study and from 778.2 to 1384 mg per cow (equivalent to 1 to 2.4 mg/kg bw) in the second study. At zero time withdrawal, animals were slaughtered and liver and kidney samples were analysed using a validated HPLC method with post-column derivatization (Method AM-AA-CR-R174-AA-791). In the two studies, there were no detectable monensin residues in kidney tissue (<0.025 mg/kg). Monensin residues were detected in 6 of 6 liver samples with two values below the LOQ (detected residues ranged from 0.02 mg/kg to 0.09 mg/kg) collected in the first study, and in one of six livers (25.8 μg/kg) was just above the LOQ(25 μg/kg) in the second study (Table 4.1).
Table 4.1. Relationship between monensin A dosage regimens (2 CRC + premix) and liver residue levels in two studies made available by the sponsor (Bagg, 1999, 2000)
From Bagg, 1999 From Bagg, 2000
Dose (mg/kg bw) Liver concentration ( g/kg) Dose (mg/kg bw) Liver concentration
( g/kg)2.7 55.1 2.0 <252.5 20.3* 1.9 25.82.9 69.6 2.0 <252.9 45.8 2.4 <253.0 23.8* 1.0 <252.4 84.5 1.9 <25
Mean 2.7 49.8 1.9Min. 2.4 20.3 1.0Max. 3.0 84.5 2.4
NOTES: * = below LOQ (25 g/kg).

105
Another study (Terhune, 2007) was completed in 2007. In this study, 9 cattle approximately 18 months of age and weighing from 406 to 537 kg were fed a medicated ration containing 40 mgmonensin/kg feed for 24 days with a daily feed consumption around 5 kg per day (estimated to be around 0.4 mg/kg bw). At zero withdrawal time, animals were slaughtered and liver was analysed for monensin using the method: ‘Determination of Monensin in Tissues and Eggs (Modified Method 5801654)’, a semiquantitative thin-layer chromatography (TLC) autobiographic method with a LOQ of 50 μg/kg. One of the cattle had a monensin liver residue with an estimated concentration of 0.0533 mg/kg (between 0.05 and 0.07 μg/kg). The limit of quantitation for this study was 0.05 mg/kg using a TLC autobiographic method.
Table 4.2. Residues of monensin in dairy cows tissues treated via gelatin capsule at 0.9 mg/kg bw/day as 2 equal doses daily for 7 days
Animal Time after last dosing Muscle ( g/kg) Fat ( g/kg) Liver ( g/kg) Kidney ( g/kg)25 6 h BLQ 5.24 9.63 1.0332 BLQ 3.23 9.39 BLQ39 ND BLQ 6.42 BLQ43 BLQ 1.08 10.76 BLQ16 18 h ND BLQ 4.84 BLQ71 ND 1.41 5.24 BLQ15 BLQ BLQ 5.39 BLQ72 ND BLQ 6.70 BLQ3 30 ND BLQ 2.23 ND11 ND BLQ 2.27 ND75 ND BLQ 5.43 ND77 ND BLQ 2.36 ND
NOTES: BLQ = below limit of quantitation; ND = not detected.
Figure 4.1. Depletion curve of monensin in dairy cows liver treated via gelatin capsule at 0.9 mg/kg bw in 2 equal doses for 7 days
The depletion of monensin was determined in the edible tissues (liver, muscle, kidney and fat) of 12 lactating dairy cows after dosing with monensin at 0.9 mg/kg bw/day for seven consecutive days

106
(Bassissi and Larvor, 2007). Gelatin capsules containing equal doses were administered at approx-imately 12-hour intervals. Tissues were collected at 6, 18 and 30 h after the final dosing. Monensin residues were determined using a validated HPLC-MS/MS method with a LOQ of 1 g/kg (Table 4.2).
The depletion curve obtained in liver is reported in Figure 4.1. The half-life of monensin in liver is about 14 h.
Finally, a study was recently completed to support the registration of a newly designed CRC in Europe (MacDougall and Roberts, 2011). The object of this study was to evaluate the residues of monensin in milk (24 dairy cows) and tissue (10 dairy cows) after 14 days following oral administration of a single monensin CRC. The target dose release for each capsule was 335 mg/day over a 95-day period. Using the daily target dose release and the overall average body weight for cattle in the study, the dose rate was calculated to be 0.53 mg/kg bw/day. Milk samples from each animal were collected twice daily, at 12-hour intervals, immediately prior to treatment (pre-trial) and for 28 consecutive milkings up to 336 h after treatment. Following the morning milking on study day 15, ten animals were slaughtered and tissue samples were collected: liver, kidneys, muscle and fat. All milk samples were initially stored refrigerated until transfer to the analytical laboratory. All tissue samples were stored frozen until analysis. Milk and tissue residue concentrations were evaluated for monensin A using a validated LC-MS/MS method (Charles River Analytical Method No. 1775 Version 1). Due to the nature of the intraruminal CRC, a residue decline phase was not included in this study because the device cannot be removed once administered. Thus, this study provides only one data point, at zero withdrawal. Only tissue sample results are reported.
Table 4.3. Residues of monensin ( g/kg) in the tissues of dairy cows treated via a single CRC device at approximately 0.5 mg/kg bw
Animal Liver Kidney Muscle Fat2 2.54 <LOQ ND <LOQ8 23.1 1.29 0.752 5.3210 18.8 <LOQ ND 1.0711 11.2 <LOQ <LOQ 2.5713 13.6 <LOQ ND <LOQ17 9.64 <LOQ ND 1.2818 26.3 <LOQ ND <LOQ21 13.6 1.45 0.836 2.9022 22.4 1.37 <LOQ 4.0424 7.99 <LOQ ND <LOQMean 14.9 0.936 <LOQ 2.12SD 7.53 0.302 0.261 1.55CV% 50.4 32.2 55.5 73.1
NOTES: ND = not detected.
Samples with no monensin A detected or with a found concentration less than the validated LOD are reported as ND. When a data point is assigned as <LOQ, the LOQ value is assigned for derivation of means and standard deviations. When a data point is assigned as ND the LOD value is assigned for derivation of means and standard deviations. In this study, while the average concentration in liver was below the Codex MRL, several liver samples were determined to be greater than the Codex MRL,and the Upper Tolerance Limit calculated using the arithmetic mean for the 95% confidence limit of the 95th percentile was 36 μg/kg. All other tissue types, including milk, were well below the JECFA MRLs. Results are summarized in Table 4.3.
No new residue data were provided for goat and sheep.

107
ANALYTICAL METHODS
A method for the determination and confirmation of monensin A and narasin A in cattle liver was validated (MacDougall, 2011). Only the monensin data are relevant to this submission. The laboratory method (CRM 1775) has been formatted according to the ISO 78/2 format. Liver samples are extracted twice with iso-octane/ethyl acetate (90/10). A portion of the combined supernatant is purified by silica solid phase extraction (SPE) before detection and quantification by HPLC with tandem mass spectrometry detection (LC-MS/MS) in the Selected Reaction Monitoring (SRM) mode. Data presented has been quantified for a single transition (693.4>675.6 m/z). Data was also collected for confirmatory transitions (693.4>501.6 and 693.4>479.4 m/z) but no data was processed or reported for these transitions. Quantification was from a matrix matched calibration line, with 1/x weighting. During the validation work, the European Union MRLs were used as the target concentrations (tissue residue depletion study for submission to the European Medicines Agency, EMA). The Codex MRL (20 μg/kg) is within the validated range for the method (EMA MRL for liver is 30 μg/kg).
System linearity was demonstrated over the range 0.5–100 ng/ml in liver for matrix match calibration standards prepared in extracted control samples for each matrix.
The inter-day assay accuracy and precision was determined for each matrix at their respective ½MRL, MRL and 2MRL (European Union) levels on 3 occasions. The mean intraday assay accuracy and precision for monensin fortified liver ranged from 89.3–103%, with a precision ranging from 2.13to 9.36%. The inter-day accuracy and precision for liver fortified with 15, 30 and 60 g/kg monensin was 95.2–101% with a precision no greater than 6.47%.
The specificity of the LC-MS/MS was investigated in liver; the assay was shown to be sufficiently specific. No interference was noted in control samples with a peak area greater than 10% for either test item at the respective LOQ for the matrix. The assay was also shown to be specific against solution standards of penicillin, tylosin, tilmicosin, tetracycline, lasalocid, ceftiofur, ractopamine and ketoprofen.
Figure 4.3. Representative ion chromatogram of a control liver extract for monensin (MacDougall, 2011 [217751 Tissue Method Validation, page 147])
Table 4.4. Limits of quantitation and limits of detection are given for Monensin A in liver, kidney, muscle and fat
Matrix MRL ( g/kg) LOQ ( g/kg) LOD ( g/kg)Liver 30 0.750 0.0823Kidney 2 0.750 0.0379Muscle 2 0.750 0.269Fat 10 1.00 0.0852
The assay LOD was determined by extraction and analysis of 20 aliquots (4 extractions from each of 5 different animals) of the matrix to determine the mean background noise. The LOD was defined as the concentration of each test item equivalent to the mean background noise plus 3 times the

108
standard deviation. The LOQ for detection of each test item was determined by the extraction and analysis of replicate (n=6) aliquots of control matrix fortified with decreasing concentrations of each test item, and assaying these samples with the standard method. The target intra-day assay accuracy at the LOQ (defined as the mean percentage determined concentration/actual concentration) was 70–110%. The precision at each concentration (defined as the coefficient of variation of the mean determined concentration) was 20%. Results are shown in Table 4.4 and Figures 4.4 and 4.5. MRL values referred to are those of the European Union.
Figure 4.4. Representative ion chromatogram of a liver assay sample fortified with monensin at 0.75 μg/kg (MRL) (MacDougall, 2011 [217751 Tissue Method Validation, page 129])
Figure 4.5. Representative ion chromatogram of a liver assay sample fortified with monensin at 30μg/kg (MRL) (MacDougall, 2011 [217751 Tissue Method Validation, page 138])

109
Stability for monensin A was found acceptable during storage for each tissue at room temperature (i.e. 4 h) and for long (i.e. up to 2 months) frozen storage at -20°C. Its stability after three freeze-thaw cycles was observed for liver. After 1, 2 and 3 freeze-thaw cycles in liver the found concentration difference for monensin at the tested MRL was -14.2, -14.5 and -15.7% respectively compared withfreshly extracted samples.
APPRAISAL
The sponsor provided updated information on the different market authorization and practices in cattle using a Controlled Release Capsule (CRC) or medicated feed, or both. The maximum dose rate used in the world for monensin in cattle is estimated by the sponsor to be 2 mg/kg bw/day. The sponsor provided two new study reports and informed the Committee that an additional study is on-going with animals treated with medicated feed, but this study was not available for the present evaluation. The most recent study was based on a new CRC with residue determined by LC/MS-MS.
The sponsor provided residue data based on different modes of treatment and analytical methods. Two studies (Bagg and Dick, 1999, Bagg 2000) combined 2 CRCs with medicated feeding to lactating cows, resulting in 2 dosage regimens (mean exposure: 2.4 mg/kg bw/day and 1.9 mg/kg bw/day). The analytical method was characterized by a LOQ of 25 μg/kg for monensin in liver. In one other study (Bassissi and Larvor, 2007), monensin was administered in gelatin capsule (0.45 mg/kg bw every 12 hfor 7 days) to lactating cows. Monensin residues were determined using a validated HPLC-MS/MS method with an LOQ of 1 μg/kg in liver, and a depletion curve obtained.
In a new study (MacDougall and Roberts, 2011), monensin was administered as one CRC to lactating cows, resulting in a mean dosage regimen of 0.53 mg/kg bw/day. The analytical method had a LOQ of 1 μg/kg for monensin in liver. The sponsor hypothesized a linear relationship between dose and monensin concentration in liver. Assuming the same dosage regimen of 1 mg/kg bw/day, Figure 4.6 shows that this assumption is not fully valid. Monensin bio-availability varies according to the administration protocol (CRC alone; 2×CRC+premix; gelatine capsule). Therefore, the concentration of monensin in liver of lactating cows differs between the studies.
Figure 4.6. Extrapolated monensin concentration in liver (y-axis; μg/kg) for a theoretical dosage regimen of 1 mg/kg bw/day (x-axis) based on studies by MacDougall and Roberts (2011), Bagg (1999, 2000) and Bassissi and Larvor (2007)
The difference in distribution should be related to differences in residue kinetics. The study performed by Bassissi and Larvor (2007) follows an experimental design with a gelatin capsule. The data obtained in the study by MacDougall and Roberts (2011) corresponds to use of a CRC alone in lactating cows. The liver tissue of two animals had monensin concentrations higher than 20 μg/kg. The

110
tolerance limit (the upper limit of the one-sided 95% confidence interval over the 95th percentile of the linear regression line, the “95/95 tolerance limit”) was calculated using the logarithmic transformed monensin concentrations and reached a value of 129 μg/kg at zero withdrawal time. There is uncertainty in the calculation due to the limited number of animals (n=10).
The data obtained in the study (Bagg et al, 1999, 2000) are used to describe the concomitant use of monensin CRC and premix. The monensin concentrations in liver were estimated for a maximal dose of 2 mg/kg. The 95/95 tolerance limit was calculated using the logarithmic transformed monensin concentrations, and reached a value of 222 μg/kg at zero withdrawal time. Again, there is uncertainty in the calculation due to the limited number of animals with quantifiable liver concentrations (n=5).
The study of MacDougall and Roberts (2011) employed an approved use of CRC. The monensin concentrations in liver were higher than the MRL of 20 μg/kg in three lactating cows. The 95/95 tolerance limit calculated with logarithmic concentration was 129.6 μg/kg. The uncertainty in the calculation is explained by the limited number of animals (n=10).
The effect of combination of CRC and medicated feed at a maximal dose of monensin 2 mg/kg bw/day on monensin residue in liver is estimated using experimental data (Bagg and Dick, 1999; Bagg, 2000). This scenario is realistic because it is very close to the actual dose administered. However, the dataset is limited (n=5 quantifiable values; 7 values below the LOQ of 25 μg/kg).Consequently, the 95/95 tolerance limit (222 μg/kg) calculated using logarithmic concentrations is far from 100 μg/kg. Using arithmetic concentrations, the 95/95 tolerance limit is calculated to be 115 μg/kg.

111
MAXIMUM RESIDUE LIMITS
In recommending a revised MRL for monensin for cattle liver, the Committee considered the following factors:
An ADI of 0–10 μg/kg bw was established by the 70th meeting of the Committee based on a chronic toxicological end-point. This ADI is equivalent to up to 600 μg monensin for a 60 kgperson.Monensin A is a suitable marker residue in liver. Monensin A is extensively metabolized and represents conservatively 5% of total residues in tissues.Different oral formulations of monensin and intra-ruminal CRCs are approved for use in cattle or lactating cows. Concomitant administration of these formulations and intraruminal controlled release capsules would lead to a maximum daily dose regimen of up to 2 mg/kg bw, according to the sponsor. At zero withdrawal time, one GLP study based on the administration of one CRC to lactating cows showed that the existing MRL for liver, originally set at 20 μg/kg, was exceeded. The 95/95 tolerance limit of monensin A in cattle liver was calculated as slightly above 100 μg/kg. This value is explained partly by the uncertainty associated with the low number of animals (10) slaughtered at zero withdrawal time.Using the data issued from the over-dosage studies conducted with a combination of two CRCsand medicated feed, liver concentrations higher than 25 μg/kg were reported for dose rates higher than 2 mg/kg bw/day. Under the assumption of dose linearity, for a maximum daily dose of 2 mg/kg bw the 95/95 tolerance limit leads to a value significantly higher than 100 μg/kg. This value is explained by the uncertainty associated with the low number of reported values and lack of information on the residue concentration below the method LOQ (25 μg/kg).For goat and sheep, no additional information was provided by the sponsor. Without any additional data, the Committee was unable to revise its recommendation on liver MRLs for goat and sheep. A validated HPLC-MS/MS complete method with adequate performance parameters and method validation was provided and was considered suitable for routine monitoring of monensin A as marker residue. On the basis of the residue study performed with the CRC administered alone to lactating cows, the Committee recommended a revision for MRL for cattle liver to 100 μg/kg,determined as monensin A. Using the model diet, these MRLs would result in an intake of 481 μg/day per person, which represents 80% of the upper bound of the ADI. The combined use of the controlled release capsule and premix in cattle at the highest dosage reported by the sponsor will be likely to result in a residue in excess in liver, over the MRL of 100 μg/kg.

112
Table 4.5. Maximum daily intake calculated for the standard food basket for the recommended MRLs in bovine tissues
Tissue Consumption factor (kg)
Codex MRL (μg/kg)
Ratio (MR:TRR)
Quantity ingested (μg total residue)
Muscle 0.300 10 0.05 60Fat 0.050 100 0.05 100Liver 0.100 100 0.05 200Kidney 0.050 10 0.05 10Milk 1.500 2 0.027 111
TDMI (μg/person)
481
ADI (μg/person) 600% of ADI 80
REFERENCES
Bagg, R. 1999 Determination of monensin residues in lactating dairy cattle at zero time withdrawal following administration of two Rumensin Control Release Capsules and feeding of Rumensin Premix at 36 ppm total matter intake. Unpublished Study No. T1FCA9804. Elanco Animal Health.
Bagg, R. 2000. Determination of monensin residues in lactating dairy cattle at zero time withdrawal following the administration of two rumensin controlled release capsules (CRC) and the feeding of rumensin premix at 24 ppm of the total dry matter intake. Unpublished Study no. T1FCA0001. Elanco Animal Health.
Bagg, R. & Dick, P. 1999. Determination of monensin residues in lactating dairy cattle at zero time withdrawal following administration of two Rumensin controlled release capsules (CRC) and the feeding of Rumensin premix at 36 ppm of the total dry matter intake. Unpublished study No. T1FCA9804 from Elanco, Guelph, Ontario, Canada. Submitted to FAO by Elanco Animal Health, Division of Eli Lilly and Company, Indianapolis, IN, USA.
Bassissi, F. & Larvor, A. 2007. Non-clinical laboratory study: Residue depletion study of monensin in milk and edible tissue from dairy cattle following oral administration of monensin at 0.9 mg per kg bodyweight for seven consecutive days. Unpublished GLP study No. A061486 from Avogadro, Parc de Genibrat, Fontenilles, France. Submitted to FAO by Elanco Animal Health, Division of Eli Lilly and Company, Indianapolis, IN, USA.
FAO/WHO. 2009. Evaluation of certain veterinary drug residues in food. Seventieth report of the Joint FAO/WHO Expert Committee on Food Additives. WHO Technical Report Series, 954.
MacDougall, J. 2011. Validation of an analytical method for the determination of Monensin A and Narasin A inbovine liver, kidney, muscle, fat and milk by LC-MS/MS. Analytical method number 1775. Version 1A. (2011) Unpublished Study Number 217751. Conducted for Elanco Animal Health by Charles River Laboratories, Tranent, Edinburgh, UK.
MacDougall, J. & Roberts, S. 2011. Non-clinical laboratory study (GLP): Tissue and milk residues in dairy cows following a single oral dose administration of Monensin controlled release capsule. Unpublished Study Number 286139 (Elanco Number T1FGB100014). Conducted for Elanco Animal Health by Charles River Laboratories, Tranent, Edinburgh, UK.
Terhune, T. 2007. Non-clinical laboratory study: Residue depletion in beef cattle following oral administration of monensin, ractopamine, tylosin and melengestrol acetate (heifers only) for 24 days. Unpublished Study Number HMS 041004. Conducted for Elanco Animal Health by HMS Veterinary Development, Tulare, CA, USA. [Includes Final Study Report Amendment #1.]

MonepantelFirst draft prepared by
Joe Boison, Saskatoon, Canadaand
Pascal Sanders, Fougères, France
IDENTITY
IUPAC Name: N-[(1S)-1-Cyano-2-(5-cyano-2-trifluoromethyl-phenoxy)-1-methyl-ethyl]-4--trifluoromethylsulfanyl-benzamide
Synonyms: N-[2-(5-cyano-2-trifluormethyl-phenyloxy)-1-(S)-1-cyano-1-methyl-ethyl]-4-trifluoromethylthio-benzoic amide
Chemical Abstracts Service Number: 887148-69-8Structural formula:
O
S
N
O
H
N
NF FF
F
F
F
Molecular formula: C20H13F6N3O2SMolecular weight: 473.4
Other information on identity and propertiesPure active ingredient: AHC-2102225 (N-[2-(5-cyano-2-trifluormethyl-phenyloxy)-1-(S)-1-cyano-1-
methyl-ethyl]-4-trifluoromethylthio-benzoic amide), the active S-enantiomerAppearance: White powderMelting point: 125°C (polymorphic form A;, 142–149°C (polymorphic form B)Solubility in water: 0.1 mg/L at 20°CSolubility in organic solvents: dichloromethane: 175 g/L; ethanol: 60.7 g/L; n-octanol: 7.3 g/L;
propylene glycol: 6.9 g/L; polyethylene glycol: 156.1 g/LpH: 6.2–6.3 (suspension in water)Partition coefficient: Octanol/water partition coefficient: log Pow = 3.0 (shake flask method, pH 7, at
20°C)Storage: At room temperature, protect from lightChirality: Monepantel has one chiral centreOptical Density: Optical rotation [ ] 580nm -32° (methanol)Purity: AHC-2155367 = N-[2-(5-cyano-2-trifluormethyl-phenyloxy)-1-(S)-1-cyano-1-
methylethyl]-4-chloro-benzoic amide, residual solvents, etc., each specified at <0.5%

114
RESIDUES IN FOOD AND THEIR EVALUATION
Conditions of useMonepantel is an anthelmintic of the amino-acetonitrile derivative class, indicated for the treatment and control of gastrointestinal roundworms (nematodes) in sheep. It is marketed under the trade name Zolvix® and licensed for use in Australia, New Zealand, Switzerland, South Africa, Uruguay and Argentina.
Dosage The recommended dose is as a single oral drench of 2.5 mg/kg bw and the maximum dose used is 3.75 mg/kg bw. The label has a warning that the product should not be administered to female sheep which are producing or may in the future produce milk or milk products for human consumption.
PHARMACOKINETICS AND METABOLISM
Absorption, distribution, metabolism and excretion SheepA non-GLP-compliant pilot study investigating the absorption, distribution, metabolism and excretion(ADME) of 14C-monepantel, following oral dosing, in two sheep was conducted (Jung, 2006). 14C-monepantel diluted with unlabelled drug was dissolved in a formulation similar to the proposed final formulation. Blood, urine and faeces were collected for 12 days post-treatment, at which time the animals were sacrificed for the collection of tissues. Total radioactive residue (TRR) in collected samples was measured and the metabolic profiles determined by LC-MS and HPLC/LSC (liquid scintillation counter) in selected samples, comparing with available authentic reference compounds. Due to the non-homogeneity of the test formulation, the doses administered were less than anticipated, and results could only be estimated. Consequently, accurate figures for excretion and balance were not possible. A large fraction (about 90%) of the dose was excreted via the urine and faeces, although the latter contained a significant proportion of unabsorbed drug over the first 1–2 days. Between animals there was variability in the ratio of faecal versus urinary excretion, ranging from 2:1 to 3:1 during the last few days before sacrifice. Figure 5.1 shows the cumulative excretion profile of radioactivity after a single oral administration of 14C-monepantel to one of the sheep. The remainder of the total radio-activity (17–27%) was distributed in fat (11–21%) and muscle (4%). The distribution of radioactivity in edible tissues is summarized in Table 5.1.
Radioactivity in blood peaked between 8 and 24 h after administration, and declined slowly thereafter. Radioactivity was neither exclusively bound in the plasma fraction, nor in the red cell fraction. Liver and fat were the tissues with the highest radioactivity. Muscle and kidney were relatively low in residues, and the variability observed for muscle residues may reflect the variability in fat content, as drug residues are lipophilic in nature. Various extraction experiments were conducted to determine the recovery of incurred radioactivity from samples. In general, simple extraction with organic solvents yielded 90% or better recovery, except for liver, where only about 70% was recovered following high-speed homogenization with acetonitrile (or other tested solvents).

115
Figure 5.1. Cumulative excretion of radioactivity after oral administration of 14C-monepantel at 1.66 mg/kg bw to sheep
Table 5.1. Distribution of radioactivity in edible tissues of sheep (pilot study)
TissueMonepantel equivalents (μg/kg) 12 days after treatment
Sheep A (dose ~1.7 mg/kg bw) Sheep B (dose ~4.6 mg/kg bw)Fat (subcutaneous) 1887 2665Fat (peritoneal) 2250 3402Liver 884 1932Kidney 228 392Muscle (shoulder) 330 979Muscle (thigh) 169 342Skin 204 324Blood 11 28Plasma 10 31Wool (back) 23 63
Metabolite profiling indicated that in tissue, blood, plasma and faeces, the sulphone metabolite is predominant, together with minor amounts of parent drug. For blood and faeces, the initial samples had a proportionately higher amount of the parent drug, especially in faeces collected within two days of treatment. Trace amounts of sulphoxide metabolite were observed in blood at 8 h post treatment, and also in faeces up to two days post-treatment.
Faeces contained two additional metabolites: the phenol M4, and the hydroxylated sulphone M3. Urine contained no parent compound or oxidized (unconjugated) metabolites of the parent. Two metabolites were observed; the minor one was M4 and the major one was its sulphate conjugate M5. The latter metabolite was confirmed by hydrolysis with sulphatase to M4. The structures of monepantel and identified metabolites are shown in Figure 5.2.
A GLP-compliant study investigating the ADME and residue depletion of 14C-monepantel, using test material labelled at either of two rings (on the cyano group, referred to as label 2, or on the amide group, referred to as label 3) of the parent molecule, was reviewed (Jung et al., 2007). The radioactive substances were dissolved in formulation TG 1778/30, and 17 male and 17 female Suffolk sheep were orally dosed at 5.0 mg/kg bw with either label 2, label 3 or an equimolar mixture of each labelled
sheep A, dose 1.66 mg/kg oral
0
10
20
30
40
50
60
70
80
90
100
0 2 4 6 8 10 12Time [d]
Cum
ulat
ive
excr
etio
n [%
of t
otal
radi
oact
ivity
]
urine
feces
urine + feces

116
substance (labels 2+3). Blood, excreta, wool and edible tissues (fat, muscle, kidney and liver) were collected 2, 7, 14, 21, 28 and 35 days post-dose and analysed for TRR. Tissue residues were extracted and the analytes quantified using the validated HPLC/UV (LOQ = 0.05 μg/kg) method (Karadzovska, 2007a). Blood and plasma were extracted and analysed by the validated method for blood for monepantel and monepantel sulphone (Karadzovska, 2007b).
Figure 5.2. Identified metabolites of monepantelThe cumulative excretion is summarized in Table 5.2. The data show that radioactivity is
predominantly excreted through the faeces, with a significant contribution from urinary elimination.Faecal excretion is high in the first 3 days (30%), but subsequently the rate declines, with about 2–3weeks required for 90% elimination. Blood and plasma profiles, obtained from 4 sheep dosed with the

117
label 2 substance, are shown in Table 5.3. Data show slow elimination from the systemic circulation, and radioactivity is distributed approximately equally between the cellular and plasma compartments.
Table 5.2. Mean cumulative excretion of radioactivity from sheep as % of dose
Label No. of sheep Days Urine (%) Faeces (%) Cage Wash (%) Total (%)2 2 0 – 14 30.8 ± 1.3 52.9 ± 5.0 1.8 ± 0.3 85.4 ± 6.03 2 0 – 14 28.8 ± 0.8 60.6 ± 0.7 2.2 ± 1.1 93.3 ± 1.5
0 – 14 29.2 ± 5.8 52.8 ± 4.12 + 3 4 0 – 21 30.7 ± 6.0 55.3 ± 3.4 4.2 ± 2.5 90.2 ± 5.4
Table 5.3. Mean sheep blood and plasma radioactivity profiles expressed as monepantel equivalents
Day Blood (mean ± SD) (μg/kg equivalents) Plasma (mean ± SD) (μg/kg equivalents)1 254 ± 27 300 262 145 ± 26 176 ± 214 77 ± 21 91 ± 237 53 ± 21 63 ± 2314 31 ± 17 36 ± 2021 19 ± 14 21 ± 1528 9 ± 9 12 ± 9
Residues in tissues and other matrices are shown in Table 5.4. The position of the label did not affect the excretion or distribution of residues. The highest residues in edible tissues were found in the fat, with slightly higher residues in rendered pure fat compared with composite fat tissue, followed by liver, kidney and then muscle. The approximate TRR proportions were 100 (fat):50 (liver):20 (kidney):10 (muscle):1 (blood):1 (plasma), respectively.
Table 5.4. Depletion of total radioactive residues (TRR) from sheep tissues
Mean TRR ± SD in mg equivalents/kgLabel position 2 2 2 3 2 2+3 2 2
Days post-dose 2 7 14 14 21 21 28 35
Bile 4.6 ±1.6 1.1 ±0.52 0.34 ±0.24 0.33 ±0.17 0.13 ±0.10 0.08 ±0.10 0.19 ±0.23 0.08 ±0.09Blood 0.14 ±0.20 0.04 ±0.10 0.02 ±0.10 0.02 ±0.10 0.01 ±0.01 0.01 ±0.00 0.01 ±0.01 0.01 ±0.00Plasma 0.16 ±0.04 0.05 ±0.01 0.03 ±0.01 0.02 ±0.01 0.01 ±0.01 0.01 ±0.00 0.01 ±0.01 0.01 ±0.00Fat tissue 15.5 ±4.0 5.8 ±2.9 2.2 ±1.2 1.7 ±0.83 1.1 ±0.50 0.74 ±0.52 1.1 ±0.62 0.46 ±0.26Pure fat 19.3 ±5.2 7.3 ±2.3 2.9 ±1.4 2.1 ±0.90 1.3 ±0.57 0.99 ±0.52 1.3 ±0.67 0.55 ±0.28Liver 6.7 ±0.23 2.7 ±0.75 1.5 ±0.71 1.1 ±0.47 0.77 ±0.37 0.50 ±0.33 0.71 ±0.55 0.33 ±0.25Kidney 2.4 ±0.15 0.81 ±0.26 0.38 ±0.24 0.32 ±0.16 0.16 ±0.10 0.12 ±0.08 0.18 ±0.1 0.06 ±. 06Muscle 1.50 ±0.34 0.45 ±0.23 0.22 ±0.15 0.14 ±0.08 0.11 ±0.06 0.06 ±0.05 0.09 ±0.06 0.03 ±0.03
The distribution of non-radiolabelled monepantel and its metabolite, monepantel sulphone in tissue, is summarized in Table 5.5. The approximate proportions of monepantel sulphone in the tissues were 10 (fat):5 (liver):2 (kidney):1 (muscle).

118
Table 5.5. Depletion of monepantel and its metabolite monepantel sulphone from sheep tissues
Day Label position
Fat Tissue Pure Fat Liver Kidney Muscle
Monepantel [mean concentration ± SD (mg/kg)]2 2 3.5 ± 1.4 5.1 ± 2.0 0.39 ± 0.12 0.14 ± 0.05 0.28 ± 0.08
7 2 0.61 ± 0.41 0.92 ± 0.61 All <0.05 All <0.05 0.81 + 3 at <0.05
14 2, 3 0.09 ± 0.02+ 3 at <0.05
0.13 ± 0.04+ 3 at<0.05 All <0.05 All <0.05 All <0.05
21 2, 2 + 3 All <0.05 All <0.05 All <0.05 All <0.05 All <0.05Monepantel sulphone [mean concentration ± SD (mg/kg)]2 2 10.2 ± 2.1 13.4 ± 3.1 5.2 ± 0.13 1.5 ± 0.23 1.4 ± 0.327 2 4.2 ± 2.0 5.7 ± 2.5 1.9 ± 0.57 0.60 ± 0.26 0.47 ± 0.26
14 2, 3 1.6 ± 1.0 2.2 ± 1.2 0.87 ± 0.49 0.30 ± 0.08+ 2 at <0.05
0.20 ± 0.10+ 2 at <0.05
21 2, 2 + 3 0.60 ± 0.56 0.76 ± 0.67 0.34 ± 0.30 0.13 ± 0.07+ 3 at <0.05
0.15 ± 0.06+ 5 at <0.05
28 2 1.1 ± 0.47+ 1 at <0.05
1.5 ± 0.73+ 1 at <0.05
0.550 ± 0.32+ 1 at <0.05
0.18 ± 0.10+ 1 at <0.05
0.15 ± 0.07+ 2 at <0.05
35 2 0.60 ± 0.02+ 2 at <0.05
0.70 ± 0.09+ 2 at <0.05
0.26 ± 0.04+ 2 at <0.05
0.10 ± 0.01+ 2 at <0.05
0.06 ± 0.01+ 2 at <0.05
Metabolite identification and profiling of residues in sheep samples Selected samples of edible tissues (except pure fat), blood, wool and excreta were extracted and profiled by HPLC with LSC detection. If a simple extraction failed to recover a large proportion of TRR, then further extractions with harsher conditions were attempted.
Some samples were extracted and profiled after prolonged storage in the freezer and compared with the initially obtained results; there were no significant changes in the profiles, indicating acceptable stability (except for urine). HPLC profiling of selected blood samples on a chiral column indicated that there was no racemization of parent or sulphone. Attempts were made to profile bile and wool, but no conclusions could be drawn because of poor extractability, low levels or complex profiles. Monepantel was not detected, but the sulphone and the M6 may have been present in bile. The proposed metabolic pathway for monepantel in sheep is shown in Figure 5.3.
The chromatographic and spectral data support the proposed metabolites and pathways. The information obtained formed the basis for selection of the marker residue and the regulatory analytical method. The distribution of metabolites in edible sheep tissues was remarkably comparable to those obtained during non-radiolabelled drug analysis and metabolite profiling studies. Little or no bound residues were observed in edible tissues. There are two main metabolic pathways:
One route involves oxidation of the parent to the transient sulphoxide M1, with rapid oxidation to the sulphone M2. There is a further slow oxidation to M3; the site of the hydroxylation was not elucidated but was thought to be on the phenolic ring. The other route involves cleavage to yield the phenol M4, together with its sulphate conjugate M5.From the corresponding benzamide portion, an alcohol and a peptide hydrolysis product, an acid that is formed and eliminated via the urine.
Elimination is predominantly via faeces, with significant contribution from urine. Bile excretion contributes to total faecal elimination. A tiny fraction of the drug is excreted with wool.

119
Figure 3. Proposed metabolic pathway of monepantel in sheep

120
Radioactive residues in fat tissue (most samples) were readily extractable with hexane (>90%) and the metabolites were identified. The sulphone was a dominant metabolite, with monepantel being a minor contributor at early times. A cyclized metabolite (G32), appeared at day 7, and was still observed at 35 days. Its distribution, as a percent of TRR, was variable between animals and increased with time to about one-third (mean value) of TRR at day 35. However, the highest individual residues (400 μg/kg) occurred at 7 to 21 days post-treatment.
Radioactive residues in liver (selected representative samples only) were readily extractable with acetonitrile at room temperature (70%) and more vigorous conditions (polar solvents, reflux, extreme pH) could extract another 16%, suggesting a very small amount of bound residues. Monepantel sulphone was the major metabolite, together with minor amounts of parent at day 2, plus two or three minor metabolites that were less than 10% of TRR. The metabolite G32 was not detected.
Kidney samples (selected representative samples only) also were readily extractable with acetonitrile at room temperature (80%). The pattern of metabolites was very similar to that of liver, with some additional very minor metabolites, one of which is tentatively the sulphoxide. Again, G32 was not detected.
Radioactivity in muscle samples (selected representative samples only) was readily extractable with acetonitrile at room temperature (90%). The sulphone was the major metabolite, with minor amounts of parent only at day 2. Minor amounts of G32 (<14 μg/kg) were observed in some samples at day 14 and 21 (only these samples were profiled), contributing between 0 and 27% to individual TRR.
The higher percentages of G32 were found in those animals with high contributions of G32 to fat TRR. It is reasonable to assume that G32 in muscle tissues arises from intramuscular fat, which is naturally present. G32 was not detected at day 2. Faeces metabolites were readily extractable with acetonitrile/water, and were dominated by (unabsorbed) parent during the first few days, and then bythe sulphone and M3. Some minor polar metabolites, such as the phenol, were also observed.
A complex pattern was observed in urine, which contained numerous polar metabolites resulting from the cleavage of the ether linkage in monepantel, and, in some cases, followed by conjugation. The major label-2 urinary metabolites were identified as the phenol and its sulphate, the latter being unstable and degrading to the former. The major label-3 urinary metabolites were the alcohol formed after cleavage of the phenylether bond (U15b) plus its corresponding sulphate (U21b) and the carboxylic acid formed after cleavage of the peptide bond (U17b). G32 was not detected in excreta or in blood.
PharmacokineticsA pharmacokinetic study of monepantel and its main metabolite, monepantel sulphone, was performed in 36 sheep, 18 castrated males and 18 females aged 6–8 months (Karadzovska, 2007c). The animals were allocated to five treatment groups on the basis of sex and body weight. In the first group of 6 animals, monepantel was administered intravenously at a dose of 1 mg/kg bw. In the second group of 6 animals, monepantel sulphone was administered intravenously at a dose of 1 mg/kg bw. The three remaining groups of 8 animals received monepantel via oral route at a dose of 1, 3 or 10 mg/kg bw.Blood specimens were collected from the animals in the groups treated intravenously at pre-defined time points: pre-treatment, 2, 5, 10, 30 minutes, 1, 2, 4, 8, 12, 24, 36, 48, 72, 96 h and 7, 10, 14, 21, 28 days post-treatment. Blood specimens were collected from the animals in the groups treated orally at pre-defined time points: pre-treatment, 30 minutes, 1, 2, 4, 8, 12, 24, 36, 48, 72, 96 h, and 7, 10, 14, 21, 28, 35 days post-treatment. Specimens were analysed for monepantel and its metabolite, monepantel sulphone (LOQ = 3 ng/ml). Faecal specimens were collected from groups 1, 2 and 4 over two 8-hourperiods to estimate faecal clearance. The calculated pharmacokinetic parameters after i.v. or oral administration of monepantel are summarized in Table 5.6.
Table 5.6. Pharmacokinetic parameters of monepantel after i.v. and oral administration
Route Intravenous Oral Oral OralDose (mg/kg bw) 1 1 3 10

121
Parameter (Unit)AUC0-7d (ng-h/ml) 676.1 ± 89.3 220.4 ± 78 703.1 ± 234.4 1967.2 ± 472.4Tmax (h) 2-8 4-24 4-6Cmax (ng/ml) 7 ± 1.9 18.9 ± 6.9 130.4 ± 110.2MRT (h) 5.3 ± 2 24.0 ± 5.7 30.0 ± 3.2 22.3 ± 4.9CL (L/(kg-h)) 1.5 ± 0.2Vss (L/kg) 7.68 ± 2.34
After i.v. administration of 1 mg/kg bw of monepantel, the blood monepantel concentration fellrapidly and the last quantifiable blood level was detected at 48 h. Total blood clearance was high (1.49 L/kg/h) and it was not possible to determine the half-life of the parent drug. Peak blood concentration of monepantel sulphone was achieved approximately 2 h after i.v. administration of monepantel, and monepantel sulphone concentrations remained above the LOQ for more than 7 days,depending on the animal. The calculated pharmacokinetic parameters after i.v. and oral administration of monepantel and i.v. administration of monepantel sulphone are summarized in Table 5.7. After i.v.administration of 1 mg/kg bw of monepantel sulphone, monepantel sulphone concentration remained above the LOQ for more than 4 days. Total blood clearance was smaller than for the parent compound (0.28 L/kg/h) and the terminal half-life was approximately 4.5 h. The volume of distribution at steady state of monepantel sulphone was 31.2 L/kg.
Bio-availability of monepantel after oral administration of 1 mg/kg bw was approximately 31% (Cl90% = 23–44%). Calculated bio-availability of monepantel sulphone obtained after oral administration of 1 mg/kg bw of monepantel was 94% (Cl90% = 71–124%). It is not a true bio-availability because the animals are different, but it shows that approximately the same amount of monepantel sulphone is formed whether monepantel is given orally or intravenously, hence demonstrating that the oral route has an excellent bio-availability of amounts of monepantel sulphonegenerated after administration of monepantel. The difference in oral bio-availability of monepantel and monepantel sulphone can be explained by a complete first-pass effect and a total absorption of the oral dose of monepantel.
Dose linearity of the blood concentration of monepantel after oral administration of monepantel appears to hold for oral administration of 1–10 mg/kg bw but is only seen for the dose of 3 mg/kg bwfor blood concentration of monepantel sulphone (Table 5.7). Dose corrected AUC, terminal half-life and MRT are significantly lower at 10 mg/kg bw than at 1 mg/kg bw.
A small fraction of monepantel (4%) is excreted unchanged in faeces and the great majority is converted to monepantel sulphone (94%). This confirms that the conversion of monepantel intomonepantel sulphone is the most important metabolic pathway. When monepantel sulphone was administered, 27% was excreted in faeces.

122
Table 5.7. Pharmacokinetic parameters of monepantel sulphone after i.v. and oral administration of monepantel and i.v. administration of monepantel sulphone
Route Intravenous Intravenous Oral Oral OralCompound Monepantel Monepantel
sulphoneMonepantel Monepantel Monepantel
Dose 1 mg/kg bw 1 mg/kg bw 1 mg/kg bw 3 mg/kg bw 10 mg/kg bwParameter (Unit)AUC0-7d (ng-h/ml) 2344 ± 290 2705 ± 631 2 442 ± 433 7 207 ± 1 230 1519 ± 1 251
AUC0- (ng-h/ml) 3651 ± 721 3701 ± 1056 3 564 ± 1 419 11 571 ± 3 600 19 200 ± 1 937Tmax (h) 24 24 24Cmax (ng/ml) 30.3 ± 4.6 31.8 ± 5.4 29.4 ± 12.2MRT (h) 127.47 ± 43.14 119.79 ± 46.58 139.15 ± 43.58 170.3 ± 47.15 104.47 ± 32.18CL (L/(kg-h)) 0.292 ± 0.096Vss (L/kg) 32.13 ± 8.27
TISSUE RESIDUE DEPLETION STUDIES
Residue studies with radiolabelled monepantelA pivotal ADME study was conducted in sheep, with radiolabelled monepantel to demonstrate the depletion of residues in edible tissues with a non-final formulation, at a dose rate (5 mg/kg bw) higher than the maximum recommended rate of 3.75 mg/kg bw.
The collected tissue and blood samples were analysed by HPLC with UV detection for monepantel and monepantel sulphone (Karadzovska, 2007b). Tissues were extracted once with acetonitrile and the analytes quantified using the validated analytical method; results were summarized earlier, in Table 5.5. Blood and plasma were analysed by the method validated for blood. Blood levels were consistent with data observed in pharmacokinetic studies and plasma results confirmed the blood:plasma distribution ratio of about 1, for both parent drug and monepantel sulphone. The ratios of sulphone were 200 (fat):100 (liver):30 (kidney):20 (muscle):1 (blood):1 (plasma).
The ratio of the concentration of monepantel sulphone (marker residue) to total radioactive residue (expressed as equivalent monepantel concentration) for each tissue was calculated using all valid data provided. Mean ratios of marker residue:total residues of 1 for muscle and of 0.66 for liver, kidney and fat were determined.
Residue depletion studies with unlabelled monepantelThree GLP-compliant residue depletion studies using unlabelled monepantel were reviewed. The final commercial formulation at the proposed maximum dose rate of 3.75 mg/kg bw was used, with a single administration individually adjusted to the individual animal body weight. In all 3 studies, equal numbers of females and castrated males were used, and sheep were maintained on green pasture. Renal fat, subcutaneous back fat (if present), liver, kidney and muscle were collected and analysed for monepantel sulphone only, using a validated analytical method (Karadzovska, 2007a, b). The additional SPE clean-up was used to reduce the LOQ to 10 μg/kg, and consequently increase the number of quantifiable values for statistical purposes.
Residue depletion in Suffolk lambs after single dose administration Thirty two Suffolk lambs, 3–4 months old were used (Karadzovska, 2007d). The mean dose received was 3.8 mg/kg bw. A group of four animals served as controls. Groups of eight were sacrificed at 7, 18, 29 and 40 days after treatment. Mean residues are shown in Table 5.8.

123
Table 5.8. Monepantel sulphone residues in edible tissues of Suffolk lambs after a single oral administration of monepantel
DayMean residue concentration ± SD (μg/kg)
Renal fat Subcutaneous fat Liver Kidney Muscle7 3256 ± 1106 2 417 ± 1 153 1 757 ± 516 591 ± 201 222 ± 114
18 490 ± 326 538 ± 281 212 ± 141 71 ± 52 43 ± 17+ 3 <10 μg/kg
29 115 ± 67 + 1 <10 μg/kg 114 ± 38 91 ± 55
+ 1 <10 μg/kg21 ± 9
+ 2 <10 μg/kg15 ± 3
+ 5 <10 μg/kg
40 109 ± 73 + 2 <10 μg/kg 114 ± 78 59 ± 43
+ 2 <10 μg/kg18 ± 9
+ 4 <10 μg/kg12
+ 7 <10 μg/kg
Residue depletion in Suffolk lambs after repeated administrationA GLP-compliant repeat dosing study (Smal, 2007) with 5-month-old Suffolk lambs, 30–39 kg, was conducted with equal numbers of females and castrated males, maintained on green pasture. The animals were dosed every 21 days at a rate of 3.75 mg/kg bw, with the dose adjusted each time to the new body weight. Up to 4 doses were administered and the mean dose rate received was 3.7 to 3.8 mg/kg bw. Between the 1st and 2nd doses the animals gained about 25% in weight, but then lost weight (about 3%) between the 2nd and 3rd treatments due to poor pasture growth. Afterwards they gained about 12% in weight. Groups of 6 animals were sacrificed at 21 days after the 2nd and 3rd doses, and at 14 and 21 days after the 4th dose. Samples were analysed for monepantel and monepantel sulphone only to the LOQs of 50 μg/kg, using the validated analytical procedure. There were no quantifiable residues of monepantel, and mean residues of monepantel sulphone were compared with the single-dose Suffolk lamb study. The results are shown in Table 5.9.
Table 5.9. Comparison of residues of monepantel sulphone after repeat dosing of monepantel
Study Doses/sacrifice Renal fat Liver Kidney MuscleY06/93 2/21 days 133 108 <50 <50
3/21 days <50 <50 <50 <504/14 days 395 305 80 <504/21 days 328 227 66 <50
Y07/21 1/18 days 490 212 71 <50
NOTES: Values the mean (n = 6) of residues of monepantel sulphone (μg/kg). For calculation of means, residues <LOQ were replaced by half LOQ.
Residue depletion in cross-bred lambsIn another study, 47 second-cross-bred lambs (Merino × Dorset), 3–4 months old, were used (Karadzovska, 2007e; Strehlau, 2007). The mean dose received was 3.9 mg/kg bw. Another group of four served as controls. Groups of eight animals were sacrificed at 7, 19, 29, 40, 70 and 77 days after treatment. Mean residues are shown in Table 5.10.
Table 5.10. Monepantel sulphone residues in edible tissues of Merino × Dorset cross-bred lambs after a single oral administration of monepantel
DayTissue [mean (n = 8) residues in g/kg ( ±SD)]
Renal fat Subcutaneous fat Liver Kidney Muscle
7 3 068 ± 1050 3 667 ± 1316 2 056 ± 733 460 ± 170 155 ± 76

124
19 681 ± 298 751 ± 364 354 ± 169 99 ± 47 32 ± 11+ 1 at <10 μg/kg
29 83 ± 45 114 ± 91 51 ± 40 18 ± 5+ 5 at <10 μg/kg All <10 μg/kg
40 22 ± 13+ 2 at <10 μg/kg
21 ± 14+ 2 at <10 μg/kg
18 ± 7+ 1 at <10 μg/kg All <10 μg/kg All <10 μg/kg
70 All <10 μg/kg All <10 μg/kg 11+ 7 at <10 μg/kg All <10 μg/kg Not analysed
77 15+ 7 at <10 μg/kg All <10 μg/kg 12 ± 2
+ 2 at <10 μg/kg Not analysed Not analysed
Residue depletion in Merino sheep A residue depletion study with 2–3 year old Merino sheep was reported (Karadzovska, 2007f). The mean oral dose received was 3.8 mg/kg bw. A group of 4 animals served as controls. Animals were sacrificed at 7, 18, 29, 35, 70, 120 and 127 days after treatment; mean tissue residues are shown in Table 5.11.
Table 5.11. Monepantel sulphone residues in edible tissues of Merino sheep after a single oral administration of monepantel
DayTissue [mean residues in μg/kg ( ±SD)]
Renal Fat Subcutaneous Fat Liver Kidney Muscle
7 3 109 ± 834 3 010 ± 1028 1 376 ± 258 366 ± 90 199 ± 11018 474 ± 380 638 ± 497 325 ± 259 82 ± 62 40 ± 39
29 202 ± 132 265 ± 197 138 ± 84 35 ± 12+ 2 at <10 μg/kg
23 ± 6+ 2 at <10 μg/kg
35 67 ± 52 89 ± 46 54 ± 47+1 at <10 μg/kg
22 ± 6+6 at <10 μg/kg
15 ± 4+6 at <10 μg/kg
70 22 ± 10+ 1 at <10 μg/kg
27 ± 15+ 2 at <10 μg/kg
15 ± 6+ 3 at <10 μg/kg All <10 μg/kg All <10 μg/kg
120 All <10 μg/kg All <10 μg/kg All <10 μg/kg All <10 μg/kg All <10 μg/kg127 All <10 μg/kg All <10 μg/kg All <10 μg/kg Not analysed Not analysed
Comparison of residue data from all residue studies Statistical analysis of variance (significance level of 5%) of the data from the three single-dose administration studies indicated that there was no difference in observed residues amongst the three studies. Therefore, data from the above single-dose administration studies were pooled (Karadzovska, 2007f), as shown in Table 5.12.
Table 5.12. Pooled monepantel sulphone residues in edible tissues of sheep
DayTissue [mean residues in μg/kg ( ±SD)]
Renal fat Subcutaneous fat Liver Kidney Muscle
7 3 145 ± 962 3 031 ± 1235 1 730 ± 588 472 ± 180 192 ± 101
18/19 548 ± 335 652 ± 391 297 ± 198 84 ± 53 38 ± 26+ 4 at<10 μg/kg
29 134 ± 101 + 1 at <10 μg/kg 169 ± 147 93 ± 70
+ 1 at <10 μg/kg26 ± 12
+ 9 at <10 μg/kg20 ± 6
+15 at <10 μg/kg35 67 ± 52 89 ± 46 54 ± 47 22 ± 6 15 ± 4

125
+ 1 at <10 μg/kg + 6 at <10 μg/kg +6 at <10 μg/kg
40 65 ± 67+ 4 at <10 μg/kg
63 ± 70+ 2 at <10 μg/kg
37 ± 35+ 3 at <10 μg/kg
18 ± 9+ 12 at <10 μg/kg
12+ 15 at <10 μg/kg
The residues were highest in fat, with renal and subcutaneous fat having similar levels, as would be expected for a lipid-soluble molecule, followed by liver, kidney and muscle. The relative magnitude of residues in tissues is about 20:10:2:1, respectively, during early phase depletion ( 2 weeks). Muscle residues presumably arise, in part, from the interstitial fat in muscle tissue. Beyond day 35, the magnitude of liver residues approaches those of fat.
METHODS OF ANALYSIS FOR RESIDUES IN TISSUES
Analytical method for monepantel sulphone residues in sheep tissues A validated analytical procedure (Karadzovska, 2007b) was used for the quantification of monepantel sulphone residues in edible sheep tissues from the ADME (Karadzovska, 2007g) and residue depletion studies. A ground tissue sample (1 g) was extracted at room temperature with acetonitrile (9 ml), either by mechanical homogenization for 2 minutes or by mechanical shaking for 10 minutes. The mixture was centrifuged briefly, and the supernatant was clarified by syringe filtration prior to dilution. The diluted extract was injected onto HPLC for quantification to an LOQ of 50 μg/kg. When an increased sensitivity was required, the stored extract (prior to filtration) would be cleaned up on a SPE cartridge (either silica based C18 for liver, or polymeric for the other tissues). Following evaporation and re-dissolution, an aliquot was injected into the same HPLC system for quantification to an LOQ of 10 μg/kg. The HPLC system was an isocratic 2-column switching system, with a narrow band of eluate from the first column (Luna 3 μm C18 (2) silica) being directed to the second column (NovaPak Phenyl 4 μm silica). The same mobile phase (acetonitrile/methanol/water) was used for both columns. The eluate from column 2 was monitored with a UV detector set at 230 nm. The combined retention time was approximately18 minutes. The HPLC was calibrated by injection of pure standards from 2 to 1000 ng/ml.
The method is simple, uses commonly available reagents and without any hazardous steps. The extraction, centrifugation, filtration and dilution steps can be performed by any experienced analyst.Switching HPLC systems, while not common, are easily set-up using readily available HPLC modules plus a switching valve, which can be controlled by instrument software. Up to 18 samples can be processed in a working day and automated HPLC analysis can be performed overnight. The SPE option, however, is more labour-intensive. The method was used extensively in the analysis of samples from several depletion studies and it was determined to be robust and there were no critical control points identified in the procedure.
Confirmation of monepantel sulphone residues was conducted on a separate LC-MS/MS system. The LC-MS/MS system was a gradient system with increasing concentrations of acetonitrile in water, on an Atlantis T3 (C18 silica, 3 μm) column. In the enhanced product ion mode, the specific m/z ions at 487 and 186 were monitored. Analytical Procedure 272B.00 was validated under GLP conditions.
The performance characteristics of the method including selectivity, accuracy and precision, stability of analyte in solution and under frozen storage conditions, LOD and LOQ were validated as follows.
SelectivityNumerous drug-free control samples of each tissue type were tested and no interferences were observed at the specified retention time. Similarly, a range of commonly used drugs approved for use in sheep (or their metabolites) were tested, and no interferences were observed. Of the metabolites derived from monepantel, only the parent itself was tested and did not co-elute. The only other major metabolites known to occur in sheep tissues (G32 and sulphoxide M1) will not interfere as their retention differs sufficiently on a C18 column, as demonstrated in the pivotal sheep ADME study. The

126
method is not stereo-specific, so the enantiomer of monepantel sulphone would be detected, but the ADME study demonstrated that racemization does not occur.
Accuracy and precisionPrecision and accuracy of the method was tested by analysing batches of 6 replicates at different levels encompassing 0.5 × MRL and 2 × MRL. Mean accuracies were acceptable, within -30 ± 10%. Precision, measured as %CV, were 12% or less for fortifications at 50 μg/kg or higher. Within-laboratory reproducibility was assessed by comparing results obtained by two analysts, each completing a batch of 6 replicates at 10 μg/kg (with SPE) and 50 μg/kg (without SPE) for each tissue type. Mean recoveries were within 9% of each other at 50 μg/kg and within 25% at 10 μg/kg.
Limit of detection (LOD) and limit of quantitation (LOQ)The calculated LODs and LOQs are based on analyses of drug-free samples. The LODs for the regulatory method option (without SPE cleanup) were 23, 22, 6 and 8 g/kg for fat, liver, kidney and muscle tissue, respectively. The corresponding LOQs were 51, 56, 13 and 15 μg/kg. For the more sensitive method option that uses an additional SPE cleanup, the LODs were 6, 4, 5 and 5 μg/kg in fat, liver, kidney, and muscle tissues, respectively. The corresponding LOQs were 15, 7, 14 and 10 μg/kg, respectively.
Stability The stock solution of monepantel sulphone in acetonitrile was stable for 12 months (Karadzovska, 2007g). The corresponding fortification and calibration solutions were also stable for 6 months. The primary extract of tissue samples was stable for 7 days when stored in a refrigerator. Prepared HPLC extracts were stable after 24 h storage at room temperature. A GLP-compliant study investigating the stability of incurred samples under freezer storage conditions, room temperature storage and freeze-thaw (3 cycles) was reviewed. Triplicates of each sample were stored under each of the conditions, and then analysed by the above method (without SPE). After 3 cycles of freeze-thaw, incurred residues of monepantel sulphone were within 94–100% of initial values. After 4 h storage at room temperature, results were within 97–107% of initial values. Samples under freezer storage (-20°C) were analysed after 1.5, 3 and 6 months storage. For liver and fat, there was no change in residue values, but for kidney there was a small decrease (17%) after 6 months storage. Muscle was stable under long-term freezer storage conditions for 1 year.
Analytical method for monepantel and its sulphone in blood As numerous studies involved analysis of blood samples, the sponsor developed and validated an analytical method for sheep blood (Karadzovska, 2007h; Browning and Karadzovska, 2008). A 0.5 mlaliquot of blood, with anti-coagulant, was extracted with acetonitrile (1.3 ml) and water (0.5 ml) and,following centrifugation, the extract was diluted with water and cleaned-up on a polymeric SPE cartridge. The eluate was evaporated and re-dissolved in mobile phase for HPLC quantification, using the same system as the tissue method, except that a separate switch for monepantel was performed within the same run. The estimated LODs were 0.5 and 0.7 ng/ml for monepantel and its sulphonerespectively. The LOQs of 3 ng/ml for each analyte were validated with at least 6 replicate samples showing acceptable accuracy and precision. The method was validated in the range 3 to 1000 ng/ml for both analytes with fortified samples. Accuracy and precision (both repeatability and within-laboratory reproducibility) were excellent. Solutions of the analytes in solvent or mobile phase were stable for 6 months or longer. Prepared blood samples for HPLC injection were stable after storage overnight at room temperature. Blood samples, both fortified and incurred, were stable under 3 cycles of freeze-thaw, after storage at room temperature for 4 h, and after 4 months storage in the freezer (-20°C).
The version of the validated analytical method without SPE, described above, with a LOQ of 50 μg/kg (Browning, 2010), was determined to be a suitable regulatory control method. In addition, a validated LC-MS/MS method is available to confirm the presence of monepantel sulphone residues at the LOQ of 50 μg/kg.

127
APPRAISAL
Monepantel has not previously been evaluated by the Committee. Monepantel was included in the agenda for the current meeting of the Committee at the request of the 19th Session of the CCRVDF. Monepantel is an anthelmintic of the amino-acetonitrile derivative class indicated for the treatment of nematodes in sheep. The recommended dose is 2.5 mg/kg bw and the maximum dose used is 3.75 mg/kg bw.
Data from two pharmacokinetic GLP-compliant studies were available, one with i.v. administration and another as an oral drench. In both studies, blood samples were collected up to 28 days post-dose. Monepantel and monepantel sulphone concentrations in blood were quantified by a validated HPLC method. In blood and plasma, monepantel concentration decreased rapidly after i.v. administration and was detected until 48 h. Monepantel sulphone concentrations declined in blood and were quantified during 4 days. The oral bio-availability of monepantel was 31%. The area under the curve of monepantel sulphone concentrations obtained after oral administration of monepantel at a dose of 1 mg/kg bw was similar to the value obtained from those given i.v. administration of monepantel sulphone, demonstrating a first-pass effect and complete absorption of the oral dose of monepantel.
In an ADME and residue depletion GLP-compliant study with a single oral dose of 14C-monepantel as a 2.5% (w/v) solution was administered to sheep. Approximately 50% of the administered radio-activity was recovered in faeces and 30% in urine after 14 days. Two different positions of the [14C] labelling in monepantel were used to assess other possible modes of metabolism for the compound. The position of the radiolabel on either ring did not influence the interpretation of the total radio-activity or the metabolic profiling in tissue and excreta. The metabolite profile was analysed and metabolites identified. Monepantel was metabolized to a sulphoxide and a sulphone, identified as the predominant metabolites. A second metabolite pathway involved cleavage to yield the phenol metabolite together with its sulphate conjugate. Monepantel sulphone was the major metabolite found in blood and tissue and represented 100% of radioactivity in blood. Fat was the tissue with the highest concentration of radioactivity followed by liver, kidney and muscle. The approximate total radioactive residue proportions were 10 (fat): 5 (liver): 2 (kidney): 1 (muscle).
In the ADME and residue depletion GLP-compliant study, monepantel and monepantel sulphonewere quantified in tissue using a validated HPLC/UV method with a chiral column and a LOQ of 50 μg/kg, and the results were compared. The concentrations of radiolabelled monepantel in the tissue matrices decreased in the order: fat > liver > kidney > muscle. The corresponding concentrations ofmonepantel sulphone residues decreased in the same order. Total radioactive residue (TRR) expressed as monepantel-equivalent were compared with monepantel and monepantel sulphone tissue concentrations at different time points from 2 to 35 days to calculate the ratio of marker residue and TRR. The ratio of the mean concentration of the marker residue and that of the total residue was calculated as 1 for muscle and 0.66 for fat, liver and kidney.
Three depletion studies were evaluated: one using Suffolk lambs; the second using cross-bred lambs (Merino × Dorset); and the third using Merino sheep. In each study, sheep were administered monepantel at 3.8–3.9 mg/kg bw using the same general study design. Animals were sacrificed at 7, 18, 29, 35, 70, 120 and 127 days after treatment. Residue concentration data from the three single-dose administration studies were statistically compared. An analysis of variance study of the data indicated that there was no significant difference in observed residues amongst the 3 studies at the significance level of 5%. Therefore, the 3 data sets were pooled and used for the estimated daily intake analysis. The median concentration of monepantel sulphone measured in the animal tissues seven days post-dose were 2 620 μg/kg in fat, 1 295 μg/kg in liver, 406 μg/kg in kidney and 152 μg/kg in muscle.
Using the combined data from the three single oral dose monepantel administration studies, the upper one-sided 95% confidence limit over the 95th percentile of residue concentrations was calculated for each edible tissue. The ratio of the mean concentration of the marker residue to that of the TRR was calculated as 1.0 for muscle and 0.66 for fat, liver and kidney. The estimated daily intake (EDI) for monepantel was calculated after applying a correction factor of 0.94 to account for the mass difference between monepantel sulphone (the marker residue) and monepantel (See Figure 5.4). The

128
time point at which the MRLs were recommended was based on an EDI < ADI approach described in the report of the 66th meeting of the Committee (FAO/WHO, 2006).

129
Figure 5.4. Monepantel sulphone residue depletion curves after oral administration of monepantel to sheep (combined data). Median and Upper 95/95 Tolerance Limit (UTL). NOTE: In the liver figure, the Y-axis is monepantel sulphone (μg/kg) and X- axis is time (days).
A validated HPLC/UV method was available and was used for the analysis of incurred residues of monepantel as its sulphone metabolite in edible sheep tissues. The method provided fit for purpose performances for muscle, kidney, liver and fat samples. Concentrations in tissue samples were determined by reference to non-matrix-matched, external standard calibration curves and can be used for the regulatory monitoring of residues of monepantel and monepantel sulphone in edible tissues. Additionally, a validated LC-MS/MS method suitable for confirming the analytes at 50 μg/kg was available.

130
MAXIMUM RESIDUE LIMITS
In recommending MRLs for monepantel in sheep, the Committee considered the following factors: Monepantel is registered for use in sheep at a maximum recommended single oral dose of 3.75 mg/kg bw.An ADI of monepantel 0–20 μg/kg bw was established by the Committee, corresponding to an upper bound of acceptable intakes of 1200 μg/day for a 60 kg person.Monepantel is extensively metabolized.Monepantel sulphone is the marker residue in tissues.Fat contains the highest concentration of monepantel sulphone at all sampling times, followed by liver, then kidney and muscle. Liver and fat can serve as the target tissues.The ratios of the concentration of marker residue to total residues are 1.0 in muscle and 0.66 in fat, liver and kidney.Residue data evaluated were determined with a validated analytical method to quantify monepantel sulphone in tissue.A validated analytical method for the determination of monepantel sulphone in edible sheep tissues (liver, kidney, muscle and fat) is available and may be used for monitoring purposes. MRLs were calculated on the basis of the upper limit of the one-sided 95% confidence interval over the 95th percentile of residue concentrations.The time point at which the MRLs were set was based on an EDI < ADI approach described in the 66th meeting of the Committee.No data are provided for sheep milk.
The Committee recommended MRLs determined as monepantel sulphone in sheep tissue at 300 μg/kg in muscle, 700 μg/kg in kidney, 3000 μg/kg in liver and 5500 μg/kg in fat. Using the model diet and marker to total residue of 1 for muscle and 0.66 for fat, liver and kidney, and after applying a correction factor of 0.94 to account for the mass difference between monepantel sulphone (the marker residue) and monepantel, the EDI is 201 μg/person per day, which represents 17% of the upper bound of the ADI.

131
REFERENCES
Browning, A. 2010. Amendment A to Analytical Procedure No 272B.01 Regulatory method for the determination of AHC-2144670 in sheep tissues by HPLC - extension to goat tissues. Unpublished report from Novartis Animal Health Australasia Pty Ltd. vol. 07, p. 191.
Browning, A. & Karadzovska, D. 2008. Regulatory method for determination of AHC-2144670 in sheep tissue by HPLC. Unpublished report from Novartis Animal Health Australasia Pty. Ltd. Analytical procedure No. 272B.01.
FAO/WHO. 2006. Evaluation of certain veterinary drug residues in animals and foods. Sixty-sixth report of the Joint FAO/WHO Expert Committee on Food Additives. WHO Technical Report Series, No. 939.
Jung, M. 2006. Pilot ADME study of [14C]AHC 2102225 in sheep. Unpublished report from Novartis. Novartis Centre de Recherché Sante Animale, Switzerland. Study Report No. CRA 05/051, vol. 03, p. 3.
Jung, M., McLellan, G., Karadzovska, D. & Strehlau, G. 2007. ADME and residue depletion study of [14C]AHC 2102225 in sheep. Study Report No. CRA 05/15, vol. 03, p. 99.
Karadzovska, D. 2007a. Validation of the analytical procedure 272A.00 for the determination of AHC-2102225and AHC-2144670 in sheep blood. Unpublished report from Novartis Animal Health Australasia Pty Ltd. Study Y06/53, Report Y06/53/2075, vol. 07, p. 83.
Karadzovska, D. 2007b. Validation of a HPLC-UV Analytical Method (Procedure 272B.00) for the determination of AHC-2144670 in sheep tissues. Unpublished report from Novartis Animal Health Australasia Pty. Ltd. Study Y07/38, Report Y07/38/2166, vol. 06, p. 230.
Karadzovska, D. 2007c. Determination of pharmacokinetic parameters of AHC-2102225 and AHC-2144670 in sheep following i.v. and oral administration of AHC-2102225 and i.v. administration of AHC-2144670. Unpublished report from Novartis Animal Health Australasia Pty. Ltd. Study Y06/72, Report Y06/72/2159,vol. 05, p. 3. Later published as Karadzovska, D., Seewald, W., Browning, A., Smal, M., Bouvier, J. & Giraudel, J.M. 2009. Pharmacokinetics of monepantel and its sulfone metabolite, monepantel sulfone, after intravenous and oral administration in sheep. Journal of Veterinary Pharmacology and Therapeutics,32(4): 359–367.
Karadzovska, D. 2007d. Residues of AHC-2102225 in edible tissues of Suffolk sheep following a single oral dose of AHC-2102225 at 3.75 mg/kg. Unpublished report from Novartis Animal Health Australasia Pty. Ltd. Study Y07/21, Report Y07/21/2154, vol. 06, p. 3.
Karadzovska, D. 2007e. Residues of AHC-2102225 in edible tissues of cross-bred fattening lambs following a single oral dose of AHC-2102225 at 3.75 mg/kg. Unpublished report from Novartis Animal Health Australasia Pty. Ltd. Study Y07/17, Report Y07/17/2157, vol 06, p. 59.
Karadzovska, D. 2007f. Residues of AHC-2102225 in edible tissues of Merino sheep following a single oral dose of AHC-2102225 at 3.75 mg/kg. Unpublished report from Novartis Animal Health Australasia Pty. Ltd. Study Y07/16, Report Y07/16/2158, vol.06, p. 120.
Karadzovska, D. 2007g. Stability of incurred AHC-2102225 residues in sheep tissues. Unpublished report from Novartis Animal Health Australasia Pty. Ltd. Study Y06/78, Report Y06/78/2138, vol. 07, p. 59.
Karadzovska, D. 2007h. Validation of the analytical procedure 272A.00 for the determination of AHC-2102225and AHC-2144670 in sheep blood. Unpublished report from Novartis Animal Health Australasia Pty Ltd. Study Y06/53, Report Y06/53/2075.
Strehlau, G. 2007. Residues of AHC-2102225 in edible tissues of sheep of different breeds following a single oral dose of AHC-2102225 at 3.75 mg/kg. Unpublished report from Novartis Animal Health Inc, Switzerland. Statistical report of studies Y07/16, Y07/17 & Y07/21, vol. 06, p. 182.
Smal, M. 2007. Tissue residues following repeated oral administration of AHC 2102225. Unpublished report from Novartis Animal Health Australasia Pty. Ltd. Study Y06/93, Report Y06/93/2141, vol. 06, p. 204.


NarasinFirst draft prepared by
Bruno Le Bizec, Nantes, Franceand
Richard Ellis, Myrtle Beach, USA
Addendum to the monograph prepared by the 70th meeting of the Committeeand published in FAO JECFA Monographs 6
IDENTITY
International Non-proprietary names (INN): NarasinSynonyms: (4s)-4-methylsalinomycin, Narasin A, Monteban®, Naravin®IUPAC Names: -ethyl-6-[5-[2-(5 ethyltetrahydro-5-hydroxy-6-methyl-2H-pyran-2-yl)-15-hydroxy-
2, 10, 12-trimethyl-1, 6, 8-trioxadispiro [4.1.5.3] pentadec-13-en-9-yl]-2-hydroxy-1, 3-dimethyl-4oxoheptyl] tetrahydro-3,5-dimethyl-2H-pyran-2-acetic acid.
Chemical Abstract Service Number: 55134-13-9Molecular formula of Narasin A: C43H72O11
Molecular mass: 765 g/mol
BACKGROUND
The Committee evaluated the residue safety of narasin in multiple species of food animals at its 70thmeeting (FAO, 2009). In the evaluation, the Committee considered narasin A (shown above) to be a suitable marker residue for narasin in animal tissues of cattle, pigs and chickens. At that time, the Committee recommended and CCRVDF concurred, that MRLs for narasin A in cattle tissues (15 μg/kg for muscle and kidney tissues and 50 μg/kg for liver and fat tissues) were temporary as the analytical method was not adequately validated. The Committee requested that before re-evaluation of narasin for consideration of permanent MRLs in tissues of cattle, a detailed description of a suitable regulatory method, including its performance characteristics and validation data, be provided by the end of 2010. The sponsor has prepared and submitted detailed reports on a method validation for the determination of narasin A in cattle tissues.

134
The sponsor submitted three documents in support of the method validation for narasin in cattle tissues. The first is a copy of the method formatted according to the ISO 78/2 format. The seconddocument is a report for a GLP-compliant validation study conducted for monensin A and narasin A in cattle tissues. (MacDougall, 2011a). This study report includes data for monensin A and narasin A, however, only the narasin A data is reviewed here. The third document is a validation data summary for two additional fortification levels in muscle and liver (MacDougall, 2011b). This additional work was conducted to correct an error in the original validation protocol whereby the target concentrations for liver and muscle were transposed and did not correspond to the temporary MRLs. The full dataset is not available for these samples, but the data tables have been fully audited by a quality assurance unit for compliance with GLP. The cattle dataset is a subset of an extensive validation programme inconjunction with the AOAC International that will also include validation data for chicken and pig tissues.
ANALYTICAL METHOD
A method for the determination and confirmation of monensin A and narasin A in cattle tissues and milk was validated (MacDougall, 2011a). The laboratory method (Charles River Method Number 1775 Version 1) was reported as written by Charles River Laboratory in Report Appendix 3 of that report. The method was formatted according to the ISO 78/2 format and assigned Version number 1A (Analytical Method Number 1775). Only the narasin data are relevant to this evaluation.
Sample preparation
Muscle, liver or kidney test samples are initially processed from sample material at approximately -20°C. Initial processing involves homogenizing each test sample with dry ice using a food grinder.Samples are allowed to freeze-dry for 24 h at -20°C before weighing 5 ± 0.1 g tissue samples. Test samples are mixed with iso-octane/ethyl acetate (90:10) followed by agitation using four 10 mm steel balls and mixed for 5 minutes in a high-speed tissue homogenizer (900 shakes/min). Samples are centrifuged for 5 minutes at 3000 rpm (g values not reported) at 4°C. Solvent is decanted and the procedure with the high-speed tissue homogenizer is repeated. Combined solvent extracts are mixed with anhydrous sodium sulphate. Dried samples are added to the silica solid phase extraction tubes and eluted with ethyl acetate/methanol (80/20) after pre-treatment of the silica SPE. Extracts are evaporated to dryness under nitrogen, and reconstituted in 1.0 ml methanol for LC-MS-MS analysis. Quantification is from a matrix-matched calibration line and is based on monensin A and narasin A. For fat samples, following treatment with the high-speed tissue homogenizer samples are centrifuged at 4000 rpm for 10 minutes at 20°C, refrigerated at 4°C for approximately 15 minutes, extraction solvent is decanted and the process repeated. The alternative is employed to minimize particulates forming a suspension. Nigercin (C40H67NaO11, mol mass: 746.94) is used as an internal standard. The structure is reported below.
Analytical measurement HPLC separation employs a Phenomenex Aqua®
5 μm C18 150 × 2 mm column with elution at 40°C using a gradient elution mixed phase of 0.1% formic acid in water (mobile phase A) and 0.1% formic acid in acetonitrile (mobile phase B). The autosampler is maintained at 4°C and the injection volume is 2 μL. Run time is 10 minutes. The MS-MS analysis employs positive MRM using an electrospray ion source (5500 V). Transitions monitored for quantitative determination of narasin are 787.5 > 431.3 (CE = 67 eV) and confirmation 787.5 > 531.3 (CE = 60 eV) and 787.5 > 279.2 (CE = 73 eV). For the internal standard, nigercin, the transition monitored is 746.6 > 729.6 (CE = 55 eV). The latter is not highly specific (loss of –OH). A splitter system may be used as appropriate to ensure the detector source remains cleaner.
Nigercin

135
Method performanceSystem suitability was demonstrated based upon column efficiency, peak width at half height, tailing factor and system precision for each test item. System linearity was demonstrated over the range of 0.5to 100 μg/kg (all tissues) for matrix-match calibration standards prepared in extracted control samples for each matrix. The accuracy (percent recovery) and precision (CV) determined for three sets of six replicate determinations at three levels are summarized in Table 6.1.
Table 6.1. Accuracy (percent recovery) and precision (CV) for determination of narasin A in cattle tissues at the LOQ (0.75 μg/kg in muscle, liver and kidney; 1.0 μg/kg fat)
Matrix Narasin A Mean (n = 6)% Recovery (CV%)Muscle 75.4 (2.88)Liver 93.9 (6.23)Kidney 96.4 (5.37)Fat 88.2 (2.44)
The inter-day assay accuracy and precision was determined for each matrix at their respective ½MRL, MRL and 2MRL levels on three occasions. However, the fortification levels for liver and muscle were transposed during the validation. Additional fortification levels were subsequently validated in a separate study (See below, MacDougall, 2011b). The recoveries and precision (CV) are summarized in Table 6.2.
Table 6.2. Inter-day assay accuracy and precision for the determination of narasin A in cattle tissues on three occasions
MatrixTemp MRL(2)
(μg/kg)
½ × MRL(1) MRL(1) 2 × MRL(1)
Mean% Recovery (CV%) Mean% Recovery (CV%) Mean% Recovery (CV%)
Muscle 15 (50) 1 97.8 (5.85) 96.2 (6.65) 99.7 (5.40)Liver 50 (15) 1 93.0 (9.55) 95.5 (7.70) 99.4 (5.85)Kidney 15 87.8 (7.07) 87.2 (6.63) 86.6 (5.92)Fat 50 81.6 (7.82) 82.0 (6.80) 84.9 (6.55)
NOTES: (1) Fortification levels for liver and muscle were transposed; parenthetical value was actually fortified instead of the MRL. (2) Recommended temporary MRLs at 70th meeting of the Committee.
The assay limit of detection (LOD) and limit of quantitation (LOQ) were determined for narasin Ain each matrix, as summarized in Table 6.3.
Table 6.3. Assay limits of detection (LOD) and quantitation (LOQ) demonstrated in tissues fortified with narasin A
MatrixNarasin A
Ratio LOQ/LODLOD (μg/kg) LOQ (μg/kg)
Muscle 0.019 0.75 39.5Liver 0.038 0.75 19.7Kidney 0.026 0.75 28.8Fat 0.151 1.00 6.6
NOTES: Values are rounded

136
Supplemental validation data for an analytical method for the determination of narasin A in bovine liver, and muscle by LC-MS/MS. Quality assurance verifiedAs noted above, during the original validation study for cattle tissues (MacDougall, 2011a), the tissue concentrations for the method validation for liver and muscle were transposed, resulting in the incorrect validation range for concentrations of narasin A (See Table 6.2). Additional liver and muscle control samples were fortified and analysed for narasin A using the same method reported in MacDougall, 2011a. The data in the Tables 6.4 and 6.5 summarize the individual data sets for narasin A employing the correct concentrations and provides the intra-day and inter-day accuracy and precision calculations (MacDougall, 2011b).

137
Table 6.4. Intra-day and inter-day assay accuracy and precision for the determination of narasin A in cattle liver on three independent replicates. (MacDougall, 2011b)
Narasin fortification
Analysis 1 Analysis 2 Analysis 3 Inter-day statistics
μg/kg Recovery (%) μg/kg Recove
ry (%) μg/kg Recovery (%)
Meanμg/kg
Recovery
(%)sr
(μg/kg)RSDr
%
25 μg/kg
21.1 84.4 21.0 84.0 20.0 80.0
20.9 83.8 1.3 6.1
18.0 72.0 22.2 88.8 20.6 82.419.6 78.4 22.5 90.0 19.0 76.022.0 88.0 21.2 84.8 21.5 86.020.9 83.6 21.3 85.2 22.8 91.222.6 90.4 20.8 83.2 19.9 79.6
Mean 20.7 82.8 21.5 86.0 20.6 82.5sr 1.67 0.687 1.35RSDr 8.08 3.20 6.52
50 μg/kg
37.5 75.0 42.8 85.6 43.1 86.2
42.4 84.7 3.4 8.1
44.6 89.2 42.0 84.0 44.9 89.834.8 69.6 39.3 78.6 45.8 91.638.3 76.6 43.9 87.8 46.1 92.242.0 84.0 44.0 88.0 44.9 89.837.8 75.6 44.3 88.6 46.5 93.0
Mean 39.2 78.3 42.7 85.4 45.2 90.4sr 3.52 1.88 1.22RSDr 8.99 4.41 2.70
100 μg/kg
79.5 79.5 86.8 86.8 107 107.0
89.2 89.2 7.2 8.1
90.1 90.1 88.4 88.4 97.7 97.785.5 85.5 82.2 82.2 91.5 91.594.7 94.7 91.7 91.7 87.6 87.685.9 85.9 83.0 83.0 99.9 99.978.3 78.3 86.5 86.5 88.9 88.9
Mean 85.7 85.7 86.4 86.4 95.4 95.4sr 6.22 3.51 7.46RSDr 7.26 4.06 7.82
NOTES: sr = Standard Deviation. RSD = Reproducability standard deviation

138
Table 6.5. Intra-day and inter-day assay accuracy and precision for the determination of narasin A in cattle muscle on three independent replicates. (MacDougall, 2011b)
Narasin fortifi-cation (μg/kg)
Analysis 1 Analysis 2 Analysis 3 Inter-day statistics
μg/kgRecovery(%)
μg/kgRecovery(%)
μg/kgRecovery(%)
Mean(μg/kg
)
Recovery
(%)sr
(μg/kg)RSDr
%
7.5
7.15 95.3 7.18 95.7 6.82 90.9
7.2 96.4 0.4 5.0
7.08 94.4 7.57 100.9 6.54 87.27.01 93.5 7.84 104.5 7.08 94.47.16 95.5 7.74 103.2 7.29 97.27.71 102.8 7.23 96.4 7.17 95.67.17 95.6 7.64 101.9 6.70 89.3
Mean 7.21 96.2 7.53 100.4 6.93 92.4sr 0.251 0.271 0.292RSDr 3.48 3.59 4.21
15
16.1 107.3 17.0 113.3 12.2 81.3
14.8 98.6 1.6 10.8
13.8 92.0 16.9 112.7 13.2 88.015.4 102.7 17.0 113.3 12.5 83.314.4 96.0 16.1 107.3 13.1 87.314.3 95.3 15.3 102.0 13.1 87.314.7 98.0 16.6 110.7 14.6 97.3
Mean 14.8 98.6 16.5 109.9 13.1 87.4sr 0.833 0.674 0.828RSDr 5.63 4.09 6.31
30
30.2 100.7 33.2 110.7 24.2 80.7
28.7 95.7 2.5 8.8
30.4 101.3 30.6 102.0 26.5 88.327.4 91.3 31.4 104.7 24.7 82.329.3 97.7 30.9 103.0 26.3 87.726.1 87.0 30.9 103.0 28.2 94.028.5 95.0 31.0 103.3 27.2 90.7
Mean 28.7 95.5 31.3 104.4 26.2 87.3sr 1.67 0.950 1.51RSDr 5.84 3.03 5.75
NOTES: sr = Standard Deviation. RSD = Reproducability standard deviation
System suitabilityThe column efficiency, peak width at half height and tailing factor for the test items and internal standards was established. The system precision for reproducibility of response and retention time was determined by replicate injections (n=10) of a standard solution of the test items and internal standard. The precision was defined as the coefficient of variation of the mean value for each parameter.
System linearityThe system linearity was determined by analysing non-extracted matrix-matched standard solutions of known amounts of each test item and the internal standard. Standards were prepared over a range of concentrations of each test item with a fixed concentration of internal standard. The detector response ratio for the test item/internal standard was plotted against the amount injected of the test item to generate a calibration curve. Calculated amounts of the injected standards were determined by using a least squares linear regression analysis with weighting factor of 1/x. The origin was excluded from the

139
regression analysis. The calculated amount injected for each prepared standard was required to be within ±15% of the actual amount injected (±20% at the lower limit of linearity) to define the linear range of the system.
System limit of detectionThe limit of on-column detection (LOOCD) was determined by analysis of solutions of each test item with decreasing concentrations. The LOOCD was defined as the amount injected of each test item that gives a clearly discernible peak, and was at least 3 times greater than the background noise.
Assay limit of quantitationThe limit of quantitation (LOQ) for each test item was determined by the extraction and analysis of replicate aliquots (n=6) of control matrix fortified with decreasing concentrations of each test item,and assaying these samples with the standard method. The target intra-day assay accuracy at the LOQ (defined as the mean percentage measured concentration versus actual concentration) was 70–110%. The precision at each concentration (defined as the CV of the mean concentration) was 20%.
Intra-day assay accuracy and precisionThe assay accuracy and precision was determined by the extraction and analysis of replicate aliquots (n=6) of each matrix fortified with each test item, together with a non-extracted matrix-matched calibration curve series of standard solutions. Samples were prepared at ½MRL, MRL and 2MRL for each matrix. The target intra-day assay accuracy at each concentration (defined as the mean percentage measured concentration versus actual concentration) was 70–110%. The target intra-day assay precision at each concentration (defined as the CV of the mean concentration) was 20%.
Inter-day assay accuracy and precisionThe assay accuracy and precision was determined on three occasions, as detailed for the intra-day assay accuracy and precision. The target inter-day assay accuracy at each concentration (defined as the mean percentage determined concentration/actual concentration of all the replicate samples from all three occasions) was 70–110%. The target inter-day assay precision at each concentration (defined as the CV of the mean requirement concentration) was 20%. To demonstrate the ruggedness of the assay, at least one of the occasions was extracted by a second analyst.
Assay specificityThe specificity of the assay for each test item and the internal standard was examined by extraction and analysis of aliquots of each matrix with and without the addition of the test item. The assay requirement for each test item was “no significant interfering substances >20%” (a very permissive value) of peak area at LOQ level eluting at the same retention times as the test items or the internal standard. The following analytes were also used to evaluate the potential for interference: penicillin, tylosin, tilmicosin, tetracycline, lasalocid, ceftiofur, ractopamine and ketoprofen. This study was limited to injection of solution standards.
Assay limit of detectionThe assay limit of detection (LOD) was determined by extraction and analysis of 20 aliquots (4 extractions from each of 5 different animals) of the matrix to determine the mean background noise. The LOD was defined as the concentration of each test item equivalent to the mean background noise plus 3 times the standard deviation.
Storage stability at room temperatureStorage stability was demonstrated to be acceptable for each matrix at room temperature (about 4 h) and for extended frozen storage (approximately -20°C) up to 2 months. The stability of samples after three freeze-thaw cycles was demonstrated for each matrix. The stability of extracts stored at about 4°C was shown to be approximately 72 h for each matrix.
The effects of storing samples at room temperature was investigated by preparing replicate matrix samples fortified with each test item at the relative MRL concentrations, followed by storage at room

140
temperature for about 4 h prior to extraction (representative of the actual times necessary to prepare and analyse a batch of samples prior to extraction). To define the reference (initial) concentrations, replicate aliquots (n=6) of the matrix was prepared (fortified with solutions prepared independently from the calibration standard solutions) and assayed. The mean calculated concentration of the replicate samples was determined and was defined as the reference (i.e. 100%) concentration. Acceptance criteria for reference concentration samples were the same as for assay accuracy and precision analysis. The stability of the test items was defined as the mean 4 h post-storage concentration/reference concentration (expressed as a percentage) for that level. The test items were considered to be stable in the matrix at room temperature if the stability was 100 ± 20%.
Freeze-thaw stabilityThe effects of repeatedly freezing and thawing samples were investigated by preparing replicate matrix samples fortified with each test item at the relative MRL, and repeatedly freezing and thawing prior to extraction. To define the reference (initial) concentrations, replicate aliquots (n=6) of the matrix were prepared (fortified with solutions prepared independently from the calibration standard solutions) and assayed. The mean calculated concentration of the replicate samples was determined and defined the initial concentration. Acceptance criteria for reference concentration samples were the same as for assay accuracy and precision analysis.
To determine the freeze-thaw stability of the test item in the matrix, 3 sets of replicate aliquots (n=6) of the matrix were prepared (fortified with solutions prepared independently from the calibration standard solutions). Following fortification of the tissues the samples were stored frozen for a minimum of 24 h. The samples were then thawed until they reach room temperature, and then re-frozen for a minimum of 24 h. Samples were subjected to 1, 2 or 3 freeze-thaw cycles. The samples were assayed together with a non-extracted matrix-match calibration curve and freshly prepared samples at the same fortified fortification level after the appropriate number of cycles.
The stability of each test item for each freeze-thaw cycle was defined as the mean post freeze-thaw concentration/concentration of the fresh extracts expressed as a percentage for that number of cycles. The test items were deemed to be stable in the matrix if the stability was 100 ± 20%.
Autosampler stabilityThe effect of storing extracts of samples was investigated by extracting replicate matrix samples fortified with each test item at the MRL and 2MRL and storing at +4°C for about 72 h prior to analysis. Replicate aliquots (n=6) of the matrix were prepared at each concentration (fortified with solutions prepared independently from the calibration standard solutions) and extracted, together with a non-extracted matrix-matched calibration curve series of standard solutions. The calibration samples and the replicates at each concentration were analysed before being stored at about +4°C for about 72 hprior to analysis. This was representative of the actual times necessary to prepare and analyse a batch of samples and to permit a repeat analysis (without re-extraction), if required, and then assayed. The mean post-storage calculated concentrations of the replicate samples at each level were determined. The stability was defined with respect to the recovery data prior to the circa 72 h storage period. The autosampler storage was considered to be acceptable if the recoveries were 100 ± 20% of the samples analysed immediately.
Solution stabilityThe stability of selected calibration solutions of each test item was investigated by periodically re-preparing standard and QC solutions and analysing them together with a non-extracted calibration series of standards previously prepared. The solutions were deemed to be stable for a period corresponding to difference in time between the preparations of the two sets of standard solutions if the mean accuracy of freshly prepared solutions (defined as the mean percentage determined concentration/actual concentration) was 100 ± 20%.
Extended frozen storage stabilityThe effects of storing samples frozen at about -20°C were investigated by preparing samples fortified with each test item at the MRL in each matrix. Sufficient samples were prepared in each matrix to

141
permit replicate samples (n=6), which were had not been thawed since preparation, to be taken at each time point. To define the reference (initial) concentrations, replicate aliquots (n=6) of the matrix were prepared (fortified with solutions prepared independently from the calibration standard solutions) and assayed. The mean calculated concentration of the replicate samples was determined and was defined as the initial concentration. Acceptance criteria for reference concentration samples were the same as for assay accuracy and precision analysis.
To determine the storage stability of the test item in the matrix at about -20°C after approximately 1 and 2 month frozen storage, replicate samples (n=6) were thawed and assayed together with a non-extracted matrix-match calibration curve and freshly prepared fortified samples. The stability of the test item was defined as the percentage difference between the freshly fortified extracts on each occasion and the time points T=1 and 2 months. The test item was deemed to be stable in the matrix under frozen conditions if the stability was 100 ± 20% of the fresh extracts.
Assay acceptance criteriaFor the analysis of the test items in bovine tissues described above, the following additional criteria were met. The determined concentration for each prepared non-extracted matrix-match (injected at the front and the end of any batch) standard used to construct the calibration curve was within 100 ± 15% of the actual concentration (100 ± 20% at the lower limit of quantitation). At least 75% of the calibration standards met the above criteria.
Statistical analysisStatistical analysis was limited to derivation of means, standard deviations, coefficient of variation and regression parameters.
Means, standard deviations and precisions (CV%).Table 6.6 provides assay limits of quantitation; Tables 6.7–6.10 provide accuracy and precision data in fortified tissues; and Figures 6.1–6.4 describe matrix match calibration lines in control tissue.
Table 6.6. Narasin A assay limits of quantitation
Analyte Fortification level (μg/kg) Recovery (%) Mean recovery (%) CV (%)In MuscleNarasin 0.75 71.9
76.676.577.077.073.5
75.4 2.88
In LiverNarasin 0.75 88.0
86.794.510199.793.7
93.9 6.23
In KidneyNarasin 0.75 101
98.996.798.486.396.8
96.4 5.37
In FatNarasin 1.00 86.1
91.587.6
88.2 2.44

142
89.085.889.3
Table 6.7. Assay accuracy and precision in muscle tissue fortified at 25 μg/kg with Narasin A
Table 6.8. Assay accuracy and precision in liver tissue fortified at 30 μg/kg with Narasin A

143
Table 6.9. Assay accuracy and precision in kidney tissue fortified at 15 μg/kg with Narasin A
Table 6.10. Assay accuracy and precision in fat tissue fortified at 50 μg/kg with Narasin A

144
Figure 6.1. Narasin matrix-match calibration line in control muscle extracts (0.5–100 ng/ml)

145
Figure 6.2. Narasin matrix-match calibration line in control liver extracts (0.5–100 ng/ml)

146
Figure 6.3. Narasin matrix-match calibration line in control kidney extracts (0.5–100 ng/ml)

147
Figure 6.4. Narasin matrix-match calibration line in control fat extracts (0.5–100 ng/ml)

148
APPRAISAL
The 70th meeting of the Committee reported on the availability of screening, quantitative and confirmatory methods for narasin in chicken, pig and cattle tissues that may be appropriate for regulatory control programmes (FAO/WHO, 2009). GLP-compliant screening methods were reported based on extraction followed by thin layer chromatography-bioautography methods (Maruyama andSugimoto, 2000). The bioautography was performed by melting agar over the surface of the TLC plate seeded with Bacillus stearothermophilus var. calidolactis C-953 inoculum. The limit of quantitation(LOQ) was estimated to be 25 μg/kg. Calibration curves showed good linearity within the tested concentrations of 0.1–3.2 mg/kg. However, the accuracy, precision and the limit of detection (LOD) of the assay were not given. In another GLP-compliant screening study (Handy, Thomson and Tamura, 1985), a TLC-bioautographic method, using Bacillus subtilis as the indicator organism, was described. The limit of detection was 5 μg/kg.
A Time-Resolved Fluorescence Immunoassay (TR-FIA) screening method for the detection of narasin was developed in a non-GLP compliant study (Peippo et al., 2004). Muscle tissue extracts were applied to a microtitre well containing an antibody (goat anti-sheep IgG), and an aliquot of unlabelled narasin-transferrin conjugate in a reconstitution buffer. The time resolved fluorescence was measured by a multi-label counter. The LOD of this method was 560 μg/kg, the LOQ was 800 μg/kg. The results of the precision intra-assay and inter-assay were 3.5 and 3.6% (CV) respectively.
Confirmatory methods for narasin were also reported using HPLC methods with UVvis detection using chromatographic analysis post-column derivatization with vanillin reagent that produces a product that absorbs at 520 nm. (Ward et al., 2005; Lacoste and Larvor, 2003). Different authors have described the use of LC coupled to mass spectrometry to determine narasin in edible chicken tissues. The analyses are performed in the positive ion electrospray modes. The mass spectrometric methods are suitable and provide better specificity and sensitivity than do the HPLC-UV methods. Because the methods require only a simple extraction with a short run time (about 12 minutes), large-sample batches (more than 20 samples) can be processed daily.
However, the 70th meeting of the Committee noted that suitable analytical methods have been described for the determination and confirmation of narasin only in edible tissues of chickens and pigs. Residues in cattle could only be determined using a TLC-bioautographic method. This method, while having a reported test sensitivity of 5 μg/kg, had results of residue values reported only as a range (e.g.10–20; 5–10). As a result, only temporary MRLs for cattle were recommended by the Committee using the LOQ values for the HPLC-UV methods.
The sponsor has provided a new GLP-compliant HPLC-MS/MS method. Three documents were submitted in support of the method validation for narasin in cattle tissues: a copy of the method formatted according to the ISO 78/2 format; a report for a GLP-compliant validation conducted for monensin A and narasin A in cattle tissues; and a validation data summary for two additional fortification levels in muscle and liver. This additional work was conducted because the original validation protocol transposed concentrations for liver and muscle temporary MRLs. The full dataset was not available for these samples, but the data tables have been fully audited by a quality assurance unit for compliance with GLP. The cattle dataset is a subset of an extensive validation programme in conjunction with the AOAC International that will include validation data for chicken and pig tissues as well. While not noted in the report, the method has been developed for narasin and monensin in tissues of cattle, chickens and pigs.
The reports document acceptable system suitability, system linearity, accuracy and precision, limits of detection and quantitation, but do not specifically specify the limit of identification, althoughexpected to be consistent with the LOQ. The LOD was determined to be 0.026–0.151 μg/kg for the four primary tissues and the LOQ was determined to be 0.75 μg/kg for muscle, liver and kidney tissues and 1.0 μg/kg for fat tissue. All values are well below the recommended temporary MRLs from the 70th meeting of the Committee. Other performance factors demonstrating method performanceand method validation include intra- and inter-day accuracy and precision performance, analytical specificity with a number of veterinary antibiotic drugs, analyte-fortified storage stability, freeze-thaw

149
and extended frozen storage stability, autosampler stability and solution stability. The method description, reagents, equipment, mass spectrometry settings and conditions are adequately described.Data provided should enable a regulatory laboratory to develop specific quality control and quality assurance documents to support laboratory and regulatory control use.
MAXIMUM RESIDUE LIMITS
In recommending MRLs for narasin in cattle, the Committee considered the following factors:A new GLP-compliant validated HPLC-MS/MS complete with adequate performance factors and method validation was provided that was considered suitable for routine monitoring for narasin A as marker residue.The analytical method has been validated for use in cattle tissues and is also appropriate for chicken and pig tissues.
The 70th meeting of the Committee recommended temporary MRLs of 50 μg/kg for cattle liver and fat, and 15 μg/kg for cattle muscle and kidney, determined as narasin A. The LOQs for the new analytical method for cattle tissues are more than adequate to accommodate the MRLs recommended at the 70th meeting of the Committee for other animal species and tissues.
The Committee recommended full MRLs for narasin of 15 μg/kg for cattle muscle and kidney, and 50 μg/kg for liver and fat tissues, determined as narasin A.
The 70th meeting of the Committee decided not to calculate the Estimated Daily Intake because there were insufficient data points in the residue depletion studies to calculate the median values for residues. Using the model diet and a marker:total residue ratio of 5%, the MRLs recommended above would result in a theoretical maximum daily intake of 255 μg per person per day, which represents approximately 85% of the upper bound of the ADI.

150
REFERENCES
Charles River Laboratory. 2011. Analytical method for the determination of Monensin A and Narasin A in bovine liver, kidney, muscle, fat and Monensin A only in bovine milk by LC-MS/MS. Sponsor submitted.
FAO. 2009. Residue evaluation of certain veterinary drugs. 70th Meeting of the Joint FAO/WHO Expert Committee on Food Additives. FAO JECFA Monographs, 6. See pp. 137–158.
FAO/WHO. 2009. Evaluation of certain veterinary drug residues in food. Seventieth report of the Joint FAO/WHO Expert Committee on Food Additives. WHO Technical Report Series, 954.
Handy, P.R., Thomson, T.D. & Tamura, R.N. 1985. Determination of the depletion of narasin residues in broiler chickens. Agricultural Analytical Chemistry, Lilly Research Laboratories, Division of Eli Lilly and Company, Report Number AAC-8408. Sponsor submitted.
Lacoste, E. & Larvor, A. 2003. Residue study in edible tissues of broiler chickens fed with narasin at 80 ppm for five consecutive days. European Animal Science Research. Elanco Animal Health, Division of Eli Lilly and Company, Report Number T2NAFR0103. Sponsor submitted.
Maruyama, N. & Sugimoto, T. 2000. Narasin residue trial in broiler chicken-I. Research Institute for Animal Science in Biochemistry and Toxicology, Lilly Japan K.K, Division of Eli Lilly and Company, Report Number T2NJA9837. Sponsor submitted.
MacDougall, J. 2011a. Narasin Final Report. Validation of an analytical method for the determination of Monensin A and Narasin A in bovine liver, kidney, muscle, fat and milk by LC-MS/MS. Test Facility Study Number 217751. Report No. 31841. Sponsor submitted.
MacDougall, J. 2011b. Charles River Study 218561. Non-clinical laboratory study (GLP): Single laboratory validation of an analytical method for determination of Monensin and Narasin in tissue and milk by LC-MS/MS. Sponsor submitted.
Peippo, P., Hagren, V., Lovgren, T. & Tuomola, M. 2004. Rapid time-resolved fluoroimmunoassay for the screening of narasin and salinomycin residues in poultry and eggs. Journal of Agricultural and Food Chemistry, 52: 1824–1828.
Ward, T.L., Moran, J.W., Turner, J.M. & Coleman, M.R. 2005. Validation of a method for the determination of narasin in the edible tissues of chickens by liquid chromatography. Journal of AOAC International,88: 95–101. Sponsor submitted.
TriclabendazoleFirst draft prepared by
Dieter Arnold, Berlin, Germany
Addendum to the monographs prepared by the 40th, 66th and 70th Meetings of the Committee and published in FAO Food & Nutrition Paper 41/5 and FAO JECFA Monographs 2 and 6,
respectively
IDENTITY
IUPAC name: 6-chloro-5-(2,3-dichlorophenoxy)-2-methylsulfanyl-1H-benzimidazoleSynonyms: Triclabendazole (common name); CGA 89317, CGP 23030; Proprietary names Fasinex®,
Soforen®, Endex®, Combinex®, Parsifal®, Fasimec®, Genesis®, GenesisTM Ultra®.Structural formula: Benzimidazoles normally undergo an intermolecular proton transfer between N-1 and N-3 in the imidazole ring which at room temperature is very rapid and yields to tautomers (Iddon et al., 1992).Molecular formula: C14H9Cl3N2OSMolecular weight: 359.66 g/mol
OTHER INFORMATION ON IDENTITY AND PROPERTIES
Pure active ingredient: TriclabendazoleAppearance: White crystalline solidMelting point: The melting point of commercial products is frequently given as 175–176°C. This is also the value given in the Merck Index. Another source:(http://www.wolframalpha.com/entities/chemicals/triclabendazole/b0/ve/bh/) reports 177°C. Another form with a melting point of 85–90°C has also been described in the literature (Iddon et al., 1992).Tothadi et al. (2012) describe two anhydrous forms, one consisting of one tautomer only and exhibiting the higher melting point of 177°C and the other consisting of an equimolar mixture of the two tautomers and exhibiting a melting point of 166°C. Solubility: Soluble in tetrahydrofuran, cyclohexanone, acetone, iso- propanol, n-octanol, and methanol; slightly soluble in dichloro-methane, chloroform, toluene, xylene, ethyl acetate; insoluble in water, hexane.Octanol water partition coefficient (POW): 1.75 × 10⁶
UVmax: Approximately 305 nm, depending on solvent (Shrivastava, Kumar and Jain, 2011).
RESIDUES IN FOOD AND THEIR EVALUATION
The Committee has reviewed triclabendazole at its 40th, 66th and 70th meetings (FAO/WHO, 1993, 2006, 2009). At the 40th meeting the Committee established an ADI of 0–3 g/kg bw (0–180 g/day for a 60 kg person) and recommended Maximum Residue Limits expressed as 5-chloro-6-(2’,3’-dichlorophenoxy)-benzimidazole-2-one for muscle, liver, kidney and fat of cattle and sheep. The marker residue on which the MRLs proposed by the 40th meeting were based is produced when
Cl
Cl
O
Cl NH
NS
CH3

152
common fragments of triclabendazole-related residues are hydrolysed under alkaline conditions at 90–100°C. Its concentrations can be converted into triclabendazole equivalents by multiplying with a conversion factor of 1.09. The 66th meeting defined the marker residue as “keto-triclabendazole” and recommended MRLs for muscle, liver, kidney and fat in cattle, sheep and goat. The sponsor correctlydefined the marker residue as “sum of the extractable residues that may be oxidised to keto-triclabendazole”. This definition was also used by the 70th meeting of the Committee: “The marker residue is the sum of all residues extracted and converted to keto-triclabendazole.” On this basis the Committee recommended the MRLs listed in Table 7.1.
Table 7.1 MRLs for triclabendazole recommended by the 70th meeting of the Committee
SpeciesMRL ( g/kg)
Muscle Liver Kidney FatCattle 250 850 400 100Sheep 200 300 200 100
The MRLs in muscle, liver and kidney of both species were derived from the curve describing the upper one-sided 95% confidence limit over the 95th percentile of the residues on day 28 after the last treatment. MRLs for fat were based on twice the LOQ of the analytical method. The MRLs previously recommended by the sixty-sixth meeting of the Committee for triclabendazole for cattle and sheep were withdrawn. As the Committee recommended significantly different MRLs for cattle and sheep,and upon reviewing the limited database for residues in goats, the Committee concluded that there was insufficient data to extend the recommended MRLs for goats. The MRLs for goats recommended at the sixty-sixth meeting of the Committee were withdrawn.
The Committee was requested to review triclabendazole by the 19th session of the CCRVDF, that had raised the specific question: “Can MRLs for goat (tissues) be established by extrapolation considering data used for recommending MRLs for cattle and sheep (tissues).” On the question of data , the CCRVDF had stated: “JECFA has established MRLs for sheep and cattle and extrapolation would be based on the data packages available to the 70th JECFA and literature review to be provided by the United States of America.”
Since the dossier provided for evaluation by the 70th meeting has been extensively reviewed by the Committee, the present addendum focuses mainly on studies possibly suitable to answer the question raised by the CCRVDF. These are primarily studies that could be useful for extrapolation from sheep to goat. Some other available studies performed in cattle and sheep are not reviewed again in the present addendum.
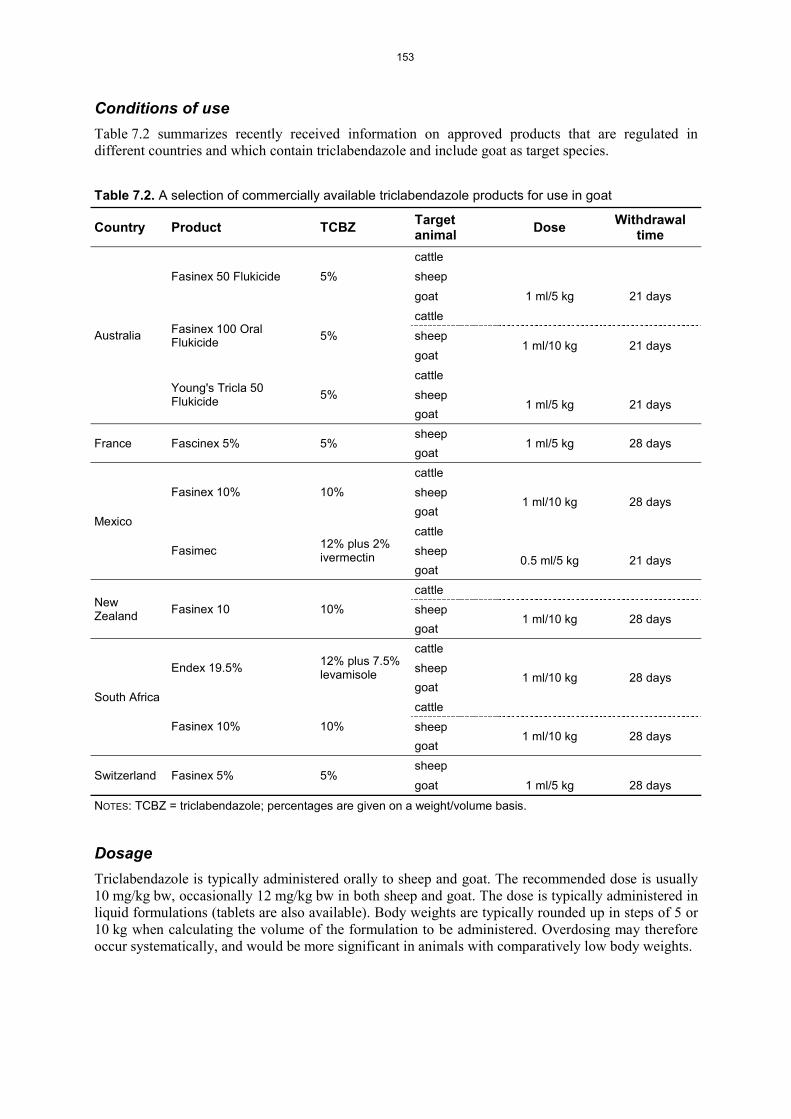
153
Conditions of useTable 7.2 summarizes recently received information on approved products that are regulated in different countries and which contain triclabendazole and include goat as target species.
Table 7.2. A selection of commercially available triclabendazole products for use in goat
Country Product TCBZ Target animal Dose Withdrawal
time
Australia
Fasinex 50 Flukicide 5%cattlesheepgoat 1 ml/5 kg 21 days
Fasinex 100 Oral Flukicide 5%
cattlesheep
1 ml/10 kg 21 daysgoat
Young's Tricla 50 Flukicide 5%
cattlesheep
1 ml/5 kg 21 daysgoat
France Fascinex 5% 5%sheep
1 ml/5 kg 28 daysgoat
Mexico
Fasinex 10% 10%cattlesheep
1 ml/10 kg 28 daysgoat
Fasimec 12% plus 2%ivermectin
cattlesheep
0.5 ml/5 kg 21 daysgoat
New Zealand Fasinex 10 10%
cattlesheep
1 ml/10 kg 28 daysgoat
South Africa
Endex 19.5% 12% plus 7.5% levamisole
cattlesheep
1 ml/10 kg 28 daysgoat
Fasinex 10% 10%cattlesheep
1 ml/10 kg 28 daysgoat
Switzerland Fasinex 5% 5%sheep goat 1 ml/5 kg 28 days
NOTES: TCBZ = triclabendazole; percentages are given on a weight/volume basis.
Dosage Triclabendazole is typically administered orally to sheep and goat. The recommended dose is usually 10 mg/kg bw, occasionally 12 mg/kg bw in both sheep and goat. The dose is typically administered in liquid formulations (tablets are also available). Body weights are typically rounded up in steps of 5 or 10 kg when calculating the volume of the formulation to be administered. Overdosing may therefore occur systematically, and would be more significant in animals with comparatively low body weights.

154
PHARMACOKINETICS AND METABOLISM
The following scheme shows some structures related to triclabendazole (metabolites and conversion products) that will be discussed in subsequent paragraphs.
TCBZ TCBZ-sulphoxide
Cl
Cl
O
Cl NH
NS
CH3 Cl
Cl
O
Cl NH
NS
CH3
O
6-chloro-5-(2,3-dichlorophenoxy)-2-(methylthio)-1H-benzimidazole
6-chloro-5-(2,3-dichlorophenoxy)-2-(methylsulfinyl)-1H-benzimidazole
Molecular Formula = C14H9Cl3N2OS Molecular Formula = C14H9Cl3N2O2SFormula Weight = 359.66 Formula Weight = 375.66Synonyms and abbreviations: CGA 89317 and CGP 23030.
Synonyms and abbreviations: CGA 110752
TCBZ-OH TCBZ-sulphone
Cl
Cl
O
Cl NH
NS
CH3
OH
Cl
Cl
O
Cl NH
NS CH3
O
O
2,3-dichloro-4-{[6-chloro-2-(methylthio)-1H-benzimidazol-5-yl]oxy}phenol
6-chloro-5-(2,3-dichlorophenoxy)-2-(methylsulfonyl)-1H-benzimidazole
Molecular Formula = C14H9Cl3N2O2S Molecular Formula = C14H9Cl3N2O3SFormula Weight = 375.66Synonyms and abbreviations: CGA 161944
Formula Weight = 391.66Synonyms and abbreviations: CGA 110753
Keto-TCBZ TCBZ-thione
Cl
Cl
O
Cl NH
NH
O
Cl
Cl
O
Cl NH
NH
S
5-chloro-6-(2,3-dichlorophenoxy)-1,3-dihydro-2H-benzimidazol-2-one
5-chloro-6-(2,3-dichlorophenoxy)-1,3-dihydro-2H-benzimidazole-2-thione
Molecular Formula = C13H7Cl3N2O2 Molecular Formula = C13H7Cl3N2OSFormula Weight = 329.56 Formula Weight = 345.63Synonyms and abbreviations: CGA 110754 Synonyms and abbreviations: CGA 77336
Food Producing AnimalsThe absorption, distribution, metabolism and excretion are very similar in the laboratory animals and food producing animals studied. A detailed review of the available information was performed by the 70th meeting of the Committee (FAO/WHO, 2009). Some studies are summarized here because the data could be helpful in considerations of between-species extrapolations (sheep and goat).

155
Sheep and goatThe distribution, degradation and excretion of 14C-labelled triclabendazole were studied in a singlefemale sheep (Hamböck and Strittmatter, 1982) and in a single lactating goat (Hamböck and Strittmatter, 1981). The same radiolabel preparation was used in both animals. The kinetic changes of the concentrations of radioactivity in blood, blood cells (only a few samples) and in plasma were measured during a period of 10 days. During the same period excretion in urine and in faeces (and in milk for goat) was determined. Animals were killed 10 days after the treatment and radioactivity was measured in a great number of tissues including, liver, kidney, muscle and fat. The tissues of both animals were also used to characterize the radioactive residues in these tissues (Hamböck, 1982). The metabolic fate of triclabendazole was finally summarized (including results of studies in the rat and analyses of metabolites in urine and faeces of sheep, goat, and rat) and a metabolic pathway was proposed (Hamböck, 1983). Table 7.3 summarizes the conditions of the experiments performed in the sheep and goat.
Table 7.3. Summary of the studies performed in a single sheep and a single goat
Species and breed Animal Age Body
weightProduct
used Formulation Route Dosage
SheepSwiss White Alp × Ile de France
1 female 4 months 28.5 kg14C-CGA
89317Specific activity
7.7 Ci/mg
2 gelatin capsules rinsed with ca.
0.5 L wateroral 10.5 mg/kg b
w
GoatChamoises des Alpes
1 female, lactating
Approx.3 years 42.5 kg
3 gelatin capsules rinsed with ca.
0.5 L wateroral 10.1 mg/kg b
w
Figure 7.1 shows the kinetics of the radioactivity in blood and plasma of the two animals and in milk obtained from the goat. The highest concentrations in plasma were measured in the samples taken 24 h after treatment. Concentrations in sheep plasma were higher than in goat plasma and the rates of distribution and elimination were apparently lower in the sheep.
More than 100% of the administered radioactivity was recovered during the observation period of 240 h. Most of the administered radioactivity was excreted in the faeces. The time course of cumulative recovery from urine and faces is shown in Figure 7.2. The curves were very similar in both animals. Cumulative excretion of the radioactivity is given in Table 7.4.
Table 7.4. Recovery of radioactivity in excreta of a sheep and a goat
AnimalRecovery of radioactivity (% of dose)
Urine Faeces Milk Total recoverySheep 3.54 100.85 104.39Goat 2.12 98.8 0.56 101.48
Faeces and urine pooled from both animals and over the period 0–72 h were analysed for radio-active metabolites of the parent drug. Using a variety of extraction procedures, chromatographic separations, chemical transformations and physical-chemical identification methods, several metabolite fractions could be separated and some of them could be identified. The pattern of metabolites was qualitatively and quantitatively similar in the two animals.
It was concluded that the predominant pathway of biotransformation was the oxidation of the 2-thiomethyl group producing the sulphoxide and the sulphone, and to a limited extent the 2-benzimidazolone. A separate minor oxidative pathway leads to the 4’-hydroxy derivative (Hamböck, 1983). Several groups of authors have studied the metabolic pathways of triclabendazole. Virkel et al.(2006), for example, have shown that both flavin-containing mono-oxygenases (FMO) and cytochromes P450 are involved in the oxidation of triclabendazole in sheep liver. The FMO system is

156
mainly involved in the sulphoxidation. Both enzyme systems participate in similar proportion in the formation of the sulphone.
Figure 7.1. Time course of the changes of concentrations of the radioactivity in some body fluids of a sheep and a goat
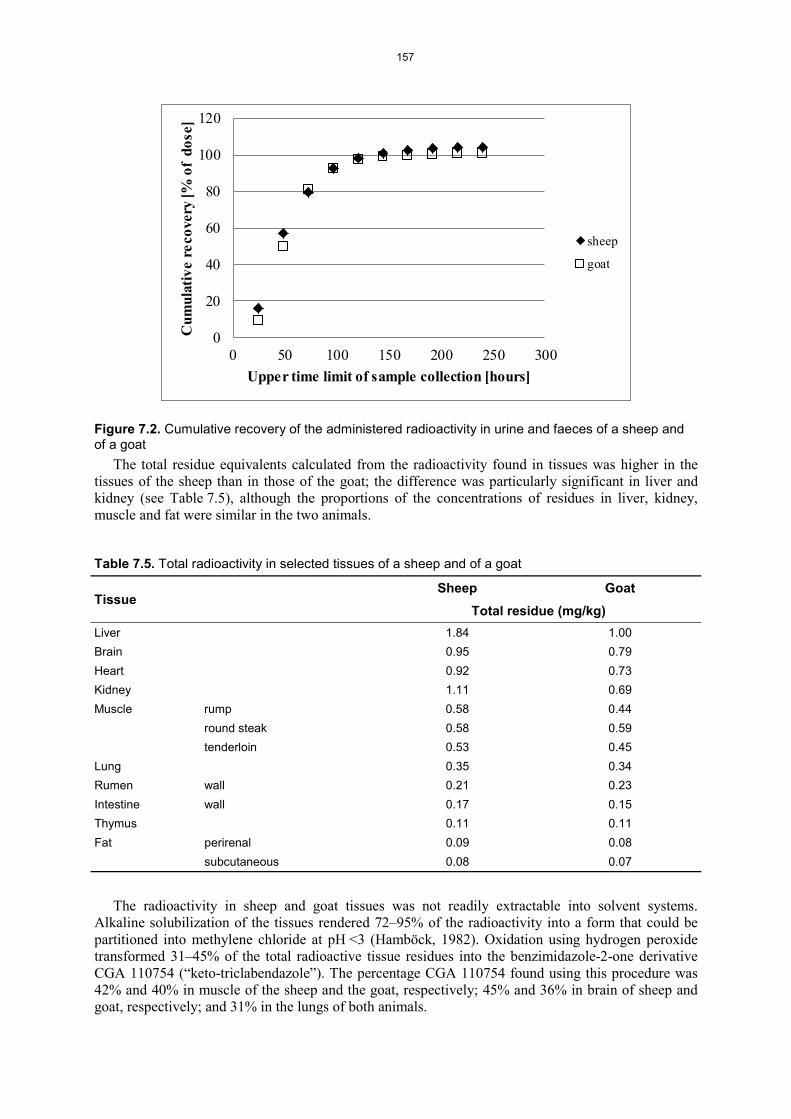
157
Figure 7.2. Cumulative recovery of the administered radioactivity in urine and faeces of a sheep and of a goat
The total residue equivalents calculated from the radioactivity found in tissues was higher in the tissues of the sheep than in those of the goat; the difference was particularly significant in liver and kidney (see Table 7.5), although the proportions of the concentrations of residues in liver, kidney, muscle and fat were similar in the two animals.
Table 7.5. Total radioactivity in selected tissues of a sheep and of a goat
TissueSheep Goat
Total residue (mg/kg)Liver 1.84 1.00Brain 0.95 0.79Heart 0.92 0.73Kidney 1.11 0.69Muscle rump 0.58 0.44
round steak 0.58 0.59tenderloin 0.53 0.45
Lung 0.35 0.34Rumen wall 0.21 0.23Intestine wall 0.17 0.15Thymus 0.11 0.11Fat perirenal 0.09 0.08
subcutaneous 0.08 0.07
The radioactivity in sheep and goat tissues was not readily extractable into solvent systems. Alkaline solubilization of the tissues rendered 72–95% of the radioactivity into a form that could be partitioned into methylene chloride at pH <3 (Hamböck, 1982). Oxidation using hydrogen peroxide transformed 31–45% of the total radioactive tissue residues into the benzimidazole-2-one derivative CGA 110754 (“keto-triclabendazole”). The percentage CGA 110754 found using this procedure was 42% and 40% in muscle of the sheep and the goat, respectively; 45% and 36% in brain of sheep and goat, respectively; and 31% in the lungs of both animals.
0
20
40
60
80
100
120
0 50 100 150 200 250 300
Cum
ulat
ive
reco
very
[% o
f do
se]
Upper time limit of sample collection [hours]
sheep
goat

158
Kinabo and Bogan (1988) studied the pharmacokinetics and efficacy of triclabendazole in normal goats (breed, age and body weight not given) and in goats with induced fascioliasis. The drug was administered orally (12 mg/kg bw). Plasma was collected over a period of seven days. Six weeks later the animals were infected and another six weeks later the kinetic experiment was repeated. Samples were analysed for the parent drug, the sulphoxide and the sulphone. The authors state that the observed differences in kinetic parameters (e.g. lower Cmax, longer tmax, longer terminal half-life in infected animals) were not statistically significant. Although there are some discrepancies between the numerical and the graphical presentation of the data in this publication, it is evident that tmax of the concentration of the sulphone was almost twice as long as tmax of the concentration of the sulphoxide.This finding is consistent with the proposed metabolic sequence. The parent drug was not detected in any sample (LOD = 0.02 g/ml). Qualitatively similar kinetic patterns of the same two metabolites were observed in a study of Sanyal (1994) after intraruminal administration of 10 mg/kg bw of triclabendazole to five goats (breed, age and body weight not given). In this study, a group of five sheep (breed, age and body weight not given) was also treated in the same way. The differences observed in the kinetic parameters of goat and sheep were considered statistically insignificant. A graph of the data shows that the observation period was probably too short to reliably estimate the half-life of the terminal elimination. The best-fitting curves of the computer modelling were not shown. The parent drug was not detected at any time (LOD = 0.02 g/ml).
Gokbulut et al. (2007) found that the type of diet could have statistically significant effects on the kinetic parameters of the sulphoxide and of the sulphone in plasma of goats. The authors used 5–6-month-old goats (breed not given) weighing 15–18 kg. Two groups of six randomly allocated animals (similar mean body weight in each group) were formed. One group was kept indoors and fed concentrate plus hay rations; the other group was grazed outside. Following three weeks during which the groups were kept on their respective diets, all animals were treated orally with 10 mg/kg bw of triclabendazole. Plasma was obtained from blood samples taken up to 192 h after treatment. Parent drug and the sulphoxide and sulphone metabolites were determined, and the concentration vs time curve of each animal was analysed with the WinNonlin (4.1) software. Pharmacokinetic parameters for the two diets were compared by one-way ANOVA and a value of P<0.05 was considered significant. Triclabendazole was found at very low concentrations (tmax 12 h) during the first 20 h after treatment. All estimated parameters of the kinetics of the metabolites were significantly different between the two groups. The sulphoxide reached higher concentrations and was less rapidly metabolized to the sulphone in “indoor” animals. Also, fasting of goats for 24 h before and 6 h after treatment resulted in significantly higher absorption and systemic bio-availability of the drug and its metabolites (Gokbulut et al., 2010).
Pharmacokinetic parameters that were determined in all the above studies are summarized in Table 7.6. The only investigation that compared the pharmacokinetics in sheep and goat (Sanyal,1994) used the intraruminal route for administration (triclabendazole is more typically administered by mouth to sheep and goat). The number of animals used in the study (n=5) was very small for a comparative study. The observation period was too short to adequately cover the terminal elimination (e.g. in the case of the sulphone in sheep plasma, there were only two measurements made after the calculated tmax). The author does not indicate for which time period the AUC was determined. The author used a program “PHARMKIT”. Such a program could not be found in the literature. The model parameters of the non-linear curve fitting are not given. Best fitting curves are not shown in the graph. Individual animal data are not provided, so the results cannot be independently verified. The author stated: “There were no differences in Cmax, tmax, AUC and t1/2 for each metabolite between the groups.” This statement is not plausible in some cases, particularly when variability within a group was very low and differences between groups were rather large (e.g. some AUC values seem to be significantly different). The author also stated: “Comparison between groups were carried out using t-test”. It is not clear how these tests were calculated (e.g. in cases of unequal variances). There are also some discrepancies between the graphical presentation of the results and the calculated parameters. Theresults of the other studies performed with goat showed great variability and dependencies on several factors such as dietary conditions of the investigated animals.
Pharmacokinetic interactions between triclabendazole and other drugs were studied by some groups. Lifschitz et al. (2009) administered triclabendazole and ivermectin intravenously to Corriedale
159
sheep with body weights of 20–30 kg, either alone or in combination. A two-compartment model and the software PK Solution® 2.0 was used for curve fitting. Higher Cmax of the sulphoxide and the sulphone metabolites were observed in the presence of ivermectin.
Triclabendazole was administered intra-ruminally to male Corriedale sheep (14–16 months old, body weight 53.8 ± 2.6 kg, artificially infected with triclabendazole-resistant F. hepatica). No statistically significant changes in the pharmacokinetic behaviour of the metabolites of triclabendazole were seen between a group receiving triclabendazole alone and another group which received ivermectin in addition to triclabendazole, applied by s.c. injection, and methimazole given by i.m. injection (Ceballos et al., 2010). It is difficult to interpret the discrepancies between the results of the two studies because too many potentially influential factors were different in the experimental design. It cannot generally be concluded from the results reported by Ceballos et al. (2010) that ivermectin has no influence on the pharmacokinetics of triclabendazole.
Inhibition of cytochrome P450 enhances the systemic availability of triclabendazole metabolites in sheep (Virkel et al., 2009). The authors carried out pharmacokinetic studies in Corriedale × Merino weaned female lambs (18.6 ± 4.2 kg). Four treatment groups of five animals each were formed and treated intravenously with either triclabendazole alone or in combination with the FMO inhibitor methimazole (MTZ), or the P450 inhibitors piperonyl butoxide (PB) or ketoconazole (KTZ; this substance was administered orally). Pharmacokinetic data analysis was carried out with PK Solution®
2.0. Methamizole, which inhibits the formation of both the sulphoxide and the sulphone in vitro, had no influence under the experimental conditions of the study. Co-administration of PB drastically enhanced the AUC of both the sulphoxide and the sulphone. KTZ is known to inhibit several P450 subspecies. It also enhanced Cmax and AUC of the metabolites in this study.
The variability of the array of parameters listed in Table 7.6 underlines the difficulty of comparingthe results of such studies performed in different laboratories under different experimental conditions. The interesting results of these studies could not be used for between-species extrapolations. At the present time it cannot be excluded that the kinetic behaviour of triclabendazole is different in sheep and goat, and that the drug and/or its metabolites exhibit different kinetic behaviour in certain commercially available combination products.

160
Table 7.6. Summary of pharmacokinetic parameters of metabolites of triclabendazole in sheep and goats
Treatment group Dose Additional
conditionsCmax
(μg/ml)tmax(h)
AUC(μg/h/ml)
Eliminationt½ (h) Source
Triclabendazole sulphoxide (Mean ± s.d.)5 sheep
10 Stall-fed, intraruminal dose
8.59 ±0.50 32.89 ±0.21 682.75 ±2.42 32.37 ±1.72 Sanyal, 19945 goats 10.34 ±0.60 27.82 ±0.38 760.97 ±3.91 32.18 ±1.32
5 goats 12
Not infected 14.88 ±2.0 12.80 ±1.29 606 ±79 22.38 ±0.66 Kinabo andBogan, 1988
Artificially infected 12.99 ±1.2 17.60 ±2.99 490 ±55 23.53 ±3.23
6 goats10
Kept Indoors 13.22 ±2.8 18.40 ±2.19 613 ±137 24.77 ±1.92 Gokbulut et al., 20076 goats Grazing 10.17 ±1.5 14.00 ±2.19 406 ±98 16.16 ±1.17
4 goats10
Fed 6.49 ±1.7 34.00 ±15.14 376.34 ±51.65 26.96 ±14.98 Gokbulut et al., 20104 goats Fasted 12.98 ±5.4 29.00 ±6.00 654.14 ±171.32 20.93 ±3.67
5 sheep5
TCBZ only, i.v. 12.6 ±4.6 2.80 ±1.05 297 ±74.3 16.7 ±4.71 Lifschitz et al., 20095 sheep TCBZ + IVM, i.v. 23.2 ±7.7 1.50 ±0.68 319 ±70.2 10.8 ±1.03
5 sheep
5
TCBZ only, i.v. 12.9 ±4.4 2.80 ±1.05 296.6 ±76(1) 15.6 ±1.77
Virkel et al., 2009
5 sheep TCBZ, KTZ i.v.. 12.0 ±1.1 2.60 ±1.34 253.5 ±96.1 12.2 ±4.275 sheep TCBZ, PB, i.v. 20.9 ±2.7 5.00 ±2.00 592.5 ±145.2 17.8 ±2.00
5 sheep TCBZ i.v., KTZ oral 17.7 ±3.6 4.00 ±3.67 418.7 ±66.4 17.4 ±6.81
Triclabendazole sulphone (Mean ± s.d.)5 sheep
10 Stall-fed, intraruminal dose
7.95 ±0.4 78.1 ±0.22 1449.6 ±3.38 71.7 ±2.13 Sanyal, 19945 goats 10.81 ±0.4 59.08 ±0.24 1356.0 ±6.59 54.18 ±2.89
5-goats12
Not infected 12.37 ±1.2 25.60 ±1.94 730 ±99 19.36 ±1.11 Kinabo and Bogan, 1988
Artificially infected 12.11 ±2.1 34.80 ±5.49 699 ±114 21.80 ±2.29
6 goats10
Kept Indoors 11.66 ±2.5 44.80 ±7.16 890 ±214 29.75 ±1.91 Gokbulut et al., 20076 goats Grazing 15.05 ±4.9 40.00 ±8.76 1108 ±445 21.43 ±2.00
4 goats10
Fed 6.45 ±1.2 56.00 ±11.31 533.93 ±114.05 34.15 ±12.96 Gokbulut et al., 20104 goats Fasted 12.07 ±5.7 52.00 ±4.62 882.93 ±370.26 27.04 ±5.83
5 sheep5
TCBZ only, i.v. 7.00 ±1.8 21.6 ±5.26 438 ±85.8 29.6 ±11.4 Lifschitz et al., 20095 sheep TCBZ + IVM, i.v. 10.4 ±2.1 16.0 ±7.35 489 ±116 16.3 ±2.31
5 sheep
5
TCBZ only, i.v. 7.02 ±1.9 21.6 ±5.37 420.1 ±103.6(2) 24.3 ±5.22
Virkel et al., 2009
5 sheep TCBZ, KTZ i.v. 5.05 ±0.6 21.6 ±10.0 309.1 ±107.3 19.1 ±5.565 sheep TCBZ, PB, i.v. 11.4 ±1.9 30.0 ±6.93 643.0 ±151.2 23.5 ±6.765 sheep TCBZ i.v., KTZ oral 8.32 ±1.8 26.4 ±13.2 517.6 ±166.4 24.7 ±10.1
NOTES; All doses are in mg/kg bw; TCBZ = triclabendazole; IVM = ivermectin; MTZ = methimazole; PB = piperonyl butoxide; KTZ = ketoconazole. (1) All AUC values in this study are for 0–120 h. (2) All AUC values in this study are for 0–144 h.

161
TISSUE RESIDUE DEPLETION STUDIES
Radiolabelled residue depletion studiesSheep and goatNo kinetic residue depletion studies with radiolabelled triclabendazole have been reported. The ratio of marker (keto-triclabendazole) to total residue concentrations can only be estimated from some experiments performed with single animals, including those of the Hamböck studies, and of another very limited study (Ferguson, 1994). In the latter study, two sheep, a 27 kg female and a 33 kg male received a dose of 10 mg/kg bw, orally by syringe and gavage tube. They were terminated 28 days later. The composition of the residues in muscle and liver of the male animal was determined in a separate study. The ratio of marker to total residue concentrations re-calculated from the data was 0.40 for muscle and 0.25 for liver. Table 7.7 summarizes the ratios of marker to total residue concentrations for sheep and goat. Data for bovine animals are added for comparison from the corresponding table of the triclabendazole residue monograph of the 70th meeting of the Committee (FAO, 2009).
Table 7.7. Summary of available information on the ratio of marker to total residue concentrations in ruminants
Animal (sex)
Body weight
Dose (mg/kg bw)
Days after dosing
Ratio of marker to total residue concentrationsLiver Kidney Muscle Fat
1 Calf (m) 96 kg 12 28 0.19 0.24 0.41 No data1 Calf (m) 91 kg 12.55 28 0.24 0.27 0.32 No data1 Sheep (m)
33 kg 10.45 28 0.25 No data 0.4 No data
1 Sheep (f) 28.5 kg 10.5 10 No data No data 0.42 No data1 Goat (f) 42.5 kb 10.1 10 No data No data 0.4 No data
Residue depletion studies with unlabelled drugSheepThe kinetic residue depletion studies carried out with sheep and with unlabelled drug have been described in detail in the residue monograph of the 70th meeting of the Committee (FAO, 2009). The most relevant study for the calculation of MRLs by the 70th meeting of the Committee was the study by Adams (2004). These studies were conducted using a commercial formulation. Using these data, MRLs for liver, kidney and muscle were derived from the curves describing the upper one-sided 95% confidence limits over the 95th percentiles of the concentrations of the marker residue on day 28 after the last treatment. Figure 7.3 shows a modification of a graph published in the residue monograph of the 70th meeting of the Committee. It shows, as an example, the abovementioned tolerance limit curves for liver, kidney and muscle of sheep, as well as the data points for muscle on which the tolerance limit curve was based and, in addition, two single data points available for the marker residue concentration in muscle of a single goat and of a single sheep used in the studies of Hamböck and Strittmatter (1981, 1982) and Hamböck (1982, 1983). These two additional points are within the range of expected concentrations on the basis of the data of the Adams (2004) study.
GoatNo residue depletion study was carried out with the unlabelled drug in goat.

162
Figure 7.3. Selected data and calculated results of the study in comparison with data points on marker residue determination in muscle of a single goat and of a single sheep
ESTIMATION OF DAILY INTAKE
SheepThe 70th meeting of the Committee estimated the daily intake on the basis of the residue concentrations found in tissues of sheep on day 28 after withdrawal of treatment. The median concentration of the marker residue used for the calculation was based on a statistical evaluation of 12 to 21 data points per tissue. The calculated daily total intake of total residue equivalents of triclabendazole was 165 g per person. This corresponds to approximately 92% of the ADI. This would be reduced to 21.5 g per person (less than 12% of the ADI) when the bio-availability of the residues (approximately 13%) is taken into account.
GoatA theoretical estimate of consumption of a standard food basket calculated from the data of Table 7.5would result in intakes of 316 g/day (176% of the ADI) on day 10 after treatment; however, taking the limited bio-availability of the residues into account and using the factor of 0.13 developed by the 70th meeting of the Committee for tissues of cattle on day 28 after treatment (see FAO, 2009), this

163
would be reduced to 41 g/day (equivalent to 23% of the upper bound of the ADI). This estimate is based on one data point per tissue obtained from a study with a radiolabelled, non-commercial product in one single animal. The animal was slaughtered 10 days after treatment.
METHODS OF ANALYSIS FOR RESIDUES IN TISSUES
The 70th meeting of the Committee reviewed available analytical methods according to their performance characteristics and results obtained in validation studies. Three methods were discussed for which the validation data were acceptable (FAO, 2009).
Several additional methods have been published in the open literature since, of which two are relevant. Cai et al. (2010) reported a method for the simultaneous determination of triclabendazole and its metabolites (the sulphoxide, sulphone and keto-triclabendazole) in bovine and goat tissues. The determinative step is based on HPLC-MS/MS with a deuterated triclabendazole internal standard. Validation data are provided. Cheng et al. (2011) published a multi-analyte method for several benzimidazoles, including triclabendazole and its sulphoxide and sulphone metabolites in edible tissues. The determinative step is also based on HPLC-MS/MS with deuterated fenbendazole as the internal standard. Validation data for several tissues were provided.
APPRAISAL
The 19th Session of the Codex Committee on Residues of Veterinary Drugs in Foods (CCRVDF) asked the question: “Can MRLs for goat (tissues) be established by extrapolation considering data used for recommending MRLs for cattle and sheep (tissues)”. CCRVDF also noted that “JECFA has established MRLs for sheep and cattle and extrapolation would be based on the data packages available to the 70th JECFA and a literature review to be provided by the United States of America.”
The sponsor of the dossier for the 70th JECFA re-submitted that information, together with an addendum to the expert report of 17 August 2005. The author of the addendum carried out a literature search with the keyword “triclabendazole” covering the period from January 2004 to 27 October 2010. No other literature review was received. The Committee extended the literature search to cover the period until 25 October 2011.
The Committee specifically re-evaluated pharmacokinetic, metabolism and residue data from the 40th, 66th, and 70th meetings that were considered relevant for possibly providing an answer to the question raised by CCRVDF, provided that linking data were found enabling between-species extrapolations. Some kinetic studies performed in cattle were not re-evaluated because it was unlikely to extrapolate from the kinetic residue data obtained with this species to the goat. The 70th meeting of the Committee had already concluded “that the kinetic behaviour of triclabendazole was distinctly different in cattle and sheep and that there was no basis for establishing MRLs of identical numerical values for the two species”. However, many products used in sheep are also recommended for use in goat and the recommended doses are typically the same (with few exceptions, more or less uniformly, oral doses of 10 mg/kg bw). Therefore, it was important to examine the possibility to extrapolate from kinetic residue data obtained in sheep to goat.
No state-of-the-art comparative pharmacokinetic study conducted in the same laboratory and using a commercial product or equivalent formulation in a sufficient number of animals of both species of animal was available.
The complex comparative study carried out with radiolabelled triclabendazole and one single animal of both species (approximately 30 years ago) was of limited value. The cumulative excretion pattern of the radioactivity was very similar in both animals in that study and the metabolites identified were the same. However, these are insufficient criteria to conclude that residue kinetics would also be the same or quantitatively similar. Only about 2.4% of the administered radioactivity was calculated to be present in blood and tissues of the goat. Kinetics in plasma of the radioactivity was qualitatively similar in the treated goat and the treated sheep; however, they were quantitatively different. Radio-

164
activity in most tissues was significantly different in the two animals, with higher concentrations found in the sheep. Whether this is a representative finding cannot be judged on the basis of a single treated animal. In the goat, the ratio of marker residue concentration to total residue concentration is only known for muscle of one animal.
Taking together all available data from all studies, two tissues of sheep and three tissues of goat are not covered by such a ratio, and therefore a full comparison between the two species cannot be made. All known figures are based on observations in one or two animals and the time points for which they are known are partly different for sheep and goat (28 and 10 days, respectively); variability and time trends are not known, except that for muscle the numerical values obtained for calves and sheep on day 28 in another study were similar to those obtained in sheep and goat on day 10 after treatment.
As the report of the 70th meeting has explained, the modelling of dietary intake of residues present in sheep tissues could only be conducted at day 28 after treatment, that being the only day when theratio of the marker residue concentration to total residue concentration was known for two tissues. In the case of the goat, this ratio is only known for muscle and at day 10 after treatment.
The results of modelling performed by the 70th meeting have shown that the bio-availability of residues must be taken into account. The factor developed by the 70th meeting for incurred residues in liver of cattle (13%) would need to be re-applied for all tissues of the three ruminants in the absence of complete data for the other tissues and species.
For recommending MRLs for goat, the procedure adopted at the 66th meeting of the Committee could not be used, because of the absence of all necessary data except the ratio of marker to total residue concentrations in muscle of a single goat slaughtered on day 10 after treatment.
MAXIMUM RESIDUE LIMITS
The procedure for deriving MRLs adopted at the 66th meeting of the Committee could not be used, because the necessary data were not available. The Committee concluded that the available database on the residues of triclabendazole in goat did not allow a scientifically justifiable extrapolation of MRLs to this species of animal. The Committee recommended that the criteria described should be met and the corresponding data provided before triclabendazole is proposed for re-evaluation with the aim of obtaining MRLs based on extrapolations between species
REFERENCES
Adams, S. 2004. Tissue residues of triclabendazole, measured as CGA 110754, in sheep following oral dosing with Fasinex 5%. Novartis Animal Health Australasia Pty Ltd, Report No 04/07/1894, Study Y04/22.
Cai, C., Zhang, L., Xue, F., Qiu, M. & Zheng, W. 2010. Simultaneous determination of triclabendazole and its metabolites in bovines and goat tissues by liquid chromatography-tandem mass spectrometry. Journal ofChromatography B, 878: 3106–3112.
Ceballos, L., Moreno, L., Alvarez, L., Shaw, L., Fairweather, I. & Lanusse, C. 2010. Unchanged triclabendazole kinetics after co-administration with ivermectin and methimazole: failure of its therapeutic activity against triclabendazole-resistant liver flukes. BMC Veterinary Research, 3 February 2010: 6–8.
Cheng, D., Tao, Y., Zhang, H., Pan, Y., Liu, Z., Huang, L., Wang, Y., Peng, D., Wang, X., Dai, M. & Yan, Z. 2011. Development of a liquid chromatography-tandem mass spectrometry with pressurized liquid extraction method for the determination of benzimidazole residues in edible tissues. Journal of Chroma-tography B, 879: 1659–1667.
FAO. 1993. Residues of some veterinary drugs in animals and foods. FAO Food and Nutrition Paper, 41/5:63–86.
FAO. 2006. Residue evaluation of certain veterinary drugs. FAO JECFA Monographs, 2: 71–88.FAO. 2009. Residue evaluation of certain veterinary drugs. FAO JECFA Monographs, 6: 197–242. FAO/WHO. 1993. Evaluation of certain veterinary drug residues in food. Fortieth report of the Joint FAO/WHO
Expert Committee on Food Additives. WHO Technical Report Series, No. 832.

165
FAO/WHO. 2006. Evaluation of certain veterinary drug residues in food. Sixty-sixth report of the Joint FAO/WHO Expert Committee on Food Additives. WHO Technical Report Series, No. 939.
FAO/WHO. 2009. Evaluation of certain veterinary drug residues in food. Seventieth report of the Joint FAO/WHO Expert Committee on Food Additives. WHO Technical Report Series, No. 954.
Ferguson, E.G.W. 1994. [14C]-CGA 89317: Absorption, distribution and excretion following a single oral administration of Fasinex-5% to ruminating sheep. Hazleton Europe. Report No. 380/215-1011.
Gokbulut, C., Karademir, U., Boyacioglu, M. & Akar, F. 2007. The effect of diet type on the plasma disposition of triclabendazoloe in goats. Research in Veterinary Science, 82: 388–391.
Gokbulut, C., Boyacioglu, M., Karademir, U. & Aksit, D. 2010. The effect of fasting on the plasma disposition of triclabendazole following oral administration in goats. Research in Veterinary Science,89: 415–417.
Hamböck, H. 1982. Characterization of tissue residues of CGA 89317 in sheep and goat. Ciba-Geigy Ltd, Project Report 50/82.
Hamböck, H. 1983. The metabolic fate of CGA 89317 in sheep, rat and the lactating goat. Ciba-Geigy Limited, Project Report No. 41/83.
Hamböck, H. & Strittmatter, J. 1981. Distribution, degradation and excretion of CGA 89317 in the lactating goat. Ciba-Geigy Limited, Project Report p. 34-81.
Hamböck. H. & Strittmatter, J. 1982. Distribution, degradation and excretion of CGA 89317 in sheep. Ciba-Geigy Limited, Project Report 10/82.
Iddon, B., Kutschy, P., Robinson, A.G., Suschitzky, H., Kramer, W. & Neugebauer, F.A. 1992. 2H-benzimidazoles (isobenzimidazoles). Part 7. A new route to Triclabendazole [5-chloro-6-(2,3-dichlorophenoxy)-2-methylthio-1H-benzimidazole] and congeneric benzimidazoles. Journal of the Chemical Society, Perkins Transactions, 1: 3129–3134.
Kinabo, L.D.B. & Bogan, J.A. 1988. Pharmacokinetics and efficacy of triclabendazole in goats with induced fascioliasis. Journal of Veterinary Pharmacology and Therapeutics, 11: 254–259.
Lifschitz, A., Virkel, G., Ballent, M., Sallovitz, J. & Lanuss, C. 2009. Combined use of ivermectin and triclabendazole in sheep: In vitro and in vivo characterization of their pharmacological interaction. The Veterinary Journal, 182: 261–268.
Sanyal, P.K. 1994. Pharmacokinetic study of triclabendazole in sheep and goat using a High Performance Liquid Chromatography method. Indian Journal of Pharmacology, 26: 200–203.
Shrivastava, A., Kumar, S.M. & Jain, A. 2011. Spectrophotometric method for quantitative determination of triclabendazole in bulk and pharmaceutical. Chronicles of Young Scientists, 2: 90–92.
Tothadi, S., Bhogala, B.R., Gorantla, A.R., Thakur, T.S., Jetti, R.K.R. & Desiraju, G.R. 2012.Triclabendazole: An intriguing case of co-existence of conformational and tautomeric polymorphism.Chemistry - An Asian Journal, 7(2): 330–342.
Virkel, G., Lifschitz, A., Sallovitz, J., Pis, A. & Lanusse, C. 2006. Assessment of the main metabolism pathways for the flukicidal compound triclabendazole in sheep. Journal of Veterinary Pharmacology and Therapeutics, 29: 213–223.
Virkel, G., Lifschitz, A., Sallovitz, J., Ballent, M., Scarcella, S. & Lanusse, C. 2009. Inhibition of cytochrome P450 activity enhances the systemic availability of triclabendazole metabolites in sheep. Journal of Veterinary Pharmacology and Therapeutics, 32(1): 79–86. (Article first published online 6 August 2008)


Annex 1Summary of JECFA evaluations of
veterinary drug residuesfrom the 32nd meeting to the present
The following table summarises the veterinary drug evaluations conducted by JECFA at the 32nd
(1987), 34th (1989), 36th (1990), 38th (1991), 40th (1992), 42nd (1994), 43rd (1994), 45th (1995), 48th
(1997), 50th (1998), 52nd (1999), 54th (2000), 58th (2002), 60th (2003), 62nd (2004), 66th (2006) , 70th
(2008) meetings and Meeting 2010 specifically for ractopamine in pig tissues. These meetings were devoted exclusively to the evaluation of veterinary drug residues in food. This table must be considered in context with the full reports of these meetings, published as WHO Technical Report Series.Some notes regarding the table:
The “ADI Status” column refers to the ADI and indicates whether an ADI was established as a full ADI or if the ADI is temporary (T).Where an MRL is temporary, it is indicated by “T”.Where a compound has been evaluated more than once, the data given are for the most recent evaluation, including the 70th meeting of the Committee.Where the compound has been considered at more than one JECFA meeting, the date given is that of the last meeting.

168
Substance ADI (μg/kg bw)
ADI Status JECFA MRL
(μg/kg) Tissue Species Marker residue and other remarks
Abamectin 0–1 (JMPR 1995)
Full 47 (1996) 10050
Liver, FatKidney
Cattle Avermectin B1a
Albendazole 0–50 Full 34 (1989) 1005000
Muscle, Fat, MilkLiver, Kidney
Cattle, Sheep MRLs analysed as 2-amino-benzimidazole, expressed as albendazole equivalents
Amoxicillin 0–0.7 Full 75 (2011) 504
Muscle, Liver, Kidney, FatMilk
Cattle, Pig, SheepCattle, Sheep
Amoxicillin
Apramycin 0–30 Full 75 (2011) 5000 Kidney Cattle, Chicken ApramycinAvilamycin 0–2000
(as avilamycin activity)
Full 70 (2008) 200
300
Muscle, Kidney, Skin/Fat
Liver
Pig, Chicken, Turkey, RabbitPig, Chicken, Turkey, Rabbit
Dichloroisoeverninic acid (DIA), expressed as avilamycin equivalents
Azaperone 0–6 Full 52 (1999) 60100
Muscle, FatLiver, Kidney
Pig Sum of azaperone and azaperol
Benzylpenicillin <30 μg/person/day of the penicillin moiety
Full 36 (1990) 504
Muscle, Liver, KidneyMilk
All species Benzylpenicillin
Bovine somatotropins
Not specified Full 50 (1998) Not specified Muscle, Liver, Kidney, Fat, Milk
Cattle
Carazolol 0–0.1 Full 52 (1999) 525
Muscle, Fat/SkinLiver, Kidney
Pig Carazolol. The Committee noted that the concentration of carazolol at the injection site may exceed the ADI that is based on the acute pharmacological effect of carazolol
Carbadox No ADI 60 (2003) No MRL The Committee decided that quinoxaline-2-carboxylic acid is not an appropriate marker residue
Ceftiofur 0–50 Full 48 (1997) 1000200060002000100
MuscleLiver
KidneyFatMilk
Cattle, PigCattle
Desfuroylceftiofur
Cefuroxime No ADI 62 (2004) No MRL

169
Substance ADI (μg/kg bw)
ADI Status JECFA MRL
(μg/kg) Tissue Species Marker residue and other remarks
Chloramphenicol No ADI 62 (2004) No MRLChlorpromazine No ADI 38 (1991) No MRLChlortetracyclineOxytetracyclineTetracycline
0–30(Group ADI)
Full 58 (2002) 200600
1200400100200200
MuscleLiver
KidneyEggsMilk
MuscleMuscle
Cattle, Pig, Sheep, Poultry
PoultryCattle, SheepFish Giant prawn
Parent drugs, either singly or in combinationOxytetracycline only
Clenbuterol 0–0.004 Full 47 (1996) 0.20.6
0.05
Muscle, FatLiver, Kidney
Milk
Cattle, HorseCattle
Clenbuterol
Closantel 0–30 Full 40 (1992) 10003000150050002000
Muscle, LiverKidney, Fat
Muscle, Liver,Kidney
Fat
CattleSheep
Closantel
Colistin 0–7 Full 66 (2006) 15020050
300
Muscle, Liver, FatKidney
MilkEggs
Cattle, Sheep, Goat, Chicken, Turkey, Pig, RabbitCattle, SheepChicken
Residue definition is the sum of Colistin A and colistin B. The MRL includes skin + fat where appropriate (chicken, turkey, pigs).
Cyfluthrin 0–20 Full 48 (1997) 2020040
Muscle, Liver, KidneyFatMilk
Cattle Cyfluthrin
Cyhalothrin 0–5 Full 62 (2004) 20400205030
Muscle, KidneyFat
LiverLiverMilk
Cattle, Sheep, PigCattle,Pig
SheepCattle, Sheep
Cyhalothrin

170
Substance ADI (μg/kg bw)
ADI Status JECFA MRL
(μg/kg) Tissue Species Marker residue and other remarks
Cypermethrin-Cypermethrin
0–20(Group ADI)
Full 62 (2004) 501000100
Muscle, Liver, KidneyFatMilk
Cattle, SheepCattle, Sheep
Total of cypermethrin residues (resulting from the use of cypermethrin or -cypermethrin as veterinary drugs)
Danofloxacin 0–20 Full 48 (1997) 20040010010050
200100
MuscleLiver, Kidney
FatMuscleLiver
KidneyFat
Cattle, ChickenPig
DanofloxacinFor chicken fat/skin
Deltamethrin 0–10(1982 JMPR)
Full 60 (2003) 3050
5003030
MuscleLiver, Kidney
FatMilkEggs
Cattle, Chicken, Sheep, SalmonCattle, Sheep, ChickenCattleChicken
Deltamethrin
Derquantel 0–0.3 Full 75 (2011) 0.20.72
Muscle, KidneyFat
Liver
Sheep Derquantel
Dexamethasone 0–0.015 Full 70 (2008) 12
0.3
Muscle, KidneyLiverMilk
Cattle, Pig, HorseCattle, Pig, HorseCattle
Dexamethasone
Diclazuril 0–30 Full 50 (1998) 500300020001000
MuscleLiver
KidneyFat
Sheep, Rabbit, Poultry DiclazurilPoultry skin + fat
Dicyclanil 0–7 Full 60 (2003) 150125200
MuscleLiver, Kidney
Fat
Sheep Dicyclanil
Dihydro-streptomycinStreptomycin
0–50(Group ADI)
Full 58 (2002) 6001000200
Muscle, Liver, FatKidney
Milk
Cattle, Pig, Chicken, SheepCattle, Sheep
Sum of dihydrostreptomycin and streptomycin
Dimetridazole No ADI 34 (1989) No MRL

171
Substance ADI (μg/kg bw)
ADI Status JECFA MRL
(μg/kg) Tissue Species Marker residue and other remarks
Diminazene 0–100 Full 42 (1994) 500120006000150
MuscleLiver,
KidneyMilk
Cattle Diminazene
Doramectin 0–1 Full 62 (2004) 105
10030
15015
MuscleMuscleLiver
KidneyFatMilk
CattlePigsCattle, PigsCattle, PigsCattle, PigsCattle
Doramectin
Enrofloxacin 0–2 Full 48 (1997) No MRLEprinomectin 0–10 Full 50 (1998) 100
200030025020
MuscleLiver
KidneyFatMilk
Cattle Eprinomectin B1a
Erythromycin 0–0.7 Full 66 (2006) 100
50
Muscle, Liver,Kidney, Fat/Skin
Eggs
Chicken, Turkey
Chicken
Erythromycin A
Estradiol-17 0–0.05 Full 52 (1999) Not specified Muscle, Liver, Kidney, Fat
Cattle
FebantelFenbendazoleOxfendazole
0–7(group ADI)
Full 50 (1998) 100500100
Muscle, Kidney, FatLiverMilk
Cattle, Goat, Horses, Pig, SheepCattle, Sheep
Sum of febantel, fenbendazole and oxfenbendazole, expressed as oxfendazole sulphone equivalents
Fenbendazole (see Febantel)Fluazuron 0–40 Full 48 (1997) 200
5007000
MuscleLiver, Kidney
Fat
Cattle Fluazuron

172
Substance ADI (μg/kg bw)
ADI Status JECFA MRL
(μg/kg) Tissue Species Marker residue and other remarks
Flubendazole 0–12 Full 40 (1992) 10200500400
Muscle, LiverMuscleLiverEggs
PigPoultry
Flubendazole
Flumequine 0–30 Full 66 (2006) 5001000500
3000500
500T500T
MuscleFat
LiverKidneyMuscleMuscleMuscle
Cattle, Sheep, Pig, ChickenTroutBlack Tiger ShrimpShrimp
Flumequine.The MRLs are temporary for Black Tiger Shrimp and Shrimp. The MRLs for shrimp applies to all fresh water and marine shrimp.
Furazolidone No ADI 40 (1992) No MRLGentamicin 0–20 Full 50 (1998) 100
20005000200
Muscle, FatLiver
KidneyMilk
Cattle, PigCattle
Gentamicin
Imidocarb 0–10 Full 60 (2003) 30015002000
50
MuscleLiver
KidneyFat, Milk
Cattle Imidocarb, free base
Ipronidazole No ADI 34 (1989) No MRLIsometamidium 0–100 Full 40 (1992) 100
5001000
Muscle, Fat, MilkLiver
Kidney
Cattle Isometamidium
Ivermectin 0–1 Full 58 (2002) 10040152010
LiverFat
LiverFatMilk
CattleCattlePig, SheepPig, SheepCattle
Ivermectin B1a
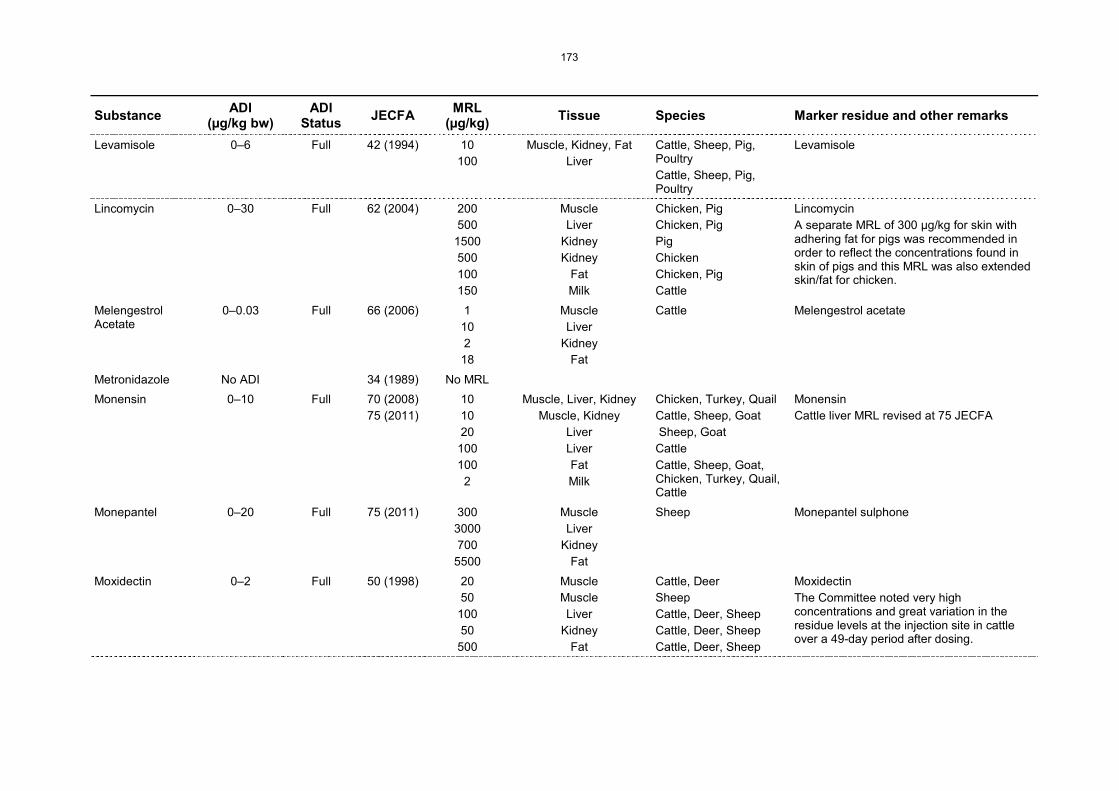
173
Substance ADI (μg/kg bw)
ADI Status JECFA MRL
(μg/kg) Tissue Species Marker residue and other remarks
Levamisole 0–6 Full 42 (1994) 10100
Muscle, Kidney, FatLiver
Cattle, Sheep, Pig, PoultryCattle, Sheep, Pig, Poultry
Levamisole
Lincomycin 0–30 Full 62 (2004) 200500
1500500100150
MuscleLiver
KidneyKidney
FatMilk
Chicken, PigChicken, PigPigChickenChicken, PigCattle
LincomycinA separate MRL of 300 μg/kg for skin with adhering fat for pigs was recommended in order to reflect the concentrations found in skin of pigs and this MRL was also extended skin/fat for chicken.
Melengestrol Acetate
0–0.03 Full 66 (2006) 110218
MuscleLiver
KidneyFat
Cattle Melengestrol acetate
Metronidazole No ADI 34 (1989) No MRLMonensin 0–10 Full 70 (2008)
75 (2011)101020
1001002
Muscle, Liver, KidneyMuscle, Kidney
LiverLiverFatMilk
Chicken, Turkey, QuailCattle, Sheep, GoatSheep, Goat
CattleCattle, Sheep, Goat, Chicken, Turkey, Quail,Cattle
MonensinCattle liver MRL revised at 75 JECFA
Monepantel 0–20 Full 75 (2011) 3003000700
5500
MuscleLiver
KidneyFat
Sheep Monepantel sulphone
Moxidectin 0–2 Full 50 (1998) 2050
10050
500
MuscleMuscleLiver
KidneyFat
Cattle, DeerSheepCattle, Deer, SheepCattle, Deer, SheepCattle, Deer, Sheep
MoxidectinThe Committee noted very high concentrations and great variation in the residue levels at the injection site in cattle over a 49-day period after dosing.
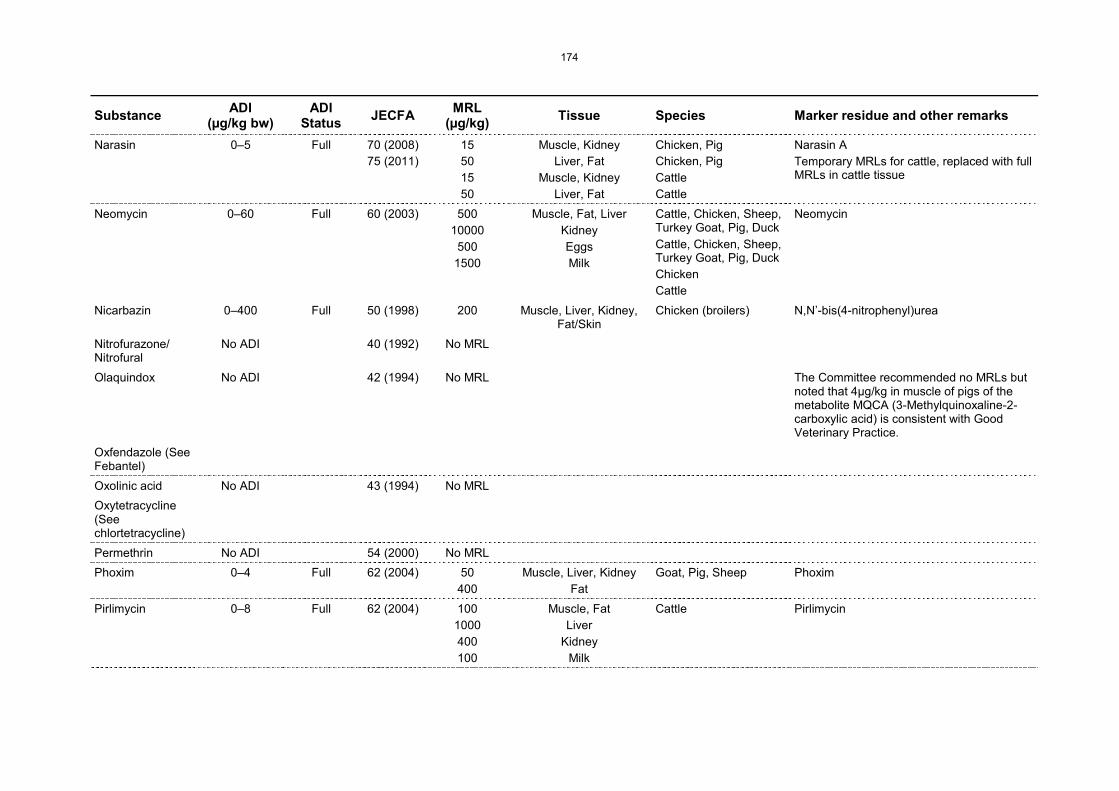
174
Substance ADI (μg/kg bw)
ADI Status JECFA MRL
(μg/kg) Tissue Species Marker residue and other remarks
Narasin 0–5 Full 70 (2008)75 (2011)
15501550
Muscle, KidneyLiver, Fat
Muscle, KidneyLiver, Fat
Chicken, PigChicken, PigCattleCattle
Narasin ATemporary MRLs for cattle, replaced with full MRLs in cattle tissue
Neomycin 0–60 Full 60 (2003) 50010000
5001500
Muscle, Fat, LiverKidneyEggsMilk
Cattle, Chicken, Sheep, Turkey Goat, Pig, DuckCattle, Chicken, Sheep, Turkey Goat, Pig, Duck ChickenCattle
Neomycin
Nicarbazin 0–400 Full 50 (1998) 200 Muscle, Liver, Kidney, Fat/Skin
Chicken (broilers) N,N’-bis(4-nitrophenyl)urea
Nitrofurazone/Nitrofural
No ADI 40 (1992) No MRL
Olaquindox No ADI 42 (1994) No MRL The Committee recommended no MRLs but noted that 4μg/kg in muscle of pigs of the metabolite MQCA (3-Methylquinoxaline-2-carboxylic acid) is consistent with Good Veterinary Practice.
Oxfendazole (See Febantel)Oxolinic acid No ADI 43 (1994) No MRLOxytetracycline (Seechlortetracycline)Permethrin No ADI 54 (2000) No MRLPhoxim 0–4 Full 62 (2004) 50
400Muscle, Liver, Kidney
FatGoat, Pig, Sheep Phoxim
Pirlimycin 0–8 Full 62 (2004) 1001000400100
Muscle, FatLiver
KidneyMilk
Cattle Pirlimycin
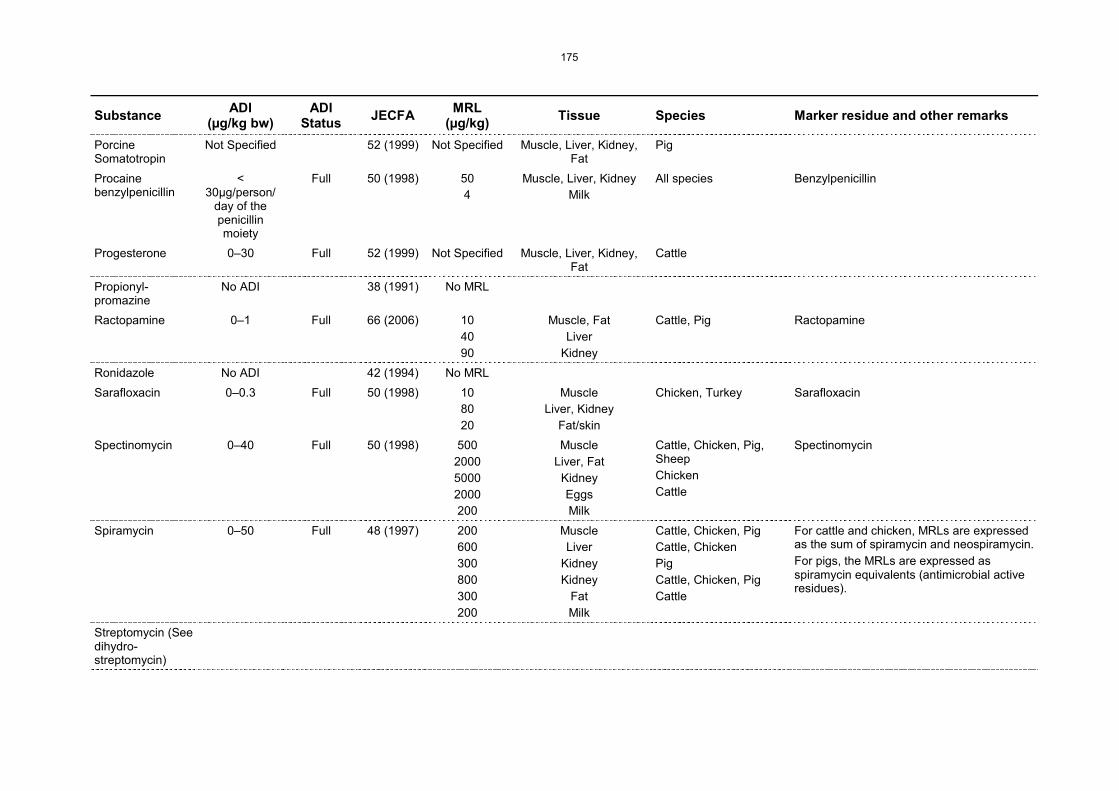
175
Substance ADI (μg/kg bw)
ADI Status JECFA MRL
(μg/kg) Tissue Species Marker residue and other remarks
Porcine Somatotropin
Not Specified 52 (1999) Not Specified Muscle, Liver, Kidney, Fat
Pig
Procaine benzylpenicillin
<30μg/person/
day of the penicillin moiety
Full 50 (1998) 504
Muscle, Liver, KidneyMilk
All species Benzylpenicillin
Progesterone 0–30 Full 52 (1999) Not Specified Muscle, Liver, Kidney, Fat
Cattle
Propionyl-promazine
No ADI 38 (1991) No MRL
Ractopamine 0–1 Full 66 (2006) 104090
Muscle, FatLiver
Kidney
Cattle, Pig Ractopamine
Ronidazole No ADI 42 (1994) No MRLSarafloxacin 0–0.3 Full 50 (1998) 10
8020
MuscleLiver, Kidney
Fat/skin
Chicken, Turkey Sarafloxacin
Spectinomycin 0–40 Full 50 (1998) 500200050002000200
MuscleLiver, Fat
KidneyEggsMilk
Cattle, Chicken, Pig, SheepChickenCattle
Spectinomycin
Spiramycin 0–50 Full 48 (1997) 200600300800300200
MuscleLiver
KidneyKidney
FatMilk
Cattle, Chicken, PigCattle, Chicken PigCattle, Chicken, PigCattle
For cattle and chicken, MRLs are expressed as the sum of spiramycin and neospiramycin.For pigs, the MRLs are expressed as spiramycin equivalents (antimicrobial active residues).
Streptomycin (See dihydro-streptomycin)

176
Substance ADI (μg/kg bw)
ADI Status JECFA MRL
(μg/kg) Tissue Species Marker residue and other remarks
Sulfadimidine(Sulfamethazine)
0–50 Full 42 (1994) 10025
Muscle, Liver, Kidney, FatMilk
Cattle, Sheep, Pig, PoultryCattle
Sulfadimidine
Sulfathiazole No ADI 34 (1989) No MRLTestosterone 0–2 Full 52 (1999) Not specified Muscle, Liver, Kidney,
FatCattle
Tetracycline (See chlortetracycline)Thiamphenicol 0–5 Full 58 (2002) No MRLTiabendazole (Thiabendazole)
0–100 Full 58 (2002) 100100
Muscle, Liver, Kidney, FatMilk
Cattle, Pig, Goat, SheepCattle, Goat
Sum of tiabendazole + 5-hydroxy tiabendazole
Tilmicosin 0–40 Full 70 (2008) 10010001500300
1000150100
24001400600
1200250
Muscle, FatLiverLiver
KidneyKidneyMuscleMuscleLiverLiver
KidneyKidney
Skin/Fat
Cattle, Pig, SheepCattle SheepPigCattle, SheepPigChickenTurkeyChickenTurkeyChicken TurkeyChicken, Turkey
Tilmicosin
Trenbolone acetate
0–0.02 Full 34 (1989) 210
MuscleLiver
Cattle Trenbolone for muscle-Trenbolone for liver
Trichlorfon (Metrifonate)
0–2 Full 66(2006) 5050
MilkMuscle, Liver, Kidney,
Fat
Cattle TrichlorfonGuidance MRLs at the limit of quantitation of the analytical method for monitoring purposes. No residues should be present in tissues when used with Good Veterinary Practice.

177
Substance ADI (μg/kg bw)
ADI Status JECFA MRL
(μg/kg) Tissue Species Marker residue and other remarks
Triclabendazole 0–3 Full 70 (2008) 250850400200300200100
MuscleLiver
KidneyMuscleLiver
KidneyFat
CattleSheepCattle, Sheep
Keto-triclabendazole
Tylosin 0–30 Full 70 (2008) 100100100100300
Muscle, Liver, KidneyFat
Skin/FatMilkEggs
Cattle, Pig, ChickenCattle, PigChickenCattleChicken
Tylosin A
Xylazine No ADI 47 (996) No MRLZeranol 0–0.5 Full 32 (1987) 2
10MuscleLiver
Cattle Zeranol
FAO TECHNICAL PAPERS
FAO JECFA MONOGRAPHSNote: JECFA Monographs are available in English only.1. Combined compendium of food additive specifications – JECFA specifications monographs
from the 1st to the 65th meeting. Vol. 1: Food additives A – D; Vol. 2: Food additives E – O;Vol. 3: Food additives P – Z; Vol. 4: Analytical methods, test procedures and laboratory solutions.
2. Residue evaluation of certain veterinary drugs – Joint FAO/WHO Expert Committee on Food Additives, 66th meeting 2006
3. Compendium of food additive specifications – Joint FAO/WHO Expert Committee on Food Additives, 67th meeting 2006
4. Compendium of food additive specifications – Joint FAO/WHO Expert Committee on Food Additives – 68th meeting 2007
5. Compendium of food additive specifications – Joint FAO/WHO Expert Committee on Food Additives, 69th meeting 2008
6. Residue evaluation of certain veterinary drugs – Joint FAO/WHO Expert Committee on Food Additives. 70th meeting 2008
7. Compendium of food additive specifications – Joint FAO/WHO Expert Committee on Food Additives, 71st meeting 2009
8. Safety evaluation of certain contaminants in food – Joint FAO/WHO Expert Committee on Food Additives, 72nd meeting 2010. Joint FAO/WHO publication: WHO Food Additives Series No. 63/FAO JECFA Monographs 8
9. Residue evaluation of certain veterinary drugs – Joint FAO/WHO Expert Committee on Food Additives, Meeting 2010 – Evaluation of data on ractopamine residues in pig tissues
10. Compendium of food additive specifications – Joint FAO/WHO Expert Committee on FoodAdditives, 73rd meeting 2010
11. Compendium of food additive specifications – Joint FAO/WHO Expert Committee on FoodAdditives, 74th meeting 2011
FAO Technical Papers are available through the authorized FAO Sales Agents or directly from Sales and Marketing Group, FAO, Viale delle Terme di Caracalla, 00153 Rome, Italy.

Joint FAO/WHO Expert Committee on Food Additives
75th meeting 2011
Joint FAO/WHO Expert Committee on Food Additives
75th meeting 2011
RESIDUE EVA LUATIONOF CERTA IN V ETERINA RY DRUGS
RESIDU
E EVALU
ATION
OF CERTA
IN VETERIN
ARY D
RUG
S
RESIDUE EVA LUATION OF CERTA IN V ETERINA RY DRUGS
F A O J E C F A M o n o g r a p h s
This document contains monographs on residue evaluations of certain
veterinary drugs, prepared at the seventy-fifth meeting of the Joint
FAO/WHO Expert Committee on Food Additives (JECFA), which was held
in Rome , Italy from 8 to 17 November 2011. Four substances were
evaluated for the first time for the animal species concerned -
amoxicillin, apramycin, derquantel and monepantel. Three substances
were reassessed, monensin, narasin and triclabendzole. Specifically,
narasin was reassessed for an analytical method in cattle tissues only
and triclabendazole for consideration only of extending the MRLs in
sheep to goat tissues. The residue monographs provide information on
chemical identity and properties of the compounds, pharmacokinetics
and metabolism, residue depletion studies and analytical methods
validated and used for the detection and quantification of the
compounds. This publication and other documents produced by JECFA
contain information that is useful to those who work with or are
involved with recommending or controlling maximum residue limits for
veterinary drugs in foods of animal origin.
ISSN 1817-7077
FAO
/ WH
O
12
12
I2766E/1/05.12
ISBN 978-92-5-107255-4 ISSN 1817-7077
9 7 8 9 2 5 1 0 7 2 5 5 4