ezra d. hausman, ph.d.puc.sd.gov/commission/dockets/civil/2006/civ06-399/2654-2730.pdf · direct...
TRANSCRIPT

BEFORE THE SOUTH DAKOTA PUBLIC UTILITIES COMMISSION
In the Matter of the Application by Otter Tail ) Power Company on behalf of the Big Stone I1 Co- ) owners for an Energy Conversion Facility Siting ) Case No EL05-022 Permit for the Construction of the Big Stone I1 )
<
Project
Direct Testimony of Ezra D. Hausman, Ph.D.
Synapse Energy Economics, Inc.
On Behalf of Minnesotans for An Energy-Efficient Economy
Izaak Walton League of America - Midwest Office Union of Concerned Scientists
Minnesota Center for Environmental Advocacy

Direct Testimony of Ezra D. Hausman South Dakota Public Utilities Co~mnission Case No. EL05-022
Joint Intervenors Exhibit 2
PROFESSIONAL QUALIFICATIONS AND SUMMARY
Please state your name for the record.
My name is Ezra D. Hausman
Where are you employed?
I am a Senior Associate with Synapse Energy Economics of Cambridge,
Massachusetts
Please describe your formal education.
I hold a PhD. in Atmospheric Science Erom Harvard University, a master's
degree in applied physics fiom Harvard University, a master's degree in
water resource engineering from Tufts University, and a Bachelor of Arts
degree Erom Wesleyan University.
Please describe "atmospheric science."
Briefly, atmospheric science is the study of the chemistry, circulation and
heat transfer processes of the atmosphere. It encompasses the study of how
the atmosphere interacts with the ocean and land surface through processes
of chemistry, moisture exchange, and energy transfers. These processes are
central to what we think of as the "climate" of the Earth and, in concert
with oceanic processes, they control the distribution of surface temperature
and patterns of precipitation on the planet.
Another way to look at this is as follows: A certain amount of energy
reaches the surface of the Earth, as sunlight, every day. At equilibrium, the
same amount of energy must be vented back to space, on average.
Atmospheric science is the science of all of those chemical, physical and
dynamical processes which work together to move that energy to the top of
the atmosphere and release it back into space.

Direct Testimony of Ezra D. Hausman South Dakota Public Utilities Commission Case No. EL05-022
Joint Intervenors Exhibit 2
Please describe your experience in the field of atmospheric science.
For my doctoral research at Harvard University, I built a dynamic computer
model of the ocean-atmosphere system to explore how a number of
observed changes in atmospheric chemistry, ocean circulation and ocean
surface temperature at the end of the last glaciation ("ice age") can be used
to explain certain aspects of the warming of the planet at that time. I
demonstrated, among other things, that the increase in atmospheric Carbon
Dioxide (COz) at that time was both a result of and a strong positive
feedback for the concurrent warming of the planet.
After graduation, I worked with researchers at Columbia University to
develop private sector applications of climate forecast science. This led to
an initiative called the Global Risk Prediction Network, Inc. for which I
served as Vice President in 1997- 1998. Specific projects included serving
as Principal Investigator for a statistical assessment of grain yield
predictability in several crop regions around the world based on global
climate indicators and for a statistical assessment of road salt demand
predictability in the United States based on global climate indicators. I also
prepared a preliminary design of a climate and climate forecast information
website tailored to the interests of the business community.
Please describe your work since 1998.
Since 1998 I have been primarily focused on electricity market issues,
turning my numerical modeling and analysis skills to issues of electricity
market structure, electric industry restructuring, asset valuation and price
forecasting, and environmental regulations in the electric industry. In July
of 2005, I joined Synapse Energy Economics of Cambridge,
Massachusetts, to continue this work but with more of a focus on the
environmental, long-term planning and consumer protection aspects of the
industry. This has given me an opportunity to apply my combined
expertise, in atmospheric science and in the electric industry, to some of the
most important issues facing the industry and, indeed, our society.
Page 2
Direct Testimony of Ezra D. Hausinan South Dakota Public Utilities Colmnission Case No. EL05-022
Joint Intervenors Exhibit 2
Q. Have you attached a copy of your current resume to this testimony?
A. Yes, I have, as Exhibit JI-2-A
Q. Please provide a summary of the main points of your testimony.
A. Human induced climate change is a grave and increasing threat to the
environment and to human societies around the globe. Its early effects,
which are already observable and documented in the scientific literature,
are consistent with those predicted by computer models of the global
climate, and these same models predict much more severe effects to come.
Indeed, we are on a path that, if unchanged, is likely to bring about a
climate well outside the range of anything ever experienced by our species,
with the potential for severe and irreversible changes that will forever alter
our environment, our economies and our way of life.
While some level of climate change is already a fact, computer models tell
us that we can still avoid the most dangerous impacts by limiting the
furthe; buildup of C02 in the atmosphere. Perhaps the most important way
to achieve this is by limiting the burning of fossil fuels in the decades
ahead. In contrast, if the Big Stone Unit I1 is built, it would inject enormous
amounts of C02 into the atmosphere for decades to come and would
contribute to the dangerous atmospheric buildup of this gas. Thus, the
proposed unit would exacerbate a problem that is likely to cause dramatic
environmental and economic harm to societies around the globe, including
to the communities in South Dakota.
Q. What issues in particular will your testimony cover?
A. My testimony will:
discuss the scientific basics of global climate change (Part 11)
describe some of the authoritative scientific literature on the subject, including that which is written specifically for the use of policyrnakers, and the state of the scientific consensus on the subject (Part Ill)

Direct Testimony of Ezra D. Hausman South Dakota Public Utilities Coinlnission Case No. EL05-022
Joint Intervenors Exhibit 2
describe the rise of atmospheric C02 globally and in the context of the long-term history of atmospheric C02 (Part IV)
discuss climate changes that have occurred already (Part V)
0 describe what is predicted for the future (Part VI)
0 discuss some of the global impacts of climate change (Part VII)
a discuss some likely impacts of climate change on South Dakota (Part VIII)
a put Big Stone II's C02 emissions in the context of overall emissions (Part JX)
express my scientific conclusions as they relate to legal standards applicable to this proceeding (Part X)
11. THE SCIENTIFIC BASICS OF GLOBAL CLIMATE CHANGE
Q. Would you explain the "greenhouse effect"?
A. The planet's climate is a function of how much energy it receives from the
sun, how much of that energy it retains, and how that energy is distributed
throughout the planet (by wind and ocean currents, evaporation,
condensation, and other mechanisms). Solar radiation arrives on earth,
mainly in the form of visible light. That radiation is absorbed by the
surface of the planet, which in turn radiates heat energy upward. Some of
that heat is trapped in the lower atmosphere by naturally-occurring gases,
analogous to how heat is trapped in a greenhouse by the glass. This is the
natural "greenhouse effect" and the heat trapping gases are commonly
called "greenhouse gases."
Without the greenhouse effect, the earth would be far too cold to support
liquid water, or probably any kind of life. Similarly with too strong of a
greenhouse effect, the earth would be considerably warmer and might have
no polar ice caps, as has happened in the geologic past. With an even
stronger greenhouse effect the earth could become extremely hot and
uninhabitable, like the planet Venus. For all of recorded human history, the
greenhouse effect has remained within a fairly narrow range that we know
today, allowing complex human civilizations to form and develop. During

Direct Testimony of Ezra D. Hausinan South Dakota Public Utilities Co~ninission Case No. EL05-022
Joint Intervenors Exhibit 2
periods of geologic history that had different abundances of greenhouse
gases such as Cozy the earth had a very different climate.
Q. How have humans enhanced the natural greenhouse effect?
A. Human activities have increased the atmospheric concentration of many
greenhouse gases, most notably the concentration of CO,. This increase has
come primarily from the burning of fossil kels (coal, oil, and natural gas),
and also from changes in land use such as deforestation. Of the fossil fuels,
coal emits the most CO? per unit of energy obtained. Today the primary
reason for burning coal is for generation of electricity.
Because of the continuous and accelerating recovery and combustion of
fossil fuels, the background level of C02 in the air has increased by roughly
one third since preindustrial times. This means that the planet as a whole
does not lose heat to space as efficiently as it otherwise would, so the
system as a whole is warming up. This is the phenomenon commonly
referred to as "global warming."
Global warming will affect different areas differently, changing the .
distribution of rainfall, warming many areas but cooling some others,
changing the length of growing seasons, and so forth. To emphasize the
planet's complex response to global warming, scientists have coined the
term "global climate change." I personally prefer to use the term "global
climate change" in contexts such as this one to emphasize that the impact
of the increased atmospheric C02 burden will not just be measured in a few
warm days, but in disruptions in the very characteristics of climate that
define our lives and our livelihoods.
Page 5

Direct Testimony of Ezra D. Hauslnan South Dakota Public Utilities Commission Case No. EL05-022
Joint Intervenors Exhibit 2
III. SCIENTIFIC LITERATURE ON GLOBAL CLIMATE CHANGE
Q. In your opinion, what is the most comprehensive, reliable,
authoritative, and scientifically credible account, relied upon by you
and other experts in your field of climate science, regarding global
warming, including the causes of global warming and the potential
impacts on people and on the natural world?
A. There are a great number of studies published in distinguished, peer-
reviewed scientific journals that are relied upon by scientists in developing
a full understanding of the many aspects of climate science and climate
change. However, perhaps unique to this area of science, there is a single
source that has been carefully assembled by the leading researchers in the
field to provide a comprehensive, reliable, authoritative, and scientifically
credible digest of this body of research. This source is the Third
Assessment Report (TAR) of the Intergovernmental Panel on Climate
Change (IPCC).
Q. What is the IPCC?
A. The IPCC was formed in 1988 by the World Meteorological Organization
and the U.N. Environment ~rogramme in response to rising concerns about
global climate change. It provides an organizational structure for the work
of hundreds of the world's leading researchers in climate science and
related sciences. The IPCC does not do scientific research as an
organization; rather, it assesses the scientific literature in an extremely
methodical and transparent way, publishing consensus reports that reflect
the work of scientists from around the world.
Q. Does the IPCC have any official role in advising policymakers?
A. Yes. In 1988 the United Nations General Assembly formally requested that
the IPCC provide a comprehensive review and recommendations with
respect to "the state of knowledge of the science of climate and climatic
Page 6

Direct Testimony of Ezra D. Hausinan South Dakota Public Utilities Coirunission Case No. EL05-022
Joint Intervenors Exhibit 2
change."' In 1992, after receiving the IPCC'S frst assessment of the
science, nearly every nation in the world, including the U.S., entered into
the United Nations Framework Convention on Climate Change. The
signers of the Framework Convention have asked the IPCC to provide full
assessments of the state of climate science every 4 to 5 years, and to
prepare various technical papers related to specific aspects of climate
science, technology, and the social and economic impacts of climate
change. The IPCC 's assessments are therefore written with policy making
in mind; they do not advocate for particular policies, but they do strive to
provide policy-relevant information.
Q. Do the periodic assessments by the IPPC address the science of climate
change?
A. Yes. The most recent Assessment Report released by the IPCC is the Third
Assessment Report (TAR), released in 200 1. The Report of Working
Group I of the IPCC, entitled "Climate Change 2001 : The Scientific
Basis," is the part of the TAR that addresses the science of climate change.
(Hereinafter "Working Group I Report".)
Q. How and by whom was the Working Group 1 Report prepared?
A. The Working Group I report describes in its preface how it was prepared,
stating: "This report was compiled between July 1998 and January 200 1,
by 122 Lead Authors. In addition, 5 15 Contributing Authors submitted
draft text and information to the Lead Authors. The draft report was
circulated for review by experts, with 420 reviewers submitting valuable
suggestions for improvement. This was followed by review by
governments and experts, through which several hundred more reviewers
participated. All the comments received were carefully analyzed and
assimilated into a revised document for consideration at the session of
Working Group I held in Shanghai, 17 to 20 January 200 1. There the
' IPCC 2004 document, "Sixteen Years of Scientific Assessment in Support of the Climate Convention."
Page 7

Direct Testimony of Ezra D. Hauslnan South Dakota Public Utilities Commission Case No. EL05-022
Joint Intervenors Exhibit 2
Summary for Policymakers was approved in detail and the underlying
report accepted."
The lead and contributing authors of this report were, like the IPCC itself,
drawn from the ranks of the world's leading researchers. It is my opinion
that the IPCC Working Group I report represents a thorough, fully
informed, and authoritative assessment of scientific knowledge related to
climate change as of the time it was written.
Q. Is there a summary of the report?
A. Yes. The Summary for Policymakers was adopted as part of the Working
Group I Report. A copy of the Working Group I Summary for
Policymakers is attached as Exhibit JI-2-B to my testimony.
Q. Does the IPCC Third Assessment Report include an analysis of the
potential impacts of global warming?
A. Yes. The P C C Third Assessment Report (TAR) includes the report of
Working Group 11 of the IPCC, entitled "Climate Change 2001 : Impacts,
Adaptation, and Vulnerability," hereinafter referred to as "Working Group
11 Report".
Q. How was the Working Group I1 Report prepared?
A. The preface of the Working Group I1 Report describes how it was prepared,
stating: "The WGII report was compiled by 183 Lead Authors between
July 1998 and February 2001. In addition, 243 Contributing Authors
submitted draft text and information to the Lead Author teams. Drafts of
the report were circulated twice for review, first to experts and a second
time to both experts and governments. Comments received from 440
reviewers were carefully analyzed and assimilated to revise the document
with guidance provided by 33 Review Editors. The revised report was
presented for consideration at a session of the Working Group 11 panel held
in Geneva from 13 to 16 February 200 1, in which delegates from 100
Page 8

Direct Testimony of Ezra D. Hauslnan South Dakota Public Utilities Colnlnission Case No. EL05-022
Joint Intervenors Exhibit 2
countries participated. There, the Summary for Policymakers was approved
in detail and the full report accepted."
As with Working Group I, the authors of the Working Group I1 report were
among the leading researchers in their fields, and their findings are based
on a thorough consideration of the science. The Working Group If's
Summary for Policymakers is attached as Exhibit JI-2-C.
Q. Can you identify any other documents for a nontechnical,
policymaking audience which you consider to be authoritative on the
subject of global warming?
A. Yes. A good example is a statement issued in 2005 by the U.S. National
Academy of Sciences along with national science academies of Brazil,
Canada, China, France, Germany, India, Italy, Japan, Russia, and the
United Kingdom entitled "Joint Science Academies' Statement: Global
Response to Climate Change," which I will refer to as the "Joint Science
Academies Statement". The Joint Science Academies Statement is attached
to my testimony as' Exhibit JI-2-D.
Q. What is the US National Academy of Sciences?
A. The National Academy of Sciences WAS) was formed by legislation
signed in 1863, and as mandated in its Act of Incorporation it has since
then served to "investigate, examine, experiment, and report upon any
subject of science or art" whenever called upon to do so by any department
of the government. The National Academy of Sciences is comprised of
approximately 2,000 members and 350 foreign associates, of whom more
than 200 have won Nobel Prizes. Although chartered by the federal
government, the NAS is a private, non-profit and independent scientific
organization. It is currently headed by Dr. Ralph J. Cicerone, himself an
atmospheric scientist with research interests in atmospheric chemistry and
climate change. Election to the NAS is considered by many to be one of the
highest honors an American scientist can receive.
Page 9

Direct Testimony of Ezra D. Hausman South Dakota Public Utilities Coln~nission Case No. EL05-022
Joint Intervenors Exhibit 2
In addition to expressing its views in the Joint Science Academies
Statement, has the NAS released any reports on climate change?
The NAS has issued a number of publications and reports on this subject,
reflecting the importance with which the scientific community views this
issue. In 200 1, at the request of the Bush Administration, it released a study
entitled "Climate Change Science: An Analysis of Some Key Questions,"
which endorsed the essential findings and predictions of the IPCC.
In your opinion is the National Academy of Sciences qualified to assess
and report on the scientific data related to the increased concentration
of C 0 2 and the effects of that increase on air, water, and natural
resources?
Yes. The National Academy of Sciences is eminently qualified to address
and produce authoritative reports on these issues.
Would you say that there is a scientific consensus on the issue of global
climate change?
There is an unequivocal scientific consensus on many aspects of the issue
of global climate change. These aspects include:
The fact that the C02 content of the atmosphere is increasing rapidly;
0 The fact that this rate of increase, and the resulting abundance of C02 in the atmosphere, is unprecedented in at leastthe past 200,000 years, and probably much longer;
a The fact that the primary source of the increase is combustion of fossil fuels by human industrialized societies, i.e., that it is anthropogenic C02;
The fact that the increased abundance of atmospheric COr has a direct radiative forcing effect on climate by altering the heat transfer characteristics of the atmosphere;
The fact that this change in the heat transfer properties of the atmosphere will have an impact on the climate of the planet;
a The fact that the climate of the earth is currently changing in ways that are consistent with model predictions based on the increased radiative forcing due to the anthropogenic increase in atmospheric
., Page 10

Direct Testimony of Ezra D. Hausinan South Dakota Public Utilities Co~nrnission Case No. EL05-022
Joint Intervenors Exhibit 2
COZY and that these changes include increased sea surface temperatures, increased sea level, loss of arctic permafrost, loss of mountain and polar glacier mass, and destruction of arctic habitat;
o The fact that these observed changes cannot be ascribed to any known natural phenomenon;
The fact that the magnitude of climate impacts will increase with increasing atmospheric C02 content; and
The fact that once the atmospheric abundance of C02 has been increased, it will only return to equilibrium levels through natural processes on a timescale of several centuries.
In addition, there is a strong scientific consensus that natural feedbacks in
the climate system would, on balance, tend to reinforce warming rather
than mitigate it; that one effect of global warming will be migration of
climate zones so that human societies and natural ecosystems will find
themselves poorly adapted to their local climate; and that this will result in
disruption and dislocation of ecosystems, migration of pest species and
disease vectors, and disruptions in agriculture. There is general agreement,
if not yet consensus, that global climate change will lead to generally more
extreme weather patterns across most of the globe, including more intense
storms and rainfall events and more extreme dry spells.
Q. Do the documents identified in this testimony, including the IPCC
Working Group reports and the Joint Science Academies Statement,
support these conclusions regarding scientific consensus?
A. Yes.
nT. THE RISE OF ATMOSPHERIC COz LEVELS
Q. Since the last IPCC report in 2001, what has been observed by climate
scientists about global levels of COz?
A. The level of C02 is still increasing. For example, the U.S. National Oceanic
and Atmospheric Administration (NOAA) reported on May 1,2006, that
Page 11
Direct Testimony of Ezra D. Hausman South Dakota Public Utilities Coi111nission Case No. EL05-022
Joint Intervenors Exhibit 2
the average atmospheric carbon dioxide level increased from an average of
376.8 parts per million in 2004 to 378.9 parts per million last year."
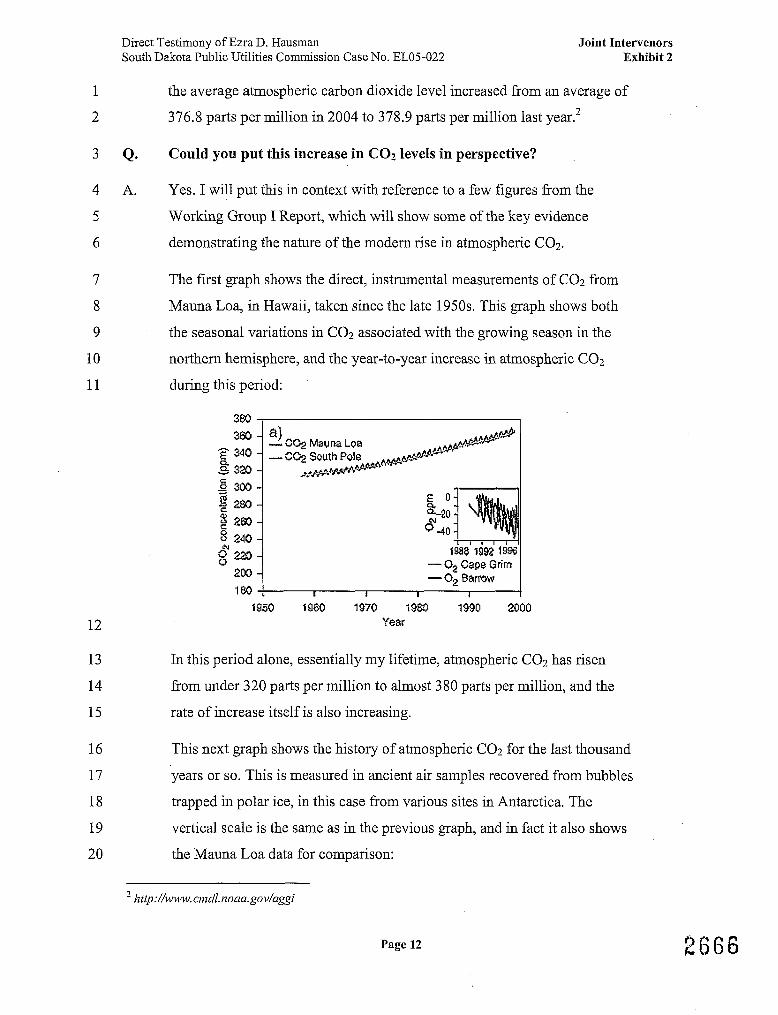
Could you put this increase in COz levels in perspective?
Yes. I will put this in context with reference to a few figures from the
Working Group I Report, which will show some of the key evidence
demonstrating the nature of the modern rise in atmospheric C02.
The first graph shows the direct, instrumental measurements of COz from
Mauna Loa, in Hawaii, taken since the late 1950s. This graph shows both
the seasonal variations in C02 associated with the growing season in the
northern hemisphere, and the year-to-year increase in atmospheric C02
during this period:
3m T 340 B 3ai) E 3D0 8 280 g am 9 240 cU g 223
2DO 180
1050 ISM 1970 1980 1990 2000 Year
In this period alone, essentially my lifetime, atmospheric C02 has risen
- - - - - -
- - -
from under 320 parts per million to almost 380 parts per million, and the
4 - C02 Maum Loa A & @ @ ~ - C02 so~th Po!e +Q@@& *,,, eA&4~~.~b
><**a++A** *
g o %-20
-40
1888 19% 19% - % Cape Grim - 0, Batmv
I 1 I 1
rate of increase itself is also increasing.
This next graph shows the history of atmospheric CO2 for the last thousand
years or so. This is measured in ancient air samples recovered from bubbles
trapped in polar ice, in this case from various sites in Antarctica. The
vertical scale is the same as in the previous graph, and in fact it also shows
the Mauna Loa data for comparison:
Page 12

Direct Testimony of Ezra D. Hausman South Dakota Public Utilities Conllnission Case No. EL05-022
Joint Intervenors Exhibit 2
v Adelie LbW
1BO &00 rOOO 1200 1400 1600 1840 2000
Year
These data demonstrate that C02 levels have been relatively steady in the
atmosphere for over 1,000 years, a time of remarkably quiescent climate by
geological standards, during which modern human civilization and culture
have flourished around the world.
Finally, this last graph shows the variations in atmospheric C02 over the
last four glacial cycles, also recovered from Antarctic ice cores. The
vertical scale is the same as for the two previous graphs, while the
horizontal scale is in thousand years before the present:
Remember that the Mama Loa data begin just below 320 ppm, and
increase rapidly from there. This is already higher than has been measured
for any time in the last 400,000 years, although the variations during this
period were considerable. These variations were accompanied by enormous
Page 13

Direct Testimony of Ezra D. Hausman South Dakota Public Utilities Co~mnission Case No. EL05-022
Joint Intervenors Exhibit 2
changes in climate, including the enormous advances of glaciers to cover
much of the North American continent and Eurasia.
We have excellent computer models to predict some of the effects of
elevated CO? levels, and some of these are the topic of my testimony. In
addition to this, however, is the extraordinary risk associated with pushing
the climate system to where it has never gone in over 400,000 years, and
probably in tens of millions of years. This is, in my opinion, a dangerous
game to play with the only planet we have.
Q. How high are C 0 2 levels projected to go in the century ahead?
A. The IPCC predicts that C 0 2 levels in the coming century will continue to
steadily rise if the earth follows the "business as usual" path of fossil fuel
consumption. These projections, based on various scenarios covering a
range of assumptions regarding population growth, economic growth,
globalization, etc., suggest that atmospheric COz concentrations could
reach from 490 to 1260 parts per million (an increase of 75% to 350%
above 1750 concentrations). The higher the concentration, the more likely
it is the earth will face dangerous or even catastrophic warming. Even
concentrations above 550 or even 500 parts per million have the potential
to cause dramatic and irreversible changes to our planet.
Q. How long will these increased C02 levels persist in the atmosphere?
A. The P C C Working Group I Summary for Policymakers states that "several
centuries after C02 emissions occur, about a quarter of the increase in C02
concentration caused by these emissions is still present in the atmosphere."
[p. 171. Thus, C02 that we put in the atmosphere today will affect the
climate of the planet for many centuries to come.
Page 14

Direct Testimony of Ezra D. Hausman South Dakota Public Utilities Commission Case No. EL05-022
Joint Intervenors Exhibit 2
V. CLIMATE CHANGE TO DATE
Q. Please describe, in general, changes in global temperatures in the last
century, and the likely causes of those changes.
A. The IPCC Working Group I Summary for Policymakers states that "[tlhe
global average surface temperature has increased over the 2oth century by
about 0.6 "C." [p.2] This is the conclusion drawn both from the more
recent instrumental record, and fiom a number of so-called
paleothermometers-the collected evidence from a large number of
temperature proxies that all point the same direction.
We know that there is a causal relationship between atmospheric C02
levels and rising average surface temperatures. This relationship was
originally postulated by the great mathematician and scientist Joseph
Fourier as early as 1824, and was first quantified by Svante Arrhenius in
1896. As the quality of both measurement technology and numerical
analysis have improved, these ideas have been strengthened and refmed,
and shown to be observable and measurable.
Q. How do we know that this warming is not part of a natural trend?
A. The IPCC Working Group I Summary for Policymakers concludes that
"[tlhere is new and stronger evidence that most of the warming observed
over the last 50 years is attributable to human activities.. ..There is a longer
and more closely scrutinized temperature record and new model estimates
of variability. The warming over the past 100 years is very unlikely to be
due to internal variability alone, as estimated by current models." [p.10].
[footnote omitted]
It goes on to state that "[iln the light of new evidence and taking into
account the remaining uncertainties, most of the observed warming over
the last 50 years is likely to have been due to the increase in greenhouse gas
concentrations." [p. 101
Page 15

Direct Testimony of Ezra D. Hausinan South Dakota Public Utilities Coinmission Case No. EL05-022
Joint Intervenors Exhibit 2
Based on what I have seen in the scientific literature in the last few years I
would expect the fourth annual report, due next year, to express even more
certainty on this point in particular.
Q. Since the IPCC report was issued in 2001, what has been observed by
climate scientists about global temperatures?
A. The highest annual average global surface temperature ever measured
occurred during the 2005 calendar year, based upon an ongoing NASA
analysis. The NASA scientific team noted that 2005 was slightly warmer
than 1998, the warmest previous year known. However, in 1998, there was
an "El Niiio" event,3 which was not the case in 2005. This event has a
strong effect on the equatorial Pacific surface ocean and would have
affected the temperature record in that year.4
Below I have reproduced one of the graphs fiom this study, showing the
mean surface temperature "anomaly" fiom 1880 through the present. By
anomaly the authors mean the difference between the annual average
surface temperature for a given year and the long-term average surface
temperature, which they define as the overall average for the period 195 1
through 1980. If a year is exactly average in terms of temperature, the
anomaly would be zero. The graph also shows the "smoothed" 5-year mean
temperature anomaly over this period:
El Niiio is an occasional disruption of the ocean-atmosphere system in the tropical Pacific, in which the trade winds weaken and wann water from the western boundary floods inuch of the surface equatorial Pacific. Thus this large wann anomaly would tend to elevate average global surface temperatures, independent of any other effects.
The GISS Surface Temperature Analysis is produced by Dr. Janes Hansen, director of NASA's Goddard Institute for Space Studies (GISS) at Columbia University in New York, along with Dr. Reto Ruedy and Dr. Ken Lo, also with the Goddard Institute, and Dr. Makiko Sato of the Colwnbia University Center for Climate Systeins Research.
Page 16

Direct Testimony of Ezra D. Hausman South Dakota Public Utilities Cormnission Case No. EL05-022
Joint Intervenors Exhibit 2
There are a number of ways to look at this. Four of the five warmest years
on record have occurred since 2000. The ten hottest years on record have
all occurred since 1990. Nineteen of the twenty warmest years on record
have occurred since 1980, and so on. The evidence is consistent,
statistically significant, and convincing. In addition, it is consistent with
what is and has been predicted by computer models of the climate in
response to today's elevated concentrations of atmospheric CO,.
9 VI. PROJECTED WARMING
What additional warming is predicted for the century ahead?
The IPCC predicts that the average surface temperature of the earth will
increase by 1.5 to 5.8 degrees Celsius by 2100. The range reflects
uncertainty about future emission levels and about precisely how the earth
will respond to those emissions.
Page 17

Direct Testimony of Ezra D. Hausman South Dakota Public Utilities Coi~~~nission Case No. EL05-022
Joint Intervenors Exhibit 2
Can you provide any perspective on the significance of the projected
changes in global temperatures in this century?
These may sound like small figures, but the average surface temperature
differential between the last ice age and the present was only about 5
degrees Celsius. During the last ice age, earth was a profoundly different
place, with much of North America covered by an ice sheet a mile or more
thick. At the upper range of the IPCCYs 2001 warming prediction, earth
would experience a warming equivalent to the one that melted that ice
sheet. The recovery from the last major glacial period took 5,000 to 10,000
years. The warming we are discussing here will occur within a single
century.
12 VII. IMPACTS OF CLIMATE CHANGE GLOBALLY
13 Q. What kinds of impacts are associated with warming projections in this
14 range?
15 A. The IPCC Working Groups I and I1 Reports predict a large number of very
16 serious negative impacts associated with this warming, including:
17 a rising sea levels, exposing coastal areas to increased risk of 18 inundation and storm damage;
19 a Damage to or loss of natural ecosystems, such as prairie wetlands and 20 alpine;
2 1 a Migration of habitats, leading to species extinctions and expansion of 22 disease vectors and pests;
23 a heat waves leading to higher morbidity and mortality from heat 24 stress;
25 more intense precipitation events resulting in increased floods, 26 mudslides, and soil erosion; and
27 a increased summer drylng in most continental interiors resulting in 2 8 more droughts; reduced crop yields, reduced water availability and 29 quality.
30 The higher the atmospheric abundance of COz rises, the more severe we
3 1 can expect these impacts to be; to some extent they are expected even at the
3 2 lower warming projections. Indeed, there is evidence that the 0.6 "C
Page 18

Direct Testimony of Ezra D. Hausman South Dakota Public Utilities Con~~nission Case No. EL05-022
Joint Intervenors Exhibit 2
warming we have experienced to date has already initiated some of these
impacts.
Q. Are the impacts of future warming likely to unfold gradually?
A. Many scientists believe that this is unlikely. While the computer models are
unable to predict specific abrupt climate changes, we know from the
geologic history that when the planet is changing from one type of climate
to another, such as from an ice age to an interglacial, it often makes those
changes in an abrupt, lurching fashion. The well-dated ice core records, in
particular, show several abrupt and sudden climate swings of a magnitude
that would be extremely disruptive were they to occur today.
Unfortunately, we cannot predict with certainty at what level of
atmospheric C02 such abrupt climate events would be likely to occur.
VIII. IMPACTS OF CLIMATE CHANGE ON SOUTH DAKOTA
Q. Turning now to the regional impacts of climate change, can you
identify any credible sources that forecast the impacts of increased
atmospheric C02 on the geographic region around South Dakota?
A. First let me note that it is much more difficult to predict climate change
impacts for specific areas than it is for the planet as a whole, because of the
significant complexities associated with changes in atmospheric circulation
and cycling of moisture. Further, even the most highly resolved climate
models still treat the Earth in large chunks compared to human scales-the
most recent GISS modelY5 for example, has a grid size of 4' longitude by3O
latitude-an area about 213 the size of South Dakota in a single grid square.
Nonetheless, certain forecasts can be made for mid-continental areas such
as South Dakota, which appear to be a robust feature of climate models.
Furthermore, a team of leading university and government scientists in the
Great Lakes region conducted an extensive study in 2003 of the likely
A climate model produced by NASA's Goddard Institute for Space Studies at Colwnbia University in New York.
Page 19

Direct Testimony of Ezra D. Hauslnan South Dakota Public Utilities Com~nission Case No. EL05-022
Joint Intervenors Exhibit 2
impacts of climate change in the Great Lakes area, including Minnesota,
which provides valuable guidance. The report, entitled "Confronting
Climate Change in the Great Lakes Region: Impacts on Ow Communities
and Ecosystems" ("Great Lakes Study"), was co-sponsored by the
Ecological Society of America and the Union of Concerned Scientists. I
consider this report to present scientifically sound, credible projections of
the likely impacts of climate change in the nearby region.
What approach did the Great Lakes Study use in forecasting local
impacts of increased atmospheric C02?
The Great Lakes Study based its analysis upon global climate simulations
using two of the world's leading climate models. In addition, they analyzed
historical climate and weather data to establish relationships between
climate trends (predictable by the models) and local temperature and
weather characteristics.
What did the Great Lakes Study team conclude about the likely
impacts of climate change on the region?
I will quote from the subreport, which deals specifically with impacts on
Minnesota, which is likely to be the closest proxy in this study for impacts
in Eastern South Dakota:
Climate Projections In general, Minnesota's climate will grow considerably wanner and probably drier during this century, especially in summer.
Temperatu~~e: By the end of the 21st century, temperatures are projected to rise 6-10 O F in winter and 7-16 O F in summer. This dramatic warming is roughly the same as the warming since the last ice age. Overall, extreme heat will be more common and the growing season could be 3-6 weeks longer.
Precipitation: While annual average precipitation may not change much, the state may grow drier overall because rainfall cannot compensate for the drylng effects of a warmer climate, especially in the summer. Seasonal precipitation in the state is likely to change, increasing in winter by 1540% and decreasing in summer by up to 15%. Minnesota, then, may well see drier soils and perhaps more
Page 20

Direct Testimony of Ezra D. Hausman South Dakota Public Utilities Coinmission Case No. EL05-022
Joint Intervenors Exhibit 2
droughts.
Extreme events: The frequency of heavy rainstorms, both 24-hour and multiday, will continue to increase, and could be 50-100% higher than today.
Ice cover: Declines in ice cover on the Great Lakes and inland lakes have been recorded during the past 100-150 years and are expected to continue.
How the Climate Will Feel These changes will dramatically affect how the climate feels to us. By the end of the century, the Minnesota summer climate will generally resemble that of current-day Kansas, and winters may be like those in current-day Wisconsin.
The report goes on to project specific impacts on the region, including
impacts on water resources, agriculture, human health, wetlands and
shorebirds, recreation and tourism, and forests and terrestrial wildlife.
Some of these impacts will be similar in South Dakota and some will not.
What is a consistent theme for all regions studied in this manner, however,
is that the seasonal temperatures, seasonal pattern of rainfall, growing
season, and other climate variables will be affected.
Q. Understanding that you cannot predict impacts on South Dakota itself
with great specificity, what can you predict in more general terms?
A. I can make a number of general predictions with fairly high level of
confidence. South Dakota is likely to experience increased heating for more
of the year, which will lead to increased evaporation and transpiration and
ultimately to decreased soil moisture. This is likely to harm both
agriculture and natural vegetation. There will be an increase in heat stress
as the number of extremely hot days increases, and an increase of heat-
related morbidity and mortality. Although total rainfall may not change
appreciably or may even increase, the region can expect an increased
probability of severe drying and drought in the summer months and
resulting ecological and economic damage.
Page 21

Direct Testimony of Ezra D. Hausman South Dakota Public Utilities Coinlnission Case No. EL05-022
Joint Intervenors Exhibit 2
As a result, plant and animal species that reside in South Dakota today will
be displaced, and others will encroach the state's habitats as conditions
change within the state and in the surrounding regions. Many species of
plants and animals will not be able to adapt to change and will become
extinct. Agricultural pests and diseases are likely to spread as a result of the
disruption of ecosystems. As a result of increased storm intensity, flooding
and pollution of streams fiom soil erosion can be expected to increase.
In addition, a large percentage of prairie wetlands will be damaged or dry
up, particularly the ephemeral seasonal wetlands that are so important to
waterfowl production, likely resulting in a loss of waterfowl population.
The impact on Prairie Pothole Region, wetlands and waterfowl will be
discussed more fully below.
Is it likely that most of the changes in the South Dakota climate will be
detrimental?
Yes. It is an unfortunate fact that most of the climate changes described in
the Great Lakes Study are likely to be detrimental to the environment of
South Dakota. In fact, any rapid change in hydrology, temperature,
seasonality, and habitat is likely to be economically and socially disruptive.
The ecosystem and agriculture of the state exist in a balance, which is
adapted to a certain set of climatic conditions, including a long-term range
of variability. Once this system is changed that balance is disturbed,
invariably resulting in damage to the natural system as it exists and is
valued today.
Is your testimony on these climate change trends supported by specific
findings and conclusions in the IPCC report, Working Group I?
Yes.
Page 22

Direct Testimony of Ezra D. Hausman South Dakota Public Utilities Commission Case No. EL05-022
Joint ~ntervenors Exhibit 2
Q. What are the key findings and conclusions from that Report on which
you rely?
A. The P C C Working Group I Summary for Policymakers contains the
following statements and forecasts which support the conclusions I have
presented:
1. "Increase of heat index over land areas" is projected to be "very likely, over most areas" during the 2 1" century. [p. 15, Table 11 [footnotes omitted].
2. "More intense precipitation events" are projected to be "very likely, over many areas" during the 21" century. [p. 15, Table 11 [footnotes omitted].
3. "Increased summer continental drylng and associated risk of drought" is projected to be "likely, over most mid-latitude continental interiors" in the 2 1" century. [p. 15, Table 11 [footnote omitted].
Q. Are you familiar with and have you reviewed a recent publication by
W. Carter Johnson and coauthors, entitled "Vulnerability of Northern
Prairie Wetlands to Climate Change", appearing in the October, 2005
issue of the journal ~ioscience?~
A. Yes.
Q. Can you summarize the approach taken by the researchers as reported
in this article?
A. The researchers base their analysis on global circulation models predictions
of future climate, with increased atmospheric CO?, in the Prairie Pothole
Region (PPR). The PPR extends from northern Iowa and Nebraska, across
most of the eastern Dakotas and up into Canada.
The authors then apply these climate conditions to a calibrated model of the
PPR wetlands to determine how the wetlands will respond and what the
6 Johnson, W.C., B.V. Millett, T. Gilrnanov, R.A. Voldseth, G.R. Guntenspergen and D.E. Naugle, "Vulnerability of Northern Prairie Wetlands to Climate Change", Biosciei7ce 55(1 O), pp. 863- 872, October, 2005.
Page 23

Direct Testimony of Ezra D. Hauslnan South Dakota Public Utilities Coimnission Case No. EL05-022
Joint Intervenors Exhibit 2
implications will be for migrating waterfowl, in what they refer to as the
"heart of the PPR's 'duck factory' during the 20th century." [p. 8691
Q. What do the authors conclude regarding expected future changes in
climate in this region?
A. Johnson and coauthors summarize the climate model results as follows:
Increased drought conditions in the PPR are forecast to occur under nearly all global circulation model scenarios. Regional climate assessments suggest that the central and northern Great Plains of the United States may experience a 3.6 "C to 6.1 OC increase in mean air temperature over the next 100 years. Longer growing seasons, milder winters in the north, hotter summers in the south, and extreme drought are projected to be a more common occurrence over the PPR. Trends in mean annual precipitation are more difficult to predict, and range from no change to an increase of 10% to 20% concentrated in the fall, winter, and spring, accompanied by decreased summer precipitation and a higher frequency of extreme spring and fall precipitation events. [pp. 864-865. References removed.]
Q. Can you comment on the conclusions reached in that article regarding
the impact of these changes on the ecology of the Prairie Pothole
Region?
A. The authors find that global climate change is likely to have a significant
negative effect on this region, and ultimately on the population of
waterfowl that use this region as a breeding ground:
The observed sensitivity of the model to climate variability suggests that wetlands in the drier portions of the PPR, such as the US and Canadian High Plains, would be especially vulnerable to climate warming, even if precipitation were to continue at historic levels. Only a substantial increase in precipitation would counterbalance the effects of a warmer climate. Additionally, the most productive wetlands, currently centrally located in the PPR, may become marginally productive in a warmer, drier future climate. Historically a mainstay for waterfowl, the region including the Dakotas and southeastern Saskatchewan would become a more episodic and less reliable region for waterfowl production, much as areas farther west have been during the past century. [p. 87 11
Page 24

Direct Testimony of Ezra D. Hausman South Dakota Public Utilities Comnission Case No. EL05-022
Joint Intervenors Exhibit 2
19 IX.
Interestingly, the authors find this to be the case even though some regions
will become wetter and others will become dryer:
A logical question is whether the favorable water and cover conditions in the eastern PPR that we simulated can compensate for habitat losses in the western and central PPR. Historically, the eastern PPR and northern parklands served as a safe haven for waterfowl during periodic droughts. Today, however, options are limited, because more than 90% of eastern PPR wetlands have been drained for agricultural production. Although wetland restoration programs have been under way since the mid-1980s, less than 1% of basins drained in Minnesota and Iowa have been restored. Restoration efforts in the east have developed slowly, largely because of the high cost of f m l a n d easements. Cpp.871-872, references removed]
Does this finding support your assertion, stated earlier, that "any rapid
change in hydrology, temperature, seasonality, and habitat is likely to
be economically and socially disruptive"?
Yes.
BIG STONE UNIT II's COz EMISSIONS
Are fossil-fired electric generation plants in the United States, such as
the proposed Big Stone Project. a significant contributor to the
production and build-up of these gases?
Yes. The United States contributes more than any other nation, by far, to
global greenhouse gas emissions on both a total and a per capita basis,
contributing 24 percent of the world C02 emissions from fossil fuel
consumption.
Coal-fired power plants in the United States already emit almost one-third
of U.S. emissions, or 8% of all the world's anthropogenic COz into the
atmosphere, a staggering contribution to the global buildup of greenhouse
gases. Further, recent analysis has shown that in 2004, power plant C02
Page 25

Direct Testimony of Ezra D. Hausman South Dakota Public Utilities Co~mnission Case No. EL05-022
Joint Intervenors Exhibit 2
emissions were 27 percent higher than they were in 1990.~ Coal fued
power plants are unquestionably a major and growing source of greenhouse
gases, and thus a significant cause of global climate change.
Q. Other than their relative contribution to increasing atmospheric COz
each year, are there any other characteristics of coal-fired power
plants like the proposed Big Stone Unit I1 that raise particular
concerns regarding climate change?
A. Yes. Large, base load coal plants in the United States are built to produce
electricity for decades, as long as 70 years in the case of some of the older
plants still operating today. The evidence I have presented and discussed in
my testimony shows that climate change is a serious threat to the
environment and to human societies, including that of South Dakota, and
that that threat is becoming increasingly obvious and severe. Today, the
United States is almost alone among industrialized nations in failing to
impose any cost on our electric sector or our industries for producing the
greenhouse gases that cause this problem. As a result, utilities around the
nation are making plans to invest in infrastructure that will emit CO, by the
millions of tons into the indefinite future. The Big Stone I1 proposal is a
good example of this shortsighted and distorted investment strategy.
Q. What would the lifetime emissions of COz from the Big Stone I1 Unit
be?
A. If built and operated as proposed, the Big Stone ll Unit would add over 4.5
million tons of CO? to the atmosphere every year of its operational life,
inexorably and significantly contributing to the buildup of greenhouse
gases in the atmosphere. Assuming it operates for fifty years, that amounts
to lifetime emissions of over 225 million tons of CO,. For perspective, this
lifetime production is roughly equal to the total amount of C02 produced
by the entire country of Spain in one year.
ELA, "Emissions of Greenhouse Gases in the United Sates, 2004;" Energy Infonnation Administration; December 2005, xiii
Page 26

Direct Testimony of Ezra D. Hausman South Dakota Public Utilities Coinmission Case No. EL05-022
Joint Intervenors Exhibit 2
1 Q. Could you compare the projected C02 emissions from the Big Stone I1
2 Unit to South Dakota emissions today?
3 A. The Big Stone 11 Unit's annual emissions would represent an enormous
4 increase in South Dakota's emission levels. According to the EPA,' South
5 Dakota's C02 emissions in 2001 (the last year for which these figures are
available) was 13.23 million tons. The Big Stone 11 Unit's emissions of
over 4.5 million tons per year of COz would therefore represent
approximately a 34% increase in the state's 2001 COz emissions. It would
more than double the current rate of emissions from the state's electric
sector (3.79 million tons).
The EPA states that the average annual C02 emissions for an American
automobile is about 6.75 tons.g At 4.5 million tons per year, emissions
from the Big Stone Unit II would be equivalent to emissions from almost
670,000 cars. According to the federal Department of Transportation, there
were fewer than 400,000 cars registered in South Dakota in 2004." This
means that the Big Stone Unit I1 is very likely to emit over two-thirds more
COz than all of the cars currently registered in South Dakota, combined.
Q. What is the significance of the Midwestern United States to the Global
Warming phenomenon?
A. The Midwest is America's heartland and responsible for 20% of the COz
emissions in the United States, and 5% of the world's total emissions. The
Midwest alone is responsible for more,global warming gas pollutants than
any country in the world other than the U.S. itself, China, the former Soviet
Union, India and Japan.
U.S. EPA, "Carbon Dioxide Emissions fioln Fossil Fuel Cornbustion (Million Metric Tons C02)," Prepared by the U.S. EPAusing DOEIEIA State Energy Consu~nption Data (2001) and EIIP einission factors.
U.S. EPA, "EPA's Personal Greenhouse Gas Calculator," states that 13,500 lbslyear of C02 emissions is "about average per vehicle."
lo Federal Highway Administration (Department of Transportation), "State Motor-Vehicle Registrations - 2004."
Page 27

Direct Testimony of Ezra D. Hausman South Dakota Public Utilities Co~nmission Case No. EL05-022
Joint Intervenors Exhibit 2
SCIENTIFIC CONCLUSIONS RELATED TO LEGAL STANDARDS
Based upon your background, education, training and experience,
your reading of the Governmental and non-governmental documents
and treatises, including those that you have described, and assuming
that the emissions from the proposed plant will operate as described in
the record, including emissions of over 4.5 million tons of C o t
annually, do you have an opinion to a reasonable level of scientific
certainty, as to whether the proposed Big Stone I1 facility will cause
irreversible changes anticipated to remain beyond the life of the
facility?
Yes. My opinion is that the emissions of over 4.5 million tons of C02 per
year from this proposed facility would cause irreversible damage to the
environment, especially considering its expected lifetime of 50 years or
more and the slow recovery time for atmospheric COz. These emissions
will contribute to elevated levels of CO2 in the atmosphere, to increased
radiative forcing of climate and to accelerated global climate change for
several centuries to come. I consider this to be a significant and irreversible
impact on the environment, both globally and in South Dakota.
Based upon your background, education, training and experience,
your reading of the Governmental and non-governmental documents
and treatises, including those that you have described, do you have an
opinion, to a reasonable level of scientific certainty, as to whether the
proposed Big Stone 11 facility will have cumulative or synergistic
adverse consequences in combination with other operating energy
conversion facilities, existing or under construction?
Yes. My opinion is that this facility will have a cumulative effect, in
combination with other operating energy conversion facilities, both existing
and under construction, of causing the level of atmospheric carbon dioxide
to be significantly elevated relative to what it would be without this plant.
The cumulative impact of coal-fired electrical generation plants in the
Page 28

Direct Testimony of Ezra D. Hausman South Dakota Public Utilities Co~nmission Case No. EL05-022
Joint Intervenors Exhibit 2
United States alone contributes about 8% of all anthropogenic COz
emissions today. This represents a substantial and growing contribution to
global warming and global climate change, and a considerable threat to the
environment globally and in South Dakota.
In dealing with a global problem such as warming, it is appropriate to look
at the cumulative impact of like facilities. This is particularly true of coal
fired electrical plants, since the number of plants is relatively small, but the
cumulative impact is great.
Q. Are you aware that the Administrative Rules of South Dakota provide
the following guidance in identifying the environmental, health and
welfare effects of a proposed electrical generation facility:
The environmental effects shall be calculated to reveal and assess demonstrated or suspected hazards to the health and welfare of human, plant and animal communities which may be cumulative or synergistic consequences of siting the proposed facility in combination with any operating energy conversion facilities, existing or under construction. ASDR 20:10:22:13.
A. Yes.
Q. Considering that definition of environmental effects, and based upon
those same assumptions and factors as in the previous two questions,
do you have an opinion as to whether this facility, considering the
cumulative effect which you have described in your previous answer,
will or will not pose a threat of serious injury to the environment or to
the social and economic condition of inhabitants or expected
inhabitants in the siting area?
A. Yes. In my opinion, the environmental effects of this facility will pose a
threat of serious injury to the environment in South Dakota and in the
broader region.
Page 29

Direct Testimony of Ezra D. Hausman South Dakota Public Utilities Co~nmission Case No. EL05-022
Joint Intervenors Exhibit 2
As noted in my earlier testimony, the continued growth of carbon dioxide
emissions fi-om coal fxed power plants as well as from other sources is
extremely likely to trigger dangerous and irreversible global climate
change. Any increase in emissions will increase the ultimate environmental
damage and social costs, as well as the likelihood of abrupt and potentially
catastrophic climate shifts. South Dakota, specifically, would expect severe
drying and droughts in the summer months, disruptive changes in
precipitation patterns in the winter, more intense storms, and adverse
impacts on local ecosystems and on,agriculture. We can expect harmhl
migration of pests, loss of a number of species of plants and animals due to
habitat destruction and migration and invasive species, and a severe impact
on the prairie pothole resource and its breeding waterfowl populations.
Based upon your background, education, training and experience,
your reading of the Governmental and non-governmental documents
and treatises, including those that you have described do you have
opinion as to whether the facility will or will not substantially impair
the health, safety or welfare of the inhabitants in South Dakota?
Yes. My opinion is that the environmental effects of the facility as
discussed above will substantially impair the health and welfare of the
inhabitants of South Dakota, along with those of the rest of the world.
Please explain your opinion.
The expected health impacts of climate change include morbidity and
mortality due to increased heat in the region, and expanded habitat for
disease vectors. Welfare impacts include the economic impacts expected to
agriculture, as well as the loss of recreational hunting grounds and loss of
the economic benefits of hunting, tourism and recreation in the region.
Page 30

Direct Testimony of Ezra D. Hausman South Dakota Public Utilities Co~mnission Case No. EL05-022
Joint Intervenors Exhibit 2
Q. Based upon your background, education, training and experience,
your reading of the Governmental and non-governmental documents
and treatises, including those that you have described, do you have an
opinion as to whether the facility will result in any pollution,
impairment, or destruction of the air, water, or other natural resources
or the public trust therein?
A. Yes. My opinion is that this facility will result in impairment of the air, by
increasing the carbon dioxide levels in the atmosphere. I state this based
both on the volume of carbon dioxide emissions that it will cause over its
lifetime, over 225 million tons, and on the fact that this will elevate the
carbon dioxide load of the atmosphere for several centuries. This facility,
by itself and cumulatively with other electrical generation plants, will
exacerbate the effects of global warming and global climate change. The
levels of carbon dioxide in the atmosphere will determine how much global
warming, and hence how much environmental damage, ultimately occurs.
Reducing carbon emissions now will have a definite impact on the ultimate
severity of climate impacts and on the ultimate costs of remediation.
Likewise, investments in infrastructure which materially increase those
emissions, will surely increase the severity of future impacts and costs.
This plant's emissions of carbon dioxide, by itself and cumulatively with
other electrical coal fired generation plants, will also impair the water
resources of South Dakota. This is because the adverse environmental
impacts of global warming, including changes in the patterns of
precipitation to which our ecosystems, our society and our agriculture are
adapted, will be made more severe than they would be without this plant or
without the cumulative effect of this and other electrical generation plants.
As noted elsewhere in my testimony, such water impairment will likely
include increasingly severe summer droughts, more intense storms and
extreme rainfall events, increased soil erosion and silting, and the loss of
Page 31
Direct Testimony of Ezra D. Hausinan South Dakota Public Utilities Colunission Case No. EL05-022
Joint Intervenors Exhibit 2
much of the prairie pothole wetland resource and its associated waterfowl
populations.
Q. In summary, what would you say is the significance of the Big Stone I1
plant to the problem of Global Warming, assuming that it will emit
over 4.5 million tons of COz each year for approximately the next 50
years, or longer?
A. The significance of the proposed plant is this: This plant, alone and in
combination with other energy conversion facilities, will contribute
materially and significantly to the environmental, social and economic
destruction associated with global climate change. We cannot pretend to be
protecting the environment of either South Dakota or the world at large
from this overwhelming threat while we continue to build long-lived
infrastructure that has exactly the opposite effect. In this respect, I conclude
that Big Stone Unit I1 will have a significant, long-term, and costly adverse
impact on the environment both in South Dakota and throughout the
region, the continent and the planet.
Q. Does this conclude your testimony?
A. Yes.
Page 32

Ezra D. Hausman, Ph.D. Synapse Energy Economics
22 Pearl Street, Cambridge, MA 02139 (617) 661-3248 ext. 242 e fax: (617) 661-0599
www.synapse-energy.com [email protected]
SUMMARY
I have worked since 1998 as an electricity market analyst with a focus on market design and market restructuring, as well as pricing of energy, capacity, transmission, losses and other electricity-related services. I have recently performed market analysis, prepared testimony and/or provided other expert support to clients in a number of areas, including:
Electricity and capacity price forcasting and asset valuation Efficient and cost-effective pricing of generating capacity The impact of environmental and other regulations, including future COz regulations, on electricity markets The role of the electric sector in addressing global climate change
e The impact of increased Liquefied Natural Gas (LNG) imports in the U.S. natural gas and electricity markets.
I hold a Ph.D. in atmospheric science from Harvard University, a Master's degree in applied physics from Harvard University, a Master's degree in water resource engineering from Tufts University, and a Bachelor of Arts degree from Wesleyan University.
PROFESSIONAL EXPERIENCE
Synapse Energy Economics Inc., Cambridge, MA. Research Associate, 2005-present. Conducting research, writing reports, and presenting expert testimony pertaining to consumer, environmental, and public policy implications of electricity industry regulation. Focus of work includes:
Electricity industry regulation and restructuring Efficient and cost-effective pricing of generating and transmission capacity Long-term electric power system planning and market design Electricity market analysis and price forecasting Impact of air quality and environmental regulations on electricity markets and pricing Natural gas and Liquified Natural Gas (LNG) market dynamics Energy efficiency and renewable energy programs and policies, and their role in the electricity market . Power plant performance and economics Market power and market concentration analysis in electricity markets
0 Consumer and environmental protection.
Joint Intervenors Exhibit 2 - 2687

Charles River Associates (CRA). Cambridge, MA. Senior Associate, 2004-2005. CRA acq~~ired Tabors Caramanis & Associates in October, 2004.
Tabors Caramanis & Associates. Cambridge, MA. Senior Associate, 1998-2004. Modeling and analysis of electricity markets, generation and transmission systems. Projects included:
Several market transition cost-benefit studies for development of Locational Marginal Price (LMP) based markets in US electricity markets Long-term market forecasting studies for valuation of generation and transmission assets,
0 Valuation of financial instruments relating to transmission system congestion and losses 0 Natural gas market analysis and price forecasting studies 0 Co-developed an innovative approach to hedging financial risk associated with
transmission system losses of electricity Designed, developed and ran training seminars using a computer-based electricity market simulation game, to help familiarize market participants and students in the operation of LMP-based electricity markets.
0 Developed and implemented analytical tools for assessment of market concentration in interconnected electricity -markets, based on the "delivered price test" for assessing market accessibility in such a network
o Performed regional market power and market power mitigation studies 0 Performed transmission feasibility studies for proposed new generation and transmission
projects in various locations in the US a Provided analytical support for expert testimony in a variety of regulatory and litigation
proceedings, including breach of contract, bankruptcy, and antitrust cases, among others.
Global Risk Prediction Network, Inc. Greenland, NH. Vice President, 1997-1998. Developed private sector applications of climate forecast science in partnership with researchers at Columbia University. Specific projects included a statistical assessment of grain yield predictability in several crop regions around the world based on global cIimate indicators (Principal Investigator); a statistical assessment of road salt demand predictability in the United States based on global climate indicators (Principal Investigator); a preliminary design of a climate and climate forecast information website tailored to the interests of the business community; and the development of client base.
Hub Data, Inc. Cambridge, MA. Financial Software Consultant, 1986-1987, 1993-1997. Responsible for design, implementation and support of analytic and communications modules for bond portfolio management software; and developed software tools such as dynamic data compression technique to facilitate product delivery, Windows interface for securities data products.
Abt Associates, Inc., Cambridge, MA. Environmental Policy Analyst, 1990-1991. Quantitative risk analysis to support federal environmental policy-making. Specific areas of research included risk assessment for federal regulations concerning sewage sludge disposal and pesticide use; statistical alternatives to Most-Exposed-Individual risk assessment paradigm; and research on non-point sources of water pollution.
Ezra D. Hausman, Ph.D. Page 2 Synapse Energy Economics, Inc. 2688

Massachusetts Water Resources Authority, Charlestown, MA. Analyst, 1988-1990. Applied and evaluated demand forecasting techniques for the Eastern Massachusetts service area. Assessed applicability of various techniques to the system and to regional planning needs; and assessed yieldlreliability relationship for the eastern Massachusetts water supply system, based on Monte-Carlo analysis of historical hydrology.
Somerville High School. Somerville, MA. Math Teacher, 1986-1987. Courses included trigonometry, computer programming, and basic math courses.
EDUCATION
Ph.D., Earth and Planetary Sciences. Harvard University, Cambridge, MA, 1997.
S.M., Applied Physics. Harvard University, Cambridge, MA, 1993.
M.S., Civil Engineering. Tufts University, Medford, MA, 1990.
B.A., Wesleyan University, Psychology. Middletown, MA, 1985.
i
FELLOWSHIPS AND AWARDS
UCAR Visiting Scientist PostdoctoraI Fellowship, 1997.
Postdoctoral Research Fello~vship, Harvard University, 1997.
Certificate of Distinction in Teaching, Haward University, 1997.
Graduate Research Fellowship, Harvard University, 1991-1997.
Invited Participant, UCAR Global Change Institute, 1993.
House Tutor, Leverett House, Harvard University, 1991-1993.
Graduate Research Fellowship, Massachusetts Water Resources Authority, 1989-1990.
Teaching Fellowships:
Harvard University: Principles of Measz~rement and Modeling in Atmospheric Chemisfry; Hydrology; Introdzlction to Environmental Science and Public Policy; The Atmosphere.
Wesleyan University: Introdz'2tction to Compz~ter Programming; Psychologiccil Statistics; Playwriting and Prodziction.
PUBLICATIONS AND FCEPORTS
Hausman, E.D., K. Takahashi, D. Schlissel and B. Biewald, "The Proposed Broadwater LNG Import Terminal: An Analysis and Assessment of Alternatives" Synapse Energy report on behalf of the Connecticut,Fund for the Environment and Save The Sound, March 2,2006.
Hausman, E.D., P. Peterson, D, White and B. Biewald, "RPM 2006: Windfall Profits for Existing Base Load Units in PJM: An Update of Two Case StudiesJ1 Synapse Energy report
Ezra D. Hausman, Ph.D. Page 3 Synapse Energy Economics, Inc.

prepared on behalf of Pennsylvania Office of Consumer Advocate and the Illinois Citizens Utility Board, February, 2006.
Hausman, E.D., K. Takahashi, and B. Bie~vald, "The Glebe Mountain Wind Energy Project: Assessment of Project Benefits for Vermont and the New England Region" Report prepared on behalf of Glebe Mountain.Wind Energy, LLC., February, 2006.
Hausman, E.D., K. Takahashi, and B. Biewald, "The Deerfield Wind Project: Assessment of the Need for Potver and the Economic and Environmental Attributes of the Project" Report prepared .on behalf of Deerfield Wind, LLC., January, 2006.
Hausman, E.D., P. Peterson, D. White and B. Bie~vald, "An RPM Case Study: Higher Costs for Consumers, Windfall Profits for Exe1ol-P Synapse Energy report to the Illinois Citizens Utility Board, October, 2005.
Hausman, E.D. and G. Keith, "Calculating Displaced Emissions from Energy Efficiency and Renewable Energy Initiatives" Content for EPA website, 2005 (in prep.)
Rudkevich, Am, E.D. Hausman, R.D. Tabors, J. BagnaI and C Kopel, "Loss Hedging Rights: A Final Piece in the LMP Puzzle" Hawaii Interizational Conference on System sciences, Hawaii, January, 2005 (acceptecl).
Hausman, E.D. and R.D. Tabors, "The Role of Demand Underscheduling in the California Energy Crisis" Hmvnii International Conference on System Sciences, Hawaii, January, 2004.
Hausman, E.D. and M.B. McElroy, The reorganization of the global carbon cycle at the last glacial termination, Global Biogeochemical Cycles, 13(2), 371 -381, 1999.
Norton, F.L., E.D. Hausman and M.B. McElroy, '(Hydrospheric transports, the oxygen isotope record, and tropical sea surface temperatures during the last glacial maximum" Paleoceanography, 12, 15-22,1997.
Hausman, E.D. and M.B. McElroy, "Variations in the oceanic carbon cycle over glacial transitions: a time-dependent box model simulation" presented at the spring meeting of the American Geophysical Union, San Fr'ancisco, 1996.
PRESENTATIONS AND WORKSHOPS
Energy Modeling Forum: Participant in coordinated academic exercise focused on modeling US and world natural gas markets, December, 2004.
Mnssachusetts Insiiizlte of Techizology (MIT): Guest lecturer in Technology and Policy Program on electricity market structure, the LMP pricing system and risk hedging with FTRs, 2002-2005.
LMP: The Ultimate Hands-on Seminar. Two-day seminar held at various sites to explore concepts of LMP pricing and congestion risk hedging, including lecture and market simulation exercises, July-December, 2003.
Ezra D. Hausman, Ph.D. Page 4 Synapse Energy Economics, Inc.
2690

Lerrrniizg to Live wit11 Locationrrl Mr~rginal Priciizg: F~in~lr~meiztnls nnd Hands-On Sinzulcrtion. Day-long seminar including on-line mock electricity market and congestion rights auction, December 2002.
LMP in California. Series of seminars on the introduction of LMP in the California electricity market, including on-line market simulation exercise. 2002.
EXPERT TESTIMONY
Illinois Pollution Control Board (Docket No. 332006-025) -April 2006 Prefile testimony on behalf of the Illinois EPA regarding the costs and benefits of proposed mercury emissions rule for Illinois power plants.
Federal Energy Regulatory Commission (Docket Nos. ER055-1410-000 and EL05-148-000) - February 2006 Affidavit filed on setting of model parameters for PJM's proposed RPM capacity market model.
State of Vermont Public Service Board -February 2006 Prefile testimony in s~pport of Certificate of Public Good pursuant to 30 V.S.A. $248 for proposed Catamount Wind Project.
State of Vermont Public Service Board -February 2006 Prefile testimony in support of Certificate of Public Good pursuant to 30 V.S.A. $248 for proposed Deerfield Wind Project.
Long Island Sound LNG Task Force - January 2006 Presentation of study on the need for and alternatives to the proposed ~rbadwater LNG storage and regasification facility in Long Island Sound.
Iowa Utilities Board (Docket No. SPU-05-15) -November 2005 Whether Interstate Power and Light's should be permitted to sell the Duane Arnold Energy Center nuclear facility to FPLE Duane Arnold, Inc., a subsidiary of Florida Power and Light.
Ezra D. Hausman, Ph.D. Page 5 Synapse Energy Economics, Inc.
Summary for PcaBicymakers
A R e p o r t of W o r k i n g G r o u p I of t h e I n t e r g o v e r n m e n t a l P a n e l o n C l i m a t e C h a n g e
Based on a draff prepared by: Daniel L. Albritton, Myles R. Allen, Alfons P. M. Baede, John A. Church, Ulrich Cubasch, Dai Xiaosu, Ding Yihui, Dieter H. Ehhalt, Christopher K. Folland, Filippo Giorgi, Jonathan M. Gregory, Dmid J. Griggs, Jim M. Haywood, Bruce Hewitson, John T. Houghton, Joanna I. House, Michael Hulme, Ivar Isaksen, Victor J. Jaramillo, Achuthan Jayaraman, Catherine A. Johnson, Fortunat Joos, Sylvie Joussaume, Thomas Karl, David J. Karoly, Haroon S. Kheshgi, Comne Le QuBr-5, Kathy Maskell, Luis J. Mata, Bryant J. McAvaney, Mack McFarland, Linda 0. Mearns, Gerald A. Meehl, L. Gylvan Meira-Filho, Valentin P. Meleshko, John F. B. Mitchell, Berrien Moore, Richard K. Mugara, Maria Noguer, Buruhani S. Nyenzi, Michael Oppenheirner, Joyce E. Penner, Steven Pollonais, Michael Prather, I. Colin Prentice, Venkatchalam Ramaswamy, Armando Ramirez-Rojas, Sarah C. B. Raper, M. Jim Salinger, Robert J. Scholes, Susan Solomon, Thomas F. Stocker, John M. R. Stone, Ronald J. Stouffer, Kevin E. Trenberth, Ming-Xing Wang, Robert T. Watson, Kok S. Yap, John Zillman
with contributions from many authors and reviewers.
Joint Intervenors Exhibit 2 - B
2 6 9.2

Summary %or Psl ieymakers
The Third Assessment Report of Working Group I of the Intergovernmental Panel on Climate. Change (IPCC) builds upon past assessments and incorporates new results from the past five years of research on climate change'. Many hundreds of scientists2 from many countries participated in its preparation and review.
This Summary for Policymakers (SPM), which was approved '
by P C C member governments in Shanghai in January 20013, - describes the current state of understanding of the climate system and provides estimates of its projected future evolution and their uncertainties. Further details can be found in the underlying report, and the appended Source Information provides cross references to the report's chapters.
A n i n c r e a s i n g b o d y of o b s e r v a t i o n s g i v e s a c o l l e c t i v e p i c t u r e of a w a r m i n g w o r l d a n d o t h e r c h a n g e s in the c l i m a t e s y s t e m . Since the release of the Second Assessment Report (SARJ), additional data from new studies of cunent and palaeoclimates, improved analysis of data sets, more rigorous evaluation of their quality, and comparisons among data from different sources have led to greater understanding of climate change.
The giobal average surface temperature has increased over the 20th century b y a b o u t 0.6"C.
e The global average surface temperature (the average of near surface air temperature over land, and sea surface temperature)
has increased since 1861. Over the 20th century the increase has been 0.6 4 0.2"C5s6 (Figure la). This value is about 0.1SoC larger than that estimated by the SAR for the period up to 1994, owing to the relatively high temperatures of the additional years (1995 to 2000) and improved methods of processing the data. These numbers take into account various adjustments, including urban heat island effects. The record shows a great deal of variability; for example, most of the warming occurred during the 20th century, during two periods, 1910 to 1945 and 1976 to 2000.
o Globally, it is very likely7 that the 1990s was the warmest decade and 1998 the warmest year in the instrumental record, since 1861 (see Figure la).
e New analyses of proxy data for the Northern Hemisphere indicate that the increase in temperature in the 20th century is likely7 to have been the largest of any century during the past 1,000 years. I t is also likely7 that, in the Northern Hemisphere, the 1990s was the warmest decade and 1998 the warmest year (Figure lb). Because less data are available, less is known about annual averages prior to 1,000 years before present and for conditions prevailing in most of the Southern Hemisphere prior to 1861.
e On average, between 1950 and 1993, night-time daily minimum air. temperatures over land increased by about 0.2"C per decade. This is about twice the rate of increase in daytime daily maximum air temperatures (O.laC per decade). This has lengthened the freeze-free season in many mid- and high latitude regions. The increase in sea surface temperature over this period is about half thal of [he mean land surface air temperature.
I Climate changa in IPCC usage refers to any change in climate over tlme, whaiher due to natural variability or as a result of human activity. This usage differs from that in the Framework Convention on Climate Change, where climate change refers to a change of climate that is attributed directly or indirectly to human activity that alters the composition of the global atmosphere and that is in addition to natural climate variability observed over comparable tlme periods.
2 In total 122 Co-ordinating Lead Authors and ~ e a d Authors, 515 Contributing Authors, 21 Review Editors and 420 Expert Reviewers.
Delegations of 99 IPCC member countries participated in the Eighth Session of Working Group I In Shanghai on 17 to 20 Janualy 2001.
The IPCC Second Assessment Report Is referred to in this Summary for Pollcymakers as the SAR.
Generally temperature trends are rounded to the nearest 0.05"G per unit tlme, the periods often being limited by data availability.
In general, a 5% statistical significance level is used, and a 95% confidence level.
In this Summaly for Pollcymakers and in the Technical Summary, the following words have been used where appropriate to indicate judgmental estimates of confidence: virtually certain (greater than 99% chance that a result is true); very likely (90-99% chance); likely (6690% chance); medium likelihood (33-66% chance); unlikely (10-33% chance); very unlikely (1-10% chance); excepfionally unfikely (less than 1% chance). The reader Is referred to individual chapters for more details.

. Variations of the Earth's surface temperature for:
(a) the past 140 years I 0 . 8 1 a 1 z 1 ' 1 ' 1 ' 1 ' 1 " l
GLOBAL - a 2~
0.4 2 a m o b g E- $ s' 0.0 $5 6 g ? 2 .r 5 g -0.4
6 g I Data from thermometers. ]
Year
(b) the past 1,000 years l ' ' a l ~ ~ ' l ' ' ' ~ ~ ' ~ ~ ' ' ' ~ ~
t NORTHERN HEMISPHERE
Zigure 1: Variations o f the Earth's surface temperature over the last
140 years and the last mlllenniurn.
[a) The Earth's surface temperature is
shown year by year (red bars) and
approximately decade by decade (black
line, a filtered annual curve suppressing
fluctuations below near decadal time-scales). There are uncertainties in
the annual data (thin black whisker bars represent the 95% coniidence range) due to data gaps, random
instrumental errors and uncertainties,
uncertainties in bias corrections in the ocean surface temperature data and
also in adjustments for urbanisation over
the land. Over both the last 140 years
and 100 years, the best estimate is that the global average surface temperature
has increased by 0.6 rt 0.2"C.
(b) Additionally, the year by year (blue
curve) and 50 year average (black
curve) variations of the average surface
temperature of the Northern Hemisphere
for the past 1000 years have been
reconstructed from "proxy" data calibrated against thermometer data (see
list of the main proxy data in the
diagram). The 95% confidence range in the annual data is represented by the grey region. These uncertainties increase
in more distant times and are always
much larger than in the instrumental record due to the use of relatively sparse
proxy data. Nevertheless the rate and
duration of warming of the 20th century
has been much greater than in any of
the previous nine centuries. Similarly, it
is likely7 that the 1990s have been the
warmest decade and 1998 the warmest
year of the millennium.
[Based upon (a) Chapter 2, Figure 2 .7~
and (b) Chapter 2, Figure 2.201
-1.0 s. &.I - -
Data from thermometers (red) and from tree rings, - corals, ice cores and historical records (blue).
I , I . # I , l , i I I I I I I I C
1000 1200 1400 1600 1800 2000 Year

Temperatures have risen during the past four decades in the lowest 8 kilometres o f the atmosphere.
o Since the late 1950s (the period of adequate observations from weather balloons), the overall global temperature increases in the lowest 8 kilometres of the atmosphere and in surface temperature have been similar at O.l°C per decade.
0 Since the start of the satellite record in 1979, both satellite and weather balloon measurcrnents show that the global average temperature of the lowest 8 kilometres of the atmosphere has changed by -1-0.05 t 0.1O0C per decade, but the global average surface temperature has increased significantly by -1-0.15 + 0.05"C per decade. The difference in the warming rates is statistically significant. This difference occurs primarily over the tropical and sub-tropical regions.
0 The lowest 8 kilometres of the atmosphere and the surface are influenced differently by factors such as stratospheric ozone depletion, atmospheric'aerosols, and the El Niiio phenomenon. Hence, it is physically plausible to expect that over a short time period (e.g., 20 years) there may be differences in temperature trends. In addition, spatial sampling techniques can also explain some of the differences in trends, but these differences are not fully resolved.
Snow cover a n d ice ex ten f have decreased.
o Satellite data show that there are very likely7 to have been decreases of about 10% in the extent of snow cover since the late 1960s, and ground-based observations show that there is very likely7 to have been a reduction of about two weeks in the annual duration of lake and river ice cover in the mid- and high latitudes of the ~ o r t h e r n Hemisphere, over the 20th century.
@ There has been a widespread retreat of mountain glaciers in non-polar regions during the 20th century.
0 Northern Hemisphere spring and summer sea-ice extent has decreased by about 10 to 15% since the 1950s. It is likely7 that there has been about a 4 0 5 decline in Arctic sea-ice thickness during late summer to early autumn in recent decades and a considerably slower decline in winter sea-ice thickness.
Global average sea level h a s risen and ocean heat content has increased.
0 Tide gauge data show that global average sea level rose between 0.1 and 0.2 metres during the 20th century.
0 Global ocean heat content has increased since the late 1950s, the period for which adequate observations of sub-surface ocean temperatures have been available.
Changes have also occurred in other imporfanf aspects o f climate.
0 It is very likely7 that precipitation has increased by 0.5 to 1 % per decade in the 20th century over most mid- and high latitudes of the Northern Hemisphere continents, and it is likely7 that rainfall has increased by 0.2 to 0.3% per decade over the tropical (1O0N to 10"s) land areas. Increases in the tropics are not evident over the past few decades. It is also likely7 that rainfall has decreased over much of the Northern Hemisphere sub-tropical (lOON to 30°N) land areas during the 20th century by about 0.3% per decade. In contrast to the Northern Hemisphere, no comparable systematic changes have been detected in broad latitudinal averages over the Southern Hemisphere. There are insufficient data to establish trends in precipitation over the oceans.
e In the mid- and high latitudes of the Northern Hemisphere over the latter half of the 20th centur): it is likely7 that there has been a 2 to 4% increase in the frequency of heavy precipitation events. Increases in heavy precipitation events can arise from a number of causes, e.g., changes in atmospheric moisture, thunderstorm activity and large-scale storm activity.
0 It is likely7 that there has been a 2% increase in cloud cover over mid- to high latitude land areas during the 20th century. In most areas the trends relate well to the observed decrease in daily temperature range.
e Since 1950 it is very likely7 that there has been a reduc.tion in the frequency of extreme low temperatures, with a smaller increase in the frequency of extreme high temperatures.

s Warm episodes of the El Niiio-Southern Oscillation (ENSO) phenomenon (which consistently affects regional variations of precipitation and temperature over much of the tropics, sub-tropics and some mid-latitude areas) have been more frequent, persistent and intense since the mid-1970s, compared with the previous 100 years.
e Over the 20th century (1900 to 1995), there were relatively small increases in global land areas experiencing severe drought or severe wetness. In many regions, these changes are dominated by inter-decadal and multi-decadal climate, variability, such as the shift in ENS0 towards more warm events.
e In some regions, such as parts of Asia and Africa, the frequency and intensity of droughts have been observed to increase in recent decades.
Some imporfant aspects o f climate appear not to have changed.
r A few areas of the globe have not warmed in recent decades, mainly over some parts of the Southein Hemisphere oceans and parts of Antarctica.
No significant trends of Antarctic sea-ice extent are apparent since 1978, the period of reliable satellite measurements.
Changes globally in tropical and extra-tropical storm intensity and frequency are dominated by inter-decadal to multi-decadal variations, with no significant trends evident over the 20th century. Conflicting analyses make it difficult to draw definitive conclusions about changes in storm activity, especially in the extra-tropics.
r No systematic changes in the frequency of tornadoes, thunder days, or hail events are evident in the limited areas analysed.
Emissions sf greenhouse g a s e s and aerosols d u e to human activities continue to alter the atmosphere i n ways t ha t are expected t o affect t h e c l imate . Changes in climate occur as a result of both internal variability within the climate system and external factors (both natural and anthropogenic). The influence of external factors on climate can be broadly compared using the concept of radiative forcings. A positive radiative forcing, such as that produced by increasing concentrations of greenhouse gases, tends to warm the surface. A negative radiative forcing, which can arise from an increase in some types of aerosols (microscopic airborne particles) tends to cool the surface. Natural factors, such as changes in solar output or explosive volcanic activity, can also cause radiative forcing. Characterisation of these climate forcing agents and their changes over time (see Figure 2) is required to understand past climate changes in the context of natural variations and to project what climate changes could lie ahead. Figure 3 shows current estimates of the radiative forcing due to increased concentrations of atmospheric constituents and other mechanisms.
Radiative forcing is a measure of the influence a factor has in altering the balance of incoming and outgoing energy in Ihe Earth-almosphere system. and is an index of the importance of \he factor as a potential climate change mechanism. It is expressed in Waits per square metre (Wm-2).

indicators of the human influence on the atmosphere during the Industrial Era
(a) Global atmospheric concentrations o f three well mixed greenhouse gases
360 Carbon dioxide 1.5
310 Nitrous oxide 0.15
- n
0.10
g 290 - . - _ - ' 270 ;. . - . -. -.. -
0.0 . -. - . 2501 . . . . ' . , , 1
1000 1200 1400 1600 1800 2000 Year
I (b) Sulphate aerosols deposi ted in Greenland ice
Figure 2: Long records of past changes in
atmospheric composition provide the context for
the influence of anthropogenic emissions.
(a) shows changes in the atmospheric
concentrations of carbon dioxide (CO,), methane
(CH,), and nitrous oxide (N,O) over the past 1000
years. The ice core and firn data for several sites in
Antarctica and Greenland (shown by different
symbols) are supplemented with the data from direct
atmospheric samples over the past few decades
(shown by the line for CO, and incorporated in the
curve representing the global average of CH,). The
estimated positive radiative forcing of the climate
system from these gases is indicated on the right-
hand scale. Since these gases have atmospheric
lifetimes of a decade or more, they are well mixed,
and their concentrations reflect emissions from
sources throughout the globe. Ail three records show
effects of the large and increasing growth in
anthropogenic emissions during the industrial Era.
(b) illustrates the influence of industrial emissions on
atmospheric suiphate concentrations, which produce
negative radiative forcing. Shown is the time history
of the concentrations of suiphate, not in the
atmosphere but in ice cores in Greenland (shown by
lines; from which the episodic effects of volcanic
eruptions have been removed). Such data indicate
the local deposition of sulphate aerosols at the site,
reflecting sulphur dioxide (SO,) emissions at
mid-latitudes in the Northern Hemisphere. This
record, aibeit.more regional than that of the
globally-mixed greenhouse gases, demonstrates the
large growth in anthropogenic SO, emissions during
the Industrial Era. The pluses denote the relevant '
regional estimated SO, emissions (right-hand scale).
[Based upon (a) Chapter 3, Figure 3.2b (CO,);
Chapter 4, Figure 4.la and b (CH,) and Chapter 4,
Figure 4.2 (N,O) and (b) Chapter 5, Figure 5.4a]
.... %... I . . ::.::. .. - . . -. . . .

Concentrations of atmospheric gre'enhouse g a s e s and their radiative forcing have continued to increase a s a resulY of human acf iv i t ies .
a The atmospheric concentration of carbon dioxide (CO,) has increased by 31% since 1750. The present CO, concentration has not been exceeded during the past 420,000 years and likely7 not during the past 20 million years. The current rate of increase is unprecedented during at least the past 20,000 years.
About three-quarters of the anthropogenic emissions of CO, to the atmosphere during the past 20 years is due to fossil fuel burning. The rest is predominantly due to land-use change, especially deforestation.
@ Currently the ocean and the land together are taking up about half of the anthropogenic CO, emissions. On land, the uptake of anthropogenic CO, very likely7 exceeded the release of CO, by deforestation during the 1990s.
@ The rate of increase of atmospheric CO, concentration has been about 1.5 ppmg (0.4%) per year over the past two decades. During the 1990s the year to year increase viried from 0.9 ppm (0.2%) to 2.8 ppm (0.8%). A large part of this variability is due to the effect of climate variability (e.g., El Niiio events) on CO, uptake and release by land and oceans.
0 The atmospheric concentration of methanc (CH,) has increased by 1060 ppbg (151%) since 1750 and continues to increase. The present CH, concentration has not been exceeded during the past 420,000 years. The annual growth in CH, concentration slowed and became more variable in the 1990s, compared with the 1980s. Slightly more than half of current CH, emissions are anthropogenic (e.g., use of fossil fuels, cattle, rice agriculture and landfills). In addition, carbon monoxide (CO) emissions have recently been identified as a cause of increasing CH, concentration.
The atmospheric concentration of nitrous oxide (N,O) has increased by 46 ppb (17%) since 1750 and continues to increase. The present N,O concentration has not been exceeded during at least the past thousand years. About a third of current N20 emissions are anthropogenic (e.g., agricultural soils, cattle feed lots and chemical industry).
o Since 1995, the atmospheric concentrations of many of those halocarbon gases that are both ozone-depleting and greenhouse gases (e.g., CFCI, and CF,CI,), are either increasing more slowly or decreasing, both in response to reduced emissions under the regulations of the Montreal Protocol and its Amendments. Their substitute compounds (e.g., CHF,Cl and CF3CH,F) and some other synthetic compounds (e.g., perfluorocarbons (PFCs) and sulphur hexafluoride (SF,)) are also greenhouse gases, and their concentrations are currently increasing.
o The radiative forcing due to increases of the well-mixed greenhouse gases from 1750 to 2000 is estimated to be 2.43 Wm-,: 1.46 Wm-2 from CO,; 0.48 Wm-2 from CII,; 0.34 Wm-2 from the halocarbons; and 0.15 Wm-2 from N,O. (See Figure 3, where the uncertainties are also illustrated.)
o The observed depletion of the stratospheric ozone (03) layer from 1979 to 2000 is estimated to have caused a negative radiative forcing (-0.15 Wm-,). Assuming full compliance with current halocarbon regulations, the positive forcing of the halcicarbons will be reduced as will the magnitude of the negative forcing from stratospheric.ozone depletion as the ozone layer recovers over the 21st century.
a The total amount of 0, in the troposphere is estimated to have increased by 36% since 1750, due primarily to anthropogenic ernissions'of several 0,-forming gases. This corresponds to a positive radiative forcing of 0.35 Wm-'. 0, forcing varies considerably by region and responds much more quickly to changes in emissions than the long- lived greenhouse gases, sich as-CO,.
--
ppm (parts per million) or ppb (parts per billion, I billion = 1.000 million) is the ratio of the number of greenhouse gas molecules to the total number of molecules of dry air. For example: 300 pprn means 300 molecules'of a greenhouse gas per million molecules of dry air.

Figure 3: Many external factors force climate change.
The global mean radiative forcing of the ciimate system for the year 2000, relative to 1750
3
- J- -
These radiative forcings arise from changes in the atmospheric composition, alteration of surface reflectance by land use, and variation in the output
of the sun. Except for solar variation, some form of human activity is linked to each. The rectangular bars represent estimates of the contributions of
these forcings - some of which yield warming, and some cooling. Forcing due to episodic volcanic events, which lead to a negative forcing lasting
only for a few years, is not shown. The indirect effect of aerosols shown 1s their effect on the size and number of cloud droplets. A second indirect
effect of aerosols on clouds, namely their effect on cloud lifetime, which'would also lead to a negative forcing, is not shown. Effects of aviation on
greenhouse gases are included in the individual bars. The vertical line about the rectangular bars jndicates a range of estimates, guided by the
spread in the published values of the forcings and physical understanding. Some of the forcings possess a much greater degree of certainty Jhan
others. A vertical line without a rectangular bar denotes a forcing for which no best estimate can be given owing to large uncertainties. The overall
level of scientific understanding for each forcing varies considerably, as noted. Some of the radiative forcing agents are well mixed over the globe,
such as CO,, thereby perturbing the global heat balance. Others represent perturbations with stronger regional signatures because of their spatial
distribution, such as aerosols. For this and other reasons, a simple sum of the positive and negative bars cannot be expected to yield the net effect
on the climate system. The simulations of this assessment report (for example, Figure 5) indicate that the estimated net effect of these perturbations
is to have warmed the global climate since 1750. [Based upon Chapter 6, Figure 6.61
Halocarbons - N2O Aerosols A
C"4 f \ - Black
co2 carbon from
fossil Tropospheric - fuel Mineral Aviation-induced ozone burning Dust A . Solar 1- A. T Contrails Cirrus T -
u
2 - I
E - m
n( .C 3 15 5 1 - 2 3 a, - n
1 0
= -
: I 3 V . A - . t3, - Stratospheric ' c organic ,- o z o n e 2 z' 0 E - 1 - + Sulphate burning a, 8 > .- .L - fuel ef (d
6 burning 2 -2 -
- - - -. .-
I - ,-. - Land- a
- Ae!osol u s e rndi-ect (albedo)
e c t only -
- . 4
High Medium Medium Low Very Very Very Very Very Very Very Very Low Low Low Low Low Low Low Low
Level of Scientific Understanding

Anthropogenic aerosols are short-lived and most ly produce negative rad ia t i ve forcing.
The major soul-ces of anthropogenic aerosols are fossil fuel and biomass burning. These sources are also linked to degradation of air quality and acid deposition.
0 Since the SAR, significant progress has been achieved in better characterising the direct radiative roles of different types of aerosols. Direct radiative forcing is estimated to be -0.4 Wm-2 for sulphate, -0.2 Wm-2 for biomass burning aerosols, -0.1 Wma2 for fossil fuel organic carbon and +0.2 Wm-2 for fossil fuel black carbon aerosols. There is much less confidence in the ability to quantify the total aerosol direct efrect, and its evolution over time, than that for the gases listed above. ~ e i o s o l s also vary considerably by region and respond quickly to changes in emissions.
a In addition to their direct radiative forcing, aerosols have an indirect radiative forcing through their effects on clouds. There is now more evidence for this indirect effect, which is negative, although of very uncertain magnitude.
Natural factors have made small contributions t o radiafive forcing over the past century.
The radiative forcing due to changes in solar irradiance for the period since 1750 is estimated td be about $0.3 Wm-2, most of which occurred during the first half of the 20th century. Since the late 1970s, satellite instruments have observed small oscillations due to the 11-year solar cycle. Mechanisms for the amplification of solar effects on climate have been proposed, but currently lack a rigorous theoretical or observational basis.
o Stratospheric aerosols from explosive volcanic eruptions lead to negative forcing, which lasts a few years. Several major eruptions occurred in the periods 1880 to 1920 and 1960 to 1991.
C o n f i d e n c e in t h e a b i l i t y of models t o project f u t u r e cI imate h a s i n c r e a s e d . Complex physically-based climate models are required to provide detailed estimates of feedbacks and of regional features. Such models cannot yet simulate all aspects of climate (e.g., they still cannot account fully for the observed trend in the surface-troposphere temperature difference since 1979) and there are particular uncertainties associated with clouds and their interaction with radiation and aerosols. Nevertheless, confidence in the ability of these models to provide useful projections of future climate has improved due fo their demonstrated performance on a range of space and time-scales.
8 Understanding of climate processes and their incorporalion in climate models have improved, including water vapour, sea-ice dynamics, and ocean heat transport.
8 Some recent models produce satisfactory simulations of current climate without the need for non-physical adjustments of heat and water fluxes at the ocean-atmosphere interface used in earlier models.
Simulations that include estimates of natural and anthropogenic forcing reproduce the observed large-scale changes in surface temperature over the 20th century (Figure 4). Howe\~er, contributions from some additional processes and forcings may not have been included in the models. Nevertheless, the large-scale consistency between models and obsenlations can be used to provide an independent check on projected warming rates over the next few decades under a given emissions scenario.
0 Some aspects of model simulations of ENSO, monsoons and the North Atlantic Oscillation, as well as selected periods of past climate, have improved.
@ - The combined change in radiative forcing of the two major natural factors (solar variation and volcanic aerosols) is estimated to be negative for the past two, and possibly the past four, decades.

There is new a n d s t r o n g e r ev idence t h a t mos t of t h e warming obse rved over t h e las t 50 y e a r s is a t t r ib- u tab le t o tiurnan ac t iv i t i es . The SAl? concluded: "The balance of evidence suggests a s Detection and attribution studies comparing model discernible human influence on global climate". That report simulated changes with the observed record can now take also noted that the anthsopogenic signal was still emerging from into account uncertainty in the magnitude of modelled the background of natural climate variability. Since the SAJL, response to external forcing, in particular that due to progress has been made in reducing uncertainty, particularly uncertainty in climate sensitivity. with respect to distinguishing and quantifying the magnitude
Most of these studies find that, over the last 50 years, the of responses to differen1 external influences. Although many
estimated rate and magnitude of warming due to increasing of the sources of uncertainty idenlified in the SAR still remain
concentrations of greenhouse gases- alone are comparable to some degree, new evidence and improved understanding
with, or larger than, the observed warming. Furthermore, support an updated conclusion.
most model estimates that take into account both There is a longer and more closely scsutinised temperature greenhouse gases and. sulphate aerosols are consistent with record and new model estimates of variability. The warming observations over this period. over the past 100 years is very unlikely7 to be due to internal variability alone, as estimated by current models. Reconstructions of climate data for the past 1,000 years (Figure lb) also indicate that this warning was unusual and is unlikely7 to be entirely natural in origin.
m There are new estimates of the climate response to natural and anthsopogenic forcing, and new detection techniques have been applied. Detection and attribution studies consis- tently find evidence for an antlropogenic signal in the climate~record of the last 35 to 50 years.
0 Simulations of the response to natural forcings alone (i.e., the response to variability in solar irradiance and volcanic eruptions) do not explain the warming in the second half of the 20th century (see for example Figure 4a). However, they indicate that natural forcings may, have contributed to the observed warming in the first half of the 20th centuly.
0 The warming over the last 50 years due to anthsopogenic greenhouse gases can be identified despite uncertainties in forcing due to anthropogenic sulphate aerosol and natural factors (volcanoes and solar irradiance). The anthropogenic sulphate aerosol forcing, while uncertain, is negative over this period and therefore cannot explain the warming. Changes in natural forcing during most of this period are also estimated to be negative and are unlikely7 to explain the warming.
e The best agreement between model simulations and observations over the last 140 years has been found when all the above anthropogenic and natural forcing factors are combined, as shown in Figure 4c. These results show that the forcings included are sufficient to explain the observed changes, but do not exclude the possibility that other forcings may also have contributed.
In the light of new evidence and taking into account the remaining uncertainties, most of the observed warming over the last 50 years is likely7 to have been due to the increase in greenhouse gas concentsations.
Furthermore, it is very likely7 that the 20th century walming has contributed significantly to the observed sea level rise, through thermal expansion of sea water and widespread loss of land ice. Within present uncertainties, observations and models are both consistent with a lack of significant acceleration of sea level rise during the 20th century.

*
Simulated annual global mean surface temperatures
(a) Natural (b) Anthropogenic 1 .o 1 .o
F - P - V)
(I)
a, 0.5 .- - .2 - 0.5 (d m
s 5 2 0.0 5 0.0 a, I
. F =I .a 4-8
e 2 a, -0.5 -0.5 a
E E
I- e . -1 .o -1 .o
1850 1900 1950 2000 1850 1900 1950 2000 Year Year
(c) All forcings 1 .o
P - fn - observations
0.5 m
5 C $ 0.0 L
3 .c. s g -0.5
E !-
-1 .o 1850 1900 1950 2000
Year
Figure 4: Simulating the Earth's temperature varlations, and comparing the results to measured changes, can provide insight into the
underlying causes of the major changes.
A climate model can be used to simulate the temperatlire changes that occur both from natural and anthropogenic causes. The simulations
represented by the band in (a) were done with only natural forcings: solar variation and volcanic activity. Those encompassed b; the band in (b) were
done with anthropogenic forcings: greenhouse gases and an estimate of sulphate aerosols, and those encompassed by the band in (c) were done with
both natural and anthropogenic forcings included. From (b), It can be seen that inclusion of anthropogenic forcings provides a plausible explanation for a substantial part of the observed temperature changes over the past century, but the best match with observations is obtained in (c)'when both
natural and anthropogenlc tactors are included. These results show that the forcings included are sufficient to explain the observed changes, but do
not exclude the possibility that other forcings may also have contributed. The bands of model results presented here are for lour runs from the same
model. Similar results to those in (b) are obtained with other models with anthropogenic forcing. [Based upon Chapter 12, Figure 12.71

Human inf luences will continue t o change atmospheric composi t ion throughout the 21 st century.
Models have been used to make projections of atmospheric concentrations of greenhouse gases and aerosols, and hence of future climate, based upon emissions scenarios from the IPCC Special Report on Emission Scenarios (SlES) (Figure 5). These scenarios were developed to update the IS92 series, which were used in the SAR and are shown for comparison here in some cases.
Greenhouse g a s e s
Emissions of CO, due to fossil fuel burning are virtually certain7 to be the dominant influence on the trends in atmospheric CO, concentration during the 21st century.
e As the CO, concentration of the atmosphere increases, ocean and land will take up a decreasing fraction-of anthropogenic CO, emissions. The net effect of land and ocean climate feedbacks as indicated by models is to further increase projected atmospheric CO, concentrations, by reducing both the ocean and land uptake of CO,.
e By 2100, carbon cycle models project atmospheric CO? concentrations of 540 to 970 ppm for the illustrative SRES scenarios (90 to 250% above the concentration'of 280 ppm in the year 1750), Figure 5b. These projections include the land and ocean climate feedbacks. Uncertainties, especially about the magnitude of the climate feedback from the terrestrial biosphere,.cause a variation of about -10 to +30% around each scenario. The total range is 490 to 1260 ppm (75 to 350% above the 1750 concentration).
@ Changing land use could influence atmospheric CO, concentration. Hypothetically, if all of the carbon released by historical land-use changes could be restored to the terrestrial biosphere over the course of the centuly (e.g., by reforestation), C02 concentration would be reduced by 40 to 70 ppm.
e Model calculations of the concentrations of the non-CO, greenhouse gases by 2100 vary considerably across the SRES illustrative scenarios, with CH, changing by -190 to +1,970 ppb (present concentration 1,760 ppb), N,O changing
by -1-38 to +I44 ppb (present concentration 316 ppb), total tropospheric O3 changing by -12 to +62%, and a wide range of changes in concentrations of HFCs, PFCs and SF6, all relative to the year 2000. In some scenarios, total tropos- pheric O3 would become as important a radiative forcing agent as CH4 and, over much of the Northern Hemisphere, would threaten the attainment of current air quality targets.
e Reductions in greenhouse gas emissions and the gases that conhol their concentration would be necessary to stabilise radiative forcing. For example, for the most important anthropogenic greenhouse gas, carbon cycle models indicate that stabilisation of atmospheric CO, concentrations at 450, 650 or 1,000 ppm would require global anthropogenic CO, emissions to drop below 1990 levels, within a few decades, about a century, or about two centuries, respectively, and continue to decrease steadily thereafter. Eventually CO, emissions would need to decline to a very small fraction of current emissions.
Aerosols
e The SRES scenarios include the possibility of either increases or decreases in anthropogenic aerosols (e.g., sulphate aerosols (Figure 5c), biomass aerosols, black and organic carbon aerosols) depending on the extent of fossil fuel use and policies to abate polluting emissions. I n addition, natural aerosols (e.g., sea salt, dust and emissions leading to the production of sulphate and carbon aerosols) are projected to increase as a result of changes in climate.
Radiative forcing over fhe 2 1 s t c e n t u r y
e For the SRES illustrative scenarios, relative to the year 2000, the global mean radiative forcing due to greenhouse gases continues to increase through the 21st century, with the fraction due to CO, projected to increase from slightly more than half to about three quarters. The change in the direct plus indirect aerosol radiative forcing is projected to be smaller in magnitude than that of CO,

Gioba izave rage t e m p e r a t u r e and sea level are p r o j e c t e d ' t o rise u n d e r at1 IPCC S R E S s c e n a r i o s . In order to make projections of future climate, models incorporate past, as well as future emissions of greenhouse gases and aerosols. Hence, they include estimates of walming to date and the commitment to.future warming from past emissions.
Temperature
a The globally averaged surface temperature is projected to increase by 1.4 to 5.8"C (Figure 5d) over the period 1990 to 2100. These results are for the full range of 35 SRES scenarios, based on a number of climate model^'^^".
e Temperature increases are projected to be greater than those in the SAR, which were about 1.0 to 3.5"C based on the six IS92 scenarios. The higher projected temperatures and the wider range are due primarily to the lower projected
.
sulphur dioxide emissions in the SRES scenarios relative to the IS92 scenarios.
e The projected rate of warming is much larger than the observed changes during the 20th century and is very likely7 to be without precedent during at least the last 10,000 years, based on palaeoclimate data.
a By 2100, the range in the surface temperature response across the group of climate models run with a given scenario is comparable to the range obtained from a single model run with the different SRES scenarios.
e On timescales of a few decades, the cursent observed rate of warming can be used to constrain the projected response to a given emissions scenario despite uncertainty in climate sensitivity. This approach suggests that anthropogenic
warming is likely7 to lie in the range of 0.1 Lo 0.2"C per decade over the next few decades under the IS92a scenario, similar to the corresponding range of projections of the simple model used in Figure 5d.
a Based on recent global model simulations, it is very likely7 that nearly all land areas will warm more rapidly than the global average, particularly those at northern high latihldes in the cold season. Most notable of these is the warming in the northern regions of North America, and northern and central Asia, which exceeds global mean warming in each model by more than 40%. In contrast,.the warming is less than the global mean change in south and southeast Asia in summer and in southern Sobth America in winter.
a~ Recent trends for surface temperature to become more El Niiio-like in the tropical Pacific, with the eastern tropical Pacific warming more than the western tropical Pacific, with a corresponding eastward shift of precipitation, are projected to continue in many models.
Precipitation
Based on global model simulations and for a wide range of scenarios, global average Water vapour concentration and precipitation are projected to increase during the 21st century. By the second half of the 21st century, it is likely7 that precipitation will have increased over northern mid- to high latitudes and Antarctica in winter. At low latitudes there are both regional increases and decreases over land areas. Larger year to year variations in precipitation are very likely7 over most areas where an increase in mean precipitation is projected.
'OComplex physically based climate models are the main tool for projecting future ciimate change. In order to explore the full range of scenarios, these are complemented by simple climate models calibrated to yield an equivalent response in temperature and sea level to complex climate models. These projections are obtained using a simple climate model whose climate sensitivity and ocean heat uptake are calibrated to each of seven complex ciimate models. The climate sensitivity used in the simple model ranges from 1.7 to 4.2'C, which is comparable to the commonly accepted range of 1.5 to 4.5"C.
11 This range does not include uncertainties in.the modelling of radiative forcing. e.g. aerosol forcing uncertainties. A small carbon-cycle climate feedback is included.

The global climate of the 21st century
(a) CO2 emissions (b) C 0 2 concentrations (c) SO2 emissions 0)
- S c s ~ r i o s
5 -. 2000 2020 2040 2060 2080 2100 2000 20h0 2040 2060 2d80 a 0 0 2000 2020 2040 2060 2080 2100
Year Year Year
(d) Temperature change (e) Sea level rise
2000 2020 2040 2060 2080 2100 Year Year
Figure 5: The global climate of the 21st century will depend on natural changes and the response of the climate system to human'activities.
Climate models project the response of many climate variables -such as increases in global surface temperature and sea level - to various
scenarios of greenhouse gas and other human-related emissions. (a) shows the CO, emissions of the six illustrative SRES scenarios, which are
summarised in the box on page 18, along with l'S92a for comparison purposes with the SAR. (b) shows projected CO, concentrations. (c) shows
anthropogenic SO, emissions. Emissions of other gases and other aerosols were included in the model but are not shown in the figure. (d) and (e)
show the projected temperature and sea level responses, respectively. The "several models all SRES envelope" in (d) and (e) shows the
temperature and sea level rise, respectively, for the simple model when tuned to a number of complex models with a range of climate sensitivities.
All SRES envelopes refer to the full range'of 35 SRES scenarios. The "model average all SRES envelope" shows the average from these models
for the range of scenarios. Note that the warming and sea level rise from these emissions would continue well beyond 2100. Also note that this
range does not allow for uncertainty relating to ice dynamical changes in the West Antarctic ice sheet, nor does it account for uncertainties in
projecting non-sulphate aerosols and greenhouse gas concentrations. [Based upon (a) Chapter 3, Figure 3.12, (b) Chapter 3, Figure 3.12, (c)
Chapter 5, Figure 5.13, (d) Chapter 9, Figure 9.14, (e) Chapter 11, Figure 11.12, Appendix I11

l2 Heat index: A combination of temperature and humidity that measures effects on human comfort.
Extreme Events
Table 1 depicts an assessment of confidence in observed For some other extreme phenomena, many of which may
changes in extremes of weather and climate during the latter have important impacts on the environment and society,
half ofthe 20th century (left column) and in projected changes there is currently insufficient information to assess recent
during the 21st century (right co l~rnn)~ . This assessment relies trends, and climate models currently lack the spatial detail
on obseIvationa1 and modelling studics, as well as the physical required to make confident projections. For example, very
plausibility of future projections across all commonly-used small-scale phenomena, such as thunderstorms, tornadoes,
scenarios and is based on expert judgement7. hail and lightning, are not simulated in climate models.
Table 1: Estimates of confidence in observed and projected changes in extreme weather and climate events.
Confidence in observed changes (latter half of the 20th century)
Likely7
Very likely7
Changes in Phenomenon 1 Confidence in projected changes (during the 21st century) '
I
Higher maximum temperatures and more ' Very likely7 I hot days over nearly all land areas I
! . Higher minimum temperatures, fewer 1 Very likely7 cold days and frost days over nearly
I all land areas 1
i Very likely7 I Reduced diurnal temperature range over Very likely7
Likely7, over many areas
most land areas
Increase of heat indexq2 over land areas Very likely7, over most areas
Likely7, over many Northern Hemisphere ! More intense precipitation eventsb I Very likely7, over many areas mid- to high latitude land areas . I Likely7, in a few areas Increased summer continental drying .Likely7, over most mid-latitude continental
and associated risk of drought i interiors. (Lack of consistent projections
Not observed in the few analyses available
Insufficient data for assessment
1 in other areas)
Increase in tropical cyclone peak wind Likely7, over some areas I intensitiesC
Increase in tropical cyclone mean and 1 Likely7, over some areas .peak precipitation IntensitiesC ! i
a For more details see Chapter 2 (0bSe~ali0nS) and Chapter 9, 10 (projections). For other areas, there are either insunicient data or conflicling analyses. Past and future changes in tropical cyclone location and frequency are uncertain.

8 Confidence in projections of changes in future frequency, amplitude, and spatial pattern of El Niiio events in the tropical Pacific is tempered by some shortcomings in how well El Niiio is simulated in complex models. Cursent projections show little change or a small increase in amplitude for El Niiio events over the next 100 years.
8 Even with little or no change in El Niiio amplitude, global warming is likely7 to lead to greater extremes of drying and heavy rainfall and increase the risk of droughts and floods that occus with El Niiio events in many different regions.
Monsoons
a It is likely7 that warming associated with increasing greenhouse gas concentrations will cause an increase of Asian summer monsoon precipitation variability. Changes in monsoon mean duration and strength depend on the details of the emission scenario. The confidence in such projections is also limited by how well the climate models simulate the detailed seasonal evolution of the monsoons.
Thermohaline circulation
@ Most models show weakening of the ocean thermohaline circulation which leads to a reduction of the heat transport into high latitudes of the Northern Hemisphere. I-Iowever, even in models where the thermohaline circulation weakens, there is still a warming over Europe due to increased greenhouse gases. The cursent projections using climate models do not exhibit a complete shut-down of the thermohaline circulation by 2100. Beyond 2100, the thermohaline circulation could completely, and possibly irreversibly, shut-down in either hemisphere if the change in radiative forcing is large enough and applied long enough.
Snow and ice
8 Northern Hemisphere snow cover and sea-ice extent are projected to decrease further.
e Glaciers and ice caps are projected to continue their widespread retreat during the 21st century.
@ The Antarctic ice sheet is likely7 to gain mass because of greater precipitation, while the Greenland ice sheet is likely7 to lose'mass because the increase in runoff will exceed the precipitation increase.
@ Concerns have been expressed about the stability of the West Antarctic ice sheet because it is grounded below sea level. However, loss of grounded ice leading to substantial sea level rise from this source is now widely agreed to be very unlikely7 during the 21st century, although its dynamics are still inadequately understood, especially for projections on longer time-scales.
Sea level
8 Global mean sea level is projected to rise by 0.09 to 0.88 metres between 1990 and 2100, for the full range of SRES scenarios. This is due primarily to thermal expansion and loss of mass from glaciers and ice caps (Figure 5e). The range of sea level rise presented in the SAR was 0.13 to 0.94 metres based on the IS92 scenarios. Despite the higher temperature change projections in this assessment, the sea level projections are slightly lower, primarily due to the use of improved models, which give a smaller contribution from glaciers and ice sheets.

A n t h r o p o g e n i c climate change will p e r s i s t f o r many c e n t u r i e s . @ Emissions of long-lived greenhouse gases (i.e., CO,, N,O,
PFCs, SF,) have a lasting effect on atmospheric composition, radiativ.e forcing and climate. For'exarnple, several centuries after CO, emissions occur, about a quarter of the increase in CO, concentration caused by these emissions is still present in the atmosphere.
@ After greenhouse gas concentrations have stabilised, global average surface temperatures would rise at a rate of only a few tenths of a degree per century rather than several degrees per century as projected for the 21st century without stabilisation. The lower the level at which concentrations are stabilised, the smaller the total temperature change.
@ Global mean surface temperature increases and rising sea level from thermal expansion of the ocean are projected to continue for hundreds of years after stabilisation of greenhouse gas concentrations (even at present levels), owing to the long timescales on which the deep ocean adjusts to climate change.
@ Ice sheets will continue to react to climate warming and contribute to sea level rise for thousands of years after climate has been stabilised. Climate models indicate that the local warming over Greenland is likely7'to be one to three times the global average. Ice sheet models project that a local warning of larger than 3"C, if sustained for millennia, would lead to virtually a complete melting of the Greenland ice sheet with a resulting sea level 'rise of about 7 metres. A local warning of 5.5"C, if sustained for 1,000 years, would be likely7 to result in a contribution from Greenland of about 3 metres to sea level rise.
S Current ice dynamic models suggest that the West Antarctic ice sheet could contribute up to 3 metres to sea lev& rise over the next 1,000 years, but such results are strongly dependent on model assumptions regarding climate change scenarios, ice dynamics and other factors.
F u r t h e r a c t i o n is r e q u i r e d t o a d d r e s s r e m a i n i n g g a p s in i n f o r m a t i o n and u n d e r s t a n d i n g . Further research is required to improve the ability to detect, attribute and understand climate change, to reduce uncertainties and to project future climate changes. In particular, there is a need for additional systematic and sustained observations, modelling and process studies. A serious concern is the decline of observational networks. The following are high priority areas for action.
@ Systematic observations and reconstructions:
- Reverse the decline of observational networks in many parts of the world.
- Sustain and expand the observational foundation for climate studies by psoviding accurate, long-term, consistent data including implementation of a strategy for integrated global observations.
- Enhance the development of reconstructions of past climate periods.
- Improve the obse~lrations of the spatial distribution of greenhouse gases and aerosols.
e Modelling and process studies:
- Improve understanding of the mechanisms and factors leading to changes in radiative forcing.
- Understand and characterise the important unresolved processes and feedbacks, both physical and biogeo- chemical, in the climate system.
- Improve methods to quantify uncertainties of climate projections and scenarios, including long-term ensemble simulations using complex models.
- Improve the integrated hierarchy of global and regional climate models with a focus on the simulation of climate variability, regional climate changes and extreme events.
- Link more effectively models of the physical climate and the biogeochemical system, and in turn improve coupling with descriptions of human activities.

Cutting across these foci are crucial needs associated with strengthening international co-operation and co-ordinatidn in order to better utilise scientific, computational and observational resources. This should also promote the free exchange of data among scientists. A special need is to increase the observational and research capacities in many regions, particularly in developing countries. Finally, as is the goal of this assessment, there is a continuing imperative to communicate research advances in terms that are relevant to decision making.
T h e Emissions Scenarios of t h e Special Report on Emissions Scenarios ( S R E S )
Al. The A1 storyline and scenario family describes a future world of very rapid economic growth, global population that peaks in mid-century and declines thereafter, and the rapid introduction of new and more efficient technologies. Major underlying themcs are convergence among regions, capacity building and increased cultural and social interactions, with a substantial reduction in regional differences in per capita income. The A1 scenario family develops into three groups that describe alternative directions of technological change in the energy system. The three A1 groups are distinguished by their technological emphasis: fossil intensive (AlFI), non-fossil energy sources (AlT), or a balance across all sources (AIB) (where balanced is defined as not relying too heavily on one particular energy source, on the assumption that similar improvement rates apply to all energy supply and end use technologies).
A2. The A2 stoiyline and scenario family describes a very heterogeneous world. The underlying theme is self-reliance and .preservation of local identities. Fertility patterns across regions converge very slowly, which results in continuously increasing population. Economic development is primarily regionally oriented and per capita economic growth and technological change more fragmented and slower than other storylines.
B1. The B1 storyline and scenario family describes a convergent world with the same global population, that peaks in mid- century and declines thereafter, as in the Al storyline, but with rapid change in economic structures toward a servicc and information economy, with reductions in material intensity and the introduction of clean and resource-efficient technologies. The emphasis is on global solutions to economic, social and environmental sustainability, including improved equity, but without additional climate initiatives.
B2. The B2 storyline and scenario family describes a world in which the emphasis 'is on local solutions to economic, social and environmental sustainability. It is a world with continuously increasing global population, at a rate lower than A2, intermedia~e levels of economic development, and less rapid and more diverse technological change than in the B 1 and A1 storylines. While the scenario is also oriented towards environmental protection and social equity, it focuses on local and regional levels.
An illustrative scenario was chosen for each of the six scenario groups AlB, AIFI, AlT, A2, B 1 and B2. All should be considered equally sound.
The SRES scenarios do not include additional climate initiatives, which means that no scenarios are included that explicitly assume implementation of the United Nations Framework Convention on Climate Change or the emissions targets of the Kyoto Protocol.

Source I n f o r m a t i o n : Summary f o r
P o l i c y m a k e r s
This appendix provides the cross-reference of the topics in the Summary for Policymakers (page and bullet point topic) to the sections of the chapters of the full report that contain expanded information about the topic.
A; increasing b o d y o f observaf ions gives a collective picture o f a warming world and other changes in the climate sys tem.
SPM Page Cross-Reference: SPM Topic -.Chapter Section
2 Tlze global avenge ssirfuce teil~per-atzire Izas increased over tlze 20112 centzliy by aborlt 0.6"C. 8 chapter 2.2.2 0 Chapter 2.2.2 0 Chapter 2.3 @ Chapter 2.2.2
4 Teil~pemhires have riser? rlzlring the past foru- decades iii the lowest 8 k~lonzetres of tlze atinosplzere. @ Chapter 2.2.3 and 2.2.4 0 Chapter 2.2.3 and 2.2.4 e Chapter 2.2.3,2.2.4 and Chapter 12.3.2
4 Srloli~ cover- and ice exter~t have decreased. All three bullet points: Chapter 2.2.5 and 2.2.6
4 Globnl avenge sea level has riseii and oceail heat corlterzt has irlcreased. 0 Chapter 11.3.2 0 Chapter 2.2.2 and Chapter 11.2.1
4 - 5 Clzarzges 11ave also occrirred in oflzer ir~zpot-fant aspects of cliriiate. 0 Chapter 2.5.2 8 Chapter 2.7.2 8 Chapter 2.2.2 and 2.5.5 @ chapter 2.7.2 0 Chapter 2.6.2 and 2.6.3 0 Chapter 2.7.3 0 Chapter 2.7.3
5 Sotrle iriiportalit aspects of cliil~ate appear not lo have clzailged. 8 Chapter 2.2.2 e Chapter 2.2.5 0 Chapter 2.7.3 0 Chapter 2.7.3
Emissions of greenhouse gases and . aerosols due to human activi t ies cont inue t o alter the atmosphere in ways tha t are expecied to a f f e c t the climate s y s t e m .
SPM Page Cross-Reference: SPM Topic - Chapter Section
5 Chapeau: "Changes in climate occur . . ." Chapter 1, Chapter 3.1, Chapter 4.1, Chapter 5.1, Chapter6.1,6.2,6.9,6.11and6.13
7 Coirceirtrntioils of atrizosplzeric gieelzlzor~se gmes and tlzeir radiative forcing have contiritied to iilcrease as a reszilf of lziii?~uri activities.
Carbon dioxide: Chapter 3.3.1, 3.3.2,3.3.3 and 3.5.1 o Chapter 3.5.1
Chapter 3.2.2, 3.2.3, 3.5.1 andTable 3.1 0 Chapter 3.5.1 and 3.5.2
Methane: o Chapter 4.2.1
Nitrous oxide: 0 Chapter 4.2.1
Halocarbons: e Chapter 4.2.2
Radiative forcing of well-mixed gases: 0 Chapter 4.2.1 and Chapter 6.3
Stratospheric ozone: Chapter 4.2.2 and Chapter 6.4
Tropospheric ozone: Chapter 4.2.4 and Chapter 6.5
9 Aritlzr-opogeriic aerasols are shori-lived and rizostly prodilce riegaiive radiative forcirrg. @ Chapter 5.2 and 5.5.4 e Chapter 5.1, 5.2 and Chapter 6.7 @ Chapter 5.3.2,5.4.3 and Chapter 6.8
9 Natrrral factors 11ave ilzade sri~all coi~tiibzitiot~s to radiative forcirlg over tlze pasf cerztz{ly. e Chapter 6.11 and 6.15.1 e Chapter 6.9 and 6.15.1 @ Chapter 6.15.1

Conf idence in t he a b i l i t y o f mode ls t o Globa l average temperature and sea leve l p ro jec t f u tu re c l imate has increased. a re pro jec ted t o r i se under a l l IPCC SR'ES
scenar ios. SPM Page Cross-Reference: SPM Topic - Chapter Section
9 Chapeau: "Complex physically-based . . ." SPM Page Cross-Reference: SPM Topic - Chapter Section Chapter 8.3.2, 8.5.1,8.6.1,8.10.3 and Chapter 12.3.2 13 Teiiipeiatilre Chapter 9.3.3 e Chapter 9.3.3
9 @ Chapter 7.2.1,7.5.2 and 7.6.1 @ Chapler 6.4.2 @ Chapter 2.2.2,2.3.2 and 2.4 Chapter 9.3.3 @ Chapter 8.6.3 and Chapter 12.3.2 and Chapter 10.3.2 Chapter 8.6.1, Chapter e Chapter 8.5.5, 8.7.1 and 8.7.5 12.4.3, Chapter 13.5.1 and 13.5.2
e Chapter 10.3.2 and Box 10.1 @ Chapter 9.3.2
i 3 Precipitntioil e Chapter 9.3.1, 9.3.6, Chapter There i s new and s t ronge r ev idence that 10.3.2 and Box 10.1 m o s t o f t h e warming observed over the l as t
15 Extl-eiize events Table 1: Chapter 2.1, 2.2,2.5, 50 years i s a f t r ibu tab le to human ac t iv i t ies .
2.7.2, 2.7.3, Chapter 9.3.6 and Chapter 10.3.2 SPM Page Cross-Reference: SPM Topic - Chapter Section s Chapter 2.7.3 and Chapter 9.3.6
10 Chapeau: "The SAR concluded: The balance of 16 El Nilio Chapter 9.3.5 chapter 9.3.5 . evidence suggests . . ." Chapter 12.1.2 and 12.6 16 Mor~sooi~s e Chapter 9.3.5
10 a Chapter 12.2.2, 12.4.3 and 12.6 16 T l z e ~ ~ ~ o l ~ a l i i ~ e circ~llatioil e Chapter 9.3.4 e Chapter 12.4.1, 12.4.2, 12.4.3 and 12.6 16 Si~ow ni~d ice 9 Chapter 9.3.2 @ Chapter 11.5.1 e Chapter 12.2.3, 12.4.1, 12.4.2, 12.4.3 and 12.6 e Chapter 11.5.1 Chapter 11.5.4 e Chapter 12.4.3 and 12.6. e Chapter 12.6 @ Chapter 12.4.3 e Chapter 12.4.3 and 12.6 16 Sen level e Chapter 11.5.1
10 "In the light of new evidence and taking into account the ..." Chapter 12.4 and 12.6 Anfh ropogen ic c l imate change will p e r s i s t
10 "Furthermore, i~ is very likely that the 20th f o r many centur ies . century warming has . , ." Chapter 11.4
SPM Page Cross-Reference: SPM Topic - Chapter Section
17 Chapter 3.2.3, Chapter 4.4 and Chapter 6.15 Human in f luences wil l con t i nue t o change e Chapter 9.3.3 and 9.3.4 Chapter 11.5.4 a tmospher i c c o m p o s i t i o n th roughou t the e Chapter 11.5.4 e Chapter 11.5.4 21sf century.
SPM Page Cross-Reference: SPM Topic - Chapter Section Fur ther work i s requ i red t o add ress 12 Chapeau: "Models have been used to make remain ing g a p s i n in fo rmat ion and
projections ..." Chapter 4.4.5 and Appendix 11 u n ders fand ing .
12 G7'ee11R011se gases 3.7.3 and SPM Page Cross-Reference: SPM Topic - Chapter Section e Chapter 3.7.1, 3.7.2, 3.7.3 and Appendix 11 e Chapter 3.7.3 and Appendix I1 17 - 18 All bullet points: Chapter 14, Executive Summary
e Chapter 3.2.2 and Appendix 11 a Chapter 4.4.5,4.5,4.6 and Appendix 11 e Chapter 3.7.3
12 Aerosols e Chapter 5.5.2, 5.5.3 and Appendix I1 12 Rndinrive forciilg over the 21st cent~uy
@ Chapter 6.15.2 and Appendix II

A Report of T'fTOrking Group II of tlze Ilztergo~)erlznz.entul Panel orz Cli~?lznte Clznrzge
This sz~~mizary, approved in detail at the Si~tli Session ofIPCC Vorl;i7zg Grozp II (Geneva, Switzer.larzd 13-1 6 Februa~y 2001), represerzts tlze fon7zalZy agreed staterlze7zt of tlze IPCC coizce77zi7zg tlze se7zsitivit)), adaptive capacity, aalzcl vul7zerabi2ity of rzatural and hta~iai7 systems to cli-nzate cl~ange, and tlze potential co~veqz~e~zces of cli7nnte clzarzge.
Based on a draft prepared by:
Q.K. Ahiiiad, Oleg Ai~isiinoi~, Nigel Amell, Saiiclrn Bro~vii, Iarl Brn.toi1. 1\4m Caiiipos, Osimlclo Caiizinizi. Tiii1ot11y Cartel; Stetvart J. Coheil. Pall1 Desoillcer, JTiLlimit Easlerliiig, B. Blair Fitzl~nrris, Doilnld Forbes, Habiba Gitay. Aiidrew~ Gitlzeko, Patrick Goltzalez, D~rone G~lbler: Sujatn Glpla, Anclreii~ Hairles, Hideo Hal-crsatvn, Jarle 6zge Holteil, Bzrbrr PnteA Jallo~v, Roger Jories, Zb i~ l ie i i~ Kzrrlcize~vicz, l\/lrtmri Lnl, Eiitilio Lebre Lo Rovere, Neil Leniy, Rilc Leeiiiai~s, Cllrtrizhei~ Lin, C11@ ~\hgadzn. A/lni?iii ~\llain~iizg, Luis Jose A4ata. Jaiiles A4cCartlg~. Roger A4cLea11, Anthoig~ n/Icn/fichnel. Kntlzleeil Millei; Ellail A4ills. IW. n/Ioi~irul Qnder Mirza, Dniziel M~ircliyarso. Leoiiard N~rrse, Caiilille Partilesari, A4ar-ti11 Pan34 Ioiiathaii Pclfz, ~\dicllel Petit, Olgo PiliJasovn. B a i ~ i e Pittock, JeffPrice, Ten31 Root, Cjliithia Roseiincleig, Jose Sarlrklzail, Johil Schelliilii~bei; Stephell Schileider; Roberl Scl~oles, Michael Scott, GrnIla111 Seiil, Barql Sillit, Joel Siilitk, Breilr Sohi~geil, Alln Tsybail, Jeaii-Pascal ilnn Ypersele, Pier T/eNir7ga, Ricl~arcl A'arrick, Ton1 Hfilbaillcs. Alistair A'oodtr~a~cl, Dallicl ATi~att, and ninny revie~oers.
Joint Intervenors Exhibit2-!712

CONTENTS
1. Introduction 3
Emergent Findings 2.1. Recent Regional Climate Changes, particularly Temperature Increases,
have Already Affected Many Physical and Biological Systems 2.2. There are Preliminary Indications that Some Human Systems have been Affected
by Recent Increases in Floods and Droughts 2.3. Natural Systems are Vulnerable to Climate Change, and Some will bcTrreversibly Damaged 2.4. Many Human Systems are Sensitive to Climate Change, and Some arevuherable 2.5. Projected Changes in Climate Extremes could have Major Consequences 2.6. The Potential for Large-Scale and Possibly Irreversible Impacts Poses Risks
that have yet to be Reliably Quantified 2.7. ~ d a ~ t a t i o n is a Necessary Strategy at All Scales to Complement Climate Change Mitigation Efforts 2.8 Those with the Least Resources have the Least Capacity to Adapt and are the Most Vulnerable 2.9. Adaptation, Sustainable Development, and ~nhanccrnent of Equity can be Mutually Reinforcing
Effects on and Vulnerability of Natural and Human Systems 3.1. Hydrology and Water Resources 3.2. Agriculture and Food Security 3.3. Terrestrial and Freshwater Ecosystems 3.4. Coastal Zones and Marine Ecosystems 3.5. Human Health 3.6. Human Settlements, Energy, and Industry 3.7. Insurance and Other Financial Services
4. Vulnerability Varies across Regions 14
5. Improving Assessments of Impacts, Vulnerabilities, and Adaptation 17

1, introduction . already affected a diverse set of physical and biological systems in many parts of the world. Examples of observed changes include
The sensitivity, adaptive capacity, and vulnerability of natural shrinkage of glaciers, thawing of permafrost, later freezing and and human systems to climate change, and the potential earlier break-up of ice on rivers and lakes, lengthening of mid- consequences of climate change, are assessed in the report of to high-latitude growing seasons, poleward and altitudinal Working Group I1 of the Intergovernmental Panel on Climate shifts of plant and animal ranges, declines of some plant and Change (IPCC), Clitilnfe Cllnrlge 2001' It~~pncrs, Arlnptntioti, animal populations, and earlier flowering of trees, emergence mld T'lllilet-nbili~~.I This report builds upon the past assessment of insects, and egg-laying in birds (see Figure SPM-1). '
reports of the IPCC, reexamining key conclusjons of the earlier Associations between changes in regional temperatures and assessments and incorporating results -from more recent observed changes in physical and biological systems have research?,3 been documented in many aquatic, terrestrial, and marine
environments. [2.1, 4.3, 4.4, 5.7, and 7.11 Observed changes in climate, their causes, and potential future changes are assessed in the report of Working Group 1 of the The studies mentioned above and illustrated in Figure SPM-1 IPCC, Clitllnte Cllntige 2001: Tlie Scierltific Bnsis. The were drawn from a literature survey, which identified long- Working Group I report concludes, iirter nlin, that the globally term studies, typically 20 years or more, of changes in biological averaged surface temperatures have increased by 0.6 h 0.2"C and physical systems that could be correlated wit11 regional over the 20th century; and that, for the range of scenarios changes in temperature.5 In most cases where changes in developed in the IPCC Special Repol? oti Eti~issiotr Scerlnrios biological and physical systems were detected, the direction of (SRES), the globally averaged surface air temperature is change was that expected on the basis of known mechanisms. projected by models to warm 1.4 to 5.8OC by 2100 relative to The probability .that the observed changes in the expected 1990, and globally averaged sea level is projected by models to direction (with no reference to magutude) could occur by chance rise 0.09 to 0.88 m by 2100. These projections indicate that the alone is negligible. In many parts of the world, precipitation- warming would vary by region, and be accompanied by increases related impacts may be important. At present, there is a lack of and decreases in precipitation. h addition, there would be changes systematic concurrent climatic and biophysical data of sufficient in the variability of climate, and changes in the frequency and len,gth (2 or more decades) that are considered necessary for intensity of some exneme climate phenomena. These general assessment of precipitation impacts. features of climate change act on natural and human systems and they set the context for the Working Group I1 assessment. Factors such as land-use change and pollution also act on these The available literature has not yet investigated climate change physical and biological systems, making it difficult to attribute impacts, adaptation, and vulnerability associated with the upper end of the projected range of warming.
This Summary for Policymakers, which was approved by P C C member governments in Geneva in February 2001, describes the current state of understanding of the impacts, adaptation, and vulnerabiiity to climate change and their uncertainties. Further details can be found in the underlying report.4 Section 2 of the Summary presents a number of general findings that emerge from integration of information across the full report. Each of these fnldings addresses a different dimension of climate change impacts, adaptation, and vulnerability, and no one dimension is paramount. Section 3 presents fuldings regarding individual natural and human systems, and Section 4 highlights some of the issues of concern for different regions of the world. Section 5 identifies priority research areas to further advance
changes to particular causes in some specific cases. However, taken together, the observed changes in these systems are consistent in direction and coherent across diverse localities
ICliirlute cl~atlge in IPCC usage refers to any change in climate over time, whether due to natural variability or as a result of human activity. This usage differs from that in the Framework Convention on Climate Change, where clir?rote cl~nr~ge refers to a change of climate that is attributed directly or indirectly to human activity that alters the composition of the global atmosphere and that is in addition to natural climate variability observed over comparable time periods. Attribution of climate change to natural forcing and human activities has been addressed by Working Group I.
'The report has been written by 163 Coordinating Lead Authors and Lead Authors, and 243 Contributing Authors. It was reviewed by
.440 government and expert reviewers, and 33 Review Editors understanding of the potential consequences of and adaptation oversaw the review process. to climate change. 3Delegations from 100 F C C member countries participated in the
Sixth Session of Working Group II in Geneva on 13-16 February 2001. M more comprehensive summary of the report is provided in the
2. Emergent Findings Technical Summary, and relevant sections of that volume are referenced in brackets at the end of paragraphs of the Summary for - - . Policymakers foireaders who need more information.
2.1. Rccclit Rc~ionnl Clilrinte Clznrlges, pnrticlrlflrb~ jThere are 44 regional studies of over 400 plants and animals, which Tetrrpernt~ire I~tcreuses, Jrnve Alrsndj~ Affected vaned in length from about 20 to 50 years, mainly from North M n l ~ y Pl~j~sicrtl ni~d Biologicnl Sjlstenls America, Europe, and the southern polar region. There are 16
regional studies covering about 100 physical processes over most Available observational evidence indicates that regional regions of the world, tvhich varied in length from about 20 to 150 changes in climate, particularly increases in temperature, have years. See Section 7.1 of the Technical Summary for more detail.

Hydrology Sea Ice Animals Plants Stmtlies covering ~tudies' using and Glaciers Large Areas Remote Sensing
Figure SPM-1: Locations at which systematic long-term studies meet stringent criteria documenting recent temperature-related regional climate change impacts on physical and biological systems. Hydrology, glacial retreat, and sea-ice data represent decadal to century trends. Terrestrial and marine ecosystem data represent trends of at least 2 decades. Remote-sensing studies cover large areas. Data are for single or multiple impacts that are consistent with knownmechanisms of physicalbiological system responses to observed regional temperature-related changes. For reported impacts spanning large areas, a representative location on the map was selected.
and/or regions (see Figure SPM-1) with the expected effects of regional changes in temperature. Thus, from the collective evidence, there is high coizjidence6 that recent regional changes in temperature have had discernible impacts on many physical and biological systems.
% this Summary for Policymalcers, fhe following words have been used where appropriate to indicate judgmental estimates of confidence (based upon the collective judgment of the authors using the observational evidence, modeling results, and theory that they have examined): vely high (95% or greater), big11 (67-95%), iiledirm~ (33-67%), low (5-33%), and v e ~ y lo~v (5% or less). In other instances, a qualitative scale to gauge the level of scientific understanding is used: well establisl~ecl, estnblislied-br~t-il7co1~piete, coapeling explni~nliotu, and spec~rlative. The approaches used to assess confidence levels and the level of scientific understanding, and the definitions of these terms, are presented in Section 1.4 of the Technical Summary. Each time these terms are used in the Summary for Policymakers, they are footnoted and in italics.
2.2. Tl1ei.e are Preliirrinmy bldicntiotls i11nt Some H I I ~ I ~ ) I Spte111s have been Affected bjr Recent Increnses jilt Floods nnd D~~or~glrts
There is emerging evidence that some social and economic systems have been affected by the recent increasing frequency of floods and droughts in some areas. However, such systems are also affected by changes in socioeconomic factors such as demographic shifts and land-use changes. The relative impact of climatic and socioeconomic factors are generally difficult to quantify. [4.6 and 7.11
Natural systems can be especially vulnerable to climate change because of limited adaptive capacity (see Box SPM-I), and some of these systems may undergo significant and irreversible damage. Natural systems at risk include glaciers, coral reefs and

atolls, mangroves, boreal and tropical forests, polar and alpine ecosystems, prairie wetlands, and remnant native grasslands. While some species may increase in abundance or range, climate
change will increase existing risks of extinction of some more vuhierable species and loss of biodiversity. It is lilell-eslablishedG that the geographical extent of the damage or loss, and the number of systems affected, will increase with the magnitude and rate of climate change (see Figure SPlvl-2). [4.3 and 7.2.11
Human systems that are sensitive to climate change include mainly water resources; agriculture (especially food security) and forestry; coastal zones and marine systems (fish.eries); human settlements, energy, and industry; insurance and other financial services; and 11uma1l health. The vulnerability of these systems varies with geographic location, time, and social, economic, and environmental conditions. [4.1, 4.2, 4.3, 4.4, 4.5,4.6, and 4.71
Projected adverse*impacts based on models and other studies include:
A general reduction in potential crop yields in most tropical and sub-tropical regions for most projected increases in temperature [4.2] A general reduction, with some variation, in potential crop yields in most regions in mid-latitudes for increases in annual-average tk~nperature of more than a few "C [4.2] Decreased water availability for populatiolls in many water-scarce regions, pa~ticularly in the sub-tropics [4.1] An increase in the number of people exposed to vector- home (e.g., malaria) and water-borne diseases (e.g., cholera), and an increase in heat stress mortality [4.7] A widespread increase in the risk of flooding for many hu~nan settlements (tens of millions of inhabitants in settlements studied) from both increased healy precipitatioii events and sea-level rise 14.51 increased energy demand for space cooling due to higher summer temperatures. [4.5]
1990 Renso~zs for Coriceni
Several Models
2000 Year
Risks from Estreme Climate Events 111 Distribution of hnpacts IV Aggregate lrnpacts
Figure SPR'I-2: Reasons for concern about projected climate change impacts. The risks of adverse impacts from climate change increase with the magnitude.of climate change. The left part of the figure displays the observed temperature increase relative to 1990 and the range of projected temperature increase after 1990 as estimated by Working Group I of the IPCC for scenarios from the Special Report on E~i~issioris Scerlnrios. The right panel displays conceptualizations of five reasons for concern regarding climate change risks evolving through 2100. White indicates neutral or small n e g ~ i v e or positive impacts or risks, yellow indicates negative impacts for some systems or low risks, and red means ne~ative impacts or risks that are more widespread andlor greater in magnitude: The assessment of impacts or risks takes into account only the magnitude s f change and not the rate of change. Global mean annual temperature change is used in the figure as a proxy for the magnitude of climate change, but projected impacts will be a function of, among other factors, the magnitude and rate of global and regional changes in mean climate, climate variability and extreme climate phenomena, social and economic conditions, and adaptation.

Cliliinte Change 2001: Ililpacts, Ad~pfafiorz, and Yzrlrzembility
Box SPM-1. Climate Change '
Sensitivity, Adaptive Capacity, and Vulnerability
~eiisitivity is the degree to which a system is affected, either adversely or beneficially, by climate-related stimuli. Climate-related stimuli encompass all the elements of climate change, including mean climate characteristics, climate variability, and the frequency and ma,pitude of extremes. The effect may be direct (e.g., a change in crop yield in response to a change iu the mean, range, or variability of temperature) or indirect (e.g., damages caused by an increase in the frequency of coastal flooding due to sea-level rise).
Arlnptiite capacity is the ability of a system to adjust to climate change (including climate variability and extremes) to moderate potential damages, to take advantage of opportunities, or to cope with the consequences.
K~liwczbilig~ is the degree to which a system is susceptible to, or unable to cope with, adverse effects of climate
decrease in the future, with both positive and negative impacts. The impactsof future changes in climate extremes are expected to fall disproportionately on the poor. Some representative examples of impacts of these projected changes in climate variability and climate extremes are presented in Table SPM-1. [3.5,4.6, 6, and 7.2.41
2.6. TIre Potelztinl for Lulpe-Scab nrzdPossiblj1 Irreversible I112pncts Poses Bisks tliat I~nve yet to be Reliably Q~lnizfified
Projected climate changes' during the 21st century have the potential to lead to future large-scale and possibly irreversible changes in Earth systems resulting in impacts at continentai and global scales. Thesc possibilities are very climate scenario- dependent and a 1 1 1 range of plausible scenarios has not yet been evaluated. Examples include significant slowing of the ocean circulation that transports w m water. to the North Atlantic, large reductions in the Greenland and West Antarctic Ice Sheets, accelerated global warming due to carbon cycle feedbacks in the terrestrial biosphere, and releases of terres,trial
change, including climate variability and extremes. carbon from permafrost regions and methane from hydrates in Vulnerability is a function of the character, magnitude, coastal sediments. The likelihood of many of these changes in
include: If these changes in Earth systems were to occur, their impacts
and rate of climate change and variation to which a system is exposed, its sensitivity, and its adaptive capacity.
would be widespread and sustained. For example, significant - Increased potential crop yields in some regions at slowing of the oceanic thermohaline circulation would impact
Earth systems- is not well-known, but is probably very low; however, their lilcelihood is expected to increase with the rate, magnitude, and duration of climate change (see Figure SPM-2).
mid-latitudes for increases in temperature of less than deep-water' oxygen levels and carbon uptake by oceans and
[3.5, 5.7, and 7.2.51 Projected beneficial impacts based on models and other studies
a few OC [4.2] marine ecosystems, and would reduce warming over parts A potential increase in global timber supply from of Europe. Disintegration of the West Antarctic Ice Sheet or appropriately managed forests [4.3] melting of the Greenland Ice Sheet could raise global sea level Increased water availability for populations in some up to 3 m each over the next .1,000 years8, submerge many water-scarce regions-for example, in parts of southeast islands, and inundate extensive coastal areas. Depending on the Asia [4.1] rate of ice loss, the rate and ma,pitude of sea-level rise could Reduced winter mortatity in mid- and high-latitudes f4.71 greatly .exceed the capacity of human and natural systems to Reduced energy demand for space heating due to adapt without substantial impacts. Releases of terrestrial higher winter temperatures. [4.5] carbon from permafrost regions and methane from hydrates in
coastal sediments, induced by warming, would further increase greenhouse gas concentrations in the atmosphere and amplify
2.5. Projected Clzmzgis ill Cliiirate Extreiires corllrl have climate change. [3.5,5.7, and 7.2.51 Major Corzseqrrerrces
The vulnerability of human societies and natural systems to 2.7. Aduptation is n Necessnry Strnte,qy at All Scnles to climate extremes is dem0nstrated.b~ the damage, hardship, and Coriplenlertt Cliaiate Cl~nrtge Mitigntion Efforts death caused by events such as droughts,' floods, heat waves, avalanches, and windstorms. Arhile there are uncertainties Adaptation has the potential to reduce adverse impacts of climate attached to estimates of such changes, some extreme events are change and to enhance beneficial impacts, but will incur costs projected to increase in frequency andlor severity during the 21st century due to changes in the r ~ e a n and/or variability of 7Details of projected climate changes, illustrated inFiwre SPbI-2, climate, so it can be expected that the severity of their impacts a,, provided in the Working &oup I Summary forPoligrmakers. will also increase in concert with global warming (see Fi,we SDetails of projected contributions to sea-level n'se from the West SPM-2). Conversely, the frequency and magnitude of extreme Anarctic Ice Sheet and Greenland Ice Sheet are provided in the low temperature events, such as cold spells, is projected to Working Group I Summary for Policymakers.

Projected Changes during the 21" Century in Extreme Climate Representative Esamples of Projected Impacts" Phenomena and their LilceIilioodl' (all hig11 co~lfiderlce of occrrrrence it? some nrensc)
Siirrple Estrenrcs
Higher rnaxi~num temperatures; more hot . Increased incidence of death and serlous illness in older age groups and urban days and heat wavesd over nearly all land poor [4.7] areas (very like/~~a) Increased heat stress in livestock and wildlife [4.2 and 4.31
Shift in tourist destinations [Table TS-4 and 5.81 Increased risk of damage to a number of crops [1.2] Increased elecrric cooling demand and reduced energy supply reliability [Table TS-4 and 4.51
Higher (increasing) minimum temperatures; . Decreased cold-related human morbidity and mortality [4.7] fewer cold days, frost days, and cold Decreased risk of damage to a number of crops, and hcreased risk to others [4.2] wavesd over nearly all land areas - Extended range and activity of some pest and disease vectors [4.2 and 4.31 (ve1-y liIce!]~o) Reduced heating energy demand [4.5] --
More intense precipitation events Increased flood, landslide, avalanche, and mudslide damage [4.5] (~lety likelya over many areas) Increased soil erosion L5.2.41
Increased flood runoff could increase recharge of some floodplain aquifers 14.11 Increased pressure on govemnent and private flood insurance systems and disaster relief [Table TS-4 and 4.61
Increased summer drying over most mid-latitude co~ltinental interiors and associated risk of drought (likeljla)
Increase in tropical cyclone peak wind intensities, mean and peak precipitation intensities (like@ over some areas)=
Decreased crop yields [4.2] Increased damage to building foundatioiis caused by ground shrinkage [Table TS4] ~ecreased water resource quantity and quality 14.1 and 4.51 Increased risk of forest fire [5.4.2]
Increased risks to human life, risk of infectious disease epidemics, and many other risks [4.7] Increased. coastal erosion and damage to coastal buildings and infrastructure [4.5 and 7.2.41 Increased damage to coastal ecosystems such as coral reefs and mangroves [4.4]
Intensified droughts and floods associated with El Niiio events in many different regions (likely~) (.see also under droughts and intense precipitation events)
Increased Asian summer monsoon precipitation variability (likeba)
Increased intensity of mid-latitude storms (little agreement behveen current model@
Decreased agricultural and rangeland productivity in drought- and flood-prone regions [4.3] Decreased hydro-power potential in drought-prone regions [5.1.1 and Figure TS-71
Increased flood and drought magnitude and damages in temperate and tropical Asia [5.2.4]
Increased risks to human life and health [4.7] * Increased property and infrastructure losses [Table TS-41
Increased damage to coastal ecosystems [4.4]
aLikelihood refers to jud-mental estimates of confidence used by TAR WGl: very likek (90-99% chance); lilrel.1. (66-90% chance). Unless orhenvise stated, information on clima~e phenomena is taken Erom the Summary for Policymakers, TAR WGI.
bThese impacts can be lessened by appropriate response measures. CHigh confidencerefers to probabilities beween 67 and 95% as described in Footnote 6. dlnfonnation from TAR WGI, Technical Summary. Section F.5. CChanges in regional distniution or tropical cyclones ars possible b u ~ have not been established.

Cli)iznte Clzalnltge 2001: Iiirpncts, Adptnzion, and V~rirrernbilit~~
and will not prevent all damages. Extremes, variability, and rates of change are all key features in addressing vulnerability and adaptation to climate change, not. simply changes in average climate conditions. Human and natural systems will to some degree adapt autonomously to climatc change. Planned adaptation can supplement autonomous adaptation, though options and incentives are greater for adaptation of human systems than for adaptation to protect natural systems. Adaptation is a necessary strategy at all scales to complement climate change mitigation efforts. [6]
Experience with adaptation to climate variability and extremes can be drawn upon to develop appropriate strategies for adaptkg to anticipated climate change. Adaptation to current climate variability and extremes often produces benefits as well as forming a basis for coping with future climate change. However, experience also demonstrates that there are constraints to achieving the full measure of potential adaptation. In addition, maladaptation, such as promoting development in risk-prone locations, can occur due to decisions based on short-term considerations, neglect of known climatic variability, imperfect foresight, insufficient information, and over-reliance on insurance mechanisms. [6]
2.8 Tilose lvitli the Least Resolrvces I~rrve t11 e Lerrst Cnpucity to Adnpt a~zd rzre flze &lost J/nlizernble
The ability ofhuman systems to adapt to and cope with climate change depends on such factors as wealth, technology, education, information, skills, infrastructure, access to resources, and management capabilities. There is potential for developed and developing countries to enhance andlor acquire adaptive capabilities. Populations and communities are highly variable in their endowments with tEese attributes, and the developing countries, particularly the least developed countries, are generally poorest in this regard. As a result, they have lesser capacity to adapt and are more vulnerable to climate change damages,' just as they are more vulnerable to other stresses. This condition is most extreme among the poorest people. l6.1; see also 5.1.7, 5.2.7,5.3.5,5.4,6,5.6.1,5.6.2,5.7, and5.8.1 forregional-scale information]
Benefits and costs of climate change effects have been estimated in monetary units and aggregated to national, regional, and global scales. These estimates generally exclude the effects of changes in climate variability and extremes, do not account for the effects of different rates of change, and only partially account for impacts on goods and services that are not traded in markets. These omissions are likely to result in underestimates of economic losses and overestimates of economic gains. Estimates of aggregate impacts are controversial because they treat gains for some as canceling out losses for others and because the weights that are used to aggregate across individuals are necessarily subjective. [7.2.2 and 7.2.31
~otwithstandm~ the limitations expressed above, based on a.few published estimates, increases in global mean temperature9 would
produce net econo.&iic losses in many developing countries for all ma,gnitudes of warming studied (low conjdei1ce6), and losses would be greater in magnitude the higher the level of warming (ilzediunl conficlence6). In contrast, an increase in global mean temperature of up to a few O C would produce a mixture of economic gains and losses in developed countries (lot11 coilfidence6), with economic losses for larger temperature increases (nzediznnz coifideizceG). The projected distribution of economic impacts is such that it would increase the disparity in well-being between developed countries and developing c,ountries, with disparity growing for higher projected temperature increases (nzedi~on coi?ficIeizce6). The more damaging impacts estimated for developing countries reflects, in part, their lesser adaptive capacity relative to developed countries. c7.2.31
Further, when aggregated to a global scale, world gross domestic product (GDP) would change by k a few percent for global mean temperature increases of up to a few O C (low confidenceb), and increasing net losses would result for larger increases in temperature (tilecliilni co~fidenceG) (see Figure SPM-2). More people aTe projected to be harmed than benefited by climate change, even for global mean temperature increases of less than a few "C (lovv confidence6). These results are
-sensitive to assumptions about changes in regional climate, level of development, adaptive capacity, rate of change, the valuation of impacts, and the methods used for aggregating monetary losses and gains, incliiding the choice of discount rate. [7.2.2]
The effects of climate change are expected to be greatest in developing countries in terms of loss of life and relative effects on investment and the economy. For example, the relative percentage damages to GDP .from climate extremes have been substantially greater in developing countries than in developed countries. [4.6]
2.9. Adaptntion, SrtstnillnbIe Developiizant, arrd Ei~hance~irerzt of ~ ~ z ~ i t y ' c a i t be Ilintrccrlly ReLzfovciizg
Many communities and regions that are vulnerable to climate change are also under pressure from forces such as population growth, resource depletion, and poverty. Policies that lessen pressures on resources, improve management of environmental risks, and increase the welfare of the poorest'members of society can simultaneously advance sustainable development and equity, enhance adaptive capacity, and reduce vulnerability to climate and other stresses. Inclusion of climatic risks in the design and implementation of national and international development initiatives can promote equity and development that is more sustainable and that reduces vulnerability to climate change. [6.2]
9Global mean temperature change is used as an indicator of the magnitude of climate change. Scenario-dependent exposures taken into account in these studies include regionally differentiated changes in temperature, precipitation, and other climatic variables.

3. Effects on and Vulnerability of climate change would degrade water quality througl~ higher Natural and Elurnan Systems water temperatures and increased pollutant load from runoff
and overflows of waste facilities. Quality would be degraded 3.1. Hj~drolo,yl nr~d I.T/ntar Rcso~~rces further where flows decrease, but increases in flows may mitigate
to a certain extent some degradations in water quality by The effect of climate change on streamflow and groundwater increasing dilution. Where snowfall is currently an important recharge varies regionally and between climate scenarios, component of the water balance, a greater proportion of winter largely followingprojected changes inprecipitation. Aconsistent precipitation may fall as rain, and this can result in a more projection across most climate change scenarios is for increases intense peak streamflow which in addition would move from. in annual mean streamflow in high latitudes and southeast Asia, spring to winter. [&I] and decreases in central Asia, the area around the Mediterranean, southern Africa, and Australia (nierli~mil cor$cle~ic&) (see Figure The greatest vulnerabilities are likely to be in unmanaged water SPM-3); the amount of change, however, varies between scenarios. systems and systems that are currently stressed or poorly and For other areas, including mid-latitudes, there is no strong unsustainably managed due to policies that discourage efficient consistency in projections of streamflow, partly because of water use and protection of water quality, inadequate watershed differences in projected rainfall and partly because of differences management, failure to manage variable water supply a12d in projected evaporation, which can offset rainfall increases. demand, or lack of sound professional guidance. In unmanaged The retreat of most glaciers is projected to accelerate, and many systems there are few or no structures in place to buffer the small glaciers may disappear (I~igll collfirlence". In general, effects of hydrologic variability on water quality and supply. In the projected changes in average annual runoff are less robust unsusiainably managed systems, water and land uses can add than impacts based solely on temperature change because stresses that heighten vulnerability to climate change. [4.1] p~ecipitation changes vary more between scenarios. At the catchment scale, the effect of a given change in climate varies Water resource management techniques, particularly those of with physical properties and vegetation of catchments, and integrated water resource management, can be applied to adapt may be in addition to land-cover changes. [4.1] to hydrologic effects of climate change, and to additional
uncertainty, so as to lessen vulnerabilities. Currently, supply-side Approximaiely 1.7 billion people, one-third of the world's approaches (e.g., increasing flood defenses, building weirs, population, presently live in countries that are water-stressed utilizin~ water storage areas, including natural systems, (defined as using more than 20% of their renewable water improving infrastructure for lilater collection and distribution) supply, a cormnonly used indicator of water stress). This number are more widely used than demand-side approaches (which is projected to increase to around 5 billion by 2025, depending alter the exposure to stress); the latter is the focus of increasing on the rate of population growth. The projected climate change attention. However, the capacity to implement effective could further decrease the streamflow and groundwater managementresponses isunevenly distributed around the world recharge in many of these water-stressed countries-for example and is low in many transition and developing countries. [4,1] in central Asia, southern Africa, and countries around the Mediterranean Sea-but may increase it in some others. 14.1; see also 5.1.1, 5.2.3, 5.3.1, 5.4.1, 5.5.1, 5.6.2, and 5.8.4 for 3.2. Agric~dt~rra and FoodSccnritJl regional-scale information]
Based on experimental research, crop yield responses to climate Demand for water is generally increasing due to population change vary widely, depending upon species and cultivar; soil growth and economic development, but is falling in some properties; pests, and pathogens; the direct effects of carboil counhies because of increased efficiency of use. Climate change dioside (C02) on plants; and interactions between C02, air is unlikely to have a big effect on,municipal and industrial temperature, water stress, mineral nutrition, air quality, and water demands in general, but may substantially affect irrigation adaptive responses. Even though increased C02 concentTation withdrawals, which depend on how increases in evaporation can stimulate crop growth and yield: that benefit may not are offset or exaggerated by changes in precipitation. Higher always overcome the adverse effects of excessive heat and temperatures, hence higher crop evaporative demand, mean that drought (nlecli~/nl col$fiderlceG). These advances, along with the general tendency would be towards an increase in irrigation advances in research on agricultural adaptation, have been demands. [4.1] incorporated since the Second Assessment Report (SAR) into
models used to assess the effects of climate change on crop Flood ma-~tude and frequency could increase in many yields, food supply, farm incomes, and prices. [4.2] regions as a consequence of increased frequency of heavy precipitation events, which can increase runoff in most areas as Costs will be involved in coping wit11 climate-induced yield well as groundwater recharge in some floodplains. Land-use losses and adaptation of livestock production systems. These change could exacerbate such events. Streamflow during agronomic and husbandry adaptation options could include, seasonal low flow periods would decrease in many areas due for example, adjustments to planting dates, fertilization rates, to greater evaporation; changes in precipitation may exacerbate irrigation applications, cultivar traits, and selection of animal or offset the effects of increased evaporation. The projected species. [4.2]

When autonomous agronomic adaptation is included, crop indicate that yields of some crops in tropical locations would modeling assessments indicate, with t71edililmi to lo~vcoilJlcle~~ce6, decrease generally with even minimal increases in temperature, that climate change will lead to generally positive responses at because such crops are near their maximum temperature tolerance less than a few "C warming and generally negative responses for and drylandIrainfed agriculture predominates. Where there is more than a few "C inmid-latitude crop yields. Similar asseshents also a large decrease in rainfall, tropical crop yields would be
Change in Annual Runoff (mnl yrl) J Figure SPM-3: Projected changes in average annual water mnoff by 2050, relative to average runoff for 1961-1990, largely follow projected changes in precipitation. Changes h runoff are calculated with a l~ydrologic model using as inputs climate projections from two versions of the Hadley Centre atmosphere-ocean general circulation model (AOGCM) for a scenario of 1% per &urn increase in effective carbon dioxide concentration in the atmosphere: (a) HadCM:! ensemble mean and (b) HadCM3'. Projected increases in runoff in high latitudes and southeast Asia, and decreases in central Asia, the area around the Mediterranean, southern Africa, and Australia are broadly consistent across the Hadley Centre experiments, and with the precipitation projections of other AOGCM experiments. For other areas of the world, changes in precipitation and runoff are scenario- and model-dependent.

even more adversely affected. With autonomous agronomic management, these pressures will cause some species currently adaptation, crop yields in the tropics tend to be less adversely classified as "critically endangered" to become extinct and affected by climate change than without adaptation, but they still the majority of those. labeled "endangered or vulnerable" to tend to remain below levels estimated with current climate. [4.2] become rarer, and thereby closer to extinction, in the 21st
century (high corfi~1~11ceG). [4.3] Most global and regional economic studies not incorporating climate change indicate that-the downward trend in global real Possible adaptation methods to reduce risks to species could commodity prices in the 20th century is likely to continue into include: 1) establishment of refuges, parks, and reserves with the 21st, although confidence in these predictions decreases co~~idors to allo~v migration of species, and 2) use of captive farther into the future. Economic modeling assessments indicate breeding and translocation. However: these options may have that impacts of climate change on agricultural production and limitations due to costs. [4.3] prices are estimated to result in small percentage changes in global income (lo~~ucorficlet~ce~), with larger increases in more developed Terrestrial ecosystems appear to be storing increasing amounts regions and smaller increases or declines in developing of carbon. At the time of the SAR, this was largely attributed regions, Improved confidence in this finding depends on further to increasing plant productivity because of the interaction between research into the sensitivity of economic modeling assessments elevated C02 conce~ltration, increasing femperatures, and soil to their base assumptions. [4.2 and Box 5-51 moisture changes. Recent results confum that productivity
gains are occumng hut suggest that they are smaller under field Most studies indicate that global mean annual temperature conditions than indicated by plant-pot experiments (n7edi~111i increases of a few O C or greater would prompt food prices to co,rfirlenceG)). Hence, the terrestrial uptalce may be due more to increase due to a slowing in the expaision of global food supply change in uses and management of land than to the direct effects relative to growth in global food demand (estnblishe(1, but of elevated C02 and climate. The degree to which terrestrial ii7coirlplete~). At lesser amounts of warming than a few "C, ecosystems continue to be net sinks for carbon is uncertain due economic models do not clearly distinguish the climate change to the complex interactions between the factors mentioned signal eom other sources .of change based on those studies above (e.g., arctic terrestrial ecosystems and wetlands may act included in this assessment. Some recent aggregated studies as both sources and sinks) (nlerliurlr corlficler~ceG). [4.3] have estimated economic impacts on vulnerable populations such as smallholder producers and poo;- urban consumers. Contrary to the SAR, global timber market studies that include These studies find that climate change would lower incomes of adaptations through land and product management, even without the vulnerable populations and increase the absolute number of loreshy projects that increase the capture and storage of carbon, people at risk of hunger, though this is uncertain and requires suggest that a small amount of climate change would increase further research. It is established, thou&.incompletely, that clunate global timber supply and enhance existing market t~ends towards change, mainly through increased extremes and temporall rising market share in developing countries (t17edi~nl?co~lfideier1ceG). spatial shifts, will worsen food security in Africa. [4.2] Consumers may benefit from'lower timber prices while
producers may gain or lose depending on regional changes in timber productivity and potential dieback effects. [4.3]
3.3. Terrcstr-in/ mid F ~ C S ~ I ~ J R ~ C ~ Ecosj~stcr~rs
Vegetation modeling studies continue Lo show the potential for significant disruption of ecosystems under climate change (hig11 coilficleilceG). Migration of ecosystems or biomes as discrete units is unlikely to occur; instead at a given site, species composition and dominance will change. The results of these changes will lag behind the changes in climate by years to decades to centuries (higli cor$rleilceG). [4.3]
Distributions, population sizes, population density, and behavior of wildlife have been, and will continue to be, affected directly by changes in global or regioiial climate and indirectly through changes in vegetation. Climate- change will lead to polelvard movement of the boundaries of freshwater fish distributions along with loss of habitat for cold- and cool-water fishes and gain in habitat for warm-water fishes (high corlfide~lceG). Many species and populations are already at high risk, and are
' expected to be placed at geater risk by the synerg between climate change rendering portions of current habifat unsuitable for many species, and land-use change fragmenting habitats and raising obstacles to species migration Without appropriate
Large-scale irnpacts of climate change on oceans are expected to inclode increases in sea surface temperature and mean global sea level, decreases in sea-ice cover, and changes in salinity, wave conditions, and ocean circulation. The oceans are an integral and responsive component of the climate system with important physical and biogeochemical feedbacks to climate. Many marine ecosystems are sensitive to climate change. Climate trends and variability as reflected in multiyear climate- ocean regimes (e.g., Pacific Decadal Oscillation) and switches from one regime to another are now recognized to strongly affect fish abundance and populatio~l dynamics, with significant impacts on fish-dependent human societies. [4.4]
Many coastal areas ~vill experience increased levels of flooding, accelerated erosion, loss of wetlands and mangroves, and seawater intrusion into freshwater sources as a result of climate change. The extent and severity of storm impacts, including stom-surge floods and shore erosion, \xrill increase as a result

of climate change including sea-level rise. High-latitude coasts will experience added impacts related to hi&er wave energy and permafrost degradation. Changes in relative sea level will vary .locally due to uplift and subsidence caused by other factors. [4.4]
Impacts on highly diverse and productive coastal ecosystems 'such as coral reefs, atolls and reef islands, salt marshes and mangrove forests will depend upon the rate of sea-level rise relative to growth rates and sediment supply, space for and obstacles to horizontal migration, changes in the climate-ocean environment such as sea surface temperatures and storminess, and pressures from human activities in coastal zones. Episodes of coral bleaching over the past 20 years have been associated with several causes, including increased ocean temperatures. Future sea surface warming would increase stress on coral reefs and result in increased frequency of marine diseases (high co~@~letzc8). [4.4]
.Assessments of adaptation strategies for coastal zones have shifted emphasis away from hard protection structures of shorelines (e.g., seawalls, groins) toward soft protection measures (e.g., beach nourishment), managed retreat, and enhanced resilience of biophysical and socioeco~~omic systems in coastal regions. Adaptation options for coastal and marine management are most effective when incorporated with policies in other areas, such as disaster mitigation plans and land-use plans. [4.4]
The impacts of short-term weather events on human health have been further elucidated since the SAR, particularly in relation to periods of thermal stress, the modulation of air pollution impacts, the impacts of storms and floods, and the influences of seasonal and interannual climatic variability on infectious diseases. There has been increased understanding of the determinants of population vulnerability to adverse health impacts and the possibilities for adaptive responses. [4.7]
Projected climate change will be accompanied by an increase in heat waves, often exacerbated by increased humidity and urban air pollution, which would cause an increase in heat- related deaths and illness episodes. The evidence indicates that the impact would be greatest in urban populations, affecting . pasticularly the elderly, sick, and those without access to air- conditioning (high colfirlence6). Limited evidence indicates that in some temperate countries.reduced winter deaths would outnumber increased summer deaths (111ecZilm7 co~zJirienceG); yet, published research has been la~gely confiied to populations in developed countries, thus precluding a gen&alized comparison of changes in summer and winter mortality. [3.5 and 4.71
Extensive experience makes clear that any increase in flooding will increase the risk of drowning, diarrhoea] and respiratory diseases, and, in developing countries, hunger and malnutrition (high conficlenceG). If cyclones were to increase regionally, devastating impacts would often occur, particularly in densely settled populations with inadequate resources. A reduction in crop yields and food production because of climate change in some regions, particularly in the tropics, will predispose food- insecure populations to malnutrition, leading to impaired child
Many vector-, food-, and water-borne infectious diseases are lcnown to be sensitive to changes in climatic conditions. From results of most predictive model studies, there is rnedi~rn7 to
'
high co1zfirlence6 that, under climate change scenarios, there would be a net increase in the geographic range of potential transmission of malaria and dengue-two vector-borne infections each of which cur;ently impinge on 40-50% of the world population.10 Within their present ranges, these and many other infectious diseases would tend to increase in incidence and seasonality-although regional decreases would occur in some infectious diseases. In all cases, however, actual disease occurrence is strongly influenced by local environmental conditions, socioeconomic circumstances, and public health
. infrastructure. [4.7] .
10 Eight studies have modeled the effects of climate change on these diseases, five on malaria and three on dengue. Seven use a biological, or process-based approach, and one uses an empirical, statistical approach.
development and decreased adult activity. Socioeconomic di-sruptions could occur in some regions, impairing both JiveIihoods and health. r3.5, 4.1,4.2,4.5, and 4.71
For each anticipated adverse health impact there is a range of social, institutional, technological, and behavioral adaptation options to Lessen that impact. Adaptations could, for example, encompass strengthening of the public health infrastructure, health-oriented management of the environment (including air and water quality, food safety, urban and housing design, and surface water management), and the provision of appropriate medical care facilities, Overall, the adverse health impacts of climate change will be greatest in vulnerable lower income populations, predominantly within tropical/subtropical countries. Adaptive policies would, in general, reduce these impacts. [4.7]
A growing and increasingly quantitative literature shows that human settlements are affected by climate change in one of three major ways:
1) The economic sectors that support the settlement are affected because of changes in resource productivity or changes in market demand for the goods and services produced there. [4.5]
2) Some aspects of physical infrastructure (including energy transmission and distribution systems), buildings, urban services (including transportation systems), and specific industries (such as agroindustry, tourism, and construction) may be directly affected. [4.5]
3) Populations may be directly affected through extreme weather, changes in health status, or migration. The problems are somewhat different in the lxgest (4 million) and mid- to small-sized population centers. [4.5]

The most w~despread direct risk to human settlements from US$ yr l in the 1950s to 40 billion USS; y r l in the 1990s (all in climate change is flooding and landslides, driven by projected 1999US$, unadjusted for purchas&g power parity), with increases in rainfall intensity and, in coastal areas, sea-level rise. approximately one-quarter of the losses occuri- in,^ in developing Riverille and coastal settlements are particularly at risk (Rig11 countries. The insured portion of these losses rose from a co~lfide~lceG)), but urban flooding could be a problem anywhere negligible level to 9.2 billion US$ yr-I during the same period. that storm drains, water supply, and waste management systems Total costs are a factor of two larger when losses from smaller, have inadequate capacity. In such areas, squatter and other non-catastrophic weather-related events are included. As a informal urban settlements with high population density, poor measure of increasing insurance industry vulnerability, the shelter, little or no access to resources such as safe water and ratio of global property/casual insurance preiniums to weather public health services, and low adaptive capacity are highly related losses fell b y a factor of three between 1965 and vulnerable. Human settlements currently experience other 1999. [4.6] significant environmental problems which could be exacerbated under higher temperature/i~~creased precipitation regimes, The costs of weather events haverisen rapidly despite significant including water and energy resources and infrastructure, waste and increasing efforts at fortifying infrastructure and enhancing treatment, and trallsportation [4.5] disaster preparedness. Part of the observed upward trend in
disaster losses over the past 50 years is linked to socioecouornic Rapid urbanization in low-lying coastal areas of both the factors, such as population growth, increased wealth, and developing and developed world is greatly increasing population urbanization in vulnerable areas, and part is linked to climatic densities and the value of human-made assets exposed to coastal factors such as the observed changes in precipitation and climatic extremes such as tropical cyclones. Model-based flooding events. Precise attribution is complex and there are projectio~ls of the mean annual number of people who would differences in the balance of these bvo causes by region and be flooded by coastal storm surges increase several fold (by type of event. [4.6] 75 to 200 million people depending on adaptive responses) for mid-range scenarios of a 40-cm sea-level rise by the 2060s Climate change and anticipated changes in weather-related relative to scenarios with no sea-level rise. Potential damases events perceived to be linked to climate change would increase to infrastructure in coastal areas from sea-level rise have been actuarial uncertainty in risk assessinent (hig11 coirfirle~~ceG). projected to be tens of billions US$ for individual countries-for Such developments would place upward pressure on insurance example, Egypt, Poland, and Vietnam. [4.5] premiums and/or could lead lo certain risks being reclassified
as uninsurable with subsequent withdrawal of coverage. Such Settlements with little economic diversification and where a changes ~vould trigger increased insurance costs, slow the high percentage of incomes derive from climate-sensitive espansion of financial services into developing countries, primary resource industries (agriculture, forestry, and fisheries) reduce the availability of insurance for spreading risk, and arc more m~lnerable than more diversified settlements (hig11 increase the demand for government-funded compensation corfirZer~ceG). In developed areas of the Arctic, and where the foIlowing natural disasters. In the event of such changes, the permafi-ost is ice-rich, special attention will be required to relative roles of public and private entities in providjllg mitigate the detrimental impacts of thawing, such as severe insurance and risk management resources can be espected to damage to buildings and transport infrastructure (veigl 11igll change. 14.61 coi@~lei1ce6). Industrial, transportation, and commercial i~lfraskucture is generally vulnerable to the same hazards as The financial services sector as a whole is expected to be able settlement infrastructure. Energy demand is expected to to cope with the impacts of climate change, although the increase for space cooling and decrease for space heating, but historic record demonstrates that low-probability high-impact the net effect is scenario- and location-dependent. Some energy events or multiple closely spaced events severely affect parts production and distribution systems may experience adverse of the sector, especially .if adaptive capacity happens to be impacts that would reduce supplies or system reliability while simultaneously depleted by non-climate factors (e.g., adverse other energy systems may benefit. [4.5 and 5.71 financial market conditions). The propertylcasualty insurance
and reinsurance se,gnenB and small specialized or undiversified Possible adaptation options involve the planning of settlements companies have exhibited greater sensitivity, including and their in&-asbuchue, placement of industrial facilities, and making reduced profitability and bankruptcy triggered by weather- similar long-lived decisions in a manner to reduce the adverse related events. [4.6] effects of events that are oflow (hut increasing) probability and high (and perhaps rising) consequences. [4.5] Adaptation to climate change presents complex challenges, but
also opportunities, to the sector. Regulatory involvement in pricing, tax treatment of reserves, and the (in)ability of firms to
3.7 I ~ ~ s ~ c r n ~ ~ c e niid Otl~er Fii~(~iicinl Se i~~ices withdraw from at-risk markets are examples of factors that influence the resilience of the sector. Public- and private-sector
The costs of ordinary and extreme weather events have actors also support adaptation by promoting disaster preparedness, increased rapidly in recent decades. Global economic losses loss-prevention programs, building codes, and iinproved land- from catastrophic events increased 10.3-fold from 3.9 billion use planning. However, in some cases, public insurance and

14 Clinlate Clzaizge 2001: Inlpacts, Adaptation, and J'z/lrlnembility
Tnble SPM-2: Regionnl adaptive cczpaciv, vvulilerability, and key concerns.fl.b
Region Adaptive Capacity, Vulnerability, and Key Concerns
Africa / Adaptive capacity of human systems in Africa is low due to lack of economic resources and technology, and vulnerability high as a result of heaxy reliance on rain-fed agriculture, fiequent droughts and floods, and poverty. [5.1.7] Grain yields are projected to decrease for many scenarios, diminish'ig food security, particularly in small food- importing countries (iizedilaii to high confiderzce6). [5.1.2] Major rivers of Aeica are highly sensitive to climate variation; average runoff and water availability would decrease in Mediterranean and southern countries of Africa (n~edi~lilrni co~lfiderlce6). [5.1.1] Extension of ranges of infectious disease vectors would adversely affect human health in Africa (n~eclililai~ conjdence6). 15.1.41 Desertification would be exacerbated by reductions in average annual rainfall, runoff, and soil moisture, especially in southern, North, and West Africa (nlediilm coilfiderlce6). L5.1.61 Increases in droughts, floods, and other extreme events would add to stresses on water resources, food security, human health, and infrastsuctures, and would constrain development in Africa (high confidence6). [5.1] Significant extinctions of plant and animal species are projected and would impact rural livelihoods, tourism, and genetic resources (nrediiml collfidence6). [5.1.3]
a Coastal settlements in, for example, the Gulf of Guinea, Senegal, Gambia, Egypt, and along the East-Southern African coast would be adversely impacted by sea-level rise through inundation and coastal erosion (lzigh coilfidenc&). [5.1.5]
Asia Adaptive capacity of human systems is low and vulnerability is high in the developing countries of Asia; the developed countries of Asia are more able to adapt and less vulnerable. [5.2.7]
* Extreme events have increased in tempel-ate and tropical Asia, including floods, droughts, forest fues, and tropical cyclones (high co11fidet1ce6). L5.2.41 .
Decreases in agricultural productivity and aquaculture. due to thermal and water stress, sea-level rise, floods-and droughts, and tropical cyclones would diminish food security in many countries of arid, tropical, and temperate Asia; agriculture would expand and increase in productivity in northern areas (malirln~ conficlence6). [5.2.1] Runoff and water availability may decrease in arid and semi-arid Asia but increase in northem Asia (riledizm~ collfidence6). 15.2.31 Human health would be threatened by possible increased exposure to vector-borne infectious diseases and heat stress in parts of Asia (nlediiilorl coilfidence6). [5.2.6] Sea-level rise and an increase in the intensity of tropical cyclones would displace tens of millions ofpedple in low-lying coastal areas of temperate and tropical Asia; increased intensity of rainfall would increase flood risks in.temperate and tropical Asia (higli cor$clence6). [5.2.5 and Table TS-S] Climate change would increase energy demand, decrease tourism attraction, and influence transportation in some regions of Asia (nzediuri~ confide~zce6). [5.2.4 and 5.2.71
* Climate change would exacerbate threats to biodiversity due to land-use and land-cover change and population pressure in Asia (nzedilrrr~ coilfiderzce6). Sea-level rise would put ecological security at risk, including mangroves and coral reefs (higlz cotlfidence6). [5.2.2] Poleward movement of the southern boundary of the permafrost zones of Asia,would result in a change of thermokarst 'and thermal erosion with negative impacts on social infrastructure and industries (niedilun co)y'icletrce6).
, p.2.21
relief programs have inadvertently fostered complacency and maladaptation by inducing development in at-risk areas such as U.S. flood plains and coastal zones. [4.6]
The effects of climate changegre expected to be greatest in the developing world, especially in countries reliant on primary production as a major source of income. Some countries experience impacts on their GDP as a consequence of natural disasters, with damages as high as half of GDP in one case. Equiw issues and development constraints would arise if weather-related risks become uninsurable, prices increase, or
availability becomes limited. Conversely, more extensive access to insurance and more widespread introduction of micro-financing schemes and development banking would increase the ability of developing countries to adapt to climate change. [4.6]
4. ~JulnerabiIitJt Varies across Regions
The vulnerability of human populations and natural systems to climate change differs substantially across regions and across

Trrble SPIVI-2 (cor~ti~~zretl)
Region Adaptive Capacity, \Julnep?bility, and Key Concerns
Australia and New Zealand
Adaptive capacity of human systems is generally high, but there are groups in Australia and New Zealand, such as indigenous peoples in some regions, with lo\v capacity to adapt and consequently high vulnerability. [5.3 and 5.3.51 The net impact on some temperate crops of climate and C02 changes may initially be beneficial, but this balance is expected to become negative for some areas and crops with further climate change (riiecli~mi cor?fider~ceb). [5.3.3] Water is likely to be a key issue (high cortjiclence6) due to projected drying trends over much of the region and change to a more El Nifio-like average state. [5.3 and 5.3.11 Increases in the intensity of hea\ry rains and tropical cyclo~les (iriedirmi corlficlerlce6), and region-specific changes in the frequency of tropical cyclones, would alter the r i s k to life, property, and ecosystems from flooding, storm surges, and wind damage. [5.3.4] Some species with restricted climatic niches and which are unable to migrate due to fragmentation of the landscape, soil differences, or topography could become endangered or extinct (high corlfirlence~. Australian ecosystems that are particularly vulnerable to climate change include coral reefs, arid and semi-arid habitats in southwest and inland Australia, and Australian alpine systems. Freshwatzr wetlands in coastal zones in both Australia and New Zealand are vulnerable, and some New Zealand ecosystems are vulnerable to accelerated invasion by weeds. [5.3.2]
Europe
Latin America
populations within regions. Regional differences in baseline that give rise to differences in sensitivity and adaptive capacity. climate and expected climate change give rise to different From these differences emerge different key concerns for exposures to climate stimuli across regions. The natural and each of the major regions of the world. Even within regions social systems of different regions have varied characteristics, however, impacts, adaptive capacity, and vulnerability will resources, and u~stitutions, and are subject to varied pressures vary. [5]
.
- -
Adaptive capacity is generally high in Europe for human'systems; southenl Europe and the European Arctic are more vulnerable than other parts of Europe. [5.4 and 5.4.61 Summer runoff, water availability, and soil moisture are likely to decrease in southern Europe, and would widen the difference between the north and drought-prone south; increases are likely in winter in the north and south (Rig11 corjider~ceG). [5 .4.1] Half of alpine glaciers and large~permafiost areas could disappear by end of the 21st century (rllediloii co17ficlericd). p.4. I] River flood hazard will increase across much of Europe (rilecli~u~~ to 11ig11 corlfidence"; in coastal areas, the risk of flooding, erosion, and wetland loss will increase substantially with implications for human settlement, industry, tourism, agriculture, and coastal natural habitats. [5.4.1 and 5.4.41 There will be some broadly positive effects on agriculture in northem Europc 4necliloii corrJirle~iceG); productivity will decrease in southern and eastern Europe (nierli~ra~ cor?Jicle1ice6). 15.4.31 Upward and northward shift of biotic zones will take place. Loss of important habitats (wetlands, tundra, isolated habitats) would threaten some species (higl~ corfider~ce~). [5.4.2] Higher temperatures and heat waves may change traditional summer tourist destinations, and less reliable snow conditions may impact adversely on winter tourism (niediioii corlficZeiice6). E5.4.41
Adaptive capacity of human systems in Latin America is low, particularly with respect to extreme climate events, and vulnerability is high. [5.5] Loss and retreat of glaciers would adversely impact runoff and water supply in areas where glacier melt is an important water source (11igI1 coilfic1ericeG): [5.5.1] - Floods and droughts would become more frequent with floods increasing sediment loads and degrade water quality in some areas (higli corf ic le~~ce~) . [5.5] Increases in intensity of tropical cyclones would alter the risks to life, property, and ecosystems from healy rain, flooding, stonn surges, and wind damages (high coificle~ice~). [5.5] Yields of important crops are projected to decrease in many locations in Latin America, even when the effects of C02 are taken into account; subsistence fanning in some regions of Latin America could be threatened (high corlfidence"). C5.5.41 The geographical distribution of vector-borne infectious diseases would expand poleward and to higher elevations, and exposures to diseases such as malaria, dengue fever, and cholera will increase (r~leclilrnl corlficle~lceG). [5.5.5]
a Coastal human settlements, productive activities, infrastructure, and mangrove ecosystems would be negatively affected by sea-level rise (r~recli~~rr~ corlfider~ceG). [5.5.3] The rate of biodiversity loss would increase (liigl~ co1lficlence6). [5.5.2]

16
Tnble SPfi1--2 (co~lti~zlrerl)
Region Adaptive Capacity, Vulnerability, and Key Concerns
North America
- - -
Adaptive capacity of human systems is generally high and vulnerability low in North America, but some communities (e.g., indigenous peoples and those dependent on climate-sensitive resources) are more vulnerable; social, economic, and demographic trends are changing vulnerabilities in subregions. [5.6 and 5.6.11 Some crops would benefit from modest warming accompanied by increasing CQ, but effects would vary among crops and regions (higlz coi@deizce6), including declines due'to drought in some areas of Canada's Prairies and the U.S. Great Plains, potential increased food production in areas of Canada north of current production areas, and increased warm-temperate mixed forest production (ntediloit coilfirlenc&). However, benefits for crops would decline at an increasing rate and possibly become a net loss with hrther warming (niedilm~ coilfiderrce6). L5.6.41 Snowmelt-dominated watersheds in western North America will experience earlier spring peak flows (high co1lfidence6), reductions in summer flotvs (inedi~ltn coifirlei1ce6), and reduced lake levels and outno\vs for the Great Lakes-St. Lawrence under most scenarios (niediiml confidence6); adaptive responses would offset some, but not all, of the impacts on water users and on aquatic ecosystems (n~ecli~n~i coizficlence6). [5.6.2] Unique natural ecosystems such as prairie wetlands, alpine tundra, and cold-water ecosystems will be at risk and effective adaptation is unlikely (nleditml coilfidence6). [5.6.5] Sea-level rise would result in enhanced coastal erosion, coastal flooding, loss of coastal wetlands, and increased risk from storm surges, particularly in Florida and much of the U.S. Atlantic coast (Izigll col?ficleiiceG). [5.6.1] Weather-related insured losses and public sector disaster relief payments in North America have been increasing; insurance sector planning has not yet systematically included climate change information, so there is potefitial for surprise (higlz co~@deiiceG). [5.6.1] Vector-borne diseases-including malaria, dengue fever, and Lyme disease-may expand their ranges in North America; exacerbated air quality and heat stress morbidity and mortality would occur (tjtedi~rii7 conficlence6); socioeconomic factors and public health measures would play a large role in determining the incidence and extent of health effects. 15.6.63
Polar Natural systems in polar regions are highly vulnerable to climate change and current ecosystems have low adaptive capacity; technologically developed communities are likely to adapt readily to climate change, but some indigenous communities, in which traditional lifestyles are followed, have little capacity and few options for adaptation. [5.7] Climate change in polar regions is expected to be among the largest and most rapid of any region on the Earth, and will cause major physical, ecological, sociological, and economic impacts, especially in the Arctic, Antarctic Peninsula, and Southern Ocean (higlz corfidence3. [5.7] Changes in climate that have already taken place are manifested in the decrease in extent and thickness of Arctic sea ice, permafrost thawing, coastal erosion, changes in ice sheets and ice shelves, and altered distribution and abundance of species in polar regions (high coilfidenceG). [5.7] Some polar ecosystems may adapt through eventual replacement by migration of species and changing species composition, and possibly by eventual'increases in overall productivity; ice edge systems that provide habitat for some species would be threatened (ineditirn coilfifence6). [5.7] Polar regions contain important drivers of climate change. Olice triggered, they may continue for centuries, long after greenhouse gas concentrations are stabilized, and cause in-eversible impacts on ice sheets, global ocean circulation, and sea-level rise (nzediutiz confidence6). [5.7]
In light of the above, all regions are likely to experience some adverse effects of climate change. Table SPM-2 presents in a highly summarized fashion .some of the key concerns for the different regions. Some regions are particularly vulnerable because of their physical exposure to climate change hazards andlor their limited adaptive capacity. Most less-developed regions are especially vulnerable because a larger share of their economies are in climate-sensitive sectors and their adaptive capacity is low due to low levels of human, financial, and natural resources, as well as limited institutional and technological capability. For example, small' island states and low-lying coastal areas are particularly vulnerable to increases in sea level and storms, and most of them have limited capabilities for
adaptation. Climate change impacts in polar regions are expected to be large and rapid, including reduction in sea-ice extent and thichess and degradation of permafrost. Adverse changes in seasonal river flows, floods and droughts, food security, fisheries, health effects, and loss of biodiversity are among the major regional wlnerabilities and concerns of Africa, Latin America, and Asia where adaptation opportunities are generally low. Even in regions with higher adaptive capacity, such as North America and Australia and New Zealand, there are vulnerable communities, such as indigenous peoples, and the possibility of adaptation of ecosystems is very limited. In Europe, vulnerability is significantly greater in the south and in the Arctic than elsewhere in the region. [5]

Tnblc SPM-2 (corltirz ~lerl)
Region Adaptive Capacity, Vulnerability, and Keg Concerns
Small Island States
Adaptive capacity of human systems is genel-ally low in small island states, and vulnerability high; small isla~ld states are likely to be among the countries most seriously impacted by climate change. [5.8] The projected sea-le\{el rise of 5 mm yrl for the next 100 years would cause enhanced coastal erosion, loss of land and property, dislocation of people, increased risk from storm surges, reduced resilience of coastal ecosyste~s, saltwater intrusion into freshwater resources, and high resource costs to respond to and adapt to these changes (/~iglr c o ~ ~ c l e ~ ~ c c ~ ) ) . [5.8.2 and 5.8.51 Islands with very limited water supplies are highly vulnerable to the impacts of climate change on the water balance (11igl1 cor?ficlerlce6). C5.8.41 Cbral reefs would be negatively affected by bleaching and by reduced calcification rates due to higher CO, levels (r~~erli~rrn cor$iidellce6); mingrove, sea grass bed, and other coastal ecosystems and the associated biodiversit$would be adversely affected by rising temperatures and accelerated sea-level rise (niedirol~ co~ficlei~ceG). C4.4 and 5.8.31 Declines in coastal ecosystems would negatively impact reef fish and threaten reef fisheries, those who eanl . their livelihoods from reef fisheries, and those tvho rely on the fisheries as a sisificant food source (rl7ediunl corrfider~ceG). [4.4 and 5.8.41 Limited arable land and soil salinization makes agriculture of small island states, both for domestic food production and cash crop exports, highly vulnerable to climate change (high cory5firlenceG). [5.8.4] Tourism, an important source of income and foreign exchange for many islands, would face severe disruption from climate change and sea-level rise (11igl1 co~ficlei~ce~). [5.8.5]
a Because the available studies have not employed a cominon set of climate scenarios and mehods, and because of uncertainties regarding the sensirivities and adaptability ofnatural and social systems, the assessment of regional vulnerabilities is necessarily qualitative.
bThe regions listed in Table SPM-2 am gaphically depicted in Figure TS-2 of the Technical sum mar)^.
5. improving Assessn~ents of Impacts, Vulnerabilities, and Adaptation
Advances have been made since previous IPCC assessments in '
the detection of change in biotic and physical systems, and steps have been taken to improve the understanding of adaptive capacit): vulnerability to climate extremes, and other critical irnpact- related issues. These advances indicate a need for initiatives to begin designing adaptation strategies and building adaptive capacities. Further research is required, however, to strengthen future assessments and to reduce uncertainties in order to assure that sufficient information is available for policymaking about responses to possible consequences of climate change, including research in and by de\reloping countries. [S]
The following are higll, priorities for narrowing gaps between current knowledge and policymaking needs:
Quantitative assessment of the sensitivity, adaptive capacity, and vulnerability of natural and human systems to climate change, with particular emphasis on changes in the. range of climatic variation and the frequency and severity of extreme climate events Assessment of possible thresholds ar which strongly discontinuous responses to projected climate change and other stimuli would be triggered Understanding dynamic responses of ecosystems to multiple stresses, including climate change, at global, regional, and ener scales Development of approaches to adaptation responses, estimarion of the effectiveness and costs of adaptation
options, and identification of differences in opporturities for and obstacles to adaptation in different regions, nations, and populations Assessment of potential impacts of the full range of projected climate changes, particularly for non-market goods and services, in multiple metrics and with consistent treatment of uncertainties, including but not limiled to numbers of people affected, land area affected, numbers of species at risk, monetary value of impact, and implications in these regards of different stabilization levels and other policy scenarios Improving tools for integrated assessment, including risk assessment, to investigate interactions between components of natural and human systems and the consequellces of different policy decisions Assessment of oppomlities to include scientific information on impacts, vulnerability, and adaptation in decisionmaking processes, risk management, and sustainable development initiatives Improvement of systems and methods for long-term monitoring and understanding the consequences of climate change and other stresses on human and natural systems.
Cutting across these foci are special needs associated with strengthening international cooperation and coordination for regional assessment of impacts, \wlnerability, and adaptation, including capacity-building and training for monitoring, assessment, and data gathering, especially in and for developing countries (particularly in relation to the items identified above).

u s -
Ctirura?? ckiar~ge is reaf potentially cost-effective technological options that could There will always be in a system contribute to stabilising greenhouse gas concentrations. . as complex as the worldls climate, However there.is now These are at various stages of research and development.
strong evidence that significant global warming is However barriers to their broad deployment still need t o be
occurrinal. The evidence tames from direct measurements Overcome' - of rising surface air temperatures and subsurface ocean temperatures and from phenomena such as increases in average global sea levels, retreating glaciers, and changes to many physical and biological systems. It is likely that most of the warming in recent decades can be attributed to human activities (IPCC 2001)2. This warming has already led to changes in the Earth's climate.
The existence of greenhouse gases in the atmosphere is vital to life on Earth - in their absence average temperarures would be about 30 centigrade degrees lower than they are today. But human activities are now causing atmospheric concentrations of greenhouse gases - including carbon dioxide, methane, tropospheric ozone, and nitrous oxide - to rise well above pre-industrial levels. Carbori dioxide levels have increased from 280 ppm in '
1750 to over 375 ppm today - higher than any previous levels that can be reliably measured (i-e. in the last 420,000 years). Increasing gieenhouse gases are causing temperatures to rise; the Earth's surface warmed by approximately 0.6 centigrade degrees over the wentieth century. The Intergovernmental Panel on Climate Change (IPCC) projected that the average global surface temperatures will continue to increase to between 1.4 centigrade degrees and 5.8 centigrade degrees above 1990 levels, by 21 00.
Recluce the causes of ciimate change The scientific understanding of climate change is now sufficiently clear to justify nations taking prompt action. It is vital that all nations identify cost-effective steps that they can take now, to contribute to substantial and long-term reduction in net global greenhouse gas emissions.
Action taken now to reduce significantly the build-up of greenhouse gases in the atmosphere will lessen the magnitude and rate of climate change. As the United Nations Framework Convention on Climate Change (UNFCCC) recognises, a lack of full scientific cerrainty about some aspects of climate change is not a reason for delaying an immediate response that will, at a reasonable cost, prevent dangerous anthropogenic interference with the climate system.
As nations and economies develop over the next 25 years, world primary energy demand is estimated to increase by almost 60%. Fossil fuels, which are responsible for the majority of carbon dioxide emissions produced by human activities, provide valuable resources for many nations and are projected to provide 85% of this demand (IEA 2004)3. lvlinimising the amount of this carbon dioxide reaching the atmosphere presents a huge challenge. There are many
Carbon dioxide can remain in the atmosphere for many decades. Even with possible lowered emission rates we will be experiencing the impacts of climate change throughout the 2lst century and beyond. Failure t o implement significant reductions in net greenhouse gas emissions now, will make the job much harder in the future.
Major parts of the climate system respond slowly t o changes in greenhouse gas concentrations. Even if greenhouse gas emissions were stabilised instantly at today's levels, the climate would still continue to change as it adapts to the increased emission of recent decades. Further changes in climate are therefore unavoidable. Nations must prepare for them.
The projected changes in climate will have both beneficial and adverse effects at the regional level, for example on water resources, agriculture, natural ecosystems and human health. The larger and faster the changes in climate, the more likely it is that adverse effects will dominate. lncreasing temperatures are likely to increase the frequency and severity of weather events such as heat waves and heavy rainfall. Increasing temperatures could lead to large-scale effects such as melting of large ice sheets (with major impacts on low-lying regions throughout the world). The IPCC estimates that the combined effects of ice melting and sea water expansion from ocean warming are projected to cause the global mean sea-level to rise by between 0.1 and 0.9 metres between 1990 and 2108. In Bangladesh alone, a 0.5 metre sea-level rise would place about 6 million people at risk from flooding.
Developing nations that lack the infrastructure or resources to respond to the impacts of climate change will be particularly affected. It is clear that many of the world's poorest people are likely to suffer the most from climate change. Long-term global efforts to create a more healthy, prosperous and sustainable world may be severely hindered by changes in the climate.
The task of devising and implementing strategies to adapt to the consequences of climate change will require
* worldwide collaborative inputs from a wide range of experts, including physical and natural scientistr;, engineers, social scientists, medical'scientists, those in the humanities, business leaders and economists.
Joint Intervenors Exhibit 2 - D

I
Conclusion We urge all nations, in the line with the UNFCCC principles'+, to take prompt action to reduce the causes of climate change, adapt to its impacts and ensure that the issue is included in all relevant national and international strategies. As national science apdemies, we commit to working with governments to help develop and implement the national and inte~national response to the challenge of climate change.
G8 nations have been responsible for much of the past greenhouse gas emissions. As parties toihe UNFCCC, G8 nations are committed to showing leadership in addressing climate change and assisting developing nations to meet the challenges of adaptation and mitigation.
Launch an international study5 to explore scientifically- informed targets for atmospheric greenhouse gaS concentrations, and their associated emissions scenarios, that will enable nations to avoid impacts deemed unacceptable. ,
Identify cost-effective steps that can be taken now to contribute to substantial and long-term reduction in net global greenhouse gas emissions. Recognise that delay.ed action will increase the risk of adverse environmental effects and will likely incur a greater cost.
Work with developing nations to build a scientific and technological capacity best suited to their circumstances, enabling them to develop innovative solutions to mitigate and adapt to the adverse effects of climate chanqe, while
We call on world leaders, including those meeting at the explicitly recognising their legitimate developmeit rights. Gleneagles G8 Summit in July 2005, to: Show leadership in developing and deploying clean
energy technologies and approaches to energy efficiency, Acknowledge that the threat of climate change is clear and share this knowledge with all other nations. and increasing. Mobilise the science and technol'ogy community to
enhance research and development efiorts, which can better inform climate change decisions.
Notes and references ' 1 This statement concentrates on climate change associated with global warming We use the UNFCCC definition of climate change, which is 'a change
: of climate which is attributed directly or ind~rectly to human activity that alters the composition of the global atmosphere and which is in addition to ; natural climate variability observed over comparable time periods'.
2 IPCC (2001).Third Assessment Report. We recognise the inrernational scientific consensus of the Intergovernmental Panel on Climate Change (IPCC).
3 IEP (2004). World Energy Outlook 4. Although long-term'projections of future world energy demand and supply are highG uncertain, the World ; Energy Outlook produced by the International Energy Agency (IEA) is a useful source of information about possible future energy scenarios.
4 With special emphasis on the first principle of the UNFCCC, which states: 'The Parties should prorect the climate System for the benefit of present and : future generations of humankind, on the basis of equity and in accordance with their common but differentiated responsibilities and respective i capabilities. Accordingly, the developed counrry Parties should take the lead in combating climate change and the adverse effects thereof'. .
i 5,Recognising and building on the IPCC's ongoing work on emission scenarios.
Academia Yrasiiiera de Ciencias Roy1 Society d Canada, Chinese Academy of Scierices, Brazil Canzcla China
C
Academie cles Sciencss, Deutsche Akademie der Naiurforscher Indian bla~ioi-tal~~once Academv. 8 -
France Leopoldina, Germany lridia
Akademia dei bncei, Science Council of fapan, Russian Academy of Scii.ncns, itail! Japan Russia
Royal Society, ' L/ Mationai Acadsnjr of Scilnces, Urritecl Kinglorn Unized SWes of America