eyes wide open - the importance of a smooth transition to a new eu deal
TRANSCRIPT

1
‘EYES WIDE OPEN’ THE IMPORTANCE OF A SMOOTH TRANSITION TO A NEW EU DEAL
London School of Economics Public Lecture
CBI Director General – Carolyn Fairbairn
Thursday 6 July 2017
2
3
4

5
THE EU IS THE WORLD’S DEEPEST PREFERENTIAL
TRADE AGREEMENT
Source: “Trading off a ’soft’ and ‘hard’ Brexit”, Mulabdic, Osnago & Ruta; CEPR/World Bank 2017.
Depth of trade agreements: number of legally enforceable provisions
6
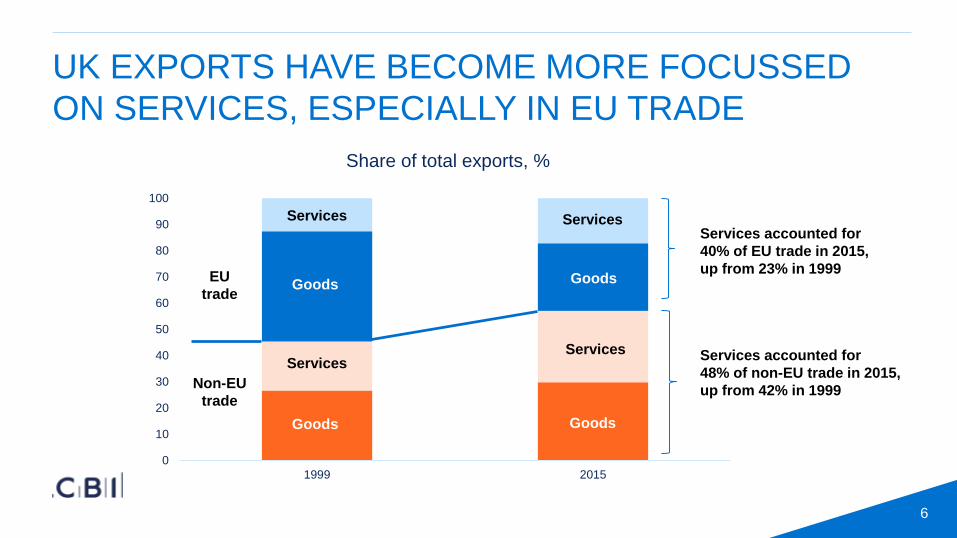
UK EXPORTS HAVE BECOME MORE FOCUSSED
ON SERVICES, ESPECIALLY IN EU TRADE
0
10
20
30
40
50
60
70
80
90
100
1999 2015
Share of total exports, %
Goods
Non-EU
trade
Services
Goods
Services
Services
Goods
Services
Goods
EU
trade
Services accounted for
40% of EU trade in 2015,
up from 23% in 1999
Services accounted for
48% of non-EU trade in 2015,
up from 42% in 1999
7
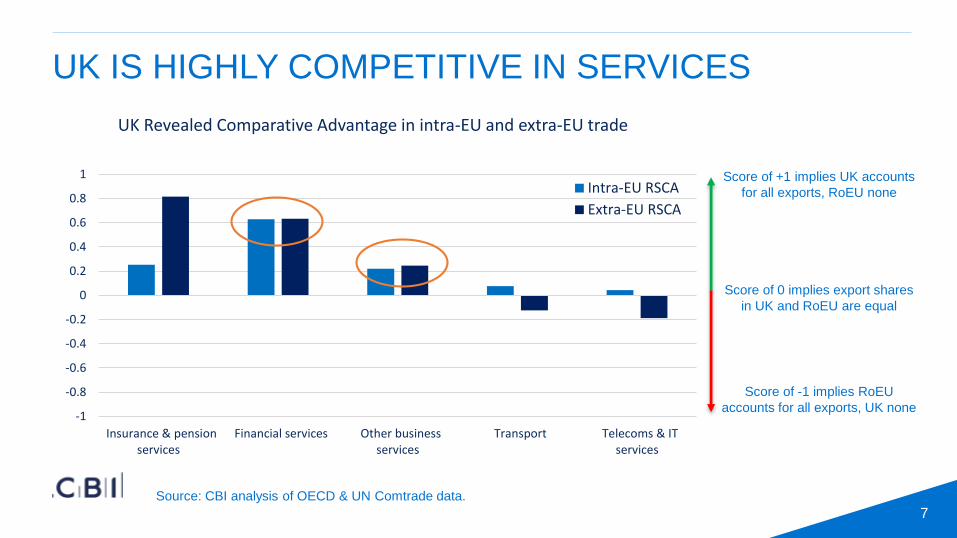
UK IS HIGHLY COMPETITIVE IN SERVICES
Source: CBI analysis of OECD & UN Comtrade data.
-1
-0.8
-0.6
-0.4
-0.2
0
0.2
0.4
0.6
0.8
1
Insurance & pensionservices
Financial services Other businessservices
Transport Telecoms & ITservices
UK Revealed Comparative Advantage in intra-EU and extra-EU trade
Intra-EU RSCA
Extra-EU RSCA
Score of +1 implies UK accounts
for all exports, RoEU none
Score of -1 implies RoEU
accounts for all exports, UK none
Score of 0 implies export shares
in UK and RoEU are equal

8
SOME SECTORS COULD SEE A SIGNIFICANT RISE
IN EXPORT TARIFF COSTS
Source: CBI, Heteronomics; HMRC; OECD.
[CELLRANGE] [CELLRANGE] [CELLRANGE] [CELLRANGE] [CELLRANGE]
0
0.2
0.4
0.6
0.8
1
1.2
1.4
1.6
Motor vehicles Agriculture Textiles, clothing & footwear Food, drink & tobacco Chemicals (excl. pharma)
Additional tariff costs depending on UK content in exports
Average MFN tariff across all sectors is 4.3% (average MFN tariff per sector below)
Billions (£)

9
WEAKER POUND IMPROVED COMPETITIVENESS
Source: CBI, Industrial Trends Survey.
-40
-30
-20
-10
0
10
20
30
40
2004 2006 2008 2010 2012 2014 2016
ITS: Has your competitiveness improved or worsened on three months ago?
EU (lhs) Non-EU (lhs) Long-run average
% balance

10
NON-TARIFF BARRIERS BY INDUSTRY
Sources: CBI; World Bank.
138133 132
118
102
85 8276
6052 51
4136
22 22 20 20
9
0
20
40
60
80
100
120
140
160
Non-tariff barriers by sectorChemicals
(ex pharma)
AgricultureMachinery
Aerospace
& defence

11
[CELLRANGE] 222 [CELLRANGE] 26
[CELLRANGE] 62 [CELLRANGE] 310
[CELLRANGE] 100
[CELLRANGE] 100 [CELLRANGE] 510
0
100
200
300
400
500
600
EU EFTA FTA/CustomsUnion
Total FTA &Single Market
US Non-US Total
£bn
44%
5%12%
61%
20%
19%100%
UK GOODS & SERVICES EXPORT BY MARKET TYPE
Sources: Making Brexit Work for British Business, Peter Sands et al.

12
[CELLRANGE]
[CELLRANGE]
[CELLRANGE]
[CELLRANGE]
[CELLRANGE]
[CELLRANGE]
[CELLRANGE]
[CELLRANGE]
[CELLRANGE]
0.0 50.0 100.0 150.0 200.0 250.0 300.0 350.0
Brazil
Russia
Japan
India
China
Rest of Asia
Africa and Middle East
US
EU
Forecasts for UK goods exports over the next 10 years ($, billions)
2016 2026
IN 10 YEARS’ TIME, THE EU WILL STILL BE OUR
BIGGEST EXPORT MARKET FOR GOODS
Source: Oxford Economics.