eye.earth pro (beta v1.0): by andrew michael straw a
TRANSCRIPT
Eye.Earth Pro (Beta v1.0):
Application Development and Spatial Financial Analysis Utilizing the PESTELM Framework
by
Andrew Michael Straw
A Thesis Presented to the
FACULTY OF THE USC DORNSIFE COLLEGE OF ARTS, LETTERS AND SCIENCES
UNIVERSITY OF SOUTHERN CALIFORNIA
In Partial Fulfillment of the
Requirements for the Degree
MASTER OF SCIENCE
(Geographic Information Science and Technology)
December 2020
Copyright © 2020 Andrew Michael Straw

ii
To my late golden retriever, Andre Jack Vail

iii
Acknowledgements
I am grateful for the USC faculty and fellow students for their feedback throughout this project’s
process and my friends and family who have helped me along the way.

iv
Table of Contents
List of Figures…………………………………………………………………………………………….. vi
List of Tables…………………………………………………………………………………………….. viii
List of Abbreviations……………………………………………………………………………………… ix
Abstract…………………………………………………………………………………………………... xii
Chapter 1 Introduction……………………………………………………………………………………... 1
1.1 Equity Asset Valuation ....................................................................................................................... 2
1.2 The PESTELM Strategic Analytical Framework ............................................................................... 3
1.3 Motivation ........................................................................................................................................... 4
1.4 Application Development Overview .................................................................................................. 6
1.5 Methodology Overview ...................................................................................................................... 6
1.6 Thesis Organization ............................................................................................................................ 7
Chapter 2 Background……………………………………………………………………………………... 9
2.1 The Equity Asset Valuation Process, Steps 1 and 2............................................................................ 9
2.1.1. Understanding the Business—Industry Analysis: US Aerospace and Defense ........................... 9
2.1.2. Understanding the Business—Company Analysis: Lockheed Martin Corp. ............................. 10
2.1.3. Forecasting Company Performance ......................................................................................... 13
2.2 The PESTEL Analytical Framework Background ............................................................................ 14
2.2.1. Industry Studies Using the PESTEL Framework ...................................................................... 14
2.3 Application Development Background ............................................................................................. 15
2.3.1. Related Applications ................................................................................................................. 16
2.5 Analysis Background ........................................................................................................................ 17
2.5.1. Real-Time Proximity Analysis ................................................................................................... 17
2.5.2. Static Analyses .......................................................................................................................... 18
2.5.3. Other Analysis Considerations ................................................................................................. 22
Chapter 3 Application Development………………………………………………………………………23
3.1 Application Requirements................................................................................................................. 23
3.1.1. Application Objective ................................................................................................................ 23
3.1.2. User Requirements .................................................................................................................... 24
3.1.3. Functional Requirements .......................................................................................................... 24
3.2 Application Design ........................................................................................................................... 25
3.2.1. Software .................................................................................................................................... 25

v
3.2.2. Platform .................................................................................................................................... 26
3.2.3. User Experience (UX) Design ................................................................................................... 26
3.3 Data Description ............................................................................................................................... 26
3.4 Mobile Application Development ..................................................................................................... 31
3.5 Web Application Development ......................................................................................................... 33
Chapter 4 Methodology…………………………………………………………………………………... 34
4.1 Company Facilities Dataset Creation ................................................................................................ 34
4.2 Real-Time Analysis .......................................................................................................................... 36
4.3 Static Analyses .................................................................................................................................. 40
4.3.1. The Equity Asset Valuation Process, Steps 3 and 4 .................................................................. 40
4.3.2. PESTELM Datasets Proximity Analysis ModelBuilder to Excel .............................................. 44
4.3.3. Literature Review Risk Analysis ............................................................................................... 45
4.3.4. The Decision-Making Trial and Evaluation Laboratory (DEMATEL), Expert-Interview, and
Analytic Network Process (ANP) PESTELM Analysis ....................................................................... 46
Chapter 5 Results…………………………………………………………………………………………. 48
5.1 Application Development Results .................................................................................................... 48
5.1.1. Web Version .............................................................................................................................. 48
5.1.2. Mobile Application .................................................................................................................... 50
5.2 Real-Time Analysis Results .............................................................................................................. 54
5.3 Static Analysis Results ...................................................................................................................... 55
5.3.1. The Equity Asset Valuation Process Step 5: Applying Valuation Conclusions ........................ 55
5.3.2. PESTELM Datasets Proximity Analysis Excel Charts and Graphs .......................................... 56
5.3.3. Literature Review Risk Analysis Conclusions ........................................................................... 72
Chapter 6 Discussion……………………………………………………………………………………... 73
6.1 Application Development ................................................................................................................. 73
6.2 Real-Time Analysis .......................................................................................................................... 74
6.3 Static Analyses .................................................................................................................................. 76
6.4 Conclusion ........................................................................................................................................ 77
Author Disclosure………………………………………………………………………………………… 78
References………………………………………………………………………………………………… 79
Appendix A: Python Script of Real-Time Proximity Analysis……………………………………………84
Appendix B: Static Analysis ModelBuilder PESTELM Models…………………………………………. 86

vi
List of Figures
Figure 1 The equity asset valuation process………………………………………………………………..2
Figure 2 The PESTELM strategic analytical framework…………………………………………………..4
Figure 3 The Global Industry Classification Standard (GICS) sectors and industries……………………..7
Figure 4 The equity asset valuation process steps 1 & 2…………………………………………………..9
Figure 5 The 2018 Lockheed Martin organizational structure……………………………………………13
Figure 6 The equity asset valuation process step 3………………………………………………………..18
Figure 7 Flowchart of the mobile application development process……………………………………...32
Figure 8 Flowchart of the web application development process…………………………………………33
Figure 9 Flowchart of the company facilities dataset creation……………………………………………36
Figure 10 Flowchart of the real-time proximity analysis: data utilized, analysis, and output…………….40
Figure 11 The equity asset valuation process steps 3 & 4………………………………………………...41
Figure 12 Screenshot of Lockheed Martin Eye.Earth Pro web application……………………………….49
Figure 13 Screenshot of Eye.Earth Pro Web version viewed on mobile browser………………………...50
Figure 14 Political component on mobile application…………………………………………………….51
Figure 15 Economic component on mobile application…………………………………………………..51
Figure 16 Sociocultural component on mobile application…………………………………………….…52
Figure 17 Technological component on mobile application………………………………………………52
Figure 18 Ecological component on mobile application……………………………………………….…53
Figure 19 Legal component on mobile application…………………………………………………….…53
Figure 20 Militaristic component on mobile application……………………………………………….…54
Figure 21 Screenshots of geoprocessing widget during Input, Execution, and Output………………...…55
Figure 22 The equity asset valuation process step 5………………………………………………………55
Figure 23 LMT Political analysis results: facility size to congressional districts…………………………58
Figure 24 LMT Political analysis results: facility division to congressional districts………………….…59

vii
Figure 25 LMT Political analysis results: facilities in congressional districts by party………………..…60
Figure 26 LMT Economic analysis results: facility size to 2015 county Real GDP by source………...…61
Figure 27 LMT Economic analysis results: facility size to 2015 Real GDP per capita by source……..…62
Figure 28 LMT Sociocultural analysis results: facility size to county population by generation……...…63
Figure 29 LMT Sociocultural analysis results: facility size to average male/female populations……..…63
Figure 30 LMT Sociocultural analysis results: facility size to average population by race………………64
Figure 31 LMT Technological analysis results: LMT facilities to airport infrastructure by type……...…65
Figure 32 LMT Technological analysis results: LMT divisions to airport infrastructure…………...……66
Figure 33 LMT Technological analysis results: LMT facilities to airport infrastructure by state……...…67
Figure 34 LMT Technological analysis results: LMT facilities to power plants by source………………68
Figure 35 LMT Ecological analysis results: count of major earthquakes at LMT facilities………...……70
Figure 36 LMT Legal analysis results: count of LMT facilities proximal to courthouses by State………71
Figure 37 LMT Militaristic analysis results: count of LMT facilities to Armed Forces components…….72
Figure 38 Screenshot of LMT political ModelBuilder model………………………………………….…86
Figure 39 Screenshot of LMT economic ModelBuilder model………………………………………...…86
Figure 40 Screenshot of LMT sociocultural ModelBuilder model…………………………………..……86
Figure 41 Screenshot of LMT technological (airports) ModelBuilder model………………………….…87
Figure 42 Screenshot of LMT technological (power plants) ModelBuilder model………………….……87
Figure 43 Screenshot of LMT ecological (historical earthquakes) ModelBuilder model…………….…..87
Figure 44 Screenshot of LMT legal ModelBuilder model…………………………………………..…….88
Figure 45 Screenshot of LMT militaristic ModelBuilder model…………………………………….……88

viii
List of Tables
Table 1 Political Factor Datasets………………………………………………………………………….27
Table 2 Economic Factor Datasets………………………………………………………………………..28
Table 3 Sociocultural Factor Datasets…………………………………………………………………….28
Table 4 Technological Factor Datasets……………………………………………………………………29
Table 5 Ecological Factor Datasets………………………………………………………………………..30
Table 6 Legal Factor Datasets……………………………………………………………………………..30
Table 7 Militaristic Factor Datasets……………………………………………………………………….31
Table 8 Summary of operating results for Lockheed Martin’s business segments (in millions)……….…42
Table 9 LMT Discount Cash Flow (DCF) live calculator………………………………………………...44

ix
List of Abbreviations
AHP Analytic Hierarchy Process
AMI Amazon Machine Image
ANP Analytic Network Process
API Application Programming Interface
AWS Amazon Web Services
BAO Business Analyst Online
BMDS Ballistic Missile Defense System
CAD Computer Aided Design
COPUOS UN Committee on the Peaceful Uses of Outer Space
CSV Comma Separated Value
DCF Discounted Cash Flow
DEMATEL Decision-Making Trial and Evaluation Laboratory
DoD Department of Defense
EC2 Elastic Compute Cloud
EIA US Energy Information Administration
EPS Earnings per Share
GAAP Generally Accepted Accounting Principles
GAO Government Accountability Office
GDP Gross Domestic Product
GICS Global Industry Classification Standard

x
GIS Geographic Information System
GISci Geographic Information Science
GIST Geographic Information Science and Technology
ICAO International Civil Aviation Organization
IDE Integrated Development Environment
ITAR International Traffic in Arms Regulations
JSON JavaScript Object Notation
KML Keyhole Markup Language
LMT Lockheed Martin Corporation
MAUP Modifiable Areal Unit Problem
MFC Missiles and Fire Control
NYSE New York Stock Exchange
PESTELM Political, Economic, Sociocultural, Technological, Ecological, Legal, and Militaristic
R&D Research and Development
REST Representational State Transfer
RMS Rotary and Mission Systems
RSS Really Simple Syndication
SEC Securities and Exchange Commission
SOTP Sum-Of-The-Parts
SQL Structured Query Language
UI User Interface
URL Uniform Resource Locator
USC University of Southern California

xi
USGS United States Geological Survey
UX User Experience
WHS Washington Headquarters Services
WPS Web Processing Service

xii
Abstract
A bridge between spatial science and financial analysis has not yet been built, and this research
lays the foundation to build this bridge using the PESTELM (Political, Economic, Sociocultural,
Technological, Ecological, Legal, and Militaristic) framework, the analytical power of a Geographic
Information System (GIS), equity valuation models, and visualization through a web and mobile
application. This study introduces the concept of equity asset valuation, describes the PESTELM
framework, application development (of both the web and mobile applications), the methodology to
combine a real-time analysis with live datasets, and describes the process of using spatial analyses outputs
as inputs to an equity asset valuation model. Lockheed Martin Corporation is used as the equity asset
valuation case study to quantify how PESTELM datasets affect overall company valuation. The results of
this application development and spatial financial analysis describe the process of using real-time analysis
on live datasets and how static analyses outputs can be used as inputs to a valuation model that uses real-
time financial data through Google Finance. This research is a basis for the intersection between spatial
sciences and financial analysis—and as such provides a recipe to combine the disciplines.

1
Chapter 1 Introduction
Geographic Information Systems (GIS) have been used to analyze many forms of spatial data in
many different fields but are still an underutilized tool in financial analysis. The primary purpose of this
thesis project is the creation of a tool and analysis that helps facilitate better estimations of an equity
asset’s valuation. The tool is in the form of a Mobile and Web GIS Application and the analysis is built
upon the PESTELM (Political, Economic, Sociocultural, Technological, Ecological, Legal, and
Militaristic) strategic framework.
For this research project, the case study equity asset is Lockheed Martin Corporation (NYSE:
LMT) and the study area is the United States. Lockheed Martin is an American aerospace and defense
company with a market capitalization of over $100 billion and employs over 100,000 people. This
company is highly suited for spatial financial analysis because it predominantly operates within the
United States and the datasets acquired for analysis are nationally standardized and high quality. The
analysis is separated into two overarching categories: real-time (which does real-time analysis on real-
time datasets) and static (which forecasts valuations and provides snapshots of the company at certain
times). As of August 2020, the beta iteration of the application is located at the Uniform Resource
Locator (URL): http://eye.earth/. This web application iteration is the initial step to create a version
intended for financial analysts and other professionals. The research detailed in this document lays the
foundation for a new way to advance the field of finance using the latest technology and techniques from
the spatial sciences.
The remainder of this chapter introduces the concept of equity valuation, the PESTELM strategic
analytical framework, the researcher’s motivation, overviews of the application development and
analytical methodology, and provides a breakdown of the thesis’ organization.

2
1.1 Equity Asset Valuation
To begin, the concepts of equity and valuation are introduced. Equity is the ownership of an asset
of value, such as ownership shares of a publicly traded company. Valuation is the estimation of an asset’s
value based on factors related to future investment returns. A critical assumption in valuation is that
market price differs from intrinsic value (intrinsic value is the actual value of an asset given a
hypothetical complete understanding of the asset's characteristics). This assumption is supported by the
Grossman-Stiglitz paradox which states that if an asset’s price perfectly reflected all information, then
there would be no reason for anyone to collect information to trade assets (Grossman-Stiglitz 1980).
In general, the valuation process follows five main steps: “understanding the business, forecasting
company performance, selecting the appropriate valuation model, converting forecasts to a valuation, and
applying valuation conclusions” (Pinto 2015). The first two steps, understanding the business and
forecasting company performance, are discussed in detail in chapter 2, “Background.” Selecting the
appropriate valuation model and converting forecasts to a valuation are explained in chapter 4
“Methodology,” and applying valuation conclusions is covered in chapter 5, “Results.” The figure below
illustrates the equity asset valuation process.
Figure 1 The Equity Asset Valuation Process
Understanding a business begins with an industry analysis; that together with financial statement
analysis and other company disclosures provide a basis for forecasting future cash flows and evaluating
risk. Industry analysis is the analysis of a specific branch of manufacturing, service, or trade. Industry
analysis uses various frameworks to structure an analyst's thinking in a systematic manner and facilitate
understanding. This study focuses on the United States aerospace and defense industry, the framework

3
used to study this industry is the PESTELM strategic analytical framework, and Lockheed Martin
Corporation will undergo the equity asset valuation process and spatial analyses in the following chapters.
1.2 The PESTELM Strategic Analytical Framework
The “PESTEL” (Rothaermel 2015) model is a strategic analytical framework that categorizes the
operating environment into six main categories: political, economic, sociocultural, technological,
ecological, legal, and militaristic. Each component of the PESTELM framework can be broken down into
spatial components using the area of study as the scope and visualized through a GIS web and mobile
application. The primary usefulness of an analytical framework is that it ensures that an analysis gives
appropriate attention to the most important drivers of a business. In other words, a framework organizes
thoughts about an industry and helps better understand a company’s prospects for success.
The components of the PESTELM analytical framework are defined for this study as follows.
The political environment describes the actions and operations of local, state, and federal governments
that can affect a firm’s decision-making process. The legal environment is the most closely related
external force to the political environment and, as such, represents the outcomes of politics as embodied
in laws, court decisions, and other federal or municipal regulations. The economic environment consists
of growth rates, employment levels, costs of living, the supply chain, and corporate tax rates. The
sociocultural environment comprises the location’s population actions, cultures, norms, and values;
demographics (age, gender, ethnicity, sexual orientation, religion, and socioeconomic class) particularly
affect sociocultural factors. The technological environment contains all commercially applied
knowledge/science that can increase a firm’s efficiency. The ecological environment includes local
weather, geography, air quality, climate, and other natural phenomena. The militaristic environment
encompasses the armed forces, equipment, and infrastructure primarily intended for warfare, which are
authorized and maintained by a sovereign state.

4
Figure 2 PESTELM Analytical Framework for Use in Analyzing the External Environment of the
Aerospace and Defense Industry
1.3 Motivation
In general, the major benefit that this research would bring to society is to improve the
dissemination of information. The predominant form of information gathering in our society comes from
television, printed sources, radio, and the internet. All these sources, however, are limited because they
provide incomplete pictures of the state of the world; this may largely be due to information purveyors’
monetary incentive to cater to human emotions rather than intellect.
Some publications are better than others (i.e., The Economist, Forbes, NPR, and Associated
Press) at reporting the facts and not sensationalizing stories (i.e., The New York Times, the Washington
Post, Fox News, and Breitbart). The sickness known as sensationalism is the current way information is

5
disseminated; this rampant editorial bias overhypes events and presents skewed impressions of them on
the public. Presumably, the goal of sensational reporting is to increase viewership/profits or to promote a
particular political ideology. This information oxymoron has resulted in a large chunk of the population
thinking that they are well versed on the state of the world, when in fact they are highly ignorant about a
variety of subjects. Even an intelligent professional that is very successful in his or her field can still be
ignorant of many things outside their expertise. Given limited time and energy, people pick and choose
what to learn, and devote their efforts to seeking interesting or career-advancing knowledge.
The results of this research will form the foundation of a new and innovative tool to visualize
information that is derived from a scientific rather than sensational origin. This is of especially vital
importance in the financial world, where no matter how many financial models’ large firms create, every
single one of them fails in the face of human behavior (which is magnified exponentially by sensational
news).
The major benefit that this research would bring to spatial sciences and financial analysis is that
no academic or commercial examination of the combination of the PESTELM framework with a GIS and
financial analysis has ever been conducted. An industry analysis should highlight which aspects of a
company’s business present the greatest challenges and opportunities and should be subject to further
investigation. Analysts must stay current on facts and news concerning the industry or industries in which
a company operates. Particularly important to valuation are PESTELM factors likely to affect the
industry’s long-term profitability and growth prospects. Additionally, by combining geoprocessing with
compatible equity valuation models, analysts can gain unbiased insights that were previously not possible.
The ultimate long-term goal of this proposed application and the underlying strategic analysis is
to expand location-driven intelligence to every industry and to help solve one of humanity’s biggest
problems: that there is no clear picture of the state of the world.

6
1.4 Application Development Overview
The application development is split into two paths: the process for web development and mobile
development. The web development relies on Web AppBuilder for ArcGIS and the mobile development
relies on the Qt Creator Integrated Development Environment (IDE) for programming and customization.
Each PESTELM component has its own associated ArcGIS Online web map and the datasets that
comprise each of these web maps are either in geoJSON format (live datasets), in CSV (static datasets)
format, or Shapefiles (.shp). The application development process followed the author’s previous
PESTELM app development projects and debugging had been worked out prior to this research study.
1.5 Methodology Overview
The methodology of this thesis is first and foremost to establish a repeatable procedure for
expanding the PESTELM framework analytical research to other public companies in every industry and
sector. The methodology chapter differentiates between two types of analytical options for a company:
real-time analysis (which updates in tandem with the live datasets) and static analysis (which provides a
snapshot at a particular time). The real-time analysis portion discusses how to automate a proximity
analysis of a company’s operational/managerial facilities to PESTELM factors. The static analyses
portion covers the equity asset valuation process, Literature Review Risk analysis, and the Decision-
Making Trial and Evaluation Laboratory (DEMATEL)/Expert-Interview/Analytic Network Process
(ANP) analysis.
Public companies provide a key window into the inner workings of themselves through the
annual filings required by the Securities and Exchange Commission (SEC). Equity (ownership shares
issued by a company) is classified by the Global Industry Classification Standard (GICS). The GICS
hierarchy consists of 11 sectors (Energy, Consumer Staples, Consumer Discretionary, Communications
Services, Financials, Health Care, Information Technology, Materials, Real Estate, and Industrials), 69
industries, and 158 sub-industries.

7
To geolocate the operational and managerial locations of a company for analysis, a combination
of the respective SEC filings, Government Accountability Office (GAO) reports, job postings, county and
municipal-level property tax data, and verification via Google Maps Street View is used.
Figure 3 Global Industry Classification Standard (GICS) Sectors and Industries Focusing on the
Aerospace and Defense Industry
1.6 Thesis Organization
The remainder of this thesis is organized into five additional chapters. Chapter 2 provides the first
two steps of the equity asset valuation process, historical context, background literature, application
development background, and analysis background. Chapter 3 outlines the application development steps:
the application requirements, application design, data description, and web/mobile application

8
functionality. Chapter 4 details the creation of the company facility dataset and illustrates the
methodology for two different types of analysis: real-time and static. Chapter 5 summarizes the results of
the application development and analysis. Lastly, chapter 6 discusses the results and future improvements
to the work.

9
Chapter 2 Background
This chapter begins with the first two steps of the equity asset valuation process: understanding
the business and forecasting company performance. Next, it explains the origins of the PESTEL analytical
framework and compares this study to other industry studies using the PESTEL framework. Then, the
chapter briefly touches on the application development background and reviews related applications, goes
into depth on the types of analysis that have been done using the PESTEL framework, and finishes on
other considerations to be made before an analysis.
2.1 The Equity Asset Valuation Process, Steps 1 and 2
The first two steps of the equity asset valuation process, understanding the business (which
includes both an industry analysis and a company analysis) and forecasting company performance are
discussed below.
Figure 4 The Equity Asset Valuation Process, Steps 1 and 2
2.1.1. Understanding the Business—Industry Analysis: US Aerospace and Defense
To understand the reasoning Lockheed Martin was chosen as a case study, it is useful to have a
general overview of the United States aerospace and defense industry. Before World War II, wars were
predominantly fought using strategy and vast numbers of soldiers fighting on the ground with differences
in technology playing a minor role in a conflict’s outcome (Clausewitz 1993). The German V2 rockets
were a complete technological game changer which allowed Germans to bomb London from hundreds of
miles away (Perring 1946). Along with this, the American Manhattan Project produced the first nuclear
weapons (Groves 2009). These inventions changed the game forever as war was no longer about who had
more soldiers and instead it was about who had the best technology (Macrae 2019). President
10
Eisenhower was the first American president to realize this and in his 1961 farewell address stated, “. . .
we have been compelled to create a permanent armament industry of vast proportions . . .” (Eisenhower
1961, 4). The military technology race had started, and with it, a brand-new doctrine—deterrence (Macrae
2019). It was no longer possible to readily convert civil factories into military ones because the
engineering for faster than sound aircraft and missiles was too precise and fissile material enrichment too
complex (Macrae 2019). In other words, to deter potential enemies, it is critical to be a technology leader,
and to be a technology leader it is necessary to invest in the industry even in times of peace. Thus, the
partnership between government and private companies, the military-industrial complex, was born from
this dynamic (Ledbetter 2011).
Over time, Lockheed Martin has become a centerpiece of the military-industrial complex and
plays a pivotal role in maintaining the United States technological advantage over adversaries (Lockheed
Martin 2018). As of December 31, 2018, Lockheed Martin has over 100,000 employees (93% of whom
work in the US), utilizes over 15,000 suppliers in every US state (which receive $19.3 billion annually for
their services), and exports strategically important technology and services to ally countries (Lockheed
Martin 2018). Lockheed Martin’s main competitors are Boeing (BA), Raytheon Technologies Corp
(RTX), Northrop Grumman (NOC), and General Dynamics (GD). A more comprehensive industry
analysis would need to include these companies, but that is beyond the scope of this thesis research. The
next section details a company analysis of Lockheed Martin.
2.1.2. Understanding the Business—Company Analysis: Lockheed Martin Corp.
A thorough company analysis provides an overview of the company (corporate profile), relevant
industry characteristics, an analysis of the demand for the company’s products and services, an analysis of
the supply of products and services, and a presentation of relevant financial ratios (Pinto 2015). The
corporate profile of Lockheed Martin begins with a history and overview of the company and then
discusses its organizational structure and the major programs within its business segments. An analysis of
the supply of products/services (e.g., sources, industry capacity outlooks, company capacity, cost

11
structure, import/export considerations, and proprietary technology) is beyond the scope of this research.
Relevant financial ratios are presented in chapter 4, “Methodology,” in tandem with the sum-of-the-parts
(SOTP) valuation model. The sum-of-the-parts valuation model is introduced later in this chapter in the
“Analysis Background” section.
In 1912, Glenn Martin established the Glenn L. Martin Company in Los Angeles, California, after
building his first plane in a rented church. In the same year, two talented mechanics, Allan and Malcolm
Lockheed founded the Alco Hydro-Aeroplane Company out of a garage. These two companies with very
humble beginnings eventually merged in 1995 and became the world’s predominant aerospace and
defense industrial juggernaut. Lockheed Martin is “. . . a global security and aerospace company
principally engaged in the research, design, development, manufacture, integration, and sustainment of
advanced technology systems, products and services” (Lockheed Martin 2018, 3). Lockheed Martin
serves both United States and international customers; however, 70% of their 2018 $53.8 billion in net
sales came from the US government alone. As of July 2020, the company has a market capitalization of
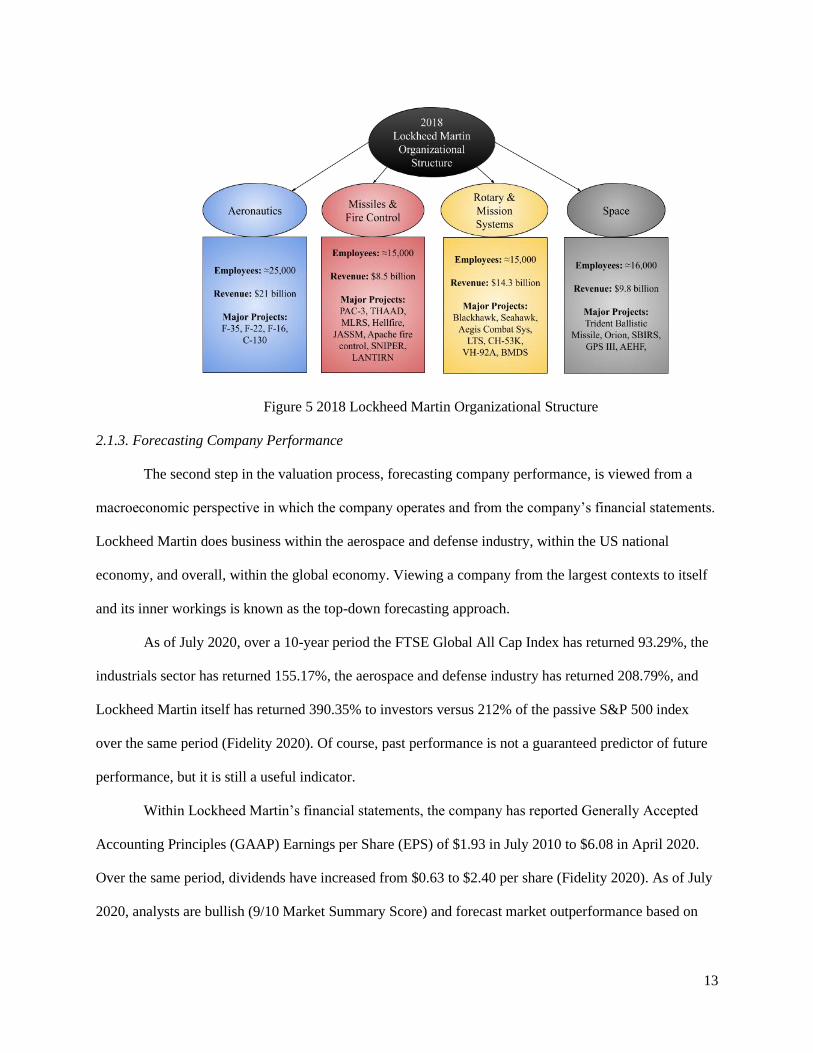
over $100 billion. The organizational structure of Lockheed Martin detailed in its 2018 SEC filing,
operates in four business segments: aeronautics, missiles and fire control (MFC), rotary and mission
systems (RMS), and space.
In 2018, the aeronautics segment generated $21 billion in revenue and “. . . is engaged in the
research, design, development, manufacture, integration sustainment, and support of advanced military
aircraft . . .”(Lockheed Martin 2018, 3) including the F-35 Lightning II (fifth generation stealth fighter),
the C-130 Hercules (tactical airlifter), F-16 (low-cost fighter), and the F-22 (air dominance stealth
fighter). Additionally, the aeronautics segment has many advanced development programs focused on
future systems such as unmanned aerial systems, advanced strike, intelligence, surveillance,
reconnaissance, situational awareness, and air mobility (Lockheed Martin 2018).
The missile and fire control (MFC) segment generated $8.5 billion in revenue in 2018 and
provides air and missile defense systems, precision strike weapon systems, logistics, fire control systems,
operations support, manned and unmanned ground vehicles, and energy solutions. MFC’s major programs
12
include the PATRIOT and THAAD air and missile defense systems, several offensive missile programs,
the Apache helicopter fire control system, and the Special Operations Forces Global Logistics Support
Services (Lockheed Martin 2018).
The rotary and mission systems (RMS) segment generated $14.3 billion revenue in 2018 and is
responsible for the design, manufacture, service, and support of military and commercial helicopters; ship
and submarine mission and combat systems; systems and sensors for aircraft; radar systems; simulation
and training services; cybersecurity; and communications capabilities. RMS’ major programs include the
Blackhawk and Seahawk helicopters, the Aegis Combat System, the Littoral combat ship, the CH-53K
King Stallion helicopter, the VH-92A Marine One transport helicopter, the Advanced Hawkeye Radar
System, and the air operations center for the Ballistic Missile Defense System (BMDS) of the US
government (Lockheed Martin 2018).
The space segment generated $9.8 billion revenue in 2018, and its operations include the
research, design, development, engineering, production of satellites, space transportation systems, strike
and defensive systems, and network integrated space and ground systems to provide situational awareness
and intelligence. Major space programs include the Trident ballistic missile program, the Orion crew
spacecraft, space-based infrared systems for Air Force intelligence, the Global Positioning System III, and
the Advanced Extremely High Frequency satellite system for ultra-secure Air Force communications
(Lockheed Martin 2018).
The geographic locations of these segments with an underlying analysis provide key insights into
how the company conducts its operations and the positions of its facilities relative to the identified
PESTELM factors. For example, almost every Air Force and Navy base has a Lockheed Martin facility to
provide spare parts, repairs, training, and logistical support for the Lockheed Martin aircraft that base
utilizes.
13
Figure 5 2018 Lockheed Martin Organizational Structure
2.1.3. Forecasting Company Performance
The second step in the valuation process, forecasting company performance, is viewed from a
macroeconomic perspective in which the company operates and from the company’s financial statements.
Lockheed Martin does business within the aerospace and defense industry, within the US national
economy, and overall, within the global economy. Viewing a company from the largest contexts to itself
and its inner workings is known as the top-down forecasting approach.
As of July 2020, over a 10-year period the FTSE Global All Cap Index has returned 93.29%, the
industrials sector has returned 155.17%, the aerospace and defense industry has returned 208.79%, and
Lockheed Martin itself has returned 390.35% to investors versus 212% of the passive S&P 500 index
over the same period (Fidelity 2020). Of course, past performance is not a guaranteed predictor of future
performance, but it is still a useful indicator.
Within Lockheed Martin’s financial statements, the company has reported Generally Accepted
Accounting Principles (GAAP) Earnings per Share (EPS) of $1.93 in July 2010 to $6.08 in April 2020.
Over the same period, dividends have increased from $0.63 to $2.40 per share (Fidelity 2020). As of July
2020, analysts are bullish (9/10 Market Summary Score) and forecast market outperformance based on
14
the StarMine Relative Accuracy Score (StarMine 2020). This score is calculated using a collective of sell-
side and independent research providers.
The third step of the equity asset valuation process, selecting a valuation model, is discussed in
section 5 of this chapter, “Analysis Background.”
2.2 The PESTEL Analytical Framework Background
This section begins with a history of the PESTEL analytical framework, gives examples of how it
has been used to analyze other industries and companies, and describes what researchers have done with
regard to this study’s topic and how they relate to the research goals. The researchers’ study scopes are
highlighted, and an analysis of their successes and failures is included. The differences between these
studies and the proposed research are compared, and the limitations of how they can be emulated and
applied is also discussed.
The PESTEL analytical framework (in some iteration) has been used intermittently in business
strategic management for the last few decades and has expanded to engineering projects and operations
management (Rastogi 2016). The earliest known reference to a PESTEL iteration is “Scanning the
Business Environment” (Aguilar 1967), where he uses the abbreviation ETPS (Economic, Technical,
Political, and Social). Shortly thereafter, the United States Institute of Life Insurance reorganized it as the
STEP. In the 1980s, several other researchers reorganized the abbreviation as PEST and added factors
such as Ecological, Legal, International, and Ethical to make the analysis more encompassing of the
external environment. The various forms of PESTEL are chosen for analysis, depending on the goals and
objectives of the researching entity. For the sake of clarity in this paper, consider PESTEL, PESTLE, and
PESTELM interchangeable with one another.
2.2.1. Industry Studies Using the PESTEL Framework
The following studies are examples of work that other researchers have done using the PESTEL
framework to study industries and companies.

15
Kolios and Read (2013) use the PESTLE framework for risk identification of the tidal industry in
the United Kingdom by reviewing the most up-to-date literature for each factor. The focus of research in
tidal energy has been upon the technology, but for the technology to become viable, other PESTLE
factors must be considered. The study found that various stakeholders had very different risks associated
with a tidal energy project. This research provides a groundwork for mitigating project risks through
stakeholder mapping and knowledge sharing. Additionally, this study incorporates broader political,
economic, legal, and environmental factors beyond national policies by considering the European Union
as well.
Holland (2004) details a case study on the global pharmaceutical industry and assesses the
competitive environment of the industry by utilizing PESTEL, Porter’s five forces, and Scenario
Planning. The researcher discusses the recent industry history and boundaries (staying within
pharmaceuticals and not straying to other healthcare markets). The PESTEL economic factors are further
partitioned into the demand and supply forces. The social factors include ethical issues relevant to
corporate strategy. For example, pharmaceutical companies literally “benefit from human suffering” and
must avoid actions that put profits ahead of patient well-being.
Zahari (2019) analyzes flight operations within the nascent suborbital flight industry using the
PESTEL framework to explore its prospects and risks from an “aerial view.” There are many advantages
and disadvantages that the blossoming suborbital flight industry could bring to a nation, and both must be
considered carefully to ensure operational sustainability. This study provides useful parallels to the more
mature aerospace and defense industry, especially in the ecological, legal, and technological framework
areas.
2.3 Application Development Background
The application development builds off two of the researcher’s previous projects: the SSCI591
web application (Straw 2019) and the SSCI592 mobile application (Straw 2020b). The web application
uses a highly customized template from ArcGIS Web AppBuilder to save on front-end development time

16
and the mobile application uses software customized in the Qt Creator integrated development
environment (IDE). Both applications use ArcGIS online web maps to host and display the PESTELM
spatial data. The web application uses the USC ArcGIS server and database to host the geoprocessing
service enabled within the app. The application development process for these two projects and the
application additions to this thesis are described in detail in chapter 3, “Application Development.”
2.3.1. Related Applications
An indirectly related application, but the primary inspiration for this application, is the Total War
series of strategy games. Total War is a series of PC strategy games that combine turn-based strategy and
resource management with real-time tactical control of battles. The greatest things about the game are its
user interface (UI) and user experience (UX) design, which are the main sources of inspiration for the
design aspects of this application. The map switches seamlessly between global, national, and local views
(each with their corresponding base map and layer detail) and presents the game’s nuanced information as
a clean, simple pop-up for practically every button and feature. The main idea behind the UX/UI is to
weave all the information through a simple interface rather than stratify the screen full of menus and
buttons. This even extends to the use of the color palette, which artfully describes the interrelationships
between the workings of the world (Creative Assembly 2019). https://www.totalwar.com/
Another related application is the GDELT project, a global database of human society supported
by Google Jigsaw. It monitors the world’s news (in all forms and places) in over 100 languages and
identifies the people, locations, groups, emotions, and other events that drive our global society every day
on an open platform. Their data is available for download and querying in a variety of formats and can be
integrated into web and mobile applications. This study plans to integrate the GDELT project data as a
news feed into future iterations of the application (Leetaru 2019). https://www.gdeltproject.org/
A final related application is Esri Business Analyst Online (BAO). Esri Business Analyst is an
extension for ArcGIS that provides location-based intelligence for firm planning, site selection, and
customer segmentation, but it is still in the nascent stages of its evolution and falls severely short of
17
complete environmental analysis by missing important framework categories. This strategic analysis and
application would advance the Business Analyst extension through the political, legal, and technological
environments, on which their application hardly touches (Esri 2019a). https://bao.arcgis.com/
2.5 Analysis Background
This section discusses two categories of analysis: real-time and a static. The real-time analysis
updates in tandem with the live datasets and is one of the primary goals of this thesis. The static analysis
provides a snapshot of the target company at a certain point in time and is addressed for auxiliary analysis
and future improvement purposes. The ultimate goal would be to eventually move all of the static analysis
processes to become real-time analyses. The process of doing so is discussed in chapter 6, “Discussion.”
The end of this section outlines other considerations to be made before analyses are conducted.
2.5.1. Real-Time Proximity Analysis
The real-time proximity analysis builds on the researcher’s previous project “Automating a
Proximity Analysis of Study Firms to Sacramento, CA Infrastructure” (Straw 2019) and two fellow USC
students master’s theses, “Social Media Canvassing Using Twitter and Web GIS to Aid in Solving
Crime” (Stone 2017) and “Precipitation Triggered Landslide Risk Assessment and Relative Risk
Modeling Using Cached and Real-Time Data” (Barnett 2016).
The Straw (2019) automated proximity analysis measured the distance of 47 study firms from six
different industrial sectors to the city of Sacramento’s technological infrastructure. This automated
analysis was built using ModelBuilder and the Python programming language. Essentially, the two main
geoprocessing tools used to complete a proximity analysis are Buffer and Intersect. Buffer is used when
the input dataset is a vector point and needs to be turned into a polygon to “intersect” with the study
PESTELM dataset. The buffer size is always a parameter and can change based on the analysts/user’s
goals for that dataset. Intersect combines two study datasets into one based on a shared spatial attribute.

18
Stone (2017) and Barnett (2016) provide the link between taking the results of the proximity
analysis and making it a real-time analysis by uploading as a feature service on ArcGIS online. They do
this by hosting their models on cloud servers such as MongoDB and Amazon EC2. The process of
utilizing these software resources are discussed further in section 3.2, “Application Design,” and section
4.1, “Real-Time Analysis.”
2.5.2. Static Analyses
This section discusses step 3 of the equity asset valuation process: selecting a valuation model,
the static PESTELM datasets ModelBuilder to Excel Process, and two other types of static analyses that
have been done by other researchers utilizing the PESTELM framework, which are the literature review
risk analysis of an industry to the PESTEL factors, and the DEMATEL, Expert-Interview, and ANP
analysis (which quantifies the risk of each PESTELM factor to a target company).
2.5.2.1. The Equity Asset Valuation Process, Step 3: Selecting a Valuation Model
Figure 6 The Equity Asset Valuation Process, Step 3
There are dozens if not hundreds of different valuation models and, in practice, an analyst
typically uses a variety of models to estimate the value of a company. These valuation models typically
fall into two categories: absolute valuation and relative valuation. Absolute valuation models result in the
asset’s intrinsic value that can be compared with the market price. Relative valuation models estimate an
asset’s value relative to another asset (usually an entire industry group) and typically compare price
multiples or enterprise multiples. However, one variation to both absolute and relative valuation models is
to estimate a company not as a single entity but as the sum of its various divisions, a sum-of-the-parts
(SOTP) valuation. The SOTP valuation aggregates the values of the company’s various divisions, values

19
them separately, and adds them together to arrive at a total enterprise valuation. SOTP is frequently used
to evaluate the value increase that might be achieved in a restructuring (spin-off, split-off, or IPO carve-
out), but has many other uses as well. This valuation technique has been chosen for this study because a
detailed breakdown of each division’s contributions to earnings would allow for a sensitivity analysis of
cash flow growth disruptions. For example, how would losing operational capabilities at the F-35 Fort
Worth plant temporarily or permanently affect overall company value?
2.5.2.2. PESTELM Datasets Proximity Analysis ModelBuilder to Excel
The background of the PESTELM datasets proximity analysis follows the real-time analysis with
the ModelBuilder portion, but instead of creating a Map Service to view the results within an app, the
results are exported to an Excel spreadsheet to analyze patterns, outliers, and anything else of note
through graphs and charts. This analysis methodology is discussed in detail in section 4.3.2 and the results
are presented in section 5.3.2.
2.5.2.3. Literature Review Risk Analysis
This section details the latest literature on each PESTELM factor and its associated relationship to
the aerospace and defense industry. This literature review emulates the three PESTEL industry studies in
section 2.2 with the overall goal of forming a PESTELM risk analysis using the latest literature.
The political factor has five initial findings to be considered: assessing and strengthening the
manufacturing and defense industrial base and supply chain resiliency of the United States (White House
2017a) to adequately provide critical technology in the space industrial base in a timely manner pursuant
to section 4533(a)(5) of the Defense Production Act of 1950 (White House 2017b), international
cooperation such as the International Space Station and F-35 program (Rovetto 2013), the lack of
boundary between air and space (Hobe 2010, Masson 2013, Seedhouse 2008), and the threat to national
sovereignty from suborbital flight activity requires new powers for the International Civil Aviation
Organization (ICAO) or a new governing authority (Crowther 2011).

20
The economic factor has five initial findings to be considered: an increase in defense spending
(Congressional Budget Office 2019), new industries emerging (e.g., suborbital flights, orbital flights,
transport, and space mining) (Beery 2012, Collins 2010), the spill-over-effect to downstream industries
(insurance, marketing, finance, system maintenance/support, resupply) (Beery 2012, Collins 2010), the
globalized supply chain features of the aerospace industry with a focus on Airbus and Boeing (Mocenco
2015), and dependence on contracts with US government for business revenue (Lockheed Martin 2019).
The sociocultural factor has three initial findings to be considered: public opportunity for space
travel (upper-middle/upper class) and potential discrimination of the lower class (Le Goff and Moreau
2013), new jobs in engineering, manufacturing, maintenance, piloting, managerial, training, and flight
services (Collins 2010), and the social cost of aircraft noise, charge mechanisms, and mathematical
measurements (Morrell and Lu 2000).
The technological factor has six initial findings to be considered: established technologies as a
driving force for the aerospace industry (Ardito 2016), low cost and reusable technology and material
being led from the private sector (Goehlich 2013), suborbital flight technology for military and civilian
uses such as SpaceX (Billings 2006), large volume data analysis with the aerospace industry
(Badea2018), the national artificial intelligence research and development strategy (White House 2016),
and cybersecurity incidents and disruptions negatively affecting business (Lockheed Martin 2019).
The ecological factor has four initial findings to be considered: pollution from aircraft emissions
(Environmental Protection Agency 2019), pollution generated from upper-class space tourism launches
(Castleman 2013), increased atmospheric composition data from flight operations between 50km and100
km as a weather balloon typically only reaches 50 km (Moro-Aguilar 2014, Yamagami 2004), and
environmental costs from the variety of federal, state, local, and foreign environmental protection laws
and regulations (Lockheed Martin 2019).
The legal factor has four initial findings to be considered: the uncertainty on the regulatory body
for suborbital flight operation (either create new agency or empower ICAO further (Masson-Zwann 2013,
2014)), the divergence between aviation and space law (i.e., ICAO vs. Outer Space Treaty 1967 which is

21
governed by the UN Committee on the Peaceful Uses of Outer Space (COPUOS) (Masson-Zwann 2010,
Sikorska 2014)), the export of technical data under the International Traffic in Arms Regulations (ITAR)
(McGowan 2007), and companies being subject to procurement laws and regulations (Lockheed Martin
2019).
Lastly, the militaristic factor has one initial finding to be considered: the Department of Defense
(DoD) strategy for the national defense of the United States of America (Mattis 2018).
2.5.2.4. Static Analysis Using DEMATEL, Expert-Interview, and ANP
This section discusses a type of static analysis that is most useful as a tool for upper-level
management decision making. The inputs required for this analysis include expert-level interviews from
within the company itself, and thus, is beyond the scope of this thesis project. However, this analysis type
could theoretically be automated in the future to become another type of real-time analysis. It is included
in chapters 2 and 4 of this thesis, because if anyone wishes to build on this thesis in the future, it is a
feasible route.
Yüksel (2012) presents a model to measure and evaluate (quantify) a PESTEL analysis. The goal
of the study is to provide a means for strategic decision making for a company. Yüksel uses the Analytic
Hierarchy Process (AHP) and Analytic Network Process (ANP) to hierarchically structure the PESTEL
subfactors and determine the relative individual factor weights. The relationships between the factors
were modeled by the Decision-Making Trial and Evaluation Laboratory (DEMATEL) and Yüksel uses a
company in Ankara, Turkey, to illustrate his methodology. Yüksel successfully demonstrated
relationships between not only the main PESTEL factors but also the subfactors. Additionally, this study
showed that the PESTEL analytical model can determine the extent to which a company is affected by its
external environment. The limitations of this study include an ambiguity in the precise structure of the
PESTEL factors, likely due to the difficulty of quantifying factors to a high degree of precision and that it
provides a snapshot in time rather than being a real-time analytical technique.
22
This analytical technique is presented in this thesis as a further example of what kind of analyses
can be done using the PESTELM analytical framework. Originally, this analysis was going to be the
focus of this thesis if it was focused more on management decision making rather than spatial financial
analysis and application development.
2.5.3. Other Analysis Considerations
A major consideration for a successful analysis is a way to deal with the large number of datasets
and ensure the web GIS application does not crash when large amounts of concurrent users access it..
Jones (1996) details a distributed geospatial framework for data storage and processing of large-scale GIS
applications. His proposal contains a scalable cloud-based architecture designed for elasticity, presents
methods for geospatial data placement and refinement to improve input and output efficiency, and
proposes a model for parallel processing of massive geospatial datasets. This study will attempt to avoid
data storage and processing issues by hosting pre-rendered analyses server-side rather than having the
client browser do most of the processing. Certain datasets deemed less important will not be visible at all
scales, and vector polygon datasets will be transformed into vector line datasets pre-analysis to reduce
processing strain. Additionally, the scalability and elasticity of Amazon’s EC2 cloud server addresses
some of these challenges.
A final consideration is recognizing that a gap between spatial and financial research exists and
there is an actual need for this research. Fujita (1999) recognizes that spatial economics has remained
outside of mainstream economics because spatial components cannot fit neatly into Arrow-Debreau type
competitive equilibrium models. Additionally, Anderson (2004) comments that economists do not deal
with organizing the economy by thinking spatially. Boasson (2001) looks at the role of geographic
location in financial performance of companies through empirical evidence, and he showed that company
performance is influenced by combinations of strategic and locational variables. Yang (2015) recognizes
that regional economic strategies with the combination of spatial planning is under-appreciated.

23
Chapter 3 Application Development
This chapter primarily focuses on the application development of the mobile application. The web
application is created through ArcGIS Web AppBuilder and requires very little development as a result.
The feature layers and web maps hosted on arcgis.com can be used for both the web and the mobile
application with only a few changes needed between the two. Below, the chapter begins with the
application requirements (objective, user requirements, and functional requirements), then detail the
application design (software, platforms, and user experience (UX)), describe the data in the application,
and detail the development of the mobile and web applications.
3.1 Application Requirements
The application requirements include the application’s objective, user requirements, and
functional (technical) requirements. The application objective leads the way for the user requirements,
and the user requirements dictate the necessary functional requirements.
3.1.1. Application Objective
The objective of this application is to visualize the PESTELM factors of Lockheed Martin
Corporation in a visually appealing and informative manner while providing a real-time analysis of both
cached and real-time data. A user opens the application and is presented with the Eye.Earth free public
view of the application. Here there is a header bar containing the name of the application and an
information button which describes how to use the application. The Pro version contains options to select
a business sector, industry, and company. The main view of the application is a web map that begins on
the political component. On the map view, there is a combo box to change the map to each of the
PESTELM framework categories, a collapsible legend that shows the layers each web map contains, and
a floating action button that shows analysis results (for Pro users) and in future iterations a list view for

24
the GDELT project news feed. Users can click every element within the web map and an informative
pop-up will explain the entity in further detail.
3.1.2. User Requirements
To meet the objective of this application, the user must be able to examine a static and/or real-
time analysis.
3.1.3. Functional Requirements
Regarding the application’s user requirements, there are several operations that the application
must perform in the back-end architecture. The application itself is written in the Qt Creator, an integrated
development environment (IDE) capable of compiling JavaScript cross-platform to Android, IOS, Apple,
and Windows devices. The compiled JavaScript is then used to load the map view and the user interaction
buttons.
The minimum specifications on a user’s device must be met for the app to be downloaded; the
threshold target is 97% of smartphones. For example, this can be achieved by specifying the
programming for the Android API (application programming interface) version Nougat (v7.0+).
Smartphones that have the capability to download at least this OS version of Android will also have the
necessary hardware capabilities to run the application.
The real-time proximity analysis will need to be run server-side rather than on the client device.
This is mostly due to the “polygon problem” for mobile devices, and the output of the real-time analysis
will be several circular polygons. The polygon problem is that polygons load extremely slowly on mobile
devices and using them pretty much renders a mobile application obsolete. Either polygons must be
converted to lines/points or they must be rendered server-side before a user opens the application.

25
3.2 Application Design
The application design encompasses the software utilized, the intended platforms the web and
mobile application will run on, and the user experience (UX) design.
3.2.1. Software
The mobile and web application earlier iterations used Esri’s software suite for front-end
development. The web version uses Web AppBuilder for ArcGIS (which offers easily configurable
templates for your web maps). The mobile version uses AppStudio for ArcGIS and Qt Creator for
customization, programming, and testing.
JavaScript editing can be done with the Web AppBuilder templates but was not done during this
development because the off-the-shelf widgets were adequate for the goals of this application.
Additionally, JavaScript debugging for the mobile application was completed prior to this research
project. In future iterations of this application, the JavaScript for the web application will be edited to
customize and tailor the application further.
The back-end software required for running the real-time analysis is Amazon EC2 (Elastic
Compute Cloud) built with ArcGIS Server and integrated with Microsoft SQL for spatial databases. An
additional program used was Visual Studio Code with Python extensions. Visual Studio Code (VS Code)
is an IDE developed by Microsoft that is optimized for developing web and cloud applications. VS Code
is used to edit the Python script that underlies the proximity analysis. The script is uploaded to the USC
ArcServer and database as a geoprocessing service. The geoprocessing service is attached to the
necessary PESTELM web maps and then the application accesses those web maps when it is loaded by
the user (for both the web and mobile versions).
ArcServer has been chosen for this study because the author has experience with it and time
management considerations demanded it. But more importantly, it was used instead of solely relying on
ArcGIS Online because the author wanted back-end experience that could be translated to other GIS
systems. Being trapped in one GIS ecosystem is helpful for efficiency but there is no guarantee that Esri

26
will remain the dominant GIS provider in the future and understanding the backend server is a way to
hedge bets against this uncertainty.
The software used for testing the mobile application is the AppStudio Player application available
on both Google Play Store and the Apple Store.
3.2.2. Platform
The intended platforms that the web application runs on are desktop computers capable of
supporting any modern browser (with the web application running on the browser itself). The mobile
platforms this application will run on include Apple IOS and Android. In addition, the web version can be
accessed via mobile devices using their mobile devices associated web browser.
3.2.3. User Experience (UX) Design
The guiding design principles brought to this project can be boiled down to a very simple design
principle espoused by both Steve Jobs and Elon Musk: that the product is both “fun and sexy” (Isaacson
2012). The “fun” aspect comes down to the map layout being the centerpiece of the UI/UX, the datasets
being mostly live and interactive, and the pop-ups being appropriately informational and fun to read. The
“sexy” aspect is derived from balancing content with simplicity and the buttons/menus being kept to an
absolute minimum. The map feels appropriately busy; whereby there is enough content to keep you
interested but not so much that it is excessively cluttered. Additionally, the crowning achievement of the
interface is the deliberate and careful use of color coding the features according to the initial PESTELM
framework categories.
3.3 Data Description
The Lockheed Martin company dataset created for this study is in CSV (comma separated value)
form. It consists of most of the locations where the company operates, number of employees, security
level, building type, projects underway at the facility, jobs performed at the facility, and phone numbers
for additional data gathering if needed. This data was gathered using Lockheed Martin’s 2018 10-K SEC
27
filing for initial reference, and Google Maps Street View for location confirmation. Additionally, this
dataset is cross-referenced with the company’s job postings for certain cities to extrapolate the facilities
main purpose and functionality. The creation of this dataset is explained in detail in section 4.1,
“Company Facility Dataset Creation.”
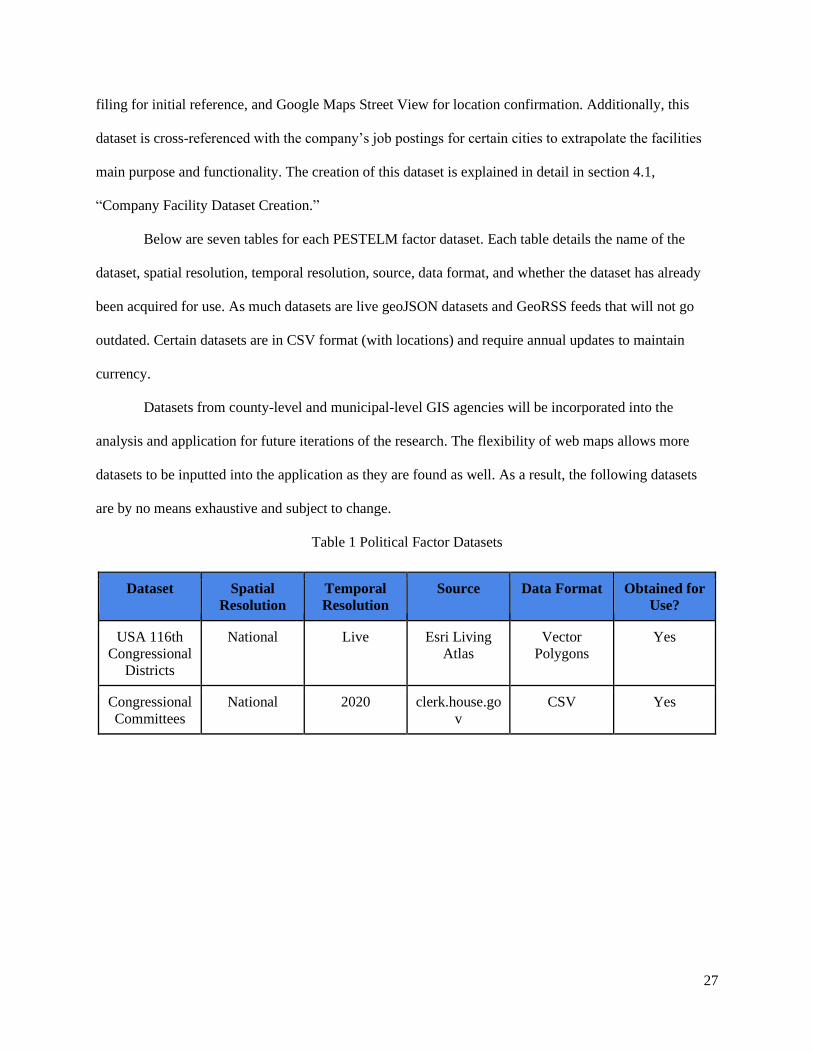
Below are seven tables for each PESTELM factor dataset. Each table details the name of the
dataset, spatial resolution, temporal resolution, source, data format, and whether the dataset has already
been acquired for use. As much datasets are live geoJSON datasets and GeoRSS feeds that will not go
outdated. Certain datasets are in CSV format (with locations) and require annual updates to maintain
currency.
Datasets from county-level and municipal-level GIS agencies will be incorporated into the
analysis and application for future iterations of the research. The flexibility of web maps allows more
datasets to be inputted into the application as they are found as well. As a result, the following datasets
are by no means exhaustive and subject to change.
Table 1 Political Factor Datasets
Dataset Spatial
Resolution
Temporal
Resolution
Source Data Format Obtained for
Use?
USA 116th
Congressional
Districts
National Live Esri Living
Atlas
Vector
Polygons
Yes
Congressional
Committees
National 2020 clerk.house.go
v
CSV Yes

28
Table 2 Economic Factor Datasets
Dataset Spatial
Resolution
Temporal
Resolution
Source Data Format Obtained for
Use?
Corporate
Headquarters
National Live Esri Living
Atlas
Vector Points Yes
Lockheed
Martin
Facilities
Global 2020 SEC Filings,
Job Postings,
Google Maps
CSV with
Lat/Long
Yes
Upstream
Supply Chain
and Raw
Materials
Global 2019 SEC Filings,
Google Maps
CSV with
Lat/Long
No
GDP by
County
National 2018 Esri Living
Atlas
Vector Lines Yes
Table 3 Sociocultural Factor Datasets
Dataset Spatial
Resolution
Temporal
Resolution
Source Data Format Obtained for
Use?
Demographics National 2010 Data.gov Vector
Polygons
Yes
Tapestry
Segmentation
National 2019 Esri Living
Atlas
Vector
Polygons
Yes
(Subscriber
Only Content)

29
Table 4 Technological Factor Datasets
Dataset Spatial
Resolution
Temporal
Resolution
Source Data Format Obtained for
Use?
Fuel
Production
Facilities
Global 2019 Esri Living
Atlas
Vector Points Yes
Transportation
Infrastructure
National 2019 Esri Living
Atlas
Vector Lines Yes
USA Airports National Live Esri Living
Atlas
Vector Points Yes
Power Plants Global Live Esri Living
Atlas
Vector Points Yes
NASA Lab
Facilities
National 2018 NASA Vector Points Yes
Top
Engineering
Universities
National 2019 US World
News and
Reports
CSV with
Lat/Long
No
Space Launch
Facilities
National 2019 Astronautix.
com
CSV with
Lat/Long
Yes
Terminal
Radar
Approach
Control
Facilities
(TRACON)
National 2019 FAA.gov CSV No

30
Table 5 Ecological Factor Datasets
Dataset Spatial
Resolution
Temporal
Resolution
Source Data Format Obtained for
Use?
Earthquakes Global Live United States
Geological
Survey
Vector Points Yes
Active
Hurricanes,
Cyclones, and
Typhoons
Global Live Esri Living
Atlas
Vector Points Yes
Air Quality
System (AQS)
Monitors
National Live Environmental
Protection
Agency
Vector Points Yes
Table 6 Legal Factor Datasets
Dataset Spatial
Resolution
Temporal
Resolution
Source Data Format Obtained for
Use?
Corruption
Bribery Cases
Congressional
District
1880-2019 Office of
Congressional
Ethics
(govtrack.us)
RSS Yes
Patents and
Patent Offices
National 2019 United States
Patent and
Trademark
Office
CSV No
US
Courthouses
National 2020 Homeland
Infrastructure
Foundation
Level Data
SHP Yes

31
Table 7 Militaristic Factor Datasets
Dataset Spatial
Resolution
Temporal
Resolution
Source Data Format Obtained for
Use?
Department of
Defense
Boundaries
National Live Esri Living
Atlas
Vector
Polygons
Yes
Military
Installations,
Ranges, and
Training Areas
National 2018 Department of
Defense
Vector Points Yes
ICBM Silos Global 2019 Astronautix
.com
CSV Yes
3.4 Mobile Application Development
The Eye.Earth mobile application development begins in Qt Creator with MyApp.qml and
imports all the modules needed for functionality. The App object that contains the AppFramework size is
created as well as the Page object (which becomes the MainActivity.qml). In addition, three controls—the
float action button (that is being reserved for the GDELT project news feed and real-time analysis
results), the pop-up page, and description page—are added.
Next, within MainActivity.qml, the Item object, property types of the scaleFactor, mapView,
popUps, and LegendInfoListModel are defined. The MapView object contains the critical JavaScript for
properly loading the legend, loading screen, and the signal handler for mouse clicks on the MapView(114
lines of code). Within the Item object but after the MapView Object, the code for the Web Map Click and
Identify(171 lines of code), the Legend Rectangle(132 lines of code), and the PESTELM combo box web
map loader(60 lines of code) are written.
After the MainActivity.qml is running properly, the DescriptionPage.qml,
FloatActionButton.qml, HeaderBar.qml, and PopUpPage.qml can be customized to match the web maps

32
with a darker theme. Within the PopUpPage.qml, the app description with the link to the web version of
the application was added.
Populating the application with data hosted on web maps from ArcGIS Online is the second most
time-consuming task. The biggest issue faced when populating the PESTELM web maps were vector
polygon datasets that completely bogged down the loading times on mobile devices. This was fixed by
uploading the dataset to ArcGIS Pro and then using the polygon to line tool and uploading it to ArcGIS
Online from there. The major benefit of having the web maps separate from the application programming
itself is that the maps and the data on them can be updated without requiring the user to update their
application on their device.
Testing the application on mobile devices has been done through the ArcGIS Player application
on iPhone and Android, which acts as a pseudo app store for developers and Enterprise users. The
ArcGIS Player allows developers to get feedback from family and friends who try using the app and
provide first time user experiences. This invaluable first-time user feedback allows new ideas to be
integrated into subsequent iterations of the application. Below is the flowchart of the mobile application
development.
Figure 7 Flowchart of the Mobile Application Development Process

33
3.5 Web Application Development
This web application development begins with the simple idea of utilizing the PESTELM
analytical framework in a GIS web application. The researcher determined which software to employ,
searched for the datasets, compiled them into ArcMap and ArcGIS Online for configuration, and then
inputted the resulting web map into both the ArcGIS JavaScript API and ArcGIS Web AppBuilder. The
widgets were then configured to add more user interactions and then the app was deployed online to the
public. The URL of the application was then configured to direct towards http://eye.earth and the
application was continually iterated after user feedback. Below is a flowchart for reference to the steps of
the application development.
Figure 8 Flowchart of the Web Application Development Process

34
Chapter 4 Methodology
This chapter discusses the methodology for the real-time analysis and the static analyses. It
begins with the company facility dataset creation (used in both the real-time and static analyses).
4.1 Company Facilities Dataset Creation
This research project is focused on Lockheed Martin’s (LMT) operational and managerial
facilities and building the dataset that contained not only the geographic location of these facilities but
also useful attributes that could be used in an analysis is arguably the most important part of this study.
The first step to create the LMT facilities dataset was to pore over every detail within the
company’s 2018 10-K SEC filing. This provided a base point of where each division within the company
operated, what project’s each division was responsible for, and where their corporate headquarters are
located. Next, Google Maps was used to find the address, longitude, latitude, and phone number (if
available) of each facility. The number of LMT facilities found in the United States total about 240.
Next, Google satellite imagery was used to determine the size of each facility (estimated in
number of employees) by using a remarkably simple technique—counting parking spots. This technique
only works in the United States since most Americans do not use public transportation to get to work and
it is only suitable for studying facilities in countries with very similar transportation systems. According
to the 2013 American Communities Survey, of the 139,786,639 working Americans, 7,000,722 use public
transit to get to work, or 5.01%. Only two places have a public transportation use above 30%—New York
and the District of Columbia. Only one LMT facility is in urban New York and only two in Washington,
D.C., so the overall results of this analysis are not overtly affected by these two outliers.
Finally, Google Maps Street View was used to verify that the facilities were indeed still operated
by Lockheed Martin, the facility type, and the security level of each facility. Google Maps Street View
provides interactive panoramas along almost every street in the United States and is a highly empowering

35
tool for researchers that allows them information that otherwise could only be gained through being in a
location in-person. The Street View technology automatically blurs license plates and faces (for privacy
concerns) but leaves signage untouched and easily legible. Signs bearing the Lockheed Martin name and
logo were the most readily available confirmation signals, and other sources included directories of the
tenants inside of an office building/complex; if a facility could not be confirmed using this method it was
removed from the dataset. The facility type was also determined during this stage and fell into the
categories of warehouse, training, testing range, division or corporate headquarters, research, office,
manufacture, maintenance, medium-size facility, large-size facility, or complex (multiple facilities on a
secure employee campus). However, facility type was deemed too subjective to be used for study; it is
merely an observational attribute to be used as an analysis resource if needed.
The security level was generalized and categorized into three main types: low, medium, or high.
The criteria to determine this level are subjective but based on simple observations and requirements. A
low-security facility has public access to its parking lot, no security fence, and building windows that can
be broken into at ground level; it may be within a building shared by other companies; has, a car can be
rammed into its front door with no resistance; and security camera presence is minimal. A medium-
security facility has no public access to its parking lot, at least a marginally sized security fence, and
building windows that cannot be easily broken into; it may have other companies located within the same
building;; a car cannot be rammed into its front door; and security camera presence is high. A high-
security facility has all the attributes of a medium-level security facility except it contains larger,
sometimes multi-layered, security fences, is located on a military base, and/or is a large complex with a
full-time security guard presence.
The final set of LMT facility attributes that can be gleaned from public information sources is the
jobs performed at each facility. To find this information, a researcher needs to cross-reference locational
information with job postings about the company. Because Lockheed Martin has over 100,000
employees, even a turnover rate of 1% allows a researcher to extrapolate almost every job and location for
every facility in the United States using job finding sites such as glassdoor.com, LinkedIn, Indeed, and

36
the company’s website itself. This attribute is useful for determining which projects a facility may be
working on and help determine an “importance” factor of the facility itself. For this thesis project, this
attribute was only found for a few facilities because the researcher did not think that the time put into this
cross-reference would yield enough benefits for the overall analysis of the company. Below is a flowchart
summarizing the creation of the company facilities dataset creation.
Figure 9 Flowchart of Company Facilities Dataset Creation
4.2 Real-Time Analysis
After the LMT facility dataset was created and the web and mobile applications were developed
containing the PESTELM web map(s), the workflow for the real-time analysis began. Again, the real-
time analysis was developed around a proximity analysis the researcher previously conducted (Straw
2019) and the real-time analysis techniques used in the USC thesis “Precipitation Triggered Landslide
Risk Assessment and Relative Risk Modeling Using Cached and Real-Time Data” (Barnett 2016). The
goal of this real-time analysis is to take a company facility dataset and “intersect” it with real-time
phenomena datasets (e.g., an earthquake, tsunami, hurricane, wildfire, flood, or riot). This “intersection”
reveals in real-time a facility under distress. If this facility is important enough and the projects that the
facility is working on contribute enough to the company’s overall bottom line, then a corresponding
financial analysis discloses how much the valuation of the company itself has changed.
The steps to this process are written assuming the Enterprise edition of ArcGIS is not readily
available for this type of analysis. The first step for an individual or organization without a server is to
create a cloud server. Amazon Web Services (AWS) offers reliable, scalable, and relatively inexpensive

37
cloud computing services and anyone can sign up at aws.amazon.com for a free tier period. After logging
into the AWS console as a root user and under Compute services, click the link for the Elastic Compute
Cloud (EC2) dashboard. The EC2 dashboard allows the root user to change to server farms located in a
variety of regions. Next, clicking the Launch instance button starts a wizard to create your own virtual
server in the cloud. The first step in the wizard is to choose an Amazon Machine Image (AMI) and in the
search window, type “Esri ArcGIS Enterprise,” select AWS Marketplace tab, and select the latest version
of ArcGIS Enterprise. Next, the instance type needs to meet the minimum system requirements needed to
run ArcGIS Enterprise. From here the instance can now be launched or other settings can be customized
(instance details, add storage, add tags, and configure security group). Next, a key pair needs to be
selected or created which allows you to connect to your instance securely and for Windows AMIs it is
required. To connect to the virtual machine from a Windows desktop, type “mstsc” in the console or
search for “remote desktop connection” in the Windows search bar. Type in your credentials and you can
now use the ArcGIS Enterprise suite. To establish an ArcServer, follow the similar steps but instead use
an ArcServer AMI. From here, an Esri license is required and it is here where the author stopped because
access to the USC ArcServer and database connection was already bought and paid for.
From within the remote desktop connection, open ArcMap and start a new blank map. Connect to
the GIS server located in the catalog pane by entering the requisite credentials. Next, establish a database
connection using the database connection wizard located by searching for geoprocessing tools. Then in a
similar fashion, create a user for the database connection by searching for the wizard in geoprocessing
tools as well. Link the server and the database and make the user database the default geodatabase and
now everything is ready to add data to the map. The datasets that are analyzed need to be saved in the
database (so that the data is referenced rather than copied and data updates are supported), and models
should be saved in the database as well (under the toolbox category). If any problems occur, files are
likely not pointing to a geodatabase already registered on the ArcServer.
With the database, server, and datasets set up, a new ModelBuilder model can be created. Add the
company facility dataset (after using the “Make XY Event Layer” tool on it if it is not already a vector

38
point shapefile) to the model and the dataset you wish to intersect it with. Two tools are needed to
transform the company facilities into a usable layer for analysis. The first is the Make Feature Layer tool
and it creates a feature layer from an input feature class or layer file. Next add the Buffer tool and connect
it to the output feature layer; this creates a polygon around the point that may or may not be needed
depending on the dataset being intersected with. To make the buffer optional, right click the tool and
select Make Variable > From Parameter > Distance (and set the units into kilometers).
With the company dataset ready to be intersected with, add the study dataset, run it through
another Make Feature Layer tool, then the Select tool (to select a subsection of the dataset if it is really
large). With the output of both geoprocessed datasets, input them into the Intersect tool. Double-check the
save paths of all the facility and intersecting dataset, the intermediary model outputs, and the final
Intersected output to make sure it is saved to the user database connection. Run the ModelBuilder model
from the catalog (not from within ModelBuilder), and when it succeeds, add the output vector dataset to
the map to make sure that the intersection between the datasets is expected.
From within the results pane, expand the current session Results, and right click the
ModelBuilder tool that was just successfully run. Click Share As > Geoprocessing Service and this opens
the Share as Service wizard. Click Publish a service, Next >, choose the GIS server connection that was
added previously, and give the service a descriptive name, Next >, on the Publish service to folder page
use an existing folder or create a new folder, and click Continue and the Service Editor window opens.
Within the Service Editor, make sure everything is named correctly under General and the “start services
immediately” box is checked. Under the Capabilities tab make sure that the Geoprocessing tab is checked
and the WPS box (WPS stands for Web Processing Service and WPS is useful for making geoprocessing
services available across many platforms and clients). On the Geoprocessing tab, check the Uploads box
to make that an allowable operation. Under the Parameters tab, make sure the Execution Mode is
Asynchronous and that the “View results with a map service” is checked. During development, change
the Message Level to Info, and for deployment, make sure it is on None (this will greatly help in
debugging during later steps). On the Pooling tab, extend the maximum time a client will wait to get a

39
service in case the dataset being processed is extremely large. Next, add metadata to the model, item
description, and instructions for the model’s parameters. For the facility dataset and the intersected
dataset, change the Input mode from Choice list to User Defined Value. On the Sharing tab, click Share
the service with: MyContent (or sign into ArcGIS Online if not already). Click Analyze at the top right of
the Service Editor and ensure no error messages appear. Finally, click Publish and the geoprocessing
service is awaiting itself on the ArcServer.
Navigating to ArcGIS Online, the final steps to set up a real-time analysis are undertaken. First,
create a web map that contains the company facility dataset and other datasets that are to be intersected
with it. Save the Map, and from the Content page, click the Create button and select Web AppBuilder
from the Create Apps column (as of July 2020, the Experience Builder did not yet support geoprocessing
widgets). Set the app theme, style, and layout to anything desired, and from the Map tab, choose the web
map that contains the facility and intersecting datasets. On the Widget tab, click the geoprocessing widget
and set the GP task either by copying/pasting the Geoprocessing REST Service URL from the ArcGIS
REST Services Directory or by selecting the service from My Content in ArcGIS Online (both methods
work equally well). Next, configure the settings of the geoprocessing widget starting with the Inputs and
ensure that the option to “Select a layer from the map” is checked and that under Options “View result
with a map service” is checked. Name the widget to its intended goal and click OK. Real-time analysis on
real-time datasets is now possible.
Test the geoprocessing widget, input the datasets to analyze, and read the info messages that
appear during processing. If any errors occur, an information box will supply an associated error code that
is invaluable for debugging. If the geoprocessing service widget is run successfully, the message “The
result is drawn on the map” will appear. After development and before releasing to the public, navigate to
ArcGIS Server Manager, click on the service that was just run, select the Parameters tab, and change the
Message level from Info to None (keeping this on allows sensitive server information to leak).
Additional analysis can be done if desired; the data output can be moved to another model and the
entire process can be updated to provide daily reports for financial analysis. The possibilities are endless.

40
While other methods to achieve these same goals are possible, such as within JavaScript alone, this is the
method that requires the least amount of technical expertise to implement. In the case of this thesis
project, the real-time datasets that can be used with this method are USGS Earthquakes and NOAA
Hurricanes; however, this process can easily be replicated as more real-time datasets are available. Below
is a flowchart illustrating the steps described above.
Figure 10 Flowchart of the Real-Time Proximity Analysis Workflow: Data Utilized, Analysis, and Output
4.3 Static Analyses
This section discusses four categories of static analysis: the equity asset valuation process (steps 3
and 4), the literature review risk analysis (which was detailed in chapter 2, “Background”), static and
historical PESTELM dataset proximity analysis, and the DEMATEL, Expert-Interview, and ANP
analysis (which details a way to quantify PESTELM factor interdependencies).
4.3.1. The Equity Asset Valuation Process, Steps 3 and 4
Step 3 of the equity asset valuation process is selecting an appropriate valuation model, and the
methodology for the sum-of-the-parts (SOTP) valuation model determined in chapter 2, “Background,”
deemed to be most appropriate is explained.

41
Figure 11 The Equity Asset Valuation Process, Steps 3 and 4
4.3.1.1. Selecting Appropriate Valuation Models: Sum-of-the-parts (SOTP) Valuation
As a mentioned earlier, the SOTP valuation aggregates the values of the company’s various
divisions, values them separately, and adds them together to arrive at a total enterprise valuation. This
valuation technique has been chosen for this study because a detailed breakdown of each division’s
contributions to earnings would allow for a sensitivity analysis of cash flow growth disruptions. For
example, how would losing operational capabilities at the F-35 Fort Worth plant for weeks or months
affect overall company value? This question can be answered by combining the outputs from the real-
time proximity analysis with the SOTP valuation model. The formula for the sum-of-the-parts valuation
is:
SOTP = N1 + N2 + … + ND - NL + NA
where:
N1 = Value of the first segment
N2 = Value of the second segment
ND = Net Debt
NL = Non-operating Liabilities
NA = Non-operating assets
In the case of Lockheed Martin Corporation, the company operates in four different business
segments: aeronautics, missiles and fire control (MFC), rotary and mission systems (RMS), and space.
From Lockheed Martin’s 2018 10-K SEC filing, the net sales and operating profit of each business
segment from 2016 to 2018 are broken down below.

42
Table 8 Summary Operating Results for Lockheed Martin’s Business Segments (in millions)
The value of each business segment is derived separately from this financial statement and can be
determined by absolute, relative, or other valuation methods. Within the SOTP valuation model, an
absolute valuation method, the Discounted Cash Flow (DCF) method, was chosen to value the company’s
individual segments. The DCF method estimates value based on its future cash flows and outputs an
intrinsic value that can be compared with the current market value of the stock. This method requires two
assumptions: a growth rate and discount rate. The growth rate has been determined by comparing the cash
flow growth rate between the company’s segments over the last five years. The discount rate assumption
should be at least the long-term average return of the stock market (about 11%), because investors can
invest in the passive total stock market index instead of individual companies. The formula for DCF is:
DCF = CF1/(1+r)1 + CF2/(1+r)2 + CFn/(1+r)n
where:
CF = the cash flow for a given year. CF1 is for year one, CF2 is for year two
r = the discount rate
43
This model begins with the current year and uses information for current earnings per share as
linked model variables. To facilitate a sensitivity analysis and changes to input variables, a Lockheed
Martin Corporation Discount Cash Flow Live Calculator was built and will be discussed in the next
section.
4.3.1.2. Converting Forecasts to a Valuation
Converting forecasts to a valuation requires more than inputting forecast amounts to a model to
obtain an estimate of the value of a company’s segments. Two key aspects of converting forecasts to a
valuation are sensitivity analysis and situational adjustments. A sensitivity analysis determines how
changes in an assumed input affect the output. Situational adjustments may be required to assess the
valuation impact of certain issues (e.g., control premiums, marketability discounts or lack thereof, and
illiquidity discounts). Situational adjustments are beyond the scope of this thesis project, and sensitivity
analysis is the method used to convert the business segment forecast into a valuation. An example of a
sensitivity analysis in proactive is assessing the impact of different revenue growth rates affecting a
company’s valuation.
To complete a sensitivity analysis, a DCF calculator was built within Google Sheets LMT DCF
valuation method (link to the Google Sheets Calculator); it uses the GOOGLEFINANCE() function to
incorporate live stock data into the SOTP and DCF sensitivity analysis. The results of this analysis and
the utilization of this calculator are discussed in chapter 5, “Results.” This DCF calculator is shown in the
figure below, its looks are based on functionality.
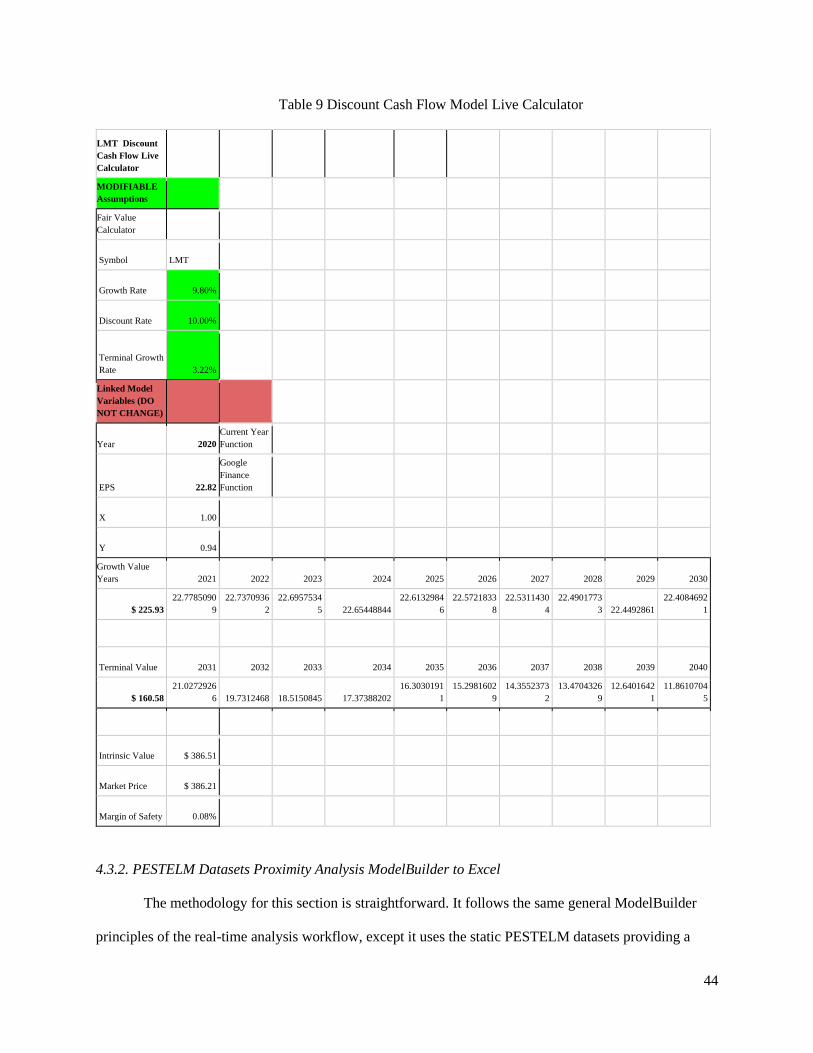
44
Table 9 Discount Cash Flow Model Live Calculator
LMT Discount
Cash Flow Live
Calculator
MODIFIABLE
Assumptions
Fair Value
Calculator
Symbol LMT
Growth Rate 9.80%
Discount Rate 10.00%
Terminal Growth
Rate 3.22%
Linked Model
Variables (DO
NOT CHANGE)
Year 2020
Current Year
Function
EPS 22.82
Finance
Function
X 1.00
Y 0.94
Growth Value
Years 2021 2022 2023 2024 2025 2026 2027 2028 2029 2030
$ 225.93
22.7785090
9
22.7370936
2
22.6957534
5 22.65448844
22.6132984
6
22.5721833
8
22.5311430
4
22.4901773
3 22.4492861
22.4084692
1
Terminal Value 2031 2032 2033 2034 2035 2036 2037 2038 2039 2040
$ 160.58
21.0272926
6 19.7312468 18.5150845 17.37388202
16.3030191
1
15.2981602
9
14.3552373
2
13.4704326
9
12.6401642
1
11.8610704
5
Intrinsic Value $ 386.51
Market Price $ 386.21
Margin of Safety 0.08%
4.3.2. PESTELM Datasets Proximity Analysis ModelBuilder to Excel
The methodology for this section is straightforward. It follows the same general ModelBuilder
principles of the real-time analysis workflow, except it uses the static PESTELM datasets providing a
45
snapshot of the company at a particular point in time. Eventually, the outputs presented here would be
automated to become part of the real-time analysis. This static analysis is presented to communicate the
patterns that emerge from intersecting a company facility dataset with study PESTELM datasets and to
back test the valuation model with historical datasets.
There are a few general guidelines when analyzing vector datasets. The first is that when
intersecting two vector point datasets, one of the datasets needs a polygon buffer around it to make the
intersection viable. This buffer should always have a parameter distance to allow the researcher to change
it depending on the goals of the analysis. The second guideline is that when intersecting a vector point
dataset with a vector polygon dataset, the intersection can be direct. The third guideline is that when one
of the study datasets is extremely large and needs to be focused, selecting a subsection attribute before the
intersection is highly advisable. Below is the general ModelBuilder model for a point to point intersection
and for a point to polygon intersection. The ModelBuilder models used to complete this analysis are in
appendix B at the end of this document.
Once the intersected data output is confirmed viable within the GIS, it is exported to Excel for
additional pattern analysis using the Table to Excel tool. When the intersected dataset is opened in Excel,
attributes of interest are listed and turned into charts and graphs for additional insights. While these charts
can be made within a GIS, a spreadsheet suite has a greater degree of user-friendliness and provides the
same information.
4.3.3. Literature Review Risk Analysis
This method is a comprehensive analysis of the United States aerospace and defense industry
through the PESTEL framework determined by reviewing the most up-to-date literature. Much of the
research required to complete this analysis has been completed in chapter 2, “Background.” Conclusions
drawn from this analysis are presented in chapter 5, “Results.”
46
4.3.4. The Decision-Making Trial and Evaluation Laboratory (DEMATEL), Expert-Interview, and
Analytic Network Process (ANP) PESTELM Analysis
This analysis is not a part of this thesis project but bears mentioning because, if this spatial
financial analysis were conducted internally with Lockheed Martin, executives as active participants, then
new insights into PESTELM factors can be made. First, an expert advisory team consisting of top-level
managers of Lockheed Martin or another chosen firm(s) needs to be recruited. Next, a hierarchical
structure of the PESTELM model by identifying PESTELM sub-factors that are most relevant towards
the firm is formed. Following this, the sub-factor interdependencies are determined by DEMATEL, the
weights of the interdependent sub-factors are calculated by Analytic Network Process (ANP) and
Analytic Hierarchy Process (AHP), and then the results of the macro environmental PESTEL values are
mapped for data visualization. The major GIS techniques that will be utilized include sensitivity analysis,
network analysis, and overlay.
Once the expert team has been formed and the relevant PESTELM factors identified, the
PESTELM factor dependencies are evaluated using the Decision-Making Trial and Evaluation Laboratory
(DEMATEL). DEMATEL identifies the cause-and-effect chain in a complex system. It evaluates factor
relational interdependencies and visualizes them through a structural model. This procedure is based on
the DEMATEL method used by Tzeng (2007) and Wu and Lee (2007). The procedure for DEMATEL is
as follows: compute the average matrix, calculate the normalized initial direct-relation matrix, calculate
the total relation matrix, and then set a threshold to obtain the digraph. The average matrix is calculated
by the following equation, where Xij = degree to which respondent thinks factor i directly influences
factor j, k = the number of respondents, H = the number of matrices, and Aij = (A) average matrix.
The initial direct-relation matrix (D) is normalized by D=AxS, where S is calculated from:
47
The total relation matrix (T) is calculated by T=D(I-D)-1, where I is the identity matrix. Next, a threshold
value needs to be set by the decision maker to filter out unimportant effects and visualize the digraph by
mapping the dataset of (r+c and r–c), where r = the sum of the i row in matrix T and c = the sum of the j
column in matrix T. If (r–c) is positive, the sub-factor is a “cause” component, and if (r–c) is negative,
then the sub-factor is an “effect” component.
The next step is calculating the weights of the PESTEL sub-factors by the AHP and the ANP.
AHP is a way to measure two sub-factors by relying on expert judgement to calculate priority scales.
ANP uses a “super matrix” to calculate the weights of the interrelationships between sub-factors. The
steps to calculate the weights through AHP/ANP processes are as follows: decision makers evaluate all
criteria pairwise by answering questions such as Which criteria should be emphasized more in a macro
environment? which should be posed to the expert team, and then the responses should be evaluated using
Saaty’s 1–9 scale (Saaty 2001). The sub-factors are evaluated using pairwise comparisons, such as Which
sub-factor will influence sub-factor 1 more: sub-factor 2 or 3; and by how much? A unique pairwise
matrix is formed for each of the sub-factors, and then the weights of the sub-factors are calculated by
synthesizing the previous results. The total level of sub-factors is calculated by multiplying the weights
by a scale of acceptability also determined by the expert team. The total macro environment for the firm
is characterized by the sum of the level of each sub-factor and these results determine how favorable the
environment is to the firm.
The PESTEL sub-factors with the calculated attributes of weights, and sub-factor levels may now
be imported into a GIS and visualized on the web and mobile GIS application. Again, this method is
being presented to the reader as an alternative and/or complementary method for a PESTELM analysis.
The focus of this thesis is more on the application development and real-time analysis procedures rather
than the quantification of the PESTELM factor independencies.
48
Chapter 5 Results
This chapter presents the results of this thesis project beginning with the application development
results of both the web and mobile application, the results of the real-time analysis process, the results of
the various static analyses: step five of the equity asset valuation process (applying valuation
conclusions), the PESTELM datasets proximity analysis Excel charts and graphs, and the literature
review risk analysis.
5.1 Application Development Results
5.1.1. Web Version
The web version of Eye.Earth Pro is accessible via the following URL as of August 2020:
http://eye.earth/ (URL for public consumption). Eventually, later iterations of this web application will be
located at the URL:
https://eye.earth/pro/sector/industrial/industry/aerospace&defense/company/LockheedMartin.
When entering the URL link to the web application, users are foremost presented with a large
map of various lines and dots in and around the United States. This web map is presented on a greyscale
base map with black oceans and light grey labels. The color scheme of the lines and dots matches the
PESTELM widgets in the bottom portion of the web page. Users can either refer to the legend on the left
for more information about the feature on the main map, read the widgets at the bottom, or click on the
features themselves for an associated informational pop-up to appear. Layers can be turned on/off by
selecting the PESTELM layers widget located in the same group as the legend. The legend only shows the
layers that appear at certain extents, and when a user zooms into the map more features appear. If a user
chooses, they can search any location in the search bar in the upper right corner of the web page to see
PESTELM features located near the specified location.
The PESTELM widgets at the bottom have options to change to alternative views if more than
one dataset is in each PESTELM category and if there is an associated geoprocessing widget to analyze a

49
real-time dataset. In this case, only the Ecological component has constantly updated datasets. The
political, economic, sociocultural, and technological datasets are live but are updated only periodically
(ranging from every few weeks to annually). The legal and militaristic datasets are static and need to be
updated manually within the underlying web map.
Figure 12 Screenshot of Lockheed Martin Eye.Earth Pro Web Application
An additional view of this web application can be accessed through the web browser on a mobile
or tablet device. The great thing about getting this mobile version is that it can also perform real-time
analysis using the geoprocessing widget. There are a few noticeable differences between viewing the
application from a desktop and from a mobile device. First, all the application’s widgets need to be
flipped through like pages instead of all being visible at once. The order that they appear is the same order
as they are listed in the Web AppBuilder editing page. An additional feature is the swipe down option
where a user can make the entire widget page disappear with a flick. It operates the same way as the web
version besides those quality of life improvements.

50
Figure 13 Screenshot of Eye.Earth Pro Web Version Viewed on Mobile Browser
5.1.2. Mobile Application
The mobile application was developed in Qt Creator for ArcGIS using the JavaScript language. It
can be compiled and uploaded to both the Google Play Store and Apple Store as a downloadable
application. The mobile application version was not able to be included in the geoprocessing service
widget process and is thus unable to perform real-time analysis. It is, however, given more flexibility with
symbolizing features and hosting datasets because each PESTELM dataset is attached to an individual
web map rather than having one web map for every PESTELM dataset.
After opening the Eye.Earth Mobile application, users are confronted with a map front and center,
a combo box in the upper left that contains all of the PESTELM analytical framework components, a
legend to see what layers the map contains, and the application title above with an info button to learn

51
how the app works. Below are screenshots of each PESTELM component taken on an iPhone X through
the AppStudio Player app.
Figure 14 Political Component on Mobile Application
Figure 15 Economic Component on Mobile Application
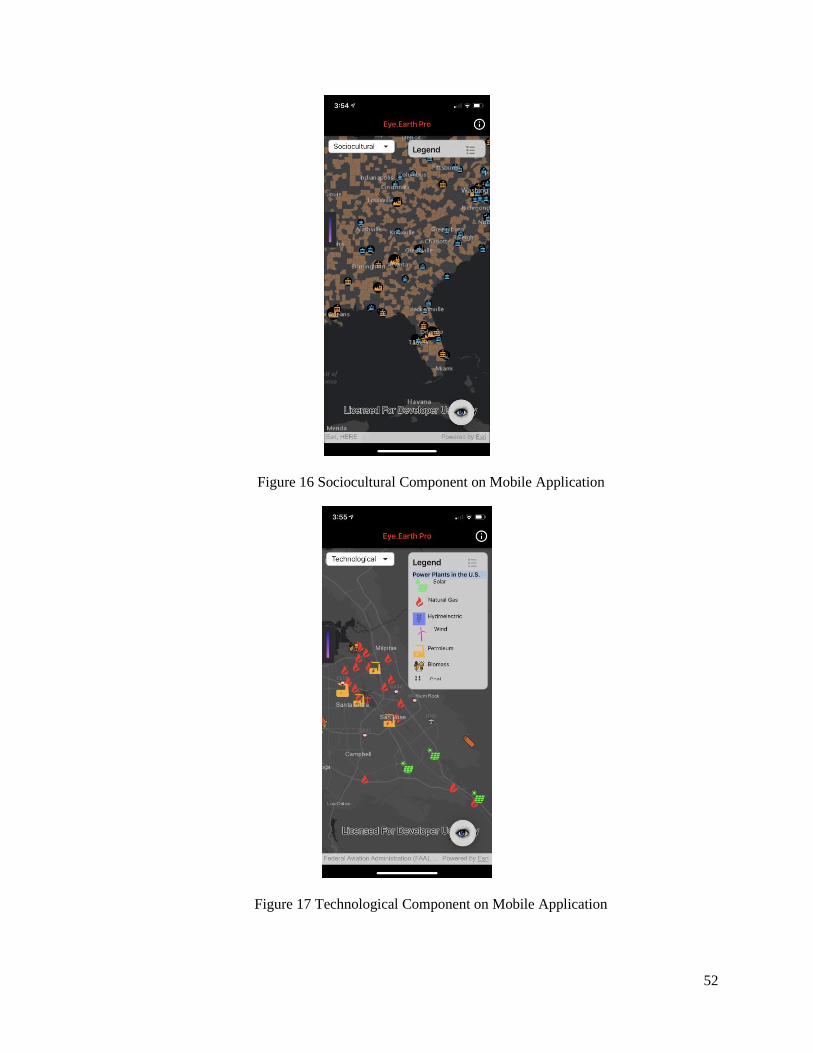
52
Figure 16 Sociocultural Component on Mobile Application
Figure 17 Technological Component on Mobile Application

53
Figure 18 Ecological Component on Mobile Application
Figure 19 Legal Component on Mobile Application
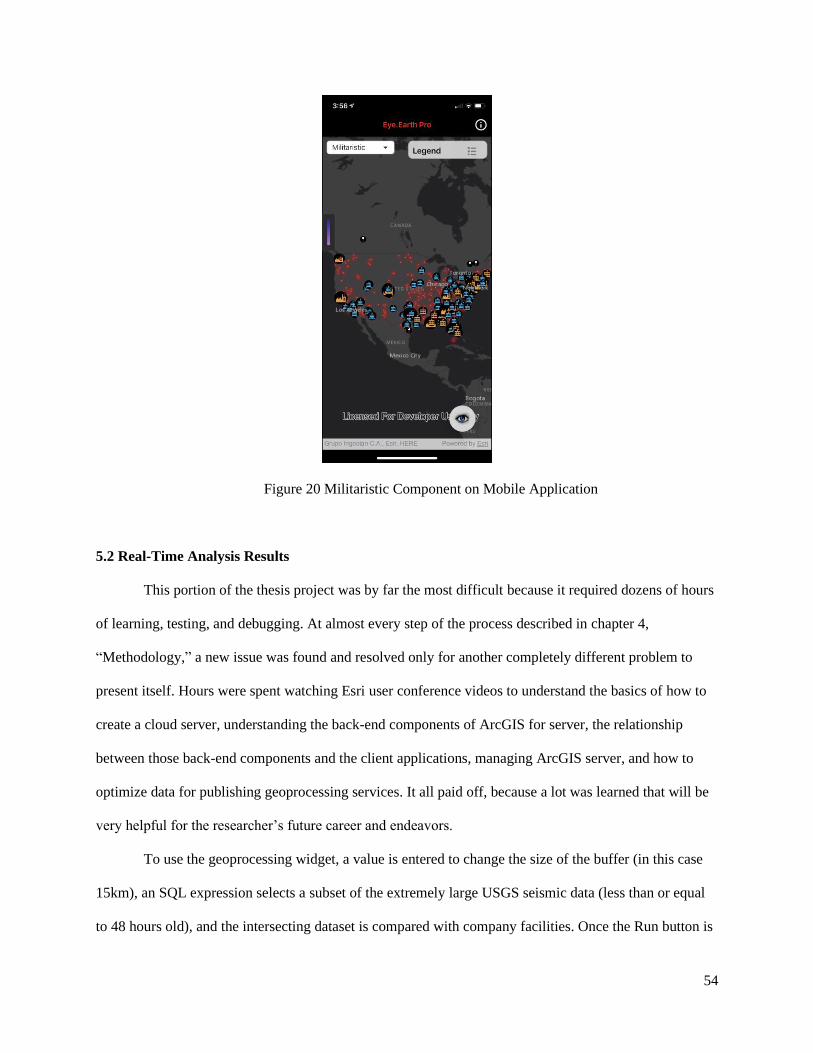
54
Figure 20 Militaristic Component on Mobile Application
5.2 Real-Time Analysis Results
This portion of the thesis project was by far the most difficult because it required dozens of hours
of learning, testing, and debugging. At almost every step of the process described in chapter 4,
“Methodology,” a new issue was found and resolved only for another completely different problem to
present itself. Hours were spent watching Esri user conference videos to understand the basics of how to
create a cloud server, understanding the back-end components of ArcGIS for server, the relationship
between those back-end components and the client applications, managing ArcGIS server, and how to
optimize data for publishing geoprocessing services. It all paid off, because a lot was learned that will be
very helpful for the researcher’s future career and endeavors.
To use the geoprocessing widget, a value is entered to change the size of the buffer (in this case
15km), an SQL expression selects a subset of the extremely large USGS seismic data (less than or equal
to 48 hours old), and the intersecting dataset is compared with company facilities. Once the Run button is

55
clicked, the geoprocessing widget executes and debugging information appears while it is executing. This
process takes about 4–6 minutes and at the end it says “Success” and “The result is drawn on the map.” A
resulting map service is created from the geoprocessing service; this map service is dynamic and supports
map service operations (export map, identify, find, generate KML) and child resources (Layer/Table,
Legend, and KML image). In the end, one final bug presented itself that was unable to be resolved within
the time frame specified for this research: The map service failed to be added to the web application and
is not visible from the application itself (only by going to the ArcGIS Server Manager can the Map
Service be viewed). Possible solutions to this problem are addressed in chapter 6, “Discussion.”
Figure 21 Screenshots of Geoprocessing Widget during Input, Execution, and Output
5.3 Static Analysis Results
5.3.1. The Equity Asset Valuation Process Step 5: Applying Valuation Conclusions
Figure 22 The Equity Asset Valuation Process, Step 5
Applying valuation conclusions is heavily dependent on the purpose the valuation was conducted.
The sum-of -the-parts (SOTP) and Discounted Cash Flow (DCF) valuation was conducted in tandem with
the spatial analysis for the purpose of discovering a method of using spatial analysis dataset intersection

56
outputs as valuation model inputs. The SOTP valuation model values each of a company’s business
segments separately and adds them together to arrive at a valuation, and the DCF technique was used to
determine the contribution of each business segment to the stock’s intrinsic value. The spatial analysis
outputs are the intersections between the company’s facilities and PESTELM datasets.
For this instance, the intersection between LMT facilities and historical earthquakes was deemed
most appropriate for use as an input into the valuation model(s). Discussed in further detail in section
5.3.2(e), the historical earthquake static spatial analysis revealed that Lockheed Martin’s facilities in
Sunnyvale, California, are most at risk for future seismic events. These facilities belong to the space
segment and its projects include the Trident Ballistic Missile and GPS III programs. The space segment
accounts for 18% of LMT’s operating profit and just less than half of the company’s operating income
growth (adjusted for segments relative contribution). If a major earthquake disrupted these facilities
permanently, then company growth rates would fall about 3% and its intrinsic value per share would fall
to $263.13 from $338.16.
To be clear, this is a simplified valuation model that relies on modifiable assumptions and is not
considered to be a fact, rather an opinion of the author. There are many risks investing in stocks and using
the above method does not guarantee a return on investment, nor is the author liable for any monetary loss
from using this method. Additionally, the author has a long position in Lockheed Martin Corporation and
the potential for a conflict of interest needs to be disclosed (although these research results are not
intentionally favoring a long or short position in LMT).
5.3.2. PESTELM Datasets Proximity Analysis Excel Charts and Graphs
The measures presented in the following subsections explain how the types, sizes, and numbers of
Lockheed Martin facilities are spatially linked to PESTELM datasets. The PESTELM datasets, in some
situations, affect the distribution of facilities for various reasons. For example, the political congressional
districts dataset shows that there are more Lockheed Martin facilities in democrat-controlled districts than
in republican ones at a ratio greater than if the facilities were randomly distributed amongst districts.

57
Within the economic dataset, a certain city was found to be highly reliant upon Lockheed Martin for
employment, and GDP in the region. The sociocultural demographic dataset shows that certain races are
more prevalent at location’s where larger or smaller facilities reside. The technological datasets displayed
expected correlations between airports and facilities but a surprising relationship in power plants whereby
there were many more renewable energies sources proximal to facilities relative to the actual total. The
ecological dataset shows that the Lockheed Martin’s facilities that are responsible for its core cash flow
are well insulated from major historical earthquake hotspots. The legal dataset shows that many legal
battles that Lockheed Martin is involved in likely take place in California and D.C. The militaristic
dataset shows that the Navy and Air Force dominate Lockheed Martin’s operational outlook.
This framework organizes thoughts about an industry and helps better understand a company’s
prospects for success. The results for the PESTELM datasets proximity analysis to Lockheed Martin
facilities are shown below in Excel chart format and a description of the characteristics, patterns, and
outliers of note accompany the charts (the results are presented in the PESTELM acronym order).
5.3.2.1. LMT Political Analysis Results
Figure 23 shows Lockheed Martin facilities grouped by facility size to congressional districts.
LMT facilities are by a majority within Democrat-controlled congressional districts. Two outliers of note
are shown: first, the largest facilities (with over 1000 employees) are in Democrat-controlled districts, and
second, the smallest facilities (with between 10 and 100 employees).

58
Figure 23 LMT Political Analysis Results: Facility Size to Congressional Districts
The second political chart shows Lockheed Martin facilities grouped by division in congressional
districts. This chart shows many facilities in the aeronautics and the missiles and fire control (MFC)
divisions located within Republican congressional districts. Rotary and mission systems (RMS) and the
space division’s facilities are located within Democrat-controlled districts. Aeronautics and RMS show
large margins compared with MFC and space, which are close.

59
Figure 24 LMT Political Analysis Results: Facility Division to Congressional Districts
This pie chart takes all the LMT facilities into consideration and illustrates which party-controlled
congressional district they fall into. LMT facilities reside almost 60% of the time in Democrat districts
and 40% of the time in Republican districts.

60
Figure 25 LMT Political Analysis Results: Facilities in Congressional District by Party
5.3.2.2. LMT Economic Analysis Results
Figure 26 compares LMT facilities separated by size to the 2015 real GDP sources (goods,
services, and government) to the county in which those facilities are located. Many of the facilities are in
counties where the predominant source of GDP is services (not surprising given that the United States is a
service economy); however, two outliers of note are visible in the 400 and 225 facility size. The county
responsible for the 400-facility size anomaly is Calhoun County, Arkansas. Calhoun has a population of
just 5,234 persons, and Lockheed Martin singlehandedly employs about 10% of the population. These
facilities belong to the missiles and fire control (MFC) division, and the products produced at these
facilities are the likely source of the county’s higher than average percentage of GDP from the goods
source. The other outlier on the chart is in the 225-facility size category, and further investigation shows
that four small office facilities located in St. Mary’s County, Maryland, are responsible. This county is
proximal to Washington, D.C., and thus has a concentration of federal employees (which explains the
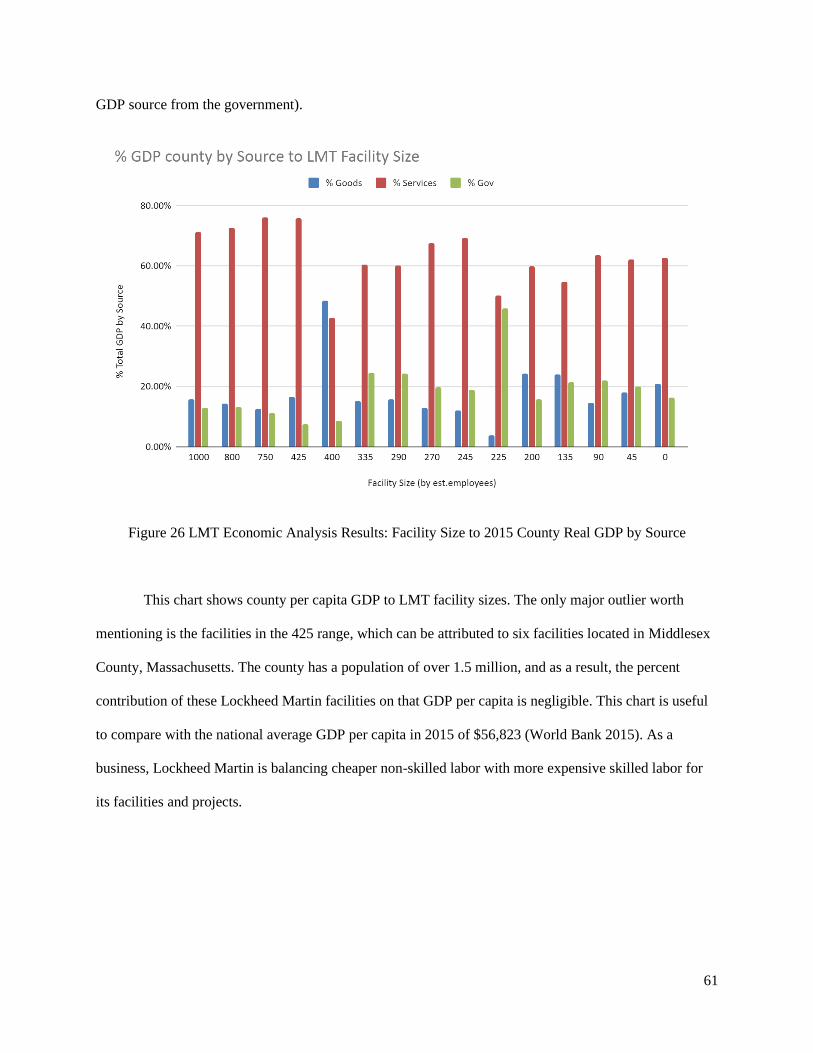
61
GDP source from the government).
Figure 26 LMT Economic Analysis Results: Facility Size to 2015 County Real GDP by Source
This chart shows county per capita GDP to LMT facility sizes. The only major outlier worth
mentioning is the facilities in the 425 range, which can be attributed to six facilities located in Middlesex
County, Massachusetts. The county has a population of over 1.5 million, and as a result, the percent
contribution of these Lockheed Martin facilities on that GDP per capita is negligible. This chart is useful
to compare with the national average GDP per capita in 2015 of $56,823 (World Bank 2015). As a
business, Lockheed Martin is balancing cheaper non-skilled labor with more expensive skilled labor for
its facilities and projects.

62
Figure 27 LMT Economic Analysis Results: Facility Size to 2015 County Real GDP per Capita by Source
5.3.2.3. LMT Sociocultural Analysis Results
Figure 28 compares LMT facility size to the average county population partitioned by
generations. Generational differences by county are consistent across all LMT facility sizes.

63
Figure 28 LMT Sociocultural Analysis Results: Facility Size to County Population by Generation
Figure 29 shows facility sizes to male and female populations in those counties. The only
pattern of note is that females have a higher population in every instance, and this is likely
because of the longevity of the female population.
Figure 29 LMT Sociocultural Analysis Results: Facility Size to Average Male/Female Populations

64
Figure 30 compares facility sizes to populations in the counties by race. In every instance, the
white (non-Hispanic) population is the majority. In the 1000, 300, and 100 categories, the Hispanic
population is a relatively close second. Only within the 100 category is the black population close with
the white and Hispanic populations. The counties which make up the 100 category are in Texas, Florida,
Virginia, New Jersey, Iowa, Georgia, and Alabama. Within the 1000 category, Los Angeles County and
Santa Clara County in California are largely responsible for the Asian population.
Figure 30 LMT Sociocultural Analysis Results: Facility Size to Average Population by Race
5.3.2.4. LMT Technological Analysis Results
Figure 31 shows overall LMT facilities to airport infrastructure by type. These types are separated
into large airports (with over 1,000,000 annual passengers), airports with 100,000–999,999 annual
passengers, airports with less than 100,000 passengers, airports with unknown passengers, heliports, and

65
seaplane bases. By far the largest airport infrastructure within 5km of LMT facilities are heliports,
followed by small and unknown airports.
Figure 31 LMT Technological Analysis Results: LMT Facilities to Airport Infrastructure by Type
This chart shows the LMT divisions to airport infrastructure. As shown above, heliports are a
large majority of the airport infrastructure, so it should come as no surprise that the rotary and mission
systems (RMS) division has the highest count of proximal airport infrastructure. As a reminder, RMS’s
major programs include the Black Hawk, Seahawk, CH-53k, VH-92A, and the Sikorsky Aircraft
subsidiary.

66
Figure 32 LMT Technological Analysis Results: LMT Divisions to Airport Infrastructure
Figure 33 shows the number of intersecting LMT facilities to airport infrastructure by state.
California, Texas, and Florida lead this chart with about 50, 40, and 35 counts of airport infrastructure
nearby LMT facilities, respectively.

67
Figure 33 LMT Technological Analysis Results: LMT Facilities to Airport Infrastructure by State
Figure 34 shows the other technological dataset used in this study: power plants by source. It
shows that natural gas and solar are by far the proximal power plants to LMT facilities. This is not
indicative of exactly what provides electricity to the respective facilities, because certain power plant
types are distant from populations on purpose. According to the US Energy Information Administration
(EIA), the 2019 US electricity generation by energy source is: natural gas (38.4%), coal (23.5%), nuclear
(19.7%), hydroelectric (6.6%), wind (7.3%), biomass (1.4%), solar (1.8%), and other (.3%) (Energy
Information Administration 2020). Additional investigation shows that Lockheed Martin owns two solar
power plants and two battery plants. Solar has an extremely high relative count likely because of its
reliability as a backup power source for important LMT facilities.

68
Figure 34 LMT Technological Analysis Results: LMT Facilities to Power Plants by Source
5.3.2.5. LMT Ecological Analysis Results
Figure 35 below shows LMT facilities that have intersected with historical major earthquakes
(from 1668 to 2014). A historical analysis is done for this section because the earthquake dataset used in
the Eye.Earth Pro application is live and not suitable for the static analysis section of this report. The
historical static analysis provides information on LMT facility locations that have been hit by major
historical earthquakes from 1 to 26 times in the last 346 years. The buffer for this intersecting dataset was
set at 100km because according to the USGS “6.1 magnitude earthquakes can be destructive in areas up to
100km across where people live” (USGS 2020).
Twelve LMT facility locations have been within the destructive range of major earthquakes
between 7 and 26 times, and every single one is in California. Among these 12 facilities, five are
considered important based on facility size and the projects underway at the facilities. 1111 Lockheed
Martin Way, Sunnyvale (21 major earthquakes) has over 1000 employees and is responsible for the
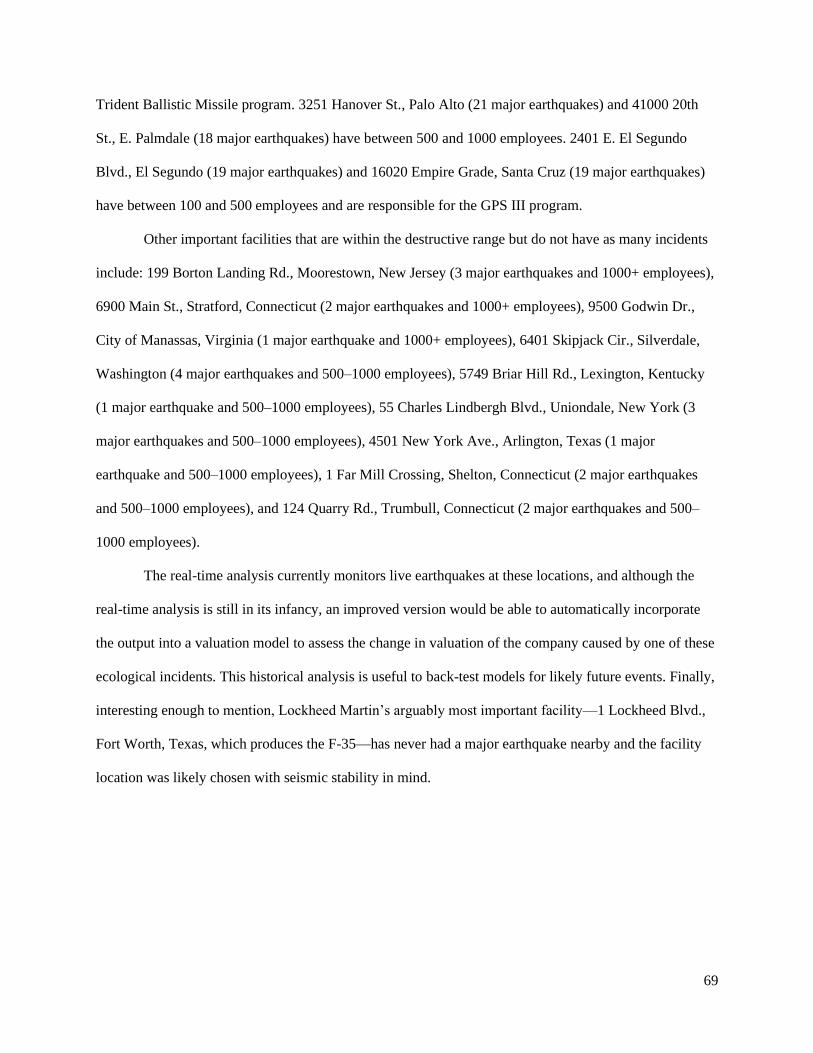
69
Trident Ballistic Missile program. 3251 Hanover St., Palo Alto (21 major earthquakes) and 41000 20th
St., E. Palmdale (18 major earthquakes) have between 500 and 1000 employees. 2401 E. El Segundo
Blvd., El Segundo (19 major earthquakes) and 16020 Empire Grade, Santa Cruz (19 major earthquakes)
have between 100 and 500 employees and are responsible for the GPS III program.
Other important facilities that are within the destructive range but do not have as many incidents
include: 199 Borton Landing Rd., Moorestown, New Jersey (3 major earthquakes and 1000+ employees),
6900 Main St., Stratford, Connecticut (2 major earthquakes and 1000+ employees), 9500 Godwin Dr.,
City of Manassas, Virginia (1 major earthquake and 1000+ employees), 6401 Skipjack Cir., Silverdale,
Washington (4 major earthquakes and 500–1000 employees), 5749 Briar Hill Rd., Lexington, Kentucky
(1 major earthquake and 500–1000 employees), 55 Charles Lindbergh Blvd., Uniondale, New York (3
major earthquakes and 500–1000 employees), 4501 New York Ave., Arlington, Texas (1 major
earthquake and 500–1000 employees), 1 Far Mill Crossing, Shelton, Connecticut (2 major earthquakes
and 500–1000 employees), and 124 Quarry Rd., Trumbull, Connecticut (2 major earthquakes and 500–
1000 employees).
The real-time analysis currently monitors live earthquakes at these locations, and although the
real-time analysis is still in its infancy, an improved version would be able to automatically incorporate
the output into a valuation model to assess the change in valuation of the company caused by one of these
ecological incidents. This historical analysis is useful to back-test models for likely future events. Finally,
interesting enough to mention, Lockheed Martin’s arguably most important facility—1 Lockheed Blvd.,
Fort Worth, Texas, which produces the F-35—has never had a major earthquake nearby and the facility
location was likely chosen with seismic stability in mind.

70
Figure 35 LMT Ecological Analysis Results: Count of Major Earthquakes at LMT Facilities
5.3.2.6. LMT Legal Analysis Results
Figure 36 is straightforward and counts the number of Lockheed Martin facilities with
courthouses nearby. California has the most, with 17 courthouses near facilities; the District of Columbia
is a distant second with six courthouses near; and tied for third are Maryland, New York, Connecticut,

71
and Massachusetts, with four courthouses near LMT facilities. Legal teams that need to fight corporate
cases (e.g., copyright infringement, patent protection, or lawsuits) may work out of these proximal
facilities.
Figure 36 LMT Legal Analysis Results: Count of LMT Facilities Proximal to Courthouses by State
5.3.2.7. LMT Militaristic Analysis Results
Figure 37 shows Lockheed Martin facilities that are nearby Department of Defense (DoD) sites
by military component. The Navy has the most LMT facilities nearby with 46, followed by the Active Air
Force with 34, and the Active Army with 16. Among the Navy intersected facility projects include the
Ballistic Missile Defense System (BMDS), the Trident Ballistic Missile, and the F-35. The Airforce
intersected facility projects include the F-35, GPS III, and the C-130. The Army intersected facility
projects include Terminal High Altitude Area Defense (THAAD), the Patriot Advanced Capability 3
(PAC-3), the BMDS, and C-130. For reference, the WHS category of the chart stands for Washington
Headquarters Services.
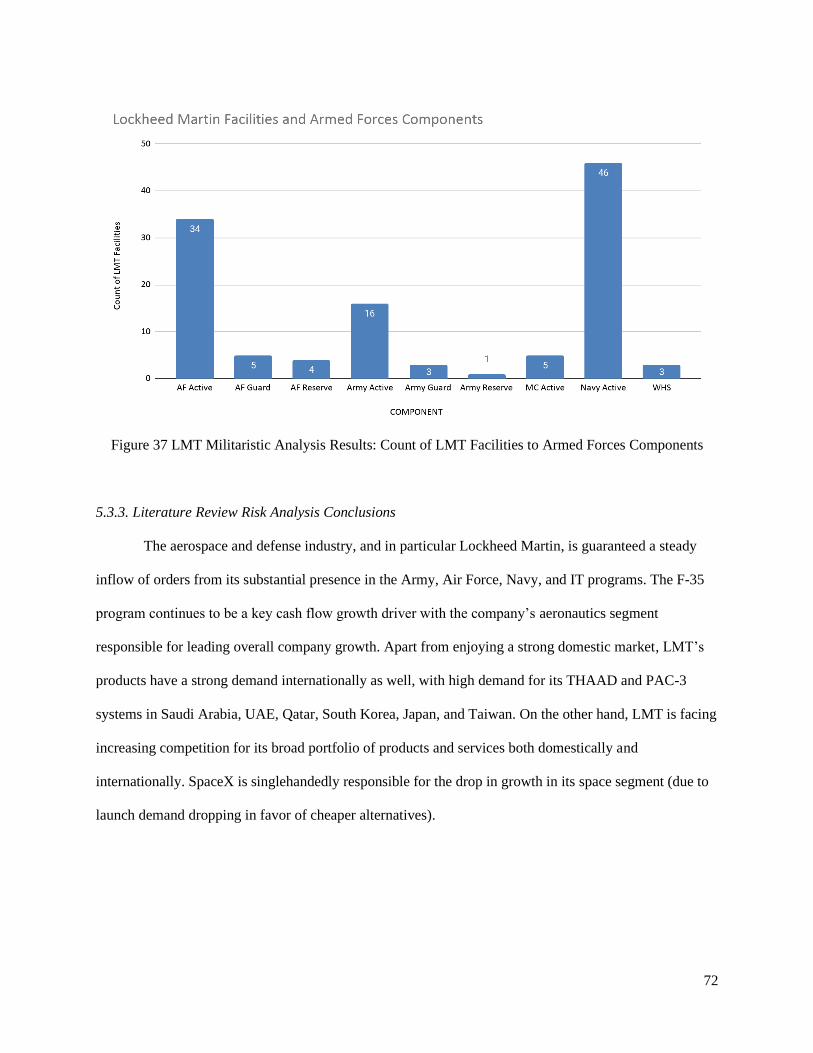
72
Figure 37 LMT Militaristic Analysis Results: Count of LMT Facilities to Armed Forces Components
5.3.3. Literature Review Risk Analysis Conclusions
The aerospace and defense industry, and in particular Lockheed Martin, is guaranteed a steady
inflow of orders from its substantial presence in the Army, Air Force, Navy, and IT programs. The F-35
program continues to be a key cash flow growth driver with the company’s aeronautics segment
responsible for leading overall company growth. Apart from enjoying a strong domestic market, LMT’s
products have a strong demand internationally as well, with high demand for its THAAD and PAC-3
systems in Saudi Arabia, UAE, Qatar, South Korea, Japan, and Taiwan. On the other hand, LMT is facing
increasing competition for its broad portfolio of products and services both domestically and
internationally. SpaceX is singlehandedly responsible for the drop in growth in its space segment (due to
launch demand dropping in favor of cheaper alternatives).

73
Chapter 6 Discussion
This chapter concludes this research report by outlining what went right, what went wrong,
possible solutions to the things that went wrong if the author had more time, and future work. In general,
future work can either go into more breadth or depth in either the application development or analyses.
Breadth refers to expanding to the full span of knowledge, and depth refers to focusing on a specific topic.
The sections below address these two mutually exclusive routes for future research.
6.1 Application Development
The things that went right with the application development include: the ease of web application
development thanks to the user-friendly nature of Web AppBuilder, the resulting web version that can be
used on a mobile device through the mobile browser, the clean and simple user interfaces of both the web
and mobile applications, and the ease of adding underlying datasets through ArcGIS Online.
What went wrong with the application development is that the mobile application does not have
the geoprocessing widget and is thus unable to perform real-time analysis. Solutions to this problem
would be to disregard mobile development completely for web development or increase the amount of
mobile application development time.
Future work to increase the breadth of the application development is updating the mobile
application to have as many features as the web version. To increase the depth of the applications,
additional functionality, additional PESTELM datasets and other company facility datasets can be added
to the underlying web maps.
The JavaScript for the mobile application has been shared to a GitHub repository at the URL:
https://github.com/astraw13/eye.earth. This repository allows the author to share his work with future
employers and others interested with the project’s process. Additionally, the URL: http://eye.earth will
remain under the ownership of the author and host the web application and/or the contents of this thesis
for the foreseeable future.
74
6.2 Real-Time Analysis
What went right with the real-time analysis is the relationship between ModelBuilder, the
geoprocessing service, and the geoprocessing widget within the web application. It is an elegant solution
to do real-time analysis on live datasets. Once the geoprocessing service process was fully understood, the
ability to replicate the process for other types of datasets and analysis is now as straightforward as making
an egg sandwich for breakfast. Another additional learning outcome of the geoprocessing process was
becoming more familiar with the back-end architecture underlying services and applications.
What went wrong with the real-time analysis is that the map service does not display on the web
application’s map. The possible solutions to this problem are setting the symbology client-side, adjusting
the save paths for the intermediary or output data, and examining the JavaScript underlying the
geoprocessing service within a code editor to find the exact source of the issue.
Future work to be done with the real-time analysis to increase the breadth is adding a real-time
analysis to every live dataset as they are incorporated into the web maps and increasing the depth—
moving from configuring the geoprocessing widget from within Web AppBuilder to a JavaScript code
editor so that more precise upgrades can be made.
The mobile application cannot consume the geoprocessing service because there was not enough
development time during this thesis project to implement that functionality, however, it is the goal of the
author to continue developing the mobile application to be able to do this. The mobile application can
contain the static map results through the underlying web maps and collect/store the real-time results
beforehand and periodically deliver them to the map services so that processing time on the client side
can be reduced.
In a similar vein, the geoprocessing service currently takes about six minutes to process a query
because the Earthquakes dataset is extremely large for a live dataset and contains a lot of unimportant low
magnitude events. The processing for the geoprocessing service task is occurring within the Server.
Processing time can be reduced by adding another SQL query to the code, such as, events being greater
75
than or equal to 5.0 magnitude or another threshold. Additionally, because the geoprocessing service was
set to asynchronous, the client must periodically ask the server if the task has finished, and if it has then
gotten the result. To lower the processing time, the geoprocessing service could be set to synchronous
where the client will wait for the task to finish, or the web application can have its logic tweaked to check
that the status of the task once the execution of the result is finished. The author could have also done the
geoprocessing service from within ArcGIS Pro instead of ArcMap to increase processing times because
Pro uses parallel processing while ArcMap does not. However, this was attempted, and it was found that
the author did not have the necessary privileges from the Server Administrator to perform these
operations from within ArcGIS Pro.
The author believes that the output cannot be viewed because of file path issues or client-side
symbology issues. The thread at the URL: https://community.esri.com/thread/117337 contains a similar
issue that was responded to by an Esri employee in April of 2020 with links to the documentation for
result map services in REST applications at the URL https://enterprise.arcgis.com/en/server/10.7/publish-
services/windows/result-map-service.htm and defining output symbology for geoprocessing tasks at the
URL: https://enterprise.arcgis.com/en/server/10.7/publish-services/windows/result-map-service.htm. With
more time, the author would follow the aforementioned documentation and configure the JavaScript
within a code editor to solve the map service viewing problem.
This real-time analysis improved on the Stone and Barnett theses by providing a simpler and
more user-friendly route to perform real-time analysis than their work. Their work relied on intermediate
to advanced programming and back-end knowledge, whereas the author of this research project would
define his own experience as beginner-intermediary. For future USC students or other master’s theses
built on this work, the route developed for this work offers a more feasible and technically friendly way to
do real-time analysis. The author made the conscious and deliberate decision to use out-of-the-box tools
as much as possible because he was not trying to re-invent several wheels at once and overall it made a lot
more sense and aligned better with the project’s overall goal.

76
Amazon EC2 was used to build the cloud server instead of a competitor like Microsoft Azure
because of the author’s experience with that cloud server provider and because the costs were relatively
low (only about $20 was spent to complete this study on their platform). Additionally, once the AMI
process was understood, the author felt the EC2 dashboard was user-friendly and explanative of the
features and services that could be provided. Harvey (2020) discusses the three leading cloud providers
(AWS, Microsoft Azure, and Google Cloud) and compare their strengths, weaknesses, and their ideal use
cases. For example, the main difference between deploying on AWS and Azure is that an SSL certificate
is required to install Cloud Builder. However, AWS has a vast tool set that with essentially unmatched
capabilities. Azure is better for companies that already have a data center and want a hybridized approach
to cloud infrastructure. Google Cloud has the backdrop of exceptional technical expertise and leads the
field with its deep learning, artificial intelligence, and data analytics. It is highly likely that the author will
continue to expand his back-end knowledge base with both of these other platforms for future work and
for future employers.
6.3 Static Analyses
Foremost, what went right with the static analyses is that this research is the first example in
literature of combining a spatial analysis outputs with a financial valuation model. Although flawed, it is
the precursory foundation of a new field of research. The PESTELM framework allowed insights into
things not previously considered and changed assumptions held by the author after the analysis in the
political, technological, and militaristic results.
What went wrong is that the static analyses required highly tedious work that only produced
marginally interesting results (however, science is not supposed to be exciting all the time). The solution
to this would be to automate the spreadsheet analysis and add higher quality and more insightful datasets
to be analyzed.
Future work to increase the breadth of the static analysis is adding more companies that
complement this analysis (like a more comprehensive industry analysis) and increasing the depth of this
77
analysis would be to move completely from static analysis to real-time and have the real-time results
automatically generate reports daily for financial analysts.
Google Sheets was used to perform the DCF calculation because assumptions and cash flow
growth rate projections could be altered based on changes with analysts’ projections or earnings reveals.
Additionally, Google Sheets contains the GOOGLEFINANCE function which provides live market prices
for the equity within the valuation model. Although, Google Sheets can not be used in this way for
commercial use (without paying extra for the services), it is free for personal and academic usage.
Additionally, Google Sheets was used to analyze the Excel tables because of time management
and efficiency reasons. For example, if a small change needed to be made within a chart or graph, then the
chart could be updated within Google Sheets and refreshed within Google Docs to reflect those changes.
6.4 Conclusion
In conclusion, this application development and spatial financial analysis is a cookbook for future
researchers to improve and build upon. This research is a bridge between two distinct fields and when
combined have the potential to drastically alter the development of both. A gap within the literature was
identified and this research project attempts to fill it.
Although this thesis report has come to an end, by no means has the author’s intrigue into delving
deeper into this research has. Improvements still need to be made in almost every facet of the project and
underlying idea, and the author plans to spend the rest of his life doing so. If you have any questions,
comments, feedback, or suggestions, please feel free to contact the author.

78
Author Disclosure
The author has a long position in Lockheed Martin and several other aerospace and defense
companies.

79
References
Aguilar, Francis J. 1967. “Scanning the Business Environment.” Macmillan.
Anderson, Patrick L. 2004. “Business economics and finance with MATLAB, GIS, and simulation
models.” CRC Press.
Ardito, Lorenzo, Antonio Messeni Petruzzelli, and Umberto Panniello. 2016. “Unveiling the
breakthrough potential of established technologies: An empirical investigation in the aerospace
industry. ” Technology Analysis & Strategic Management 28, no. 8: 916–934.
Badea, Victor Emmanuell, Alin Zamfiroiu, and Radu Boncea. 2018. “Big Data in the Aerospace Industry.
” Informatica Economica 22, no. 1: 17–24.
Barnett, Michael. 2016. “Precipitation Triggered Landslide Risk Assessment and Relative Risk Modeling
Using Cached and Real-Time Data.” A Thesis Presented to the Faculty of the USC Graduate
School University of Southern California.
Beery, Jason., 2012. “State, Capital and Spaceships: A Terrestrial Geography of Space Tourism.”
Geoforum 43, 25–34. https://doi.org/10.1016/j.geoforum.2011.07.013.
Billings, Linda. 2006. “Exploration for the Masses? Or Joyrides for the Ultra-Rich? Prospects for Space
Tourism.” Space Pol. 22, 162–164.https://doi.org/10.1016/j.spacepol.2006.05.001.
Birkin, Mark, Graham Clarke, Martin Clarke, and Alan Wilson. 1996. Intelligent GIS: Location Decisions
and Strategic Planning (No. 528.8 INT). Cambridge: Geoinformation International.
Boasson, Vigdis, and Alan MacPherson. 2001. “The Role of Geographic Location in the Financial and
Innovation Performance of Publicly Traded Pharmaceutical Companies: Empirical Evidence from
the United States.” Environment and Planning A: Economy and Space 33, no. 8: 1431–44.
doi:10.1068/a3431.
Broekel, Tom, and Ron Boschma. 2011. “Knowledge networks in the Dutch aviation industry: the
proximity paradox. ” Journal of Economic Geography 12, no. 2 (2011): 409–433.
Carboni, Oliviero A. 2013. “A Spatial Analysis of R&D: The Role of Industry Proximity.” Economics of
Innovation and New Technology 22, no. 8: 820–839.
Castleman, Thomas. 2013.“PESTLE Analysis: Virgin Galactic.”
http://tcastlema7.wixsite.com/virgingalactic/pestle-analysis.
Clausewitz, Carl von, and Michael Howard. 1993. On War. Carl Von Clausewitz. London: David
Campbell.
Collins, Patrick, and Adriano Autino. 2010. “What the Growth of a Space Tourism Industry Could
Contribute to Employment, Economic Growth, Environmental Protection, Education, Culture and
World peace.” Acta Astronaut. 66, 1553–1562. https://doi.org/10.1016/j.Actaastro.2009.09.012.
Congressional Budget Office. 2019. “Long-Term Implications of the 2020 Future Years Defense
Program.”

80
Creative Assembly. 2019. “Three Kingdoms. ” Total War. Accessed August 06, 2019.
https://www.totalwar.com/games/three-kingdoms/.
Crowther, R.ichard. 2011. “The Regulatory Challenges of Ensuring Commercial Human Spaceflight
Safety.” Space Pol. 27, 74–76. https://doi.org/10.1016/j.spacepol.2011.04.011.
Eisenhower, Dwight D. 1961. “Farewell address. ” White House. Washington, DC.
https://www.ourdocuments.gov/doc.php?flash=false&doc=90&page=transcript
Environmental Protection Agency. 2019. Atmospheric Data and Air Pollution.
Esri. 2019a. “ArcGIS Business Analyst. ” Location-driven Market Intelligence. Accessed August 09,
2019. https://www.esri.com/en-us/arcgis/products/arcgis-business-analyst/overview.
Esri. 2019b. “Web AppBuilder for ArcGIS: Make Your Own Web App, No Coding Required. ” For
ArcGIS | Make Your Own Web App, No Coding Required. Accessed August 09, 2019.
https://www.esri.com/en-us/arcgis/products/web-appbuilder/overview.
Fidelity Investments Inc. 2020. “Lockheed Martin eResearch.” https://eresearch.fidelity.com/
Fujita, Masahisa, Paul R. Krugman, and Anthony Venables. 1999. “The spatial economy: Cities, regions,
and international trade.” MIT press.
Grossman, Sanford J., and Joseph E. Stiglitz. 1980. "On the impossibility of informationally efficient
markets." The American economic review 70, no. 3: 393-408.
Groves, Leslie R. 2009. “Now It Can Be Told: The Story of the Manhattan Project.” Da Capo Press.
Harvey, Cynthia. 2020. “AWS vs. Azure vs. Google: Cloud Comparison.” Datamation.
https://www.datamation.com/cloud-computing/aws-vs-azure-vs-google-cloud-comparison.html
Hobe, Stephan. 2010. “The Legal Regime for Private Space Tourism Activities: An Overview.” Acta
Astronaut. 66, 1593–1596. https://doi.org/10.1016/j.actaastro.2009.08.019.
Holland, Sarah. 2004. “The Global Pharmaceutical Industry.” Manchester Business School Instructor’s
Manual.
Isaacson, Walter. 2012. “How Steve Jobs’ Love Of Simplicity Fueled A Design Revolution.”
Smithsonian.com. Accessed August 09, 2019. https://www.smithsonianmag.com/arts-
culture/how-steve-jobs-love-of-simplicity-fueled-a-design-revolution-23868877/.
Jones, Christopher B., David B. Kidner, L. Q. Luo, G. Ll Bundy, and J. Mark Ware. 1996. “Database
Design for a Multi-Scale Spatial Information System. ” International Journal of Geographical
Information Systems 10, no. 8: 901–920.
Ketels, Christian H. M. “Industrial policy in the United States. ” 2007. Journal of Industry, Competition
and Trade 7, no. 3-4 : 147–167.
Kolios, Athanasios, and George Read. 2013. “A Political, Economic, Social, Technology, Legal and
Environmental (PESTLE) Approach for Risk Identification of the Tidal Industry in the United
Kingdom.” Energies 6, no. 10: 5023–45. https://doi.org/10.3390/en6105023.
81
Le Goff, Thierry, and Antonio Moreau, 2013. “Astrium Suborbital Spaceplane Project: Demand Analysis
of Suborbital Space Tourism.” Acta Astronaut. 92, 144–149.
https://doi.org/10.1016/j.Actaastro.2013.03.025.
Ledbetter, James., 2011. “Unwarranted influence: Dwight D. Eisenhower and the Military Industrial
Complex.” Yale University Press.
Leetaru, Kalev H. 2019. “The GDELT Project. ” Accessed August 07, 2019.
https://www.gdeltproject.org/.
Lockheed Martin. 2018. “10-K SEC Filing.” https://investors.lockheedmartin.com/sec-filings/sec-
filing/10-k/0000936468-19-000009.
Lockheed Martin. 2019. “10-K SEC Filing.” https://investors.lockheedmartin.com/financial-
information/sec-filings.
Lockheed Martin. 2020. “Our History.” https://www.lockheedmartin.com/en-
us/news/features/history.html.
Lorell, Mark A., Julia F. Lowell, Richard M. Moore, Victoria A. Greenfield, and Katia Vlachos. 2002.
“Going Global?: US Government Policy and the Defense Aerospace Industry.” Rand
Corporation.
Macrae, Norman. 2019. “John von Neumann: The Scientific Genius Who Pioneered the Modern
Computer, Game Theory, Nuclear Deterrence, and Much More.” Plunkett Lake Press.
Masson-Zwaan, T., and R. Moro-Aguilar. 2013. “Regulating Private Human Suborbital Flight at the
International and European Level: Tendencies and Suggestions.” Acta Astronaut. 92, 243–254.
https://doi.org/10.1016/j.actaastro.2012.11.002.
Masson-Zwaan, T., R. Moro-Aguilar, and A. Lentsch. 2014. “The Future Regulation of Suborbital Flight
in Europe.” Space Pol. 30, 75–82. https://doi.org/10.1016/j.spacepol.2014.03.004.
Mattis, Jim. 2018. “Summary of the 2018 National Defense Strategy of the United States of America.”
Washington, D.C.: Department of Defense.
McGowan, Mollie. 2007. “Between a Rock and a Hard Place: The Export of Technical Data Under the
International Traffic in Arms Regulations. ” Geo. Wash. L. Rev. 76: 1327.
Mocenco, Daniela. 2015. “Supply Chain Features of the Aerospace Industry. Particular Case Airbus and
Boeing. ” Scientific Bulletin-Economic Sciences 14, no. 2: 17–25.
Moro-Aguilar, R. 2014. “The New Commercial Suborbital Vehicles: An Opportunity for Scientific and
Microgravity Research.” Microgravity Sci. Technol. 26, 219–227. https://doi.org/10.1007/s12217-
014-9378-9.
Morrell, Peter, and Cherie H-Y. Lu. 2000. “Aircraft Noise Social Cost and Charge Mechanisms–A Case
Study of Amsterdam Airport Schiphol. ” Transportation Research Part D: Transport and
Environment 5, no. 4: 305–320.

82
National Geospatial-Intelligence Agency. 2019. “National Geospatial-Intelligence Agency.” Geospatial-
Intelligence Agency. Accessed August 09, 2019. https://www.nga.mil/Pages/Default.aspx.
Perring, W. G. A. 1946. “A Critical Review of German Long-Range Rocket Development.” Journal of
the American Rocket Society 65: 1–17.
Pinto, Jerald. 2015. “Equity Asset Valuation.” CFA Institute Investment Series.
Rastogi, Nitank, and Dr. Trivedi. 2016. “PESTLE Technique: A Tool to Identify External Risks in
Construction Projects.” Int. Res. J. Eng. Technol. 3, 384–388.
Rothaermel, Frank. 2015. Strategic Management. McGraw-Hill Education.
Rovetto, Robert. 2013. “The Essential Role of Human Spaceflight.” Space Pol. 29, 225–228.
https://doi.org/10.1016/j.spacepol.2013.08.001.
Saaty, Thomas. 2001. “Deriving the AHP 1–9 Scale from First Principles.” ISAHP 2001 Proceedings,
Bern, Switzerland, pp.397–402.
Seedhouse, Erik. 2008. “Commercial Potential for Space Tourism.” Tourists in Space: A Practical Guide:
1-12.
Shepherd, Ifan. 2009. “From Geography Department to Business School: Strategies for Transplanting
GIS Courses between Disciplines.” Journal of Geography in Higher Education, 33(S1), S28–
S45.
Sikorska, Paulina. 2014. “The Mission (Im)possible: Towards a Comprehensive Legal Framework
Regulating Safety Issues of Point to Point Suborbital Flights.” Jurisprudence 21, 1055.
https://doi.org/10.13165/JUR-14-21-4-07.
StarMine Corporation. 2020. “Lockheed Martin Quantitative Modeling.”
https://www.refinitiv.com/en/products/starmine-financial-modeling/starmine-investment-
research-analytics
Stone, Neil E. 2017. “Social Media Canvassing Using Twitter and Web GIS to Aid in Solving Crime.” A
Thesis Presented to the Faculty of the USC Graduate School University of Southern California.
Straw, Andrew M. 2019. “Automating Proximity Analysis of Study Firms to Sacramento, CA
Infrastructure.” SSCI586 GIS Programming & Customization Final Project.
Straw, Andrew M. 2020a. “Eye.Earth Beta v.1.0 Web Application Development.” SSCI591 Web GIS
Final Project.
Straw, Andrew M. 2020b. “Eye.Earth Mobile v1.0 Application Development.” SSCI592 Mobile GIS
Final Project.
Tzeng, Don. 2007. “Evaluating intertwined effects in e-learning programs: a novel hybrid MCDM model
based on factor analysis and DEMATEL.” Expert Syst. Appl. 32, 1028-1044.
http://dx.doi.org/10.1016/j.eswa.2006.02.004
US Geological Survey. 2020. “The Earthquakes Hazards Program.” Science For A Changing World.
https://earthquake.usgs.gov/data/
83
US Energy Information Administration. 2020. “2019 US electricity generation by energy source.”
https://www.eia.gov/
US Government’s Open Data. 2019. https://www.data.gov.
White House. 2016. “The National Artificial Intelligence Research and Development Strategic Plan.”
White House.
White House. 2017a. “Strengthening Manufacturing and Defense Industrial Base and Supply Chain
Resiliency of the US.” White House.
White House. 2017b. “Presidential Determination Pursuant to Section 4533(a)(5) of the Defense
Production Act of 1950.” White House.
World Bank. 2015. “World Bank 2015 Open Economic Data.” https://data.worldbank.org/
Wu, Wei-Wen, & Lee, Y. T. 2007. “Developing global managers’ competencies using the fuzzy
DEMATEL method.” Expert Systems with Applications, 32, 499-507.
http://dx.doi.org/10.1016/j.eswa.2005.12.005
Yamagami, Taito. 2004. “Development of the Highest Altitude Balloon.” Adv. Space Res. 33, 1653–1659.
https://doi.org/10.1016/j.asr.2003.09.047.
Yang, Zhenshan, Pu Hao, and Jianming Cai. 2015. "Economic clusters: A bridge between economic and
spatial policies in the case of Beijing." Cities 42: 171-185.
Yüksel, Ihsan. 2012. “Developing a Multi-Criteria Decision-Making Model for PESTEL Analysis.”
International Journal of Business and Management 7, no. 24 (2012): 52.
Zahari, Arimali. “Analysis of Suborbital Flight Operation Using PESTLE.” Journal of Atmospheric and
Solar-Terrestrial Physics 192 (2019): 104901. https://doi.org/10.1016/j.jastp.2018.08.006.

84
Appendix A: Python Script of Real-Time Proximity Analysis
# -*- coding: utf-8 -*-
# ---------------------------------------------------------------------------
# LMT_Intersect.py
# Created on: 2020-07-21 17:54:58.00000
# (generated by ArcGIS/ModelBuilder)
# Usage: LMT_Intersect <Distance__value_or_field_> <Expression> <Events_by_Magnitude>
<Thesis_astraw_USER_ASTRAW_LMT_Facilities>
# Description:
# intersection of lmt and earthquakes
# ---------------------------------------------------------------------------
# Import arcpy module
import arcpy
# Script arguments
Distance__value_or_field_ = arcpy.GetParameterAsText(0)
if Distance__value_or_field_ == '#' or not Distance__value_or_field_:
Distance__value_or_field_ = "15 Kilometers" # provide a default value if unspecified
Expression = arcpy.GetParameterAsText(1)
if Expression == '#' or not Expression:
Expression = "hoursOld <= 48" # provide a default value if unspecified
Events_by_Magnitude = arcpy.GetParameterAsText(2)
if Events_by_Magnitude == '#' or not Events_by_Magnitude:
Events_by_Magnitude = "Recent Earthquakes\\Events by Magnitude" # provide a default value if
unspecified
Thesis_astraw_USER_ASTRAW_LMT_Facilities = arcpy.GetParameterAsText(3)
if Thesis_astraw_USER_ASTRAW_LMT_Facilities == '#' or not
Thesis_astraw_USER_ASTRAW_LMT_Facilities:
Thesis_astraw_USER_ASTRAW_LMT_Facilities =
"Thesis_astraw.USER_ASTRAW.LMT_Facilities" # provide a default value if unspecified
# Local variables:
LMT_Feature = "LMT_Feature"
LMT_Intersect0707Buff = "\\\\gist-
fs1\\filestore\\astraw\\Documents\\ArcGIS\\astrawThesis\\PESTELM_data.gdb\\LMT_Intersect0707Buff"
Events_Feature = "Events_Feature"
LMT_Intersect0707 = "\\\\gist-
fs1\\filestore\\astraw\\Documents\\ArcGIS\\astrawThesis\\PESTELM_data.gdb\\LMT_Intersect0707"

85
Thesis_astraw_USER_ASTRAW_LMT_Intersect0707Output = "Database
Connections\\User_astraw.sde\\Thesis_astraw.USER_ASTRAW.LMT_Intersect0707Output"
# Process: Make Feature Layer (2)
arcpy.MakeFeatureLayer_management(Thesis_astraw_USER_ASTRAW_LMT_Facilities,
LMT_Feature, "", "", "OBJECTID VISIBLE NONE;Company Company VISIBLE NONE;Division
Division VISIBLE NONE;Division_Information Division_Information VISIBLE
NONE;Facility_Information Facility_Information VISIBLE NONE;Employees Employees VISIBLE
NONE;Jobs_at_Site Jobs_at_Site VISIBLE NONE;Security_Level Security_Level VISIBLE
NONE;Projects Projects VISIBLE NONE;Address Address VISIBLE NONE;City City VISIBLE
NONE;State State VISIBLE NONE;Country Country VISIBLE NONE;Latitude Latitude VISIBLE
NONE;Longitude Longitude VISIBLE NONE;Telephone Telephone VISIBLE NONE;Shape Shape
VISIBLE NONE")
# Process: Buffer
arcpy.Buffer_analysis(LMT_Feature, LMT_Intersect0707Buff, Distance__value_or_field_, "FULL",
"ROUND", "NONE", "", "PLANAR")
# Process: Make Feature Layer
arcpy.MakeFeatureLayer_management(Events_by_Magnitude, Events_Feature, "", "", "OBJECTID
VISIBLE NONE;id id VISIBLE NONE;mag mag VISIBLE NONE;eventType eventType VISIBLE
NONE;sig sig VISIBLE NONE;alert alert VISIBLE NONE;place place VISIBLE NONE;hoursOld
hoursOld VISIBLE NONE;eventTime eventTime VISIBLE NONE;updated updated VISIBLE NONE;tz
tz VISIBLE NONE;url url VISIBLE NONE;detail detail VISIBLE NONE;felt felt VISIBLE NONE;cdi
cdi VISIBLE NONE;mmi mmi VISIBLE NONE;status status VISIBLE NONE;tsunami tsunami
VISIBLE NONE;net net VISIBLE NONE;code code VISIBLE NONE;ids ids VISIBLE NONE;sources
sources VISIBLE NONE;types types VISIBLE NONE;nst nst VISIBLE NONE;dmin dmin VISIBLE
NONE;rms rms VISIBLE NONE;gap gap VISIBLE NONE;magType magType VISIBLE
NONE;longitude longitude VISIBLE NONE;latitude latitude VISIBLE NONE;depth depth VISIBLE
NONE;Shape Shape VISIBLE NONE")
# Process: Select
arcpy.Select_analysis(Events_Feature, LMT_Intersect0707, Expression)
# Process: Intersect
arcpy.Intersect_analysis("\\\\gist-
fs1\\filestore\\astraw\\Documents\\ArcGIS\\astrawThesis\\PESTELM_data.gdb\\LMT_Intersect0707Buff
#;\\\\gist-
fs1\\filestore\\astraw\\Documents\\ArcGIS\\astrawThesis\\PESTELM_data.gdb\\LMT_Intersect0707 #",
Thesis_astraw_USER_ASTRAW_LMT_Intersect0707Output, "ALL", "", "INPUT")

86
Appendix B: Static Analysis ModelBuilder PESTELM Models
Figure 38 Screenshot of LMT Political ModelBuilder Model
Figure 39 Screenshot of LMT Economic ModelBuilder Model
Figure 40 Screenshot of LMT Sociocultural ModelBuilder Model
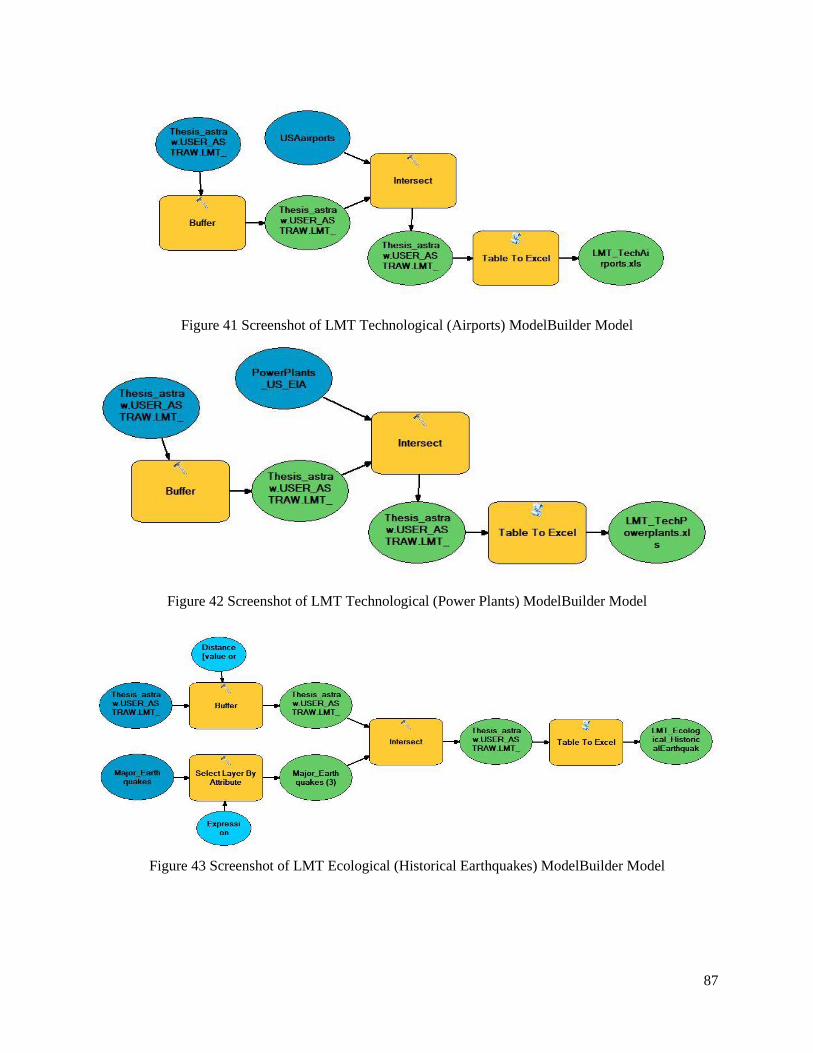
87
Figure 41 Screenshot of LMT Technological (Airports) ModelBuilder Model
Figure 42 Screenshot of LMT Technological (Power Plants) ModelBuilder Model
Figure 43 Screenshot of LMT Ecological (Historical Earthquakes) ModelBuilder Model

88
Figure 44 Screenshot of LMT Legal ModelBuilder Model
Figure 45 Screenshot of LMT Militaristic ModelBuilder Model