extreme wind characteristics of coastal …file.scirp.org/pdf/acs_2016032814061828.pdfv. e. weli et...
TRANSCRIPT

Atmospheric and Climate Sciences, 2016, 6, 180-189 Published Online April 2016 in SciRes. http://www.scirp.org/journal/acs http://dx.doi.org/10.4236/acs.2016.62016
How to cite this paper: Weli, V.E., Adegoke, J.O. and Wodu, D.P.-E. (2016) Extreme Wind Characteristics of Coastal Com-munities in Bayelsa State: Implications for Community Planning and Development in Nigeria. Atmospheric and Climate Sciences, 6, 180-189. http://dx.doi.org/10.4236/acs.2016.62016
Extreme Wind Characteristics of Coastal Communities in Bayelsa State: Implications for Community Planning and Development in Nigeria Vincent Ezikornwor Weli1*, Jimmy O. Adegoke2, Douye Pere-Ere Wodu1 1Department Of Geography And Environmental Management, Faculty of Social Sciences, University Of Port Harcourt, Port Harcourt, Nigeria 2Department of Geosciences, University of Missouri-Kansas City, Kansas City, USA
Received 21 February 2016; accepted 25 March 2016; published 28 March 2016
Copyright © 2016 by authors and Scientific Research Publishing Inc. This work is licensed under the Creative Commons Attribution International License (CC BY). http://creativecommons.org/licenses/by/4.0/
Abstract The study examined extreme wind characteristics of the coastal communities in Bayelsa State, Ni-geria for possible community planning and development. To achieve this aim, data on wind speed were sourced from the Nigerian Meteorological Agency (NIMET). Personal interview and focused group discussions were done with the aid of well structured questionnaire in the various coastal communities sampled to identify impact and coping strategies from extreme winds. The Beaufort Winds Scale and regression analysis were the statistical tools used for the analysis of the data in order to achieve the objectives of the study. The results indicate that, the return period to obtain maximum 1-year wind speed value of 29.3 m/s (violent storm), 27.8 m/s (storm), 24.3 m/s (strong Gale) and 20.6 m/s (fresh Gale) will be 17 years, 5.7 years, 2.8 years and 1.4 years respectively. Fresh Gale characterized the extreme wind events in the area. Result further showed that out of 19 occurrences of wind events, 11 were extreme cases, while 2 occurred as violent storm of 29.3 m/s. Findings also showed that extreme winds occurred more (8 cases) during the early part (March- April) of the raining season when the area is under the influence of maritime moisture laden air mass than the dry season which is dried and dusty. Using a combination of return period of the magnitude of extreme wind and the log of wind speed for the 16 years a model predicting the in-cidence of extreme wind was done. Awareness on the dangers of wind hazard increases while ear-ly warning systems are advocated to mitigate the associated dangers with extreme wind events in the study area.
*Corresponding author.

V. E. Weli et al.
181
Keywords Extreme Winds, Gale, Coastal Communities, Coastal Storms, Wind Hazards
1. Introduction Bayelsa’s coastal areas are dynamic environments that are susceptible to a broad range of processes that can create and generate potentially climatic related hazardous conditions. Much of Bayelsa’s populated coast is vul-nerable to the effects of coastal storms (high winds, wave action, overwash, and storm surge), flooding, sea-level rise, and both episodic and chronic shoreline erosion. In coastal areas, particularly of developing countries, where rapid growth is the pattern of global environmental changes that has been identified as a key precursor of risks. A major manifestation of global climate change is the increase in occurrence and intensity of natural ha-zards with devastating effect on humans; buildings and infrastructure [1]-[3]. The IPCC Fourth Assessment Re-port [3] explicitly highlighted the increasing frequency and intensity of extreme weather events related to tem-perature extremes, wind and rain consequent on global climate change. “The increasing global incidence of nat-ural disasters has been largely attributed to increased social vulnerability of affected societies in addition to the role played by the occurrence of more extreme events in nature [4]”.
Studies of climate event impacts for developing countries (Tropical Africa) emphasize mostly drought and floods [5]. Although, the worst effect of rainfall hazard is the creation of floods, rainfall is also normally asso-ciated with intense storm as part of a compound hazard involving wind and flooding. It has been observed that strong winds associated with rainstorms occur during the raining season and are a threat to most communities in Bayelsa State, directly affecting buildings, infrastructure, lives and other environmental settings. Wind hazards also have indirect social and economic consequences on the communities affected [6].
Wind related hazards have not been adequately acknowledged as environmental problem, like flooding and gully erosion. This is in-spite of the fact that wind hazards claims lives, destroys buildings and social infrastruc-ture annually. Globally much attention is given to major extreme weather events such as droughts, floods and tropical storms, yet small hazard events, which are mostly neglected in the policy arena, have strategic impor-tance to development planning as aggregate loss resulting from their occurrence is usually high. These are out-comes of mesoscale climatic circumstances which may be affected by climate changes. As small hazard events, the occurrence of local windstorms is becoming frequent and increasingly important to human security as they have the capacity to facilitate large events by eroding people’s assets and the integrity of critical infrastructure subsequently lowering society’s threshold of resilience in local communities [7] [8]. In both rural and urban en-vironments windstorms have important implication especially when high quests result in mortality, the uproot-ing of trees, considerable structural damage to buildings, power and telephone lines, communication masts, farm crops, such as yams among others. The significance of severe convection weather indicates that disasters have been recognized in other regions aside sub-Saharan Africa and attention has been given to them in studies. However, very little impact or vulnerability studies from a hazard perspective have been carried out with respect to windstorm hazard in Sub-Saharan Africa [6] [9] [10]. The problem of wind has, however, not been widely acknowledged and addressed in the area of climatic hazards in coastal communities of Nigeria. This is the gap which this paper intends to fill in the study area.
2. Study Area The study area is Yenagoa LGA of Bayelsa State (Figure 1). The study area lies along latitudes between 4˚48'00'' North and 5˚24'10'' East; and longitudes between 6˚12'00'' E and 6˚39'30'' E It is bounded by Rivers State on the North and East, Kolokuma/Opokuma LGA on the North West and West, Ogbia LGA on the South East and Southern Ijaw on the South west. Yenagoa LGA has a population of 352,285 by 1996 estimate.
Weather systems particularly rainfall in Nigeria are primarily as result of the interplay between two major pressure and wind systems. These are two dynamically generated sub-tropical high pressure cells entered over the Azores Achipelago (off the coast of North Africa) and St. Hellena Islands (off the coast of Namibia). These high pressure centers (or anticyclones) which are permanently generated and drive respectively the North-East trade wind and South-east trade wind of the South Atlantic Ocean. Both air streams blow over Bayelsa coastal

V. E. Weli et al.
182
Figure 1. Map showing the study area in Bayelsa state.
communities at various seasons of the year. It is important to note that these air streams or masses follow the apparent movement of the sun which passes the region twice on its way to and from the tropic of cancer [11]. These trade winds have been conditioned by the nature of their source religions having originated over the South Atlantic Ocean; the moist south-west wind transports its moisture to Nigeria. This air stream blows over the re-gions between the months of February and November. This is the period in which the region receives its rains. Conversely the north-east trade winds bring dry condition, having passed over in hot and dry Sahara desert to reach Nigeria from the north, this air stream blows over the Bayelsa State coastal communities. The entire Bayelsa state is endowed with abundant sunshine by virtue of its geographical location near the equator hence, the sun is vertically overhead throughout the year. Daylight hours are longer, because of the long duration of so-lar radiation at the surface which is substantially reduced mainly due to cloudiness consequent upon its coastal location. These moderating influences induce slight diurnal, monthly and annual variation in temperature over the region. Other influences aside cloud cover; include the hamattan, and the influences of vegetation. The soil of the area consist of various types of superficial deposits overlying thick tertiary sandy and clayey deposits which are over 100 m thick in places. The consistently high rainfall and temperature of the area encourage in-tense chemical weathering of the rocks, which result in the formation of clay minerals that are ubiquitous in the area. Generally, the land surface is very flat while swamp tidal basins, mud flats and sandbank predominate along the coastal communities. The drainage of the area is poor, essentially due to a combination of low relief, high water table and high rainfall resulting in low flow velocities of the rivers. This situation gives rise to the formation of well-developed river meanders which are irregular such as the Ox-bow Lake.

V. E. Weli et al.
183
3. Methodology Data on daily windspeed was obtained from the Nigerian Meteorological Agency (NIMET) in the study area from the period of five years (1997-2012) making a total of 5475 days and the effects of extreme wind events in the study area was collected with the aid of the questionnaire and focused group discussion with the residents of the sampled coastal communities in Bayelsa. They were selected based on a population criterion of 1200 persons and above. They include Oporoma, Brass, Akassa, Amasoma and Kaiama. Similarly wind cup anemometers were installed in the selected communities to validate the data on wind speed for six months. The data was ana-lysed using Regression technique. Probability of occurrence, Return Period and Trend Analysis were similarly done to determine the recurrence interval of extreme wind events of specific magnitude in the study area. A re-turn period, also known as a recurrence interval (sometimes repeat interval) is an estimate of the likelihood of an event, such as an extreme wind to occur [12]. It is a statistical measurement typically based on historic data de-noting the average recurrence interval over an extended period of time, and is usually used for risk analysis and it is applicable in the case under investigation. The algorithms are shown below;
In a given period of n years, the probability of a given number r of extreme wind events of a return period µ is given by the binomial distribution as follows:
In general, if the random variable X follows the binomial distribution with parameters n∈ and [ ]0,1p∈ , we write X ~ B (n, p). The probability of getting exactly k successes in n trials is given by the probability mass function:
( ) ( )1 n rrr
nP X r
rµ µ −
= = −
(1)
In the limit of: n →∞ , 0µ → , such that nµ λ→ Then,
( ) ( )! 1 e! ! !
rn rrn
n r r rλ λµ µ − −− →
− (2)
Take,
11
mTn
µ = =+
(3)
where; T = is return interval; N = is number of years on record; m = is the number of recorded occurrences of the event being considered.
4. Results and Discussion of Findings 4.1. Wind Speed Characteristics and Return Period in the Coastal Communities Table 1 indicates that the associated extreme wind types (event) in the study area are: Violent storm (28.4 - 32.6 m/s), Storm (24.5 - 28.4 m/s) and strong Gale (20.7 - 24.5 m/s). Findings further showed that the period of 1997 through 2012 (Figure 2), the total occurrence (frequency) of extreme wind events in the study area was 11; out of which 2 were violent storms, 3 were storm and 6 were strong Gales.
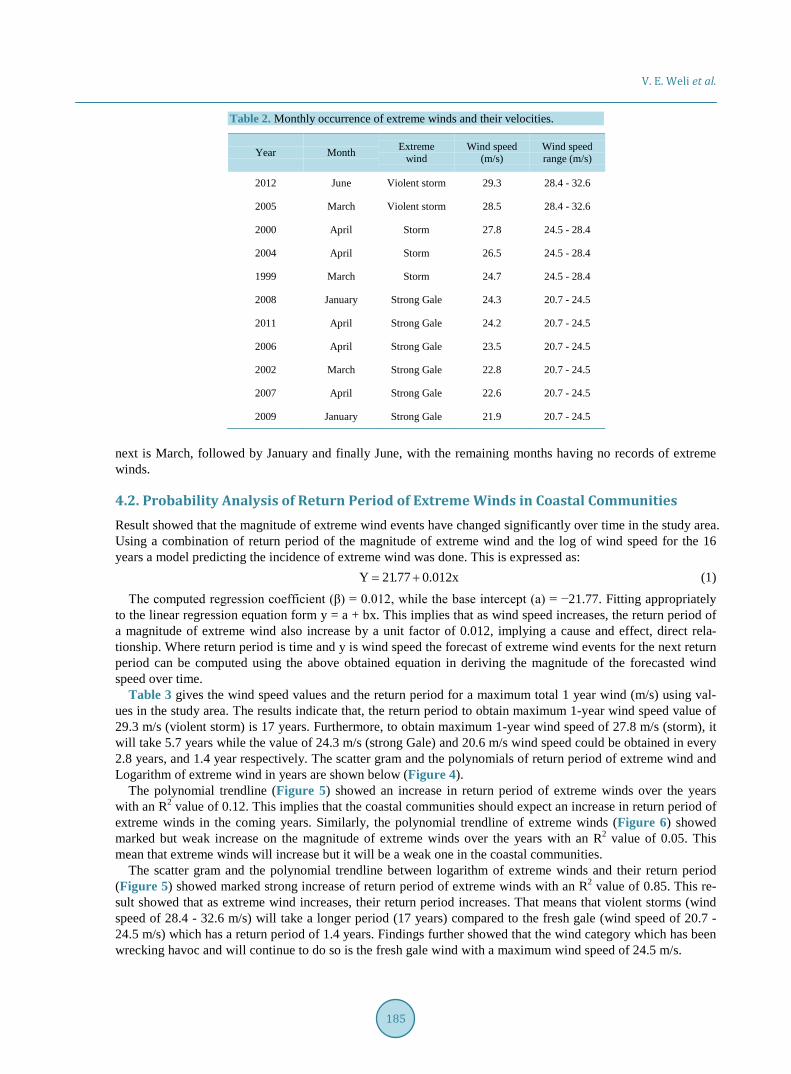
Findings showed that extreme wind event occurred more during the early part of rainy season (March and April) and the later part of the season (December through January) (see Table 2). As such, extreme wind events are characteristics of rainfall and thunderstorm within the coastal communities of the study area.
Findings showed that the violent storms 29.3 m/s and 28.5 m/s occurred in June 2012, and march 2005 re-spectively (Figure 3). The storms with the values 27.8 m/s, 26.5 m/s and 24.7 m/s occurred in April, 2000, 2004 and in march 1994 respectively. The strong gale which are wind speed range of 20.7 m/s - 24.5 m/s occurred in January 2008, 2-009; April 2011, 2006 and 2007. This indicates that violent storms that significantly affect the coastal communities occur in the early part of the year when the maritime air mass begins to move inland. Simi-larly, the month of April marks the highest occurrences of extreme wind events within the period of 1997-2012,

V. E. Weli et al.
184
Table 1. Trend, frequency and occurrence of extreme winds typology.
Year Wind speed (m/s)
Wind speed range (m/s)
Extreme wind types Frequency
2012 29.3 28.4 - 32.6 Violent storm 2
2005 28.5 28.4 - 32.6 Violent storm 1
2000 27.8 24.5 - 28.4 Storm 3
2004 26.5 24.5 - 28.4 Storm 1
1999 24.7 24.5 - 28.4 Storm 1
2008 24.3 20.7 - 24.5 Strong Gale 6
2011 24.2 20.7 - 24.5 Strong Gale 1
2006 23.5 20.7 - 24.5 Strong Gale 1
2002 22.8 20.7 - 24.5 Strong Gale 1
2007 22.6 20.7 - 24.5 Strong Gale 1
2009 21.9 20.7 - 24.5 Strong Gale 1
Total 276.1 19
Figure 2. Wind speed characteristics of the Bayelsa state (1997-2012).
Figure 3. Mean monthly frequency distribution of extreme wind events (>20 m/s).
V. E. Weli et al.
185
Table 2. Monthly occurrence of extreme winds and their velocities.
Year Month Extreme wind
Wind speed (m/s)
Wind speed range (m/s)
2012 June Violent storm 29.3 28.4 - 32.6
2005 March Violent storm 28.5 28.4 - 32.6
2000 April Storm 27.8 24.5 - 28.4
2004 April Storm 26.5 24.5 - 28.4
1999 March Storm 24.7 24.5 - 28.4
2008 January Strong Gale 24.3 20.7 - 24.5
2011 April Strong Gale 24.2 20.7 - 24.5
2006 April Strong Gale 23.5 20.7 - 24.5
2002 March Strong Gale 22.8 20.7 - 24.5
2007 April Strong Gale 22.6 20.7 - 24.5
2009 January Strong Gale 21.9 20.7 - 24.5
next is March, followed by January and finally June, with the remaining months having no records of extreme winds.
4.2. Probability Analysis of Return Period of Extreme Winds in Coastal Communities Result showed that the magnitude of extreme wind events have changed significantly over time in the study area. Using a combination of return period of the magnitude of extreme wind and the log of wind speed for the 16 years a model predicting the incidence of extreme wind was done. This is expressed as:
Y 21.77 0.012x= + (1) The computed regression coefficient (β) = 0.012, while the base intercept (a) = −21.77. Fitting appropriately
to the linear regression equation form y = a + bx. This implies that as wind speed increases, the return period of a magnitude of extreme wind also increase by a unit factor of 0.012, implying a cause and effect, direct rela-tionship. Where return period is time and y is wind speed the forecast of extreme wind events for the next return period can be computed using the above obtained equation in deriving the magnitude of the forecasted wind speed over time.
Table 3 gives the wind speed values and the return period for a maximum total 1 year wind (m/s) using val-ues in the study area. The results indicate that, the return period to obtain maximum 1-year wind speed value of 29.3 m/s (violent storm) is 17 years. Furthermore, to obtain maximum 1-year wind speed of 27.8 m/s (storm), it will take 5.7 years while the value of 24.3 m/s (strong Gale) and 20.6 m/s wind speed could be obtained in every 2.8 years, and 1.4 year respectively. The scatter gram and the polynomials of return period of extreme wind and Logarithm of extreme wind in years are shown below (Figure 4).
The polynomial trendline (Figure 5) showed an increase in return period of extreme winds over the years with an R2 value of 0.12. This implies that the coastal communities should expect an increase in return period of extreme winds in the coming years. Similarly, the polynomial trendline of extreme winds (Figure 6) showed marked but weak increase on the magnitude of extreme winds over the years with an R2 value of 0.05. This mean that extreme winds will increase but it will be a weak one in the coastal communities.
The scatter gram and the polynomial trendline between logarithm of extreme winds and their return period (Figure 5) showed marked strong increase of return period of extreme winds with an R2 value of 0.85. This re-sult showed that as extreme wind increases, their return period increases. That means that violent storms (wind speed of 28.4 - 32.6 m/s) will take a longer period (17 years) compared to the fresh gale (wind speed of 20.7 - 24.5 m/s) which has a return period of 1.4 years. Findings further showed that the wind category which has been wrecking havoc and will continue to do so is the fresh gale wind with a maximum wind speed of 24.5 m/s.

V. E. Weli et al.
186
Table 3. Type and seasonal pattern of extreme wind.
Rank Years Wind speed (m/s) P-m/n + 1 RT = 1/p Log of wind speed
13 1997 20.5 13/17 = 0.7647 1.3077 1.3118
12 1998 20.6 12/17 = 0.7059 1.4166 1.3139
5 1999 24.7 5/17 = 0.2941 3.4002 1.3927
3 2000 27.8 3/17 = 0.1765 5.6657 1.4440
14 2001 19.3 14/17 = 0.8235 1.2143 1.2856
9 2002 22.8 9/17 = 0.5294 1.8889 1.3579
16 2003 18.5 16/17 = 0.9412 10625 1.2672
4 2004 26.5 4/17 = 0.2353 4.2499 1.4232
2 2005 28.5 2/17 = 0.1176 8.5034 1.4548
8 2006 23.5 8/17 = 0.4706 2.1249 1.3711
10 2007 22.6 10/17 = 0.5882 1.7001 1.3541
6 2008 24.3 6/17 = 0.3529 2.8337 1.3856
11 2009 21.9 11/17 = 0.6471 1.5454 1.3404
15 2010 18.8 15/17 = 0.8823 1.1334 1.2742
7 2011 24.2 7/17 = 0.4118 2.4284 1.3838
1 2012 29.3 1/17 = 0.0588 17.0068 1.4669
Total 16 373.3 7.89406 57.4819 21.8272
Figure 4. Scattergram and the polynomial trendline of return period of ex-treme winds in years.
Figure 5. Scattergram and the polynomial trendline of log of extreme winds in years.
y = 602.0ln(x) − 4573.R² = 0.121
02468
1012141618
1995 2000 2005 2010 2015
Ret
urn
perio
d of
ext
rem
e w
ind
Years
Series 1
Logarithm(Series 1)
—
y = −4E−05x2 + 0.178x − 180.6R2 = 0.053
1.25
1.3
1.35
1.4
1.45
1.5
1995 2000 2005 2010 2015Log
valu
es o
f ext
rem
e w
ind
Years
Series 1
Multinomial (Series 1)
—

V. E. Weli et al.
187
Figure 6. Scattergram and the polynomial trendline between logarithm of extreme wind speed and their return periods in 16 years.
4.3. Extreme Wind Impacts and Coping Strategies in the Coastal Communities of Bayelsa State
The associated destruction caused by wind hazard in the study area include but are not limited to displacement from dwelling, damage to property, economic hardship, restriction of movement, depression and death (Table 4). Responses from affected persons in the study area regarding their coping strategies include relocation to neigh-bours residence, repairs/replacement of damaged property, cut down of financial expenses, rescheduling of ap-pointment, and borrowing to effect repairs respectively.
From responses gathered from the study area with the aid of questionnaire and focused group discussion, the perceived factors responsible for increasing vulnerability/exposure to extreme wind hazards are proximity to the sea, obsolete structures, use of substandard construction materials and insufficient trees to serve as natural wind breakers as shown on Table 5. Haven considered available aspects of wind characteristics in this paper, the sec-tion below examines what extreme wind could mean for community planning and development.
Table 4. Impacts of, and coping strategies for extreme winds.
Impact Coping Strategies
Displacement from dwellings Relocated to neighbours residence
Damage to property Repair/replace damaged property
Economic hardship Cut down of financial expenses
Restriction of movement Rescheduled appointment
Depression Borrowing to effect repairs
Death
Table 5. Factors responsible for increasing vulnerability/exposure to extreme wind hazards.
Factor Percentage Responses
Proximity to sea 20
Obsolete structures 5
Use of poor construction materials 34
Insufficient trees to serve as wind breakers 41
Total 100
y = −0.001x2 + 0.040x + 1.265R2 = 0.859
1.25
1.3
1.35
1.4
1.45
1.5
1.55
0 5 10 15 20
Log
valu
es o
f ext
rem
e w
ind
Return period of extreme wind
Series 1
Multinomial (Series 1)
—

V. E. Weli et al.
188
4.4. Implications for Community Planning and Development If coastal hazards are not considered in the process of community planning and development, properties, local residents and businesses, traditional indigenous owners, the insurance, property development and real estate in-dustries, fishing and agricultural industries and their consumers, tourist operators and visitors, environmental organisations and recreational groups may be subject to unnecessary and increased risks from extreme wind and their associated hazards. Strong governance arrangements are critical to developing an effective response to ex-treme winds in the highly vulnerable coastal communities of the state. Unfortunately, the complicated layers of legislation and policy, and overlapping Commonwealth, state and local responsibilities for aspects of the coastal zone, represent a major challenge for effective governance within Bayelsans coastal amenity communities.
5. Summary This study has shown that, the return period to obtain maximum 1-year wind speed value of 29.3 m/s (violent storm), 27.8 m/s (storm), 24.3 m/s (strong Gale) and 20.6 m/s (fresh Gale) will be 17 years, 5.7 years, 2.8 years and 1.4 years respectively. Violent storm, Storm, and Strong Gale characterized the extreme wind events in the area. More so, extreme winds occurred more (8 cases) during the early part (March-April) of the raining season when the area is under the influence of maritime moisture laden air mass than the dry season which is dried and dusty. Using a combination of return period of the magnitude of extreme wind and the log of wind speed for the 16 years a model predicting the incidence of extreme wind was done.
Recommendation A coordinated federal effort, in cooperation with other levels of government, academia and the private sector should build on existing efforts and should include but not limited to:
1) Assessing individual and community capability to respond to wind events, including vulnerability analyses, risk perception, risk communication, and sharing; installation and communication of early wind warnings and public response, evacuation capability, and knowledge of appropriate actions for wind events, especially among vulnerable populations (the aged and children and women).
2) Evaluating the response of the built environment and critical infrastructure to wind events by investigating aerodynamic response, load path, ultimate capacity and the performance of the building envelope.
3) Assessing the impact of wind and wind-blown debris on wind and water. 4) Examining the interaction between wind and storm surge to determine the impact on building foundations
and critical infrastructure. 5) Exploring the near-ground and channeling/shielding effects of winds on buildings through testing and in-
strumentation. 6) Developing new technologies on ground, and satellite based observing systems to improve predictability,
knowledge and understanding of windstorms and the wind variability within those storms.
References [1] Guha-Sapir, D., Hargitt, D. and Hoyois, P. (2004) Thirty Years of Natural Disaster 1974-2003: The Numbers Presses.
Universities de Lovivain, Centre for Research on the Epidemology of Disasters, Louvain-la-Neuve, Belsium. [2] Huppert, H.E. and Sparks, R.S.J. (2006) Extreme Natural Hazards: Population Growth, Globalization and Environ-
mental Change. Philosophical Transactions of the Royal Society A: Mathematical, Physical and Engineering Sciences, 364, 1875-1888. http://dx.doi.org/10.1098/rsta.2006.1803
[3] IPCC (2007) Climate Change, Impact, Adaptation and Venerability. Parry, Martiai, Canszian: Osvaldoif, Palutikof, Jean P. Vandees Linden, Paul, J. and Hanson Clair Cambridge University Press.
[4] Etkin, D., (1999) Extreme Events and Natural Disasters in an Era of Increasing Environmental Change. In: Report of a May 14, 1999 Workshop on Emerging Environmental Issues in Ontario, Environmental Monograph No. 15, Institute for Environmental Studies, University of Toronto, Toronto, 19-22.
[5] Ayoade, J.O. (2004) Climate Change: Synopsis, Impact and Adaptation. Vantage Publishers, Ibadan. [6] Adelekan, I.O. (2000) A Survey of Rainstorm as Weather Hazards in Southern Nigeria. Environmentalist, 20, 33-39. [7] Kasperson, J.X., Kasperson, R.E. and Turner, B.L. (1995) Regions at Risk: Comparisons of Threatened Environments
II. United Nations University Press, Tokyo.
V. E. Weli et al.
189
[8] United Nations Framework Convention (UNFCCC) (2006) on Climate Change Work paper LHP:/unfccc.int/2860. PHP. https://simple.wikipedia.org
[9] Goliger, A.M and Retief, J.V. (2007) Sever wind Phenomena in Southern Africa and the Related Damage. Journal of Wind Engineering and Industrial Aerodynamics, 95, 1065-1078. http://dx.doi.org/10.1016/j.jweia.2007.01.029
[10] Odjugo, P.O.A (2008). Quantifying the Cost of Climate Change Impact in Nigeria. Emphasis on Wind and Rainstorms. Journal of Human Ecology, 28, 93-101.
[11] Oyegun, C.U. and Ologunorisa, E.T. (2002) Climate Change and Its Implications for Mankind in the 21st Century. JOGET, 4, 73-84, 87.
[12] Omey, E., Mallor, F. and Nualent, E. (2009) An Introduction to Statistical Modeling of Extreme Values: Application to Calculate Extreme Winds Speeds. Hub Research Paper, Brussels.