extreme summer temperatures in iberia: health impacts … · extreme summer temperatures in iberia:...
TRANSCRIPT
Annales Geophysicae (2005) 23: 239–251SRef-ID: 1432-0576/ag/2005-23-239© European Geosciences Union 2005
AnnalesGeophysicae
Extreme summer temperatures in Iberia: health impacts andassociated synoptic conditions
R. Garcıa-Herrera1, J. Dıaz2, R. M. Trigo 3, and E. Hernandez1
1Dto. Fısica de la Tierra II, Facultad de Fısicas, Universidad Complutense, Spain2Centro Universitario de Salud Publica, Universidad Autonoma de Madrid, Spain3CGUL, Faculdade de Ciencias, Universidade de Lisboa, Portugal
Received: 17 March 2004 – Revised: 25 October 2004 – Accepted: 27 October 2004 – Published: 28 February 2005
Abstract. This paper examines the effect of extreme sum-mer temperatures on daily mortality in two large cities ofIberia: Lisbon (Portugal) and Madrid (Spain). Daily mortal-ity and meteorological variables are analysed using the samemethodology based on Box-Jenkins models. Results revealthat in both cases there is a triggering effect on mortalitywhen maximum daily temperature exceeds a given threshold(34◦ C in Lisbon and 36◦ C in Madrid). The impact of mostintense heat events is very similar for both cities, with signifi-cant mortality values occurring up to 3 days after the temper-ature threshold has been surpassed. This impact is measuredas the percentual increase of mortality associated to a 1◦ C in-crease above the threshold temperature. In this respect, Lis-bon shows a higher impact, 31%, as compared with Madridat 21%. The difference can be attributed to demographic andsocio-economic factors. Furthermore, the longer life span ofIberian women is critical to explain why, in both cities, fe-males are more susceptible than males to heat effects, withan almost double mortality impact value.
The analysis of Sea Level Pressure (SLP), 500 hPa geopo-tential height and temperature fields reveals that, despite be-ing relatively close to each other, Lisbon and Madrid haverelatively different synoptic circulation anomalies associatedwith their respective extreme summer temperature days. TheSLP field reveals higher anomalies for Lisbon, but extend-ing over a smaller area. Extreme values in Madrid seem torequire a more western location of the Azores High, embrac-ing a greater area over Europe, even if it is not as deep as forLisbon. The origin of the hot and dry air masses that usuallylead to extreme heat days in both cities is located in NorthernAfrica. However, while Madrid maxima require wind blow-ing directly from the south, transporting heat from South-ern Spain and Northern Africa, Lisbon maxima occur undermore easterly conditions, when Northern African air flowsover the central Iberian plateau, which had been previouslyheated.
Correspondence to:R. Garcıa-Herrera([email protected])
Key words. Meteorology and atmosphere dynamics (Mete-orology and atmosphere dynamics)
1 Introduction
Classically, mortality has been considered as an indicator ofpopulation health. Various studies in different countries in-dicate seasonal behaviour of daily mortality as a functionof diverse environmental variables, especially temperature(Montero et al., 1997; Alberdi et al., 1998; Keatinge et al.,2000), in a V-shape relationship (Kunst et al., 1993; Saez etal., 1995). When specific causes of mortality are taken intoaccount it is found that increased winter and summer mor-tality are mostly due to cardiovascular diseases, especially inthe elderly (Pan et al., 1995; Alberdi and Dıaz, 1997). This iscoherent with the underlying biological mechanisms (Pan etal., 1995), which show that thermal susceptibility increaseswith advancing age. Reduced thermoregulatory responsesand less sensitive thermal perception may blunt thermoreg-ulatory behaviour during heat stress, which might in turn ag-gravate cardiovascular disease risks factors and trigger eventssuch as thrombosis, strokes or Cardio Vascular Accidents.Much interest has been focused on the study of the healthimpact produced by extreme temperature events. Thus, inrecent years there have been an increasing number of studiesdealing with the mortality associated with intense heat events(e.g. Smoyer (1998), Nakai et al., 1999; Ungar (1999); Des-sai (2002); Dıaz et al., 2002a, 2002b; Davis et al., 2003).Readers looking for an updated review of methodologies andresults are referred to Laschewski and Jendritzky (2002) andto Koppe et al., 2004. Results obtained by most of these au-thors agree on two key issues: a) the heat impact occurs atvery short term, with the increased mortality lagging the heatwave by 1 to 3 days, b) people older than 65 are the mostsensitive to extreme heat wave episodes.
240 R. Garcıa-Herrera et al.: Extreme summer temperatures in Iberia
Global mean temperature has risen around 0.6◦ C over thelast 100 years (IPCC 2001) and this increase has been sharperover the continents and milder over the oceans. Further-more, over most continental landmasses, this warming hasbeen asymmetrical, with trends of minimum night tempera-ture being consistently of a higher magnitude than the trendsof daily maximum temperature (Karl et al., 1993). A re-cent pan-European project (European Climate Assessment,ECA) has shown evidence of changes in the frequency of ex-treme temperatures during the second part of the 20th Cen-tury (Klein-Tank et al., 2002; Frich et al., 2002). Resultsobtained for the Iberian Peninsula confirm a steep increaseof the minimum temperature and a smaller but, nevertheless,important raise of the maximum temperature (Santos et al.,2002). Furthermore, the concentration of population in largeurban areas such as Lisbon and Madrid, with its urban heatisland effect, is likely to further exacerbate the health impactof such temperature increases. Climate change communityawareness to changes of summer heatwaves gained particu-lar “momentum” with the catastrophic heatwave observed inthe summer of 2003 in Europe. While the whole summerof 2003 was characterised by warm weather throughout Eu-rope (Luterbacher et al., 2004; Schar et al., 2004), it was therelatively short-lived heatwave that occurred during the firstfortnight of August 2003 that had a major impact in exces-sive mortality rates throughout western Europe, particularlyin France (Grynszpan, 2004).
Lisbon, the capital of Portugal (10.4 million inhabitants),is located at the mouth of the Tagus River, and its metropoli-tan area encloses approximately 2 million people; its climateis usually mild in the winter and warm in the summer, modu-lated by the nearby presence of the Atlantic Ocean. Madrid isthe capital of Spain (40 million inhabitants) and is located atthe very center of the Iberian Peninsula. Madrid’s metropoli-tan area encloses approximately 3 million people and its cli-mate is more continental than Lisbon, with frequent hot sum-mer days and cold winter nights.
Most of the previously mentioned studies analyse thetemperature-mortality relationship through the application ofdifferent statistical models. However, few of these works in-vestigate in depth the atmospheric large-scale circulation thatleads to such extreme conditions over specific regions of theglobe. In recent years, one of the most promising method-ologies has focused on the establishment of robust links be-tween different air-mass types or atmospheric weather situ-ations, and the associated effects on human health at a localor regional scale. Most applications were developed for siteslocated in the USA (Kalkstein, 1991; Kalkstein and Smoyer,1993; Greene and Kalkstein, 1996), including a warning sys-tem for the Philadelphia area (Kalkstein et al., 1996). Similarapproaches have now been adapted to other regions, such asEngland (McGregor et al., 1999) and Australia (Guest et al.,1999). Previous work for the Iberian Peninsula (Garcıa etal., 2002) has looked at specific synoptic conditions leadingto Extremely Hot Days (EHD) in the area of Madrid, Spain,revealing that stagnation episodes and southern fluxes are themost relevant patterns.
The characterization of the synoptic patterns involved inthe occurrence of mortality events is especially relevant be-cause atmospheric circulation indices at the synoptic scaleare nowadays well reproduced by regional circulation mod-els and thus can be satisfactory used as forecast tools. Infact, an adequate real-time forecasting scheme, either sta-tistical or dynamical in nature, is the most useful tool toprevent the increased health risks of extreme heat episodes.However, the role of local meteorological factors (e.g. seabreezes, topography, nearby lakes or mountains) is far frombeing completely understood, thus a better understanding ofthese factors could yield the development of better downscal-ing schemes which would provide an increment on the qual-ity of forecasts.
The main aims of this paper are twofold: a) to examine theeffect of Extremely Hot Days (EHD) on mortality in Lisbonand Madrid, and b) to characterize the meteorological factorsthat lead to an increase in summer heat-related mortality forboth Iberian cities. Previous studies for Iberia have analysedthe association between mortality and extreme temperaturesin both cities, but with different methodologies; Box-Jenkinsfor Madrid (Dıaz et al., 2002a) and a simple empirical modelfor Lisbon, (Dessai, 2002). This precluded a direct compari-son of the results. The simultaneous analysis presented hereshould be beneficial to detect the differences due to the localmeteorology and social variables, by using the same method-ology applied to similar meteorological and mortality series.Furthermore, it should be stressed that none of the previouslymentioned works has analysed the synoptic atmospheric cir-culation characteristics that led to an EHD in Lisbon. On theother hand, the only work that has looked at atmospheric cir-culation leading to EHD in Madrid (Garcıa et al., 2002) lacksthe comprehensive multivariable approach presented here.
Data and the methodology are briefly introduced in Sect. 2.Then, Sect. 3 characterises the health impact of EHDs in bothMadrid and Lisbon using a Box-Jenkins methodology. Sec-tion 4 describes in great detail the similarities and the dif-ferences of the atmospheric synoptic patterns responsible forEHD in Lisbon and Madrid. Finally, a discussion and someconclusions are outlined in Sect. 5.
2 Data and methods
Among the different methodologies available to evaluate thehealth impact of environmental variables, two techniquesstand out as those most commonly used: generalised addi-tive models (Kelsall et al., 1997) and Box-Jenkins models(Box et al., 1994). A recent study shows that both of themproduce similar results when the considered populations fol-low normal distributions (Tobıas et al., 2001). Box-Jenkinsor ARIMA models present the additional advantage that theycan provide the results expressed as the absolute increaseof mortality associated with an increase in temperature of1◦ C. This may be more easily manageable than the relativerisks given by the additive models. Basically, these Box-Jenkins or ARIMA models take into account the history of
R. Garcıa-Herrera et al.: Extreme summer temperatures in Iberia 241
the modelled series through autorregresive (AR) and movingaverage (MA) terms. The external variables can be intro-duced linearly at varying lags and dealing with different si-multaneous effects, thus enabling an effective identificationof the individual role associated with each specific predictor.
When analysing the association between extreme tem-perature and mortality, it must be noted that the mortalityseasonal cycle is probably not associated with temperature(Lasheweski and Jendritzky, 2002; Davis et al., 2004). Inorder to remove the spurious signal from the seasonal cy-cle both series have been fitted to an ARMA model, ARMA(2,0,2). The residuals have then been correlated at differ-ent time-lags. The significant values, after applying a Chi-square test (Makridakis et al., 1983), will show which mor-tality peaks are associated with high temperature events. Amore detailed description of the methodology followed inthis paper can be found in Dıaz et al. (1999).
Mortality has been computed as the number of daily deathsoccurring in Madrid and Lisbon between 1986 and 1997from June to September, both inclusive. The consideredcauses were “organic” (all mortality causes excluding acci-dents) included under the codes ICD9 1–799. The residentpopulation of both metropolitan areas has not changed sig-nificantly during these 12 years, so results are representedin terms of raw mortality as performed in previous worksfor this two cities (Dessai, 2002; Dıaz et al., 2002a), sincethe interest lies in evaluating the absolute impact. However,there are no significant differences when we apply the samemethodology to standardised rates (not shown). The mete-orological variables included in the models are daily max-imum, minimum and average temperatures. Station-basedmeteorological variables were obtained from the Retiro Ob-servatory in Madrid and from the Instituto Geofısico D. Luisin Lisbon. It should be emphasised that both meteorologi-cal stations are located near the city centres (Table 1) andthat these data have been used extensively in several previousinterdisciplinary studies, taking advantage of their long andconsistent records, as well as data control procedures (e.g.Dessai 2002; Diaz et al., 2002a).
To obtain a comprehensive, multivariable characterisationof the atmospheric circulation associated with the extremetemperatures, NCEP/NCAR reanalysis data (Kalnay et al.,1996) for the summer season (June and September), for theperiod 1958–1997 has been used. In order to identify themost favorable synoptic conditions to EHD, several surface,low- and mid-tropospheric meteorological variables wereconsidered. Anomaly fields of surface or low troposphereclimate variables are then computed and interpreted basedon large-scale physical mechanisms, such as the advectiveanomalous mean flow (characterised by the 500 hPa geopo-tential height and the surface wind) or the radiative balanceassociated with anomalous cloud cover (Trigo et al., 2004).Despite the relative small size of Iberia we have opted to ex-tract a large window (30◦ W−15◦ E and 30◦ N−60◦ N) thatincludes most of Western Europe, part of Northern Africaand a large sector of the Northern Atlantic ocean. The mete-orological data used consist of time series of daily values of:
1. sea level pressure (hereafter SLP),
2. 500 hPa geopotential height,
3. 850 hPa level temperature,
4. maximum and minimum air temperature at 2 m (here-after Tmax and Tmin),
5. zonal and meridional wind components at 10 m,
6. precipitation rate.
It must be remembered that, though based on observationaldata, the reanalysis data is also dependent upon the skill andreliability of the particular forecast model used. In the caseof NCEP/NCAR reanalysis, Kalnay et al. (1996) categorisethe reliance on the model of different types of variables.According to these authors variables such as SLP, 500 hPageopotential height and 850 hPa temperature correspond toobserved variables that were analysed by the model, whileprecipitation rate is most dependent upon the forecast model,thus susceptible to model systematic errors and must be usedwith precaution. Nevertheless, it is necessary to bear in mindthat all the large-scale atmospheric circulation analyses per-formed in this paper were based on the use of anomaly com-posites (mean field removed), thus filtering considerably theimpact of model inadequacies on our results (Trigo et al.,2004).
The definition of what constitutes an EHD day will avoidthe use of absolute threshold values, such as the commondefinition of any day with Tmax>30◦ C or Tmax>35◦ C. Here,EHD will be selected on a local basis, taking into account thetemperature-mortality relationships for each city and also thecharacteristics of the corresponding local Tmax distribution.In particular, an EHD will be defined as any day with a Tmaxvalue above the 95 percentile value of Tmax for that partic-ular station (see next section for details). The computationof these 95 thresholds and consequently the EHD sequenceswill be performed twice, the first time with the “short” pe-riod of 1986–1997 for the heat-mortality assessment and thenwith the “longer” period of 1958–1997 for the large-scalesynoptic characterization. It is worth mentioning that we arenot using a heatwave definition, usually based on the inten-sity and/or duration of consecutive number of days above acertain threshold. If we had been restricted to only thoseevents with more than three or five days, it would have lim-ited the application of the above-mentioned ARIMA mod-els. In this sense this work focuses its attention on describingthe impact of higher than usual temperatures, regardless ofwhether they occur in a sequence or as isolated events. Thus,the term heatwave will be only employed here whenever ourresults are compared with those obtained by other authorsthat have effectively used heatwave definition.
3 Mortality versus extreme temperatures
All the analysis developed in this section is based on data forthe short period that spans between 1986 and 1997. The as-
242 R. Garcıa-Herrera et al.: Extreme summer temperatures in Iberia
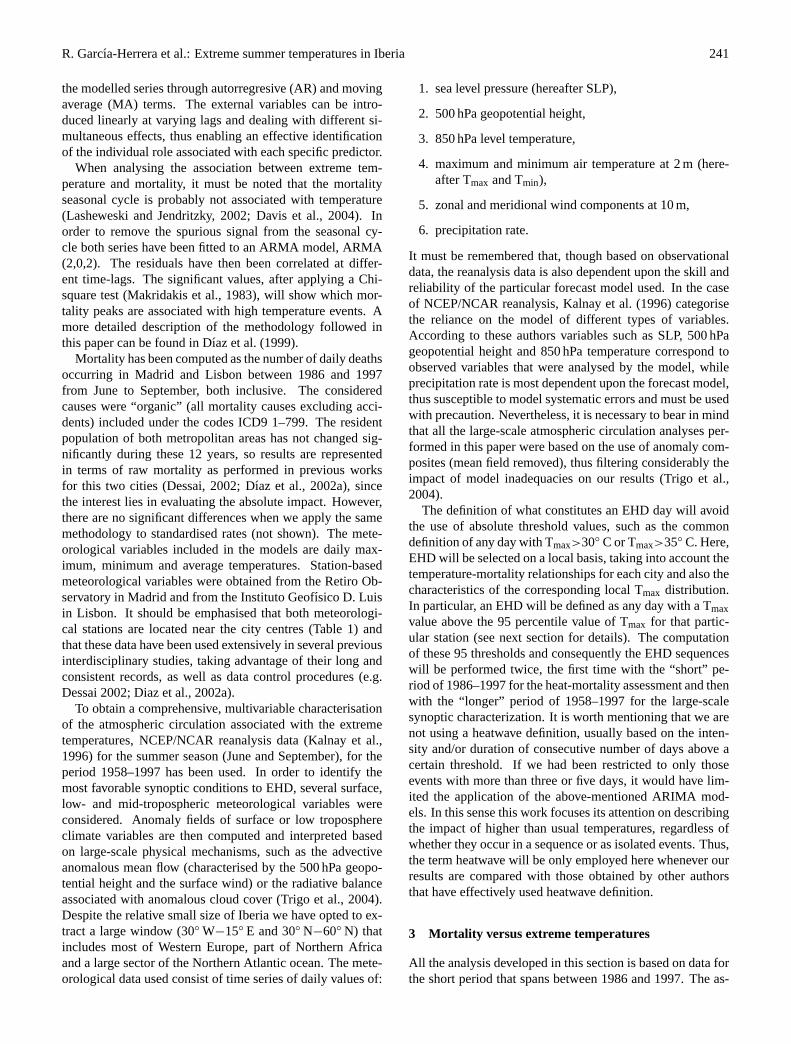
Table 1. Summary of main characteristics of data used from Lisbon and Madrid. Comparison of different variables between Madrid andLisbon.
Madrid Lisbon
Population considered (Census of 1991) 3.0 million people 2.0 million peopleLatitude/Longitude/Altitude 40◦41’ / 3◦67’ / 665 m 38◦43’ / 9◦08’ / 77 mMeteorological Station used Retiro (city center) Instituto de Geofisica D.Luis (city center)Short Period 1986–1997 1986–1997Temperature Threshold (95 percentile for short period) 36.4 33.6Long Period 1958–1997 1958–1997Temperature Threshold (95 percentile for long period) 35.7 33.4Most frequent duration of EHD spells/(Maximum duration) 1–2 days (11 days) 1–2 days (6 days)
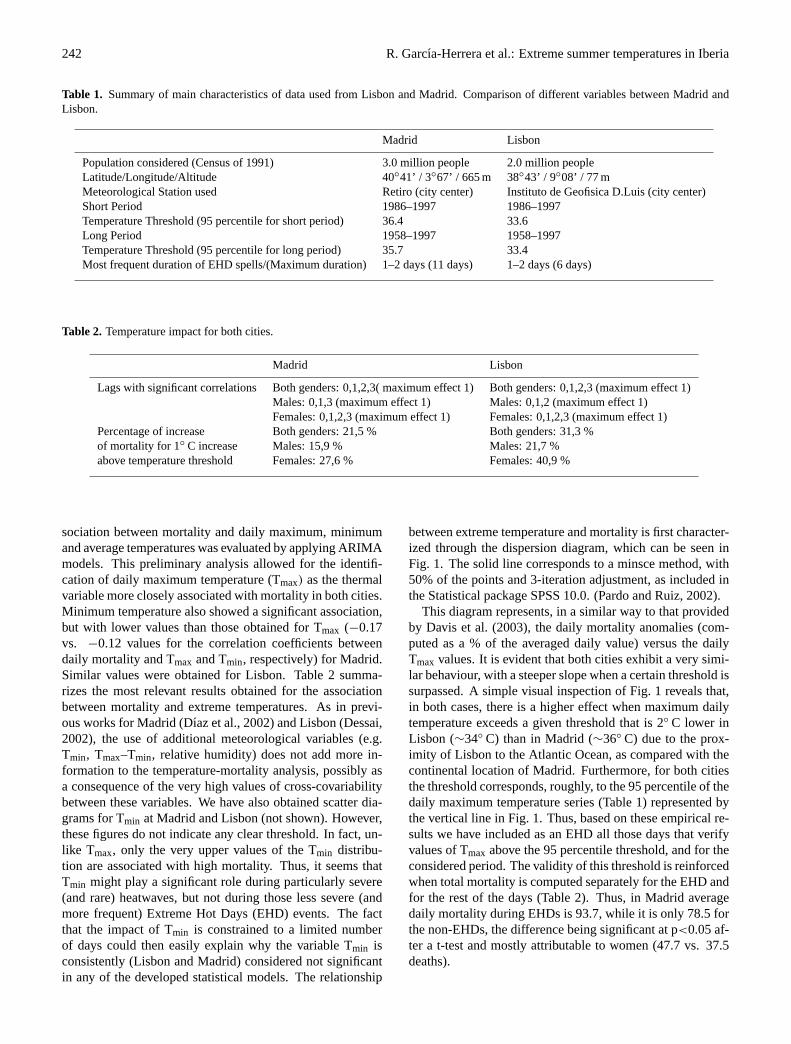
Table 2. Temperature impact for both cities.
Madrid Lisbon
Lags with significant correlations Both genders: 0,1,2,3( maximum effect 1) Both genders: 0,1,2,3 (maximum effect 1)Males: 0,1,3 (maximum effect 1) Males: 0,1,2 (maximum effect 1)Females: 0,1,2,3 (maximum effect 1) Females: 0,1,2,3 (maximum effect 1)
Percentage of increase Both genders: 21,5 % Both genders: 31,3 %of mortality for 1◦ C increase Males: 15,9 % Males: 21,7 %above temperature threshold Females: 27,6 % Females: 40,9 %
sociation between mortality and daily maximum, minimumand average temperatures was evaluated by applying ARIMAmodels. This preliminary analysis allowed for the identifi-cation of daily maximum temperature (Tmax) as the thermalvariable more closely associated with mortality in both cities.Minimum temperature also showed a significant association,but with lower values than those obtained for Tmax (−0.17vs. −0.12 values for the correlation coefficients betweendaily mortality and Tmax and Tmin, respectively) for Madrid.Similar values were obtained for Lisbon. Table 2 summa-rizes the most relevant results obtained for the associationbetween mortality and extreme temperatures. As in previ-ous works for Madrid (Dıaz et al., 2002) and Lisbon (Dessai,2002), the use of additional meteorological variables (e.g.Tmin, Tmax–Tmin, relative humidity) does not add more in-formation to the temperature-mortality analysis, possibly asa consequence of the very high values of cross-covariabilitybetween these variables. We have also obtained scatter dia-grams for Tmin at Madrid and Lisbon (not shown). However,these figures do not indicate any clear threshold. In fact, un-like Tmax, only the very upper values of the Tmin distribu-tion are associated with high mortality. Thus, it seems thatTmin might play a significant role during particularly severe(and rare) heatwaves, but not during those less severe (andmore frequent) Extreme Hot Days (EHD) events. The factthat the impact of Tmin is constrained to a limited numberof days could then easily explain why the variable Tmin isconsistently (Lisbon and Madrid) considered not significantin any of the developed statistical models. The relationship
between extreme temperature and mortality is first character-ized through the dispersion diagram, which can be seen inFig. 1. The solid line corresponds to a minsce method, with50% of the points and 3-iteration adjustment, as included inthe Statistical package SPSS 10.0. (Pardo and Ruiz, 2002).
This diagram represents, in a similar way to that providedby Davis et al. (2003), the daily mortality anomalies (com-puted as a % of the averaged daily value) versus the dailyTmax values. It is evident that both cities exhibit a very simi-lar behaviour, with a steeper slope when a certain threshold issurpassed. A simple visual inspection of Fig. 1 reveals that,in both cases, there is a higher effect when maximum dailytemperature exceeds a given threshold that is 2◦ C lower inLisbon (∼34◦ C) than in Madrid (∼36◦ C) due to the prox-imity of Lisbon to the Atlantic Ocean, as compared with thecontinental location of Madrid. Furthermore, for both citiesthe threshold corresponds, roughly, to the 95 percentile of thedaily maximum temperature series (Table 1) represented bythe vertical line in Fig. 1. Thus, based on these empirical re-sults we have included as an EHD all those days that verifyvalues of Tmax above the 95 percentile threshold, and for theconsidered period. The validity of this threshold is reinforcedwhen total mortality is computed separately for the EHD andfor the rest of the days (Table 2). Thus, in Madrid averagedaily mortality during EHDs is 93.7, while it is only 78.5 forthe non-EHDs, the difference being significant at p<0.05 af-ter a t-test and mostly attributable to women (47.7 vs. 37.5deaths).
R. Garcıa-Herrera et al.: Extreme summer temperatures in Iberia 243 Figure 1a: Daily mortality anomalies (anomalies>0) versus daily maximum temperatures for
Lisbon. The solid line corresponds to a minsce method with 50% of the points and 3 iterations
adjustment. The corresponding 95 percentile Tmax value for Lisbon is also represented.
Perc.95
Maximum temperature (ºC)
42403836343230282624222018
Mea
n M
orta
lity
anom
aly
(%).
Lisb
on140
130
120
110
100
90
80
70
60
50
40
30
20
100
Perc 95 %
Figure 1b: Daily mortality anomalies versus daily maximum temperatures for Madrid The solid
line corresponds to a minsce method with 50% of the points and 3 iterations adjustment. The
corresponding 95 percentile Tmax value for Madrid is also represented.
Maximum temperature (ºC)
424038363432302826242220
Mea
n M
orta
lity
anom
aly
(%).
Mad
rid.
140
130
120
110
100
90
80
70
60
50
40
30
20
100
Perc 95 %
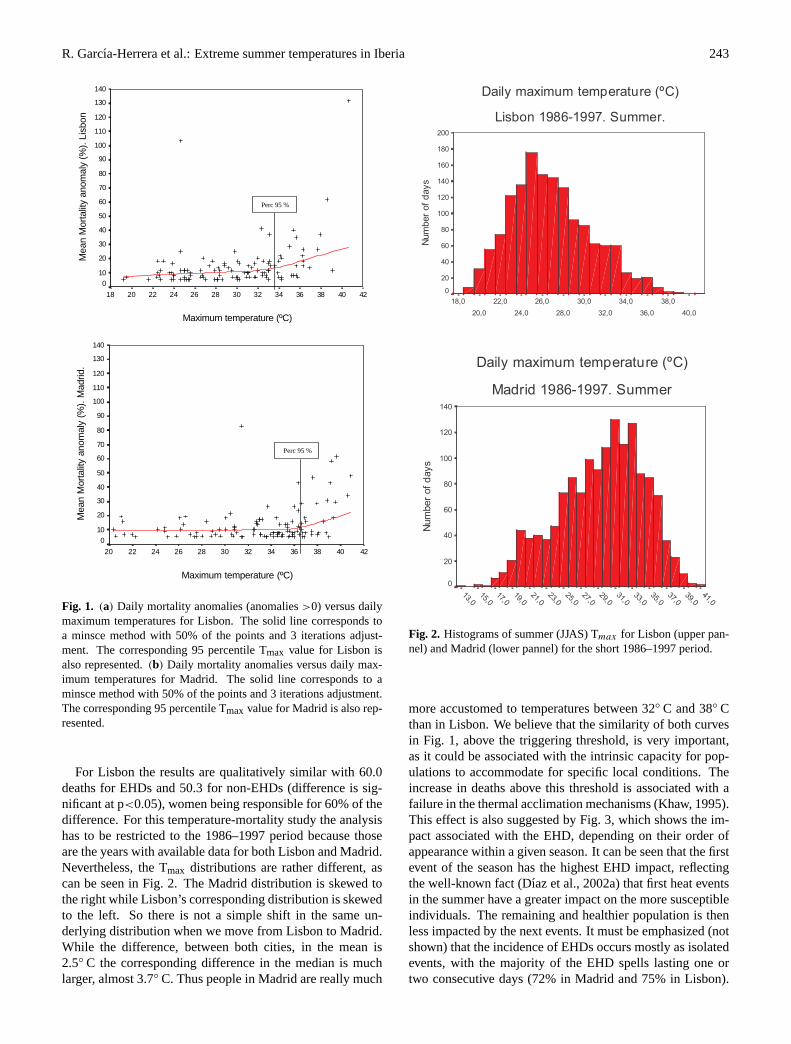
Fig. 1. (a) Daily mortality anomalies (anomalies>0) versus dailymaximum temperatures for Lisbon. The solid line corresponds toa minsce method with 50% of the points and 3 iterations adjust-ment. The corresponding 95 percentile Tmax value for Lisbon isalso represented.(b) Daily mortality anomalies versus daily max-imum temperatures for Madrid. The solid line corresponds to aminsce method with 50% of the points and 3 iterations adjustment.The corresponding 95 percentile Tmax value for Madrid is also rep-resented.
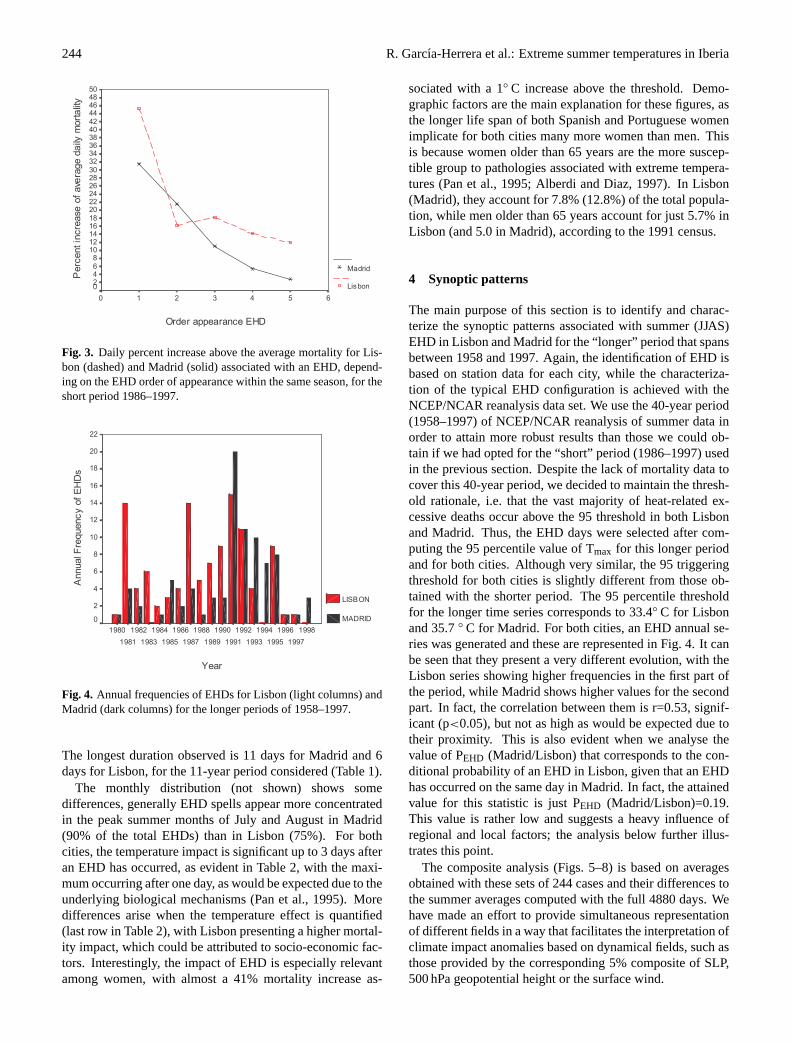
For Lisbon the results are qualitatively similar with 60.0deaths for EHDs and 50.3 for non-EHDs (difference is sig-nificant at p<0.05), women being responsible for 60% of thedifference. For this temperature-mortality study the analysishas to be restricted to the 1986–1997 period because thoseare the years with available data for both Lisbon and Madrid.Nevertheless, the Tmax distributions are rather different, ascan be seen in Fig. 2. The Madrid distribution is skewed tothe right while Lisbon’s corresponding distribution is skewedto the left. So there is not a simple shift in the same un-derlying distribution when we move from Lisbon to Madrid.While the difference, between both cities, in the mean is2.5◦ C the corresponding difference in the median is muchlarger, almost 3.7◦ C. Thus people in Madrid are really much
�
�
�
�
�
�
�
�
�
�
�
�
�
�
�
�
�
�
�
�
�
�
�
�
�
�
�
�
�
�
�
�
�
�
�
�
�
�
�
����
����
����
����
����
����
����
����
����
����
����
����
�� �����������������������
����������� ���!"�#�����"
$��
�����%�& �
���
���
���
���
���
���
��
��
��
��
�
��������
�!���'��
��������
�����!��
�'������
��������
�!���'��
����
�� �����������������������
(&��&����� ���!"�#�����
$��
�����%�& �
���
���
���
��
��
��
��
�
Fig. 2. Histograms of summer (JJAS) Tmax for Lisbon (upper pan-nel) and Madrid (lower pannel) for the short 1986–1997 period.
more accustomed to temperatures between 32◦ C and 38◦ Cthan in Lisbon. We believe that the similarity of both curvesin Fig. 1, above the triggering threshold, is very important,as it could be associated with the intrinsic capacity for pop-ulations to accommodate for specific local conditions. Theincrease in deaths above this threshold is associated with afailure in the thermal acclimation mechanisms (Khaw, 1995).This effect is also suggested by Fig. 3, which shows the im-pact associated with the EHD, depending on their order ofappearance within a given season. It can be seen that the firstevent of the season has the highest EHD impact, reflectingthe well-known fact (Dıaz et al., 2002a) that first heat eventsin the summer have a greater impact on the more susceptibleindividuals. The remaining and healthier population is thenless impacted by the next events. It must be emphasized (notshown) that the incidence of EHDs occurs mostly as isolatedevents, with the majority of the EHD spells lasting one ortwo consecutive days (72% in Madrid and 75% in Lisbon).
244 R. Garcıa-Herrera et al.: Extreme summer temperatures in Iberia
�
�
�
�
�
�
�
�
�
�
�
�
�
�
�
�
�
�
�
�
�
�
�
�
�
�
�
�
�
�
�
�
�
�
�
�
�
�
�
������������������
������
�����������������������������������������
����� ��������� ��������� ��������� ������� ���
�����
!��"��
Fig. 3. Daily percent increase above the average mortality for Lis-bon (dashed) and Madrid (solid) associated with an EHD, depend-ing on the EHD order of appearance within the same season, for theshort period 1986–1997.
�
�
�
�
�
�
�
�
�
�
�
�
�
�
�
�
�
�
�
�
�
�
�
�
�
�
�
�
�
�
�
�
�
�
�
�
�
�
�
����
����
����
���
���
����
����
���
����
����
����
����
����
���
���
����
����
���
����
����
������������������������
�
��
�
��
�
��
�
�
�
�� !"#
$��%��
Fig. 4. Annual frequencies of EHDs for Lisbon (light columns) andMadrid (dark columns) for the longer periods of 1958–1997.
The longest duration observed is 11 days for Madrid and 6days for Lisbon, for the 11-year period considered (Table 1).
The monthly distribution (not shown) shows somedifferences, generally EHD spells appear more concentratedin the peak summer months of July and August in Madrid(90% of the total EHDs) than in Lisbon (75%). For bothcities, the temperature impact is significant up to 3 days afteran EHD has occurred, as evident in Table 2, with the maxi-mum occurring after one day, as would be expected due to theunderlying biological mechanisms (Pan et al., 1995). Moredifferences arise when the temperature effect is quantified(last row in Table 2), with Lisbon presenting a higher mortal-ity impact, which could be attributed to socio-economic fac-tors. Interestingly, the impact of EHD is especially relevantamong women, with almost a 41% mortality increase as-
sociated with a 1◦ C increase above the threshold. Demo-graphic factors are the main explanation for these figures, asthe longer life span of both Spanish and Portuguese womenimplicate for both cities many more women than men. Thisis because women older than 65 years are the more suscep-tible group to pathologies associated with extreme tempera-tures (Pan et al., 1995; Alberdi and Diaz, 1997). In Lisbon(Madrid), they account for 7.8% (12.8%) of the total popula-tion, while men older than 65 years account for just 5.7% inLisbon (and 5.0 in Madrid), according to the 1991 census.
4 Synoptic patterns
The main purpose of this section is to identify and charac-terize the synoptic patterns associated with summer (JJAS)EHD in Lisbon and Madrid for the “longer” period that spansbetween 1958 and 1997. Again, the identification of EHD isbased on station data for each city, while the characteriza-tion of the typical EHD configuration is achieved with theNCEP/NCAR reanalysis data set. We use the 40-year period(1958–1997) of NCEP/NCAR reanalysis of summer data inorder to attain more robust results than those we could ob-tain if we had opted for the “short” period (1986–1997) usedin the previous section. Despite the lack of mortality data tocover this 40-year period, we decided to maintain the thresh-old rationale, i.e. that the vast majority of heat-related ex-cessive deaths occur above the 95 threshold in both Lisbonand Madrid. Thus, the EHD days were selected after com-puting the 95 percentile value of Tmax for this longer periodand for both cities. Although very similar, the 95 triggeringthreshold for both cities is slightly different from those ob-tained with the shorter period. The 95 percentile thresholdfor the longer time series corresponds to 33.4◦ C for Lisbonand 35.7◦ C for Madrid. For both cities, an EHD annual se-ries was generated and these are represented in Fig. 4. It canbe seen that they present a very different evolution, with theLisbon series showing higher frequencies in the first part ofthe period, while Madrid shows higher values for the secondpart. In fact, the correlation between them is r=0.53, signif-icant (p<0.05), but not as high as would be expected due totheir proximity. This is also evident when we analyse thevalue of PEHD (Madrid/Lisbon) that corresponds to the con-ditional probability of an EHD in Lisbon, given that an EHDhas occurred on the same day in Madrid. In fact, the attainedvalue for this statistic is just PEHD (Madrid/Lisbon)=0.19.This value is rather low and suggests a heavy influence ofregional and local factors; the analysis below further illus-trates this point.
The composite analysis (Figs. 5–8) is based on averagesobtained with these sets of 244 cases and their differences tothe summer averages computed with the full 4880 days. Wehave made an effort to provide simultaneous representationof different fields in a way that facilitates the interpretation ofclimate impact anomalies based on dynamical fields, such asthose provided by the corresponding 5% composite of SLP,500 hPa geopotential height or the surface wind.
R. Garcıa-Herrera et al.: Extreme summer temperatures in Iberia 245
�
�
�
�
�
�
�
�
�
�
�
�
�
�
�
�
�
�
�
�
�
�
�
�
�
�
�
�
�
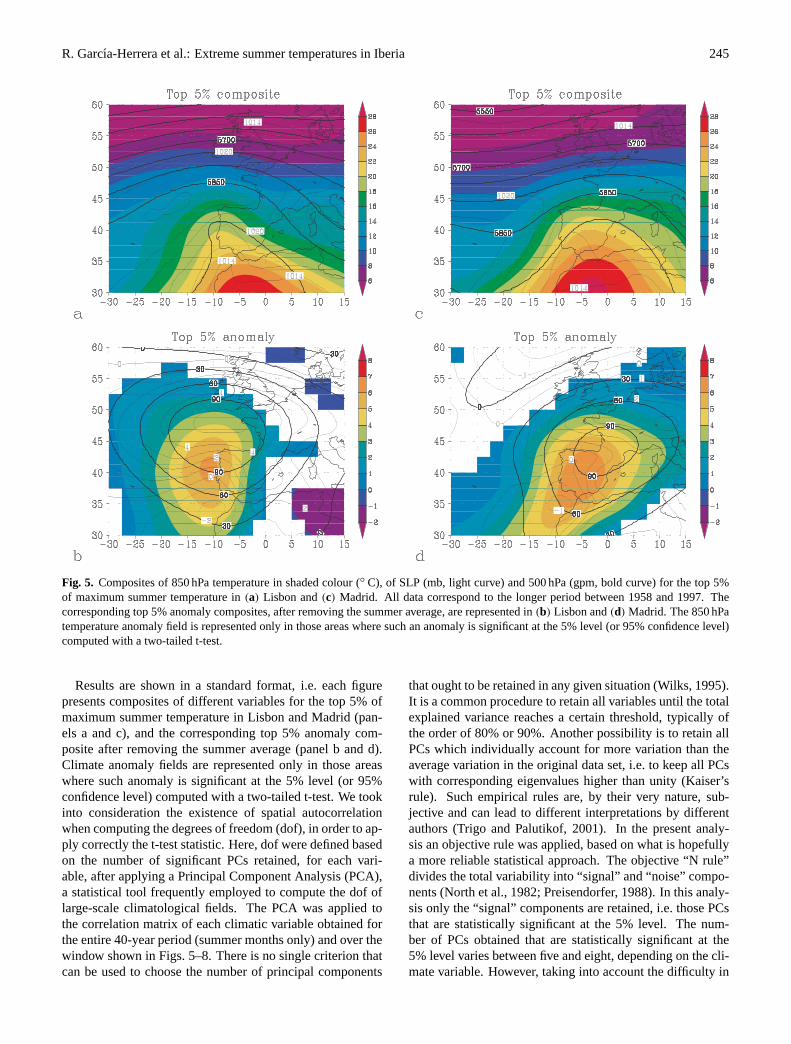
� Fig. 5. Composites of 850 hPa temperature in shaded colour (◦ C), of SLP (mb, light curve) and 500 hPa (gpm, bold curve) for the top 5%of maximum summer temperature in(a) Lisbon and(c) Madrid. All data correspond to the longer period between 1958 and 1997. Thecorresponding top 5% anomaly composites, after removing the summer average, are represented in(b) Lisbon and(d) Madrid. The 850 hPatemperature anomaly field is represented only in those areas where such an anomaly is significant at the 5% level (or 95% confidence level)computed with a two-tailed t-test.
Results are shown in a standard format, i.e. each figurepresents composites of different variables for the top 5% ofmaximum summer temperature in Lisbon and Madrid (pan-els a and c), and the corresponding top 5% anomaly com-posite after removing the summer average (panel b and d).Climate anomaly fields are represented only in those areaswhere such anomaly is significant at the 5% level (or 95%confidence level) computed with a two-tailed t-test. We tookinto consideration the existence of spatial autocorrelationwhen computing the degrees of freedom (dof), in order to ap-ply correctly the t-test statistic. Here, dof were defined basedon the number of significant PCs retained, for each vari-able, after applying a Principal Component Analysis (PCA),a statistical tool frequently employed to compute the dof oflarge-scale climatological fields. The PCA was applied tothe correlation matrix of each climatic variable obtained forthe entire 40-year period (summer months only) and over thewindow shown in Figs. 5–8. There is no single criterion thatcan be used to choose the number of principal components
that ought to be retained in any given situation (Wilks, 1995).It is a common procedure to retain all variables until the totalexplained variance reaches a certain threshold, typically ofthe order of 80% or 90%. Another possibility is to retain allPCs which individually account for more variation than theaverage variation in the original data set, i.e. to keep all PCswith corresponding eigenvalues higher than unity (Kaiser’srule). Such empirical rules are, by their very nature, sub-jective and can lead to different interpretations by differentauthors (Trigo and Palutikof, 2001). In the present analy-sis an objective rule was applied, based on what is hopefullya more reliable statistical approach. The objective “N rule”divides the total variability into “signal” and “noise” compo-nents (North et al., 1982; Preisendorfer, 1988). In this analy-sis only the “signal” components are retained, i.e. those PCsthat are statistically significant at the 5% level. The num-ber of PCs obtained that are statistically significant at the5% level varies between five and eight, depending on the cli-mate variable. However, taking into account the difficulty in
246 R. Garcıa-Herrera et al.: Extreme summer temperatures in Iberia
�
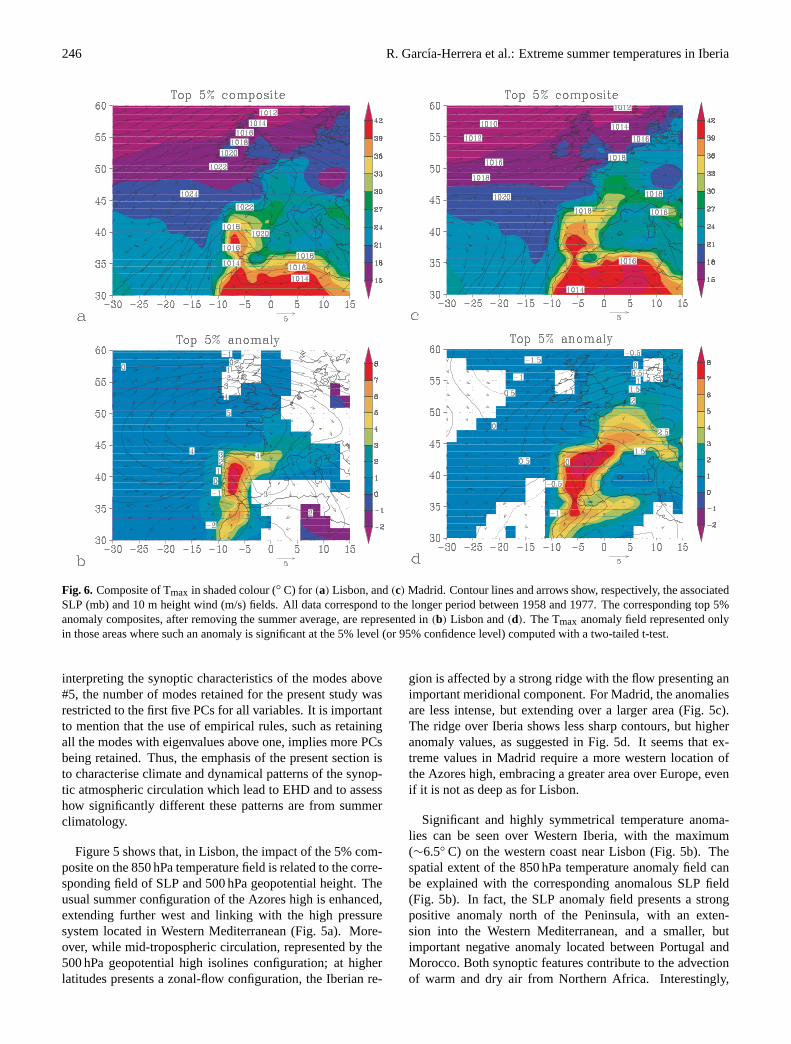
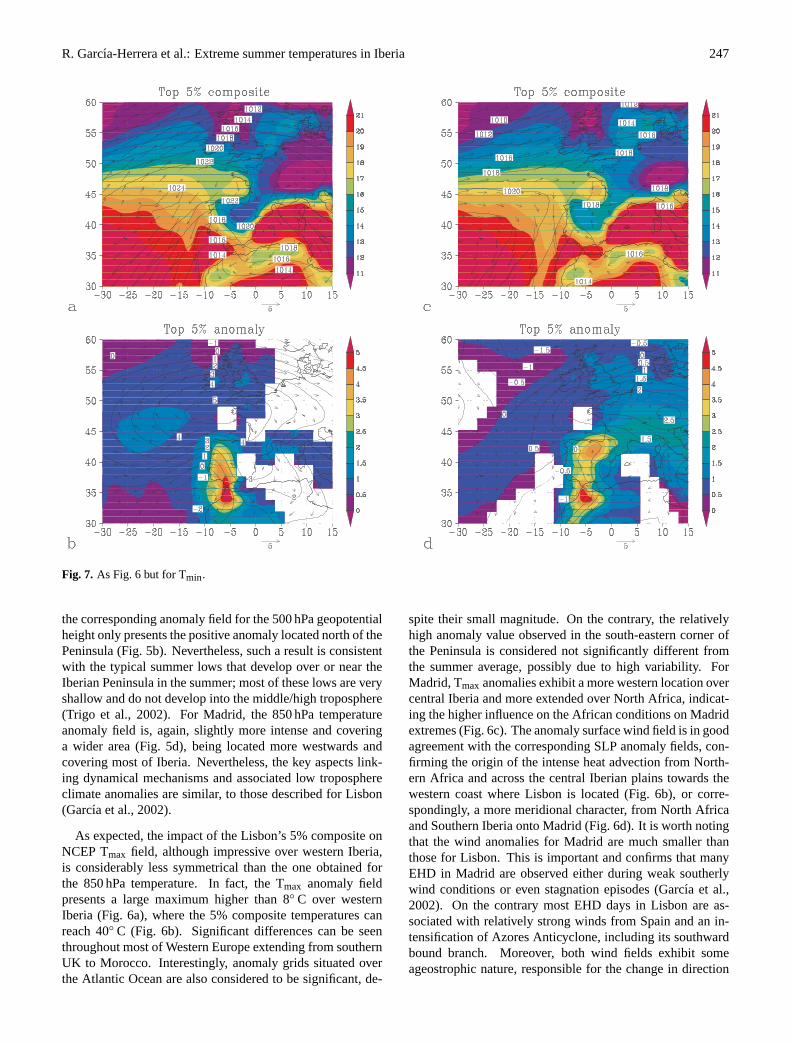
Fig. 6. Composite of Tmax in shaded colour (◦ C) for (a) Lisbon, and(c) Madrid. Contour lines and arrows show, respectively, the associatedSLP (mb) and 10 m height wind (m/s) fields. All data correspond to the longer period between 1958 and 1977. The corresponding top 5%anomaly composites, after removing the summer average, are represented in(b) Lisbon and(d). The Tmax anomaly field represented onlyin those areas where such an anomaly is significant at the 5% level (or 95% confidence level) computed with a two-tailed t-test.
interpreting the synoptic characteristics of the modes above#5, the number of modes retained for the present study wasrestricted to the first five PCs for all variables. It is importantto mention that the use of empirical rules, such as retainingall the modes with eigenvalues above one, implies more PCsbeing retained. Thus, the emphasis of the present section isto characterise climate and dynamical patterns of the synop-tic atmospheric circulation which lead to EHD and to assesshow significantly different these patterns are from summerclimatology.
Figure 5 shows that, in Lisbon, the impact of the 5% com-posite on the 850 hPa temperature field is related to the corre-sponding field of SLP and 500 hPa geopotential height. Theusual summer configuration of the Azores high is enhanced,extending further west and linking with the high pressuresystem located in Western Mediterranean (Fig. 5a). More-over, while mid-tropospheric circulation, represented by the500 hPa geopotential high isolines configuration; at higherlatitudes presents a zonal-flow configuration, the Iberian re-
gion is affected by a strong ridge with the flow presenting animportant meridional component. For Madrid, the anomaliesare less intense, but extending over a larger area (Fig. 5c).The ridge over Iberia shows less sharp contours, but higheranomaly values, as suggested in Fig. 5d. It seems that ex-treme values in Madrid require a more western location ofthe Azores high, embracing a greater area over Europe, evenif it is not as deep as for Lisbon.
Significant and highly symmetrical temperature anoma-lies can be seen over Western Iberia, with the maximum(∼6.5◦ C) on the western coast near Lisbon (Fig. 5b). Thespatial extent of the 850 hPa temperature anomaly field canbe explained with the corresponding anomalous SLP field(Fig. 5b). In fact, the SLP anomaly field presents a strongpositive anomaly north of the Peninsula, with an exten-sion into the Western Mediterranean, and a smaller, butimportant negative anomaly located between Portugal andMorocco. Both synoptic features contribute to the advectionof warm and dry air from Northern Africa. Interestingly,
R. Garcıa-Herrera et al.: Extreme summer temperatures in Iberia 247
�
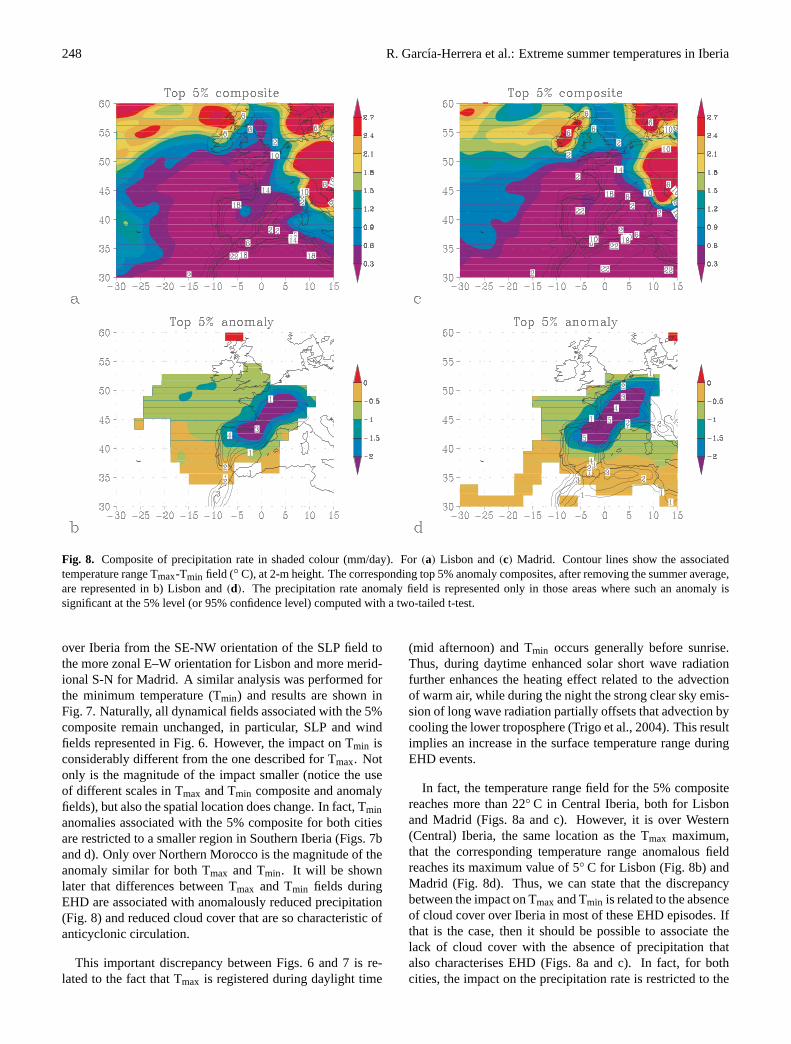
Fig. 7. As Fig. 6 but for Tmin.
the corresponding anomaly field for the 500 hPa geopotentialheight only presents the positive anomaly located north of thePeninsula (Fig. 5b). Nevertheless, such a result is consistentwith the typical summer lows that develop over or near theIberian Peninsula in the summer; most of these lows are veryshallow and do not develop into the middle/high troposphere(Trigo et al., 2002). For Madrid, the 850 hPa temperatureanomaly field is, again, slightly more intense and coveringa wider area (Fig. 5d), being located more westwards andcovering most of Iberia. Nevertheless, the key aspects link-ing dynamical mechanisms and associated low troposphereclimate anomalies are similar, to those described for Lisbon(Garcıa et al., 2002).
As expected, the impact of the Lisbon’s 5% composite onNCEP Tmax field, although impressive over western Iberia,is considerably less symmetrical than the one obtained forthe 850 hPa temperature. In fact, the Tmax anomaly fieldpresents a large maximum higher than 8◦ C over westernIberia (Fig. 6a), where the 5% composite temperatures canreach 40◦ C (Fig. 6b). Significant differences can be seenthroughout most of Western Europe extending from southernUK to Morocco. Interestingly, anomaly grids situated overthe Atlantic Ocean are also considered to be significant, de-
spite their small magnitude. On the contrary, the relativelyhigh anomaly value observed in the south-eastern corner ofthe Peninsula is considered not significantly different fromthe summer average, possibly due to high variability. ForMadrid, Tmax anomalies exhibit a more western location overcentral Iberia and more extended over North Africa, indicat-ing the higher influence on the African conditions on Madridextremes (Fig. 6c). The anomaly surface wind field is in goodagreement with the corresponding SLP anomaly fields, con-firming the origin of the intense heat advection from North-ern Africa and across the central Iberian plains towards thewestern coast where Lisbon is located (Fig. 6b), or corre-spondingly, a more meridional character, from North Africaand Southern Iberia onto Madrid (Fig. 6d). It is worth notingthat the wind anomalies for Madrid are much smaller thanthose for Lisbon. This is important and confirms that manyEHD in Madrid are observed either during weak southerlywind conditions or even stagnation episodes (Garcıa et al.,2002). On the contrary most EHD days in Lisbon are as-sociated with relatively strong winds from Spain and an in-tensification of Azores Anticyclone, including its southwardbound branch. Moreover, both wind fields exhibit someageostrophic nature, responsible for the change in direction
248 R. Garcıa-Herrera et al.: Extreme summer temperatures in Iberia
�
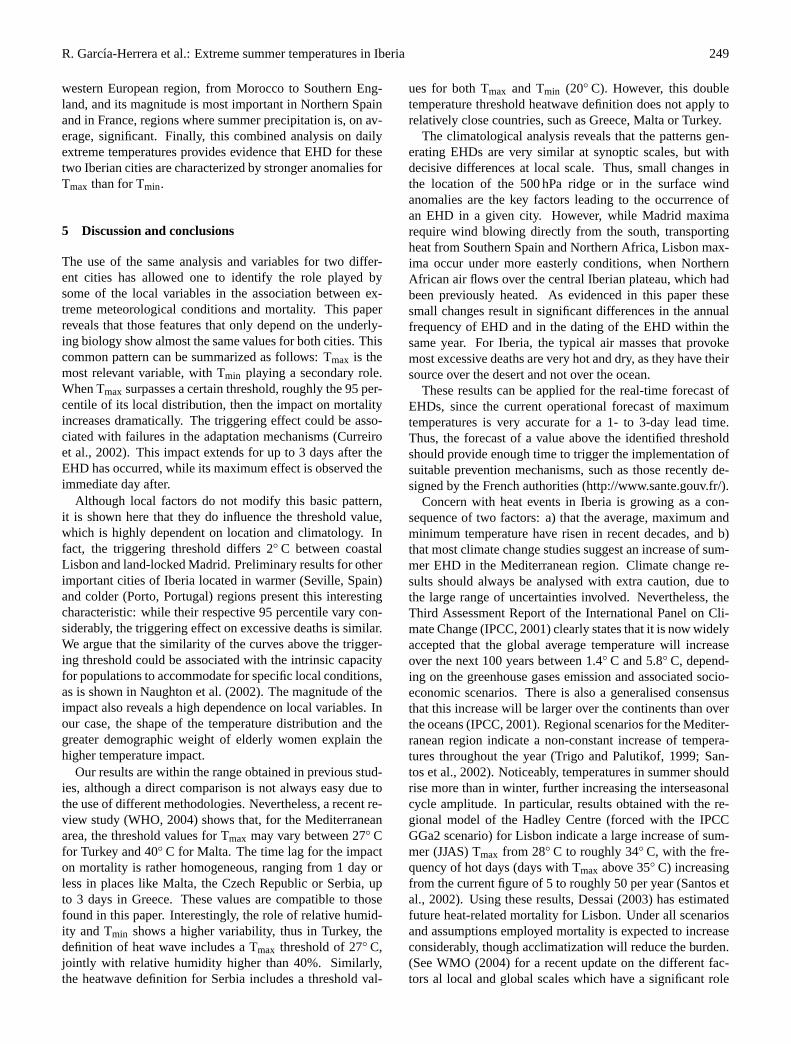
Fig. 8. Composite of precipitation rate in shaded colour (mm/day). For(a) Lisbon and(c) Madrid. Contour lines show the associatedtemperature range Tmax-Tmin field (◦ C), at 2-m height. The corresponding top 5% anomaly composites, after removing the summer average,are represented in b) Lisbon and(d). The precipitation rate anomaly field is represented only in those areas where such an anomaly issignificant at the 5% level (or 95% confidence level) computed with a two-tailed t-test.
over Iberia from the SE-NW orientation of the SLP field tothe more zonal E–W orientation for Lisbon and more merid-ional S-N for Madrid. A similar analysis was performed forthe minimum temperature (Tmin) and results are shown inFig. 7. Naturally, all dynamical fields associated with the 5%composite remain unchanged, in particular, SLP and windfields represented in Fig. 6. However, the impact on Tmin isconsiderably different from the one described for Tmax. Notonly is the magnitude of the impact smaller (notice the useof different scales in Tmax and Tmin composite and anomalyfields), but also the spatial location does change. In fact, Tminanomalies associated with the 5% composite for both citiesare restricted to a smaller region in Southern Iberia (Figs. 7band d). Only over Northern Morocco is the magnitude of theanomaly similar for both Tmax and Tmin. It will be shownlater that differences between Tmax and Tmin fields duringEHD are associated with anomalously reduced precipitation(Fig. 8) and reduced cloud cover that are so characteristic ofanticyclonic circulation.
This important discrepancy between Figs. 6 and 7 is re-lated to the fact that Tmax is registered during daylight time
(mid afternoon) and Tmin occurs generally before sunrise.Thus, during daytime enhanced solar short wave radiationfurther enhances the heating effect related to the advectionof warm air, while during the night the strong clear sky emis-sion of long wave radiation partially offsets that advection bycooling the lower troposphere (Trigo et al., 2004). This resultimplies an increase in the surface temperature range duringEHD events.
In fact, the temperature range field for the 5% compositereaches more than 22◦ C in Central Iberia, both for Lisbonand Madrid (Figs. 8a and c). However, it is over Western(Central) Iberia, the same location as the Tmax maximum,that the corresponding temperature range anomalous fieldreaches its maximum value of 5◦ C for Lisbon (Fig. 8b) andMadrid (Fig. 8d). Thus, we can state that the discrepancybetween the impact on Tmaxand Tmin is related to the absenceof cloud cover over Iberia in most of these EHD episodes. Ifthat is the case, then it should be possible to associate thelack of cloud cover with the absence of precipitation thatalso characterises EHD (Figs. 8a and c). In fact, for bothcities, the impact on the precipitation rate is restricted to the
R. Garcıa-Herrera et al.: Extreme summer temperatures in Iberia 249
western European region, from Morocco to Southern Eng-land, and its magnitude is most important in Northern Spainand in France, regions where summer precipitation is, on av-erage, significant. Finally, this combined analysis on dailyextreme temperatures provides evidence that EHD for thesetwo Iberian cities are characterized by stronger anomalies forTmax than for Tmin.
5 Discussion and conclusions
The use of the same analysis and variables for two differ-ent cities has allowed one to identify the role played bysome of the local variables in the association between ex-treme meteorological conditions and mortality. This paperreveals that those features that only depend on the underly-ing biology show almost the same values for both cities. Thiscommon pattern can be summarized as follows: Tmax is themost relevant variable, with Tmin playing a secondary role.When Tmax surpasses a certain threshold, roughly the 95 per-centile of its local distribution, then the impact on mortalityincreases dramatically. The triggering effect could be asso-ciated with failures in the adaptation mechanisms (Curreiroet al., 2002). This impact extends for up to 3 days after theEHD has occurred, while its maximum effect is observed theimmediate day after.
Although local factors do not modify this basic pattern,it is shown here that they do influence the threshold value,which is highly dependent on location and climatology. Infact, the triggering threshold differs 2◦ C between coastalLisbon and land-locked Madrid. Preliminary results for otherimportant cities of Iberia located in warmer (Seville, Spain)and colder (Porto, Portugal) regions present this interestingcharacteristic: while their respective 95 percentile vary con-siderably, the triggering effect on excessive deaths is similar.We argue that the similarity of the curves above the trigger-ing threshold could be associated with the intrinsic capacityfor populations to accommodate for specific local conditions,as is shown in Naughton et al. (2002). The magnitude of theimpact also reveals a high dependence on local variables. Inour case, the shape of the temperature distribution and thegreater demographic weight of elderly women explain thehigher temperature impact.
Our results are within the range obtained in previous stud-ies, although a direct comparison is not always easy due tothe use of different methodologies. Nevertheless, a recent re-view study (WHO, 2004) shows that, for the Mediterraneanarea, the threshold values for Tmax may vary between 27◦ Cfor Turkey and 40◦ C for Malta. The time lag for the impacton mortality is rather homogeneous, ranging from 1 day orless in places like Malta, the Czech Republic or Serbia, upto 3 days in Greece. These values are compatible to thosefound in this paper. Interestingly, the role of relative humid-ity and Tmin shows a higher variability, thus in Turkey, thedefinition of heat wave includes a Tmax threshold of 27◦ C,jointly with relative humidity higher than 40%. Similarly,the heatwave definition for Serbia includes a threshold val-
ues for both Tmax and Tmin (20◦ C). However, this doubletemperature threshold heatwave definition does not apply torelatively close countries, such as Greece, Malta or Turkey.
The climatological analysis reveals that the patterns gen-erating EHDs are very similar at synoptic scales, but withdecisive differences at local scale. Thus, small changes inthe location of the 500 hPa ridge or in the surface windanomalies are the key factors leading to the occurrence ofan EHD in a given city. However, while Madrid maximarequire wind blowing directly from the south, transportingheat from Southern Spain and Northern Africa, Lisbon max-ima occur under more easterly conditions, when NorthernAfrican air flows over the central Iberian plateau, which hadbeen previously heated. As evidenced in this paper thesesmall changes result in significant differences in the annualfrequency of EHD and in the dating of the EHD within thesame year. For Iberia, the typical air masses that provokemost excessive deaths are very hot and dry, as they have theirsource over the desert and not over the ocean.
These results can be applied for the real-time forecast ofEHDs, since the current operational forecast of maximumtemperatures is very accurate for a 1- to 3-day lead time.Thus, the forecast of a value above the identified thresholdshould provide enough time to trigger the implementation ofsuitable prevention mechanisms, such as those recently de-signed by the French authorities (http://www.sante.gouv.fr/).
Concern with heat events in Iberia is growing as a con-sequence of two factors: a) that the average, maximum andminimum temperature have risen in recent decades, and b)that most climate change studies suggest an increase of sum-mer EHD in the Mediterranean region. Climate change re-sults should always be analysed with extra caution, due tothe large range of uncertainties involved. Nevertheless, theThird Assessment Report of the International Panel on Cli-mate Change (IPCC, 2001) clearly states that it is now widelyaccepted that the global average temperature will increaseover the next 100 years between 1.4◦ C and 5.8◦ C, depend-ing on the greenhouse gases emission and associated socio-economic scenarios. There is also a generalised consensusthat this increase will be larger over the continents than overthe oceans (IPCC, 2001). Regional scenarios for the Mediter-ranean region indicate a non-constant increase of tempera-tures throughout the year (Trigo and Palutikof, 1999; San-tos et al., 2002). Noticeably, temperatures in summer shouldrise more than in winter, further increasing the interseasonalcycle amplitude. In particular, results obtained with the re-gional model of the Hadley Centre (forced with the IPCCGGa2 scenario) for Lisbon indicate a large increase of sum-mer (JJAS) Tmax from 28◦ C to roughly 34◦ C, with the fre-quency of hot days (days with Tmax above 35◦ C) increasingfrom the current figure of 5 to roughly 50 per year (Santos etal., 2002). Using these results, Dessai (2003) has estimatedfuture heat-related mortality for Lisbon. Under all scenariosand assumptions employed mortality is expected to increaseconsiderably, though acclimatization will reduce the burden.(See WMO (2004) for a recent update on the different fac-tors al local and global scales which have a significant role
250 R. Garcıa-Herrera et al.: Extreme summer temperatures in Iberia
in the association between mortality and extreme tempera-tures.) Besides the large uncertainties associated with thescenarios of Tmax increases, we must keep in mind the longtime-span involved for these changes to take place (∼100years).
It is a reasonable assumption to expect a slow, but effectiveadaptation capability from the affected populations, to ac-commodate these changes, thus diminishing considerably theassociated hazardous health effects. Nevertheless, it is alsoreasonable to expect that the increase in frequency of dayswith Tmax above 38◦ C in Lisbon and Madrid will inducesome impact on the health of both cities’ populations. How-ever, the definition of EHD used throughout this work is aflexible one, it adapts to specific local conditions (that is whythe triggering threshold is so different between Madrid andLisbon) and it should adapt to slow climate changes withinthe same location. For example, the shift of the entire Tmaxdistribution for Lisbon by 2◦ C or 3◦ C will inevitably im-plicate a new 95 percentile threshold (e.g. from 34.5◦ C to37◦ C), but it will maintain the number of EHD with Tmaxabove that threshold (5%).
The results of this paper show that the forecast of maxi-mum temperatures is not enough to obtain a realistic assess-ment of the human health impact of extreme temperatureson future climate scenarios, which would require one to takeinto account the following points:
1. Distribution of extreme temperatures, since they deter-mine the threshold for the triggering effect and the mag-nitude of the impact.
2. Economic scenarios, which allow one to infer the use ofdomestic equipment, such as air conditioning.
3. Demographic scenarios, especially the proportion ofwomen older than 65 years.
4. Local meteorological conditions vs. synoptic patterns,to obtain realistic downscaling schemes.
5. Mitigation due to acclimation mechanisms, mostly re-lated to the speed of the temperature change.
Despite the large uncertainties involved throughout the com-plex process of climate scenario construction, they should beseriously considered by both countries’ public health author-ities, since in any case this will be a growing public healthproblem.
Acknowledgements.NCEP/NCAR reanalysis data were obtainedfrom the Climate Prediction Centre. The Atlantic-European win-dow used here was kindly provided by Ian Harris and David Vinerfrom the Climatic Research Unit. The authors would like to ac-knowledge Isabel Trigo from CGUL for helpful suggestions on aearlier version of this paper. Spanish Instituto Nacional de Meteo-rologıa provided Meteorological data from Madrid. Two anonimousreviewers provided helpful comments which improved considerablythe original manuscript.
Topical Editor O. Boucher thanks two referees for their help inevaluating this paper.
References
Alberdi, J. C. and Dıaz, J. : Modelizacion de la mortalidad diariaen la Comunidad Autonoma de Madrid (1986–1991). Gac Sanit,11, 9–15, 1997.
Alberdi, J. C., Dıaz, J., Montero, J. C., and Miron, I. J.: DailyMortality in Madrid Community (Spain) 1986–1991: Relation-ship with atmospheric variables. Eur. J. Epidemiol, 14, 571–578,1998.
Box, G. E., Jenkins, G. M., and Reinsel, C.: Time Series Analysis.Forecasting and Control. Englewood. Prentice Hall, 1994.
Curreiro, F. C., Heiner, K. S., Samet, J. M., Zeger, S. L., Strug, L.,Patz, J. A.: Temperature and mortality in 11 cities of the Easternof the United States. Am. J. Epidemiol, 155, 80–87, 2002.
Davis, R. E., Knappenberger, P. C., Michaels, P. J. and Novicoff, W.M. et al.: Changing Heat-related Mortality in the United States,Environ. Health Perspec., 111, 1712–1718, 2003.
Davis, R. E., Davis, R. E., Knappenberger, P. C., Michaels, P. J.,and Novicoff, W. M. : Seasonality of climate-human mortalityrelationships in US cities and impacts of climate change. Clim.Res., 26, 61–76. 2004.
Dessai, S.: Heat stress and mortality in Lisbon. Part I: model con-struction and validation. Int. J. Biometeorol. 47, 6–12, 2002.
Dessai S.: Heat stress and mortality in Lisbon. Part II: an assess-ment of the potential impacts of climate change. Int. J. Biomete-orol. 48, 37–44, 2003.
Dıaz, J., Garcıa, R., Ribera, P., and Alberdi, J. C. et al.: A Modellingof Air Pollution and its Relationship with Mortality and Morbid-ity in Madrid (Spain). Int. Arch. Occ. Env. Health, 72, 366–376,1999.
Dıaz, J., Lopez, C., Alberdi, J. C., Jordan, A., Garcıa, R.,Hernandez, E., and Otero, A.: Heat Waves in Madrid, 1986-1997: Effects on the health of the elderly. Int. Arch. Occ. Env.Health. 75, 163–170, 2002a.
Dıaz, J., Garcıa, R., Velazquez de Castro, F., Hernandez, E., Lopez,C., and Otero, A.: Effects of extremely hot days on people olderthan 65 years in Seville (Spain) from 1986 to 1997. Int. J. Biome-teorol, 46, 145–149, 2002b.
Donaldson, G. C., Keatinge, W. R., and Nayha, S. et al.: Changesin summer temperature and heat-related mortality since 1971 inNorth Carolina, South Finland, and Southeast England. Environ.Res., 91, 1–7, 2003.
Frich, P., Alexander, L. V., Della-Marta, P., Gleason, P., Haylock,M., Klein Tank, A. M. G, and Peterson, T.: Observed coherentchanges in climatic extremes during the second half of the twen-tieth century. Climate Res., 19, 193–212, 2002.
Garcıa R, Prieto, L., Dıaz, J., Hernandez, E., and del Teso, T.: Syn-optic condition leading extremely high temperatures in Madrid.Ann. Geophys., 20, 237–245, 2002.
Greene, J. S. and Kalkstein, L. S.: Quantitative analysis of sum-mer air masses in the eastern United States and an application tohuman mortality. Climate Res., 7, 43–53, 1996.
Grynszpan, D.: Lessons from the French heatwave. Lancet, 362,1169–1170, 2004.
Guest, C. S., Wilson, K., Woodward, A., Hennessy, K., Kalkstein,L. S., Skinner, C., and McMichael, A. J.: Climate and mortal-ity in Australia: retrospective study, 1979–1990 and predictedimpacts in five major cities. Climate Res., 13, 1–15, 1999.
Huynen, M. M., Martens, P., Schram, D., Weijenberg, M. P., andKunst, A. E.: The impact of the heat waves and cold spells onmortality rates in the Dutch population. Environ Health Persp.,109, 463–470, 2001.
R. Garcıa-Herrera et al.: Extreme summer temperatures in Iberia 251
IPCC. Climate Change 2001: the scientific basis. Cambridge Uni-versity Press, Cambridge, UK, 881, 2001.
Kalnay, E., Kanamitsu, M., Kistler, R., Colins, W., Deaven, D.,Gandin, L., Iredell, M., Saha, S., White, G., Wollen, J., Zhu,Y., Cheliqh, M., Ebisuzaki, W., Higgins, W., Janowiak, J., Mo,K. C., Ropelewski, C., Wang, J., Leetmaa, A., Reynolds, R.,and Jenne, J. D.: The NCEP/NCAR 40-years reanalyses project.Bull. Am. Meteorol. Soc., 77, 437–471, 1996.
Kalkstein, L. S.: A new approach to evaluate the impact of cli-mate on human mortality. Environ. Health Perspect., 96, 145–150, 1991.
Kalkstein, L. S. and Smoyer, K.: The impact of climate change onhuman health: some international implications. Experientia, 49,469–479, 1993.
Kalkstein, L. S., Jamason, P. F., Greene, J. S., Libby, J., and Robin-son, L.: The Philadelphia Hot Weather-Health Watch/WarningSystem: Development and Application, Summer 1995. Bull.Am. Meteorol. Soc., 77, 1519–1528, 1996.
Karl, T. R., Jones, P. D., Knight, R. W., Kukla, G., Plummer, N.,Razuvayev, V., Gallo, K., Lindseay, J., Charlson, R. J., and Peter-son, T. C.: Asymmetric trends of daily maximum and minimumtemperature. Bull. Am. Meteorol. Soc., 74, 1007–1023, 1993.
Keatinge, W. R., Donaldson, G. C., and Cardioli, E. et al.: Heatrelated mortality in warm and cold regions of Europe: observa-tional study. Brit. Med. J., 321, 670–673, 2000.
Kelsall, J. E., Samet, J. M., and Zeger, S. L.: Air Pollution andmortality in Philadelphia, 1974–1988. Am. J. Epidemiol, 146,750–762, 1997.
Khaw, K. T.: Temperature and cardiovascular mortality. Lancet,345, 337–338, 1995.
Klein-Tank, A. M. G., Wijngaard, J. B., Konnen et al.: Daily datasetof 20th-century surface air temperature and precipitation seriesfor the European Climate Assessment. Int. J. Climatol, 22, 1441–1453, 2002.
Koppe, C., Kovasts, S., Jendritzky, G., and Menne, B. et al.: Heat-waves: risks and responses. WHO Health and Global Environ-mental Change Serie n◦ 2. WHO Geneva, 123, 2004.
Kunst, A. E., Looman, C. W. N., and Mackenbach, J. P.: OutdoorAir Temperature and Mortality in the Netherlands. A time-seriesanalysis. Am. J. Epidemiol, 137, 331–341, 1993.
Laschewski, G. and Jendritzky, G.: Effects of the thermal environ-ment on human health: an investigation of 30 years of daily mor-tality data from SW Germany. Climate Res., 21, 91–103, 2002.
Luterbacher, J., Dietrich, D., Xoplaki, E., Grosjean, M., and Wan-ner, H.: European seasonal and annual temperature variability,tends and extremes since 1500 A. D., Science, 3, 1499–1503,2004.
Makridakis, S., Wheelwright, S. C., and McGee, V. E.: ForecastingMethods and Applications. Wiley and Sons. S. Francisco. 1983.
Martens, W. J. M.: Climate change, thermal stress and mortalitychanges. Soc. Sci. Med., 46, 331–344, 1998.
McGeehin, M. A. and Mirabelli, M.: The potential impacts of cli-mate variability and change on temperature-related morbidityand mortality in the United States. Environ Health Persp., 109,185–189, 2001.
McGregor, G. R.: Winter ischaemic heart disease deaths in Birm-ingham, United Kingdom: a synoptic climatological analysis.Climate Res., 13, 17–31, 1999.
Montero, J. C., Miron, I. J., Dıaz, J., Alberdi, J.C.: Influencia devariables atmosfericas sobre la mortalidad por enfermedades res-piratorias y cardiovasculares en los mayores de 65 anos en la Co-munidad de Madrid. Gac. Sanit. 11, 164–170, 1997.
Nakai, S., Itoh, T., and Morimoto, T.: Deaths from Heat-stroke inJapan: 1968–1994. Int. J. Biometeorol., 43, 124–127, 1999.
Naughton, M. P., Henderson, A., Mirabelli, M. C., and Kaiser, R. etal.: Heat-related mortality during a 1999 heat wave in Chicago.Am. J. Prev. Med., 22, 221–227, 2002.
North, G. R., Bell, T. L., Cahalan, R. F., and Moeng, F. J.: Samplingerrors in the estimation of empirical orthogonal functions. Mon.Weather Rev., 110, 699–706, 1982.
Pan, W. H., Li, L. A., and Tsai, M. J.: Temperature Extremes andMortality from Coronary Heart Disease and Cerebral Infarctionin Elderly Chinese. Lancet 345, 353–355, 1995.
Pardo, A. and Ruiz, M. A.: SPSS11. Guıa para el analisis de datos.Ed. McGrawhill, Madrid 2002.
Preisendorfer, R. W.: Principal Component Analysis in Meteorol-ogy and Oceanography. Developments in Atmospheric Science,17, Elsevier, 1988.
Saez, M., Sunyer, J., Castellsague, J., Murillo, C., Anto, J. M.: Rela-tionship between Weather Temperature and Mortality: A time se-ries analysis approach in Barcelona. Int. J. Epidemiol., 24, 576–582, 1995.
Santos, F. D., Forbes, K., and Moita, R.: Climate Change inPortugal. Scenarios, impacts and Adaptaion Measures – SIAM.Gradiva, Lisbon, 2002.
Sartor, F., Snacken, R., Demuth, C., and Walkiers, D.: Temperature,Ambient Ozone Levels and Mortality during Summer 1994 inBelgium. Environ. Res., 70, 105–113, 1995.
Schar, C., Vidale, P. L., Luthi, D., Frei, C., Haberli, C., Lin-iger, M. A., and Appenzeller, C.: The role of increasing tem-perature variability in European summer heatwaves, Nature,doi:10.1038/nature02300, 2004.
Smoyer, K. E.: A Comparative Analysis of Heat-wave AssociatedMortality in St. Louis, Missouri-1980 and 1995. Int. J. Biomete-orol., 42, 44–50, 1998.
Tobıas, A., Dıaz, J., Saez, M., and Alberdi, J. C.: Use of Poissonregression and Box-Jenkins models to evaluate the short-term ef-fects of environmental noise levels on daily emergency admis-sions in Madrid, Spain. Eur. J. Epidemiol., 17, 765–771, 2001.
Trigo, R. M. and Palutikof, J. P.: Simulation of daily temperaturesfor climate change detection over Portugal: A neural networkmodel approach. Climate Res., 13, 45–49, 1999.
Trigo, I. F., Bigg, G. R., and Davies, T. D.: Climatology of cyclo-genesis in the Mediterranean. Mon. Weather Rev., 130, 549–569,2002.
Trigo, R. M. and Palutikof, J. P.: Precipitation scenarios over Iberia:a comparison between direct GCM output and different down-scaling techniques. J. Climate, 14, 4422–4446, 2001.
Trigo, R. M., Trigo, I. F., DaCamara, C. C., and Osborn, T. J.: Cli-mate impact of the European winter blocking episodes from theNCEP/NCAR Reanalyses. Climate Dynamics, 23, 17–28, 2004.
Ungar, S.: Is Strange Weather in the Air? A Study of U.S. NationalNetwork News Coverage of Extreme Weather Events. Climatic.Change, 41, 133–150, 1999.
Wilks, D. S.: Statistical Methods in the Atmospheric Sciences: anintroduction. Intern. Geophy. Ser., 59, Academic Press, 1995.
WHO Heat-waves: risks and responses. Health and Environmentlchange. WHO Series N◦ 2, Geneva, 2004.