extraction of zinc from highly saline and acidic solutions
TRANSCRIPT

Extraction of zinc from highly saline and
acidic solutions
Master Thesis in Chemistry
Željka Rašković-Lovre
Department of Chemistry
Faculty of Mathematics and Natural Sciences
UNIVERSITY OF OSLO
April 2019

II
© Željka Rašković-Lovre
2019
Extraction of zinc from highly saline and acidic solutions
Željka Rašković-Lovre
http://www.duo.uio.no/
Printed at Reprosentralen, Universitetet i Oslo

III
Abstract
The aim of this project was to investigate zinc extraction processes where various
types of extractants were applied on industrial stock and synthetic laboratory-prepared
solutions. One of the goals was to study chemical reactions behind the extraction and to
develop extraction mechanism. Finding parameters and extractants which can give very
good selectivity factor of zinc over cobalt was also part of the work.
The zinc separation study was conducted on synthetic solutions prepared in the
laboratory using liquid/ liquid separation technique. Two radiotracers were used- 65Zn
and 60Co, in order to track distribution of the metals between organic and aqueous phases.
The extraction of zinc and the selectivity between zinc and cobalt were investigated in
solutions containing different chloride concentration. Several solvent extraction agents
were tested, such as TBP (tri-butylphosphate), CYANEX 923 with TOPO as an active
component (tri-octylphosphine oxide) as well as cat- and anionic extractants. In addition,
effects in changes of concentrations of extractants were recorded.
Afterwards, CYANEX 923 and CYANEX 272 were chosen to be tested on a stock
solution. The stock solution, supplied by Glencore Nikkelverk, Kristiansand, Norway,
contained various metals dissolved in highly saline chloride-based media. The utilization
of the extractants was based on the characteristics and capabilities shown in the previous
experiments conducted on the synthetic solutions. The same separation technique and
parameters were maintained. Results of a comparison of the two systems are presented
in this thesis.

IV
Acknowledgement
This project was just a small piece of a large “Hydromet” project where University
of Oslo was one of the collaborators. Jon Petter Omtvedt, the head of the Nuclear
Chemistry gave me an opportunity to be a part of his group where I gained a lot of hands-
on experience and knowledge needed to conduct the research and perform experiments.
Therefore, I would like to thank him for all the trainings and discussions during my work.
Special thanks to my co-supervisor, Dag Øistein Eriksen for all his help and time dedicated
listening to all the troubles and doubts and be involved in back and forth steps during my
work and outcomes related to this project.
I would especially like to thank to Hans V. Lerum for always being available to help,
discuss and listen to all my bad, and I guess, some good ideas. I appreciate all the
suggestions and solutions he proposed to me.
I would like to thank Glencore Nikkelverk for providing the sample and letting me
be part of the research.
Thanks to my fellow students and friends for unlimited time and support.
I dedicate this work to Eva R. - this step would be impossible to make without your
smile. Thank you.
V
Table of contents
Abstract ............................................................................................................................................... III
Acknowledgement .......................................................................................................................... IV
Table of contents ............................................................................................................................... V
1 Introduction ................................................................................................................................. 1
1.1 Scarcity of metals – a reason to recover them ....................................................... 1
1.2 Motivation and aim of the project .............................................................................. 4
1.3 Thesis Outline ..................................................................................................................... 5
2 Theoretical part .......................................................................................................................... 6
2.1 Solvent extraction ............................................................................................................. 6
2.2 Complexation of metal ions .......................................................................................... 7
2.3 Complexation with ammonia ligand .......................................................................... 8
2.4 Solvent extraction in industrial processes .............................................................. 9
2.5 Type of solvent agents ................................................................................................. 12
2.6 Acidic extractants .......................................................................................................... 13
2.6.1 CYANEX 272 (Bis(2, 4, 4 – trimethylpentyl) phosphinic acid) ............. 14
2.7 Basic extractants ............................................................................................................ 15
2.7.1 Aliquat 336 (Trioctylmethylammonium chloride) .................................... 15
2.7.2 Primene JM – T (16,16-dimethylheptadecan-1-amine) ........................... 15
2.8 Solvating extractants .................................................................................................... 15
2.8.1 CYANEX 923 (A mixture of Trihexylphospine oxide, dihexylmonooctylphosphine oxide, dioctylmonohexylphosphine and trioctylphosphine oxide) .................................................................................................................. 16
2.8.2 TBP (Tributyl phosphate) ................................................................................... 16
2.9 Application of radiotracers in separation technology ..................................... 17
2.9.1 Detection of radioactivity .................................................................................... 18
3 Experimental part .................................................................................................................. 19
3.1 Preparation of radiotracers ....................................................................................... 19
3.2 High purity germanium detector - HPGe .............................................................. 19
3.2.1 Maestro Multichannel Analyzer Emulation Software ............................... 19
3.3 Preparation of aqueous phase .................................................................................. 20
3.4 Preparation of organic phase .................................................................................... 21
3.5 pH measurements .......................................................................................................... 21
3.5.1 Uncertainty of the pH measurement ............................................................... 21
3.6 Solvent extraction .......................................................................................................... 22

VI
3.7 Calculation and presentation of chemical equilibrium diagrams ............... 23
4 Results and discussion .......................................................................................................... 24
4.1 Speciation of zinc species in chloride media ....................................................... 24
4.2 Speciation of cobalt species in chloride media ................................................... 26
4.3 Basic extractants ............................................................................................................ 26
4.4 Solvating extractants .................................................................................................... 28
4.4.1 CYANEX 923 .............................................................................................................. 28
4.4.2 Slope analysis ........................................................................................................... 32
4.5 Speciation of zinc species in ammoniacal media and combined chloro-ammoniacal media .................................................................................................................................. 37
4.6 CYANEX 272 ..................................................................................................................... 41
4.6.1 Effect of pH ................................................................................................................ 41
4.6.2 Slope analysis ........................................................................................................... 45
4.6.3 Future work with CYANEX 272 ......................................................................... 51
5 Conclusion ................................................................................................................................. 52
6 Appendix .................................................................................................................................... 54
7 Literature ................................................................................................................................... 75
1
1 Introduction
1.1 Scarcity of metals – a reason to recover them
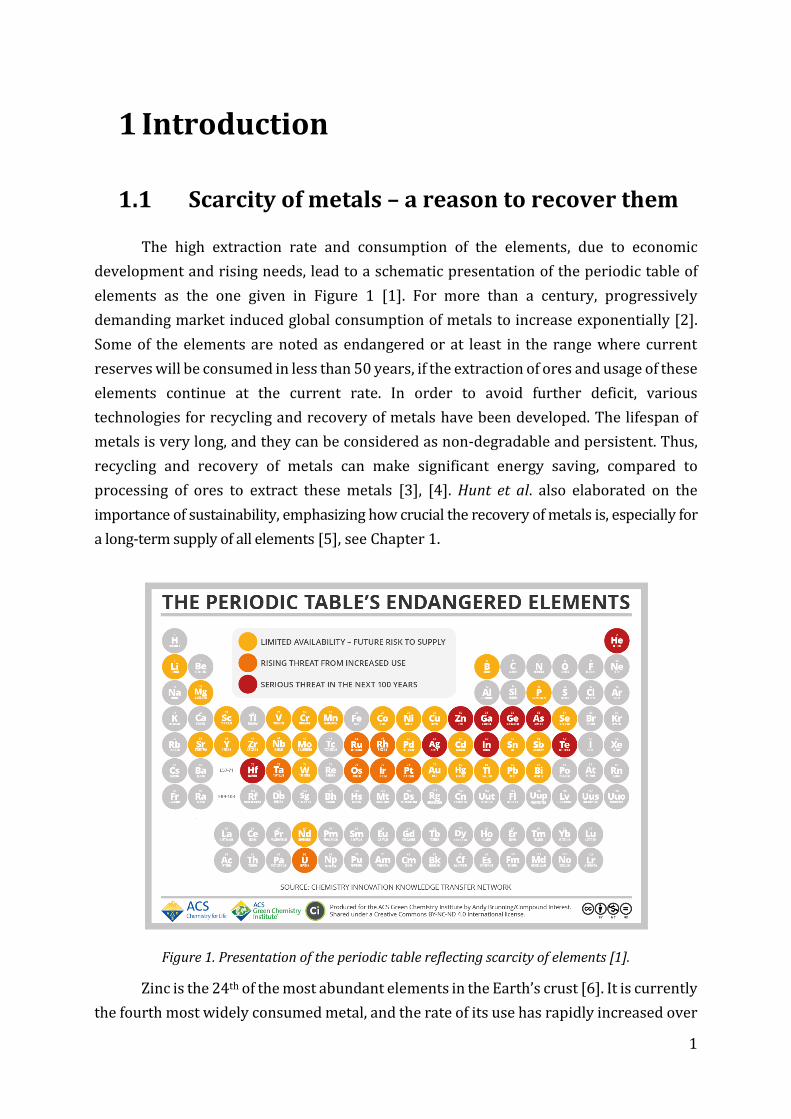
The high extraction rate and consumption of the elements, due to economic
development and rising needs, lead to a schematic presentation of the periodic table of
elements as the one given in Figure 1 [1]. For more than a century, progressively
demanding market induced global consumption of metals to increase exponentially [2].
Some of the elements are noted as endangered or at least in the range where current
reserves will be consumed in less than 50 years, if the extraction of ores and usage of these
elements continue at the current rate. In order to avoid further deficit, various
technologies for recycling and recovery of metals have been developed. The lifespan of
metals is very long, and they can be considered as non-degradable and persistent. Thus,
recycling and recovery of metals can make significant energy saving, compared to
processing of ores to extract these metals [3], [4]. Hunt et al. also elaborated on the
importance of sustainability, emphasizing how crucial the recovery of metals is, especially for
a long‐term supply of all elements [5], see Chapter 1.
Figure 1. Presentation of the periodic table reflecting scarcity of elements [1].
Zinc is the 24th of the most abundant elements in the Earth’s crust [6]. It is currently
the fourth most widely consumed metal, and the rate of its use has rapidly increased over

2
the last decades. Approximately 30% of global zinc production comes from recycled zinc
[7]. Henckens et al [8] published an estimation of the total amount of extractable global
resources - 60 metals and metalloids were listed and divided into four scarcity classes, as
shown in Table 1. The calculation is based on a prediction of 3 % increase in consumption
up to 2050 with a stable extraction rate.
Table 1. Exhaustion periods of 60 elements (years after 2050) under the assumption that
extraction of all elements mentioned increases annually by 3 % until 2050, after which it levels off
(rounded figures) [8]
Very scarce
Scarce (EGR*
exhaustion time
< 100 years after
2050)
Moderately scarce (EGR
exhaustion time between 100
and 1000 years after 2050)
Not scarce (EGR
exhaustion time > 1000
years after 2050)
Antimony -10 Gold 10 Arsenic 400 Aluminum 20000
Molybdenum 50 Bismuth 200 Barium 1000
Rhenium 80 Boron 200 Beryllium 200000
Zinc 50 Cadmium 500 Cobalt 2000
Chromium 200 Gallium 1000000
Copper 100 Germanium 200000
Iron 300 Indium 10000
Lead 300 Lithium 9000
Nickel 300 Magnesium 30000
Silver 200 Manganese 2000
Tin 200 Mercury 1000
Tungsten 300 Niobium 20000
Platinum
group metals 300000
Rare earth
metals 10000
Selenium 300000
Strontium 10000
Tantalum 2000
Thallium 1000000
Titanium 10000
Uranium 2000
Vanadium 20000
Zirconium 2000
*EGR – extractable global resources as defined by United Nations Environment Programme [9].

3
The data from the International Lead and Zinc Study Group (ILZSG) shows that
global zinc consumption has increased significantly over the last few years mainly due to
rising demands from the construction industry [6]. This puts zinc in a group of scarce
metals, which depletes in the next 100 years as shown in Figure 1.
The main supply of zinc has been based on processing of sulphide ores. Non-
sulphide zinc ores had a huge potential for industrial production, but the processing was
significantly neglected due to the development of flotation and other techniques intended
for sulphide ores [6]. The old processing routes were shown as inefficient since they
cannot be applied for the treatment of other types of ores, such as oxide ores, without
additional modification and costs [6]. Depletion of zinc sulphide ores reintroduced
interest into the processing of non-sulphide ores.
Differences in the ore composition and the mineralogy may have strong impacts
on the process of the extraction of the metals. In addition, metal processing industries are
facing changes in terms of a drop in quality and lowered concentration of desired metals
present in ores. Many metals ib low concentrations have been considered as waste
products within a production of high purity metals. Development of new processes such
as solvent extraction is shown as advantageous in terms of pre-concentration, separation,
purification, and recovery steps. The extraction of these metals became very important
from both an economic and environmental point of view.
Combining known technologies in hydrometallurgy and fast development of
hydrometallurgical processes (solvent extraction, leaching and electrowinning) show
good potential towards recovering and recycling of metals from non-sulphide ores. The
improvement in liquid – liquid extraction, by advancing properties of old and developing
new extractants can lead to treatment of low-grade ores.
In order to achieve high extraction yields, it is crucial to understand the extraction
reactions and postulate models on a small scale. Extensive research offers many different
chemical systems as replicas to larger industrial scale, and the progress made reflects
changes in steps of industrial metal extraction processes. Still, many discrepancies in the
parameters and extraction yields prove complexity of separation of metals in industrial
solutions and establishing models of the reactions.

4
1.2 Motivation and aim of the project
This thesis has been a part of “Hydromet” project, which involved many research
institutions - University of Oslo (UiO), Norwegian University of Technology (NTNU),
Institute of Energy Technology (IFE) and SINTEF. Norwegian industrial companies: Yara
International, Boliden Odda and Glencore Nikkelverk were also involved. The “Hydromet”
project was funded by Research Council of Norway.
The focus of the project was to improve and strengthen existing techniques
practiced in hydrometallurgy, such as solid – liquid and liquid – liquid extractions, ion –
exchange, electrolysis for recovery and refining, etc. As the quality of ores has been
changing, the complexity of industrial metal extraction processes has increased. The
established flowsheets of industrial companies need adjustments, due to an increase in
the amount of impurities. Even though solvating extraction has been used for decades to
separate metals, establishing the extraction mechanisms has proven difficult. The main
cause is linked to the chemical properties of industrial solutions and disparities in
extraction parameters. Therefore, the motivation and basis of this project lie in
understanding the extraction processes of metals of interest in relevant systems and to
postulate the reaction mechanisms of the extraction.
One of the solutions investigated was supplied by Glencore Nikkelverk, an
industrial partner within nickel mining and processing. The main concern has been
removal and recovery of zinc from the leaching solution. The utilization of solvent
extraction in the nickel industry is well known and has mostly been established for
processing of sulphide ores. Oxide ores (laterites), representing 70 % of world’s land –
based nickel resources, are considered less costly for mining and thus became of interest
for industry. Nevertheless, the usage has been limited due to the production of ferronickel
or matte. Therefore, separation of zinc from cobalt and nickel by testing of already
improved extractants was main task of this project.
Solutions were prepared in the laboratory are referred to as synthetic solutions.
Several different extractants were tested in the separation experiments which
investigated the capabilities and separation factors between zinc and cobalt. This
approach served as a screening method to narrow the choice of extractants used to extract
zinc from the stock solution, provided by Glencore Nikkelverk. By using extracting agents
such as CYANEX 923 and CYANEX 272, it was possible to extract zinc in the organic phase
by leaving cobalt in the aqueous phase. Very good selectivity for zinc over cobalt was
achieved.

5
Since the stock solution is highly acidic and saline, adjustment of the systems was
needed. For example, ammonia was used to vary pH, since CYANEX 272 is pH dependent
and it effects the yield of the extracted species. In addition, ammonia as a ligand was
employed to convert the anionic species to the positively charged extractable complexes
for certain cationic reagents.
Application of radiotracers have been shown to be as advantageous in the study of
separation processes [10]–[16]. Benefits are noticeable when correlating variation of
parameters, such as the concentration of extractant or the content of salts in the aqueous
phase, to the level of extracted metals and selectivity factor among them. It is easy to
compare the distribution ratios between synthetic solutions prepared in a laboratory and
stock solutions provided by an industrial partner.
1.3 Thesis Outline
The thesis consists of five Chapters, starting with an overview of importance and
motivation of the work. Afterwards an overview of conducted and published work is
presented in Chapter 2, Theoretical part. An overview of publications and methods
relevant to this thesis has been discussed. Chapter 3 provides a description of the
experiments and preparations performed. Chapter 4 contains results from experiments
performed, followed by discussion of the results. The conclusion of the conducted work
in given in Chapter 5. Appendix and list of publications are given as Chapter 6 and 7,
respectively.

6
2 Theoretical part
2.1 Solvent extraction
Solvent extraction (SX) can be used as a purification, preparation, enriching or
separation technique [17], see page 1. It is based on the different solubility of a solute
between two phases. It denotes a distribution of solute between two immiscible liquid
phases, which are in direct contact one with another [18], see page 27. Solvent extraction
relies on the use of organic agents that can selectively separate metal ions and transfer
them from one phase, usually aqueous, to another immiscible phase, usually organic.
The distribution of the solute between two phases is described by the distribution
ratio, D. It refers to a ratio of a solute at concentration [C]aq in the aqueous phase to the
concentration [C]org in the organic phase, after equilibrium is reached, as defined by
Equation 1.
D =[C]org
[C]aq (1)
The term used more to express the extraction efficiency by percentage of extracted
metal, %E, given by Equation 2:
%E =D
D+Vorg
Vaq
∙ 100, (2)
which leads to Equation 3 when the extraction is performed with equal volumes of
the two phases and as a one - step extraction process.
%E =D
D+1∙ 100 (3)
The choice of extractant is determined by its efficiency. Factors such as fast
kinetics, stability, low costs and environmental impact are considered when an extraction
system is designed. The extraction system can differ depending on the scale and purpose
of use. Some extraction systems can be excellent for microanaylisis or laboratory work,
but on the other hand may have poor performance when scaled up. In industrial setups,
volatilization and loss of solvents, prevention of precipitation and emulsification play
major roles in regulating the extraction system [17] see page 4.

7
2.2 Complexation of metal ions
Interactions of positive (metal ion) and negative ions (ligand) may lead to
formation of complexes. Complexation reactions give species (complexes) with different
stability constants which define the extent of metal – ligand interaction [18], see page 82.
The distribution of the species depends on concentrations of the metal and ligands, pH,
stoichiometry, and ionic strength [19], see pages 116-117. This has a large effect on
extractability by providing extractable and/ or unextractable species in aqueous solution.
It also dictates the type of extractant that can be applied in a separation system and the
separation of such species is followed by an alteration in distribution. However, a change
in distribution can prevail to a more favorable specie than others, by varying some of the
factors, such as concentration of ligands, additional ligand, pH and ratio metal to ligand.
If we define a metal ion as M+ and L− as a ligand – a species capable of combining
with other species to form a complex, the complexation reactions and equilibrium
constants for each step can be express as following:
M+ + L− ML (4) K1 =[ML]
[M+][L−] (7)
ML + L− ML2− (5) K2 =
[ML2−]
[ML][L−] (8)
ML2− + L− ML3
2− (6) K3 =[ML3
2−]
[ML2−][L−]
(9)
Alternatively, written as:
Mn+Ln−1 + L− MLn (10)
In addition, the equilibrium constant for given stepwise reactions is presented as:
Kn = [MLn]/[MLn−1][L] (11)
A total mass balance of metal, MT, is given as:
[MT] = [M+] + [ML] + [ML2−] + [ML3
2−] (12)
Which gives a fraction of total metal, αn, found in each of the individual species
αn =Kn[M+][L−]n
[M+]+K1[M+][L−]+K1[M+][L−]2+..+Kn[M+][L−]n (13)

8
The generalized way of presenting the reactions in total, involves defining the
overall stability constant or complexity constant [19], see page 116, βn as:
βn =[MLn]
[MLn−1][L]n = ∏ Kini=1 (14)
A fraction of the species can be calculated by using complexation constants and the
concentrations of the species. A speciation or distribution diagram is a visual
representation of the species as a function of the concentration of the ligand [18], see page
85. Since the total quantity of the metal is usually what can be measured, the speciation
diagram obtained gives important information on how to manipulate the system
regarding relevant extractability or separation of species. The speciation diagram can also
be given as a function of pH in the aqueous solution.
The stability constant is presented as a ratio of concentrations of species in the
system. Equation 14 defines stability constant of a system which has properties of the
standard state conditions, where a concentration is equal to activity of the same species
[18]. see page 85. However, most of the systems are far from this state especially in
industrial processes. Therefore, a medium of fixed ionic strength is usually introduced,
where an inert non-complexing electrolyte is added at high concentration. It is assumed
that by adding a medium the ionic strength will remain constant during the reactions [18],
see page 110. In such a case, the ionic strength I, and the salt used to keep the ionic
strength constant are specified for a certain value of the complexation constant [20], [21].
Metals of interest for this thesis form anionic chloro-complexes in strong chloride
media. It implies that basic extractants, e.g. tri-octylamine (Alamine 336) or tri-
octylmethylammonium chloride (Aliquat 336) must be used. It has been shown that an
increase in the chloride concentration would be followed by an increase in extraction
efficiency. Thus, the zinc extraction efficiency is affected by chloride concentration. The
explanation is provided by the increase of ZnCl3− species and basic extractants are used
[22], [23]. In general, Aliquat 336 and amines have been proven to show very good
extraction efficiency towards zinc, and for that reason have been selected for testing in
this work.
2.3 Complexation with ammonia ligand
The application of ligands is a useful method for separating metals and compounds
based on complexation reactions between ligands and metals. Separation occurs due to
differences in the complexing strength.
9
Ammonia belongs to a group of chelating agents. This type of complexes is very
useful in many solvent extraction systems, especially because of the possibility to provide
solubility of the complex in organic phase [18], see page 96. In addition, chelates are more
stable than non-chelate complexes. If an electrolyte is dissolved in water, beside
hydration, complexation reactions with anions in stoichiometric excess are possible. In
that case, addition of chelating agent could favor substitution reactions depending on the
thermodynamics and properties of the complexes. Also, some of the metals can be
removed by precipitation as hydroxides or oxides, which lowers costs of recovering.
The Murrin-Murrin process uses ammonia in combination with CYANEX 272
(bis(2, 4, 4 – trimethylpentyl) phosphinic acid) for extraction of zinc from sulphate media
[7], [24]. A combination of chloride and ammoniacal media has been used to recover zinc
from various zinc resources [24], [25]. It has been reported that by adjusting equilibrium
in ammoniacal chloride media, zinc ions effectively can be transferred from and into the
media by single and/ or synergetic extractant systems [22]. Therefore, ammonia is of
interest for this work as a possible ligand for conversion of anions to cations in order to
investigated cationic reagents.
2.4 Solvent extraction in industrial processes
Solvent extraction (SX) began in 1942 as a part of the Manhattan project for
recovery and purification of uranium with diethyl ether as the extracting solvent, which
was later replaced with tributyl phosphate (TBP) [18] see page 508. Afterward, SX gained
a lot of attention in hydrometallurgical ore processing due to rapid development of new
extracting agents with an application in base and transition metals.
The new generation of organic extractants have better selectivity of metals from
very complex leaching solutions. This enables enhanced purification of leach solutions by
removing impurities and obtaining a higher quality and a higher purity product. This new
generation of extractants can also selectively extract desired metals from aqueous
solution (raffinate) regardless of the concentration of metals. Therefore, solvent
extraction plays an important role in processing of complex and secondary resources, and
in recovering of metals or impurities [26].
SX has a vast application in extraction and separation of metals from sulphate,
chloride and ammoniacal solutions. Hydrometallurgical processing of ores and secondary
material (waste) in chloride media has a higher potential over sulphide media, due to
better leaching properties, less corrosive and volatility of extracting agents [5]. Chloride
10
media is considered rapid in dissolving minerals, and metal chloride salts are more
soluble. Separation of cobalt over nickel, recovery and separation of zinc and other
desired metals, extraction of copper, extraction of platinum group and rare earth metals
are some of the applied solvent extraction industrial processes.
Utilization of solvent extraction in the nickel industry started early in the 1970s in
order to separate nickel and cobalt. This was challenging due to their similar chemical and
physical properties however, solvent extraction was effective because nickel remains in
the aqueous phase. Zinc has been removed as a waste product in the processing route
along with other metals as applied in the Goro hydrometallurgical process of laterite ores
[27]. In addition, separation of zinc from other metals using SX has been established in
processes such as the Bulong and the Murrin-Murrin [18], see pages 468-471. Due to
presence of iron, ammonia is used to make insoluble residue with iron. The precipitate
was removed by filtration [19] see page 203.
In Ni/Co processing six types of extractants are in use: tertiary amines (for chloride
solutions), carboxylic acids (for sulphate solutions), organophosphoric acids (sulphate
solutions), organophosphonic acids (sulphate solutions), organophosphinic acids
(sulphate solutions) and ketoximes (ammoniacal solution) [27]. Organophosphorus
extractants have certain limitations with the selectivity of cobalt over nickel when iron,
copper, zinc and manganese are present in the leach solution. Thus, extraction of zinc has
been widely studied with a great range of extractants employed to recover zinc over other
elements [28].
Based on the literature overview, zinc extraction was investigated from a vast of
different systems [7]. Extraction of zinc has been performed from aqueous sulphate
solutions [28], [29], acidic solution with different media such as nitrates, sulphates and
chlorides [25], [30], [31] and from solutions defined as one - metal solutions [31], [32]. All
the publication referring to application of cationic or acidic extractants are in agreement,
confirming that the yield of the extraction is governed by an increase in pH. Alguacil et al.
showed that recovery of zinc is a function of the concentration of zinc in the solution [33].
CYANEX 301 (bis(2,4,4-trimethylpentyl)dithiophosphinic acid) is mostly used for
extractions of laterite sulphate solutions, and can be applied for separation of cobalt over
nickel, and zinc over cobalt [27]. Alguacil et al. investigated the extraction of Zn (II) from
chloride solution using thiophosphonic extractants such as CYANEX 302 (bis-(2,4,4-
trimethylpentyl) monothiophosphinic acid) and showed that the substitution of oxygen
in P=O bond with sulphide will enhance the extraction. The extraction occurs at very low
pH, which enables extraction of zinc from very acidic solutions. It is pointed out that
CYANEX 302 is much better than the most investigated D2EHPA (di-(2-

11
ethylhexyl)phosphoric acid) and less used CYANEX 272 [30]. On the other hand, CYANEX
301 along with 302 proved to be insufficiently stable and CYANEX 272 became further
utilized. Due to the characteristics of our systems, CYANEX 272 was prioritized over
others and chosen as a reagent candidate for this work, especially due to a very good
Co/Ni selectivity factor, which has been shown to be better than for D2EHPA and PC-88A
(2-ethylhexyl 2-ethylhexyphosphonic acid) [19], see page 202.
Glencore Nikkelverk has been using solvent extraction (SX) for separation of Co
from other impurities, after a high purity nickel has been removed in the previous step,
Figure 2. The complexity of the flowsheet shows that an increment of impurities, due to
low quality of present raw materials, could affect the purity standard of the main
products. Since the processed ores currently contain 1.5 wt. % of Zn in this project solvent
extraction has been employed as a method of separation of zinc over cobalt.
Figure 2. Flowsheet of nickel and cobalt production at Glencore Nikkelverk, Kristiansand.
Co-extraction of zinc and cobalt is possible to avoid since they can be separated
selectively based on the difference in pH. Alternatively, it is important to keep in mind
that very acidic and saline solutions can dictate different separation conditions for
species. Therefore, prior to selecting an appropriate extracting agent several parameters
which define the separation system should be taken into consideration; such as - pH, ionic

12
strength, and concentration of the desired metal along with the concentration of
complexing anions. All of them reflect having vast values of published selectivity factors
for zinc over cobalt [19], see page 202.
2.5 Type of solvent agents
The choice of extractant depends on its related distribution coefficients, inertness,
stability towards diluent, and separation from the solute. In addition, other factors
including the costs of separation process and the extractant itself must be taken into
consideration [34].
The extraction of Zn from acidic solutions can be performed by using a wide variety
of extractants [25]. A thorough list, including commercial uses and manufactures, can be
found in work of Flett et al. [24]. The extraction of zinc from chloride solutions has been
investigated by using TBP [35], [36] , DPPP [37], DBBP [38], Kelex 100 [39], D2EPHA [40],
CYANEX 302 [30], [41], Aliquat 336 [42] and secondary amines [43]. The focus of this
work was on testing of the agents from each of the three basic types - acidic, basic and
solvating from chloride solutions. The list of the extractants chosen is given in Table 2.

13
Table 2. List of the extractants of interest listed according to the class. Commercial name,
chemical composition and chemical structure of active substance are included
Class of
extractant Trade name Chemical composition
Chemical structure of
active substance
Acidic CYANEX 272 Bis(2, 4, 4 – trimethylpentyl)
phosphinic acid
Solvating CYANEX 923
A mixture of Trihexylphospine
oxide, dihexylmonooctylphosphine
oxide, dioctylmonohexylphosphine
and trioctylphosphine oxide
Solvating TBP Tributyl phosphate
Basic Primene JM - T 16,16-dimethylheptadecan-1-amine
Basic Aliquat 336 Trioctylmethylammonium chloride
2.6 Acidic extractants
Metal cations are extracted from aqueous phase by forming neutral lipophilic
complexes. This is carried out by replacing one proton of the extractant for every positive
charge on the metal, according to the Equation 15:
Maqn+ + nHA → MAn
+ nHaq+ (15)
where Maqn+ represents metal cation present in the aqueous phase, and HA is an
acidic extractant [25] in organic phase. Equation 16 has been used to express the
extraction reaction:
Maqn+ + rHA → MA2 ∙ (r − 2)HA + nHaq
+ (16)
Where r can be a value between 2 to n. pH of the aqueous solution should be
controlled, since the reaction leads to an increase in hydrogen ion concentration. In

14
general, acidic extractants are used in processing of acidic solutions. These cationic
exchange systems will reject anionic species, which is especially important when working
with most commonly used chloride solutions [7].
2.6.1 CYANEX 272 (Bis(2, 4, 4 – trimethylpentyl) phosphinic acid)
CYANEX 272 was developed specifically for the separation of cobalt from nickel by
SX from weakly acidic sulphate solutions [24]. Cole and Sole showed that zinc extraction
with CYANEX 272, being pH dependent, is very selective over the other metals
investigated [7]. Those metals and alkali cations require a higher pH value to be extracted
while extraction of zinc happens at low pH [31]. Therefore, the interference could be
neglected. The pH value when the extraction starts, corresponds to values close to pH=2
when one-metal solution is investigated [32]. The reported pH values of maximum zinc
extracted are between 3 and 3.6 from sulphate solution [31], [44], [45]. Zhang et al.
reported that the maximum of extracted metal was reached at pH=3.5 - 4 in the systems
where ratio of aqueous to organic phase were varied from 3-10 [46].
In case of Ni/Co extraction CYANEX 272 has been shown to be a suitable extractant,
since oxidation and degradation of diluent are not reported, compared to the extractions
with D2EHPA or PC-88A [24]. Application of only one extractant to cover a major part of
processing of several metals is always advantageous. This gives the possibility to avoid
cross contamination of several reagents in industrial flowsheet (Murrin-Murrin over
Bulong process) [24]. The selectivity factor of CYANEX 272 for cobalt over nickel is 7000
at pH 4 [19], see page 202. In addition, CYANEX 272 has been shown as a very good
extractant with excellent selectivity for zinc over cobalt and nickel, which can be deduced
from Figure 3, copyright Cole et al [7].
Figure 3. Extraction of cations as a function of pH by CYANEX 272 [7].

15
2.7 Basic extractants
The basic extractants are almost always long-chain primary, secondary, tertiary or
quaternary alkylamines [47]. The extraction of metals is performed by converting the
amine to amine salt to provide an anion which can later be exchanged for a metal ion. An
amine salt is made when organic reagent is in contact with acid, e. g.HCl. Then the anionic
Zn chloro-complex is extracted by anion-exchange mechanism which is described by
Equations (17) and (18):
R3N + H+Cl−aq R3N ∙ H+Cl− (17)
R3N ∙ H+Cl− + ZnCl42− → (R3N ∙ H)2 ∙ ZnCl4
2− + 2Cl− (18)
2.7.1 Aliquat 336 (Trioctylmethylammonium chloride)
It has been shown that Aliquat 336 can be used for extraction over a wide pH range
[48], [49], and performs the selective extraction of Zn(II) over Co(II) and Ni(II). Since zinc
in chloride solution will predominantly form negatively charged chloro complexes basic
extractants are applied among which Aliquat 336 was very effective [42], [48]. The
efficiency of Aliquat 336 was proven to be higher than efficiency of TOA [50], [51]. Lower
concentration of inert media also affect the selectivity of zinc over cobalt and nickel [48].
2.7.2 Primene JM – T (16,16-dimethylheptadecan-1-amine)
Primene JM – T is a primary amine and it is used in extraction processes where
anionic species are formed, such as in chloride media. Primary amines are considered the
weakest in the line of amines where quaternary and tertiary have the highest efficiency.
Even though it has been shown that in 2N HCl solution, the efficiency of zinc extraction
can be as high as for Aliquat 336, 83.8 % and 83.4% for Primene JM – T and Aliquat 336
respectively [11]. Primary amines are used also in combination with acidic extractants. It
was shown that extraction of zinc has been improved when primary amine was used
together with CYANEX 272 [52].
2.8 Solvating extractants
Solvating extractants are effectively neutral and they facilitate the extraction by
first replacing solvating water molecules with organic solvent molecules, thereby

16
reaching organic solubility. Later, usually through protonation, ion associations are made
and the overall charge is neutralized. Most solvating extractants contain polar oxygen
atoms that accept hydrogen ions. The accepted hydrogen ions associate with negatively
charged metal complexes. These extractants, which contain oxygen bonded to
phosphorus have been used for zinc extraction from chloride solutions following the
solvation extraction mechanism [25], were of interest for this project. In addition,
solvating extractants tend to have high capacity of loading zinc and good distribution of
extraction over other metals such as iron (II) [53].
2.8.1 CYANEX 923 (A mixture of Trihexylphospine oxide,
dihexylmonooctylphosphine oxide, dioctylmonohexylphosphine
and trioctylphosphine oxide)
Cyanex 923 is a neutral extractant with low tendency towards hydrolysis and low
solubility in water [54]. The temperature dependency was shown by Alguacil et al., where
a decrease in extraction follows an increase of temperature [55]. The expected species are
described as ZnCl2 ∙ 2L, HZnCl3 ∙ 2L and H2ZnCl4 ∙ 2L [55]. In addition, Regel et al.
proposed the presence of ZnCl2 ∙ 3L, a neutral chloro complex extracted at low acidity of
aqueous phase [56]. Zinc can be extracted with low concentration of reagent such as 0.05
M CYANEX 923 within 4 stages while O/A ratio was kept 1/2 [57].
2.8.2 TBP (Tributyl phosphate)
TBP has been used for extraction of zinc and several different reactions have been
reported [58] depending on zinc concentration [59], concentration of HCl acid and
chloride used. The reported species are ZnCl2 ∙ 2L, HZnCl3 ∙ 3L and H2ZnCl4 ∙ 2L. Lum et
al. showed that an increase in chloride concentration by adding NaCl results in an increase
of zinc extraction, and in acid extraction. The effect was attributed to the extraction of
acido-metal complexes [58], [60]. The extraction of 5 g/l Zn has been around 10 % in the
range of 1 – 9 M HCl, while addition of 2 M NaCl pushed the extraction to almost 30 %
[61].

17
2.9 Application of radiotracers in separation
technology
Application of radiotracers in the separation technology is considered convenient
due to very easy detection of isotope of interest. They can be easily measured with high
precision and are considered independent of pressure, temperature, chemical and
physical state. It is assumed that radioactive isotopes are chemically identical with a
stabile isotope of the same element,
disregarding the difference in mass
for the elements heavier than
hydrogen-deuterium-tritium
system. It is necessary to have
appropriate radiotracer with a long
half – life, which will not induce
changes to the experimental
parameters during work. 65Zn and
60Co were used as radiotracers in
this project. 65Zn disintegrates with a
half-life of 244 days, by electron
capture (50.23 %) to the 1115 keV
excited level and by electron capture
(48.35%) and beta plus emission
(1.42 %) to the ground state of stable
65Cu.
Energy of gamma ray of 1115
keV was used to track activity of zinc
distributed between two phases.
Decay scheme is given in Figure 3
(a).
Zn3065 → Cu + β+ +29
65 γ (19)
60Co has a half-life of 5.27
years and disintegrates by 100 %
beta minus emission to excited
levels of 60Ni, which emits two
gamma rays, 𝛾1 and 𝛾2 of 1.17 and 1.33 MeV respectively. Those energies were used for
Figure 3. Disintigration scheme of (a) 65Zn and (b) 60Co.

18
detection and determination of cobalt distribution ratios. Disintegration scheme is given
in Figure 3 (b).
Co → Ni + β− + γ1 + γ22860
2760 (20)
Both tracers have sufficiently separate energies for gamma ray detection. Gamma
spectroscopy was utilized for detection and measurement of distributed radioactivity.
2.9.1 Detection of radioactivity
Techniques for detecting ionizing radiation have very low detection limits. Choice
of the detection system depends on the type of the radiation emitted from the
radionuclide.
In this work, both tracers 60Co and 65Zn emit beta and gamma radiation, but the
choice of the detection was determined by the energy of the radiation. The high energy
gamma rays have very good separation, compared to beta emission. In order to measure
beta radiation, the use of liquid scintillation detector is a viable option however, samples
containing only one tracer at the time would be required. This would prevent the
overlapping of the beta energy peaks. Therefore, the detection and measurement of
radioactivity transferred from one phase to another was conducted by high purity
germanium detector (HPGe) with 80 % efficiency. In this case sample preparation was
shorter.
Dead time of detector, geometry of samples and distance from the detector are
important factors to consider in designing the measurement experiments. In addition, the
amount of activity dictates the distance from the detector where the dead time is low, but
the count rate is sufficiently large. Thus, the measuring time is relatively short and no
changes in chemical properties of the samples are expected. Therefore, the activity of
prepared tracers was of the same magnitude. Also, the dead time of detector did not affect
the measurements. The distance was large enough that detection was not influenced by
manually placed samples prior to measurement.

19
3 Experimental part
3.1 Preparation of radiotracers
65Zn was produced in 2016 at IFE by thermal neutron activation from high purity
metallic zinc pellet (supplied by E-Merck AG, Darmstadt). Irradiation has been performed
for 72 hours using a flux of 1.3 ∙ 1013 n/cm2s following the reaction 64Zn (n,)65Zn. The
activity of the source was 86.71 MBq after one week. Afterwards, the pellet of 65Zn was
dissolved in 12 M HCl, since chloride environment will be the common medium for all the
solutions. 1 ml of the stock solution was diluted with type II water. In order to have
isotopic exchange between stable zinc in aqueous solution, known as a carrier, and the
radionuclide, 65Zn, the amount of radiotracer compared to stable zinc was microscopic.
This assured that the radionuclide would follow the chemical properties of the carrier.
Therefore, 200 l was added per 2 ml of aqueous solution prior to start of the
experiments. The activity of the produced tracer was high enough to ensure the same
volume of tracer over the whole project.
60Co was purchased from Amersham, England as cobalt chloride solution. A small
aliquot was withdrawn and diluted with type II water. The amount of radioactivity was
approximately in the range as of 65Zn radiotracer. 100 l was added per 2 ml of aqueous
phase, which already contained 65Zn tracer.
3.2 High purity germanium detector - HPGe
Both tracers emit gamma rays, gamma spectroscopy system was used to detect
presence of the tracers in the aqueous and organic phases. The position of a sample was
fixed to 150 mm away from the detector. The geometry (volumes of the phases and the
type of vials) of all the samples were identical during the whole project – 1.5 ml of solution
(aqueous or organic phase) was placed in 20 ml plastic vials. Uncertainty of the
measurements were calculated using equations given in Appendix I.
3.2.1 Maestro Multichannel Analyzer Emulation Software
Maestro software package enables visual presentation of the detected peaks and
counts in real time. The region of interest (ROI) of a test sample was recorded prior to
measuring samples containing different phases. ROI has a function to subtract the
20
background after the collection of the data is complete. The test sample contains the same
volume as investigated phases with the total amount of activity used in experiments. 8
channels of background were selected from both sides of the peak, in order to limit the
uncertainty of the measurement.
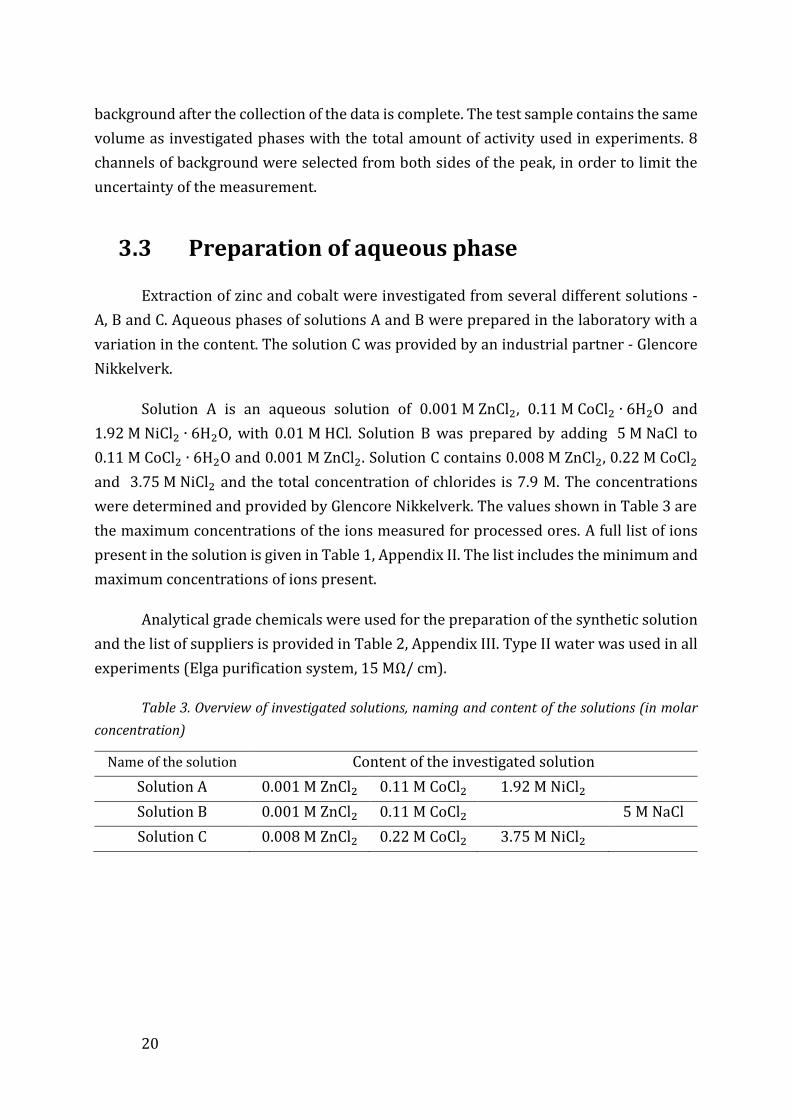
3.3 Preparation of aqueous phase
Extraction of zinc and cobalt were investigated from several different solutions -
A, B and C. Aqueous phases of solutions A and B were prepared in the laboratory with a
variation in the content. The solution C was provided by an industrial partner - Glencore
Nikkelverk.
Solution A is an aqueous solution of 0.001 M ZnCl2, 0.11 M CoCl2 ∙ 6H2O and
1.92 M NiCl2 ∙ 6H2O, with 0.01 M HCl. Solution B was prepared by adding 5 M NaCl to
0.11 M CoCl2 ∙ 6H2O and 0.001 M ZnCl2. Solution C contains 0.008 M ZnCl2, 0.22 M CoCl2
and 3.75 M NiCl2 and the total concentration of chlorides is 7.9 M. The concentrations
were determined and provided by Glencore Nikkelverk. The values shown in Table 3 are
the maximum concentrations of the ions measured for processed ores. A full list of ions
present in the solution is given in Table 1, Appendix II. The list includes the minimum and
maximum concentrations of ions present.
Analytical grade chemicals were used for the preparation of the synthetic solution
and the list of suppliers is provided in Table 2, Appendix III. Type II water was used in all
experiments (Elga purification system, 15 MΩ/ cm).
Table 3. Overview of investigated solutions, naming and content of the solutions (in molar
concentration)
Name of the solution Content of the investigated solution
Solution A 0.001 M ZnCl2 0.11 M CoCl2 1.92 M NiCl2
Solution B 0.001 M ZnCl2 0.11 M CoCl2 5 M NaCl
Solution C 0.008 M ZnCl2 0.22 M CoCl2 3.75 M NiCl2

21
3.4 Preparation of organic phase
The organic phase was prepared by diluting the extractant in a diluent - ASOL D80,
at room temperature. The diluent, petroleum distillate, was used without further
purification. The amount of benzene is less than 1 ppm [62]. The concentrations of used
extractants are provided in Table 4.
Table 4. List of concentration of tested extractants
Extractant Concentration (M)
Aliquat 336 0.1
Primene JM – T 0.1
TBP 0.1
CYANEX 923 0.1 0.02 0.005
CYANEX 272 0.1 0.02 0.004
3.5 pH measurements
pH of all the solutions were adjusted by using 32 % aqueous ammonia solution.
The pH was determined by Orion star A211, equipped with Thermo Scientific Orion ROSS
Sure Flow pH electrode 8172BNWP. The electrode is filled with 3 M KCl solution and the
measurements were performed at room temperature T=23.5 ± 0.1 . Prior to each
measurement, the electrode was calibrated using Orin pH buffers, pH=4.01 and pH=7. The
pH values are given as a mean value of three measurements conducted consecutively.
Following each measurement, the electrode was rinsed with Type II water prior to
immersing it in the same solution for another measurement.
3.5.1 Uncertainty of the pH measurement
Resolution (precision) [63] of the pH meter is 0.01, while the relative accuracy of
the measurement is 0.002 [64]. The uncertainty of pH measurements can only be
estimated, due to enrollment of all uncertainties while a solution is prepared. Therefore,
we present the uncertainty as an estimation of uncertainties included and based on the
highest uncertainty which prevails. Thus, the uncertainty of pH measurements is usually
related to the resolution of the pH meter. Besides that, the uncertainty of pH

22
measurements is more heavily influenced by the parameters of solution preparation,
which is in our case pipetting of the ammonia.
The uncertainty of the pH measurements was calculated as a mean value of 6
consecutive measurements of pH conducted on 2 replicas. This includes predation of two
solutions, where pH measurements were performed 3 times for each solution with same
amount of ammonia added. The process of pH uncertainty therefore includes uncertainty
of the measurement and the preparation (withdrawal of the ammonia, as a random error).
The uncertainty is calculated as a standard deviation of the pH measurement, Appendix
IV. The given value is 4 times the resolution and it was applied for all experiments. We are
certain that this value is high enough since the calculated value was 3 times higher than
resolution of the pH meter.
A solution at a specific pH value was prepared in 20 ml vial. The pH was measured
the same day; reducing the amount of ammonia that can evaporate. 2 ml sample of the
aqueous phase was transferred to a test tube for further experimental procedure. 3
replicas of same pH value (same ammonia concentration) for 3 different concentrations
of reagent were prepared. One solution was sufficient for testing all three concentration
of CYANEX 272, if not stated otherwise.
3.6 Solvent extraction
Solvent extraction was performed on both
the synthetic and the industrial solutions. The
solutions were prepared by combining 2 ml of
aqueous phase with 2 ml of organic phase.
Radiotracers were added to aqueous phase and
manually stirred to give an even distribution
within the carrier. The organic phase was added
on top of the aqueous phase and the test tubes
were shaken using Vortex shaker for 20 min,
Figure 5. The shaking time was enough to reach
equilibrium [12]. Afterwards, the phases were
separated using centrifuge for 5 minutes at 3000
rpm.
First, 1.5 ml of the organic phase was
withdrawn from a test tube leaving 0.5 ml on top
Figure 5. Vortex shaker with test tubes
containing both phases prior to
separation.
23
of the aqueous phase ensuring limited entrainment of the phases. Later, 0.5 ml of organic
was removed. In addition to removing the organic phase, approximately 0.25 ml of top
aqueous phase was removed and disposed of as radioactive waste. 1.5 ml of the aqueous
sample was taken for a measurement. The rest of the aqueous phase was disposed as
radioactive waste.
1.5 ml of each phases were taken for measurement of the radioactivity remaining
in the phase. A comparison of the activity distributed among phases was performed in
order to determine the distribution ratio.
3.7 Calculation and presentation of chemical
equilibrium diagrams
The Origin software was used for depicting distribution of the species in the
systems depending on the ligand concentration. Distribution of zinc species is presented
as a function of one ligand concentration at the time. In order to get an overview of
distribution of zinc with both ligands, concentration of chloride ions was kept constant,
while ammonia concentration was varied. The list of the constants used is given in
Appendix V.
Medusa and Hydra [65] were software programs employed for the calculation and
depiction of chemical equilibrium diagrams based on the content of the investigated
systems. Hydra contains a database with stability constants at T=25. The diagrams are
created with Medusa for the systems which were defined in Hydra. This software allowed
us to present the distribution of zinc species as a function of pH. The diagrams presented
were calculated for the specified ionic strength of the solutions. Appendix VI contains
figures reflecting species distribution. Nevertheless, the determination of accuracy and
truthfulness of the calculation at higher ionic strength is outside of the scope of this work.

24
4 Results and discussion
The use of chloride media is effective in terms of digesting sulfides and secondary
materials. Also, the same media is used in Glencore Nikkelverk’s production. Thus, the
extraction and separation of zinc over cobalt under similar conditions was investigated.
Both metals of interest, zinc-(II) and cobalt-(II), form numerous chloro-complexes.
Distribution of the formed complexes is dependent on the concentration of chloride ions
in the aqueous phase. Prior to screening and investigating the effect of zinc and cobalt
extraction, the speciation diagrams were constructed. This gave a better overview of what
type of reagent can give the best yield, but not the separation factor.
4.1 Speciation of zinc species in chloride media
Four consecutive aqueous zinc chloride-complexes can be formed depending on
the concentration of chloride ions in solution. The following Equations (20 – 27) are:
Table 5. List of zinc chloro-complexes and equilibrium constants
Zn2+ + Cl− ZnCl+ (21) K1 =[ZnCl+]
[Zn2+][Cl−]; log10K1 = 0.40* (25)
Zn2+ + 2Cl− ZnCl2 (aq) (22) K2 =[ZnCl2]
[Zn2+][Cl−]2; log10K2 = 0.69* (26)
Zn2+ + 3Cl− ZnCl3− (23) K3 =
[ZnCl]3−
[Zn2+][Cl−]3; log10K3 = 0.48* (27)
Zn2+ + 4Cl− ZnCl42− (24) K4 =
[ZnCl]42−
[Zn2+][Cl−]4; log10K4 = 0.20** (28)
*[21]
**[66]
These complexes are very weakly coordinating and require high concentration of
chloride ions, high chloride to zinc ratio and high ionic strength [21]. The values of the
stability constants are dependent on the content of the aqueous phase and ionic strength.
In real hydrometallurgical solutions, high saline mixed systems influence the activity
coefficients, due to high concentration of ions present. Therefore, various values of the
constants can be found in the literature [20], [21]. A large part of it gives information at
constant ionic strength of the solutions. The relation of the concentration to activity is
done by extrapolating the constants to zero ionic strength.

25
It has been difficult to find values of stability constants for all the investigated
complexes in this work, while the ionic strength of the solutions was 𝐼 > 0. Hence, for the
sake of calculations and not involving stability constants obtained under various
conditions, the values of stability constants taken in this work are for solutions of ionic
strength equal to 0. A list of stability constants’ values used for making the diagrams is
presented in Table 5.
Zinc chloride species are presented in Figure 6 and the system can be divided into
several regions depending on the chloride concentration. All the species (cationic, anionic
and neutral) appear at 1 M Cl-. Above 1 M, ZnCl 3− and ZnCl 4
2−species are dominant, while
below 1 M cationic species dominate (Zn2+. and ZnCl+). ZnCl2 is evenly distributed and
present below and above the mentioned concentration.
The solutions investigated have the chloride ion concentration above 4 M. Solution
A is a 4 M chloride solution and main species are ZnCl2, ZnCl 3− and ZnCl 4
2−with a small
fraction of ZnCl+. Due to coordination characteristics of chloride ions, zinc predominately
forms negatively charged complexes [22]. Therefore, the choice of extracting agents relies
on the chloride concentration. Mostly neutral or basic extractants can be applied.
Figure 6. Speciation diagram for zinc-chloride system depending on the concentration of
chloride ions.

26
4.2 Speciation of cobalt species in chloride media
Speciation of cobalt in acidic chloride solution appears as two - step reaction
according to the literature [20], [67]:
Table 6. List of zinc chloro-complexes and stability constants
Co2+ + Cl− CoCl+ (29) K1 =[CoCl+]
[Co2+][Cl−]; log10K1 = 0.70* (31)
Co2+ + 2Cl− CoCl2 (aq) (30) K2 =[CoCl2]
[Co2+][Cl−]2 ; log10K2 = 0.52* (32)
*[67] method A has been chosen
It is easy to conclude that cobalt makes a positively charged complexes in high
concentrated chloride solutions. On the other hand, the complexation of cobalt has not
been clarified, since there has been several different values of stability constants and steps
of the reaction reported. In addition, Morris et al. [67] introduced the presence of
negatively charged complexes, such as , CoCl 3−and CoCl 4
−, but stability constants have
been given as zero. For this study, only the first two reactions have been considered.
Based on the molarity of chloride ions in our solutions and present complexes,
several different extractants were tested – Aliquat 336 and Primene JM-T - basic
extractants, TBP and CYANEX 923 - solvating extractants and CYANEX 272 - cationic
extractant.
4.3 Basic extractants
Aliquat 336 is a tertiary amine and has been proven to be an extractant with very
good extractability towards zinc and cobalt. Unfortunately, Aliquat 336 was only partly
miscible in the diluent. Based on results available in publications, Aliquat 336 as a polar
solvent has been preferably diluted in other polarized solvents such as toluene, carbon
tetra chloride and others. Nevertheless, ASOL D80 has been kept as a diluent and other
extractants were investigated further.
Primene JM-T was successfully dissolved, and the extraction of zinc was studied
first from solution A, due to the similarity to the industrial solution. Distribution ratio (D)
of zinc extraction was very low - 0.036 and 0.039, for pH of 1.32 and 1.52 respectively.
The efficiency, percentage of metal extracted (%E), has been calculated based on the
distribution ratio.
27
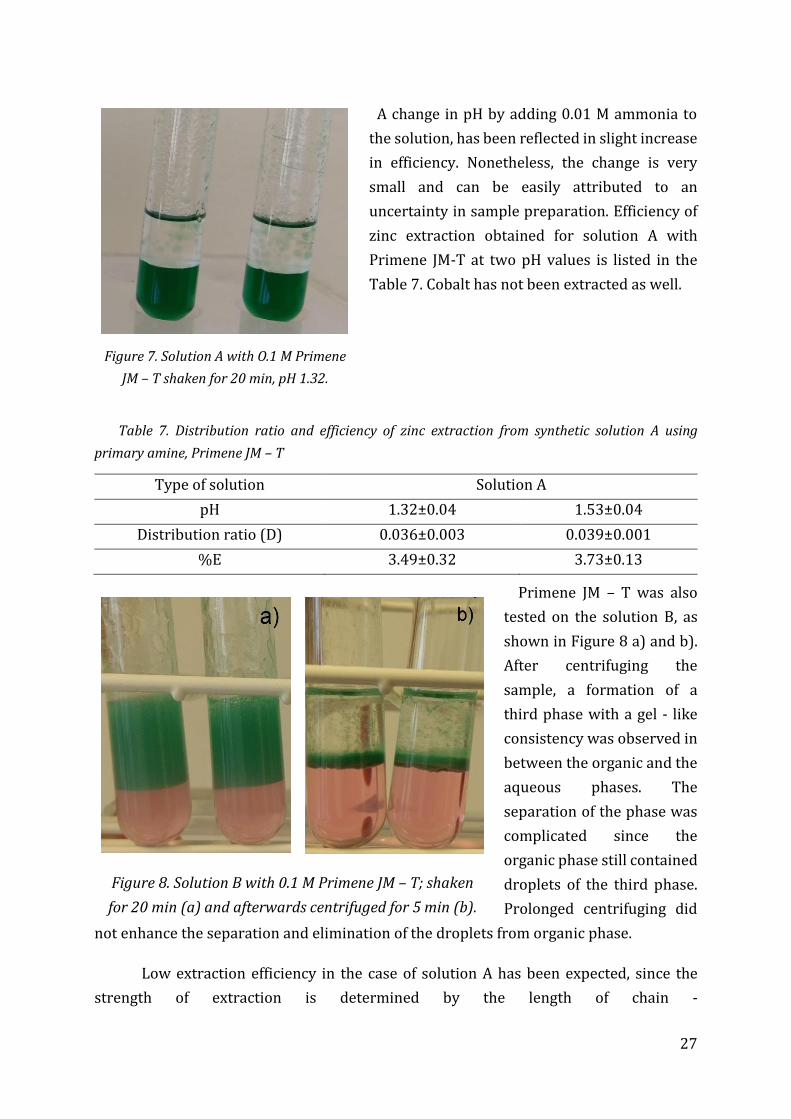
A change in pH by adding 0.01 M ammonia to
the solution, has been reflected in slight increase
in efficiency. Nonetheless, the change is very
small and can be easily attributed to an
uncertainty in sample preparation. Efficiency of
zinc extraction obtained for solution A with
Primene JM-T at two pH values is listed in the
Table 7. Cobalt has not been extracted as well.
Table 7. Distribution ratio and efficiency of zinc extraction from synthetic solution A using
primary amine, Primene JM – T
Type of solution Solution A
pH 1.32±0.04 1.53±0.04
Distribution ratio (D) 0.036±0.003 0.039±0.001
%E 3.49±0.32 3.73±0.13
Primene JM – T was also
tested on the solution B, as
shown in Figure 8 a) and b).
After centrifuging the
sample, a formation of a
third phase with a gel - like
consistency was observed in
between the organic and the
aqueous phases. The
separation of the phase was
complicated since the
organic phase still contained
droplets of the third phase.
Prolonged centrifuging did
not enhance the separation and elimination of the droplets from organic phase.
Low extraction efficiency in the case of solution A has been expected, since the
strength of extraction is determined by the length of chain -
Figure 7. Solution A with O.1 M Primene
JM – T shaken for 20 min, pH 1.32.
Figure 8. Solution B with 0.1 M Primene JM – T; shaken
for 20 min (a) and afterwards centrifuged for 5 min (b).

28
tertiary>ternary>secondary>primary [18], see page 463. Even though primary amines
are weaker than the others, it has been shown that Primene JM – T can extract sufficient
amount of zinc [11]. In addition, it was used as a co-extractant in synergic systems along
with CYANEX 272. In our case, Primene JM-T has not been effective as a single extractant
and therefore, it has not been selected as an extractant of interest for further work.
4.4 Solvating extractants
TBP has been tested on two synthetic solutions A and B. There was no extraction
of zinc nor cobalt observed. The distribution ratios of zinc for the solutions are given in
Table 8. The observed effect is not in agreement with published values in the literature
[60], [61]. The explanation can be due to low pH of the solutions [68], even though TBP as
a solvating extractant should be pH independent. Higher pH of the aqueous phase might
give higher extraction efficiency [36]. Thus, adjustment of pH of the solutions can be one
of the prospects of the future work. Nevertheless, further work on extraction of zinc with
TBP was not performed.
Table 8. Distribution ratio of zinc for solution A and B with 0.1 M TBP
Solution A Solution B
0.002±0.001 0.003±0.001
4.4.1 CYANEX 923
Extraction of zinc with CYANEX 923 has been performed on all three solutions – A,
B and C. The kinetics of the reaction is quite rapid, and it could be seen immediately after
addition of organic phase, Figure 9 a). In Figure 9 b) to d), photographs of solutions A, B
and C with different concentrations of the extractant after 20 min of shaking are
presented.
The solutions have different pH and by comparing the values of the distribution
ratio, it can be easily concluded that pH had no effect on the extraction of zinc, Table 9. In
addition, the solutions differ in the chloride concentration. Based on a previously
published work regarding the application of solvating extractants, it was expected that an
increase in chloride concentration should lead to an increase in zinc extraction [60], which
was not in accordance with our results.

29
Table 9. Comparison of distribution ratio of zinc extraction for A, B and C solution using 0.005,
0.02 and 0.1 M CYANEX 923
Solution A Solution B Solution C
pH 1.32 1.16 1.06
Cl−(M) 4 5.13 7.9
D (0.005 M CYANEX 923) 0.265±0.006 0.136±0.003 0.211±0.004
D (0.02 M CYANEX 923) 4.5±0.2 2.7±0.1 3.9±0.2
D (0.1 M CYANEX 923) 83±37 56±3 39±11
Figure 9. Photographs of solutions mixed with different concentrations of CYANEX 923; a)
solution A after addition of 0.1 M CYANEX 923, b) Solution A after 20 min of shaking with 0.1
M CYANEX 923, c) Solution B with 0.1 M and d) Solution C with 0.05 M of CYANEX 923
The chloride concentration influences the extraction of zinc. The difference in
extraction trend has been observed between solution A, and B and C. Comparison of
distribution ratio of zinc for all three solutions as a function of different concentration of
extractant is presented in Figure 10. The decrease in distribution ratio has been observed
with the increase in the chloride concentration. On the other hand, the solution C which
contains 8 M concentration of chlorides has higher distribution value than solution B with
5 M concentration of chlorides. Zinc species as a function of chloride concentration, which
can be extracted with a solvating extractant, are ZnCl2, ZnCl 3− and ZnCl 4
2−, as shown in
Figure 6. The solution C contains higher concentration of HCl compared to the synthetic
solutions (10mM). As published by Mishonov et al. high concentration of HCl leads to

30
formation of HZnCl3 and H2ZnCl4, along with ZnCl2. Formation of H2ZnCl4 is predominant
at higher acidity of the aqueous phase [53]. The difference in pH of the solutions can cause
this effect. Nevertheless, it might be said that higher concentration of chlorides impact
extraction of cobalt. Thus, the lower distribution ratio of zinc extraction might be affected
by coextraction of cobalt. Comparison of distribution ratio of cobalt for all three solutions
as a function of different concentration of extractant is presented in Figure 11. The
solution B and C have higher extraction of cobalt, as seen in Figure 11. The effect implies
a limited availability of the extractant for consecutive extraction of both metals.
Figure 10. Comparison of distribution ratios of zinc as a function of extractant concentration; full
square – solution A, full circle – solution B, full triangle – solution C.
The comparison of efficiency of different concentration of CYANEX for all three
solution is presented in Table 9. The maximum of extracted zinc is achieved when 0.1 M
CYANEX 923 was used. Very high extraction of zinc is possible with a concentration of
0.02 M, where more than 50% of zinc has been extracted.
31
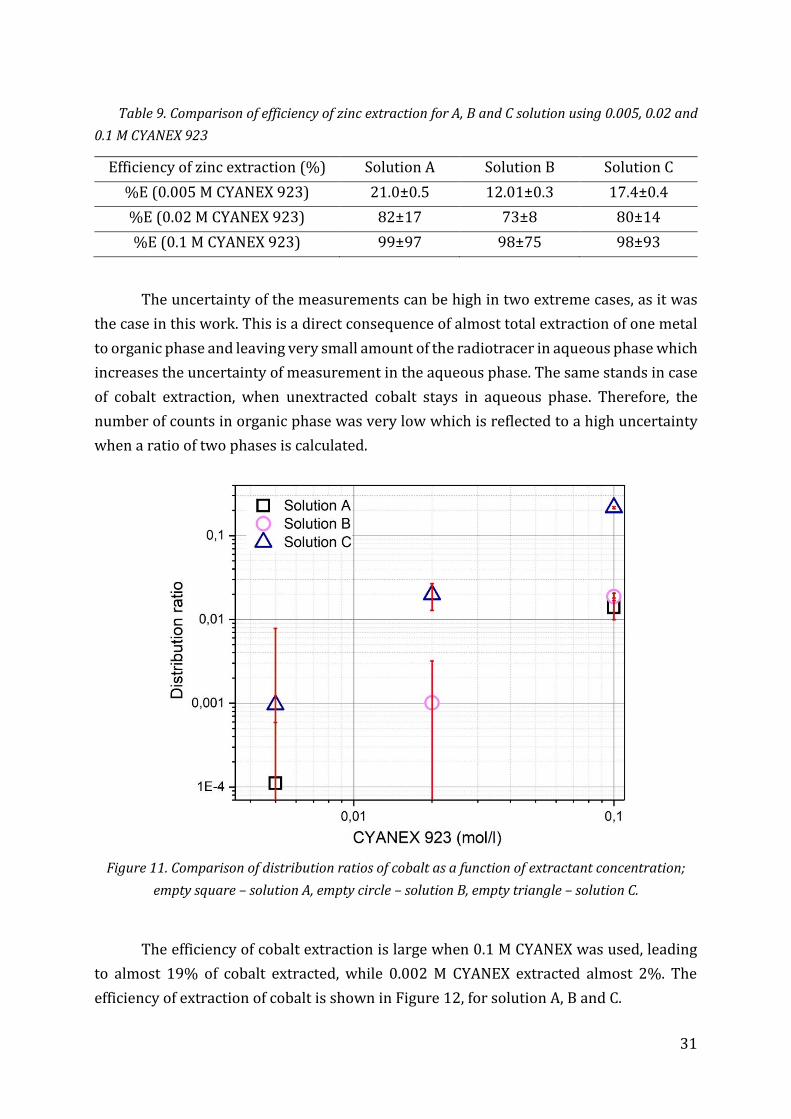
Table 9. Comparison of efficiency of zinc extraction for A, B and C solution using 0.005, 0.02 and
0.1 M CYANEX 923
Efficiency of zinc extraction (%) Solution A Solution B Solution C
%E (0.005 M CYANEX 923) 21.0±0.5 12.01±0.3 17.4±0.4
%E (0.02 M CYANEX 923) 82±17 73±8 80±14
%E (0.1 M CYANEX 923) 99±97 98±75 98±93
The uncertainty of the measurements can be high in two extreme cases, as it was
the case in this work. This is a direct consequence of almost total extraction of one metal
to organic phase and leaving very small amount of the radiotracer in aqueous phase which
increases the uncertainty of measurement in the aqueous phase. The same stands in case
of cobalt extraction, when unextracted cobalt stays in aqueous phase. Therefore, the
number of counts in organic phase was very low which is reflected to a high uncertainty
when a ratio of two phases is calculated.
Figure 11. Comparison of distribution ratios of cobalt as a function of extractant concentration;
empty square – solution A, empty circle – solution B, empty triangle – solution C.
The efficiency of cobalt extraction is large when 0.1 M CYANEX was used, leading
to almost 19% of cobalt extracted, while 0.002 M CYANEX extracted almost 2%. The
efficiency of extraction of cobalt is shown in Figure 12, for solution A, B and C.

32
Figure 12. Comparison of efficiency of cobalt extraction as a function of extractant
concentration; empty square – solution A, empty circle – solution B, empty triangle – solution C.
4.4.2 Slope analysis
CYANEX 923 is a solvating extractant and the following reaction describes the
extraction process:
ZnCln aq(2−n)
+ (n−2)Haq+ + rL H(n−2)ZnCln ∙ rL (33)
Species present in organic phase are presented with a bar above the species.
The equilibrium constant for the reaction will be:
K =H(n−2)ZnCln∙rL
[ZnCln(2−n)
]aq
[H+]aq(n+2)
[L] r (34)
And logarithm of Equation 34 will give
log K = log D − npH − r log[L] (35)

33
Based on the chloride concentration and availability of the zinc chloro-complexes,
it is assumed that n=0, 1, 2. Therefore, the reactions look like Equations 36 - 38:
ZnCl2aq+ rL ZnCl2 · rL (36)
ZnCl3−
aq+ H+
aq + rL HZnCl3 · rL (37)
ZnCl42−
aq+ 2H+
aq + rL H2ZnCl4 · rL (38)
Thus, by plotting log D against log[L] , the slope of a straight line gives the value of
r. The linear fit of log D against log[L] for all three solutions gave a slope of two, indicating
r=2. The linear regression plots for all solutions are shown in Appendix VII. By introducing
the value of the slope to the Equations 36 - 38, a new set of Equations 39 - 41 can
presumably be addressed as the extraction mechanism of the solutions.
ZnCl2aq+ 2L ZnCl2 · 2L (39)
ZnCl3−
aq+ H+
aq + 2L HZnCl3 · 2L (40)
ZnCl42−
aq+ 2H+
aq + 2L H2ZnCl4 · 2L (41)
If considering absence of Zn2+ species based on the Figure 6, and taking into
account the assumption of predominant species - ZnCl2aq, ZnCl3
−aq
and ZnCl42−
aq in
aqueous phase, the distribution ratio of zinc can be written as:
D =[ZnCl2·2L ]+[HZnCl3·2L ]+[H2ZnCl4·2L]
[ZnCl2]aq+[ZnCl 3−]aq+[ZnCl 4
2−]aq
(42)
The concentration of acid in the industrial solution (solution C) is much higher than
what was used for preparation of the synthetic solutions (10mM of HCl). It has been
shown that solvating extractants make acido-complexes such as H2ZnCl4 at high
concentration of acid [53], [56], [60], [69]. Hence, it is possible that in case of solution C
the H2ZnCl4 specie has a higher fraction than in solutions A and B. Therefore, we can
conclude that extraction of zinc in case of solution A predominantly follows Equations 40
- 42. Solution B has lower pH than solution A which provides more hydrogen ions to
contribute to complexation of H2ZnCl4. The decrease in distribution value then can be
addressed to an outcome of competitive reactions and the fraction of ZnCl2aq is too low.
The dominant specie is ZnCl42−
aq but the concentration of hydrogen ions will determine
the fraction of H2ZnCl4 extracted by the extractant. Therefore, distribution ratio of
34
solution B is lower than in the other two solutions. On the other hand, in solution C the
Equations 41 and 42 can be used to explain the mechanism of zinc extraction. This is also
confirmed with values of distribution ratio which fits in between values for solution A and
B.
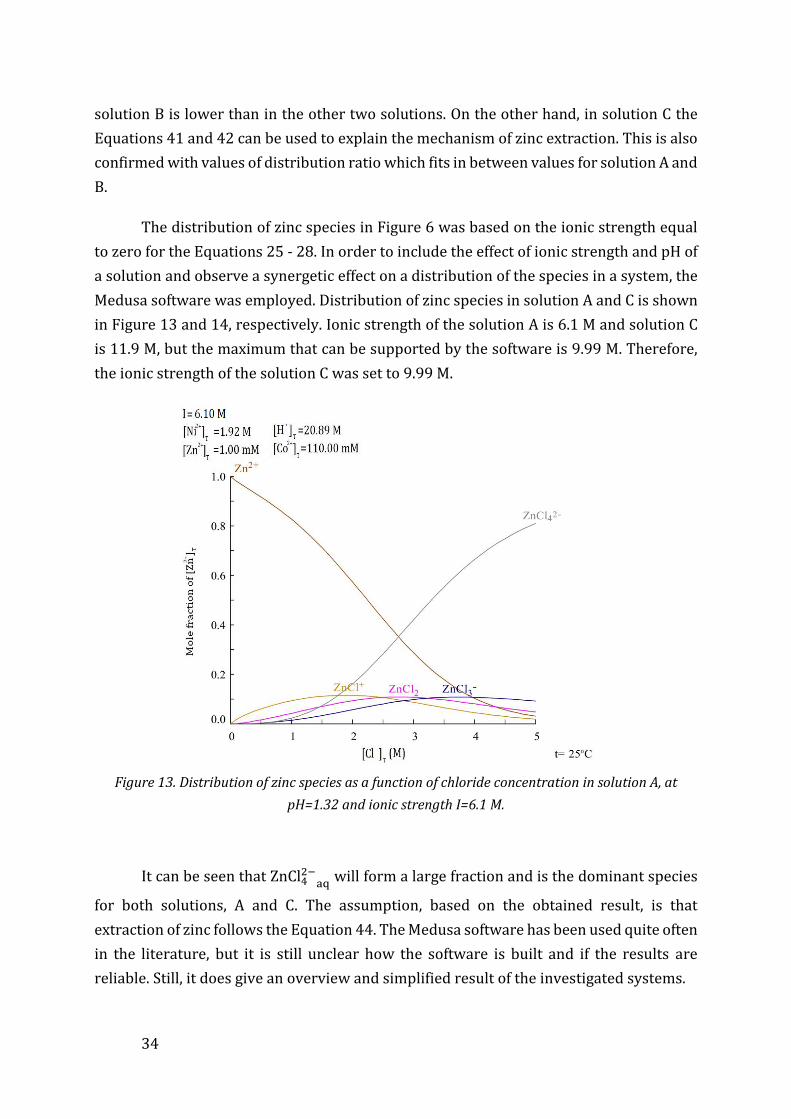
The distribution of zinc species in Figure 6 was based on the ionic strength equal
to zero for the Equations 25 - 28. In order to include the effect of ionic strength and pH of
a solution and observe a synergetic effect on a distribution of the species in a system, the
Medusa software was employed. Distribution of zinc species in solution A and C is shown
in Figure 13 and 14, respectively. Ionic strength of the solution A is 6.1 M and solution C
is 11.9 M, but the maximum that can be supported by the software is 9.99 M. Therefore,
the ionic strength of the solution C was set to 9.99 M.
Figure 13. Distribution of zinc species as a function of chloride concentration in solution A, at
pH=1.32 and ionic strength I=6.1 M.
It can be seen that ZnCl42−
aq will form a large fraction and is the dominant species
for both solutions, A and C. The assumption, based on the obtained result, is that
extraction of zinc follows the Equation 44. The Medusa software has been used quite often
in the literature, but it is still unclear how the software is built and if the results are
reliable. Still, it does give an overview and simplified result of the investigated systems.

35
Figure 14. Distribution of zinc species depending on chloride concentration in solution C,
pH=1.06 and ionic strength I=9.99 M.
For concentration of 0.005, 0.02 M and 0.1 M of CYANEX 923 used, the equilibrium
constant can be calculated for the following Equation:
log K = log D − 2pH − 2 log[L] (44)
The calculated values of stability constant are shown in Table 10. The equilibrium
constants were calculated using Equation 44 for zinc extraction from solution A, B and C
when different concentration of CYANEX 923 were used.
If coextraction of cobalt is taken into consideration it can be seen from the obtained
calculation that the extraction of zinc which was performed from the solution C with 0.05
and 0.02 M CYANEX 923, gave an equilibrium constant of zinc extraction with less than
10% difference. The same value is shown for solution B when 0.005M of CYANEX 923 was
used. The equilibrium constant for solution C confirms that the extraction of zinc follows
a different reaction. In addition, the extraction of zinc when 0.1 M of CYANEX was used in
case of solution C is followed by coextraction of cobalt which reflects on the value of
equilibrium constant.
Table 10. Calculated values of equilibrium constants with standard deviations* of zinc
extraction from all three solution when 0.05, 0.02 and 0.1 M of CYANEX 923 were applied

36
Concentration of
CYANEX 923 (M)
Calculated values of equilibrium constant
Solution A Solution B Solution C
0.005 24±7 26±8 64±19
0.02 26±8 32±9 75±22
0.1 19±10 26±8 1.5±0.6
*the standard deviation was calculated based on the standard deviation of a fraction, Appendix I (Equation 5)
37
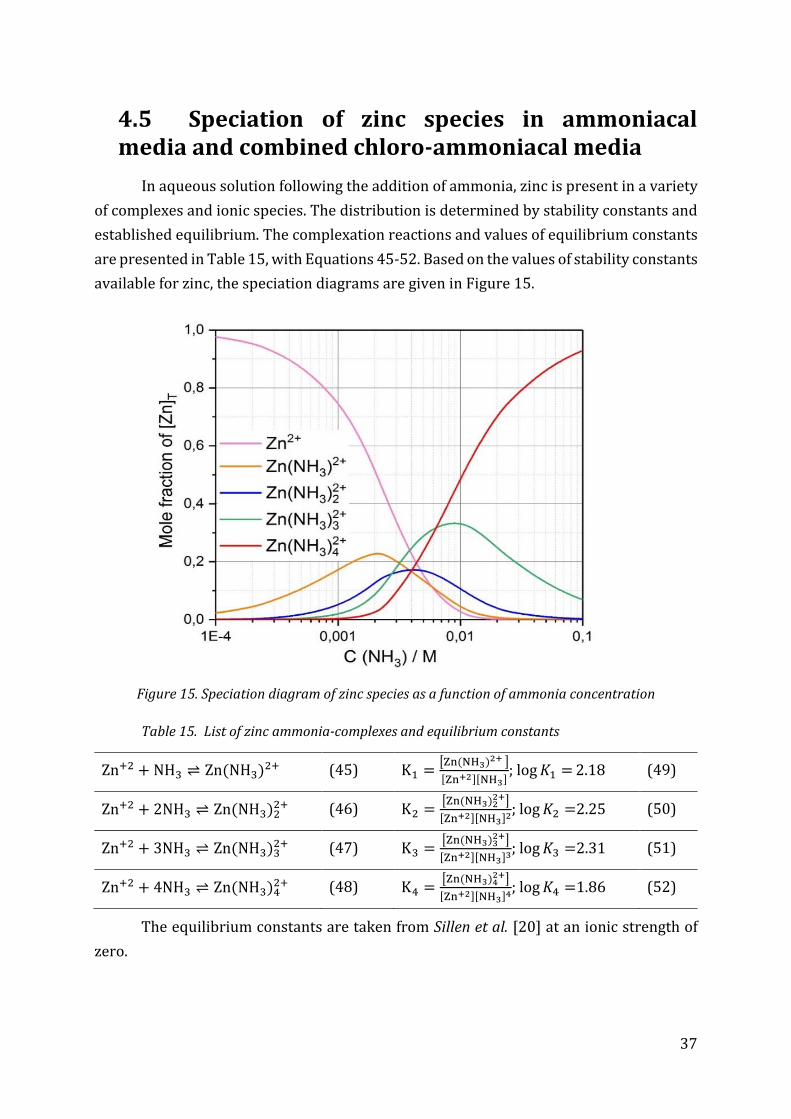
4.5 Speciation of zinc species in ammoniacal media and combined chloro-ammoniacal media
In aqueous solution following the addition of ammonia, zinc is present in a variety
of complexes and ionic species. The distribution is determined by stability constants and
established equilibrium. The complexation reactions and values of equilibrium constants
are presented in Table 15, with Equations 45-52. Based on the values of stability constants
available for zinc, the speciation diagrams are given in Figure 15.
Figure 15. Speciation diagram of zinc species as a function of ammonia concentration
Table 15. List of zinc ammonia-complexes and equilibrium constants
Zn+2 + NH3 Zn(NH3)2+ (45) K1 =[Zn(NH3)2+ ]
[Zn+2][NH3]; log 𝐾1 = 2.18 (49)
Zn+2 + 2NH3 Zn(NH3)22+ (46) K2 =
[Zn(NH3)22+]
[Zn+2][NH3]2; log 𝐾2 =2.25 (50)
Zn+2 + 3NH3 Zn(NH3)32+ (47) K3 =
[Zn(NH3)32+]
[Zn+2][NH3]3; log 𝐾3 =2.31 (51)
Zn+2 + 4NH3 Zn(NH3)42+ (48) K4 =
[Zn(NH3)42+]
[Zn+2][NH3]4; log 𝐾4 =1.86 (52)
The equilibrium constants are taken from Sillen et al. [20] at an ionic strength of
zero.

38
If ammonia is added to a solution of zinc and high concentration of chlorides, a
complexation reaction of the ligands will take place. In addition, ammonia and chloride
ions have competitive coordination capabilities with free zinc ions, which is dependent
on their concentration [22]. Higher stability constant will determine which of the
complexation reaction will occur, since Gibs free energy (G) is proportional to the
formation constant (Kf), given as ∆G0=-RT ln Kf. The consecutive reactions of replacing
chlorides bonded to zinc will occur, as concentration of ammonia increases.
If we take into
consideration a fixed
concentration of chloride ions
in a system, e.g. 4 M as given in
Figure 16 a) and 8 M in Figure
16 b), a variation in ammonia
concentration will result in a
formation of different ammonia
complexes. If consecutive
replacement of chlorides by
ammonia occur, a double-
ligand system with zinc is also
an option. Adjusting the
composition of the aqueous
phase by addition of ammonia
in order to extract zinc species
with cationic extractant, must
lead to formation of positively
charged complexes.
It can be seen in Figures
16 a) that a 0.04 M
concentration of ammonia was
sufficient for the formation of
zinc ammonia complexes while
the fraction of zinc chloride
species was less. The concentration of chloride ions was fixed to 4 M, which corresponds
to concentration of chloride ions present in solution A. Thus, a region of interest was
defined as a necessary concentration of ammonia which will provide a positively and
extractable complexes. The range is set to 0.04 - 0.1 M ammonia present in the solution A.
Figure 16. Speciation diagram of zinc species as a
function of ammonia concentration at fixed concentration
of chlorides; a) 4 M, b) 8 M

39
The Figure 16 b) shows a fraction of zinc species when the chloride concentration
corresponds to the concentration given in the solution C. It can be observed from Figure
16 b), that higher demands of ammonia are needed, and fractions of chloro-complexes
will still be present after having of 0.1 M ammonia in solution.
A disadvantage of the zinc speciation presentation as in Figure 16 a) and b),
obtained with the Origin software, is a lack of known formation constants of double-ligand
complexes – Zn-Cl-NH3. All combinations of both ligands attached to the metal were
expected and an increase in complexity of investigated systems elevated. That means that
a combination of more ligands with one metal couldn’t be presented with manual
calculations. In addition, a distribution of species as a function of pH of solutions was a
parameter of interest, which cannot be included in this calculation. Therefore, the Medusa
software was used to obtain a better overview of the extractable species. The software is
capable of taking ionic strength into consideration while the species presented in Figure
16 were based on zero ionic strength of solutions. The speciation of zinc complexes as a
function of pH, calculated with Medusa software is shown in Figure 17.
Figure 17. Speciation of zinc complexes calculated using Medusa software. Concentration of
ammonia was fixed to 0.04 M
The Medusa software shows distribution of the species while concentration of
chlorides and ammonia are fixed, while pH is varied within a predetermined region. This
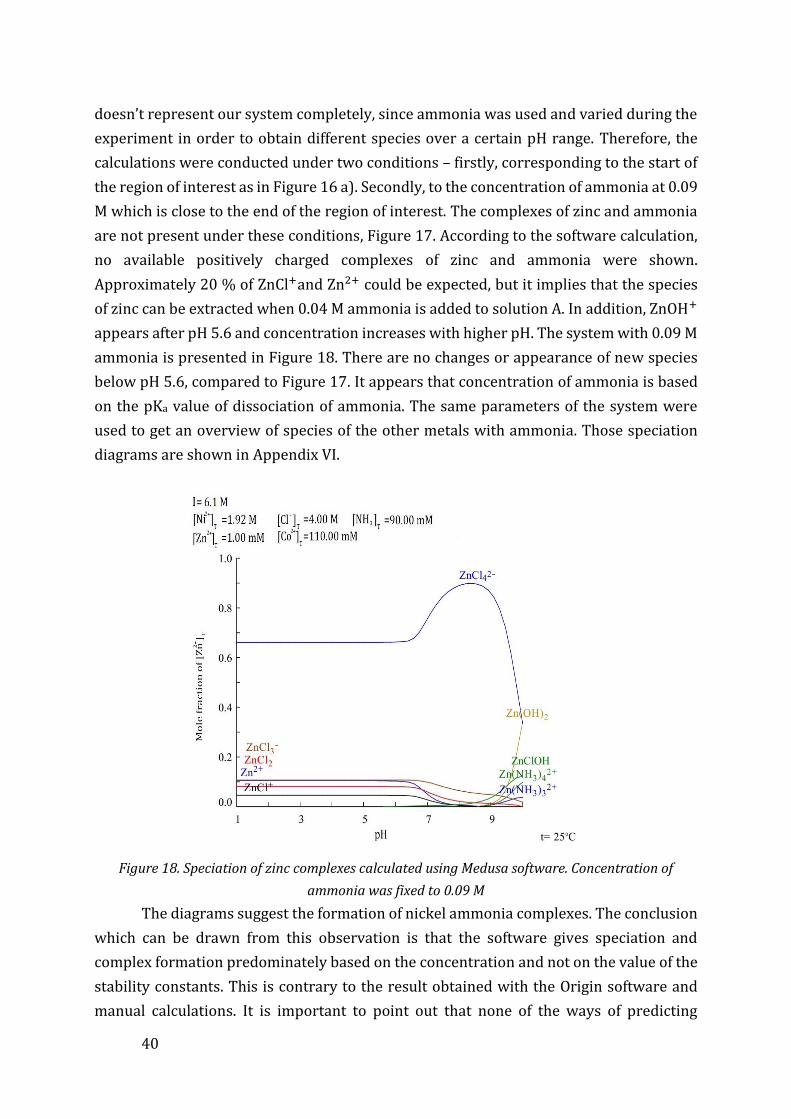
40
doesn’t represent our system completely, since ammonia was used and varied during the
experiment in order to obtain different species over a certain pH range. Therefore, the
calculations were conducted under two conditions – firstly, corresponding to the start of
the region of interest as in Figure 16 a). Secondly, to the concentration of ammonia at 0.09
M which is close to the end of the region of interest. The complexes of zinc and ammonia
are not present under these conditions, Figure 17. According to the software calculation,
no available positively charged complexes of zinc and ammonia were shown.
Approximately 20 % of ZnCl+and Zn2+ could be expected, but it implies that the species
of zinc can be extracted when 0.04 M ammonia is added to solution A. In addition, ZnOH+
appears after pH 5.6 and concentration increases with higher pH. The system with 0.09 M
ammonia is presented in Figure 18. There are no changes or appearance of new species
below pH 5.6, compared to Figure 17. It appears that concentration of ammonia is based
on the pKa value of dissociation of ammonia. The same parameters of the system were
used to get an overview of species of the other metals with ammonia. Those speciation
diagrams are shown in Appendix VI.
Figure 18. Speciation of zinc complexes calculated using Medusa software. Concentration of
ammonia was fixed to 0.09 M
The diagrams suggest the formation of nickel ammonia complexes. The conclusion
which can be drawn from this observation is that the software gives speciation and
complex formation predominately based on the concentration and not on the value of the
stability constants. This is contrary to the result obtained with the Origin software and
manual calculations. It is important to point out that none of the ways of predicting

41
available species in the system take zinc ammonia chloride species into consideration.
The species are disregarded from the system, due to limited obtainability of stability
constants. Nevertheless, those reactions will be taken into consideration in the hypothesis
of the mechanism in this work. The formation of zinc ammonia complexes goes under
consecutive replacement of chloride ions as the chloride ions are taken as an initial ligand
and present in higher concentration than ammonia. A variation in numbers of ammonia
and chloride ions bonded to zinc can’t be excluded.
4.6 CYANEX 272
4.6.1 Effect of pH
The extraction of zinc was first tested on solution A using 0.1 M CYANEX 272. The
dependency of zinc distribution ratio of pH is given in the Figure 19 a). The extraction is
enhanced by an increase in pH which agrees with previous published data. The observed
S-shaped curve, a characteristic of cationic extractants, represents the zinc extraction
from solution A obtained with 0.1 M of CYANEX 272, Figure 19. The distribution ratio of
zinc from the solution A at the initial pH of 1.32, was lower than values published in the
literature. It has been reported that adjustment of pH should give almost 100% of
extracted zinc by reaching pH 3-3.5, while the extraction can start at pH=1.0 [31], [52].
Nevertheless, in case of the investigated solution A, the increase in pH towards higher
values, by reaching pH=2, reasons less than 10% of zinc extracted.
a)
b)
Figure 19. Distribution ratio of zinc extraction from solution A as a function of a) pH and b) concentration
of ammonia, when 0.1 M of CYANEX 272 was used.

42
The distribution ratio is 0.09 at pH 2. An increase in distribution ratio occurred
when pH of the solution was above 5. The extracting agent has been “activated” in that
region of concentration of ammonia present in the aqueous phase. The “activation” refers
to a formation of extractable species. If the values of distribution ratio are plotted against
concentration of ammonia in the solution A, Figure 19 b), the activation of the extractant
can be related to the formation of zinc ammonia complexes. Concentration of 0.03 M of
ammonia was sufficient for distribution ratio of 1.44. A similar correlation is shown in the
Figure 16 a). The 0.04 M concentration of ammonia was referred as a starting point of the
region of interest, where most of the chloride complexes lessens. This can also imply that
the replacement of chloride ions has taken place at lower concentration of ammonia
present in the solution. It can be assumed that zinc forms complexes with both ligands
under these conditions, e.g. ZnNH3Cl+, Zn(NH3)2Cl+ and Zn(NH3)3Cl+.
The distribution ratio of cobalt is in the range of 2 ∙ 10−4 − 0.02 for the pH below
4.62. The upper limit of the range is due to separation error, since only one replica had
higher distribution ratio. The list is given in Appendix VIII. Therefore, the coextraction of
cobalt was not observed at pH below 4.62. Coextraction of cobalt is observed at pH 5.49,
when 1.83% of cobalt is extracted. The coextraction happens in the same range of
extractant’s “activation” for zinc. It follows the zinc extraction and maximum of cobalt
extracted is 15% at pH=5.62.
Figure 20. Extraction efficiency of zinc and cobalt over a pH range 1-6 from solution A.

43
On the other hand, the extraction of cobalt at pH lower than 4.6 has been previously
reported [7]. The reported pH region for cobalt and nickel extractions are 3.2 – 5 and 4.6
– 6.1, respectively. In the case of solution A, the cobalt extraction is also shifted towards
higher pH values. Due to this effect it might be assumed that nickel hasn’t been extracted.
Since the extraction of cobalt hasn’t started below pH 4.62, it can be expected that the
reactions of separation of metals are shifted to higher values of pH for all three cations
present in the solution. Cobalt extraction is very low and distribution ratio for zinc is
between 0.1 and 1.44, for pH 4.93 and 5.28 respectively. The zinc extraction, leaving
cobalt in aqueous phase, can be conducted at pH close to 5. The list of distribution ratios
for zinc and cobalt are given in Appendix VIII.
CYANEX 272 can be utilized as an extractant on the synthetic solution A, along with
ammonia, and therefore the same parameters were used for extraction of zinc from the
industrial solution, solution C. The concentration of ammonia needed to adjust pH was
much higher. It reflects the variety of metals present in the solution which can form
complexes with ammonia. The extraction of zinc started at a pH lower than expected,
based on the finding related to the extraction from the solution A. The same dependency
on ammonia concentration has been observed where a certain concentration of ammonia
is needed in order to extract zinc. The increase in distribution ratio of zinc starts at
pH=3.81, Figure 21.
Figure 21. Distribution ratio of zinc extraction from solution C as a function of pH when 0.1 M of
CYANEX 272 was used.

44
Efficiency dependency on pH for both metals are shown in Figure 22 and the
coextraction of cobalt seems unavoidable. The pH of cobalt extraction is in agreement
with the publications compared to the solution A [7]. Efficiency of the extractant for zinc
over cobalt is also affected by coextraction of cobalt, due to limited capacity of the
extractant. The zinc extraction decreased to 80% compared to solution A, where 100% of
zinc was extracted.
Figure 22. Extraction efficiency of zinc and cobalt over a pH range 1-5 from solution C.
The extraction of zinc and cobalt was investigated from both solutions using
different concentrations of the extractant. The same trend was observed for 0.02 and
0.004 M concentrations of CYANEX 272. The three-dimensional presentations of the
dependency of distribution ratio of zinc and cobalt, over pH and ammonia for three
different concentration of CYANEX 272 are shown in Figure 23 a) and b).

45
a)
b)
Figure 23. Three-dimensional presentations of the dependency of distribution ratio over pH and
ammonia for three different concentration of CYANEX 272, a) zinc and b) and cobalt from
solution C.
The pH of the increase in distribution ratio occurs at pH around 4 for the both
solutions, contrary to published results which reported pH 2. The slope of the S-curve is
very steep and the extraction reaction is quite rapid over the pH range. The adjustment of
pH, in order to gain more values of the distribution ratios, was difficult to obtain. Minor
change in pH resulted in a high variation in distribution ratios. The shift in pH of extraction
shows that the reaction is related to the complexation reactions. Binary ligand-systems
exists in a vast possibility of the formed complexes with metal. In addition, it is not clear
if the exchange is driven by thermodynamics or kinetics. Thus, the limiting step can be
only assumed. Therefore, a hypothesis of a possible zinc extraction mechanism is
proposed, based on the parameters and components included in the investigated systems.
4.6.2 Slope analysis
The slope analysis was used in order to determine the number of molecules of
extractant needed to accomplish extraction of one metal ion. Linear regression of the
distribution ratio dependency over pH is presented in the Figure 24, for solution A when
0.1 M CYANEX was used. Sole et al. showed that CYANEX 272 undergoes self-association
as a result of hydrogen bonding [7]. The degree of self-association depends on the nature,
mainly on the size, of the donor’s atoms. If the donor atom is smaller it will cause higher
repulsion in the ring. The effect is due to a steric factor in which four chelate rings are
replaced by ligands with less strain among each other. Therefore, if CYANEX 272 is
considered a dimer and, the following reaction describes the extraction process:
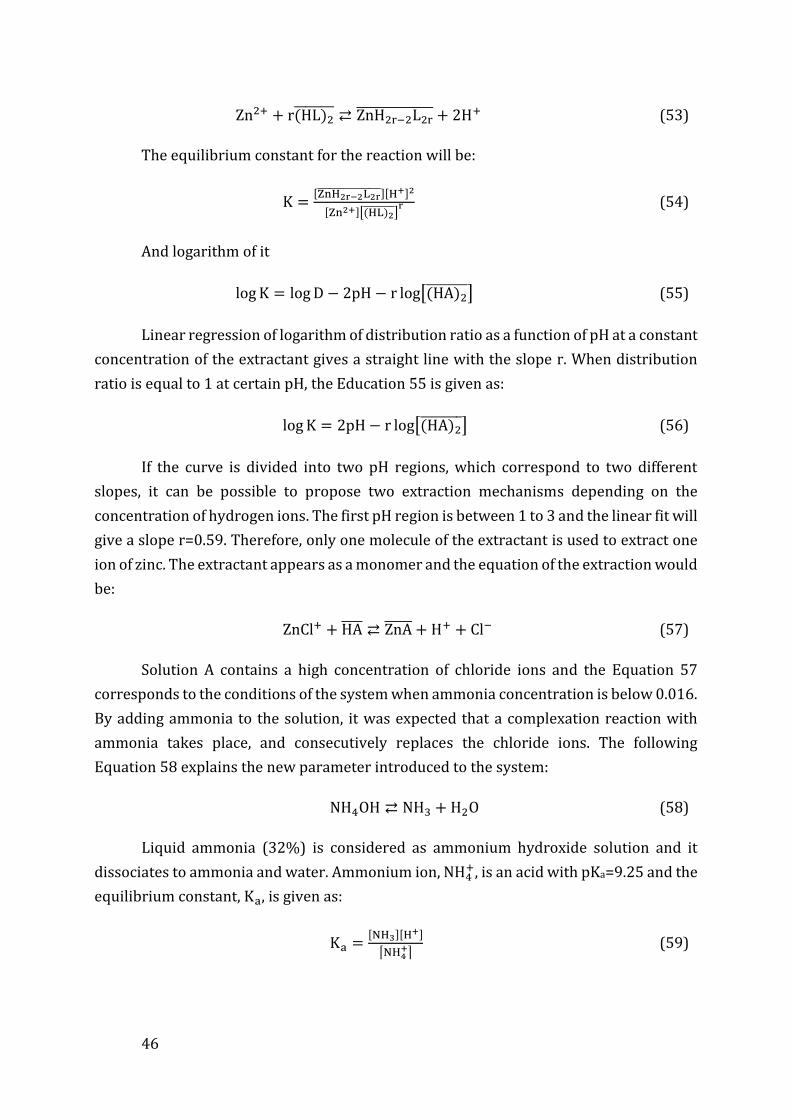
46
Zn2+ + r(HL)2 ZnH2r−2L2r
+ 2H+ (53)
The equilibrium constant for the reaction will be:
K =[ZnH2r−2L2r ][H+]2
[Zn2+][(HL)2 ]
r (54)
And logarithm of it
log K = log D − 2pH − r log[(HA)2 ] (55)
Linear regression of logarithm of distribution ratio as a function of pH at a constant
concentration of the extractant gives a straight line with the slope r. When distribution
ratio is equal to 1 at certain pH, the Education 55 is given as:
log K = 2pH − r log[(HA)2 ] (56)
If the curve is divided into two pH regions, which correspond to two different
slopes, it can be possible to propose two extraction mechanisms depending on the
concentration of hydrogen ions. The first pH region is between 1 to 3 and the linear fit will
give a slope r=0.59. Therefore, only one molecule of the extractant is used to extract one
ion of zinc. The extractant appears as a monomer and the equation of the extraction would
be:
ZnCl+ + HA ZnA + H+ + Cl− (57)
Solution A contains a high concentration of chloride ions and the Equation 57
corresponds to the conditions of the system when ammonia concentration is below 0.016.
By adding ammonia to the solution, it was expected that a complexation reaction with
ammonia takes place, and consecutively replaces the chloride ions. The following
Equation 58 explains the new parameter introduced to the system:
NH4OH NH3 + H2O (58)
Liquid ammonia (32%) is considered as ammonium hydroxide solution and it
dissociates to ammonia and water. Ammonium ion, NH4+, is an acid with pKa=9.25 and the
equilibrium constant, Ka, is given as:
Ka =[NH3][H+]
⌈NH4+⌉
(59)
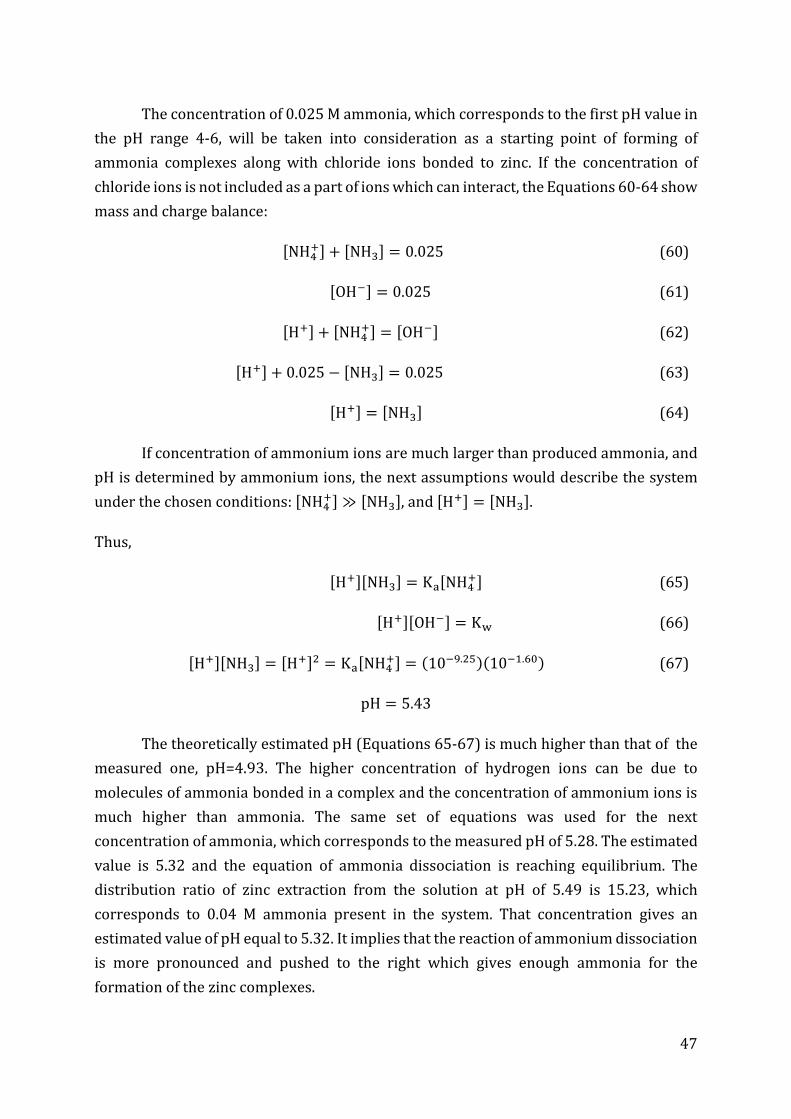
47
The concentration of 0.025 M ammonia, which corresponds to the first pH value in
the pH range 4-6, will be taken into consideration as a starting point of forming of
ammonia complexes along with chloride ions bonded to zinc. If the concentration of
chloride ions is not included as a part of ions which can interact, the Equations 60-64 show
mass and charge balance:
[NH4+] + [NH3] = 0.025 (60)
[OH−] = 0.025 (61)
[H+] + [NH4+] = [OH−] (62)
[H+] + 0.025 − [NH3] = 0.025 (63)
[H+] = [NH3] (64)
If concentration of ammonium ions are much larger than produced ammonia, and
pH is determined by ammonium ions, the next assumptions would describe the system
under the chosen conditions: [NH4+] ≫ [NH3], and [H+] = [NH3].
Thus,
[H+][NH3] = Ka[NH4+] (65)
[H+][OH−] = Kw (66)
[H+][NH3] = [H+]2 = Ka[NH4+] = (10−9.25)(10−1.60) (67)
pH = 5.43
The theoretically estimated pH (Equations 65-67) is much higher than that of the
measured one, pH=4.93. The higher concentration of hydrogen ions can be due to
molecules of ammonia bonded in a complex and the concentration of ammonium ions is
much higher than ammonia. The same set of equations was used for the next
concentration of ammonia, which corresponds to the measured pH of 5.28. The estimated
value is 5.32 and the equation of ammonia dissociation is reaching equilibrium. The
distribution ratio of zinc extraction from the solution at pH of 5.49 is 15.23, which
corresponds to 0.04 M ammonia present in the system. That concentration gives an
estimated value of pH equal to 5.32. It implies that the reaction of ammonium dissociation
is more pronounced and pushed to the right which gives enough ammonia for the
formation of the zinc complexes.

48
ZnCl+ + nNH3 Zn(NH3)nCl+ (68)
Where n can have values from 1-4, or
ZnCl3− + 3NH3 Zn(NH3)3Cl+ (69)
ZnCl3− + 4NH3 Zn(NH3)4Cl+ (70)
ZnCl4− + 3NH3 Zn(NH3)3Cl+ (71)
ZnCl4− + 4NH3 Zn(NH3)4Cl+ (72)
A linear fit of the curve in the region of pH=4-6 gives a slope of 3.61, Figure 24.
Approximately 4 molecules are needed to extract one zinc ion. Keeping in mind previously
proposed complexes in that region, it can be assumed that a different mechanism of
extraction occurs. The number of extractant molecules cannot be explained with the
abovementioned Equations 53-56, which describe extraction with the cationic
extractants. The highest valence of the zinc complex is correlated to the valence state of
zinc, and therefore it cannot be bonded to more than 2 ions of the extractant. Including
ammonia - hydrogen exchange with the extractant molecules is not possible.
Figure 24. Linear fit analyses performed on the zinc distribution ratio curve obtained with 0.1 M
CYANEX 272, in two different pH regions.

49
Proposing the following hypothesis, the results can be explained to a certain level.
If Equations 70 and/or 72 are taken into consideration, Equation 73 can be introduced as
a possible explanation of the reactions within the extraction process.
Zn(NH3)4Cl+ + 2(HA) 2 Zn(NH3)2(L2)2
+ 2pH + 2NH4+ (73)
The same can be applied for Equation 72. Therefore, if CYANEX 272 forms a dimer
when the equilibrium is reached the usage of 4 molecules of the extractant can be related
to the calculation of the slope, Figure 24. That would also imply that centers of binding of
the reagent to zinc ion, would lead to release of two ammonia molecules which would
form ammonium ions by attracting one hydrogen ion per molecule of ammonia available
due to dimerization of the extractant. This is very hard to prove by the obtained results
and employing more techniques, such as Raman spectroscopy, is necessary.
The slope analysis was performed for all three concentrations of the extractant
used. The obtained values of the slope vary between 3.61-1.48 for pH region 4-6 for the
two solutions when different concentrations of the extractant were used. Lower
concentrations of an extractant and lack closer values in distribution ratio increase the
uncertainty of determination of the slope, see Figure 1 c) Appendix VIII. The uniformity
of the determined number of extractant’s molecules is low for the different concentration
of the extractant applied. Therefore, estimating the equilibrium constant was not attained.
Comparable results were observed for the solution C as well, Figure 25. The
analysis of the extraction curve for the whole process can only be performed as a
polynomial fit. Coextraction of cobalt is present from pH 3.81 and reaches almost 20% by
pH 4.5. Nevertheless, the first four points in the pH region 3.81 – 4.5 of the curve, were
taken for a linear fit analysis. The distribution ratios of coextracted cobalt range between
0.001 to 0.1 for the investigated region. The slope is 3.40 which is in close agreement with
the results obtained for solution A. The similarity in the mechanism was confirmed.
Nevertheless, the coextraction of metals reflects on the equilibrium constant and
therefore estimating the constant was not performed.

50
Figure 25. Linear fit analyses performed on the distribution ratio curve over pH=3.81-4.23
region, obtained with 0.1 M CYANEX 272, for solution C.
The extraction of zinc from solution B was not possible by using CYANEX 272. The
concentration of chloride ions was too high, and the solution was close to saturation with
NaCl. Moreover, addition of ammonia did not affect the extraction which implies there is
no formation of the extractable complexes. It also suggests that water molecules have a
certain role in the complexation of zinc which requires further investigation.
The pH of the solution is 5.60 which corresponds to pH of the maximum of
extracted zinc (in %). However, the complexes available were ZnCl3−and ZnCl4
− and a
variation in ammonia concentration in the solution did not lead to the formation of the
extractable complexes with ammonia. This does not exclude a formation of binary ligand
systems. The charge of the complexes is negative. The added ammonia corresponded to
the range used for A and C solution – 0.025 – 0.06 M. All aliquots had same pH, 5.60, which
confirms that the solution was in a buffer region at that pH. The list of distribution ratios
for different concentrations of ammonia in the solution is given in Appendix VII.

51
4.6.3 Future work with CYANEX 272
The given distribution curves for both solutions, A and C, obtained with CYANEX
272, using different concentrations of the extractant did not reveal the extraction
mechanism. The number of the extractants used for extraction was not determined. Thus,
more variations in pH range are necessary.
A proposed method of estimating the constant would be to apply a low
concentration of the extractant, such as 0.003-0.005 M on the solution A at pH 4.9-5.2 with
at least 4 different pH points and determine a slope of the obtained curve under these
conditions. Afterwards, the constant can be used to estimate the number of molecules
needed in case of solution C and performed a linear fit analysis in the lower part of the
curve, in pH 3.6-4.2 when less cobalt is extracted.
Moreover, employing different techniques can give more information regarding
the extracted species. Therefore, future work - experiments performed on the solutions
in order to confirm or disregard the proposed hypothesis, would be:
- Raman or IR spectroscopy performed on the organic phase, in order to
determine the presence of ammonia and number of coordination places. The
same could be performed on the aqueous phase and investigate the
complexation of zinc between two ligands present in the solution, by varying
the concentration of the ammonia.
- Determination of ammonia concertation in organic and aqueous phases after
the separation, in order to find the amount of transferred ammonia.
- Use of 63Ni radiotracer to determine if nickel enrolls the extraction process at
lower pH.
- Investigation of water involvement in organic phase and solubility of the
extractant. And, 3H could be used to track water molecules if any of them
surround and form complexes with zinc.

52
5 Conclusion
An investigation of zinc extraction mechanism from synthetic and industrial
solutions was performed in this work. The synthetic solutions were prepared in
laboratory and the purpose was to mimic properties of the industrial solution. The
industrial solutions are generally very complex and different than laboratory prepared
solutions. Therefore, the objective for preparing the synthetic solution was to have
simplified overview of the ions’ interactions, formation of complexes, stability, and
extractability. This was conducted in order to study the extraction reactions and postulate
a hypothesis of the extraction mechanism. The hypothesis based on the results obtained
from synthetic solutions would be applied and investigated further on industrial
solutions.
Distribution of zinc and cobalt were studied in this work by using 60Co and 65Zn
radiotracers. Gamma spectroscopy was used to determine distribution of zinc and cobalt
between the organic and aqueous phases. Screening of several types of reagents were
performed with the purpose of finding a suitable extractant. Two extractants, CYANEX
923 and CYANEX 272, were shown as possible candidates for extraction of zinc from these
solutions. The effects of the extractants’ and chloride ions concentrations on the
extraction behavior in three different studies were examined.
The applied methods of preparation and separation of the phases were effective.
Consistency in the results and low uncertainty showed effectiveness of the separation
method and limitation of entrainment as a possible cross contamination of the phases.
The results obtained showed that CYANEX 923 can be applied on all three different
solutions and the extraction of zinc was very effective. The coextraction of cobalt occurred
in case of the solution C when 0.02 and 0.1 M CYANEX 923 was used. Low concentration
of the extractant used could be beneficial in terms of avoiding coextraction. This is
confirmed with no extracted cobalt when 0.005 M CYANEX 923 was used, but the
distribution ratio is very low. A concentration of CYANEX 923 between 0.005 and 0.02 M
could be performed in future work, where a higher distribution ratio would be achieved
and lower concentration of the extractant applied would mean lower costs.
Ability to use a cationic extractant to extract zinc from these solutions was
investigated as well. The extractant was used after the pH of the aqueous phase was
adjusted with ammonia. Ammonia was shown as a very good ligand to be applied on these
solutions. This is due to very high stability constants with zinc over other cations present
in the solutions. The pH of extraction was shifted to higher values, but no extraction of

53
cobalt was noticeable in case of solution A. Therefore, it was assumed that extractions of
other cations present in solution A were not extracted along with zinc. The extractant was
not effective as CYANEX 923 in separation of zinc over cobalt, since in case of solution C
cobalt was coextracted in the same pH range as zinc. In addition, the determination of
number of molecules of the extractant used, was not possible to conclude. The slope
analysis performed on the obtained results gave finding which need to be more
investigated. Therefore, a hypothesis was proposed in order to explain the results.
Further work on these systems and the extractant is needed. The extraction of zinc from
solution B was not possible, which opened a question of an involvement of water in the
solutions. This needs to be investigated more and hence some of the future work was
proposed.
Application of CYANEX 923 and CYANEX 272 on these systems was effective. Some
of the extraction reaction were proposed, and some questions need further investigation
and examination. This also confirms the complexity of the industrial solutions and the
extent of the difference between laboratory and industrial solutions.

54
6 Appendix
Appendix I
Calculation of uncertainty of detection
The uncertainty σ in measurements of radioactivity is given as a square root of the
number of counts Nc, Equation 1:
σN = √NC (1)
The count rate is defined as a ratio of the number of counts and the counting time
t:
R =Nc
t (2)
The rate depends on the efficiency, ε, of the detector and the activity, A, of the
sample as:
R =A
ε (3)
Therefore, the uncertainty in the count rate is equal to:
σR =σN
t (4)
The general formula for expressing a standard error of a fraction is:
σf
f= √(
σx
x)
2
+ (σy
y)
2
(5)
Similarly, the uncertainty in the distribution ratio can relate to the Equation
(above), since the distribution ratio is given as in Equation 1, page 6.
σD = D√(σR,org
Rorg)
2
+ (σR,aq
Raq)
2
(6)
Where Rorg is the count rate measured in organic phase, σR,org is the uncertainty
of the count rate measured in organic phase, and same stands for Raq and σR,aq.
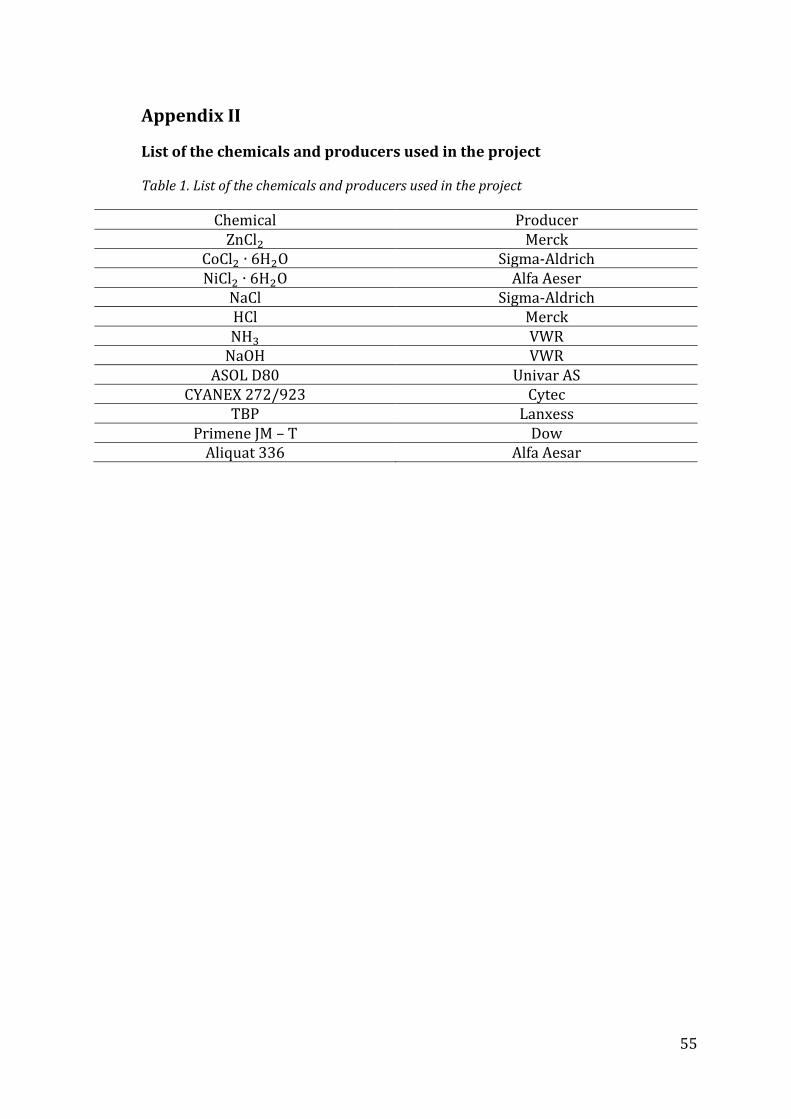
55
Appendix II
List of the chemicals and producers used in the project
Table 1. List of the chemicals and producers used in the project
Chemical Producer ZnCl2 Merck
CoCl2 ∙ 6H2O Sigma-Aldrich NiCl2 ∙ 6H2O Alfa Aeser
NaCl Sigma-Aldrich HCl Merck NH3 VWR
NaOH VWR ASOL D80 Univar AS
CYANEX 272/923 Cytec TBP Lanxess
Primene JM – T Dow Aliquat 336 Alfa Aesar
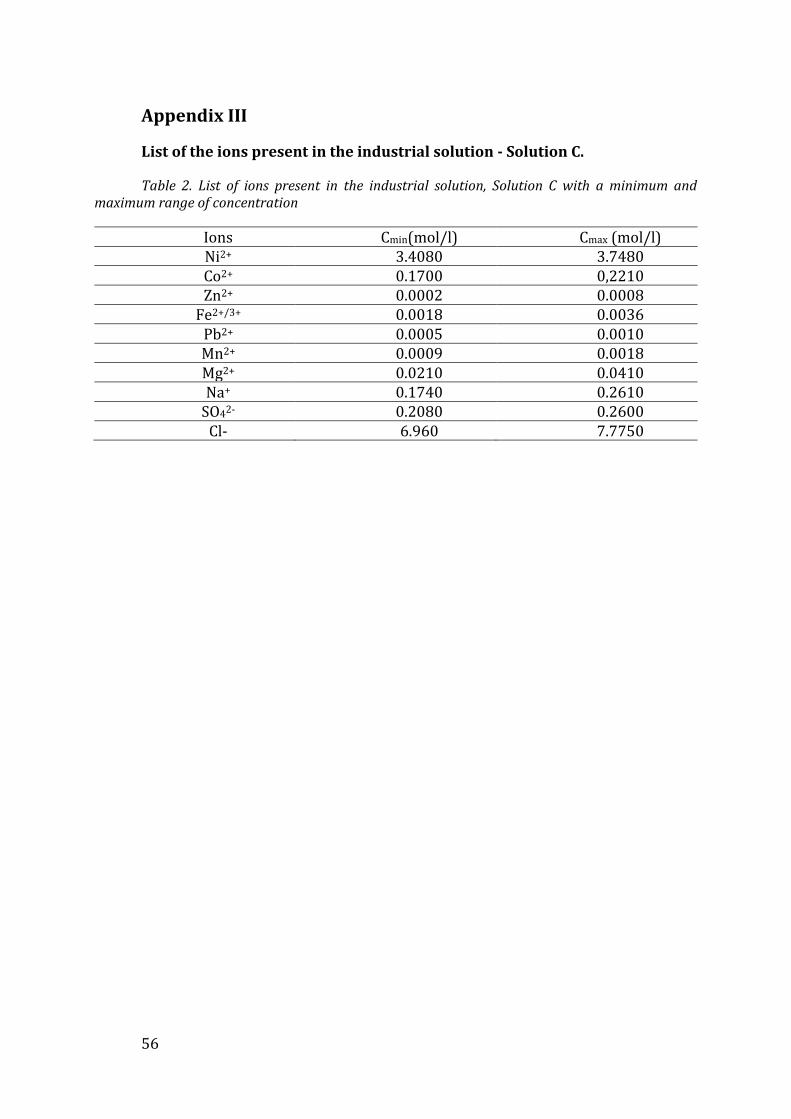
56
Appendix III
List of the ions present in the industrial solution - Solution C.
Table 2. List of ions present in the industrial solution, Solution C with a minimum and maximum range of concentration
Ions Cmin(mol/l) Cmax (mol/l) Ni2+ 3.4080 3.7480 Co2+ 0.1700 0,2210 Zn2+ 0.0002 0.0008
Fe2+/3+ 0.0018 0.0036 Pb2+ 0.0005 0.0010 Mn2+ 0.0009 0.0018 Mg2+ 0.0210 0.0410 Na+ 0.1740 0.2610
SO42- 0.2080 0.2600 Cl- 6.960 7.7750

57
Appendix IV
Uncertainty of the pH measurements
The pH measurements were performed three times on the same solution, e.g.
solution A, B and C. The 20 ml-solution is divided into 9 aliquots, which are then used as
the aqueous phase in the experiments. The pH is given as a mean value of three
consecutive measurements:
𝑝𝐻 =1
n∑ pHn
1 (7)
and n=3.
The uncertainty is defined based on the uncertainty of the preparation of aqueous
phase, since the uncertainty of ammonia withdrawal has the greatest uncertainty as it was
dictated by a pipette uncertainty and random error. Therefore, the uncertainty of all pH
measurements was defined based on the two replicas and the following Equation 8.
𝜎𝑝𝐻 = √∑(𝑝𝐻−𝑝𝐻 )2
𝑁−1 (8)
It refers to two samples of 20 ml which supposedly must have same pH value,
adjusted by adding the same volume of ammonia, see Table 3. The discrepancy in the pH
was used to define the uncertainty.
Table 3. Values of pH measurements conducted on two replicas (20 ml each)
pH1 pH2 pH3 Mean value
of pH 𝜎𝑝𝐻
Replica 1 5.36 5.39 5.40 5.38 0.021
Replica 2 5.42 5.44 5.44 5.43 0.012
And the uncertainty was calculated as a mean value of the ones shown in the table
3, which gives a value of 0.033. The uncertainty is then rounded to a higher value and 0.04
is used during the whole project.

58
Appendix V
Lists of zinc complexes and equilibrium constants used in this work
Table 4. List of zinc chloro-complexes and equilibrium constants
Zn2+ + Cl− ZnCl+ (9) K1 =[ZnCl+]
[Zn2+][Cl−]; log10K1 = 0.40* (13)
Zn2+ + 2Cl− ZnCl2 (aq) (10) K2 =[ZnCl2]
[Zn2+][Cl−]2; log10K2 = 0.69* (14)
Zn2+ + 3Cl− ZnCl3− (11) K3 =
[ZnCl]3−
[Zn2+][Cl−]3; log10K3 = 0.48* (15)
Zn2+ + 4Cl− ZnCl42− (12) K4 =
[ZnCl]42−
[Zn2+][Cl−]4; log10K4 = 0.20** (16)
Table 5. List of zinc ammonia-complexes and equilibrium constants
Zn+2 + NH3 Zn(NH3)2+ (17) K1 =[Zn(NH3)2+ ]
[Zn+2][NH3]; log 𝐾1 = 2.18 (20)
Zn+2 + 2NH3 Zn(NH3)22+ (18) K2 =
[Zn(NH3)22+]
[Zn+2][NH3]2; log 𝐾2 =2.25 (21)
Zn+2 + 3NH3 Zn(NH3)32+ (19) K3 =
[Zn(NH3)32+]
[Zn+2][NH3]3; log 𝐾3 =2.31 (22)
Zn+2 + 4NH3 Zn(NH3)42+ (20) K4 =
[Zn(NH3)42+]
[Zn+2][NH3]4; log 𝐾4 =1.86 (23)

59
Appendix VI
Distribution diagrams of species obtained with the Medusa software
Solution A
a)
b)
Figure 1. Distribution of species as a function of chloride concentration in solution A: a) zinc, b)
cobalt
a)
b)
Figure 2. Distribution of zinc species as a function of pH when concentration of ammonia is set
to: a) 0.04 M, and b) 0.09 M

60
a) b)
Figure 3. Distribution of cobalt species as a function of pH when concentration of ammonia is set
to a)0.04 M, and b) 0.09 M
a)
b)
Figure 4. Distribution of nickel species as a function of pH when concentration of ammonia is set
to a)0.04 M, and b) 0.09 M

61
Solution B
a)
b)
Figure 5. Distribution of zinc species as a function of pH when concentration of ammonia is set
to: a) 0.04 M, and b) 0.09 M
a)
b)
Figure 6. Distribution of cobalt species as a function of pH when concentration of ammonia is set
to a) 0.04 M, and b) 0.09 M

62
Solution C
a)
b)
Figure 7. Distribution of species as a function of chloride concentration in solution C: a) zinc, b)
cobalt
a)
b)
Figure 8. Distribution of zinc species as a function of pH when concentration of ammonia is set to
a) 0.06 M, and b) 0.4 M

63
a) b)
Figure 9. Distribution of cobalt species as a function of pH when concentration of ammonia is set
to a) 0.06 M, and b) 0.4 M
a)
b)
Figure 10. Distribution of nickel species as a function of pH when concentration of ammonia is
set to a) 0.06 M, and b) 0.4 M

64
Appendix VII
Tables of plotted data
The data plotted in Figure 10
Concentration of
CYANEX 923
Distribution ratio of zinc with standard deviation
Solution A Solution B Solution C
0.005 0.2652±0.006 0.136±0.003 0.211±0.004
0.02 4.5±0.2 2.70±0.09 3.9±0.2
0.1 83±37 56±3 39±11
The data plotted in Figure 11
Concentration of
CYANEX 923
Distribution ratio of cobalt with standard deviation
Solution A Solution B Solution C
0.005 0.0001±0.0005 -0.00006±0.0004 0.001±0.007
0.02 -0.0007±0.0004 0.001±0.002 0.020±0.007
0.1 0.014±0.004 0.019±0.002 0.217±0.007
Data used for plotting Figure 12, with efficiency of zinc extraction included
Concentration
of CYANEX
923
Solution A Solution B Solution C
%E of Zn %E of Co %E of Zn %E of Co %E of Zn %E of Co
0.005 21.0±0.5 0.01±0.05 12.01±0.3 -0.006±0.045 17.4±0.4 0.09±0.17
0.02 82±17 -0.07±0.04 73±8 0.1±0.2 80±14 1.94±0.25
0.1 99±97 1.4±0.4 98±75 1.8±0.2 98±93 18.0±0.7

65
Figure 11. Linear fit of the data obtained for zinc extraction from solution A when 0.1 M CYANEX
923 was applied

66
Figure 12. Linear fit of the data obtained for zinc extraction from solution B when 0.1 M CYANEX
923 was applied

67
Figure 13. Linear fit of the data obtained for zinc extraction from solution C when 0.1 M CYANEX
923 was applied

68
Figure 14. Linear fit of the data obtained for cobalt extraction from solution C when 0.1 M CYANEX 923 was applied

69
Appendix VIII
Solution A when 0.1 M of CYANEX 272 is used
pH
Concentration
of ammonia
Distribution
ratio - Zn % E - Zn
Distribution
ratio - Co % E - Co
1.32±0.04 0 0.021±0.002 2.1±0.2 0.0013±0.0001 0.13±0.01
1.53±0.04 0.001 0.054±0.002 5.2±0.2 0.02±0.23 -25±86
2.01±0.04 0.016 0.087±0.002 8.0±0.2 -1±12 996±92
4.93±0.04 0.025 0.103±0.002 9.4±0.2 0.0002±0.0006 0.02±0.06
5.28±0.04 0.033 1.44±0.03 59±3 0.0030±0.0007 0.3023±0.07
5.49±0.04 0.041 17±1 94±46 0.0019±0.0019 1.8±0.2
5.56±0.04 0.058 65 ±14 98±91 0.080±0.003 7.4±0.3
5.62±0.04 0.083 91±23 99±95 0.178±0.004 15.1±0.4
5.32±0.04 0.091 50±13 98±93 0.097±0.004 8.8±0.4
5.34±0.04 0.099 103±56 99±97 0.122±0.004 10.9±0-4
Solution B when 0.1 M of CYANEX 272 is used
pH
Concentration
of ammonia
Distribution
ratio - Zn % E - Zn
Distribution ratio -
Co % E - Zn
1.16±0.04 0 0.007±0.001 0.67 ±0.15 0.0013±0.0007 0.13±0.07
5.60±0.04 0.041 0.012±0.001 1.2±0.1 -0.0008±0.0007 -0.08±0.07
5.60±0.04 0.058 0.01±0.001 1.0±0.1 0.0002±0.001 0.2±0.1
Solution C when 0.1 M of CYANEX 272 is used
pH
Concentration
of ammonia
Distribution
ratio - Zn % E - Zn
Distribution ratio -
Co % E - Zn
1.06±0.04 0 0.013±0.001 1.33±0.15 -0.0001±0.0002 -0.01±0.02
3.81±0.04 0.041 0.063±0.002 5.8±0.2 0.002±0.001 0.18±0.14
4.03±0.04 0.059 0.734±0.001 42±1 0.042±0.002 4.1±0.2
4.14±0.04 0.083 1.226±0.025 55±2 0.075±0.003 7.0±0.3
4.23±0.04 0.099 1.899±0.05 65±4 0.131±0.004 11.6±0.4
4.30±0.04 0.140 2.728±0.08 72 ±8 0.196±0.008 8±1
4.40±0.04 0.248 3.5±0.1 78±9 0.240±0.008 19±1
4.47±0.04 0.413 3.9±0.1 80±12 0.263±0.009 21±1
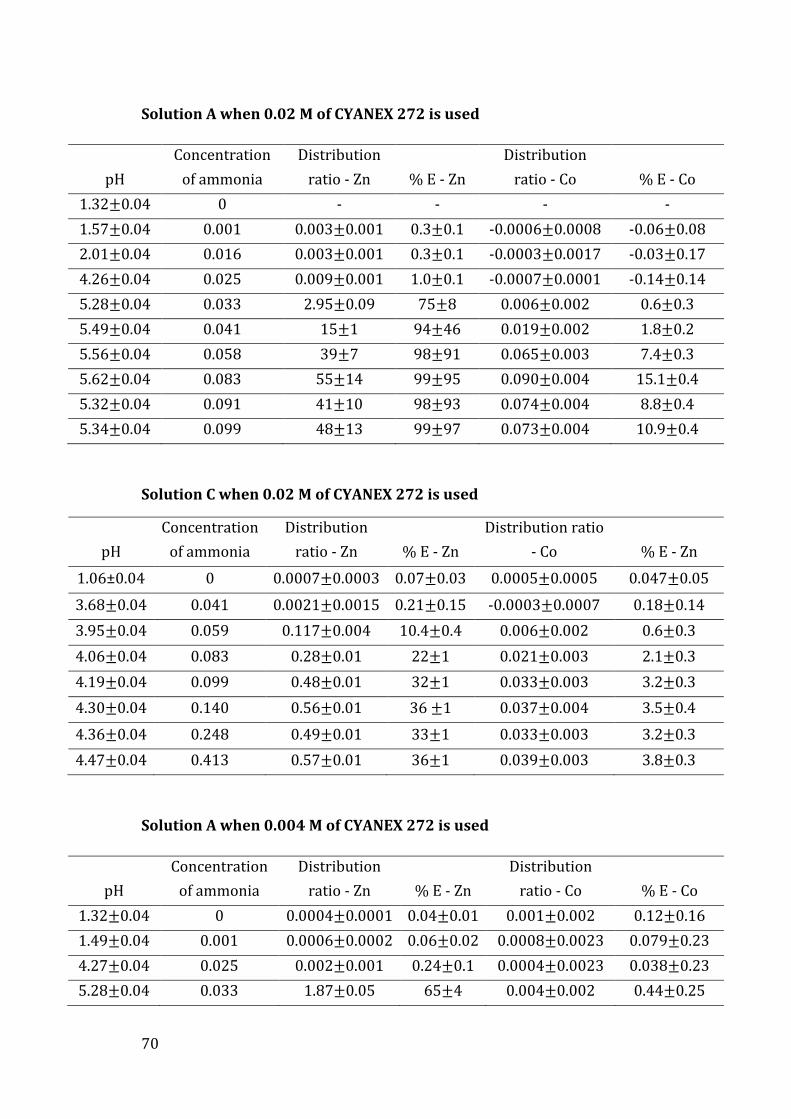
70
Solution A when 0.02 M of CYANEX 272 is used
pH
Concentration
of ammonia
Distribution
ratio - Zn % E - Zn
Distribution
ratio - Co % E - Co
1.32±0.04 0 - - - -
1.57±0.04 0.001 0.003±0.001 0.3±0.1 -0.0006±0.0008 -0.06±0.08
2.01±0.04 0.016 0.003±0.001 0.3±0.1 -0.0003±0.0017 -0.03±0.17
4.26±0.04 0.025 0.009±0.001 1.0±0.1 -0.0007±0.0001 -0.14±0.14
5.28±0.04 0.033 2.95±0.09 75±8 0.006±0.002 0.6±0.3
5.49±0.04 0.041 15±1 94±46 0.019±0.002 1.8±0.2
5.56±0.04 0.058 39±7 98±91 0.065±0.003 7.4±0.3
5.62±0.04 0.083 55±14 99±95 0.090±0.004 15.1±0.4
5.32±0.04 0.091 41±10 98±93 0.074±0.004 8.8±0.4
5.34±0.04 0.099 48±13 99±97 0.073±0.004 10.9±0.4
Solution C when 0.02 M of CYANEX 272 is used
pH
Concentration
of ammonia
Distribution
ratio - Zn % E - Zn
Distribution ratio
- Co % E - Zn
1.06±0.04 0 0.0007±0.0003 0.07±0.03 0.0005±0.0005 0.047±0.05
3.68±0.04 0.041 0.0021±0.0015 0.21±0.15 -0.0003±0.0007 0.18±0.14
3.95±0.04 0.059 0.117±0.004 10.4±0.4 0.006±0.002 0.6±0.3
4.06±0.04 0.083 0.28±0.01 22±1 0.021±0.003 2.1±0.3
4.19±0.04 0.099 0.48±0.01 32±1 0.033±0.003 3.2±0.3
4.30±0.04 0.140 0.56±0.01 36 ±1 0.037±0.004 3.5±0.4
4.36±0.04 0.248 0.49±0.01 33±1 0.033±0.003 3.2±0.3
4.47±0.04 0.413 0.57±0.01 36±1 0.039±0.003 3.8±0.3
Solution A when 0.004 M of CYANEX 272 is used
pH
Concentration
of ammonia
Distribution
ratio - Zn % E - Zn
Distribution
ratio - Co % E - Co
1.32±0.04 0 0.0004±0.0001 0.04±0.01 0.001±0.002 0.12±0.16
1.49±0.04 0.001 0.0006±0.0002 0.06±0.02 0.0008±0.0023 0.079±0.23
4.27±0.04 0.025 0.002±0.001 0.24±0.1 0.0004±0.0023 0.038±0.23
5.28±0.04 0.033 1.87±0.05 65±4 0.004±0.002 0.44±0.25

71
5.18±0.04 0.041 2.86±0.08 74±8 0.004±0.002 0.43±0.2
5.30±0.04 0.058 5.4±0.2 84±18 0.008±0.002 0.80±0.2
5.37±0.04 0.083 4.9±0.2 83±17 0.007±0.002 0.72±0.2
5.32±0.04 0.091 4.6±0.2 82±16 0.007±0.002 0.67±0.2
5.44±0.04 0.099 5.4±0.3 84±22 0.064±0.002 0.63±0.2
Solution C when 0.004 M of CYANEX 272 is used
pH
Concentration
of ammonia
Distribution
ratio - Zn % E - Zn
Distribution ratio
- Co % E - Zn
1.06±0.04 0 0.0011±0.0014 0.11±0.14 -0.0009±0.0007 -0.09±0.07
3.68±0.04 0.041 0.0037±0.0004 0.37±0.04 -0.0005±0.0001 -0.05±0.01
3.95±0.04 0.059 0.0277±0.0022 2.7±0.2 0.004±0.002 0.4±0.2
4.06±0.04 0.083 0.055±0.002 5.3 ±0.2 0.004±0.003 0.4±0.3
4.19±0.04 0.099 0.076±0.003 7.1±0.3 0.005±0.003 0.5±0.3
4.30±0.04 0.140 0.076±0.003 7.1±0.3 0.004±0.003 0.4±0.3
4.36±0.04 0.248 0.075±0.003 7.0±0.3 0.006±0.003 0.6±0.3
4.47±0.04 0.413 0.092±0.003 8.4±0.3 0.007±0.003 0.7±0.3

72
Figure 14. Linear fit of the data obtained for zinc extraction from solution A when 0.1 M CYANEX
272 was applied
Figure 15. Linear fit of the data obtained for zinc extraction from solution C when 0.1 M
CYANEX 272 was applied

73
Figure 16. Linear fit of the data obtained for zinc extraction from solution A when 0.02 M
CYANEX 272 was applied
Figure 17. Linear fit of the data obtained for zinc extraction from solution C when 0.02 M
CYANEX 272 was applied

74
Figure 18. Linear fit of the data obtained for zinc extraction from solution A when 0.004 M
CYANEX 272 was applied
Figure 19. Linear fit of the data obtained for zinc extraction from solution C when 0.004 M
CYANEX 272 was applied
75
7 Literature [1] “https://www.acs.org/content/acs/en/greenchemistry/research-
innovation/endangered-elements.html.” .
[2] F. Krausmann, S. Gingrich, N. Eisenmenger, K.-H. Erb, H. Haberl, and M. Fischer-Kowalski, “Growth in global materials use, GDP and population during the 20th century,” Ecol. Econ., vol. 68, no. 10, pp. 2696–2705, 2009.
[3] J. Cui and E. Forssberg, “Mechanical recycling of waste electric and electronic equipment: A review,” J. Hazard. Mater., vol. 99, no. 3, pp. 243–263, 2003.
[4] J. Johnson, B. K. Reck, T. Wang, and T. E. Graedel, “The energy benefit of stainless steel recycling,” Energy Policy, vol. 36, no. 1, pp. 181–192, 2008.
[5] A. J. Hunt, T. J. Farmer, and J. H. Clark, “CHAPTER 1. Elemental Sustainability and the Importance of Scarce Element Recovery,” 2013, pp. 1–28.
[6] E. Abkhoshk, E. Jorjani, M. S. Al-Harahsheh, F. Rashchi, and M. Naazeri, “Review of the hydrometallurgical processing of non-sulfide zinc ores,” Hydrometallurgy, vol. 149, pp. 153–167, 2014.
[7] P. M. Cole and K. C. Sole, “Zinc solvent extraction in the process industries,” Miner. Process. Extr. Metall. Rev., vol. 24, no. 2, pp. 91–137, 2003.
[8] M. L. C. M. Henckens, P. P. J. Driessen, and E. Worrell, “Metal scarcity and sustainability, analyzing the necessity to reduce the extraction of scarce metals,” Resour. Conserv. Recycl., vol. 93, pp. 1–8, Dec. 2014.
[9] T. E. Graedel, “Metal stocks in society - Scientific synthesis,” 2010.
[10] M. L. Good and F. F. Holland, “Extraction of In(III) and Ga(III) from aqueous chloride media by long chain alkyl amines and quaternary salts,” J. Inorg. Nucl. Chem., vol. 26, no. 2, pp. 321–327, Feb. 1964.
[11] J. M. Singh and S. N. Tandon, “Extraction of zinc(II), cadmium(II) and mercury(II) oxalate complexes by high molecular weight amines and quaternary ammonium salt,” J. Inorg. Nucl. Chem., vol. 41, no. 6, pp. 897–899, Jan. 1979.
[12] H. V. Lerum et al., “Study of cadmium extraction with Aliquat 336 from highly saline solutions,” J. Solution Chem., vol. 47, no. 8, pp. 1395–1417, 2018.
[13] A. Alian, A. Haggag, and W. Sanad, “Extraction and separation of 60Co and 65Zn halides from H2SO4 with TBP and amberlite LA-2,” J. Radioanal. Chem., vol. 20, no. 2, pp. 559–573, Sep. 1974.
[14] M. L. Good and S. E. Bryan, “Extraction of group VIII metals by long chain alkyl amines—II: Cobalt(II)-hydrochloric acid systems,” J. Inorg. Nucl. Chem., vol. 20, no. 1–2, pp. 140–146, Nov. 1961.

76
[15] M. L. Good and S. E. Bryan, “Extraction of group VIII metals by long chain alkyl amines. I. A tracer study of iron(III)-chloride systems,” J. Am. Chem. Soc., vol. 82, no. 21, pp. 5636–5639, Nov. 1960.
[16] A. Alian, A. El-Kot, A. Badran, and M. S. El-Bassiouny, “Solvent extraction studies on cadmium I. Extraction and separation of microamounts of cadmium halides in absence and presence of sulphuric acid,” J. Radioanal. Chem., vol. 27, no. 2, pp. 383–399, Sep. 1975.
[17] A. K. De, S. M. Khopkar, and R. A. Chalmers, Solvent Extraction of Metals. London: Van Nostrand Reinhold, 1970.
[18] J. Rydberg, Solvent extraction principles and practice. New York: Marcel Dekke, Inc, 2004.
[19] V. S. Kislik, Solvent extraction : classical and novel approaches. Oxford: Elsevier, 2012.
[20] L. Sillen, Stability constants of metal-ion complexes., 2d ed. London: The Chemical Society, 1964.
[21] K. J. Powell et al., “Chemical speciation of environmentally significant metals with inorganic ligands. Part 5: The Zn2+ + OH-, Cl-, CO3 2-, SO4 2-, and PO4 3- systems (IUPAC Technical Report),” Pure Appl. Chem., vol. 85, no. 12, pp. 2249–2311, 2013.
[22] K. Ding, Y. Liu, J. Tang, Y. Zhou, X. Lin, and J. Hu, “Efficiently enriching zinc(II) from and into ammonium chloride media with species regulation and Aliquat 336,” Sep. Purif. Technol., vol. 190, pp. 100–107, Jan. 2018.
[23] B. Pospiech and A. Chagnes, “Highly selective solvent extraction of Zn(II) and Cu(II) from acidic aqueous chloride solutions with mixture of Cyanex 272 and Aliquat 336,” Sep. Sci. Technol., vol. 50, no. 9, pp. 1302–1309, 2015.
[24] D. S. Flett, “Solvent extraction in hydrometallurgy: The role of organophosphorus extractants,” J. Organomet. Chem., vol. 690, no. 10, pp. 2426–2438, 2005.
[25] M. K. Jha, V. Kumar, and R. J. Singh, “Solvent extraction of zinc from chloride solutions,” Solvent Extr. Ion Exch., vol. 20, no. 3, pp. 389–405, 2002.
[26] V. Kumar, S. K. Sahu, and B. D. Pandey, “Prospects for solvent extraction processes in the Indian context for the recovery of base metals. A review,” Hydrometallurgy, vol. 103, no. 1–4, pp. 45–53, 2010.
[27] I. Mihaylov, “Solvent extractants for nickel and cobalt: New opportunities in aqueous processing,” Jom, vol. 55, no. 7, pp. 38–42, Jul. 2003.
[28] L. Gotfryd and J. Szymanowski, “Recovery of zinc(II) from acidic sulfate solutions. Simulation of counter-current extraction-stripping process,” Physicochem. Probl. Miner. Process., vol. 38, pp. 113–120, 2004.
[29] H. Long, L. Chai, W. Qin, and S. Tang, “Solvent extraction of zinc from zinc sulfate

77
solution,” J. Cent. South Univ. Technol., vol. 17, no. 4, pp. 760–764, Aug. 2010.
[30] F. J. Alguacil, A. Cobo, and C. Caravaca, “Study of the extraction of zinc(II) in aqueous chloride media by Cyanex 302,” Hydrometallurgy, vol. 31, no. 3, pp. 163–174, Nov. 1992.
[31] A. M. I. Ali, I. M. Ahmad, and J. A. Daoud, “CYANEX 272 for the extraction and recovery of zinc from aqueous waste solution using a mixer-settler unit,” Sep. Purif. Technol., vol. 47, no. 3, pp. 135–140, 2006.
[32] Cytec Industries Inc., “CYANEX 272 Extractant,” 2008.
[33] F. J. Alguacil, B. Schmidt, R. Mohrmann, and E. Giebel, “The extraction of zinc from chloride solutions using dibutyl butylphosphonate (DBBP) in Exxsol D100,” Rev. Metal., vol. 35, no. 4, pp. 255–260, 1999.
[34] J. G. Sharefkin and J. M. Wolfe, “Efficiency in extraction with solvents,” J. Chem. Educ., vol. 21, no. 9, p. 449, 2009.
[35] V. M. P. Forrest, D. Scargill, and D. R. Spickernell, “The extraction of zinc and cadmium by tri-n-butyl phosphate from aqueous chloride solutions,” J. Inorg. Nucl. Chem., vol. 31, no. 1, pp. 187–197, Jan. 1969.
[36] G. M. Ritcey, B. H. Lucas, and K. T. Price, “Evaluation and selection of extractants for the separation of copper and zinc from chloride leach liquor,” Hydrometallurgy, vol. 8, no. 3, pp. 197–222, May 1982.
[37] E. D. Nogueira and P. Cosmen, “The solvent extraction of zinc chloride with di-n-pentyl pentaphosphonate,” Hydrometallurgy, vol. 9, no. 3, pp. 333–347, Jan. 1983.
[38] H. K. Lin, “Extraction of zinc chloride with dibutyl butylphosphonate,” Metall. Trans. B, vol. 24, no. 1, pp. 11–15, Feb. 1993.
[39] G. Harrison, V. I. Lakshmanan, and G. J. Lawson, “The extraction of Zinc(II) from sulphate and chloride solutions with kelex 100 and versatic 911 in kerosene,” Hydrometallurgy, vol. 1, no. 4, pp. 339–347, Apr. 1976.
[40] Zong Chen Li, W. Fürst, and H. Renon, “Extraction of zinc(II) from chloride and perchlorate aqueous solutions by di(2-ethylhexyl) phosphoric acid in ESCAID 100: Experimental equilibrium study,” Hydrometallurgy, vol. 16, no. 2, pp. 231–241, Jun. 1986.
[41] R. Benito, B. Menoyo, and M. P. Elizalde, “Extraction equilibria of Zn(II) from chloride medium by Cyanex 302 in toluene,” Hydrometallurgy, vol. 40, no. 1–2, pp. 51–63, Jan. 1996.
[42] T. Sato, T. Shimomura, S. Murakami, T. Maeda, and T. Nakamura, “Liquid-liquid extraction of divalent manganese, cobalt, copper, zinc and cadmium from aqueous chloride solutions by tricaprylmethylammonium chloride,” Hydrometallurgy, vol. 12, no. 2, pp. 245–254, May 1984.
78
[43] F. Nakashio, H. Sato, K. Kondo, K. Inoue, and Y. Kawano, “Solvent extraction of zinc from chloride media with secondary long-chain alkylamine,” Solvent Extr. Ion Exch., vol. 4, no. 4, pp. 757–770, Jan. 1986.
[44] N. Begum, F. Bari, S. B. Jamaludin, and K. Hussin, “Solvent extraction of copper, nickel and zinc by Cyanex 272,” Int. J. Phys. Sci., vol. 7, no. 22, pp. 2905–2910, 2012.
[45] M. Gharabaghi, M. Irannajad, and A. R. Azadmehr, “Separation of nickel and zinc ions in a synthetic acidic solution by solvent extraction using D2EHPA and Cyanex 272,” Physicochem. Probl. Miner. Process., vol. 49, no. 1, pp. 233–242, 2013.
[46] W. Zhang, C. Y. Cheng, M. Rodriguez, and Y. Pranolo, “Separation of copper , iron and zinc from cobalt and nickel with mixed Cyanex 272 and LIX84 extractants,” Proc. ISEC, vol. 1, no. January 2008, pp. 177–182, 2008.
[47] L. M. Free, Hydrometallurgy Fundamentals and applications. Hoboken, New Jersey: John Wiley & Sons, Inc., 2013.
[48] B. Wassink, D. Dreisinger, and J. Howard, “Solvent extraction separation of zinc and cadmium from nickel and cobalt using Aliquat 336, a strong base anion exchanger, in the chloride and thiocyanate forms,” Hydrometallurgy, vol. 57, no. 3, pp. 235–252, 2000.
[49] C. W. Mcdonald and T.-S. Lin, “Solvent Extraction Studies of Zinc and Cadmium with Aliquat 336-S in Aqueous Chloride Solutions,” Sep. Sci., vol. 10, no. 4, pp. 499–505, Aug. 1975.
[50] T. Sato, “The extraction of cobalt (II) from hydrochloric acid solution by tri-n-octylamine,” J. Inorg. Nucl. Chem., vol. 29, no. 2, pp. 547–553, Feb. 1967.
[51] T. Sato and T. Kato, “The stability constants of the chloro complexes of copper(II) and zinc(II) determined by tri-n-octylamine extraction,” J. Inorg. Nucl. Chem., vol. 39, no. 7, pp. 1205–1208, Jan. 1977.
[52] Q. Jia, D. Li, and C. Niu, “Synergistic extraction of zinc(II) by mixtures of primary amine N1923 and Cyanex272,” Solvent Extr. Ion Exch., vol. 20, no. 6, pp. 751–764, 2002.
[53] I. V. Mishonov, K. Alejski, and J. Szymanowski, “A contributive study on the stripping of zinc(II) from loaded TBP using an ammonia/ammonium chloride solution,” Solvent Extr. Ion Exch., vol. 22, pp. 219–241, 2004.
[54] T. Duan, H. Li, J. Kang, and H. Chen, “Cyanex 923 as the Extractant in a Rare Earth Element Impurity Analysis of High-Purity Cerium Oxide,” Anal. Sci., vol. 20, no. 6, pp. 921–924, 2004.
[55] A. Francisco Jose and M. Susana, “Solvent extraction of Zn ( II ) by Cyanex 923 and its application to a solid-supported liquid membrane system,” J. Chem. Technol. Biotechnol., vol. 76, pp. 298–302, 2001.
[56] M. Regel, A. M. Sastre, and J. Szymanowski, “Recovery of zinc(II) from HCL spent

79
pickling solutions by solvent extraction,” Environ. Sci. Technol., vol. 35, no. 3, pp. 630–635, 2001.
[57] K. Sarangi, P. K. Parhi, E. Padhan, A. K. Palai, K. C. Nathsarma, and K. H. Park, “Separation of iron(III), copper(II) and zinc(II) from a mixed sulphate/chloride solution using TBP, LIX 84I and Cyanex 923,” Sep. Purif. Technol., vol. 55, no. 1, pp. 44–49, 2007.
[58] D. F. C. Morris and E. L. Short, “Zinc chloride and zinc bromide complexes. Part II. Solvent-extraction studies with zinc-65 as tracer,” J. Chem. Soc., vol. 0, no. 0, pp. 2662–2671, Jan. 1962.
[59] Ryszard Cierpiszewski, Ireneusz Miesiac, Magdalena Regel-Rosocka, Ana M. Sastre, and Jan Szymanowski, “Removal of zinc(II) from spent hydrochloric acid solutions from zinc hot galvanizing plants,” Ind. Eng. Chem. Res., vol. 41, no. 3, pp. 598–603, 2002.
[60] K. H. Lum, G. W. Stevens, J. M. Perera, and S. E. Kentish, “The modelling of ZnCl2 extraction and HCl co-extraction by TBP diluted in ShellSol 2046,” Hydrometallurgy, vol. 133, pp. 64–74, 2013.
[61] J. W. Ahn and J. C. Lee, “Separation of Sn, Sb, Bi, As, Cu, Pb and Zn from Hydrochloric Acid Solution by Solvent Extraction Process Using TBP (tri-n-Butylphosphate) as an Extractant,” Mater. Trans., vol. 52, no. 12, pp. 2228–2232, 2011.
[62] “Safety data sheet ASOL D80.” [Online]. Available: https://docplayer.me/14498442-Sikkerhetsdatablad-asol-d80.html. [Accessed: 28-Mar-2019].
[63] “OrionTM ROSSTM Sure-FlowTM pH Electrode with Sure-flow junction, BNC connector.” [Online]. Available: https://www.thermofisher.com/order/catalog/product/8172BNWP. [Accessed: 28-Mar-2019].
[64] “Thermo Scientific Orin Star A211 - Features and Benefits,” 2016.
[65] “Chemical Equilibrium Diagrams.” [Online]. Available: https://sites.google.com/site/chemdiagr/. [Accessed: 28-Mar-2019].
[66] Y. Marcus and D. Maydan, “Anion exchange of metal complexes. VIII. The effect of secondary cation. The zinc-chloride system,” J. Phys. Chem., vol. 67, no. 5, pp. 979–983, 1963.
[67] D. F. C. Morris and E. L. Short, “Stability constants of cobalt (II) chloride complexes*,” Electrochim. Acta, vol. 7, no. January, pp. 385–391, 1962.
[68] A. Azizitorghabeh, F. Rashchi, A. Babakhani, and M. Noori, “Synergistic extraction and separation of Fe(III) and Zn(II) using TBP and D2EHPA,” Sep. Sci. Technol., vol. 52, no. 3, pp. 476–486, 2017.
[69] A. Grzeszczyk and M. Regel-Rosocka, “Extraction of zinc(II), iron(II) and iron(III)

80
from chloride media with dibutylbutylphosphonate,” Hydrometallurgy, vol. 86, no. 1–2, pp. 72–79, 2007.