extraction of periodic multivariate signals: mapping of ...ats/resources/ieeetransmedimaging... ·...
TRANSCRIPT

IEEE TRANSACTIONS ON MEDICAL IMAGING, VOL. 22, NO. 12, DECEMBER 2003 1537
Extraction of Periodic Multivariate Signals:Mapping of Voltage-Dependent DyeFluorescence in the Mouse Heart
Andrew Sornborger*, Lawrence Sirovich, and Gregory Morley
Abstract—In many experimental circumstances, heart dy-namics are, to a good approximation, periodic. For this reason,it makes sense to use high-resolution methods in the frequencydomain to visualize the spectrum of imaging data of the heartand to estimate the deterministic signal content and extract theperiodic signal from background noise in experimental data. Inthis paper, we describe the first application of a new methodthat we call cardiac rhythm analysis which uses a combination ofprincipal component analysis and multitaper harmonic analysisto extract periodic, deterministic signals from high-resolutionimaging data of cardiac electrical activity. We show that thismethod significantly increases the signal-to-noise ratio of ourrecordings, allowing for better visualization of signal dynamicsand more accurate quantification of the properties of electricalconduction. We visualize the spectra of three cardiac data setsof mouse hearts exhibiting sinus rhythm, paced rhythm andmonomorphic tachycardia. Then, for pedagogical purposes,we investigate the tachycardia more closely, demonstrating thepresence of two distinct periodicities in the re-entrant tachycardia.Analysis of the tachycardia shows that cardiac rhythm analysisnot only allows for better visualization of electrical activity, butalso provides new opportunities to study multiple periodicities insignal dynamics.
Index Terms—Harmonic analysis, optical mapping, period aver-aging, signal processing.
I. INTRODUCTION
OPTICAL recordings of electrical activity using fluores-cent dyes and high-speed imaging techniques in both car-
diac [1], [2] and neural tissues have provided new opportunitiesto globally visualize electrical activity with unprecedented de-tail. These techniques have revolutionized our understanding of
Manuscript received December 2, 2002; revised April 2, 2003. The work ofA. Sornborger and L. Sirovich was supported in part by the National Institutesof Health (NIH) under Grant NEI EY11276, Grant NIMHMH50166, and GrantNEI EY12867 and in part by the Defense Advanced Research Projects Agency(DARPA) under Grant MDA972-01-1-0028. The work of G. Morley was sup-ported in part by the American Heart Association Scientist Development GrantAHA-003056T. The Associate Editor responsible for coordinating the reviewof this paper and recommending its publication was M. Viergever. Asterisk in-dicates corresponding author.*A. Sornborger was with the Laboratory of Applied Mathematics, Biomath-
ematical Sciences Division, Mt. Sinai School of Medicine, New York, NY10029 USA. He is now with the Faculty of Engineering and Departmentof Mathematics, University of Georgia, Athens, GA 30602 USA (e-mail:[email protected]).L. Sirovich is with the Laboratory of AppliedMathematics and the Biomathe-
matical Sciences Division, Mt. Sinai School of Medicine, New York, NY 10029USA.G. Morley is with the Department of Medicine, NYU School of Medicine,
Veterans Administration Hospital, New York, NY 10010 USA.Digital Object Identifier 10.1109/TMI.2003.818163
cardiac electrophysiology by providing important clues on basicmechanisms underlying cardiac arrhythmias, defibrillation, ex-citation, and conduction [3], [5], [6]. Although high-resolutionimaging of cardiac excitation is a powerful approach, image pro-cessing techniques that can identify and extract small amplitudeoptical signals are needed to improve our understanding of themechanisms that underlie the initiation and maintenance of car-diac arrythmia.We have used our method to analyze many datasets, including
data of hearts beating in sinus rhythm, paced hearts, and heartswith induced tachycardias. The data that we analyze in thispaper include an example of a mouse heart beating in sinusrhythm and in paced rhythm and a dataset of images of a mouseheart exhibiting a monomorphic re-entrant tachycardia. We ac-quire data at a rate of 914 frames/s. For the relatively short timethat we image the heart (approximately 2 s), the approximationthat the signal is periodic is especially good. The sinus and pacedrhythms are the only rhythms found in their datasets. Therefore,their analysis is relatively straightforward. However, using visu-alization methods that we present, we found that there were ac-tually two different periodicities in the tachycardia data: a 32-Hztachycardia and also a slower 5-Hz atrial rhythm. In fact, the32-Hz tachycardia induced movement in the heart at the halffrequency of 16 Hz. However, we will refer to this signal as a32-Hz signal, since the re-entrant wave rotated at 32 Hz.There are advantages to analyzing periodic signals in fre-
quency space, since a periodic signal then has distinctive fea-tures. The Fourier transform of such a signal is a set of dis-crete, equally spaced harmonics. We use multitaper harmonicanalysis, a high-resolution, stable and accurate method of esti-mating deterministic sinusoids in noisy data, to extract this se-quence of harmonics [7]. Only harmonics that are at multiplesof the base pulsing frequency are extracted. Therefore, deter-ministic signal components that are not related to the heart’saction, for instance 60-cycle camera noise and other determin-istic experimental noise, as well as any random-phase noise, canbe removed and discarded resulting in a significantly denoisedsignal.Mitra and Pesaran [8] have recently introduced high-resolu-
tion multitaper spectral and harmonic techniques for the anal-ysis of dynamic brain imaging data with remarkable success.Multitaper methods, which are optimal in a well-defined sense(see Appendix), are the standard for analysis of geophysical data[9], and are becoming the standard in astrophysics [10]. By con-trast, in the analysis of biomedical imaging data these methodsare largely unexplored.
0278-0062/03$17.00 © 2003 IEEE

1538 IEEE TRANSACTIONS ON MEDICAL IMAGING, VOL. 22, NO. 12, DECEMBER 2003
Many readers may be familiar with windowing techniques.Multitaper analysis is an improvement on these methods in thefollowing sense. Windowing a signal reduces the signal’s bias,but assumes that the probability distribution of the sampleddata is identical to the probability distribution of the stationaryprocess. This assumption is, in general, incorrect for data that isdiscretely sampled from a signal that is continuous in time andfrequency. Multitaper analysis is different from data windowingin that the data is projected onto a set of tapers (sometimescalled windows), then the statistics of the signal in frequencyspace are used to obtain estimates of frequency content. Themultitaper approach is derived by considering the estimationof an orthogonal increment stationary process as an inverseproblem [7]. The tapers onto which the data are projected havelow bias, and the estimates are consistent (i.e., they converge)since statistics from a set of tapers are used. For these reasons,multitaper analysis is extremely robust.In this paper, we present a new method that we call cardiac
rhythm analysis that uses features of periodic signals in Fourierspace for denoising imaging data. Although the method is gen-erally applicable to any periodic signal, we will specialize thediscussion to imaging data of a mouse heart that has been in-fused with voltage-sensitive fluorescent dye.
II. METHODS
A. Experimental Methods
We performed imaging studies on an adult mouse heart. Theheart was surgically removed by performing a thoracotomyand placed in a custom-built perfusion/superfusion apparatus.While the heart was fully immersed in Tyrode’s solution, theaorta was cannulated and Langendorff perfused at a constantpressure of 68–74 mm Hg (1–2 ml/min). The heart was fluo-rescently labeled with the voltage-sensitive dye Di-4-ANEPPS.High-resolution optical mapping of the right ventricular freewall was performed on an upright microscope (BX50WIOlympus, Inc.) equipped with a high-speed charge-coupleddevice (CCD) camera (CA-D128 Dalsa, Inc.) using a 4objective. Images were acquired at 914 frames/s for 2 s witha 64 64-pixel array in the absence of any motion reductiontechniques, as previously described [2]. Therefore, there wereapproximately 16 cycles of the rhythms in the sinus and paceddata, 66 cycles of the tachycardia and ten cycles of the atrialrhythm in the tachycardia data. The re-entrant tachyarrhythmiawas induced using a burst pacing protocol [3].
B. Data Analysis Methods: Cardiac Rhythm Analysis
Before examining spectral and harmonic content, it is neces-sary to bring the multivariate imaging data into a more manage-able form. We always consider mean subtracted data. We candenote the heart data
(1)
where is the activity (gray level) at time and pixel .Principal component analysis (PCA) furnishes an optimal rep-resentation of multivariate data such as ours in that it best com-
presses multivariate data [4]. As shown in the Appendix, we canexpress (1) as
(2)
where the and are each sets of orthonormal func-tions, and the are constants. The eigenfunctions of thePCA are arranged in order of decreasing power. For typicalmouse heart data, more than 99% of the signal power is retainedin the first 50 principal components. In this form, we see that thedynamics is carried by the coefficients . It is, therefore, ourgoal to understand and extract the harmonic content from thesecoefficients.Before extracting the harmonic content, we typically examine
the frequency spectra of the principal components. This can beuseful since often the structure of the data then becomes evident.For instance, the frequency spectrum of the tachycardia data thatwe analyze below show three sets of harmonic stacks associatedwith different periodicities: the 32-Hz re-entrant tachycardia, a5-Hz atrial rhythm, and noise from the experimental apparatuswith a base frequency of 60 Hz.To determine harmonic content (i.e., to find amplitudes and
phases of deterministic sinusoids in noisy data), the timecoursesare projected onto a set of low-bias tapers. Then a least-
squares regression estimate is performed to find the best fittingcomplex amplitudes for sinusoids in the data. Due to the cen-tral limit theorem, in Fourier space the complex amplitude es-timates are normally distributed. Under the null hypothesis thatno sinusoid is present, a statistical F-test is used to determine thesignificance of the sinusoid. For a more complete description ofmultitaper harmonic analysis see the Appendix.Using multitaper harmonic analysis, we identify and sepa-
rately extract each periodic signal by extracting all statisticallysignificant deterministic sinusoids that lie at multiples of thebase frequencies in the principal component timecourses. Wethen reconstruct denoised datasets by combining the extracteddeterministic periodic content with the spatial eigenfunctions.The denoised datasets resulting from our method can then befurther analyzed using standard methods.It is important to note that our method of extracting the pe-
riodic content is in some ways similar to the commonly usedmethod of first, identifying the period by finding a peak in theautocorrelation function, then averaging periods to increase thesignal-to-noise ratio (SNR). The period averagingmethod, how-ever, retains all periodic information, including harmonic con-tent that is not statistically significant. Our method, since it re-lies on an F-statistic to determine the statistical significance ofindividual harmonics, leaves out statistically insignificant har-monics, thereby reducing spurious noise in the signal. Further-more, by visualizing the log-spectrum, it is easier to identifymultiple periodicities in the data compared with the method ofusing the autocorrelation to identify periodic information.
III. RESULTS
Here, we present results from three datasets: a mouse heartin sinus rhythm, a mouse heart in paced rhythm and a mouseheart exhibiting a re-entrant tachycardia. We show only spectra

SORNBORGER et al.: EXTRACTION OF PERIODIC MULTIVARIATE SIGNALS 1539
Fig. 1. A multitaper spectral estimate of of the spectrum of (a) PCA modes of raw mouse heart data imaged in sinus rhythm, (b) the periodic sinus rhythmextracted from the raw data, (c) the residual background noise. Note the clean extraction of the periodic signals, which can be seen as stacks of harmonics in thespectrum, from the background. Principal component index (PC Index) is indicated on the abscissa and frequency in Hertz on the ordinate.
to visualize the periodicity and the results of our reconstructionfor the first two datasets. For the tachycardia, we show spectraand give details on the reconstruction process and improvementsin quantitative measurements on the reconstructed data.Both the sinus and paced data are periodic with base frequen-
cies of approximately 8 Hz. In Figs. 1 and 2, we plot log-spectraof principal components of the data as a function of frequency.The colorbar gives greyscale values in the plots for amplitudesof the log-spectrum. Fig. 1(a) shows the -spectrum of theprincipal components of the raw data with principal componentindex on the abscissa and frequency in Hertz on the ordinate.The harmonic sequence includes a harmonic sequence with basefrequency of approximately 8 Hz. There is also considerablebackground noise. Fig. 1(b) is the log-spectrum of the extractedsinus rhythm using cardiac rhythm analysis to extract the de-terministic harmonic stacks described above. There is a gen-eral trend for power to lie at low frequencies for low principlecomponent indexes and at higher frequencies for higher indexprinciple components. This is seen in panel Fig. 1(b) wherethe high-amplitude peaks shift to the right at higher frequen-cies. In both the sinus rhythm and paced rhythm data, there aremore than one discernible band of spectral power indicating thepresence of wave behavior with a complex dispersion relation,
perhaps arising from nonlinear wave behavior. Fig. 1(d) is thelog-spectrum of the removed background noise. Note that thereare some faint remaining harmonics in the background noise.These can arise from inaccuracies in the estimation of harmoniccontent. For the most part, however, the harmonic informationhas been well estimated, extracted and reconstructed.In Fig. 2, we plot log-spectra of principal components of the
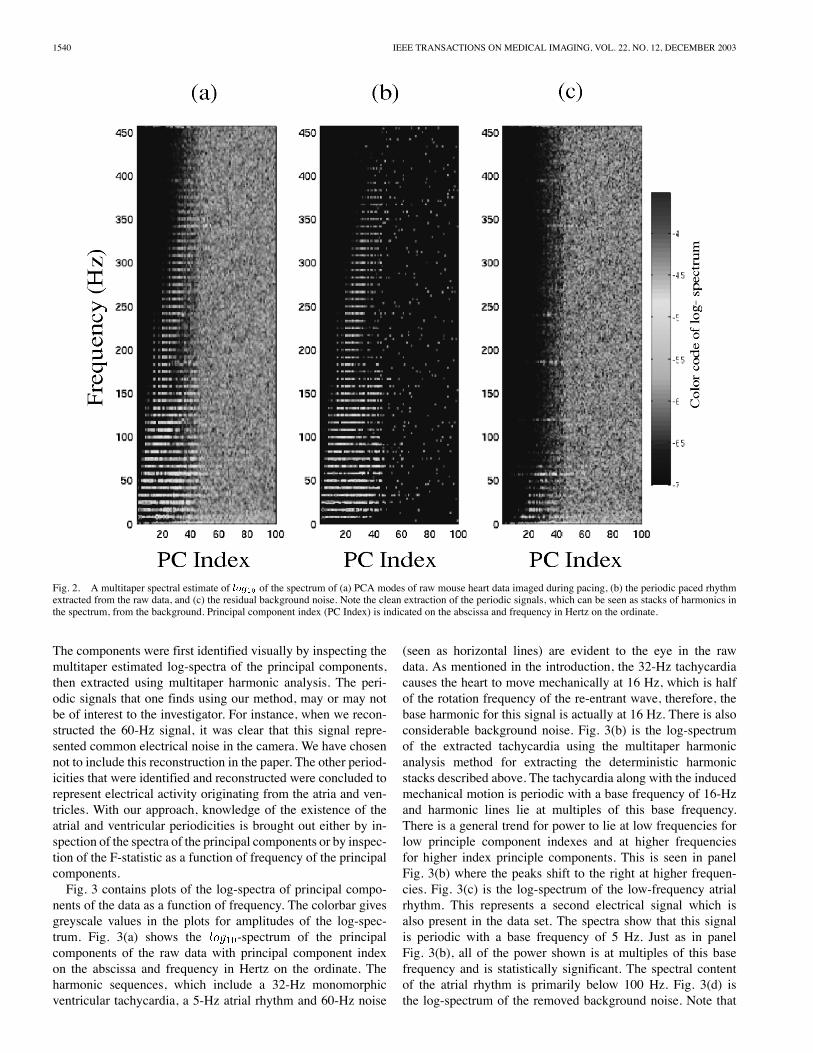
paced rhythm. Again, Fig. 2(a) depicts the log-spectrum of theraw data, Fig. 2(b) depicts the log-spectrum of the reconstructedpaced rhythm, and Fig. 2(c) depicts the log-spectrum of theresidual background noise. Note that, for this data, the harmoniccontent also exhibits bands of power probably arising from non-linear wave behavior. The power in the periodic signal extendsto fewer principal components for this dataset because the signalwas weaker.From here on, we discuss and present results from the de-
noising of a dataset of a mouse heart exhibiting three separateperiodic components: a 32-Hz monomorphic re-entrant tachy-cardia, a 5-Hz atrial rhythm and 60-Hz noise. We will discussthis dataset in detail because it exhibits the greatest complexityof the datasets that we have examined and demonstrates advan-tages of using cardiac rhythm analysis. The three signal com-ponents were unknown before we applied our analysis method.
1540 IEEE TRANSACTIONS ON MEDICAL IMAGING, VOL. 22, NO. 12, DECEMBER 2003
Fig. 2. A multitaper spectral estimate of of the spectrum of (a) PCA modes of raw mouse heart data imaged during pacing, (b) the periodic paced rhythmextracted from the raw data, and (c) the residual background noise. Note the clean extraction of the periodic signals, which can be seen as stacks of harmonics inthe spectrum, from the background. Principal component index (PC Index) is indicated on the abscissa and frequency in Hertz on the ordinate.
The components were first identified visually by inspecting themultitaper estimated log-spectra of the principal components,then extracted using multitaper harmonic analysis. The peri-odic signals that one finds using our method, may or may notbe of interest to the investigator. For instance, when we recon-structed the 60-Hz signal, it was clear that this signal repre-sented common electrical noise in the camera. We have chosennot to include this reconstruction in the paper. The other period-icities that were identified and reconstructed were concluded torepresent electrical activity originating from the atria and ven-tricles. With our approach, knowledge of the existence of theatrial and ventricular periodicities is brought out either by in-spection of the spectra of the principal components or by inspec-tion of the F-statistic as a function of frequency of the principalcomponents.Fig. 3 contains plots of the log-spectra of principal compo-
nents of the data as a function of frequency. The colorbar givesgreyscale values in the plots for amplitudes of the log-spec-trum. Fig. 3(a) shows the -spectrum of the principalcomponents of the raw data with principal component indexon the abscissa and frequency in Hertz on the ordinate. Theharmonic sequences, which include a 32-Hz monomorphicventricular tachycardia, a 5-Hz atrial rhythm and 60-Hz noise
(seen as horizontal lines) are evident to the eye in the rawdata. As mentioned in the introduction, the 32-Hz tachycardiacauses the heart to move mechanically at 16 Hz, which is halfof the rotation frequency of the re-entrant wave, therefore, thebase harmonic for this signal is actually at 16 Hz. There is alsoconsiderable background noise. Fig. 3(b) is the log-spectrumof the extracted tachycardia using the multitaper harmonicanalysis method for extracting the deterministic harmonicstacks described above. The tachycardia along with the inducedmechanical motion is periodic with a base frequency of 16-Hzand harmonic lines lie at multiples of this base frequency.There is a general trend for power to lie at low frequencies forlow principle component indexes and at higher frequenciesfor higher index principle components. This is seen in panelFig. 3(b) where the peaks shift to the right at higher frequen-cies. Fig. 3(c) is the log-spectrum of the low-frequency atrialrhythm. This represents a second electrical signal which isalso present in the data set. The spectra show that this signalis periodic with a base frequency of 5 Hz. Just as in panelFig. 3(b), all of the power shown is at multiples of this basefrequency and is statistically significant. The spectral contentof the atrial rhythm is primarily below 100 Hz. Fig. 3(d) isthe log-spectrum of the removed background noise. Note that

SORNBORGER et al.: EXTRACTION OF PERIODIC MULTIVARIATE SIGNALS 1541
Fig. 3. A multitaper spectral estimate of of the spectrum of (a) PCA modes of raw mouse heart data imaged during a tachycardia event, (b) the periodicmonomorphic re-entrant tachycardia (and induced mechanical motion at half of the tachycardia frequency) extracted from the raw data, (c) an atrial rhythm in thedata, and (d) the residual background noise. Note the clean extraction of the periodic signals, which can be seen as stacks of harmonics in the spectrum, from thebackground. Principal component index (PC Index) is indicated on the abscissa and frequency in Hertz on the ordinate. Arrows indicate the base frequency of theperiodic signals found at 5 Hz (atrial rhythm), 32 Hz (ventricular tachycardia), the induced mechanical motion at 16 Hz and 60 Hz (CCD camera noise, on righthand side) in the data.
there are some remaining harmonics in the background noise(notably a harmonic stack with base harmonic of 60 Hz). Theseharmonics are not part of the harmonic sequence of interest.They represent deterministic machine noise, due to the CCDcamera, and are easily discernable since they do not lie onmultiples of the base frequencies of the tachycardia or the atrialrhythm.It is evident from the results shown in Fig. 3 that the periodic
electrical signals in both the atria and ventricles were accuratelyidentified and separated using our high-resolution methods. Theaccurate estimation of these signals enabled us to separately re-construct these two signals with high precision.Use of spectral analysis provides a useful window into the
signal dynamics. Inspection of Figs. 1(b), 2(b), and 3(b), and toa lesser extent Fig. 3(c), indicates that the extracted signal con-tains power that peaks on parabolic branches. It has been ob-served that in two dimensions, the principal component indexand spatial wavenumber are related as [13]. There-fore, since we find that frequency , this implies that
. This means that, without resorting to visualization, wecan already infer that there is wave propagation in the data.To give the reader a sense for the harmonic analysis used to
identify and extract harmonic content and how statistical signif-icance is determined for the periodic content, in Fig. 4(a), weplot versus frequency (in Hz). Here, isthe value of the cumulative distribution for the F-statistic. (Seethe Appendix for the expression for calculating the F-statistic.)The horizontal line is set at (we set our significancelevel at , see Appendix). The vertical dotted lines showthe locations of the two harmonic sequences at 5 and 16 Hz. InFig. 4(b), we plot versus frequency (in Hz)for the residual time series. Note the accurate removal of the16-Hz harmonic sequence. Note that there are some changes inthe amplitudes of some of the 5-Hz harmonics in Fig. 4(b) dueto overlaps in the bandwidths of the sinusoid estimates.In Fig. 5, we plot two different estimates of the periodic con-
tent of one principal component timecourse of the 32-Hz tachy-cardia [Fig. 5(a)] and the 5-Hz atrial rhythm [Fig. 5(b)]. In this

1542 IEEE TRANSACTIONS ON MEDICAL IMAGING, VOL. 22, NO. 12, DECEMBER 2003
Fig. 4. Top panel: A measure of the statistical significance of the F-statistic. We plot versus frequency in Hertz. The horizontal line is thestatistical significance threshold. This threshold is set such that if the signal were Gaussian noise, we expect on average to spuriously detect less than one sinusoidin the time series. The vertical dotted black lines are placed at the locations of the 5-Hz atrial rhythm harmonics, and the vertical dashed lines are at the locationsof the 16-Hz harmonic stack which includes the 32-Hz tachycardia and the 16-Hz induced mechanical motion.
reconstruction, and for the rest of Section III, we retained onlythe harmonics at multiples of 32 Hz, effectively averaging overthe mechanical motion. In light grey, with one-sigma error bars,we plot a period averaged timecourse. In dark grey, also withone-sigma error bars, we plot the timecourse estimated withour method. Note that the error bars from our estimate are sub-stantially smaller compared with those of the period averagedestimate. The reason for this is that, with our estimate, statis-tically insignificant harmonics are not retained. Therefore, spu-rious noise is discarded and the error is smaller with our method.Although it is not typically thought of in this way, in a pe-riod averaged estimate, all harmonics that are periodic with abase frequency commensurate with the period that is averagedare retained, including those that are not statistically signifi-cant. Therefore, spurious noise is retained in period averagedestimates.In Fig. 6, we compare error bars estimated with our method as
a function of principal component index. x’s are the amplitudeof the error estimated with period averaging, and dots are theamplitude of the error estimated with our method. Note that theerror bars are everywhere less with our method relative to pe-riod averaging. This is for the same reason as mentioned above:that statistically insignificant spurious noise is retained with pe-
riod averaged estimates, but not with our method. One way tothink of this result is that our method accurately identifies thefrequency subspace occupied by the multivariate cardiac signal.Fig. 6 shows the significant increase in SNR that can be obtainedin cardiac imaging data with our method.In Fig. 7, we compare images of the spatio-temporal evolution
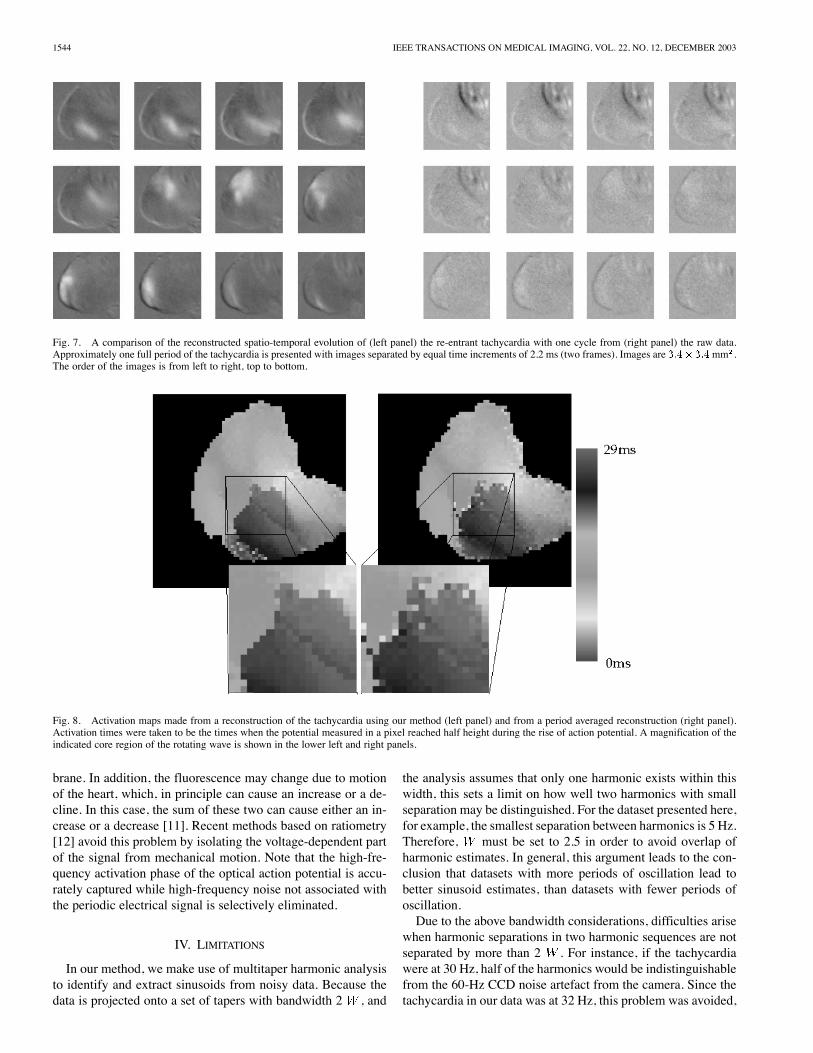
of one cycle of the extracted tachycardia (left panel) with onecycle from the raw data (right panel). The left ventricular freewall (lower left) and the left atrial appendage (upper right) arein view. Light shades of grey represent depolarized tissue, whiledarker regions are at rest. Approximately one full period of thetachycardia (26.2 ms) is presented with images separated byequal time increments of 2.2 ms, (i.e., two frames). Note theclean extraction and depiction of the periodic wave travelling ina counter-clockwise direction around the ventricle. The raw datais contaminated both by shot noise and also by the beginning ofone period of the low-frequency atrial rhythm.In Fig. 8, we compare activation maps made from a recon-
struction of the tachycardia using our method (left panel) andusing a period averaged reconstruction (right panel). Greyscalesindicate time in milliseconds as the wave propagates counter-clockwise on the ventricle. Activation times were taken to bethe times when the potential measured in a pixel reached half

SORNBORGER et al.: EXTRACTION OF PERIODIC MULTIVARIATE SIGNALS 1543
(a)
(b)
Fig. 5. Superimposed plots of a period averaged principal componenttimecourse (here, we have chosen principal component 2) with (a) basefrequency 32 Hz (this is the re-entrant tachycardia) plotted with one-sigmaerror bars (light grey) and the multitaper extracted harmonic content withone-sigma error bars (dark grey) and (b) base frequency 5 Hz (this is the atrialrhythm). The SNR in the tachycardia timecourse extracted using our methodis about half that of the period averaged timecourse and the SNR in the atrialrhythm is about one third that of the period averaged timecourse.
height during the rise of the action potential [2]. The estimatedSNR using our method is roughly twice that of the period av-eraging method. Therefore, particularly in areas at the edges ofthe sweeping wave of re-entrant electrical activity such as areasnear the wave core (i.e., the center of rotation of the wave de-picted in the inset panels) and near the edges of the heart, theactivation time estimate is more accurate, giving rise to a lessnoisy activation map.In Fig. 9, we compare images of the spatio-temporal evolu-
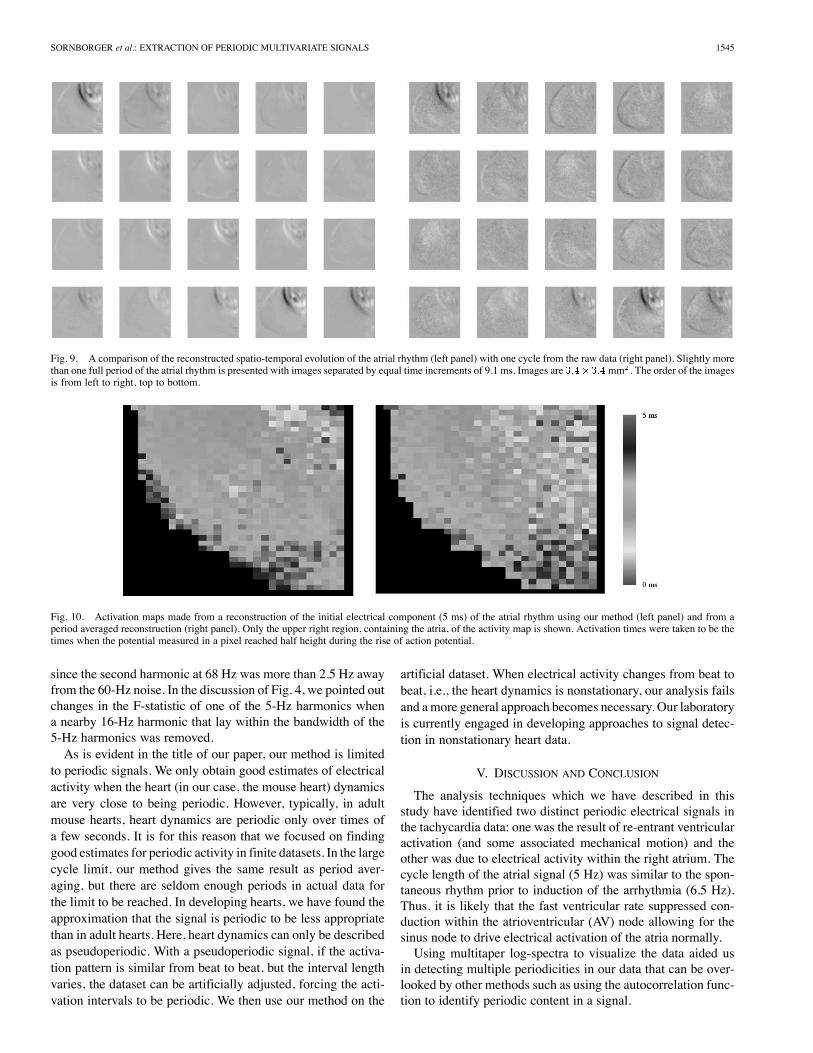
tion of one cycle from the extracted atrial rhythm (left panel)with one cycle from the raw data (right panel). Slightly morethan one full period of the atrial rhythm is presented with im-ages separated by equal time increments of 9.1 ms. Notice that
Fig. 6. A comparison of error bars for all principal component timecoursesestimated with period averaging (x’s) and error bars estimated with our method(dots). Note that the error bars are everywhere less using our method than usingperiod averaging.
the raw data is contaminated with high-frequency shot noise andthe voltage signal originating from the ventricular tachycardia,which is faintly visible in this image series, but would be moreevident with a contracted color axis. Also apparent in some ofthe raw images is darkening near the border of the ventriclewhich is due to mechanical motion. Mechanical motion inducesdarkening since we have subtracted the mean from the data,therefore, when the heart wall moves, the pixel values relativeto the average decrease and look darker. The atrial componentof the signal that we separately reconstruct and present in thisfigure is the second of two periodic signals which were presentin the raw data set. That we can identify and separately recon-struct these signals demonstrates the versatility of our approach.In Fig. 10, we compare activation maps from our recon-
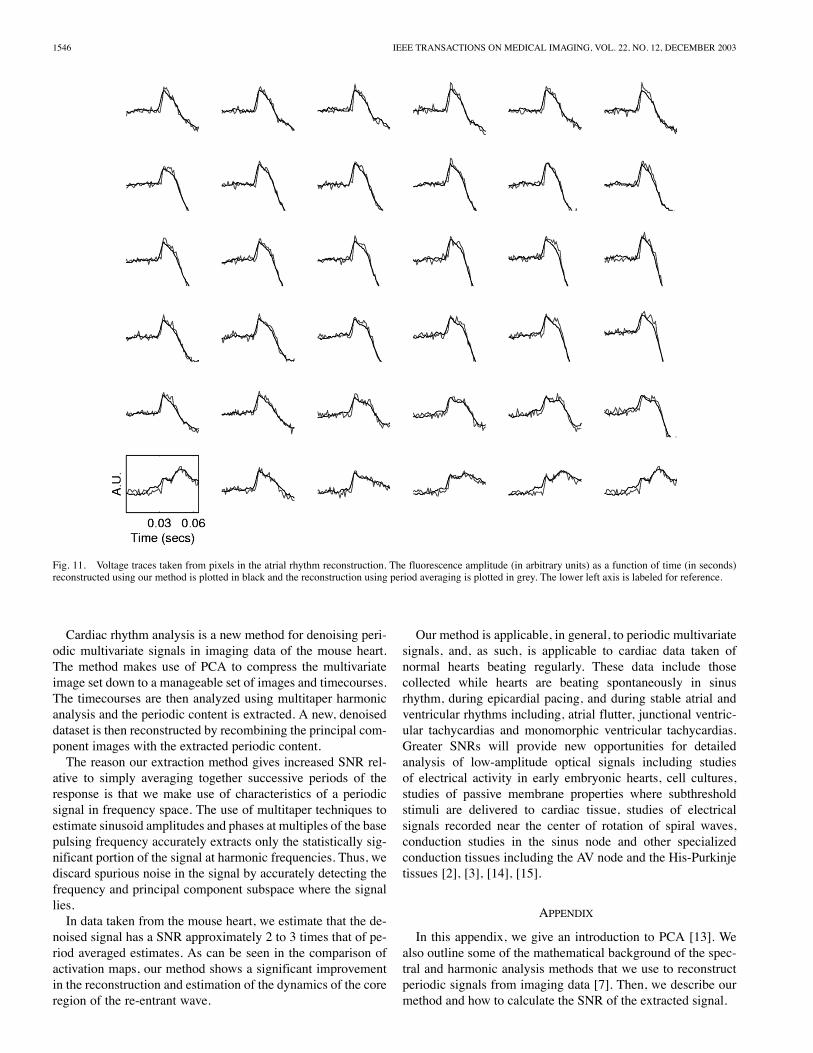
struction (left panel) and a period averaged reconstruction(right panel). The maps were calculated in the same way asthe above tachycardia activation maps. Activation maps weregenerated from the initial 5-ms segment of the periodic atrialsignal which contained the voltage-dependent fluorescence.The remainder of the period contained the mechanical activityinduced by the electrical signal. Electrical activity begins as abroad breakthrough along the upper right border of the imageand rapidly spreads downward to activate the entire field in lessthan 5 ms. Similar to our findings with the activation map ofthe ventricular tachycardias, the reconstructed atrial activationmap shows smoother and more uniform activation times.In Fig. 11, we compare an array of 6 6 pixels taken from
the atrial rhythm reconstructed using our method and using pe-riod averaging. The voltage amplitude as a function of time re-constructed using our method is plotted in black and the recon-struction using period averaging is plotted in grey. The lowerleft axis is labeled for reference. These traces show an initialrelatively flat diastolic phase followed by a rapid rise in voltagedue to electrical activation. The electrical activation is followedby a slow decline caused by the repolarization of the cell mem-
1544 IEEE TRANSACTIONS ON MEDICAL IMAGING, VOL. 22, NO. 12, DECEMBER 2003
Fig. 7. A comparison of the reconstructed spatio-temporal evolution of (left panel) the re-entrant tachycardia with one cycle from (right panel) the raw data.Approximately one full period of the tachycardia is presented with images separated by equal time increments of 2.2 ms (two frames). Images are mm .The order of the images is from left to right, top to bottom.
Fig. 8. Activation maps made from a reconstruction of the tachycardia using our method (left panel) and from a period averaged reconstruction (right panel).Activation times were taken to be the times when the potential measured in a pixel reached half height during the rise of action potential. A magnification of theindicated core region of the rotating wave is shown in the lower left and right panels.
brane. In addition, the fluorescence may change due to motionof the heart, which, in principle can cause an increase or a de-cline. In this case, the sum of these two can cause either an in-crease or a decrease [11]. Recent methods based on ratiometry[12] avoid this problem by isolating the voltage-dependent partof the signal from mechanical motion. Note that the high-fre-quency activation phase of the optical action potential is accu-rately captured while high-frequency noise not associated withthe periodic electrical signal is selectively eliminated.
IV. LIMITATIONS
In our method, we make use of multitaper harmonic analysisto identify and extract sinusoids from noisy data. Because thedata is projected onto a set of tapers with bandwidth 2 , and
the analysis assumes that only one harmonic exists within thiswidth, this sets a limit on how well two harmonics with smallseparation may be distinguished. For the dataset presented here,for example, the smallest separation between harmonics is 5 Hz.Therefore, must be set to 2.5 in order to avoid overlap ofharmonic estimates. In general, this argument leads to the con-clusion that datasets with more periods of oscillation lead tobetter sinusoid estimates, than datasets with fewer periods ofoscillation.Due to the above bandwidth considerations, difficulties arise
when harmonic separations in two harmonic sequences are notseparated by more than 2 . For instance, if the tachycardiawere at 30 Hz, half of the harmonics would be indistinguishablefrom the 60-Hz CCD noise artefact from the camera. Since thetachycardia in our data was at 32 Hz, this problem was avoided,
SORNBORGER et al.: EXTRACTION OF PERIODIC MULTIVARIATE SIGNALS 1545
Fig. 9. A comparison of the reconstructed spatio-temporal evolution of the atrial rhythm (left panel) with one cycle from the raw data (right panel). Slightly morethan one full period of the atrial rhythm is presented with images separated by equal time increments of 9.1 ms. Images are mm . The order of the imagesis from left to right, top to bottom.
Fig. 10. Activation maps made from a reconstruction of the initial electrical component (5 ms) of the atrial rhythm using our method (left panel) and from aperiod averaged reconstruction (right panel). Only the upper right region, containing the atria, of the activity map is shown. Activation times were taken to be thetimes when the potential measured in a pixel reached half height during the rise of action potential.
since the second harmonic at 68 Hz was more than 2.5 Hz awayfrom the 60-Hz noise. In the discussion of Fig. 4, we pointed outchanges in the F-statistic of one of the 5-Hz harmonics whena nearby 16-Hz harmonic that lay within the bandwidth of the5-Hz harmonics was removed.As is evident in the title of our paper, our method is limited
to periodic signals. We only obtain good estimates of electricalactivity when the heart (in our case, the mouse heart) dynamicsare very close to being periodic. However, typically, in adultmouse hearts, heart dynamics are periodic only over times ofa few seconds. It is for this reason that we focused on findinggood estimates for periodic activity in finite datasets. In the largecycle limit, our method gives the same result as period aver-aging, but there are seldom enough periods in actual data forthe limit to be reached. In developing hearts, we have found theapproximation that the signal is periodic to be less appropriatethan in adult hearts. Here, heart dynamics can only be describedas pseudoperiodic. With a pseudoperiodic signal, if the activa-tion pattern is similar from beat to beat, but the interval lengthvaries, the dataset can be artificially adjusted, forcing the acti-vation intervals to be periodic. We then use our method on the
artificial dataset. When electrical activity changes from beat tobeat, i.e., the heart dynamics is nonstationary, our analysis failsand amore general approach becomes necessary. Our laboratoryis currently engaged in developing approaches to signal detec-tion in nonstationary heart data.
V. DISCUSSION AND CONCLUSION
The analysis techniques which we have described in thisstudy have identified two distinct periodic electrical signals inthe tachycardia data: one was the result of re-entrant ventricularactivation (and some associated mechanical motion) and theother was due to electrical activity within the right atrium. Thecycle length of the atrial signal (5 Hz) was similar to the spon-taneous rhythm prior to induction of the arrhythmia (6.5 Hz).Thus, it is likely that the fast ventricular rate suppressed con-duction within the atrioventricular (AV) node allowing for thesinus node to drive electrical activation of the atria normally.Using multitaper log-spectra to visualize the data aided us
in detecting multiple periodicities in our data that can be over-looked by other methods such as using the autocorrelation func-tion to identify periodic content in a signal.
1546 IEEE TRANSACTIONS ON MEDICAL IMAGING, VOL. 22, NO. 12, DECEMBER 2003
Fig. 11. Voltage traces taken from pixels in the atrial rhythm reconstruction. The fluorescence amplitude (in arbitrary units) as a function of time (in seconds)reconstructed using our method is plotted in black and the reconstruction using period averaging is plotted in grey. The lower left axis is labeled for reference.
Cardiac rhythm analysis is a new method for denoising peri-odic multivariate signals in imaging data of the mouse heart.The method makes use of PCA to compress the multivariateimage set down to a manageable set of images and timecourses.The timecourses are then analyzed using multitaper harmonicanalysis and the periodic content is extracted. A new, denoiseddataset is then reconstructed by recombining the principal com-ponent images with the extracted periodic content.The reason our extraction method gives increased SNR rel-
ative to simply averaging together successive periods of theresponse is that we make use of characteristics of a periodicsignal in frequency space. The use of multitaper techniques toestimate sinusoid amplitudes and phases at multiples of the basepulsing frequency accurately extracts only the statistically sig-nificant portion of the signal at harmonic frequencies. Thus, wediscard spurious noise in the signal by accurately detecting thefrequency and principal component subspace where the signallies.In data taken from the mouse heart, we estimate that the de-
noised signal has a SNR approximately 2 to 3 times that of pe-riod averaged estimates. As can be seen in the comparison ofactivation maps, our method shows a significant improvementin the reconstruction and estimation of the dynamics of the coreregion of the re-entrant wave.
Our method is applicable, in general, to periodic multivariatesignals, and, as such, is applicable to cardiac data taken ofnormal hearts beating regularly. These data include thosecollected while hearts are beating spontaneously in sinusrhythm, during epicardial pacing, and during stable atrial andventricular rhythms including, atrial flutter, junctional ventric-ular tachycardias and monomorphic ventricular tachycardias.Greater SNRs will provide new opportunities for detailedanalysis of low-amplitude optical signals including studiesof electrical activity in early embryonic hearts, cell cultures,studies of passive membrane properties where subthresholdstimuli are delivered to cardiac tissue, studies of electricalsignals recorded near the center of rotation of spiral waves,conduction studies in the sinus node and other specializedconduction tissues including the AV node and the His-Purkinjetissues [2], [3], [14], [15].
APPENDIX
In this appendix, we give an introduction to PCA [13]. Wealso outline some of the mathematical background of the spec-tral and harmonic analysis methods that we use to reconstructperiodic signals from imaging data [7]. Then, we describe ourmethod and how to calculate the SNR of the extracted signal.

SORNBORGER et al.: EXTRACTION OF PERIODIC MULTIVARIATE SIGNALS 1547
A. PCA and Multivariate DataPCA (also known as singular-value decomposition and
Karhunen-Loéve decomposition) is a method for compressingan image set and also for separating out uncorrelated compo-nents. Since images in our data are 64 64 pixels, a brute forceapproach would leave us with around 4000 pixel timecoursesto analyze. We use PCA to compress the data into a smallset of images and timecourses resulting in significantly fewertimecourses to analyze.The dataset is decomposed as
(3)
where is the time index and is pixel number. We seek a de-composition where and are orthonormal. It followsthat:
(4)
and
(5)
To obtain the and the , we may solve one of twoproblems
(6)
where
(7)
or equivalently(8)
where
(9)
Only one of these eigenvalue problems need be solved, sincethe above expressions for and can be used to furnish thecomplementary eigenfunctions. The problem that is solved inpractice is that which gives the smaller matrix to diagonalize. Inour case, this is .The principal component decomposition is optimal in the
sense that it is the best term by term approximation to the data.Therefore, truncating the decomposition gives an optimallycompressed dataset. Often truncation is possible since many ofthe principal components that contain little of the signal powerare associated with noise.
B. Multitaper Harmonic and Spectral MethodsMultitaper methods have been successful because they have
the smallest bias and variance among the spectral and harmonicanalysis methods that have been developed to date [7]. Also,there is a very accurate and useful nonparametric multitaper har-monic analysis technique for extracting deterministic sinusoidsfrom noisy data. This technique is useful both for the extractionof a deterministic signal from noisy data, as well as for bettercharacterization of spectra that include harmonic lines.
It has long been known that “tapering” or windowing a signalcan improve the bias characteristics of the signal’s estimatedspectrum. Bias is a measure of how much power at one fre-quency in a signal influences the estimate of power at other fre-quencies. Multitaper methods achieve low bias through the useof orthogonal tapers (sometimes also called windows), whichare solutions to an optimization problem in which frequencyconcentration is optimized within a certain bandwidth. Eigen-functions of the optimization problem that are associated withlarge eigenvalues have extremely good frequency concentrationproperties, i.e., low bias. Therefore, a set of the eigenfunctionswith good frequency concentration is selected and projectedonto the data to obtain a set of (approximately orthogonal) es-timates of the spectral content. The estimates are then averagedto decrease the variance of spectral estimates or regressed uponto determine harmonic content.1) Frequency Concentration: Multitaper spectral and har-
monic analysis make use of a set of tapers with optimal fre-quency concentration properties. These tapers are referred to asdiscrete prolate spheroidal sequences (DPSSs) or also simplyas Slepian sequences. The DPSSs are eigenfunctions of a fre-quency concentration problem, which can be sketched as fol-lows: we define frequency concentration with the expression
(10)
This is a measure of the amount of power found in a frequencyinterval with bandwidth 2 , relative to the amount of powerin the entire signal. We wish to find functions with frequencymaximally concentrated within the frequency interval (band-width) 2 . is the Fourier transform of the discretely sampledtime sequence to be solved for
(11)
Here, is the time coordinate in the sequence and is the fre-quency. Inserting this expression into the expression forgives
(12)
We now maximize resulting in the eigenvalue problem
(13)
The solution of this eigenvalue problem results in a set of eigen-functions that are parametric in , the number of pointsin the time series, and the bandwidth within which poweris concentrated. They are ordered according to their frequencyconcentration characteristics. The eigenfunction correspondingto the largest eigenvalue has the best concentration properties,and so on in decreasing order.2) Spectral Analysis: We use multitaper spectral estimates
primarily as a means of inspecting our data. Multitaper har-monic analysis, explained next, is the technique used in our re-construction method. A spectral estimate only provides infor-mation concerning the power at a given frequency, and givesno information concerning the phase of the signal, however, the

1548 IEEE TRANSACTIONS ON MEDICAL IMAGING, VOL. 22, NO. 12, DECEMBER 2003
spectrum can be extremely useful in visualizing the distributionof power in various components of a signal.The spectrum is calculated by tapering the signal (here as-
sumed to be stationary) with a set of low-bias DPSS tapers,giving a set of individual estimates of the spectrum
(14)
where denotes the taper used to calculate theestimate. These estimates, each having good bias properties, areaveraged to give a low-variance spectral estimate
(15)
To retain low bias in the spectral estimate, a good first choicefor is . For a spectral analysis of a periodicsignal, should be at most half the frequency separation ofsuccessive multiples of the base frequency.3) Harmonic Analysis: Multitaper harmonic analysis is
one of the two main techniques used in our analysis method.Harmonic analysis provides information on both amplitude andphase of deterministic sinusoids in noisy data.The procedure here is to begin with the assumption that the
time series has a deterministic sinusoidal component at fre-quency with complex amplitude (i.e., amplitude and phase)accompanied by noise
(16)
The Fourier transform of tapered with the th DPSS taperat frequency is, to a good approximation
(17)
where is the tapered estimate of the noise at frequency ,is the increment in time between samples (assumed fixed), and
is the Fourier transform of the th DPSS. At this point, wehave estimates of the sinusoid amplitude at fre-quency . We can now use linear regression (i.e., a least squaresfit) to obtain an estimate for
(18)
As a consequence of the central limit theorem, the estimatesare normally distributed. With the estimate in hand, we
construct the ratio of the estimated variance of the distributionof the complex signal amplitude with an estimate of varianceof the distribution of the noise . The ratio is F-distributed with2 and degrees of freedom under the null hypothesis (thatthere is no sinusoid present) and takes the form
(19)
where
(20)
and signifies “equal” in the distributional sense. With theabove expression for an F-distribution, we can test whether asinusoid exists in the data. We take as null hypothesis that thereis no sinusoid. We then ask the question, is the data consistentwith the null hypothesis. Mitra and Pesaran [8] suggest usinga significance level for the F-test of . At this level, aGaussian noise process would, on average, result in only onespuriously identified sinusoid in the time series.It should be emphasized here that this method gives excellent
results, even for sinusoids in substantial background noise.
C. Method for Extracting the Periodic Signal From ImagingDataOurmethod, which we also describe verbally in themain text,
is as follows.We begin by compressing the image set using PCA
(21)
here, is time, or often just frame number, and is pixel number.We determine where to truncate the expansion by either exam-ining the spectrum visually for the location of the end of the har-monic sequences due to periodic content and the spectra becomesmooth, or by examining the locations of significant harmonicsto determine where the harmonic sequences end. We also checkthe amount of power in the principal components and ascertainthat we are not discarding more than 1% of the power in thesignal. We have found in the mouse heart data analyzed herethat 50 principal components are usually sufficient.We then use multitaper harmonic analysis to remove statis-
tically significant sinusoids that are located at multiples of thebase pulsing frequency. We choose the bandwidth 2 of theSlepian sequences used in the estimates to be 90% of the widthbetween harmonics in the harmonic sequence. The harmonicanalysis results in a set of estimated periodic time-courses associated with the set of eigenimages .Finally, we reconstruct an estimate of the harmonic content
in the image set by recombining the estimated periodictimecourses with the eigenimages from the PCA.
(22)
contains all of the statistically significant periodic con-tent of the original raw data.
D. SNR of the Extracted Periodic ComponentThe results from the harmonic regression analysis may be
used to calculate error bars for each extracted harmonic. Thevariance of an estimated harmonic is
(23)
where the local continuous part of the spectrum may be esti-mated from the regression analysis as
(24)
One-sigma error bars for a single harmonic, for example, maythen be estimated as . When multiple significant

SORNBORGER et al.: EXTRACTION OF PERIODIC MULTIVARIATE SIGNALS 1549
harmonics exist in a timeseries, global error bars may be calcu-lated for the extracted timecourse as
(25)
where counts the significant harmonics.
REFERENCES[1] S. Rentschler, D. M. Vaidya, H. Tamaddon, K. Degenhardt, D. Sassoon,
G. E. Morley, J. Jalife, and G. I. Fishman, “Visualization and functionalcharacterization of the developing murine cardiac conduction system,”Development, vol. 128, pp. 1785–1792, 2001.
[2] H. S. Tamaddon, D. Vaidya, A. M. Simon, D. L. Paul, J. Jalife, and G.E. Morley, “High-resolution optical mapping of the right bundle branchin connexin40 knockout mice reveals slow conduction in the specializedconduction system,” Circ. Res., vol. 87, pp. 929–936, 2000.
[3] D. M. Vaidya, H. S. Tamaddon, C. W. Lo, S. Taffet, M. Delmar, G. E.Morley, and J. Jalife, “Null mutation of connexin43 causes slow prop-agation of ventricular activation in the late stages of mouse embryonicdevelopment,” Circulation Research, vol. 88, pp. 1196–1202, 2001.
[4] L. Sirovich, Ed., New Perspectives in Turbulence. New York:Springer-Verlag, 1991, ch. 5.
[5] R. A. Gray, A. M. Pertsov, and J. Jalife, “Spatial and temporal organi-zation during cardiac fibrillation,” Nature, vol. 392, pp. 75–78, 1998.
[6] R. A. Gray and J. Jalife, “Effects of atrial defibrillation shocks on theventricles in isolated sheep hearts,”Circulation, vol. 97, pp. 1613–1622,1998.
[7] D. J. Thomson, “Spectrum estimation and harmonic analysis,” Proc.IEEE, vol. 70, pp. 1055–1096, 1982.
[8] P. P. Mitra and B. Pesaran, “Analysis of dynamic brain imaging data,”Biophys. J., vol. 76, pp. 691–708, 1999.
[9] L. Tauxe, “Sedimentary records of relative paleointensity of the geomag-netic field: theory and practice,” Rev. Geophys., vol. 31, pp. 319–354,1993.
[10] D. J. Thomson and R. Schild, “Time delay estimates for Q0957+561A, B,” in Application of Time Series Analysis in Astronomy and Mete-orology, T. S. Rao, M. B. Priestley, and O. Lessi, Eds. London, U.K.:Chapman and Hall, 1997, pp. 187–204.
[11] S. Rohr and J. PKucera, “Optical recording system based on a fiber opticimage conduit: assessment of microscopic activation patterns in cardiactissue,” Biophys. J., vol. 75, pp. 1062–1075, 1998.
[12] S. B. Knisley, R. K. Justice, W. Kong, and P. L. Johnson, “Ratiometryof transmembrane voltage-sensitive fluorescent dye emission in hearts,”Amer. J. Physiol. Heart Circ. Physiol., vol. 279, pp. H1421–H1433,2000.
[13] L. Sirovich and R. Everson, “Management and analysis of large scien-tific datasets,” Int. J. Supercomput. Applicat., vol. 6, pp. 50–68, 1992.
[14] I. R. Efimov and T. N. Mazgalev, “High-resolution, three-dimensionalfluorescent imaging reveals multilayer conduction pattern in the atri-oventricular node,” Circulation, vol. 98, pp. 54–57, 1998.
[15] T. Sakai, A. Hirota, Y. Momose-Sato, K. Sato, and K. Kamino, “Opticalmapping of conduction patterns of normal and tachycardia-like excita-tion in the rat atrium,” Jpn. J. Physiol., vol. 47, pp. 179–188, 1997.