extraction of bio-active components...
TRANSCRIPT

EXTRACTION OF BIO-ACTIVE COMPONENTS
FROM FRUIT AND VEGETABLE PROCESSING
WASTES: USING GRAPE WASTE FROM THE WINE
PROCESSING INDUSTRY AS A MODEL
By
AKHILA VASAN
Bachelor of Engineering in Chemical Engineering
Visvesvaraya Technological University
Bangalore, India
2006
Submitted to the Faculty of the Graduate College of the
Oklahoma State University in partial fulfillment of
the requirements for the Degree of
MASTER OF SCIENCE May, 2009
EXTRACTION OF BIO-ACTIVE COMPONENTS
FROM FRUIT AND VEGETABLE PROCESSING
WASTES: USING GRAPE WASTE FROM THE WINE
PROCESSING INDUSTRY AS A MODEL
Thesis Approved:
Dr. Christina DeWitt
Thesis Adviser
Dr Stanley Gilliland
Dr William McGlynn
Dr. A. Gordon Emslie
Dean of the Graduate College
ii
ACKNOWLEDGMENTS
This research project would not have been possible without the support of many
people. Firstly I would like to thank my mentor Dr. Christina DeWitt without whose kind
support and encouragement this project would indeed be an unthinkable task. Her
constructive criticism, comments, fruitful discussions and suggestions has made her the
backbone of this thesis. I gratefully acknowledge Dr. Stanley Gilliland for his continued
support and guidance. His insight has provided me with a great source of inspiration,
something I will carry with me in my life. I am very appreciative of Dr William McGlynn
who was zealous and motivating throughout the study. I would like to extend my heartfelt
gratitude to Dr Carla Goad for helping me with the statistical analysis.
I also wish to thank Mr. Ioannis Oikanomakos for being a good team partner
during the extraction process, Dr. Paloma Cuesta Alonso for being a mentor and helping
me out in times of need and everyone at the Food and Agricultural Products Center for
being a strong support. Words cannot express my gratitude towards Kris Novotny, who
never said ‘no’ when asked for help. I owe special thanks to a very vibrant working
group: Lin Koh, Alisha Parsons, Teresa Brown, Tyler Tate, Claudia Cerruto Noya , Lina
Ramirez and Tanner Dry. They made me feel at home even though I was away from
home. I enjoyed working with all of them and have learnt a lot during the course of my
study here. With this, I owe immense gratitude to Sujitha Prasad and Aparna Nagarajan.
iii
They helped me through all my ups and downs and were a constant source of
encouragement and support. I will remember them for some of my best memories in
Stillwater. Thank you so much for everything.
Most importantly, my family and friends have played a major role in my pursuit
of a Master’s degree. I would like to thank my parents: Mr. H.R.K. Vasan and Mrs Veena
Vasan, and my brother, Aditya for shaping me to be what I am today. Special thanks to
Jayant for supporting me at all times. Their unwavering support and love, made this
journey a very pleasant one. Last but not the least; I would like to thank God for giving
me this wonderful opportunity.
iv

TABLE OF CONTENTS
Chapter Page I. INTRODUCTION ......................................................................................................1
Objectives ................................................................................................................2 II. LITERATURE REVIEW ..........................................................................................3 2.1 Importance of bioactive components .................................................................3 2.2 Wine Processing Industry ..................................................................................4 2.3 Grape Seed Composition ...................................................................................6 2.4 Extraction Methods ............................................................................................8 2.4.1 Traditional Methods ..................................................................................9 2.4.2 Modern technologies ...............................................................................11 2.5 Microorganisms ...............................................................................................12 2.5.1 Escherichia coli 0157:H7 .......................................................................12 2.5.2 Staphylococcus aureus ............................................................................14 2.6 Mechanism of mode of action of phenolics against the microorganisms ........16 III. EXTRACTION OF BIO-ACTIVE COMPONENTS FROM FRUIT AND
VEGETABLE PROCESSING WASTES: USING GRAPE WASTE FROM THE WINE PROCESSING INDUSTRY AS A MODEL FOR DETERMINING ANTIMICROBIAL ACTIVITY ............................................................................17
Abstract ..................................................................................................................17 Introduction ............................................................................................................18 Materials and Methods ...........................................................................................20 Results ....................................................................................................................25 Petroleum Ether ...............................................................................................25 70% Methanol ..................................................................................................27 50% Acetone ....................................................................................................28 0.01% Pectinase ...............................................................................................30 Discussion ..............................................................................................................32
v
Chapter Page
IV. CONCLUSION......................................................................................................35 REFERENCES ............................................................................................................45 APPENDICES .............................................................................................................54
vi

LIST OF FIGURES
Figure Page 1. Structure of some basic phenolics .........................................................................36 2. Basic Steps involved in red wine making .............................................................37 3. Action of petroleum ether, 50% acetone, 70% methanol and 0.01% pectinase against Escherichia coli 0157:H7 .........................................................................38 4. Action of petroleum ether, 50% acetone, 70% methanol and 0.01% pectinase against Staphylococcus aureus ..............................................................................39
vii

LIST OF TABLES
Table Page 1. Approximate acreage, percentage and number of vines breakdown of wine grape
types in Oklahoma ................................................................................................40 2. Inhibition of Escherichia coli 0157:H7 at a 3 h growth level ...............................41 3. Inhibition of Escherichia coli 0157:H7 at a 4 h growth level ...............................42 4. Inhibition of Staphylococcus aureus at a 3 h growth level ...................................43 5. Inhibition of Staphylococcus aureus at a 4 h growth level ...................................44
viii

CHAPTER I
INTRODUCTION
According to the 1997 USDA Economic Research Service, about 96 billion
pounds of food or 27 % of 356 billion pounds was lost to human use (Lipton and others
1999). A significant quantity of this waste arises from the fruit and vegetable processing
industries due to variability of input, high standards of production and amount of non-
usable materials in fresh produce. The US Council for Agricultural Science and
Technology reported 136 – 410 kg of waste is produced for every ton of input material in
these industries (UNEP 2002). The waste consists of a significant amount of solid organic
material and includes peels, rinds, seeds, stems, fruits, twigs and other rejected raw
material (Stabnikova and others 2005). The by-products from these industries generally
have high moisture content (Garcia and others 2005) and are thus prone to microbial
spoilage. The high moisture content of the wastes also leads to increased drying and
storage costs. Thus, waste plant material is typically used as a fertilizer or in feed in order
to minimize the economic impact of its treatment and stabilization (Esteban and others
2007). Food processors also use composting as a low cost method of waste management
(Schaub and Leonard 1996). All the above factors, have led to the importance of
efficient, economic and environment friendly methods to deal with food processing by-
products: in other words, the possible conversion of by-products to co-products.
1

To illustrate my point, let’s look at an upcoming industry in Oklahoma: the wine
making industry. The end products of wine processing consist of seeds, skins and stems.
This refuse known as ‘pomace’ is obtained on pressing juice from the grapes. The
amount and composition of waste varies and is dependent on the type of process (batch or
semi-batch) and also processing conditions (Musee and others 2007; Andres-Lacueva and
others 2008; Baydar and Ozkan 2006). A challenge faced by the wine making industry is
to add value to the waste by extracting the tannins and polyphenolics already present in
the grapes. This implies that the byproducts of the wine making industry can be used to
develop nutraceuticals and functional components such as antioxidants, antimicrobials
and biofuels. The focus of this project was hence to conceive a method to add economic
value to fruit and vegetable waste by developing an efficient method to screen for
valuable bioactive components. Waste from the wine industry was used to evaluate
extraction conditions suitable for the screening process.
The objectives of this work were therefore:
• To develop extraction procedures which can be commercially replicated with ease.
• To test different extraction conditions by evaluating their ability to extract antimicrobial
compounds from wine waste. Antimicrobial activity was tested against both Gram
positive (Staphylococcus aureus) and Gram negative (Escherichia coli 0157:H7)
pathogens commonly encountered in foods.
The long term goal of the project is to apply the selected screening protocol to other fruit
and vegetable processing industries in Oklahoma thus turning their wastes into revenue.
2
CHAPTER II
REVIEW OF LITERATURE
2.1 Importance of Bio-Active Components
The present day consumer is focused on dietary interventions to improve health. This
includes foods with functional ingredients that provide additional
health benefits (Teratanavat and Hooker 2006). Organic and natural foods are in great
demand because as far as the consumer is concerned this is the 'best' form of
food (Hughner and others 2007). Needless to say, our market is consumer driven and
innovation in food manufacturing practices is a prerequisite for the industry to survive.
Researchers have aided the industry in this process and a significant amount of literature
is available on the use of plant metabolites in food showing their impact on human health.
However, the plant food processing industries produce large quantities of by products and
these pose disposal problems (Hui and others 2006). The extraction of functional or
bioactive components would therefore be an alternative to other disposal methods.
Several foods like cereals, legumes, flax seed, sweet cherry, banana, red onion, echinacea
flower head and root, purple potato, ginseng, buck wheat, apple, pears, horseradish, white
and red grapes, green tea, black tea, wine, coffee, beer, etc (Andres-Lacueva and others
2008; Velioglu and others 1998; Sembries and others 2006) possess phytochemicals.
Thus, phytochemicals (plant extracts) are commonly found and easily available in
everyday fruits, vegetables, snack foods as well as breakfast foods. These phytochemicals
are plant derived compounds that possess antimicrobial and antioxidant properties. Plants
and derived oils that possess antimicrobial properties include garlic (Kyung and others
3

1996), hops (Larson and others 1996), ginger, turmeric (Gupta and Ravishankar 2005),
rosemary (Krajcova and others 2008), sage, cocoa (Andres-Lacueva and others 2008),
oregano etc. Tamarind seeds show the presence of flavanoid compounds such as
cathechin and epicatechin (Murga and others 2000). Theivendran and others (2006)
showed that Grape Seed Extract (GSE) and green tea extract showed antimicrobial
activity both alone as well as with nisin. Thus, as mentioned above, plant derived extracts
or phytochemicals are obtained from a variety of sources and can be divided into the
following general categories as described by Goldberg and others (2003).
1. Phenolic compounds
Phenolic compounds are characterized by at least one aromatic ring and have one or
more hydroxyl groups. Phenolics are classified based on the number and arrangement
of carbon atoms and are normally conjugated with sugars or organic acids.
2. Sulphur containing compounds and derivatives
3. Chlorophyll and its derivatives
Of these, ones most commonly found in plants are polyphenols and flavanoids which are
derivatives of phenolic compounds (Shi and others 2005). Fig 1 portrays the structures of
some basic phenolics. Many of these commonly occur in grapes.
2.2 Wine Processing Industry
Grapes (Vitis vinifera) are the second most abundant crop, after oranges, with an
annual world production of more than 60 million tons (Schieber and others 2001).
According to Mazza and others (1998) about 80 % of this is utilized for wine making,
13% is sold as table grapes and the balance is consumed as raisins, juice and other
products. The United States produces about 7.2 million tons (USDA 2008). About 89%
4

of the grapes produced in the US are from California. Wine type grape production in
California is expected to be 53% of the California production i.e. 3.4 million tons (NASS
2008). In Oklahoma, wine production is a forthcoming industry and a 2002 study by
USDA showed total wine sales in OK to be nearly 2 million gallons a year. A report on
the Oklahoma Grape Growers survey (Stafne 2006) showed a total acreage between 232
- 242 acres.
Grapes can either be table or wine grapes and they are further classified based on
the region of growth and climatic conditions. The European Union (EU) is the largest
producer of grapes and European grapes are known to thrive in a Mediterranean climate.
This climatic condition is also prevalent in California and is encompassed by mild
winters and variable summer temperatures. Rainfall in these regions is more prominent in
the colder months. Hence, Vitis vinifera is a common grape varietal in EU and California.
Other American states experience more severe variations in temperature such as multiple
frosts and windy weather in spring followed by heavy rainfall in the fall especially
September. This results in pollination problems as well as damaged grapes (NASS 2008).
Applequist and others (2008) elucidate that American vineyards rely on American
varieties of grapes such as Norton and Cynthina, native muscadine varities ( Vitis
rotundifolia and Vitis labrusca) and other French hybrids that thrive in Missouri and are
capable of producing high quality wines. Specifically in Oklahoma, Vitis vinifera
dominates with nearly 80%, hybrids less than 15%, American species roughly 7% and
muscadine with less than 1% of the total (Stafne 2006). Table 1 shows a comprehensive
view of the Oklahoma wine industry and its components.
5

Fig 2 shows the major steps involved in wine-making. Depending on the type of
wine to be produced, further changes are made to the process.
Also of importance is that waste consists of about 20% of the weight of processed
grapes (Mazza and others 1998). This is because waste is produced from almost every
step of the wine making process. About 3% of the original grapes consist of stems and
20% consists of pomace (skins and seeds). Skins constitute 75% of wet pomace while the
remaining comprises seeds (Rabak and Taylor 1921).
Byproducts from the wine processing industry are disposed either by burning or
are used as cattle feed. An alternative is the production of grape seed oil for human
consumption due to the high level of unsaturated fatty acids (Gomez and others 1996).
Some researchers have also studied the possibility of producing functional compounds
from grape waste, as has been described in the ‘Extraction Methods’ of this thesis.
2.3 Grape Seed Composition
Grape seed is a complex matrix that consists of 40% fiber, 16% oil, 11% protein
and 7% complex phenols and tannins (CPT) besides sugars, mineral salts etc. Natural
phenolic compounds such as proanthocyanidins (PA) are present in CPT and are
responsible for the properties of GSEs (Murga and others 2000). It has been found that
fresh red Vitis vinifera grapes contain about 4 mg/kg of phenolic material. This is
normally present in the skin and seeds in the form of gallic acid, caftaric acid,
anthocyanins, and oligomeric proanthocyanidins. Even white grapes contain phenolic
material in the seed (Goldberg 2003). Hence, the majority of phenolics in grapes are
present in the seeds. As a result, seedless grapes have a lower phenolic content.
Oligomeric proanthocyanidins are present abundantly in grape seeds, tea leaves and pine
6
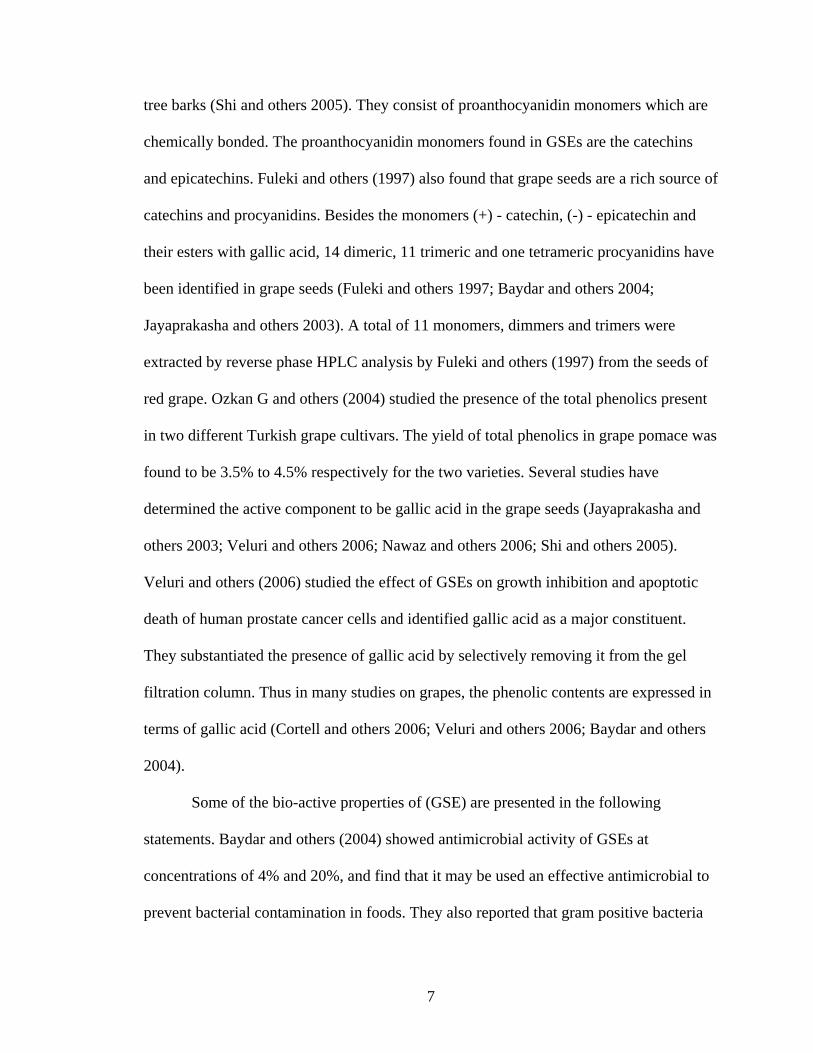
tree barks (Shi and others 2005). They consist of proanthocyanidin monomers which are
chemically bonded. The proanthocyanidin monomers found in GSEs are the catechins
and epicatechins. Fuleki and others (1997) also found that grape seeds are a rich source of
catechins and procyanidins. Besides the monomers (+) - catechin, (-) - epicatechin and
their esters with gallic acid, 14 dimeric, 11 trimeric and one tetrameric procyanidins have
been identified in grape seeds (Fuleki and others 1997; Baydar and others 2004;
Jayaprakasha and others 2003). A total of 11 monomers, dimmers and trimers were
extracted by reverse phase HPLC analysis by Fuleki and others (1997) from the seeds of
red grape. Ozkan G and others (2004) studied the presence of the total phenolics present
in two different Turkish grape cultivars. The yield of total phenolics in grape pomace was
found to be 3.5% to 4.5% respectively for the two varieties. Several studies have
determined the active component to be gallic acid in the grape seeds (Jayaprakasha and
others 2003; Veluri and others 2006; Nawaz and others 2006; Shi and others 2005).
Veluri and others (2006) studied the effect of GSEs on growth inhibition and apoptotic
death of human prostate cancer cells and identified gallic acid as a major constituent.
They substantiated the presence of gallic acid by selectively removing it from the gel
filtration column. Thus in many studies on grapes, the phenolic contents are expressed in
terms of gallic acid (Cortell and others 2006; Veluri and others 2006; Baydar and others
2004).
Some of the bio-active properties of (GSE) are presented in the following
statements. Baydar and others (2004) showed antimicrobial activity of GSEs at
concentrations of 4% and 20%, and find that it may be used an effective antimicrobial to
prevent bacterial contamination in foods. They also reported that gram positive bacteria
7

were more inhibited than the corresponding gram negative ones. GSE of the variety
Ribier showed significant antilisterial activity through 2 distinct types of compounds:
skin derived (pigmented) and seed derived (non – pigmented) polymeric phenolics
(Rhodes and others 2006). Inhibitory effect of GSE against lipases is due to the
synergistic activity of multiple components as against a single component. Presence of a
variety of health promoting compounds in GSE has been shown by many studies. Some
of them include flavonoids that prevent obesity (Moreno and others 2003) and
antimicrobial effects by various proanthocyanidins (Theivendran and others 2006;
Baydar and others 2004; Jayaprakasha and others 2003). Moreno and others (2003) have
indicated a lack of toxicity and hence support the use of GSE in foods.
2.4 Extraction Methods
Extraction is defined as the process of obtaining a compound from a mixture by
physical or mechanical means. It is an indispensable step to isolate the active ingredients
in plant material. Many techniques have been developed to extract the bio-active
components of grape pomace. The core foci of extraction methods are choice of solvents
and addition of thermal or mechanical energies to increase the efficiency of the process.
This is achieved by varying the rate of mass transfer in the system. Also of importance is
that many components are thermally unstable as well as photosensitive. Thus, care must
be taken to not only increase the amount of extracted compound but also to obtain them
in an active form.
The first step in an extraction process is sample preparation. Studies conduct
preparation of the sample in a multitude of ways depending on the state of the raw
material and the components of interest. Oszmianski and others (1989) removed the
8

grape seeds, froze it as well as ground it under liquid nitrogen. The stage of evolution of
the grapes was of interest in this study as earlier studies showed that phenolic content in
an unripe fruit is higher than a fully ripe grape. Baydar and others (2006) studied wine by
products such as grape seed, bagasse (skin and stem) and pomace (skin, seed, and stem)
to determine the tocopherol contents. In this case, the samples were air dried at room
temperature in the dark and were crushed in a grinder. Gomez and others (1996) treated
grape seed under different particle size and drying times. In their case, they used a
fraction grape seed size of 0.75 mm and a relative humidity less than 0.35%.
2.4.1 Traditional Methods
Traditionally, extraction of the compounds used organic solvents such as hexane
(Gómez and others 1996) . Baydar and others (2006) evaluated two traditional methods
of extraction: hot and cold. For cold extraction, 2g samples were extracted with 10 mL of
hexane by triple extractions at room temperature. Rotary evaporation under vacuum was
used as means to remove the solvent and the extract was filtered and resuspended in a
mixture of heptane: tetrahydrofuran (95:5 v/v). For hot extractions, a Soxhlet apparatus
was used. Temperature was 65 ⁰C with 1 g of ground sample and 50 mg of pyrogallol as
an antioxidant. The extraction apparatus was completely covered in foil and thus
protected from light. Baydar and others (2004) used dried and powdered grape seeds
wherein fatty materials were removed by Soxhlet extraction with petroleum ether (60 ⁰C
for 6 h). The defatted grape seed (50 g) was further extracted with a mixture of acetone:
water: acetic acid (90:9.5:0.5, 200 mL for 8 h) and ethyl acetate: methanol: water
(60:30:10). It was found that the former extraction yielded more phenolics than the latter.
This agrees with results obtained by Jayaprakasha and others (2003). In Soxhlet
9

extractions, a variety of combinations of solvents can be used depending on the presumed
chemical composition of the grape seed. Another group (Lafka and others 2007) studied
different extraction solvents, times, concentration and pH to determine phenolic content
of winery wastes. Phenolic extraction was carried out on samples defatted with hexane
(10:1 v/w). Extraction solvents tested were methanol, ethanol, methanol: ethanol (1:1),
isopropanol and ethyl acetate (3:1 to 12:1 v/w) under extraction times (30 min to 24 h) in
an orbital shaker at room temperature. Extract was filtered through a Buchner funnel and
dried using a rotary evaporator. The residue was re-dissolved in methanol and stored at -
20 ⁰C until further analysis. The highest phenolic content (95.9%) was extracted using
ethanol: waste (1:1) while isopropanol gave the least (4.2%). Pinelo and others (2005)
studied the effect of temperature (25 ⁰C to 50 ⁰C), solvent interaction time (between 30
min and 90 min) and solvent to solid ratio (1:1 to 5:1) on grape pomace extracts. The
grape pomace (10 g) was subjected to batch extraction in a rotary shaker (140 rpm) and
methanol, 96% ethanol and distilled water were used as pure solvents. On filtration, the
solids were separated and extracts were analyzed for total phenolic content and
antiradical activity. It was deduced that extraction with ethanol as the solvent was the
most suitable in the given conditions. Also optimum conditions of temperature (50 ⁰C)
and solvent: solid ratio (1:1) maximized antiradical activity of the phenolic extracts.
Thus, the commonly used organic solvents, in conjunction with a polar solvent like water,
are ethyl acetate, acetic acid, petroleum ether, methanol, ethanol and acetone
(Jayaprakasha and others 2003; Baydar and others 2004; Fuleki and others 1997; Ozkan
and others 2004).
10

As research in the food industry focuses on action of the extracted compounds in
food systems, organic solvents are coupled with water. In this process the catechins,
which are lipid soluble are extracted with organic solvents while the aqueous
procyanidins are extracted with water. In 2006, Nawaz and others extracted the
polyphenols with ethanol: water (1:1). This solvent mixture improved the solubility of the
bioactive components in the diluted ethanol. The principle behind the use of solvent
extraction is the preferential action of the solvents as some materials are more soluble in
one than in another. Single, double and triple extractions were carried out in order to
increase the efficiency of extraction and to concentrate the extracts. The optimum
conditions (maximum polyphenols 11.4% of total seed weight) they determined were 0.2
g/mL (solid to liquid ratio), and a double stage extraction with a 0.2 µm pore size.
2.4.2 Modern Technologies
Some modern methodologies are microwave extraction, ultrasonic techniques,
ohmic heating and ultrasonic techniques. Microwave assisted extraction was used to
obtain phenolic alkaloids in a traditional Chinese plant (Lu and others 2008). In
comparison with traditional methods, interaction time was reduced from 2 h to 90 s and
varying the ionic liquid influenced the extracted compounds. Hong and others (2001)
used Microwave Assisted Extraction to obtain phenolics from grape seed. They found no
effect of variation in extraction time (20 - 200 s) and power (150 – 300 W) on yield of
phenolics. However changing the polarity of the solvent increased the total polyphenolics
content. Ultrasonic extraction acoustically breaks down the cell membranes releasing the
intracellular components and thus enhances penetration of solvent into plant materials.
Velickovic and others (2008) used spent sage plant waste (after extraction of essential
11

oils) to obtain possible bioactive compounds using ultrasonic extraction. Extraction using
super critical fluids is another alternative and is used widely at laboratory, pilot plant and
commercial scales. The most commonly used solvent is carbon dioxide as it is non toxic,
environmentally safe, cheap and a selective solvent (Murga and others 2000). Besides
being cheap and non toxic, carbon dioxide is readily available with high purity and has a
low critical temperature. Carbon dioxide is suitable for aqueous extractions and hence
Murga and others (2000) also used co-solvents like ethanol to extract the phenolics from
grape seed. Solubility was higher for gallic acid than for the catechins at 313 K and 20
MPa, and also increased with use of ethanol as co-solvent. Thus, each type of extraction
has its own advantages and disadvantages. Though super critical extraction is a
commonly used modern method, it is not practical to use if the total phenolics are of
interest as this deals with preferential extraction. It can be used for individual compounds
and has the advantage of increasing efficiency of extraction by varying operating
conditions. Though traditional methods pose a time constraint, it may be selected
depending on the need of the process. Extractability of the bio-active components also
depends on the variety of grape on which the extraction is carried out (Shi and others
2005; Baydar and others 2006; Cheynier and others 2006; Gachons and others 2003;
Ozkan and others 2004).
2.5 Microorganisms
2.5.1 Escherichia coli 0157:H7
Characteristics
Escherichia coli 0157:H7 or enterohemorrhagic E. coli is a rod shaped pathogenic
bacterium. It is a gram negative, catalase positive, facultative anaerobe which has been
12
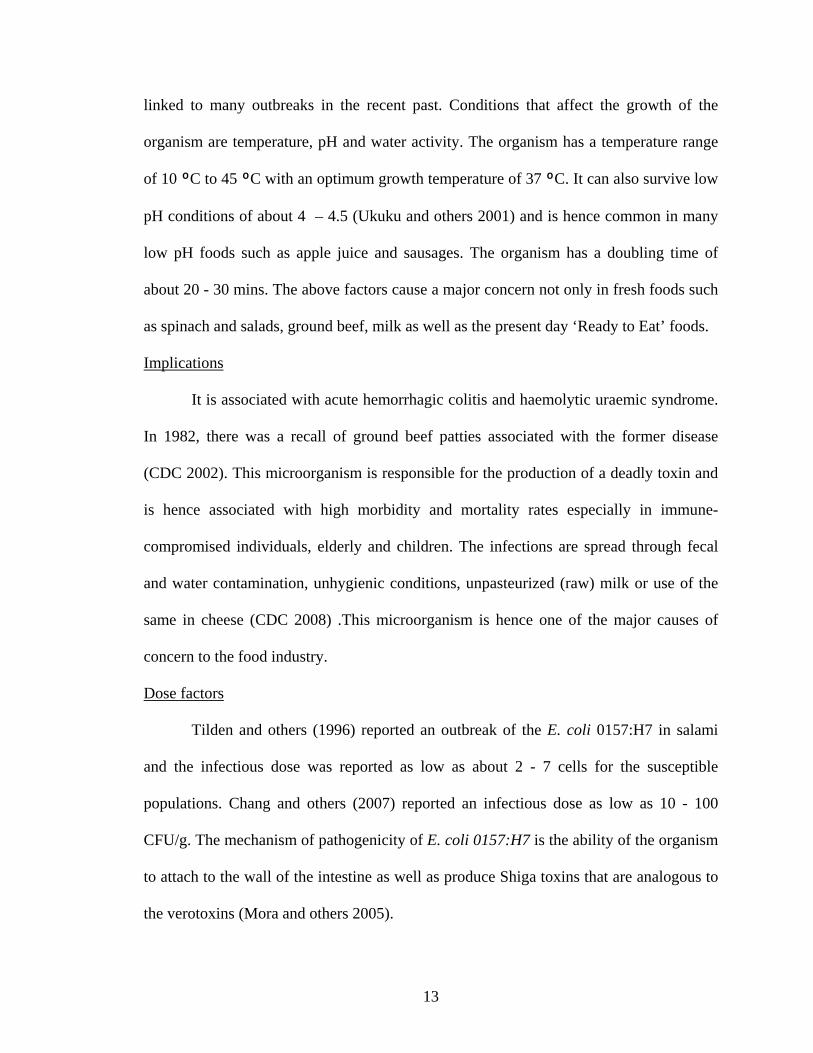
linked to many outbreaks in the recent past. Conditions that affect the growth of the
organism are temperature, pH and water activity. The organism has a temperature range
of 10 ⁰C to 45 ⁰C with an optimum growth temperature of 37 ⁰C. It can also survive low
pH conditions of about 4 – 4.5 (Ukuku and others 2001) and is hence common in many
low pH foods such as apple juice and sausages. The organism has a doubling time of
about 20 - 30 mins. The above factors cause a major concern not only in fresh foods such
as spinach and salads, ground beef, milk as well as the present day ‘Ready to Eat’ foods.
Implications
It is associated with acute hemorrhagic colitis and haemolytic uraemic syndrome.
In 1982, there was a recall of ground beef patties associated with the former disease
(CDC 2002). This microorganism is responsible for the production of a deadly toxin and
is hence associated with high morbidity and mortality rates especially in immune-
compromised individuals, elderly and children. The infections are spread through fecal
and water contamination, unhygienic conditions, unpasteurized (raw) milk or use of the
same in cheese (CDC 2008) .This microorganism is hence one of the major causes of
concern to the food industry.
Dose factors
Tilden and others (1996) reported an outbreak of the E. coli 0157:H7 in salami
and the infectious dose was reported as low as about 2 - 7 cells for the susceptible
populations. Chang and others (2007) reported an infectious dose as low as 10 - 100
CFU/g. The mechanism of pathogenicity of E. coli 0157:H7 is the ability of the organism
to attach to the wall of the intestine as well as produce Shiga toxins that are analogous to
the verotoxins (Mora and others 2005).
13
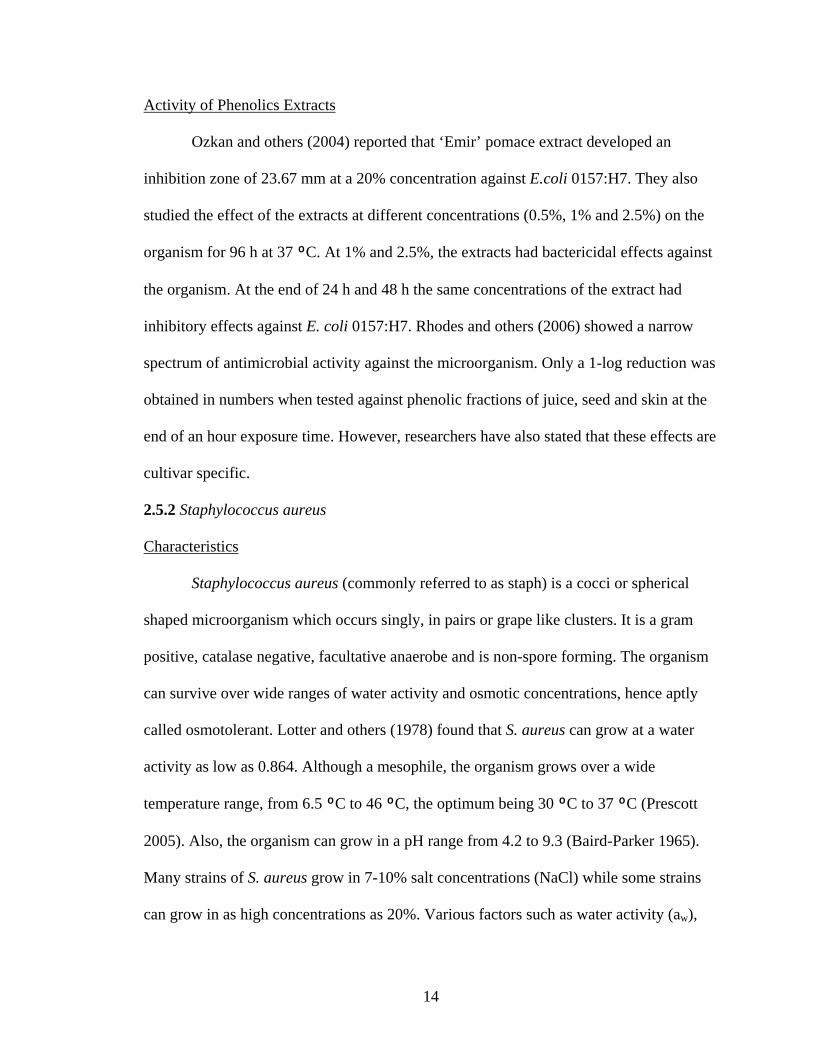
Activity of Phenolics Extracts
Ozkan and others (2004) reported that ‘Emir’ pomace extract developed an
inhibition zone of 23.67 mm at a 20% concentration against E.coli 0157:H7. They also
studied the effect of the extracts at different concentrations (0.5%, 1% and 2.5%) on the
organism for 96 h at 37 ⁰C. At 1% and 2.5%, the extracts had bactericidal effects against
the organism. At the end of 24 h and 48 h the same concentrations of the extract had
inhibitory effects against E. coli 0157:H7. Rhodes and others (2006) showed a narrow
spectrum of antimicrobial activity against the microorganism. Only a 1-log reduction was
obtained in numbers when tested against phenolic fractions of juice, seed and skin at the
end of an hour exposure time. However, researchers have also stated that these effects are
cultivar specific.
2.5.2 Staphylococcus aureus
Characteristics
Staphylococcus aureus (commonly referred to as staph) is a cocci or spherical
shaped microorganism which occurs singly, in pairs or grape like clusters. It is a gram
positive, catalase negative, facultative anaerobe and is non-spore forming. The organism
can survive over wide ranges of water activity and osmotic concentrations, hence aptly
called osmotolerant. Lotter and others (1978) found that S. aureus can grow at a water
activity as low as 0.864. Although a mesophile, the organism grows over a wide
temperature range, from 6.5 ⁰C to 46 ⁰C, the optimum being 30 ⁰C to 37 ⁰C (Prescott
2005). Also, the organism can grow in a pH range from 4.2 to 9.3 (Baird-Parker 1965).
Many strains of S. aureus grow in 7-10% salt concentrations (NaCl) while some strains
can grow in as high concentrations as 20%. Various factors such as water activity (aw),
14
temperature, pH and red-ox potential determine the maximum permissible salt
concentrations (Jay 1992).
Reservoirs
The primary reservoirs of S. aureus are the skin and mucous membranes, in
particular the nasopharyngeal region of birds and mammals (Atanassova and others
2001). The largest numbers of the organism are found near body openings, wherein
numbers per sq. cm may reach 103 – 106 in moist habitats and 10 – 103 in dry habitats
(Jay 1992).
Implications
The mode of action of the organism is through production of enterotoxins and the
enterotoxin producing S. aureus is a major cause of food intoxication. The staphylococcal
enterotoxin is a heat stable protein with a molecular weight of approximately 27-31 kDa.
The effects caused can be minor (pimples, boils or rash) or sometimes severe (pneumonia
or blood infections (Atanassova and others 2001). It is usually spread from person to
person contact through open wounds, nasal discharge or improper hand washing. Thus, it
is not transferred through the food itself but as a mode of post-production contamination
(Rauha and others 2000). In 2005, the Center for Disease Control estimated about 94,000
drug resistant life threatening staph infections and about 19,000 deaths (CDC 2007).
Dose factors
The implicated foods are ham, beef, poultry, warmed over foods, cream filled
pastries and egg products to name a few. Staphylococccal food poisoning is associated
with unhygienic food treatment like improper holding temperatures and is frequently
allied to manually handled foods. The minimum infectious dose of the staph entertoxin
15

16
has been reported by Jay (1992) as 20 ng from an outbreak traced to 2% chocolate milk.
The minimum number of cells of staphylocci to produce enough enterotoxin to cause
food poisoning is 107 (Lotter and Leistner 1978).
Activity of Phenolics
Baydar and others (2006) studied the antibacterial effects of GSE against S.
aureus. Extracts of three different varieties at concentrations (0.5%, 1%, 2.5% and 5%)
showed bactericidal effects against the organism at the end of 48 h interaction period.
Researchers studied the antimicrobial activity of Ribier variety of grape juice, skin and
seed phenolics at a pH of 3.5. At the end of a 60 min exposure period all phenolic
fractions were inhibitory to S. aureus. However, this reduction was small and accounted
for a maximum of one log reduction in cell numbers (Rhodes and others 2006). Baydar
and others (2004) found that GSEs exhibited antibacterial activity against Staphylococcus
aureus COWAN1 at a 20% concentration. They also determined that acetone: water:
acetic acid as a solvent was more effective than its methanol counterpart. These results
are in conformation with other studies (Jayaprakasha and others 2003).
2.6 Mechanism of mode of action of phenolics against the microorganisms
The site and number of hydroxyl groups are related to the level of toxicity and are
directly proportional to each other. Research on this is limited and is contradictory. Some
researchers have described the mechanism of simple phenols such as catechol and
epicatechin to be substrate deprivation and membrane disruption respectively. Other
mechanisms of action noted by the study of phenols in general and subclasses of phenolic
acids, flavonoids and tannins involve enzyme inhibition, enzyme inactivation, formation
of complexes with cell walls and metal ions (Cowan 1999).
CHAPTER III
EXTRACTION OF BIO-ACTIVE COMPONENTS FROM FRUIT AND VEGETABLE PROCESSING WASTES: USING GRAPE WASTE FROM THE WINE PROCESSING INDUSTRY AS A MODEL TO EXTRACT ANTIMICROBIALS Akhila Vasan1, Ioannis Oikonomakos2, William McGlynn2 and Christina Mireles Dewitt1,2
1 Department of Animal Science, Oklahoma State University, Stillwater, OK 2 Robert M. Kerr. Food and Agricultural Product Center, Oklahoma State University, OK
Wastes generated from the fruit and vegetable processing industries cause
significant disposal problems. A simple method to recover bio-active components from the waste would be economically advantageous. Therefore the objective of our research was to evaluate the effectiveness of different extraction methods in recovering antimicrobial components from processing wastes. Grape pomace from the wine making industry was used as a model to evaluate the extraction efficacy.
Grape waste was ground under liquid nitrogen to a uniform particle size (<3.6mm). Influence of process parameters such as solvents utilized (100% petroleum ether, 70% methanol, 50% acetone and 0.01% pectinase), solvent: waste ratio (2:1 or 4:1) and interaction time (1, 2, 4 and 8 h) were studied. Efficacy of the treatment parameters were studied based on antimicrobial testing of the extracts against common Gram negative and Gram positive food borne pathogens: Escherichia coli 0157:H7 and Staphylococcus aureus. Antimicrobial activity was measured based on time taken to increase absorbance of bacterial growth by 0.5U.
Probit models were fit to the increase in absorbance (A620) data and inverse predictions were used to identify time required for a 0.5U increase. The time taken to increase microbial concentrations by 0.5U was about 4.2 h for E.coli (control 3.6 h) and 3.9 h for S.aureus (control 3.3 h) with 50% acetone as a solvent. This is much higher than the time to reach equivalent microbial concentrations for the other solvents. Thus, it appears that this extract contains higher amounts of bioactive components. For both the organisms, significant inhibition (p<0.05) was obtained at lower interaction times and longer extraction times of 8 h were not significant.
In conclusion, results indicated the optimum interaction times and extraction ratios for each solvent in recovering antimicrobial bioactive components from fruit and vegetable processing wastes was effective.
Key words: grape pomace, antimicrobial, extraction
17

INTRODUCTION
The US Council for Agricultural Science and Technology has reported that fruit
and vegetable processing industries produce about 136-410 kg of waste for every ton of
input material. This plant waste material is disposed by burning or used as cattle feed
(Esteban and others 2007). A challenge faced by these industries is to add value to the
waste.
An emerging industry in Oklahoma is the wine making industry. A study
conducted by USDA in 2002 showed that total wine sales in the state of Oklahoma were
approximately 2 million gallons. Also, data from the Oklahoma Grape Growers Survey
(Stafne 2006) illustrates that total acreage is between 232-242 acres. With this growth in
the industry, a cause of concern is the large quantities of by-products produced. By-
products from the wine making industry consist of seeds, stem and skin. It constitutes
about 20% of the weight of processed grapes (Mazza and others 1998) and is produced
from almost every step of the wine making process. Grape seeds are rich sources of
polyphenolic compounds which have antioxidant and antimicrobial properties (Garcia-
Marino and others 2006; Nawaz and others 2006; Postescu and others 2007; Schieber and
others 2001; Shi and others 2005; Baydar and Ozkan 2006; Baydar and others 2007;
Baydar and others 2004). Thus, a solution to the problematic waste production in this
industry can be achieved by extracting the polyphenols from the grape waste.
Extractions of the polyphenols from grapes are carried out both by traditional
methods as well as modern technologies. Traditional methods include solvent extraction
using a variety of organic solvents like hexane (Gómez and others 1996), methanol,
18

acetone and ethyl acetate (Baydar and others 2004; Garcia-Marino and others 2006;
Jayaprakasha and others 2003; Ozkan and others 2004; Pinelo and others 2005). Modern
technologies include microwave extraction(Hong and others 2001), supercritical fluid
extraction (Murga and others 2000) and ultra filtration (Nawaz and others 2006; Shi and
others 2005).
The focus of this project was to develop a screening procedure which can add
economic value to the waste from fruit and vegetable processing industries. Waste from
the wine making industry was used as a model to evaluate extraction procedures for the
screening process. The objectives of the study were hence to evaluate extraction
conditions which can be replicated with ease commercially. Also, different extraction
conditions were evaluated based on their ability to extract antimicrobial compounds from
winery waste. Antimicrobial activity was tested against common food borne pathogens:
Escherichia coli 0157:H7 and Staphylococcus aureus.
19

MATERIALS AND METHODS
Sample Collection
About 800 pounds of grape waste (pomace) were obtained from Summerside Winery,
Vineta, OK. The grapes were of the Cynthiana variety with small berries. This is a red
grape and hence the pomace was obtained after fermentation of the grapes. The pomace
was at the winery for about a week. Upon arrival the pomace was stored overnight at 4-
6⁰C and then vacuum packaged (Multivac C500, Multivac Inc., Kansas City, MO).
Approximately 3 lbs of pomace was placed in each Cryovac vacuum package bag (Type
540, 8x14 cm, Cryovac Division., W.R. Grace and Co., Simpsonville, SC). Pomace was
stored in over 250 bags. Vacuum package bags were initially stored for 3d at 0⁰C and
then transferred to a -20⁰C storage.
Sample Preparation
A total of 32 vacuum bags were randomly selected and allowed to thaw overnight at 0⁰C.
Each bag was then opened; woodchip and stem residues were removed. The contents
were then mixed and a 10 lb sample was obtained for further processing. The pomace
was then transferred to a cold room (4⁰C), half pound batches were taken in a metal
strainer and were frozen rapidly using liquid nitrogen (-196⁰C). The sample was then
immediately ground for 30s bursts in a cold room using a Warring Blender (model
51BL31, Torrington, CT). The blender jar was allowed to equilibrate at -20⁰C prior to
use. The powder obtained was screened for particles less than 3.36 mm using Tyler Sieve
Size 6. This was then stored in large Ziploc bags at -20⁰C until further extraction and
analyses were performed.
20
Bioactive Compound Extraction
Preliminary investigations were conducted to determine optimum solvent: waste ratios.
The following ratios were tested: 1:1, 2:1, 3:1, 4:1 and 5:1. Extraction ratios were
selected based on % recovery of extracts which were optimum at 2:1 and 4:1. Two
process parameters for extraction of bio-active compounds from the powdered pomace
were investigated for solvents differing in degree of hydrophobicity (petroleum ether,
70% methanol, 50% acetone and 0.01% pectinase).
• Solvent: waste ratio 2:1 or 4:1
• Interaction time (h): 1, 2, 4 or 8 h
Extractions were carried out at room temperature. Based on experimental design, 8
possible extraction conditions were evaluated for each of the 4 solvents. All extractions
were performed in triplicate. Extractions were conducted by placing 20 g of ground
pomace in a 250 mL Erlenmeyer flask. An appropriate amount of solvent was added (40
or 80 mL) and the flask was stoppered with a neoprene type plug. The flask was placed in
an incubator shaker (Classic C76, New Brunswick Scientific, Edison, NJ) maintained at
18 ⁰C and 250 rpm for the aforesaid interaction time. The petroleum ether, 50% acetone
and 70% methanol samples were filtered through a Whatman #1 filter paper (55 mm
No1, Whatman Inc. Ltd., Mainstone, England) while 0.01% pectinase extractions were
filtered using Miracloth (Calbiochem, San Diego, USA) . The samples were filtered
under vacuum at a flow rate of 4.5-5 liter/min. Filtrate was transferred to a 100 mL
volumetric flask and brought to volume with the respective solvent except in the case of
petroleum ether. The petroleum ether was first evaporated and the residue was
21
resuspended in 100% acetone. The resuspended residue was then brought to a 100 mL
volume with acetone as stated previously.
Bacterial Cultures
Bacterial cultures namely Escherichia coli 0157:H7 ATCC 35150 and Staphylococcus
aureus ATCC 13565 were obtained from the stock culture collection of Food
Microbiology, Robert. M. Kerr Food and Agricultural Products Center, Oklahoma State
University. The cultures of both the strains were maintained by subculturing in Tryptic
Soy Broth (BD, Sparks, MD) using 1% innocula and 18-20 h of incubation at 37 ⁰C.
They were stored at 4 - 6⁰C between transfers. Also, each culture was subcultured at
least three times prior to experimental use.
Antimicrobial Activity
The extracts were compared for their ability to inhibit the growth of E.coli ATCC 35150
and S.aureus ATCC 13565. The treatments were randomly distributed and 4 treatments
per extraction (set) were tested for antimicrobial activity at a given time. All extracts
(0.5mL) except for 0.01% pectinase were evaporated using a heating block (set at room
temperature) under the influence of nitrogen gas for 30-40 min. To all the test tubes
(including pectinase) 0.5 mL of water was added in order to suspend the extracts. The
volume was brought up to a total of 5 mL with Tryptic Soy Broth. The effects of the
extracts were evaluated by inoculating the treatments at 1% with the culture. The control
for each set of test tubes was 0.5 mL of water brought up to 5 mL with TSB and
inoculated at 1% with the culture. The test tubes were incubated at 37 ⁰C. Growth was
monitored by measuring the A620 every hour for 6 h. Growth curves were constructed by
plotting increases in absorbance (increase in absorbance from 0 h readings) versus
22
incubation time. Growth curves of the action of the extracts against the bacteria are
shown in the appendices. The number of hours required to increase the absorbance by 0.5
U in each sample was used to compare the activity of the microorganisms. Probit analysis
was conducted and the time taken to reach an absorbance of 0.5 U was obtained by
inverse predictions. Analysis of each of the extractions was carried out in duplicate and
against E.coli 0157:H7 and S. aureus. The above mentioned method is a modification
from a previous study by Gilliland and others (1985). Gilliland and others (1985)
compared bile tolerance of cultures of L. acidophilus isolated from fecal samples of pigs
using time taken to increase the turbidity by 0.3 U. Their analysis in this case was carried
out using least significance difference mean separation techniques.
Statistical Analysis
Probit models were fit to the increased absorbance data for each sample and each solvent.
Estimates of time resulting in a 0.5 increase in absorbance units were obtained using
inverse prediction models. Probit analyses for all solvents indicated 0.50 increases in
absorbance units occurred between 3 and 4 h. In order to reduce the number of treatment
(sample) comparisons within solvent, comparisons were also made at these 3 and 4 h
times using analyses of covariance (ANCOVA) where baselines (h=0, Sample – control)
and GLMM (Generalized Linear Mixed Model) with random effects of trial and set.
Hourly measurements were analyzed using repeated measures methods for modeling
covariance. In the case of Escherichia coli 0157:H7, responses were modeled by a beta
distribution, and the repeated measures were modeled using a heterogeneous covariance
structure (early measurements were less variable than the latter: 5 h and 6 h
measurements). In the case of Staphylococcus aureus, responses followed a gamma
23

distribution, and the repeated measures were modeled using a first order autoregressive
heterogeneous covariance structure. Each sample and hour combination means was
adjusted for the covariate and pair wise sample comparisons were made at 3 and 4 h for
each solvent. Statistical Analysis was performed using SAS 9.2 (Cary, NC) version 9.2.
24

RESULTS
Screening procedures were examined to obtain bio-active components from grape
pomace. The extracts (treatments) were analyzed for their ability to inhibit food pathogen
growth in Tryptic Soy Broth. Growth of pathogens was monitored by measuring hourly
absorbance at 620 nm. The absorbance prediction at 0.5 U generally occurred at the mid
range for log growth of bacteria (see Appendices). Inhibition at this absorbance level took
place between the 3 h and 4 h period, and hence, closer examination of the action of the
solvents at each of these times is also explained. Petroleum ether and 70% methanol were
evaluated at a baseline value of 0.02 while 50% acetone and 0.01% pectinase were
evaluated at a baseline value of 0.01. These baseline values were representative of the
range of 0 h responses for each solvent.
Petroleum Ether
a. Measurement of Bioactive compounds effective against Gram negative pathogens
using Escherichia coli 0157:H7 as a model
When looking at the action of petroleum ether using time to inhibition at 0.5 U (Fig.
3a), all the extracts were successful in inhibiting E. coli except the 4 h 4:1 and 8 h 2:1
extracts. The most effective extracts (those that show higher action of bioactive
components) were 2 h 2:1 and 8 h 2:1. Further comparison at 3 h of growth (Table 2)
shows that, only the 1 h 2:1 extract was significantly different (p<0.05) from the control
for this pathogen. The comparison of the antimicrobial activity of extracts by measuring
microbial concentration after 3 h does not correlate well with conclusions from the time
required to increase microbial concentration by 0.5 absorbance units. This suggests that
25

growth at 3 h is not a good predictor for recovery of antimicrobial compounds from the
extracts. However, evaluation of the extracts at 4 h of growth (Table 3) indicates that the
only effective extract was 2 h 2:1 (p<0.05). Based on the above evaluation for petroleum
ether, the 4 h growth rate predicts that the 2 h 2:1 extract is the most effective against E.
coli, which is in agreement with the data evaluated at 0.5U.
b. Measurement of Bioactive compounds effective against Gram positive pathogens
using Staphylococcus aureus as a model
The 2 h 4:1, 4 h (2:1 and 4:1) and 8 h 2:1(Fig. 4a) extracts contained bioactive
components in sufficient quantities to be effective against S. aureus. These correlate well
with our findings at 3 h of growth (Table 4) wherein the 4 h (2:1 and 4:1) and 8 h 2:1
extracts are statistically significant (p<0.05) from the control. Evaluation of the extracts
at 4 h of growth (Table 5) shows that 2 h 4:1, 4 h 4:1 and 8 h 2:1 are statistically different
from the control. The 8 h 2:1 extract was most effective in recovering bioactive
components effective against S. aureus. Based on these evaluations, the least time
consuming extraction condition for recovery of bioactive compounds that are effective
against S. aureus using petroleum ether as the extracting solvent is the 2 h 4:1 extract. If
time was not a significant factor in cost, the 8 h 2:1 extract would be the most
economical.
It appears that the extracts which were most effective in case of E. coli were least
effective in case of S. aureus. Longer interaction times were necessary to extract
sufficient antimicrobial compounds for significant inhibition of S. aureus as compared to
E. coli 0157:H7. The recommended extracts for E.coli 0157:H7 and S. aureus are 2 h 2:1
and 2 h 4:1 respectively. Researchers have used petroleum ether as a solvent for removal
26

of fatty materials in a Soxhlet Extractor as a preliminary stage for further extractions
(Baydar and others 2004; Jayaprakasha and others 2003) and not as an extraction solvent
itself. This is one of the first approaches towards using petroleum ether as a solvent to
extract antimicrobial compounds.
70% Methanol
a. Measurement of Bioactive compounds effective against Gram negative pathogens
using Escherichia coli 0157:H7 as a model
Based on the time taken to increase microbial concentrations by 0.5 absorbance units
(Fig. 3b), all the extracts except 1 h 2:1 and 4 h 4:1 appeared to contain bioactive
components in sufficient quantities to inhibit E. coli 0157:H7. However, measurement of
growth of E. coli 0157:H7 at 3 h of growth (Table 2) indicated that only the 4 h 4:1
extract was significantly different from the control (p<0.05). This was not a good
correlation with the findings based on time taken to increase microbial concentrations by
0.5 U. Evaluation of the extracts at microbial growth level of 4 h (Table 3) indicated that
2 h (2:1 and 4:1), 4 h 2:1 and 8 h 4:1 are statistically significant (p<0.05) from the
control. The 4 h growth level results agreed more with the observations at 0.5 U than
those at 3h. Based on absorbance at 0.5U and the 4 h growth levels, the 2 h 2:1 extract
appears to be the most effective against E. coli 0157:H7 with 70% methanol as the
solvent.
b. Measurement of Bioactive compounds effective against Gram positive pathogens
using Staphylococcus aureus as a model
The time taken to increase microbial concentrations by 0.5 absorbance units (Fig. 4b)
shows that all the extracts contained bioactive components in sufficient quantities to
27

inhibit the Gram positive pathogen, S. aureus. The time taken to increase absorbance by
0.5U was 3.3 h for the control and ranged from 3.53 – 3.75 h for the extracts. Thus, some
extracts showed higher antimicrobial activity as compared to the others. Further
comparison at 3 h of growth (Table 4) shows that all the extracts except the 2 h 4:1 and
8 h 2:1 are statistically significant from the control (p<0.05). However, the screening
method which was most effective is the 1 h 4:1 extract. Evaluation of extracts at 4 h of
growth (Table 5) also indicated that all extracts contain bioactive components in
sufficient quantities to inhibit S. aureus. These results correlate with our findings at 3 h of
growth as well as with the time taken to obtain an increase of 0.5 absorbance units.
In conclusion, our findings for 70% methanol shows that a 1 h 4:1 extract was
sufficient to achieve statistically significant inhibition for the S. aureus pathogen while 2
h 2:1 extract was suitable for the E. coli pathogen. Jayaprakasha and others (2003)
studied the effect of grape seed extracts by a methanol: water: acetic acid assay and found
that both these bacteria were inhibited by the extracts. Similar findings were also reported
by other researchers indicating that methanol extracts from grape seeds are potent
antimicrobial agents (Shoko 1999; Baydar and others 2004).
50% Acetone
a. Measurement of Bioactive compounds effective against Gram negative pathogens
using Escherichia coli 0157:H7 as a model
As shown in Fig. 3c, 4 h (2:1 and 4:1) extracts and 8 h 4:1 were most effective in
inhibiting microbial growth. Further examination at 3 h of growth (Table 2)
demonstrated that the 1 h 2:1, 2 h 4:1, 4 h 4:1 and 8 h 4:1 were significantly different
from the control. Though the 8 h 4:1 extract had the most inhibition numerically, it was
28
not statistically significant (p>0.05) from the 1 h 2:1 extract. At 3 h of growth, results
indicated that lower interaction times and ratios were sufficient to achieve inhibition of E.
coli 0157:H7. At 4 h of microbial growth (Table 3), all the extracts except the 2 h 2:1
extract were significantly different from the control at a 95% confidence level. However,
the extracts were not statistically significant from each other (p>0.05). The most
economical extract should be the 1 h 2:1 extract based on growth levels at 3 h and 4 h,
and absorbance at 0.5U because of lower interaction time and solvent utilizations.
b. Measurement of Bioactive compounds effective against Gram positive pathogens
using Staphylococcus aureus as a model
Based on the time taken to reach microbial concentration of 0.5 absorbance units
(Fig. 4c), all the extracts contained antimicrobial bioactive compounds. Further
comparison at 3 h of growth (Table 4) demonstrates that all the extracts except the 2 h
2:1(p>0.05) extract show significant antimicrobial activity. Though the 4 h 4:1 extract
showed the most inhibition at 3 h of growth, it is not statistically significant from the 1 h
4:1 extract. Effects of the extracts at higher interaction times were not statistically
different from those at lower extraction times (p>0.05). At 4 h of microbial growth
(Table 5), all the extracts are statistically significant from the control. Also, evaluation of
extracts at both 3 h and 4 h of growth correlates well with the conclusions from time
taken to increase absorbance by 0.5 U. Based on the above results, it appears that the
best extraction condition for the recovery of bioactive components with antimicrobial
activity is that chosen on economical factors, namely 1 h 2:1.
In conclusion, our findings show that the extracts contain bioactive components in
sufficient quantities to effectively inhibit E. coli 0157:H7 and S. aureus using 50%
29

acetone as a solvent. However, the most economical extracts would be those with lower
interaction times and solvent utilizations. Hence, the1 h 2:1 extract appears to be the most
suitable. Jayaprakasha and others (2003), Baydar and others (2004, 2006), Ozkan G and
others (2004) have shown inhibitory effect of grape seed extract against E. coli 0157:H7
and S. aureus by using acetone: water: acetic acid (90: 9.5: 0.5) as an extraction solvent.
0.01% Pectinase
a. Measurement of Bioactive compounds effective against Gram negative pathogens
using Escherichia coli 0157:H7 as a model
From Fig. 3d, it is observed that E.coli 0157:H7 was inhibited by all the extracts
except 1 h 2:1 and 8 h 4:1 extracts. Further comparison of microbial growth at 3 h(Table
2) shows that inhibition of the organism by the aqueous extracts was significant (p<0.05)
at 1 h 2:1 and 8 h 4:1. The comparison of the antimicrobial activity of the extracts by
measuring microbial concentrations after 3 h of growth does not correlate well with the
deductions from time taken to increased absorbance of microbial concentrations by 0.5 U.
Hence, measuring growth rate after 3 h does not appear to be a good indicator for this
extraction condition. At 4 h of growth (Table 3), all the extracts contained bioactive
components in sufficient quantities to inhibit the growth of the organism. However,
except for 8 h 4:1, they were not significantly different from each other (p>0.05). Thus,
based on economical factors, it appears that the most suitable screening procedure is at 1
h 4:1.
b. Measurement of Bioactive compounds effective against E. coli pathogens using
Staphylococcus aureus as a model
30
Estimation of bioactivity of the extracts based on antimicrobial studies against S.
aureus shows that all the extracts have inhibitory action against the pathogen. Those with
higher antimicrobial activity (longer time to reach an absorbance of 0.5 U) are 1 h 4:1
and 2 h 2:1 (Fig. 4d). Further examination at a microbial growth level at 3 h (Table 4)
indicates that all the extracts are significantly different from the control except the 1 h 2:1
and 4 h 2:1 extracts. The 1 h 4:1 extract exhibits the most inhibition numerically and is
statistically significant (p<0.05) from the remaining treatments. At a 4 h growth level
(Table 5) for the pathogen, all the extracts are significantly different (p<0.05) from the
control except the 1 h 2:1 and 4 h 2:1 extracts (p>0.05). Numerically, though the 2 h 2:1
extract shows the most inhibition, it is not significant (p>0.05) from the remaining
extracts (including the 1 h 4:1 extract). The results based on microbial concentrations at
0.5 U and also on observations at 3 h and 4 h of microbial growth indicate that the 1 h 4:1
extract is the most suitable.
In conclusion, our findings reveal that 1 h 4:1 extract contains bioactive components
in sufficient quantities to be effective against both the pathogens, E. coli 0157:H7 and S.
aureus. Studies measuring antibacterial activity on grape pomace by using aqueous
solvents are limited.
31

DISCUSSION
From the above data it can be concluded that all the extracts contain bioactive
components. However, extracts that illustrated antimicrobial activity, contained active
compounds in sufficient quantities to inhibit the pathogens. The extent of antimicrobial
activity exhibited by the extracts was different. This implies that the extracts contain
varying quantities of bioactive compounds. These bioactive compounds have been
quantified and characterized as phenolic compounds and their derivatives by some
researchers (Ozkan and others 2004; Pinelo and others 2005; Schieber and others 2001).
Shoko and others (1999) also suggested that food borne pathogens can be inhibited by
phenolic compounds like gallic acid.
Of the four solvents evaluated, it appears that 50% acetone contains higher
amounts of bioactive components. This was evident in the ability of the extract to inhibit
the pathogens to a greater extent. The time taken to increase microbial concentrations by
0.5 absorbance units was well beyond 4.2 h for E.coli (Fig. 3c) and 3.9h for S. aureus
(Fig. 4c). These are much higher than the times of inhibition for the other solvents.
Researchers have reported that acetone: water: acetic acid extracts inhibit bacteria at
lower concentrations than methanol: water: acetic acid extracts (Baydar and others 2004;
Jayaprakasha and others 2003). Jayaprakasha and others (2003) also have confirmed that
the acetone extracts selectively extract more phenolics than the methanol extracts. Higher
activity of 50% acetone can be explained on the basis of its ability to extract both the
lipid soluble as well as aqueous components of the pomace.
32

The amount of solvent used also played a role in the extraction process. The
principle of mass transfer in this case is the concentration gradient between the two
phases, waste and solvent. Thus, higher amounts of solvent equate to greater extraction
yields. But, the drawback would be that the extract is diluted. Based on our findings,
greater inhibition of bacteria generally occurs at lower solvent: solid ratios. This is
understandable, as lesser the amount of solvent used, more concentrated is the extract and
hence a higher antimicrobial activity is demonstrated. From the standpoint of the
processor, economical factors play an important role in selection of extraction solvents. It
is the prerogative of the processor to choose between organic and aqueous solvents. Both
aqueous as well as organic solvents contain bioactive components and show
antimicrobial activity against food borne pathogens but at different levels.
Among petroleum ether, 70% methanol, 50% acetone and 0.01% pectinase
extracts tested against Staphylococcus aureus, it appears that shorter interaction times
were sufficient to achieve inhibition in all cases except petroleum ether. This may imply
that the components leading to inhibition of the pathogen are more extractable under
partial or complete aqueous conditions. For both the organisms, significant inhibition was
achieved at lower interaction times and hence it appears that longer interaction times (8
h) are not significant. In case of Escherichia coli 0157:H7, significant inhibition was
achieved within the 1 h and 2 h extraction times for all the solvents. It was found that
extraction times of 4 h and 8 h had no significant effect on inhibition (p>0.05) of E.coli
0157:H7.
Overall, all the extracts showed greater inhibition against E. coli 0157:H7 than
against S. aureus (Fig. 3 and Fig. 4). On the contrary, Jayaprakasha and others (2003)
33
34
and Baydar and others (2004) showed that Gram positive bacteria are inhibited more than
the Gram negative bacteria. Possible differences could be that the base substrate used in
their study was grape seeds while we incorporated the skin, seeds and stems. Also, the
method of extraction plays an important role in the mass transfer during extraction.
Grape cultivars vary by region of growth and climatic conditions. These factors may be
responsible for the quantities of individual bioactive components of the extracts. Studies
on antimicrobial activities against extracts obtained from grape pomace are limited and
comparisons are therefore made with grape seed extracts. Lack of a standardized method
of extraction of bioactive components from grape seed extract leads to variations in
extraction procedures from lab to lab (Veluri and others 2006). This explains the
variation observed in the action of bioactive properties from varying systems.
CHAPTER IV
CONCLUSION
In conclusion, value of bioactive compounds in grape pomace can be extracted
due to its potent antimicrobial properties. These compounds have potential applications in
the food industry to enhance the safety of the foods. Both Escherichia coli 0157:H7 and
Staphylococcus aureus were inhibited by the grape pomace. This study was conducted on
a lab scale and can be considered as a preliminary step for further scale up of the process.
For commercial production of extracts from grape byproducts, it is vital to determine
optimum extraction conditions that produce economical bioactive components. Thus,
grape pomace extracts possess bioactive components that exhibit antimicrobial properties
against food borne pathogens Escherichia coli 0157:H7 and Staphylococcus aureus.
Further research needs to be conducted to characterize and identify the components of the
extracts obtained.
35

Figure 1: Structure of some basic phenolics (Goldberg 2003)
36
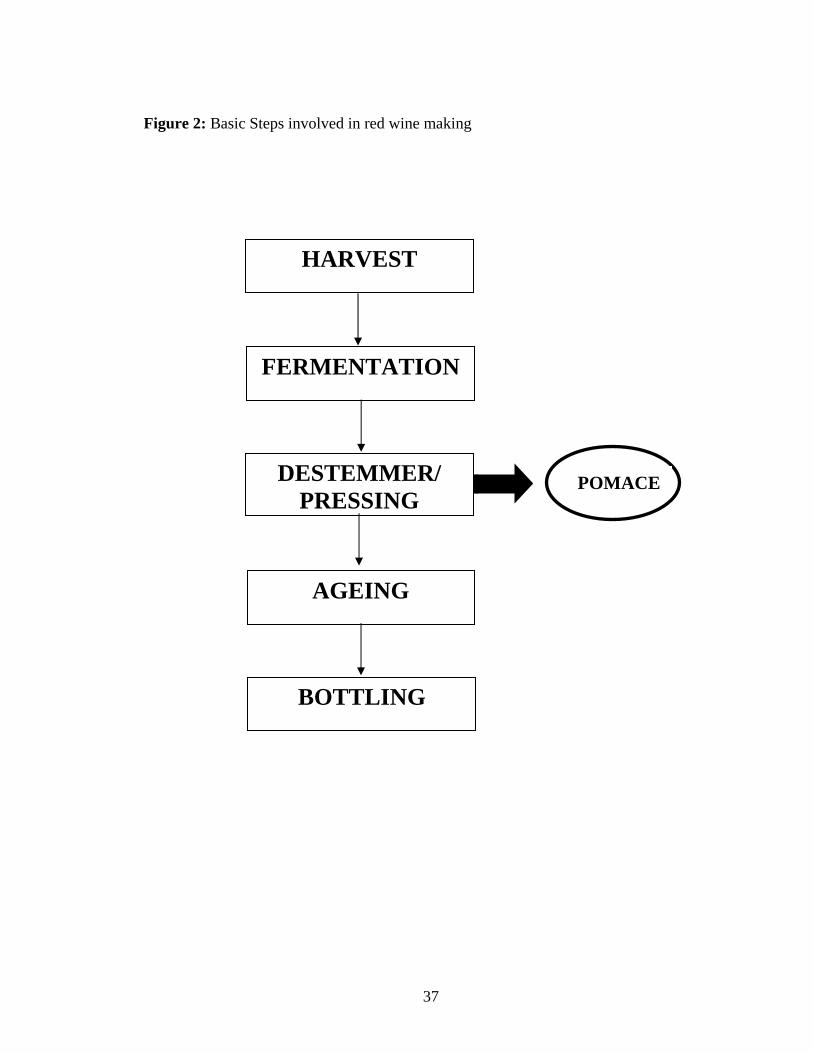
Figure 2: Basic Steps involved in red wine making
FERMENTATION
DESTEMMER/ PRESSING
HARVEST
POMACE
BOTTLING
AGEING
37

Figure 3: Action of petroleum ether, 50% acetone, 70% methanol and 0.01% pectinase extracts against Escherichia coli 0157:H7
ca
db
Each treatment is representative of values from 3 replicates analyzed in duplicate.
38

Fig 4: Action of petroleum ether, 50% acetone, 70% methanol and 0.01% pectinase extracts against Staphylococcus aureus.
Each treatment is representative of values from 3 replicates analyzed in duplicate.
a c
b d
39

Table 1: Approximate acreage, percentage, and number of vines breakdown of wine grape types in Oklahoma (Stafne 2006)
Grape Color
Color Acres % # of vines
Red 137.5 59.2 85101
White 94.8 40.8 57201
Grape Type
American 17.7 7.3 9661
Hybrid 34.5 14.3 19793
Vinifera 188.8 78 117971
Muscadine 1 0.4 242
40
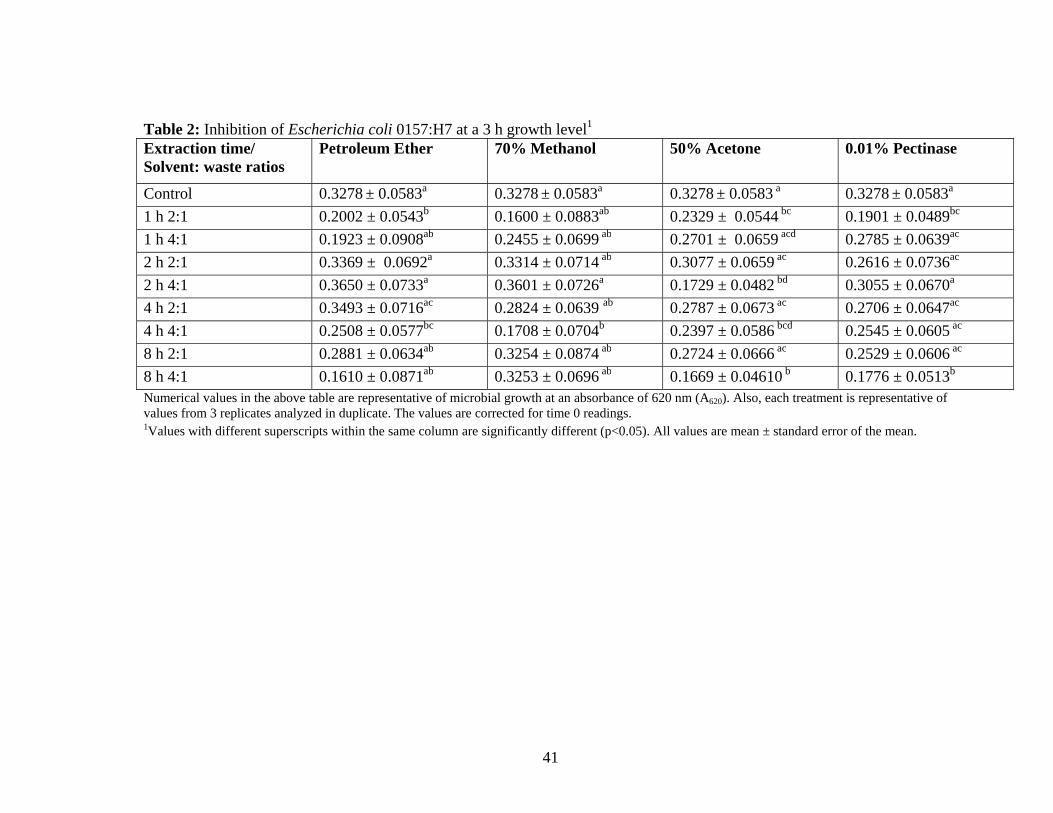
Table 2: Inhibition of Escherichia coli 0157:H7 at a 3 h growth level1 Extraction time/ Solvent: waste ratios
Petroleum Ether 70% Methanol 50% Acetone 0.01% Pectinase
Control 0.3278 ± 0.0583a 0.3278 ± 0.0583a 0.3278 ± 0.0583 a 0.3278 ± 0.0583a
1 h 2:1 0.2002 ± 0.0543b 0.1600 ± 0.0883ab 0.2329 ± 0.0544 bc 0.1901 ± 0.0489bc
1 h 4:1 0.1923 ± 0.0908ab 0.2455 ± 0.0699 ab 0.2701 ± 0.0659 acd 0.2785 ± 0.0639ac
2 h 2:1 0.3369 ± 0.0692a 0.3314 ± 0.0714 ab 0.3077 ± 0.0659 ac 0.2616 ± 0.0736ac
2 h 4:1 0.3650 ± 0.0733a 0.3601 ± 0.0726a 0.1729 ± 0.0482 bd 0.3055 ± 0.0670a
4 h 2:1 0.3493 ± 0.0716ac 0.2824 ± 0.0639 ab 0.2787 ± 0.0673 ac 0.2706 ± 0.0647ac
4 h 4:1 0.2508 ± 0.0577bc 0.1708 ± 0.0704b 0.2397 ± 0.0586 bcd 0.2545 ± 0.0605 ac 8 h 2:1 0.2881 ± 0.0634ab 0.3254 ± 0.0874 ab
0.2724 ± 0.0666 ac 0.2529 ± 0.0606 ac 8 h 4:1 0.1610 ± 0.0871ab 0.3253 ± 0.0696 ab 0.1669 ± 0.04610 b 0.1776 ± 0.0513b Numerical values in the above table are representative of microbial growth at an absorbance of 620 nm (A620). Also, each treatment is representative of values from 3 replicates analyzed in duplicate. The values are corrected for time 0 readings. 1Values with different superscripts within the same column are significantly different (p<0.05). All values are mean ± standard error of the mean.
41
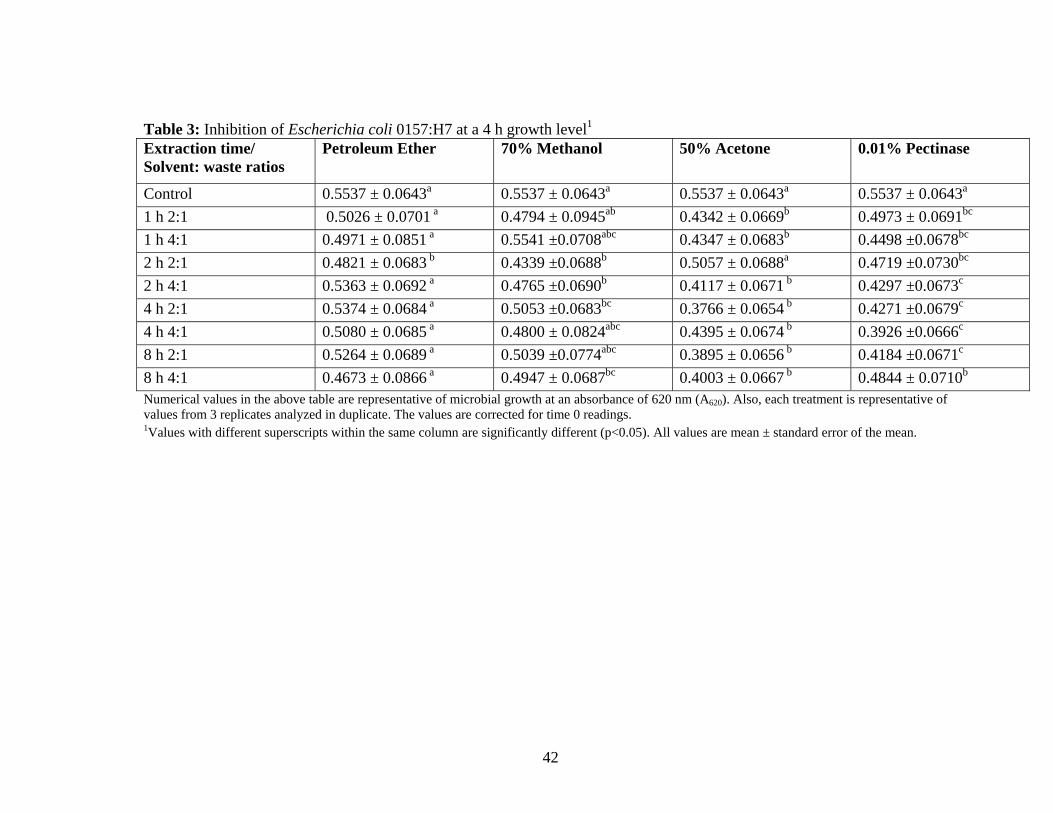
Table 3: Inhibition of Escherichia coli 0157:H7 at a 4 h growth level1
Numerical values in the above table are representative of microbial growth at an absorbance of 620 nm (A620). Also, each treatment is representative of values from 3 replicates analyzed in duplicate. The values are corrected for time 0 readings.
Extraction time/ Solvent: waste ratios
Petroleum Ether 70% Methanol 50% Acetone 0.01% Pectinase
Control 0.5537 ± 0.0643a 0.5537 ± 0.0643a 0.5537 ± 0.0643a 0.5537 ± 0.0643a
1 h 2:1 0.5026 ± 0.0701 a 0.4794 ± 0.0945ab 0.4342 ± 0.0669b 0.4973 ± 0.0691bc
1 h 4:1 0.4971 ± 0.0851 a 0.5541 ±0.0708abc 0.4347 ± 0.0683b 0.4498 ±0.0678bc
2 h 2:1 0.4821 ± 0.0683 b 0.4339 ±0.0688b 0.5057 ± 0.0688a 0.4719 ±0.0730bc
2 h 4:1 0.5363 ± 0.0692 a 0.4765 ±0.0690b 0.4117 ± 0.0671 b 0.4297 ±0.0673c
4 h 2:1 0.5374 ± 0.0684 a 0.5053 ±0.0683bc 0.3766 ± 0.0654 b 0.4271 ±0.0679c
4 h 4:1 0.5080 ± 0.0685 a 0.4800 ± 0.0824abc 0.4395 ± 0.0674 b 0.3926 ±0.0666c
8 h 2:1 0.5264 ± 0.0689 a 0.5039 ±0.0774abc 0.3895 ± 0.0656 b 0.4184 ±0.0671c
8 h 4:1 0.4673 ± 0.0866 a 0.4947 ± 0.0687bc 0.4003 ± 0.0667 b 0.4844 ± 0.0710b
1Values with different superscripts within the same column are significantly different (p<0.05). All values are mean ± standard error of the mean.
42
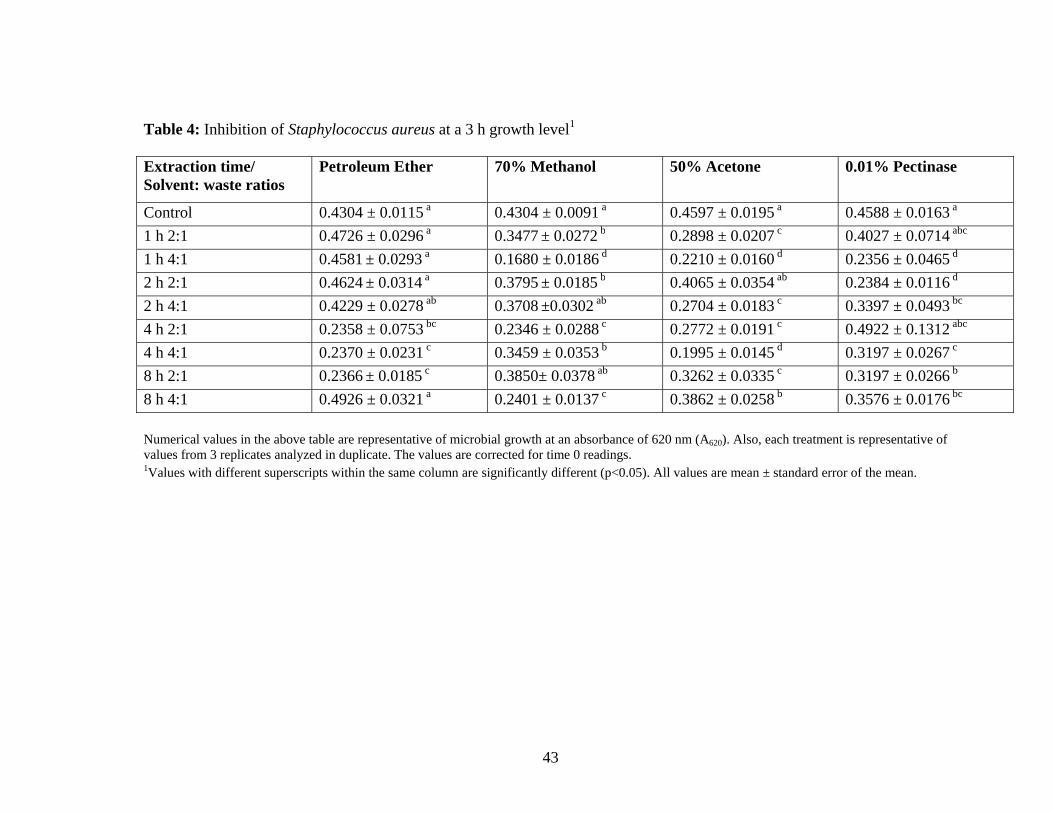
Table 4: Inhibition of Staphylococcus aureus at a 3 h growth level1
Extraction time/ Solvent: waste ratios
Petroleum Ether 70% Methanol 50% Acetone 0.01% Pectinase
Control 0.4304 ± 0.0115 a 0.4304 ± 0.0091 a 0.4597 ± 0.0195 a 0.4588 ± 0.0163 a 1 h 2:1 0.4726 ± 0.0296 a 0.3477 ± 0.0272 b 0.2898 ± 0.0207 c 0.4027 ± 0.0714 abc 1 h 4:1 0.4581 ± 0.0293 a 0.1680 ± 0.0186 d 0.2210 ± 0.0160 d 0.2356 ± 0.0465 d 2 h 2:1 0.4624 ± 0.0314 a 0.3795 ± 0.0185 b 0.4065 ± 0.0354 ab 0.2384 ± 0.0116 d 2 h 4:1 0.4229 ± 0.0278 ab 0.3708 ±0.0302 ab 0.2704 ± 0.0183 c 0.3397 ± 0.0493 bc 4 h 2:1 0.2358 ± 0.0753 bc 0.2346 ± 0.0288 c 0.2772 ± 0.0191 c 0.4922 ± 0.1312 abc 4 h 4:1 0.2370 ± 0.0231 c 0.3459 ± 0.0353 b 0.1995 ± 0.0145 d 0.3197 ± 0.0267 c 8 h 2:1 0.2366 ± 0.0185 c 0.3850± 0.0378 ab 0.3262 ± 0.0335 c 0.3197 ± 0.0266 b 8 h 4:1 0.4926 ± 0.0321 a 0.2401 ± 0.0137 c 0.3862 ± 0.0258 b 0.3576 ± 0.0176 bc
Numerical values in the above table are representative of microbial growth at an absorbance of 620 nm (A620). Also, each treatment is representative of values from 3 replicates analyzed in duplicate. The values are corrected for time 0 readings. 1Values with different superscripts within the same column are significantly different (p<0.05). All values are mean ± standard error of the mean.
43
Numerical values in the above table are representative of microbial growth at an absorbance of 620 nm (A620). Also, each treatment is representative of values from 3 replicates analyzed in duplicate. The values are corrected for time 0 readings.
44
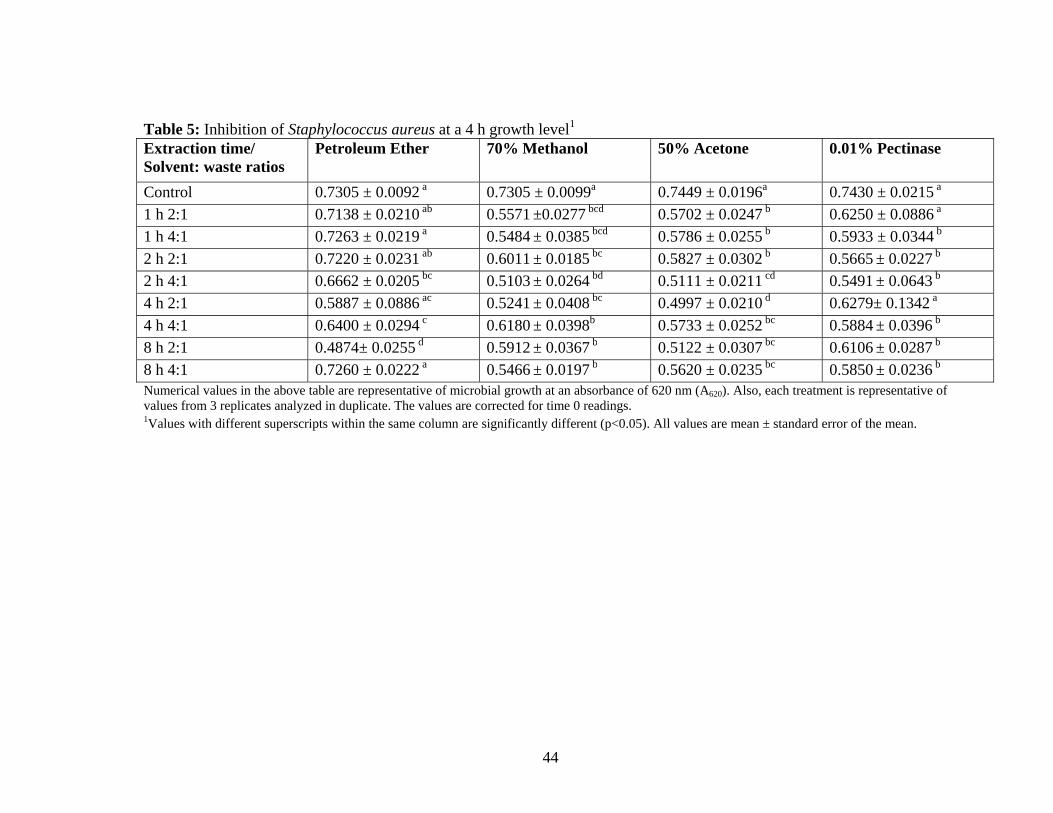
Table 5: Inhibition of Staphylococcus aureus at a 4 h growth level1
Extraction time/ Solvent: waste ratios
Petroleum Ether 70% Methanol 50% Acetone 0.01% Pectinase
Control 0.7305 ± 0.0092 a 0.7305 ± 0.0099a 0.7449 ± 0.0196a 0.7430 ± 0.0215 a 1 h 2:1 0.7138 ± 0.0210 ab 0.5571 ±0.0277 bcd 0.5702 ± 0.0247 b 0.6250 ± 0.0886 a 1 h 4:1 0.7263 ± 0.0219 a 0.5484 ± 0.0385 bcd 0.5786 ± 0.0255 b 0.5933 ± 0.0344 b 2 h 2:1 0.7220 ± 0.0231 ab 0.6011 ± 0.0185 bc 0.5827 ± 0.0302 b 0.5665 ± 0.0227 b 2 h 4:1 0.6662 ± 0.0205 bc 0.5103 ± 0.0264 bd 0.5111 ± 0.0211 cd 0.5491 ± 0.0643 b 4 h 2:1 0.5887 ± 0.0886 ac 0.5241 ± 0.0408 bc 0.4997 ± 0.0210 d 0.6279± 0.1342 a 4 h 4:1 0.6400 ± 0.0294 c 0.6180 ± 0.0398b 0.5733 ± 0.0252 bc 0.5884 ± 0.0396 b 8 h 2:1 0.4874± 0.0255 d 0.5912 ± 0.0367 b 0.5122 ± 0.0307 bc 0.6106 ± 0.0287 b 8 h 4:1 0.7260 ± 0.0222 a 0.5466 ± 0.0197 b 0.5620 ± 0.0235 bc 0.5850 ± 0.0236 b
1Values with different superscripts within the same column are significantly different (p<0.05). All values are mean ± standard error of the mean.

REFERENCES
1. Andres-Lacueva C, Monagas M, Khan N, Izquierdo-Pulido M, Urpi-Sarda M,
Permanyer J, Lamuela-Raventos RM. 2008. Flavanol and flavonol contents of
cocoa powder products: Influence of the manufacturing process. J Agr Food
Chem 56(9):3111-17.
2. Applequist WL, Johnson H, Rottinghaus G. 2008. (+)-catechin, (-)-epicatechin,
and gallic acid content of seeds of hybrid grapes hardy in Missouri. Am J Enol
Viticult 59(1):98-102.
3. Atanassova V, Meindl, A Ring C. 2001. Prevalence of Staphylococcus aureus and
staphylococcal enterotoxins in raw pork and uncooked smoked ham - a
comparison of classical culturing detection and RFLP-PCR. Int J Food Microbiol
68(1-2):105-13.
4. Baird-Parker AC. 1965. The Classification of Staphylococci and Micrococci from
World-wide sources. J Gen Microbiol 38:363-87.
5. Baydar NG, Ozkan G. 2006. Tocopherol contents of some Turkish wine by-
products. Eur Food Res Technol 223(2):290-93.
6. Baydar NG,Ozkan G, Cetin ES. 2007. Characterization of grape seed and pomace
oil extracts. Grasas Y Aceites 58(1):29-33.
7. Baydar NG, Ozkan G, Sagdic O. 2004. Total phenolic contents and antibacterial
activities of grape (Vitis vinifera L.) extracts. Food Cont 15(5):335-39.
45

8. Baydar NG, Sagdic O, Ozkan, G Cetin S. 2006. Determination of antibacterial
effects and total phenolic contents of grape (Vitis vinifera L.) seed extracts. Int J
Food Sci Tech 41(7):799-804.
9. [CDC] Center for Disease Control. 2002. Multistate Outbreak of Escherichia coli
0157:H7 Infections Associated with Eating Ground Beef. Atlanta: Center for
Disease Control. Available from: www.cdc.gov. Accessed April 29, 2009.
10. [CDC] Center for Disease Control. 2007. CDC estimates 94000 invasive drug
resistant staph infections occurred in the U.S in 2005. Atlanta: Center for Disease
Control. Available from: www.cdc.gov. Accessed April 29, 2009.
11. [CDC] Center for Disease Control. 2008. Escherichia coli 0157:H7 Infections in
Children Associated with Raw Milk and Raw Colostrum From Cows. Atlanta:
Center for Disease Control. Available from: www.cdc.gov. Accessed April 29,
2009.
12. Chang JM, Fang TJ. 2007. Survival of Escherichia coli O157: H7 and Salmonella
enterica serovars Typhimurium in iceberg lettuce and the antimicrobial effect of
rice vinegar against E.coli O157 : H7. Food Microbiol 24(7-8):745-51.
13. Cheynier V, Duenas-Paton M, Salas E, Maury C, Souquet JM, Sarni-Manchado P,
Fulcrand H. 2006. Structure and properties of wine pigments and tannins. Am J
Enol Viticult 57(3):298-305.
14. Cortell JM, Kennedy JA. 2006. Effect of shading on accumulation of flavonoid
compounds in (Vitis vinifera L.) pinot noir fruit and extraction in a model system.
J Agri Food Chem 54(22):8510-20.
46

15. Cowan MM. 1999. Plant Products as Antimicrobial Agents. Clin Microbiol Rev
12(4):564–82.
16. Esteban MB, García AJ, Ramos P, Márquez MC. 2007. Evaluation of fruit-
vegetable and fish wastes as alternative feedstuffs in pig diets. Waste Manage
27(2):193-200.
17. [FAS] Foreign Agricultural Service. 2008. World Markets and Trade: Fresh Table
Grapes. Washington, D.C.: U. S. Dept. of Agriculture. Available from:
www.fas.usda.gov. Accessed April 29, 2009.
18. Fuleki T, Ricardo-da-Silva JM. 1997. Catechin and procyanidin composition of
seeds from grape cultivars grown in Ontario. J Agri Food Chem 45(4):1156-60.
19. Gachons CP, Kennedy JA. 2003. Direct method for determining seed and skin
proanthocyanidin extraction into red wine. J Agri Food Chem 51(20):5877-81.
20. Garcia AJ, Esteban MB, Márquez MC, Ramos P. 2005. Biodegradable municipal
solid waste: Characterization and potential use as animal feedstuffs. Waste
Manage 25(8):780-87.
21. Garcia-Marino M, Rivas-Gonzalo JC, Ibanez E, Garcia-Moreno C. 2006.
Recovery of catechins and proanthocyanidins from winery by-products using
subcritical water extraction. Anal Chim Acta 563(1-2):44-50.
22. Gilliland SE, Nelson CR, Maxwell C. 1985. Assimilation of cholesterol by
lactobacillus-acidophilus. Appl Environ Microb 49(2):377-81.
23. Goldberg G. 2003. Plants: Diet and Health. 2 ed.: Blackwell Science for the
British Nutrition Foundation. 337 p.
47
24. Gómez AM, López CP, De la Ossa EM. 1996. Recovery of grape seed oil by
liquid and supercritical carbon dioxide extraction: A comparison with
conventional solvent extraction. Chem Eng J Bioch Eng 61(3):227-31.
25. Gupta S, Ravishankar S. 2005. A comparison of the antimicrobial activity of
garlic, ginger, carrot, and turmeric pastes against Escherichia coli O157: H7 in
laboratory buffer and ground beef. Foodborne Path Disease 2(4):330-40.
26. Hong N, Yaylayan VA, Raghavan GSV, Pare JRJ, Belanger JMR. 2001.
Microwave-assisted extraction of phenolic compounds from grape seed. Nat Prod
Lett15 (3):197-204.
27. Hughner PM, Prothero A, Shultz C, Stanton J. 2007. Who are organic food
consumers? A compilation and review of why people purchase organic food. J
Consum Behav 6:94-110.
28. Hui YH, Barta J, Cano MP, Gusek TW, Sidhu JS, Sinha NK. 2006. Handbook of
Fruits and Fruit Processing. Hoboken: Wiley-Blackwell Publishing. 697 p.
29. Jay JM. 1992. Modern food microbiology. New York Van. Nostrand Reinhold.
790 p.
30. Jayaprakasha GK, Selvi T, Sakariah KK. 2003. Antibacterial and antioxidant
activities of grape (Vitis vinifera) seed extracts. Food Res Int 36(2):117-22.
31. Krajcova E, Greifova M, Schmidt S. 2008. Study of antimicrobial activity of
selected plant extracts against bacterial food contaminants. J Food Nutr
47(3):125-30.
48

32. Kyung KH, Park KS, Kim YS. 1996. Isolation and characterization of bacteria
resistant to the antimicrobial activity of garlic. J Food Sci 61(1):226-29.
33. Lafka TI, Sinanoglou V, Lazos ES. 2007. On the extraction and antioxidant
activity of phenolic compounds from winery wastes. Food Chem 104(3):1206-14.
34. Larson AE, Yu RRY, Lee OA, Price S, Haas GJ, Johnson EA. 1996.
Antimicrobial activity of hop extracts against Listeria monocytogenes in media
and in food. Int J Food Microb 33(2-3):195-207.
35. Lotter LP, Leistner L. 1978. Minimal water activity for enterotoxin-A production
and growth of Staphylococcus aureus. Appl Environ Microb 36(2):377-80.
36. Lu YB, Ma WY, Hu RL, Dai XJ, Pan YJ. 2008. Ionic liquid-based microwave-
assisted extraction of phenolic alkaloids from the medicinal plant Nelumbo
nucifera gaertn. J Chromatogr A 1208(1-2):42-46.
37. Mazza G, Shi J, LeMaguer M. 1998. Functional Foods: Biochemical &
Processing Aspects. CRC Press.Boca Raton. 409 p.
38. Mora A, Blanco JE, Blanco M, Alonso MP, Dhabi G, Echeita A, Gonzalez EA,
Bernandez MI, Blanco J. 2005. Antimicrobial resistance of Shiga toxin
(verotoxin)-producing Escherichia coli O157: H7 and non-O157 strains isolated
from humans, cattle, sheep and food in Spain. Res Microb 156(7):793-806.
39. Moreno DA, Ilic N, Poulev A, Brasaemle DL, Fried SK, Raskin I. 2003.
Inhibitory effects of grape seed extract on lipases. Nutrition 19(10):876-79.
49
40. Murga R, Ruiz R, Beltran S, Cabezas JL. 2000. Extraction of natural complex
phenols and tannins from grape seeds by using supercritical mixtures of carbon
dioxide and alcohol. J Agri Food Chem 48(8):3408-12.
41. Musee N, Lorenzen, L Aldrich C. 2007. Cellar waste minimization in the wine
industry: a systems approach. J Clean Prod 15(5):417-31.
42. [NASS] National Agricultural Service Station. 2008. Crop Production.
Washington, D.C.: U.S. Dept. of Agriculture. Available from:
www.nass.usda.gov. Accessed April 29, 2009.
43. Nawaz H, Shi J, Mittal GS, Kakuda Y. 2006. Extraction of polyphenols from
grape seeds and concentration by ultrafiltration. Sep Purif Technol 48(2):176-81.
44. Oszmianski J, Sapis JC. 1989. Fractionation and identification of some low-
molecular weight grape seed phenolics. J Agri Food Chem 37(5):1293-97.
45. Ozkan G, Sagdic O, Baydar NG, Kurumahmutoglu Z. 2004. Antibacterial
activities and total phenolic contents of grape pomace extracts. J Sci Food Agr
84(14):1807-11.
46. Pinelo M, Rubilar M, Jerez M, Sineiro J, Nunez MJ. 2005. Effect of solvent,
temperature, and solvent-to-solid ratio on the total phenolic content and
antiradical activity of extracts from different components of grape pomace. J Agri
Food Chem 53(6):2111-17.
47. Postescu ID, Tatomir C, Chereches G, Brie I, Damian G, Petrisor D, Hosu AM,
Miclaus V, Pop A. 2007. Spectroscopic characterization of some grape extracts
with potential role in tumor growth inhibition. J Optelectron Adv M 9(3):564-67.
50
48. Prescott LM, Harley J, Klein DA. 2005. Microbiology, 6 ed. New York: McGraw
Hill. 1152 p.
49. Rabak F, Taylor JH. 1921. Commercial Utilization of grape pomace and stems
from the grape juice industry. Washington D.C. USDA. 23 p.
50. Rauha JP, Remes S, Heinonen M, Hopia A, Kahkonen M, Kujala T, Pihlaja K,
Vuorela H, Vuorela P. 2000. Antimicrobial effects of Finnish plant extracts
containing flavonoids and other phenolic compounds. Int J Food Microbiol
56(1):3-12.
51. Rhodes PL, Mitchell JW, Wilson MW, Melton LD. 2006. Antilisterial activity of
grape juice and grape extracts derived from Vitis vinifera variety Ribier. Int J
Food Microbiol 107(3):281-86.
52. Schaub SM, Leonard JJ. 1996. Composting: An alternative waste management
option for food processing industries. Trends Food Sci Tech 7(8):263-68.
53. Schieber A, Stintzing FC, Carle R. 2001. By-products of plant food processing as
a source of functional compounds - recent developments. Trends Food Sci Tech
12(11):401-413.
54. Sembries S, Dongowski G, Mehrlander K, Will F, Dietrich H. 2006.
Physiological effects of extraction juices from apple, grape, and red beet pomaces
in rats. J Agri Food Chem 54(26):10269-80.
55. Shi J, Nawaz H, Pohorly J, Mittal G, Kakuda Y, Jiang YM. 2005. Extraction of
polyphenolics from plant material for functional foods - Engineering and
technology. Food Rev Int 21(1):139-66.
51

56. Shoko TS, Megumi M, Eri F, Jun K, Michiko W. 1999. Isolation and
Identification of an Antibacterial Compound from Grape and Its Application to
Foods. Nippon Nogeikagaku Kaishi 73(2):4.
57. Stabnikova O, Wang JY, Bo Ding H, Joo H. 2005. Biotransformation of vegetable
and fruit processing wastes into yeast biomass enriched with selenium.
Bioresource Technol 96(6):747-51.
58. Stafne ET. 2006. Report of the 2006 Oklahoma Grape Growers Survey.
Oklahoma State Univeristy. 19 p.
59. Teratanavat R, Hooker NH. 2006. Consumer valuations and preference
heterogeneity for a novel functional food. J Food Sci 71(7):S533-S41.
60. Theivendran S, Hettiarachchy NS, Johnson MG. 2006. Inhibition of Listeria
monocytogenes by nisin combined with grape seed extract or green tea extract in
soy protein film coated on turkey frankfurters. J Food Sci 71(2):M39-M44.
61. Tilden J, Young W, Ann-Marie MN,Custer C,Boesel B, Lambert-Fair MA,
Majkowski J, Vugia D, Wemer SB, Hollingsworth J, Morris JG . 1996. A New
Route of Transmission for Eschenichia coli: Infection from Dry Fermented
Salami. Public Health Briefs 86(8):4.
62. Ukuku DO, Pilizota V, Sapers GM. 2001. Influence of washing treatment on
native microflora and Escherichia coli population of inoculated cantaloupes. J
Food Safety 21(1):31-47.
52

53
63. [UNEP] The United Nations Environment Program. 2002. Cleaner production
Fact Sheet 3: Food Manufacturing Series. Queensland: University of Queensland
and UNEP. Available from: www.geosp.uq.edu.au. Accessed April 27, 2009.
64. Velickovic DT, Milenovic DM, Ristic MS, Veljkovic VB. 2008. Ultrasonic
extraction of waste solid residues from the Salvia sp essential oil hydro
distillation. Biochem Eng J 42(1):97-104.
65. Velioglu YS, Mazza G, Gao L, Oomah BD. 1998. Antioxidant activity and total
phenolics in selected fruits, vegetables, and grain products. . J Agri Food Chem
46(10):4113-17.
66. Veluri R, Singh RP, Liu ZJ, Thompson JA, Agarwal R, Agarwal C. 2006.
Fractionation of grape seed extract and identification of gallic acid as one of the
major active constituents causing growth inhibition and apoptotic death of DU145
human prostate carcinoma cells. Carcinogenesis 27(7):1445-53.
.

APPENDIX 1
Growth of Escherichia coli 0157:H7 with Petroleum Ether as the extracting solvent
Each treatment is representative of values from 3 replicates analyzed in duplicate.
54

APPENDIX 2
Growth of Escherichia coli 0157:H7 with 70% Methanol as the extracting solvent
Each treatment is representative of values from 3 replicates analyzed in duplicate.
55
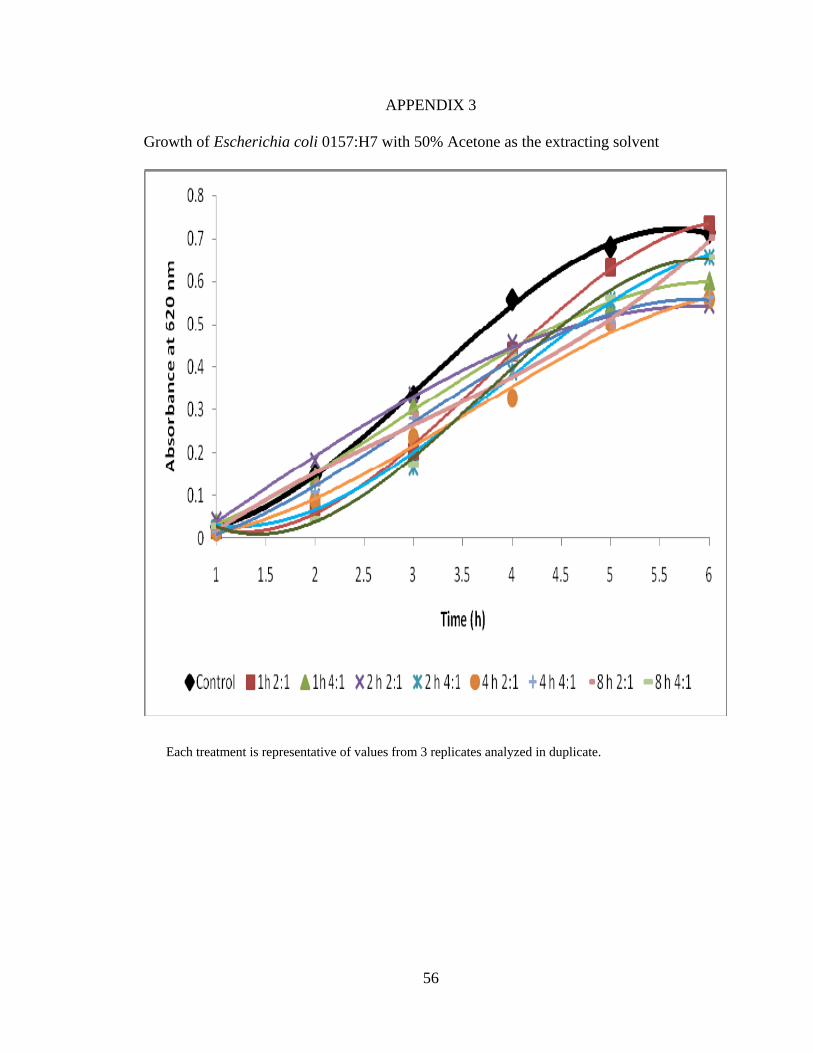
APPENDIX 3
Growth of Escherichia coli 0157:H7 with 50% Acetone as the extracting solvent
Each treatment is representative of values from 3 replicates analyzed in duplicate.
56
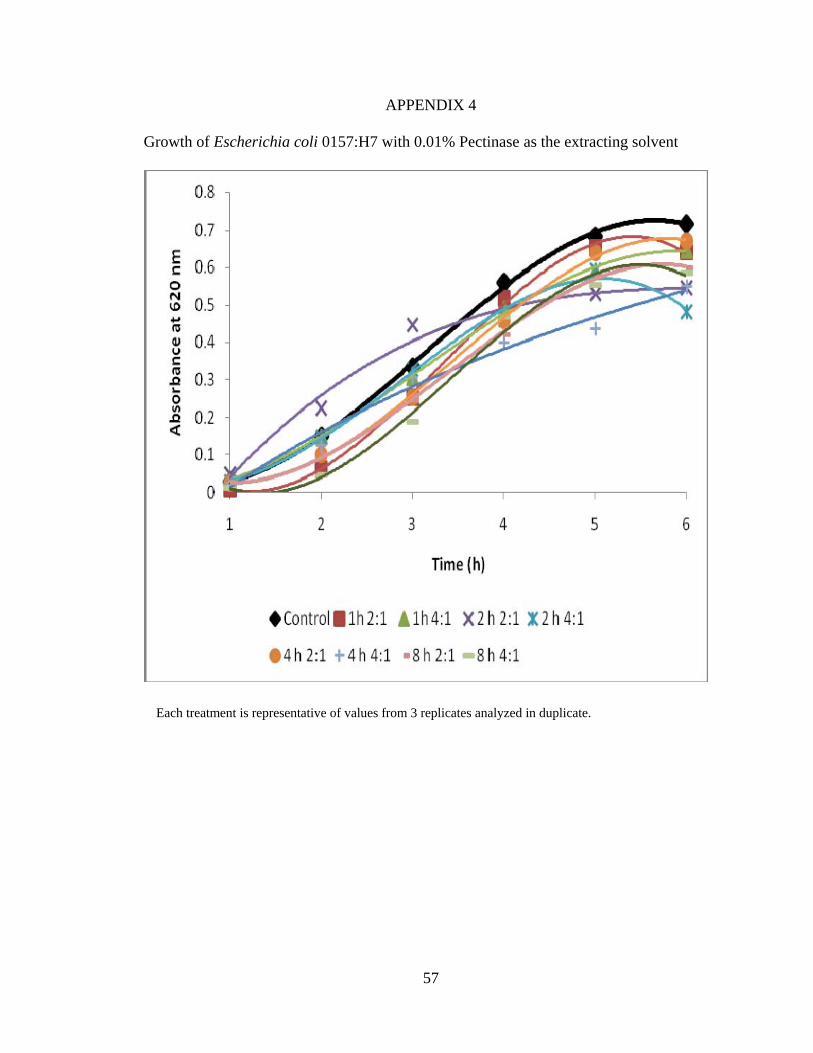
APPENDIX 4
Growth of Escherichia coli 0157:H7 with 0.01% Pectinase as the extracting solvent
Each treatment is representative of values from 3 replicates analyzed in duplicate.
57
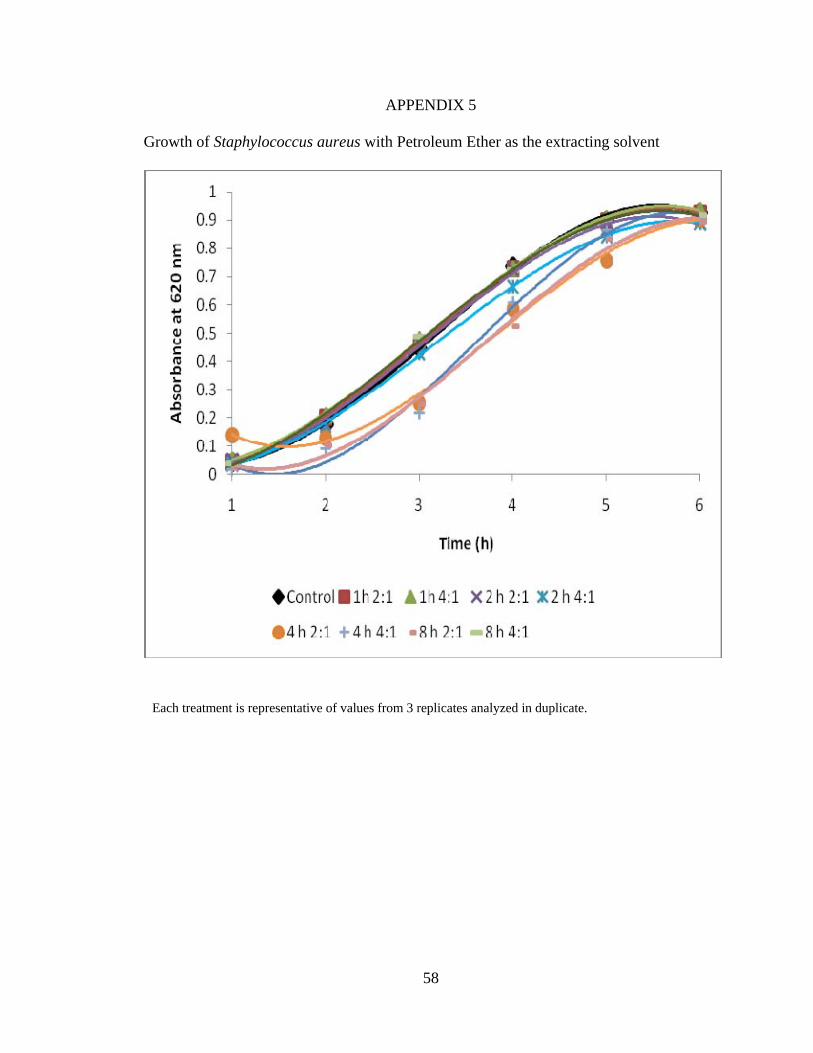
APPENDIX 5
Growth of Staphylococcus aureus with Petroleum Ether as the extracting solvent
Each treatment is representative of values from 3 replicates analyzed in duplicate.
58
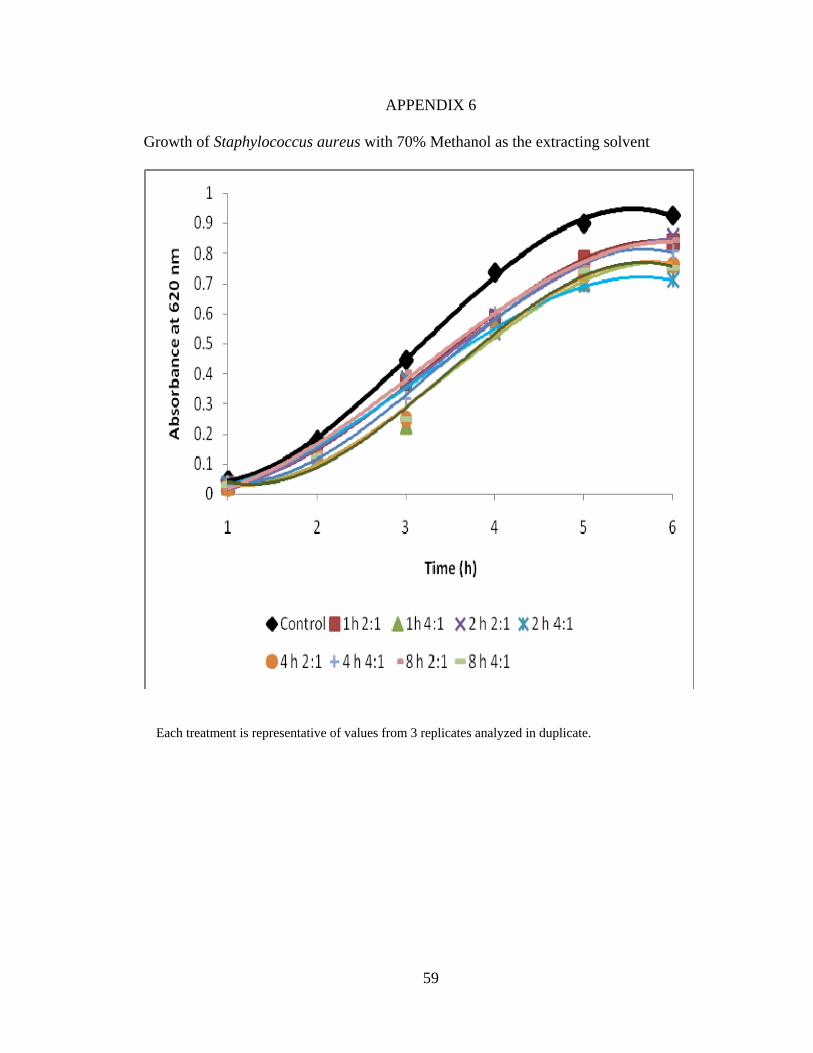
APPENDIX 6
Growth of Staphylococcus aureus with 70% Methanol as the extracting solvent
Each treatment is representative of values from 3 replicates analyzed in duplicate.
59

APPENDIX 7
Growth of Staphylococcus aureus with 50% Acetone as the extracting solvent
Each treatment is representative of values from 3 replicates analyzed in duplicate.
60

APPENDIX 8
Growth of Staphylococcus aureus with 0.01% Pectinase as the extracting solvent
Each treatment is representative of values from 3 replicates analyzed in duplicate.
61

62
VITA
Akhila Vasan
Candidate for the Degree of
Master of Science Thesis: EXTRACTION OF BIO-ACTIVE COMPONENTS FROM FRUIT AND
VEGETABLE PROCESSING WASTES: USING GRAPE WASTE FROM THE WINE
PROCESSING INDUSTRY AS A MODEL
Major Field: Food Science Biographical:
Education: Completed the requirements for the Master of Science in Food Science at Oklahoma State University, Stillwater, Oklahoma in December 2008. Bachelor of Engineering in Chemical Engineering M.S.Ramaiah Institute of Technology September 2002 – June 2006 Experience: Graduate Research and Teaching Assistant
September 2006 – May 2009 Professional Memberships: Institute of Food Technologists
ADVISER’S APPROVAL: Dr. Christina DeWitt
Name: Akhila Vasan Date of Degree: May, 2009 Institution: Oklahoma State University Location: Stillwater, Oklahoma Title of Study: EXTRACTION OF BIO-ACTIVE COMPONENTS FROM FRUIT AND
VEGETABLE PROCESSING WASTES: USING GRAPE WASTE FROM THE WINE PROCESSING INDUSTRY AS A MODEL
Pages in Study: 61 Candidate for the Degree of Master of Science
Major Field: Food Science Scope and Method of Study: The aim of the study was to develop a screening procedure
to extract valuable components from fruit and vegetable processing wastes which can be easily replicated on a large scale. Variety of extraction conditions such as solvent utilization, ratio of solvent: waste and interaction time were tested for their effect on the extraction procedure. The activity of the extracts was tested based on antimicrobial activity against common food pathogens: Escherichia coli0157:H7 and Staphylococcus aureus.
Findings and Conclusions: The results from the study concluded that the extracts contain
bioactive components in sufficient quantities to inhibit the pathogens. Thus, value can be extracted in the form of bioactive antimicrobial compounds from grape waste. The most effective solvent was 50% acetone, which implies that this extract contains bioactive components in higher amounts than the other solvents to inhibit the pathogens. The experiment was conducted on a lab scale and further research needs to be conducted to scale up the process. Further research also needs to be conducted to identify and characterize the compounds.