extraction and determination of chemical and physical...
TRANSCRIPT

Degree Thesis in Life Science 15 ECTS
Bachelor’s Level
Spring semester 2017
Extraction and determination of chemical and physical properties of antimicrobial compounds from a Swedish mushroom
Iman Kalmoni
Supervisors: Charlotta Sundin and Caroline Zetterström

Table of Contents Abstract ...................................................................................................................................... 1
1.Introduction ............................................................................................................................. 2
1.1 Pseudomonas aeruginosa.................................................................................................. 2
1.2 Virulence systems in Pseudomonas aeruginosa ............................................................... 2
1.3 Treatment and multi drug resistance of Pseudomonas aeruginosa .................................. 3
1.4 Medicinal mushroom........................................................................................................ 3
2. Objectives .............................................................................................................................. 4
3. Materials and Methods ........................................................................................................... 4
3.1 Cultivation of mycelium and measurement of bacterial growth ...................................... 4
3.2 pH, brightness and temperature sensibility test ................................................................ 4
3.3 Extraction of active secondary metabolite from mycelium supernatant .......................... 5
3.4 Fractionation of crude extract .......................................................................................... 5
3.5 Determination of chemical and physical properties of active secondary metabolite ....... 5
4. Results and Discussion .......................................................................................................... 6
4.1 Confirmation of antimicrobial activity in mycelium supernatant .................................... 6
4.2 Production of active compound........................................................................................ 7
4.3 Sensibility to different stress factors ................................................................................ 8
4.3.1 pH test ........................................................................................................................ 9
4.3.2 Brightness and darkness test ...................................................................................... 9
4.3.3 Temperature ............................................................................................................. 10
4.4 Extraction of active compound from supernatant .......................................................... 10
4.5 Fractionation of crude extract ........................................................................................ 11
4.6 Analysis of chemical and physical properties of unknown compound .......................... 12
4.6.1 Ultra Performance Liquid Chromatography (UPLC) and Liquid Chromatography-Mass Spectrometry (LC/MS)............................................................................................ 13
5. Conclusions .......................................................................................................................... 17
6. Acknowledgements .............................................................................................................. 18
7. References ............................................................................................................................ 19
1
Abstract Pseudomonas aeruginosa is an opportunistic gram-negative bacterium responsible for health-threatening infections among people with compromised immune system. The development of antibiotic resistance in P. aeruginosa is a consequence of common overuse and mishandle of antibiotics. This fact has resulted in the global concern and encouragement of finding novel pharmaceutical treatments.
One promising strategy is now focused on natural occurring secondary metabolites from mushrooms. Although it is an unexploited field, consumption of mushrooms has shown to obtain health-promoting properties. In this study, we have found plausible compound(s) with antimicrobial properties from a Swedish mushroom. We have performed an analysis of its possible chemical and physical properties with qualitative techniques such as Liquid Chromatography- Mass Spectrometry (LC/MS), High Performance Liquid Chromatography (HPLC) and, Ultra Performance Liquid Chromatography (UPLC) and revealed promising data. This has given us a better overview of isolation procedure and chemical properties of possible active compound(s) in a Swedish mushroom.

2
1.Introduction Pseudomonas aeruginosa is an opportunistic gram-negative bacterium responsible for the high mortality rate and infection among patients with open wounds, cystic fibrosis or acute leukaemia in hospitals (S. Bentzmann, 2011). P. aeruginosa is able to produce multitude of virulence factors including flagella, type 4 pili, lipopolysaccharides and type III secretion system, among others (Hancock, 2013).
For many years, scientists and doctors have been targeting gram-negative bacteria with antibiotics. However, not only the rapid adaptation to different environments but the result of a common overuse and mishandle of commercial antimicrobial drugs to treat infectious diseases has resulted in a growing concern over the efficacy of antibiotics (Pattar, 2010). Such consequences have encouraged scientists to find new antimicrobial compounds from natural occurring sources which has been found to contain various therapeutic activities including anticarcinogenic, anti-inflammatory, immuno-suppressor and antibiotic (Kuo-Hsiung Lee, 2012).
Herbal products derived from mushrooms have been consumed as health-promoting factors and drugs to treat microbial infections since ancient times (Ulrike Lindequist, 2005). Today, a great number of different mushrooms have been thoroughly analysed and has led to the discovery of promising chemical compounds which expectantly can be used as the basis for the development of new antimicrobial treatments (Josefine Enman, 2007).
1.1 Pseudomonas aeruginosa Pseudomonas aeruginosa is an opportunistic, rod-shaped, aerobic, gram-negative bacterium capable of causing disease to vulnerable patients with different medical conditions such as cystic fibrosis, severe burns and pneumonia. Although P. aeruginosa is present in the normal microbial flora in humans (Philip D. Lister, 2009), the impairment of the patient’s immune system can lead to infection and ultimately life-threatening disease. Treatment of such diseases can be challenging because P. aeruginosa utilises a wide variety of virulence factors including type III secretion system, flagella, secretion of proteases, among others (Anis Ben Haj Khalifa, 2011).
Commonly, in a hospital environment, patients are supplemented with antibiotics to treat microbial infections. However, P. aeruginosa is characterised by its intrinsic mechanisms of resistance including survival on minimal nutritional environment (Philip D. Lister, 2009), low permeability of its cell wall, as well as its ability to rapidly acquired new resistance mechanisms through mutations or from other bacteria. Therefore, such delicate situation has become a problem for the human health.
1.2 Virulence systems in Pseudomonas aeruginosa Pseudomonas aeruginosa utilises a variety of virulence systems involved in colonization, survival of the bacterium and invasion of tissues.
Flagella and type 4 pili are responsible for the adhesion to the host cell surface. In addition, an important virulence factor shared with many gram-negative bacteria, is type III secretion
3
system. This mechanism is characterised by the injection of effector proteins into the host cell through a needle-like complex, which ultimately interferes with the host immune system response and signal transduction (Marlies Galle, 2012). Other virulence factors include the production of proteases capable of disrupting protein structures in the host cell and lipases that target cell membranes (Hancock, 2013).
1.3 Treatment and multi drug resistance of Pseudomonas aeruginosa Discovery of a suitable drug to P. aeruginosa infections has been an ongoing challenge over the past years. Upon infection, many hospitals use combinational therapy of β-lactams, aminoglycosides, fluoroquinolones and polymyxins (Kristi A. Traugott, 2011). An extensive majority of these antibiotics target similar cellular mechanisms, including DNA metabolism, components of translational machinery and cell wall biosynthesis (F.C., 2006). However, the misuse and excessive consumption of antibiotics even when virus causes the infections, have contributed to the multi-drug resistance problem we are facing. Additionally, the use of antibiotic therapy to promote growth in food animals and agriculture has also contributed to an increase of bacterial resistance (Aminov, 2010). As a consequence, bacteria have been able to respond to this selective pressure by acquiring resistance mechanisms through mutational changes in chromosomal genes which closely regulate resistance genes or acquiring resistance genes from other microorganisms through plasmids and bacteriophages (Lambert, 2001) (Aminov, 2010).
On the other hand, P. aeruginosa has intrinsic mechanisms of resistance related to the low permeability of its outer membrane, efflux systems and production of β-lactamases. Additionally, another advantageous intrinsic property of P. aeruginosa concerns the mode of growth of such bacteria. Some bacteria grow in aggregates surrounded with a polysaccharide matrix, termed biofilms, characterized by the appearance of a barrier that limit penetration of antibiotics or any chemical compounds involved in the immune response (Drenkard, 2003).
As a result of the rapid acquisition of alternative routes to become pathogenic, what was thought to be under control has turned out to be a growing threat. Therefore, the greatest goal is to stop infection at an early stage by understanding the mechanisms of host-pathogen interactions and provide a rapid diagnosis for specific bacteria (Lambert, 2001).
1.4 Medicinal mushroom Natural occurring products have been exploited and used to further optimize the effect of antibiotics. However, mushrooms, which remain unexplored, might be of valuable resource in the discovery of new potential antimicrobial compounds (Maria José Alves, 2014), (Harvey, 2000). As a matter of fact, it is estimated that there are at least 14 000 known mushroom species from a total of 140 000 earth’s wild species (Ulrike Lindequist, 2005).
During development, mushrooms produce secondary metabolites to survive in their environment and communicate between other species (Ulrike Lindequist, 2005). These metabolites have shown to be useful for human purposes. An example is the Shiitake mushroom (Lentinus edodes) which has presented to play a role in various aspects of human
4
health including antimicrobial activity and antitumor properties, among others (Hatvani, 2001). Therefore, secondary metabolites which can be found in different parts of the mushroom’s fruiting body, mycelia and spores might be the key for the development of modern antibiotics.
2. Objectives The main objective of this thesis is to identify the presence of antibacterial activity from a Swedish mushroom as well as giving a closer insight of the chemical and physical properties of the unknown compound(s) produced by the mycelia. Due to future intellectual property rights the Latin name of the mushroom is not stated in this thesis.
3. Materials and Methods 3.1 Cultivation of mycelium and measurement of bacterial growth A preparatory laboratory experiment was done by collecting mushroom from two different locations in Sweden. The mushroom was dried, the spores collected, heat-activated and growth condition and growth length for production of active secondary metabolite were set prior to this thesis. The sub-cultures showing a growth inhibition were further re-cultivated and studied.
This laboratory work started by cultivating fresh mycelium. 10 mL from two different previously-cultivated mycelia and one control was transferred to three separate 2 L Erlenmeyer flasks containing 1 L medium (20 g D-Glucose, 20 g Malt extract and 1 g peptone from casein). The cultures were grown for two weeks. Prior to growth inhibition experiments, samples were centrifuged in Allegra X12R centrifuge Beckmann coulter at 3750 rpm at 24 ºC for 10 minutes, to remove any solid material in the sample tubes. In a 96-well plate 20 µL of P. aeruginosa, previously grown at 37 ºC overnight while shaking and diluted OD600 = 1.0 in Luria Broth (LB) was added, followed by 80 µL from each of the supernatants from the mycelium. The plate was cultivated at 37 ºC while shaking and the bacterial growth was measured at OD600every hour for eight hours and after 24 hours with Wallac Victor 2 1420 multilabel counter. The experiment was repeated twice and each sample was tested in triplicates.
3.2 pH, brightness and temperature sensibility test Two smaller parallel projects were conducted to detect any possible increase in production of active antimicrobial compounds. Two different samples were prepared in a 500 mL Erlenmeyer flasks by adding 350 mL of medium and 5 mL of previously-cultivated supernatant. The cultures were monitored using MColorpHast pH-indicator strips and kept at a pH of 5 over 20 days by adding 1M NaOH or 1M HCl. The supernatant was measured after 8, 15 and 35 days for bacterial inhibition, following the procedure described above. In addition, two series of samples were prepared by adding 10 mL of medium and 3 mL from each sample to be studied in a 50 mL Falcon tube. One was kept in darkness and one in light at room temperature. Activity was measured after 7, 12, 20 and 48 days as described previously. The temperature experiment consisted in cultivating two different sets of 3 samples as described above. The tubes were kept in darkness and 6 ºC, and at normal light and temperature, respectively.

5
3.3 Extraction of active secondary metabolite from mycelium supernatant After having tested the mycelia for bacterial activity and showing a positive result, the samples were transferred to a 2 L separation funnel and 500 ml of ethyl acetate was added and shaked vigorously. This process was repeated twice for each sample and the ethyl acetate was separated from the aqueous phase and evaporated using Buchi rotavapor R-114. The pH of the aqueous phase was measured using MColorpHast pH-indicator strips and changed to approximately 7 by adding 1M NaOH followed by the extraction procedure. The evaporated organic phase was set under high vacuum overnight and 200 µL of DMSO was added. The final extractions were tested against bacterial growth by adding 20 µL P. aeruginosa OD600= 1.0 in LB, 80 µL maltose and 1 µL of the extract.
3.4 Fractionation of crude extract After extracting and obtaining positive indication of the presence of active compound, 100 µL of crude extract (previously submerged in 200 µL of DMSO) was added together with extra 1 mL DMSO in a 4 mL vial. The sample was run in Semi-preparative HPLC Gilson system HPLC using nucleodor C18 HTec 5 µm 250/21 mm. The wavelength as well as the flow rate was set to 254nm and 9 mL/min, respectively. The eluent system consisted of A. aq. 0.0005% HCOOH and B. 0.0005 % HCOOH in MeCN/water. The gradient used was 5% (MeCN/water) to 20% over 20 minutes and 20% to 100% over 10 minutes. The elution was collected manually in either 2.2 mL 48-well plate or 4.5 mL 96-well plate by adding approximately 1.9 mL and 3.4 mL in each well, respectively. Plates were freeze dried with liquid nitrogen and put under high vacuum at -107 ºC for 3 days. Thereafter, 10 µL of DMSO was added in each well and stored until measurements. Once again, each well was tested against antimicrobial effect by adding 20 µL P. aeruginosa, 80 µL LB and 2 µL from each well and measured every 3 hours over 8 hours and after 24 hours.
3.5 Determination of chemical and physical properties of active secondary metabolite Fractionated samples were prepared for Liquid Chromatography-Mass Spectroscopy (LC/MS) by adding 1 µL of active extracts resulting from fractionation with 20 µL of methanol or MeCN. The samples were run using Agilent Technologies 6150 Quadrupole LC/MS with the following gradient: 2.5% to 10% (MeCN /water) over 5 minutes, 20% to 100% (MeCN /water) over 2 minutes and 100% for 30 seconds. Next, an analytical test on UPLC using Shimadzu LC-30AD and 85 Sedere LT-ELSD. The flow rate was set to 1 mL/min, SPD-M20A detector at 210, 230, 260, 280, 310 and 360nm, and MeCN/water eluent system. Two different gradients were established according to the column used: For column EC150/4 nucleodor C18 Htec 5 µm, the gradient was set up to 28.5 minutes with different concentrations of the mobile phase: 5% to 20% (MeCN /water) over 12.5 minutes, 20% to 100 % (MeCN /water) over 8 minutes and 100% for 5 minutes. The alternative column was EC 125/4.6 nucleodor C18 pyramid 5 µm. The gradient was as follows: 0% to 5% (MeCN/water) over 15 minutes, 5% to 100% (MeCN /water) for 10 minutes and kept at 100% for 2 minutes.

6
4. Results and Discussion 4.1 Confirmation of antimicrobial activity in mycelium supernatant Secondary metabolites originate from biosynthetic pathways and many are not directly involved in the mycelium growth but might take part in the interaction between other plants and protection (Demain AL, 2000). In this project, we are looking at a secondary metabolite with antimicrobial properties.
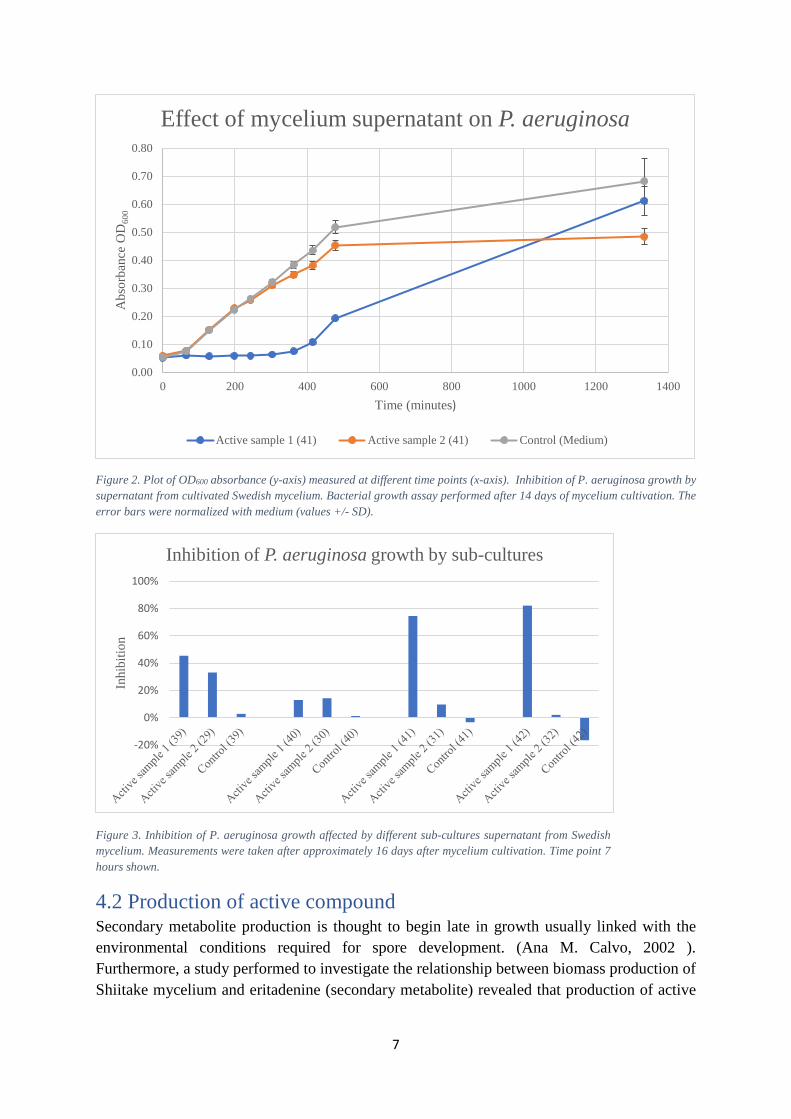
To prove concept that the supernatant of the cultivated mycelium has an effect on the growth of P. aeruginosa, series of trials were conducted. The resulting cultures after approximately 14 days can be seen in Figure 1. As it can be seen in Figure 2, there was a clear inhibition from Active sample 1 for approximately 7 hours, compared to the control sample which displayed a normal bacterial growth curve. On the other hand, Active sample 2 which was previously seen to be active showed no decrease in absorbance thus in positively inhibiting the bacteria. This can be due to the low concentration of active secondary metabolites in the supernatant. Throughout the experiments, this same pattern was reproduced in different sub-cultures measurements: Active sample 1 has always had a better effect than Active sample 2 (Figure 3).
Figure 1. Cultures of mycelium after 14 days of cultivation
7
Figure 2. Plot of OD600 absorbance (y-axis) measured at different time points (x-axis). Inhibition of P. aeruginosa growth by supernatant from cultivated Swedish mycelium. Bacterial growth assay performed after 14 days of mycelium cultivation. The error bars were normalized with medium (values +/- SD).
Figure 3. Inhibition of P. aeruginosa growth affected by different sub-cultures supernatant from Swedish mycelium. Measurements were taken after approximately 16 days after mycelium cultivation. Time point 7 hours shown.
4.2 Production of active compound Secondary metabolite production is thought to begin late in growth usually linked with the environmental conditions required for spore development. (Ana M. Calvo, 2002 ). Furthermore, a study performed to investigate the relationship between biomass production of Shiitake mycelium and eritadenine (secondary metabolite) revealed that production of active
0.00
0.10
0.20
0.30
0.40
0.50
0.60
0.70
0.80
0 200 400 600 800 1000 1200 1400
Abs
orba
nce
OD
600
Time (minutes)
Effect of mycelium supernatant on P. aeruginosa
Active sample 1 (41) Active sample 2 (41) Control (Medium)
-20%
0%
20%
40%
60%
80%
100%
Inhi
bitio
n
Inhibition of P. aeruginosa growth by sub-cultures
8
secondary metabolite was accomplished after 15 days of cultivation whereas the mycelium continued to grow (Josefine Enman, 2008).
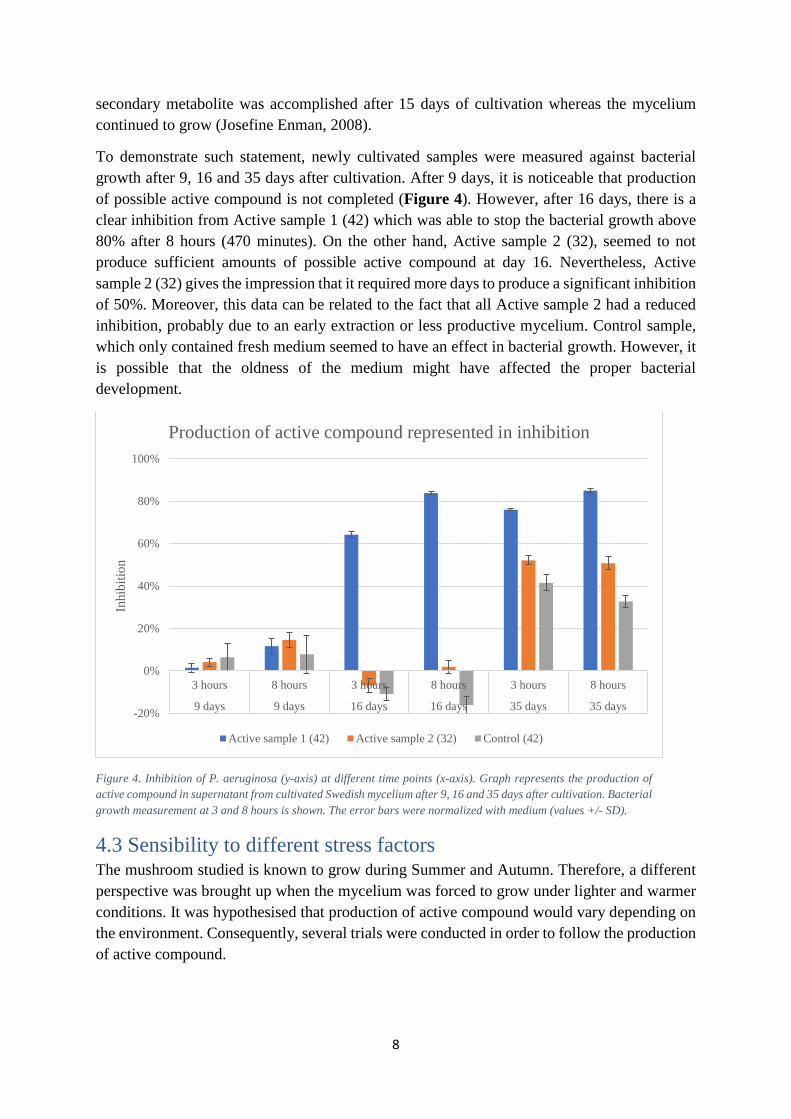
To demonstrate such statement, newly cultivated samples were measured against bacterial growth after 9, 16 and 35 days after cultivation. After 9 days, it is noticeable that production of possible active compound is not completed (Figure 4). However, after 16 days, there is a clear inhibition from Active sample 1 (42) which was able to stop the bacterial growth above 80% after 8 hours (470 minutes). On the other hand, Active sample 2 (32), seemed to not produce sufficient amounts of possible active compound at day 16. Nevertheless, Active sample 2 (32) gives the impression that it required more days to produce a significant inhibition of 50%. Moreover, this data can be related to the fact that all Active sample 2 had a reduced inhibition, probably due to an early extraction or less productive mycelium. Control sample, which only contained fresh medium seemed to have an effect in bacterial growth. However, it is possible that the oldness of the medium might have affected the proper bacterial development.
Figure 4. Inhibition of P. aeruginosa (y-axis) at different time points (x-axis). Graph represents the production of active compound in supernatant from cultivated Swedish mycelium after 9, 16 and 35 days after cultivation. Bacterial growth measurement at 3 and 8 hours is shown. The error bars were normalized with medium (values +/- SD).
4.3 Sensibility to different stress factors The mushroom studied is known to grow during Summer and Autumn. Therefore, a different perspective was brought up when the mycelium was forced to grow under lighter and warmer conditions. It was hypothesised that production of active compound would vary depending on the environment. Consequently, several trials were conducted in order to follow the production of active compound.
-20%
0%
20%
40%
60%
80%
100%
3 hours 8 hours 3 hours 8 hours 3 hours 8 hours
9 days 9 days 16 days 16 days 35 days 35 days
Inhi
bitio
n
Production of active compound represented in inhibition
Active sample 1 (42) Active sample 2 (32) Control (42)

9
4.3.1 pH test Following the data and discussion presented by Josefine Enman et al. (Josefine Enman, 2008), mycelium tend to produce different amounts of compound depending on the external stress response. Specifically, it is said that optimum pH for growth and production of compound in Lentinus edodes differs by approximately 2 pH units. The same principals were taken and tested on this mushroom. In this project, pH was increased to a more neutral solution and production was followed throughout a month (Figure 5).
For 15 days, the pH was maintained at approximately 5. None of the supposedly active samples was able to inhibit bacterial growth above 20%. Intriguingly, when the pH was left to fluctuate after 15 days, it was only when the pH dropped below 5 (Active sample 1: pH 3.5; Active sample 2: pH 4.5 and Control: pH 5) that a noticeable change was observed. It can be speculated that the active compound produced by the mycelium is responsible for such decrease in bacterial growth and pH. Moreover, it can be seen that the control sample had an inhibition of 40%. However, this might be due to the contamination of the control sample or oldness of the medium.
Figure 5. Inhibition of P. aeruginosa (y-axis) at different time points (x-axis). Graph represents the inhibition of bacteria after 8, 15 and 35 days. The pH was kept at 5 for 15 days and left to fluctuate until day 35. The error bars were normalized with medium (values +/- SD).
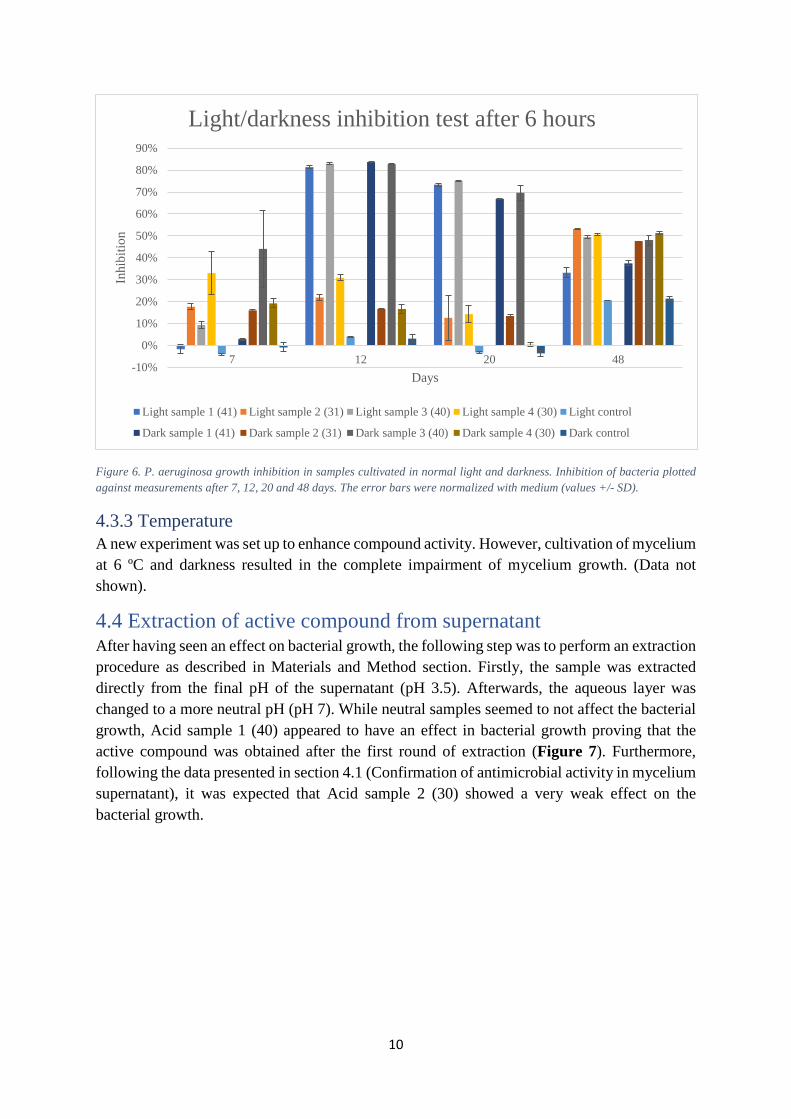
4.3.2 Brightness and darkness test An additional test was performed to detect possible relation between production of active compound and environmental conditions. In this section, two sets of samples were cultivated in normal light and almost complete darkness, respectively. All samples show a similar pattern. Therefore, it is difficult to address any possible effect in the activity of the compound due to the light conditions (Figure 6).
-20%
0%
20%
40%
60%
80%
8 15 35
Inhi
bitio
n
Days
Effect of pH on compound activity
Active sample 1 (42) Active sample 2 (32) Control (42)
10
Figure 6. P. aeruginosa growth inhibition in samples cultivated in normal light and darkness. Inhibition of bacteria plotted against measurements after 7, 12, 20 and 48 days. The error bars were normalized with medium (values +/- SD).
4.3.3 Temperature A new experiment was set up to enhance compound activity. However, cultivation of mycelium at 6 ºC and darkness resulted in the complete impairment of mycelium growth. (Data not shown).
4.4 Extraction of active compound from supernatant After having seen an effect on bacterial growth, the following step was to perform an extraction procedure as described in Materials and Method section. Firstly, the sample was extracted directly from the final pH of the supernatant (pH 3.5). Afterwards, the aqueous layer was changed to a more neutral pH (pH 7). While neutral samples seemed to not affect the bacterial growth, Acid sample 1 (40) appeared to have an effect in bacterial growth proving that the active compound was obtained after the first round of extraction (Figure 7). Furthermore, following the data presented in section 4.1 (Confirmation of antimicrobial activity in mycelium supernatant), it was expected that Acid sample 2 (30) showed a very weak effect on the bacterial growth.
-10%
0%
10%
20%
30%
40%
50%
60%
70%
80%
90%
7 12 20 48
Inhi
bitio
n
Days
Light/darkness inhibition test after 6 hours
Light sample 1 (41) Light sample 2 (31) Light sample 3 (40) Light sample 4 (30) Light control
Dark sample 1 (41) Dark sample 2 (31) Dark sample 3 (40) Dark sample 4 (30) Dark control

11
Figure 7. Plot of OD600 absorbance (y-axis) measured at different time points (x-axis). Bacterial growth of P. aeruginosa after extraction at acidic and neutral pH. The error bars were normalized with medium (values +/- SD).
4.5 Fractionation of crude extract Extraction of the active compound was successfully performed. Fractionation of Active sample 1 (41) compound from the background resulted in the elution of two sets of samples (Table 1, yellow and green). The fact that the elution of active compound was not continuous brings up the question whether it is necessary to have simultaneously both compounds to produce a good inhibition. To prove synergy of both active sets, it would be necessary to perform a dose response between the two different sets together and separately.
In addition, it is possible to observe how inhibition of P. aeruginosa growth pattern is affected with increasing well number (Figure 8). Yet, it is difficult to conclude that the second set has a better effect in inhibition since after 8 hours we do not know what might have caused the first set (yellow) to stop bacterial growth. Nevertheless, from the first set of wells (yellow), it is possible to appreciate the total inhibition of wells 22 to 25 whereas all wells from the second set (green) showed a complete abstention in growth compared to DMSO controls.
On a chemical basis, it is clear that the yellow set had a lower affinity to the column thus it can be considered to be a more polar compound than the green set. Moreover, it is necessary to consider that after many manipulations, this discontinuous pattern of elution might illustrate the degradation of the compound’s side chain resulting in a difference in polarity.
In contrast to this finding, Active sample 2 (31) did not show any relevant activity in any of the wells. Therefore, the experiment continued by focusing on Active sample 1 (41). Note that
0.00
0.10
0.20
0.30
0.40
0.50
0.60
0.70
0.80
0.90
1.00
0 200 400 600 800 1000 1200 1400 1600
Abs
orba
nce
OD
600
Time (minutes)
Bacterial growth after acidic and neutral extraction
Acid sample 1 (40) Acid sample 2 (30) Acid Control (40)
Neutral sample 1 (40) Neutral sample 2 (30) Neutral control (40)

12
the same fractionation procedure was performed on the control sample and expectantly, all wells displayed a normal bacterial growth.
Table 1. Elution pattern from 48-well plate after fractionation. Yellow and green wells represent the first and second eluted active samples, respectively.
1 2 3 4 5 6 12 11 10 9 8 7 13 14 15 16 17 18 24 23 22 21 20 19 25 26 27 28 29 30 36 35 34 33 32 31 37 38 39 40 41 42 48 47 46 45 44 43
Figure 8. Plot of OD600 absorbance (y-axis) measured at different time points (x-axis). Bacterial growth of P. aeruginosa after fractionation. Each curve represents one of the active wells. Measurements were performed by adding 2 µL from each fraction/well in 100 µL bacterial solution OD600 = 0.2
4.6 Analysis of chemical and physical properties of unknown compound To further acquire information about the possible active compound’s chemical and physical properties, a series of qualitative methods were performed on the active wells of the fractionated Active sample 1 (41).
Following the data presented by Jian-Jiang Zhongb et. al (Xiao, 2009), secondary metabolites are characterised by a molecular weight in the range of 150-1000 Da. In addition, this article
0.000
0.100
0.200
0.300
0.400
0.500
0.600
0.700
0.800
0 200 400 600 800 1000 1200 1400 1600
Abs
orba
nce
OD
600
Time (minutes)
Bacterial growth after fractionation
Well 19 Well 20 Well 21 Well 22 Well 23 Well 24
Well 25 Well 35 Well 36 Well 37 DMSO 1 DMSO 2

13
stated that secondary metabolites contain, C, H, O, N, S, P, Cl, Br and F, as well as functional groups such as hydroxyl, carboxyl, carbonyl, amino, among others.
4.6.1 Ultra Performance Liquid Chromatography (UPLC) and Liquid Chromatography-Mass Spectrometry (LC/MS) Wells 23, 24 and 25 (yellow) showed a completely different LC/MS pattern (Figure 9 and 10) compared to the second set of wells (green). First of all, a single UV- active peak is eluted after 1.015 minutes at 260 nm (Figure 9. A, C and D), whereas at 210 nm only peaks corresponding to the solvent and salts can be seen (Figure 9. B, D and E). Moreover, LC/MS data shows the presence of peaks of 101, 127, 157, 179 m/z (Figure 10). However, it is difficult to draw any conclusions about the possible mass of the compound.
Figure 9. LC/MS chromatograms of extracts from wells 23,24 and 25 diluted in DMSO/methanol. Figures (A), (C) and (E) represent chromatograms at 260 nm. Figures (B), (D) and (F) represent chromatograms at 210 nm. Unknown compound was eluted after 1.021 minutes at a gradient 2.5 % (MeCN/water) to 10% over 5 min, 10% to 20% over one minute and 20% to 100% over two minutes.

14
Figure 10. Mass spectrometry results from wells 23, 24 and 25, respectively. Clear peaks can be seen at 101.1, 120.1, 157, 169, and 179 m/z.
As mentioned previously, the second set (green) showed a complete inhibition of the bacteria. This set was further investigated using quantitative UPLC (Figure 11). Note that the first peak at approximately 2.5 minutes is caused by the solvent and peaks at 17.5 and 27.5 minutes are due to the rapid change of MeCN/water concentration. Moreover, the fact that all wells, 35, 36 and 37, showed the same absorbance maximum at 212 nm suggests that we might be looking at the same compound. However, little can be said regarding the possible functional groups unless IR spectrometry is performed. For now we can only speculate that due to peaks at 260 nm and 210 nm, aromatic rings as well as oxygen containing side chains might be part of the compound’s structure. Yet, it is necessary to consider the possibility that the summation of all absorbances corresponding to each functional group might have contributed to this absorption maxima.
15
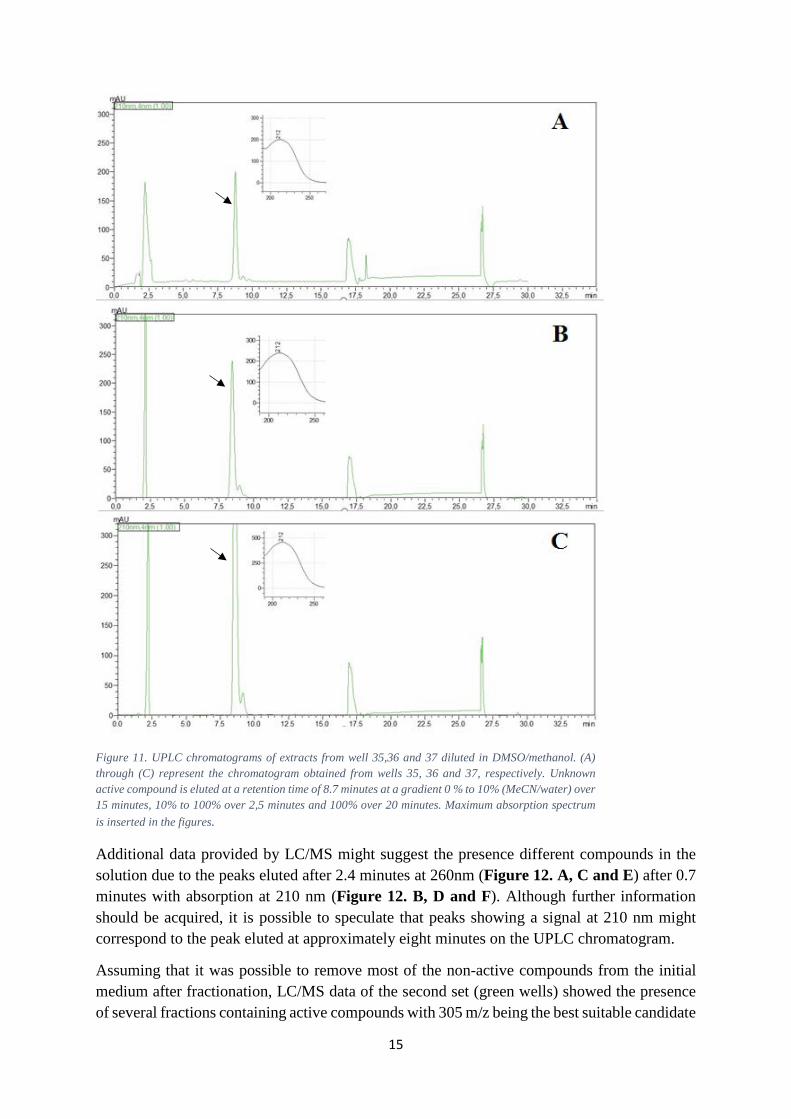
Figure 11. UPLC chromatograms of extracts from well 35,36 and 37 diluted in DMSO/methanol. (A) through (C) represent the chromatogram obtained from wells 35, 36 and 37, respectively. Unknown active compound is eluted at a retention time of 8.7 minutes at a gradient 0 % to 10% (MeCN/water) over 15 minutes, 10% to 100% over 2,5 minutes and 100% over 20 minutes. Maximum absorption spectrum is inserted in the figures.
Additional data provided by LC/MS might suggest the presence different compounds in the solution due to the peaks eluted after 2.4 minutes at 260nm (Figure 12. A, C and E) after 0.7 minutes with absorption at 210 nm (Figure 12. B, D and F). Although further information should be acquired, it is possible to speculate that peaks showing a signal at 210 nm might correspond to the peak eluted at approximately eight minutes on the UPLC chromatogram.
Assuming that it was possible to remove most of the non-active compounds from the initial medium after fractionation, LC/MS data of the second set (green wells) showed the presence of several fractions containing active compounds with 305 m/z being the best suitable candidate

16
(notice that 327 m/z might be due to possible ion) (Figure 13). The other signals, 153, 105 m/z might correspond to different fragments of 305 m/z, however, further analysis is required.
Figure 12. LC/MS chromatograms of extracts from wells 35,36 and 37 diluted in DMSO/methanol. Figures (A), (C) and (E) represent chromatograms at 260 nm. Figures (B), (D) and (F) represent chromatograms at 210 nm. Unknown compound was eluted after 0.734, 0.854 and 2.39 minutes at a gradient 2.5 % (MeCN/water) to 10% over 5 min, 10% to 20% over one minute and 20% to 100% over two minutes.

17
Figure 13. Mass spectrometry results from wells 35, 36 and 37, respectively. Clear peaks can be seen at 105.1, 153.1, 154, 194, 305.1 and 327.1 m/z.
5. Conclusions In summary, treatment of infections caused by P. aeruginosa with combinational therapy of β-lactams, aminoglycosides, fluoroquinolones and polymyxins has enhanced its resistance and propagation among people with compromised immune system. This fact has encouraged researchers to explore alternative methods to obtain novel pharmaceutical compounds.
The results from this project reveal that this specific Swedish mushroom is able to inhibit growth of P. aeruginosa in vitro. Preparative HPLC data suggest that isolation of this specific compound(s) has been possible but brings up the question whether more than one compound is produced. Considering the UV-spectra and UPLC chromatogram we can get an overview of possible chemical structure. For instance, strong UV peaks at 260 and 210 nm might give some information about the overall absorption of the compound. On the other hand, Mass Spectrometry data also suggests that either the compound(s) has been degraded with time or two separate compounds have been isolated.
The next step will be to perform several alternative techniques such as IR spectroscopy, 2D-NMR, 13C-NMR and 1H-NMR in order to get a clearer picture of the possible compound(s).
18
6. Acknowledgements I cannot be more thankful to all the people that have helped me accomplish this project.
I would like to give a special thank you to my supervisors Charlotta Sundin and Caroline Zetterström for all the patience and assistance in the biology section of my project and analysis of the data in Excel.
Sara Spjut for giving me guidance interpreting LC/MS data.
Weixing Qian and Marcus Carlsson part of the LCBU group, for finding time to explain how UPLC, HPLC, prep HPLC and LC/MS machines work.
Rémi Caraballo and Michael Saleeb for all the discussions about Chemistry.
Finally, I would like to thank Mikael Elofsson not only accepting me in his lab group but contributing in the discussion meetings to interpret the data.

19
7. References Aminov, Rustam I. 2010. A brief history of the antibiotic era: lessons learned and. 08 December 2010.
Ana M. Calvo, Richard A. Wilson, Jin Woo Bok and Nancy P. Keller. 2002 . Relationship between Secondary Metabolism and Fungal Development. Microbiol Mol Biol Rev. September, 2002 , 66(3): 447–459.
Anis Ben Haj Khalifa, Didier Moissenet, Hoang Vu Thien, Mohamed Khedher. 2011. Virulence factors in Pseudomonas aeruginosa: mechanims and modes of regulation. Ann. Biol. Clin. 2011, pp. 69(4): 393-403.
Demain AL, Fang A. 2000. The natural functions of secondary metabolites. Adv Biochem Eng Biotechnol. . 2000, 69:1-39.
Drenkard, Eliana. 2003. Antimicrobial resistance of Pseudomonas aeruginosa biofilms. Microbes and Infection . 2003, pp. 1213–1219.
F.C., Tenover. 2006. Mechanisms of antimicrobial resistance in bacteria. Am J Infect Control. June, 2006, 34(5 Suppl 1):S3-10; discussion S64-73.
Hancock, Shaan L. Gellatly Robert E.W. 2013. Pseudomonas aeruginosa : new insights into pathogenesis and host defenses . Pathog. Dis. 8 April 2013, pp. 159-173.
Harvey, A. 2000. Strategies for discovering drugs from previously unexplored natural products. . Drug Discov. Today. 2000, pp. 5, 294–300.
Hatvani, N. 2001. Antibacterial effect of the culture fluid of Lentinus edodes mycelium grown in submerged liquid culture. Int. J. Antimicrob. 2001, pp. 71-74.
Hauser, Alan R. 2009. The type III Secretion System of Pseudomonas aeruginosa: Infection by Injection. Nat Rev Microbiol. September 2009, pp. 654-665.
Josefine Enman, David Hodge, Kris A. Berglund and Ulrika Rova. 2008. Production of the Bioactive Compound Eritadenine by submerged Cultivation of Shiitake (Lentinus Edodes) Mycelia. J. Agric. Food Chem. 2008, pp. 56, 2609-2612.
Josefine Enman, Ulrika Rova and Kris A. Berglund. 2007. Quantification of the Bioactive Compound Eritadenine in Selected Strains of Shiitake Mushroom (Lentinus edodes). J. Agric. Food Chem. 2007, 55, 1177-1180.
Kristi A. Traugott, Pharm.D., Kelly Echevarria, Pharm.D., Pamela Maxwell, Pharm.D., Kay Green, B.S., and James S. Lewis, II, Pharm.D. 2011. Monotherapy or Combination Therapy? The Pseudomonas aeruginosa Conudrum. Pharmacotherapy . 2011, pp. 31(6):598–608).
Kuo-Hsiung Lee, Susan L. Morris-Natschke, Xiaoming Yang, Rong Huang, Ting Zhou, Shou-Fang Wu, Qian Shi, and Hideji Itokawa. 2012. Recent progress of research on medicinal mushrooms, foods, and other herbal products used in traditional Chinese medicine. J. Tradit. Complement Med. Apr-Jun 2012, pp. 84-95.
Lambert, P. A. 2001. Mechanisms of antibiotic resistance in Pseudomonas aeruginosa. J. R. Soc. Med. 27 November 2001, pp. (Suppl. 41): 22-26.

20
Maria José Alves, Isabel C. F. R. Ferreira, Inês Lourenço, Eduardo Costa, Anabela Martins and Manuela Pintado. 2014. Wild Mushroom Extracts as Inhibitors of Bacterial Biofilm Formation. Pathogens. 2014, pp. 3,667-679.
MARIA JOSÉ ALVES, ISABEL FERREIRA, JOANA DIAS4, VÂNIA TEIXEIRA4 , ANABELA MARTINS, MANUELA PINTADO. A review on antimicrobial activity of mushroom (Basidiomycetes) extracts and isolated compunds.
Marlies Galle, Isabelle Carpentier and Rudi Beyaert. 2012. Structure and Fucntion of the Type III Secretion System of Pseudomonas aeruginosa. Current Protein and Peptide Science. 2012, pp. 13, 831-842.
Pattar, Ch. Ramesh and Manohar G. 2010. Antimicrobial properties, antioxidant activity and bioactive compounds for six wild edible mushrooms of western ghats of Karnataka, India. Pharmacognosy. Res. Mar-Apr 2010, pp. 107-112.
Philip D. Lister, Daniel J. Wolter and Nancy D. Hanson. 2009. Antibacterial-Resistant Pseudomonas aeruginosa: Clinical Impact and Comples Regulation of Chromosomally Encoded Resistance Mechanisms. Clinical Microbiology reviews. October 2009, pp. 582-610.
S. Bentzmann, P. Plésiat. 2011. The Pseudomonas aeruginosa opportunistic pathogen and human infections. Environ. Microbio. July 2011, pp. 1655-65.
Sašo Jančič, Jens C. Frisvad, Dragi Kocev, Cene Gostinčar , Sašo Džeroski, Nina Gunde-Cimerman. 2016. Production of Secondary Metabolites in Extreme Environments: Food and Airborne Wallemia. 30 December 2016.
Ulrike Lindequist, Timo H. J. Niedermeyer, and Wolf-Dieter Jülich. 2005. The Pharmacological Potential of Mushrooms. Evid Based Complement Alternat Med. September, 2005, 2(3): 285–299.
Xiao, Jian-Jiang Zhong and Jian-Hui. 2009. Secondary Metabolites from Higher Fungi: Discovery, Bioactivity, and Bioproduction. Adv Biochem Engin/Biotechnol. 26 May , 2009, 113: 79-150.