extraction and analysis of pharmaceutical residues in - doras
TRANSCRIPT

Extraction and Analysis of Pharmaceutical Residues in
Environmental Samples using SPE with
LC-MS/MS.
John-Joseph Bones BSc.
Student No: 99542480.
Under the supervision of Prof. Brett Paull. School of Chemical Sciences.
A thesis submitted to Dublin City University for consideration for the
degree of:
Doctor of Philosophy.
January 2007.
Table of Contents.
Section Page
(i) Declaration.
(ii) Abstract.
(iii) Acknowledgements.
(iv) A List of Publications & Conference Presentations.
(v) A List of Figures & Tables.
(vi) A List of Abbreviations Mentioned in the Text.
Pharmaceuticals and Personal Care Products - An
Emerging Class of Environmental Contaminants.
Introduction.
Sources of Pharmaceuticals in the Environment.
The Role of Drug Metabolism.
The Treatment of Wastewater.
The Behaviour of Pharmaceuticals in WWTPs.
Pharmaceutical Disposal and Landfill Leachate.
Environmental Processes and Fate of PPCPs.
Assessing the Ecotoxicology and Risk Posed by PPCPs.
PPCPs and Drinking Water.
Technologies for the Removal of PPCPs.
Prevention is Better than Cure.
References
2.0 A Review of the Analytical Approaches used for the
Determination of Pharmaceutical Residues in
Environmental Samples.
2.1 Introduction.
v
vi
vii
viii
xi
xxi

Sample Preparation.
Analytical Separation.
Selective Detection using Mass Spectrometry.
References
Development of Dual Gradient Monolithic HPLC for the
Determination of Pharmaceutical Residues in
Environmental Samples.
Introduction.
Experimental.
Results & Discussion.
Conclusions.
References
On-line Preconcentration of Pharmaceutical Residues
from Large Volume Water Samples using Short Reversed-
Phase Monolithic Cartridges Coupled to LC-UV-ESI-MS.
Introduction.
Experimental.
Results & Discussion.
Conclusions.
References
Column Switching Liquid Chromatography with
Atmospheric Pressure Chemical lonisation Mass
Spectrometry for the Determination of Zinc Pyrithione
and its Fate in the Aquatic Environment.
Introduction.
Experimental.
Results & Discussion.
Conclusions.
References
iii
Comparison of Monolithic and Sub 2pm Particle Packed
Columns - Application to the Determination of Drug
Contamination on Irish Euro Banknotes.
Introduction.
Experimental.
Results & Discussion.
Conclusions.
References
Using Environmental Analytical Data to Estimate Levels
of Community Consumption of Illicit Drugs and Abused
Pharmaceuticals.
Introduction.
Experimental.
Results & Discussion.
Conclusions.
References
Overall Conclusions & Future Research Direction.
Overall Conclusions.
Future Research Direction.

Declaration.
I hereby certify that this material, which I now submit for assessment on the
programme of study leading to the award of Doctor of Philosophy is entirely my
own work and has not been taken from the work of others, save and to the extent
that such work has been cited and acknowledged within the text of my work.
JU 'U n ~ossph ~orres, Sbdent Number: 99542580.
January 2007.

Abstract.
Pharmaceuticals and personal care products (PPCPs) have recently emerged as a
significant new class of organic micro-contaminants. Of recent years a number of
reports detailing the presence of PPCPs in a variety of environmental matrices and
compartments have been published in the peer-reviewed literature. However, in
Ireland very little research has been conducted to determine the level of
environmental contamination due to the presence of drug residues.
The primary focus of this research is to develop suitably sensitive analytical
methods for the determination of residual PPCP contamination based upon solid
phase extraction (SPE) and liquid chromatography mass spectrometry (LC-MS).
Monolithic silica based stationary phases were used for the development of high
performance liquid phase separations of common pharmaceuticals, the antifouling
and anti-dandruff agent zinc pyrithione and a range of illicit drugs and abused
pharmaceuticals. As a pre-requisite to all the developed methods, a SPE sample
enrichment procedure was also developed focusing upon either off-line formats
using modern hydrophilic lipophilic balanced polymeric phases or the use of
column switching, whereby short reversed-phase monolithic micro-columns were
applied as suitable traps for on-line preconcentration. Method performance data for
all the developed methods were also determined and analytical detection limits
were found to lie in the n g ~ - ' range. The developed methods were applied for the
determination of the selected analytes in environmental aquatic samples.
This research was funded by the Irish Council for Science Engineering and
Technology (IRCS E T) under the Embark initiative, grant reference: RS/2003/6.

Acknowledgements.
This research was supported financially by the Irish Research Council for Science,
Engineering and Technology under the Embark Initiative, without which the project
would not have been possible.
Sincere thanks to my supervisor, Prof. Brett Paull for his unending encouragement,
guidance and patience over the past three years. I would also like to thank Brett for
providing me with the opportunity to travel to numerous domestic and major
international conferences over the course of my postgraduate studies. Thanks also
to Dr. Kevin Thomas of NlVA for his input and suggestions and for his hospitality
expressed to us when visiting NlVA in Oslo.
A big thank you to the technical staff within the School of Chemical Sciences, in
particular to Maurice for sorting out all instrumental problems encountered, to
Veronica for her help regarding documentation and licensing and to Mary and
Ambrose for all their help with orders and supplies over the past three years.
Thanks also to all the friends I have made and the great people I have met over the
course of my postgraduate studies, to Cepta, Eadaoin, Edel, Colman, Leon and
John. Thanks guys for the chats and laughs.
Finally thanks to my parents Sean and Mary and the rest of my family for being the
best anyone could wish for.
Thanks to you all.

,Poster Presentations:
J. Bones, K.V. Thomas and 6. Paull, "Development of Analytical Methods for the
Determination of Pharmaceutical Residues in the Environment", presented at:
Royal Society of Chemistry Analytical research Forum 2004, University of
Central Lancashire at Preston, July 1 gth to 21St 2004.
The Third Biennial Conference on Analytical Science in Ireland, University
College Cork, September gth/l oth 2004..
The Second Annual National Symposium of the lrish Research Council for
Science, Research and Technology, Croke Park Dublin, 2"d November 2004.
J. Bones and 6. Paull, "Dual Gradient Monolithic HPLC for the Routine Analysis of
Pharmaceuticals in Environmental Samples", presented at:
Environ 2005, lnstitute of Technology Sligo, January 28th to 31St 2005.
Pharmaceuticals in the Environment; Fate, Effects and Regulation, Society of
Chemistry and Industry, London, 1" March 2005.
J. Bones, P.N. Nesterenko and 6. Paull, "Online Solid Phase Extraction and Dual
Gradient Monolithic LC-MS for the Determination of Pharmaceuticals in the
Environment", presented at:
HPLC 2005, Stockholm, Sweden, June 27th to June 3oth 2005.
The Royal Society of Chemistry Analytical Research Forum 2005, University of
Plymouth, July 18'~ to 2oth 2005.
The Third Annual National Symposium of the lrish Research Council for
Science, Research and Technology, Croke Park Dublin, 3rd November 2005.
J. Bones, P.N. Nesterenko, K.V. Thomas and 6. Paull, "Determination of Zinc
Pyrithione in Environmental Samples using Online Solid Phase Extraction with LC-
APCI-MS"l presented at:
The Fourth Biennial Conference on Analytical Science in Ireland, Dublin
lnstitute of Technology at Kevin Street, April 1 1 ~ ~ 1 1 2 ~ ~ 2004.

J. Bones, P.N. Nesterenko, K.V. Thomas and B. Paull, "A Simple and sensitive
Method for the Determination of Zinc Pyrit-hione in Environmental SamplesJ',
presented at:
HPLC 2006, San Francisco, USA, June lgth to June 23rd 2006.
J. Bones, P.N. Nesterenko, K.V. Thomas and B. Paull, "Column Switching LC/LC-
APCI-MS for the Determination of Zinc Pyrithione and its Fate in Environmental
Waters", presented at:
= The Royal Society of Chemistry Analytical Research Forum 2006, University
College Cork, July 1 7th to 1 gth 2006.

A List of Figures & Tables.
Fiqures:
Figure
Number Caption
Peer reviewed articles published within the period of 1995 to 2006
concerning pharmaceuticals in the environment, (see footnote on
previous page for further information).
Possible sources and entry pathways of human and veterinary
pharmaceuticals into the environment.
The metabolism of the non steroidal anti-inflammatory drug
diclofenac by Phase I & II reactions.
An overview of wastewater treatment.
Schematic of the environmental risk assessment process.
The four steps of solid phase extraction.
Typical breakthrough curve for SPE sorbent.
Hypothetical chromatographic separation.
A pictorial representation of band broadening mechanisms.
Dual head reciprocating pump.
Schematic of UV detector.
The mechanism of electrospray ionisation.
The mechanism of atmospheric pressure chemical ionisation.
The quadrupole mass analyser.
The ion trap mass analyser.
The time of flight mass analyser.
Optimised MeOH gradient separation of 19 pharmaceuticals on 20
cm reversed-phase silica monolithic column (pH 3.0 formic acid).
Peak identification: 1 Paracetamol; 2 Trimethoprim; 3 Caffeine; 4
Salicylic acid; 5 o-Toluic acid; 6 Clotrimazole; 7 2-Naphthoic acid,
(internal standard); 8 Ketoprofen; 9 Clofibric acid; 10 Naproxen; 11
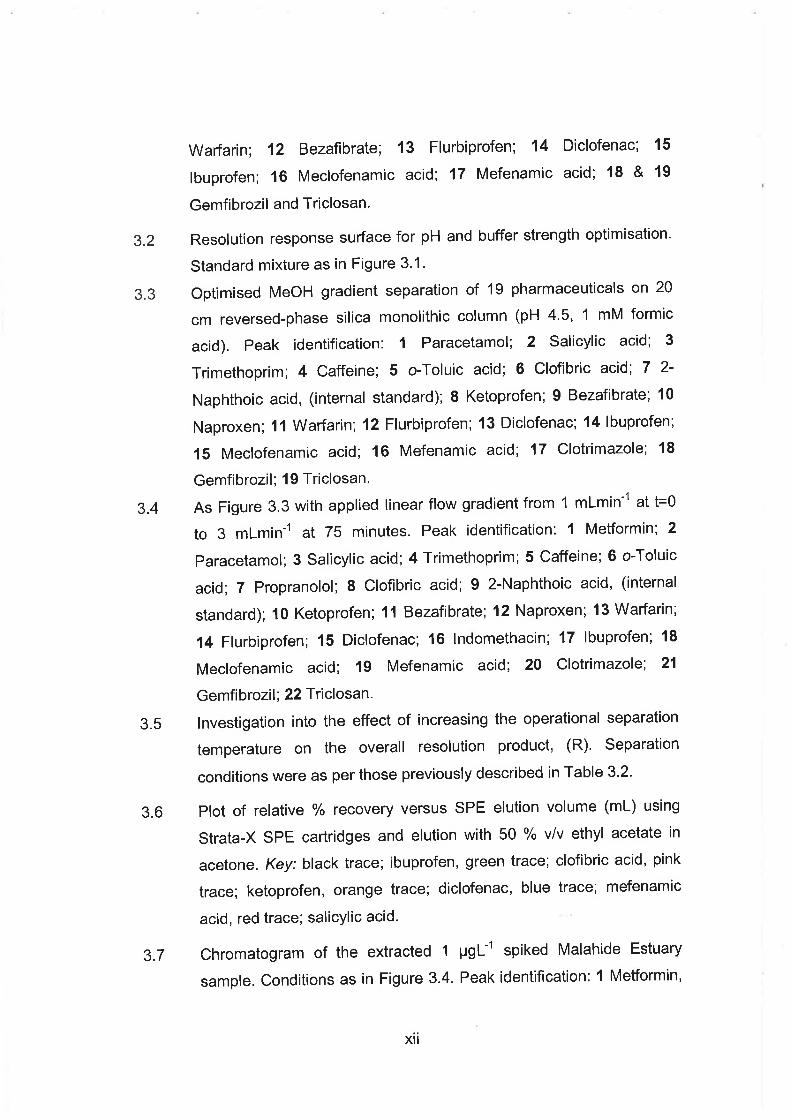
Warfarin; 12 Bezafibrate; 13 Flurbiprofen; 14 Diclofenac; 15
Ibuprofen; 16 Meclofenamic acid; 17 Mefenamic acid; 18 & 19
Gemfibrozil and Triclosan.
3.2 Resolution response surface for pH and buffer strength optimisation.
Standard mixture as in Figure 3.1.
3.3 Optimised MeOH gradient separation of 19 pharmaceuticals on 20
cm reversed-phase silica monolithic column (pH 4.5, 1 mM formic
acid). Peak identification: 1 Paracetamol; 2 Salicylic acid; 3
Trimethoprim; 4 Caffeine; 5 o-Toluic acid; 6 Clofibric acid; 7 2-
Naphthoic acid, (internal standard); 8 Ketoprofen; 9 Bezafibrate; 10
Naproxen; 11 Warfarin; 12 Flurbiprofen; 13 Diclofenac; 14 Ibuprofen;
15 Meclofenamic acid; 16 Mefenamic acid; 17 Clotrimazole; 18
Gemfibrozil; 19 Triclosan.
3.4 As Figure 3.3 with applied linear flow gradient from 1 mlminml at t=O
to 3 mlmin-' at 75 minutes. Peak identification: 1 MetFormin; 2
Paracetamol; 3 Salicylic acid; 4 Trimethoprim; 5 Caffeine; 6 o-Toluic
acid; 7 Propranolol; 8 Clofibric acid; 9 2-Naphthoic acid, (internal
standard); 10 Ketoprofen; I I Bezafi brate; 12 Naproxen; 13 Warfarin;
14 Flurbiprofen; 15 Diclofenac; 16 Indomethacin; 17 Ibuprofen; 18
Meclofenamic acid; 19 Mefenamic acid; 20 Clotrimazole; 21
Gemfibrozil; 22 Triclosan.
3.5 Investigation into the effect of increasing the operational separation
temperature on the overall resolution product, (R). Separation
conditions were as per those previously described in Table 3.2.
3.6 Plot of relative % recovery versus SPE elution volume (mL) using
Strata-X SPE cartridges and elution with 50 % v/v ethyl acetate in
acetone. Key: black trace; ibuprofen, green trace; clofibric acid, pink
trace; ketoprofen, orange trace; diclofenac, blue trace; mefenamic
acid, red trace; salicylic acid.
3.7 Chromatogram of the extracted 1 pg~ ' l spiked Malahide Estuary
sample. Conditions as in Figure 3.4. Peak identification: 1 MetFormin,

2 Paracetamol, 3 Salicylic acid, 4 Trimethoprim, 5 Caffeine, 6 o-Toluic
acid, 7 Propranolol, 8 Clofibric acid, 9 2-Naphthoic acid, (internal
standard, 10 Ketoprofen, 11 Bezafibrate, 12 Naproxen, 13 Warfarin,
14 Flurbiprofen, 15 Diclofenac, 16 Indomethacin*, 17 Ibuprofen, 18
Meclofenamic acid, 19 Mefenamic acid, 20 Clotrimazole*, 21
Gemfibrozil*, 22 Triclosan, 23 Ivermectin*, (*Actual spiking level: 2
P P ~ ) .
3.8 Partial contour plot of spiked Malahide estuary sample,
distinguishable UV spectra can be obtained even for ultra trace
residues with sample preconcentration using SPE.
4.1 On-line SPE experimental set-up.
4.2 Standard separation of chosen pharmaceuticals. Peak identification:
1; MetFormin, 2; Atenolol, 3; Salbutamol, 4; Acetaminophen, 5;
Amoxicillin, 6; Salicylic acid, 7; Trimethoprim, 8; Sulfamethazine, 9;
Sulfamethoxazole, 10; Caffeine, 11 ; Ciprofloxacin, 12; Furosemide,
13; Propranolol, 14; Clofibric acid, 15; Carbamazepine, 16;
Ketoprofen, 17; Bezafibrate, 18; Nimesulide, 19; Naproxen, 20;
Fluoxetine, 21; Warfarin, 22; Flurbiprofen, 23; Diclofenac, 24;
Indomethacin, 25; Ibuprofen, 26; Meclofenamic acid, 27; Mefenamic
acid, 28; Clotrimazole, 29; Gemfibrozil, 30; Triclosan, 31; Ivermectin.
The blue trace is offset by 2.5 minutes in time and 5 mAU, the red
trace is offset by 5 minutes in time and 10 mAU for the purposes of
clarity, separation conditions as per Table 3.1.
4.3 Extraction column backpressure generated at various flow rates of
Milli-Q water.
4.4 Matrix removal using MeCN washes; (A) depicts the determination of
the % MeCN required for the removal of the sample matrix. (B)
depicts the removal of the preconcentrated matrix under the chosen
isocratic solvent wash conditions (1 0% MeCN).
4.5 On-line SPE wash development, depicting the effect of the matrix
removal wash procedure upon the retention of the analytes on the
xiii
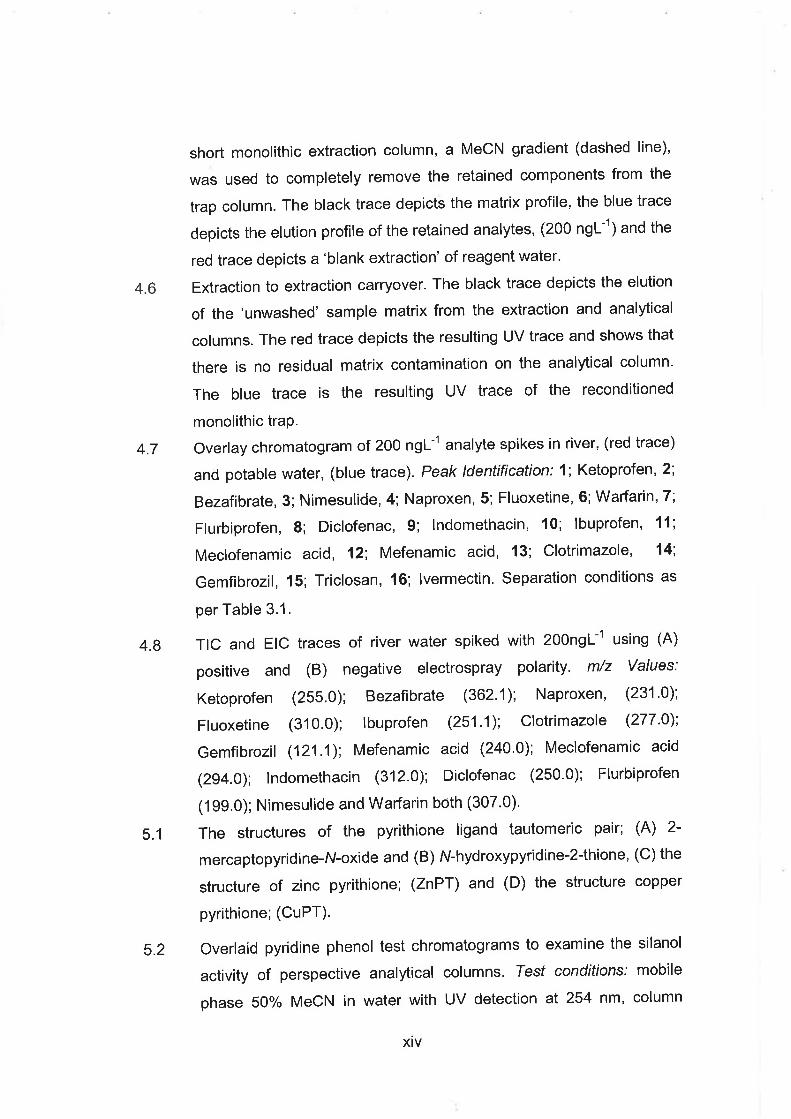
short monolithic extraction column, a MeCN gradient (dashed line),
was used to completely remove the retained components from the
trap column. The black trace depicts the matrix profile, the blue trace
depicts the elution profile of the retained analytes, (200 n g ~ ~ ' ) and the
red trace depicts a 'blank extraction' of reagent water.
4.6 Extraction to extraction carryover. The black trace depicts the elution
of the 'unwashed' sample matrix from the extraction and analytical
columns. The red trace depicts the resulting UV trace and shows that
there is no residual matrix contamination on the analytical column.
The blue trace is the resulting UV trace of the reconditioned
monolithic trap.
4.7 Overlay chromatogram of 200 ngLbl analyte spikes in river, (red trace)
and potable water, (blue trace). Peak Identification: I; Ketoprofen, 2;
Bezafibrate, 3; Nimesulide, 4; Naproxen, 5; Fluoxetine, 6; Warfarin, 7 ;
Flurbiprofen, 8; Diclofenac, 9; Indomethacin, 10; Ibuprofen, 11;
Meclofenamic acid, 12; Mefenamic acid, 13; Clotrimazole, 14;
Gemfibrozil, 15; Triclosan, 16; Ivermectin. Separation conditions as
per Table 3.1.
4.8 TIC and EIC traces of river water spiked with 200ngL-I using (A)
positive and (B) negative electrospray polarity. m/z Values:
Ketoprofen (255.0); Bezafibrate (362.1); Naproxen, (231.0);
Fluoxetine (31 0.0); Ibuprofen (251 1 ) Clotrimazole (277.0);
Gemfibrozil (121.1); Mefenamic acid (240.0); Meclofenamic acid
(294.0); lndomethacin (312.0); Diclofenac (250.0); Flurbiprofen
(199.0); Nimesulide and Walfarin both (307.0).
5.1 The structures of the pyrithione ligand tautomeric pair; (A) 2-
mercaptopyridine-N-oxide and (B) N-hydroxypyridine-2-thione, (C) the
structure of zinc pyrithione; (ZnPT) and (D) the structure copper
pyrithione; (CuPT).
5.2 Overlaid pyridine phenol test chromatograms to examine the silanol
activity of perspective analytical columns. Test conditions: mobile
phase 50% MeCN in water with UV detection at 254 nm, column

temperature 40°c, concentrations; 0.5 pLrnL-' pyridine and 4 mgmL-'
phenol. Peak Identification: I Phenol, 2, Pyridine.
5.3 The effect of stationary phase metal contamination upon ZnPT, the
bottom trace depicts a 20 m g ~ - ' ZnPT injection prior to washing the
stationary phase with dipicolinic acid, the upper trace depicts an
injection of the same 20 m g ~ - ' standard ZnPT solution after washing
the stationary phase with dipicolinic acid. The MeOH gradient used is
depicted by the black line, TR ZnPT = 16.60 minutes.
5.4 A 5 mgL-' injection of ZnPT on the Chromolith Performance RP-18e
monolithic column using the multi step gradient, TR ZnPT = 9.2
minutes.
5.5 5 mgL" ZnPT standard injections using LC-APCI-MS on the
Chromolith Performance RP18e monolithic column. The blue trace
was recorded using a mobile phase of methanol and 10 mM
ammonium acetate I acetic acid buffer pH 4.7, the red trace was
recorded using 10 mM ammonium acetate pH 6.5. The calculated
USP asymmetry value for the red trace was 0.95.
5.6 APCI-MS spectrum of ZnPT showing the [M+H]' pseudomolecular ion
at rnlz 31 7.0 and a decomposition product ion at mlz 221 . I . lnset A
shows the expanded isotopic pattern of the pseudomolecular ion and
lnset B depicts the theoretical isotopic patter as calculated by the
Sheffield Chemputer re-plotted using Microsoft ~ x c e l ~ ~ .
5.7 Proposed structure of the ion at rnlz 221.2 and the MSlMS daughter
ion at rnlz 11 1.2.
5.8 APCI-MS spectrum of CuPT showing the [M+H]+ pseudomolecular
ion at rnlz 316.0. lnset (A) shows the expanded isotopic pattern of the
pseudomolecular ion and lnset (B) depicts the theoretical isotopic
patter as calculated by the Shefield Chemputer re-plotted using
Microsoft ~ x c e l ~ ~ .
5.9 Optimisation of the APCl ionisation parameters, (A) corona voltage
optimisation and (B) APCl temperature optimisation, inserted y-error

bars are the standard deviation of the three replicate measurements.
Overlaid EIC rnlz 31 7.0 traces showing the degradation of ZnPT upon
its passage through the Merck sample pump at a flow rate of 6
mlmin-'.
Optimisation of the C18 extraction parameters, (A) the sample pH and
(B) the salt concentration. In each instance an increase in the %
recovery is observed with increasing pH and [NaCI].
1 pgL-I ZnPT spike in laboratory tap water depicting the matrix
interference even after the use of a solvent wash procedure.
Overlay of EIC mlz 316 trace depicting the extraction of 1 p g ~ - l ZnPT
using the Si-SAX-C18 tandem column.
EIC mlz 316 chromatogram depicting the extraction of 1 pgl-' ZnPT
from river water.
Overlaid EIC mlz 316 traces depicting minimal sample to sample
carryover on the analytical and extraction columns.
The effect of different copper salts upon the transchelation of ZnPT to
CuPT: extracted EIC rnlz 316 traces depicting a 1 pgL-' ZnPT extract
to which a 20 fold excess of CU" had been added, samples prepared
in river water.
The determination of ZnPT as CuPT in anti-dandruff shampoo
samples diluted in river water as a waste matrix. The blue trace
represents Dove Anti-Dandruff shampoo which contains 0.37% wlw
ZnPT, the concentration corresponding to the blue trace is -76 ngL-'.
The red trace represents Head and Shoulders Classic Clean
shampoo which contains 0.80% wlw ZnPT, the concentration
corresponding to the red trace is -80 ngl-'.
Overlaid EIC rnlz 316 traces for the analysis of the BCSS-1 extracted
and preconcentrated sediment phase and the BCSS-1 water phase.
Degradation of CuPT in filtered river water upon exposure to natural
sunlight under laboratory conditions.
(A) Plot of plate height (H) versus mobile phase linear velocity using
diazepam as the test analyte, (B) Plot of plate number (N) versus
mobile phase linear velocity and (C) Plot of plate number (N) versus
the generated backpressure on the 1.8 pm column (+), the 10 cm
monolithic column (m) and the 20 cm monolithic column (A).
6.2 Kinetic comparison of the examined stationary phases; (A) a plot of to
versus the pressure drop limited plate number (N), and (B) a plot of
the to based separation impedance Eo versus the ratio of pressure
drop limited plate number (N/Nopt). Symbols: 1.8 pm column (+), the
10 cm monolithic column (m) and the 20 cm monolithic column (A).
6.3 Minimum resolution response surface for the optimisation of the pH
and buffer concentration of the aqueous mobile phase. Experiments
were performed using a 1 mgL-' standard mixture of analytes.
6.4 Separation of a 1mgL-' standard solution of all analytes using a
multistep gradient of MeOH and 5 mM ammonium acetate, pH 4.5
on the 200.0 mm x 3 mm i.d. monolithic column at a flow rate of
0.35 m~min- ' using ESI-MSIMS detection. The traces have been
offset for the purpose of clarity. Peak identification, 1 morphine, 2
amphetamine, 3 MDMA, 4 benzoylecgonine, 5 ketamine, 6 heroin,
7 cocaine, 8 cocaethylene, 9 LSD, 10 EDDP, 11 papaverine, 12
methadone, 13 fluoxetine, 14 temazepam, 15 diazepam and 16 A'-
THC.
6.5 Resulting chromatograms from banknote analysis depicting; (A) the
presence of -24 ng of cocaine (blue trace) on a €5 note overlaid upon
the EIC mlz 304 trace for the un-circulated €5 note (red trace) and (B)
the presence of -20 ng cocaine and -4 ng of benzoylecgonine on a
€20 banknote, (blue and red traces respectively).
6.6 Graphical representation of cocaine contamination on the analysed
banknotes. The highest levels were detected on one €5 note and one
€20 note as labelled in the above figure. It can also be seen that the
levels of contamination are higher on the €20 and €50 notes than on
the €5 and €1 0 notes.
7.1 The structure of (A) the Phenomenex strata-x'" hydrophilic lipophilic
balanced polymeric sorbent, (B) the additional strong cation
xvii

exchange functionality of the strata-xcTM sorbent and (C) the weak
cation exchange functionality of the strata-XCW~ sorbent.
7.2 Plot of % relative recovery versus SPE elution volume using Strata-
XC SPE cartridges and elution with 5% vlv NH40H in 1:1 acetone
ethyl acetate. Key: black trace; methadone, blue trace; cocaine, red
trace; temazepam.
7.3 Extracted ion chromatograms for a 200 ngL-' mixed analyte spike
solution prepared in river water collected from the River Boyne. Peak
identification: 1 Morphine mlz 286 - m/z 268, TR 4.1 mins; 2 MDMA
rnlz 194 - mlz 163, TR 8.6 mins; 3 Benzoylecgonine rnlz 290 - rnlz
168, TR 9.7 mins; 4 Ketamine mlz 238 - mlz 220, TR 10.0 mins; 5
Cocaine mlz 304 - rnlz 182, TR 10.2 mins; 6 Cocaethylene mlz 31 8 -
rnlz 196, TR 11.5 mins; 7 LSD rnlz 324 - rnlz 223, TR 11.8 mins; 8
EDDP mlz 278 - rnlz 249, TR 12.5 mins; 9 Papaverine (Internal
Standard) rnlz 340 - rnlz 202, TR 13.9 mins; 10 Methadone mlz 31 0 -
rnlz 265, TR 16.8 mins; 11 Temazepam rnlz 301 - mlz 283, TR 17.9
mins; 12 Fluoxetine rnlz 301 - m/z 148, TR 18.3 mins; 13 Diazepam
mlz 285 - rnlz 257, TR 20.0 mins.
7.4 (A) The presence of ngL-' quantities of benzoylecgonine and cocaine
in the influent and effluent of the Ringsend Wastewater Treatment
Works, key: benzoylecgonine influent; red trace, benzoylecgonine
effluent; pink trace, cocaine influent; blue trace, cocaine effluent;
black trace, and (6) the presence of n g ~ - ' quantities of EDDP in the
treated effluent of the Navan Wastewater Treatment Centre.
Tables:
Table Caption
Number
3.1 Chemical structures of the pharmaceuticals and metabolites selected
for study.
3.2 Liquid chromatographic method parameters.

Dual gradient HPLC method performance data.
Sorbent selection performance data (calculated % recoveries).
Extraction repeatability and overall method precision calculated using
1 pg~ - l spikes in river water, (*actual spiking level was 2 vg~-') .
Overall method sensitivity data calculated in two different sample
matrices, (1 L extraction volume), values quoted are in vgL-'.
The chemical structures of the additionally included pharmaceuticals.
pK, and Log P data for the selected pharmaceutical analytes.
The effect of sample loading flow rate upon analyte recovery.
Analyte recovery as a function of sample pH.
Overall method sensitivity using on-line SPE.
Overall method precision and analyte recovery from two different
sample matrices, (n = 10).
Tuned ESI-MS method parameters, (optimisation was performed
using a nebuliser pressure of 55 psi, dry gas flow of 8 Lmin-' and a
drying temperature of 300°C).
Optimised ion focusing APCI-MS parameters for ZnPT, (the
optimisation was performed using a nebuliser pressure of 50.0 psi, a
dry gas flow of 10.0 Lmin-I, a drying temperature of 325OC, a corona
voltage of +3200 V and an APCl temperature of 500°C).
Online SPE LC-APCI-MS method performance data.
TOC and metal content of the two certified sediment samples.
Calculated concentrations of CuPT in the aqueous and sediment
phases after a 2 hour mixing period.
The chemical structures of the illicit drugs and abused
pharmaceuticals chosen for study.
Optimised ion focusing parameters for ESI-MSIMS detection, (the
optimisation was performed using a nebuliser pressure of 10.0 psi, a
dry gas flow of 3.0 Lmin" and a drying temperature of 300°C.
Spectra were collected over the range 50 - 600 mlz).
Selected product ion transitions for MSIMS monitoring.

6.4 Method performance data.
6.5 Banknote analysis.
7.1 Wastewater treatment plants sampled for the presence of illicit drugs.
7.2 pK, and Log P, (as theoretically calculated XLogP) data for the
selected illicit drugs and pharmaceutical analytes.
7.3 Initial sorbent selection investigations; calculated analyte recovery for
a 2 p g ~ - l mixed spike using the sorbents and conditions mentioned in
the text, (values quoted are mean recovery f standard deviation, n =
3).
7.4 Calculated analyte recovery for the optimisation of the elution
solvent.
7.5 Recovery data for extraction pH optimisation.
7.6 Method performance data for the developed SPE LC-MSIMS
procedure.
7.7 Concentrations (ng~- ' ) of illicit drugs detected in collected wastewater
and surface water samples.
7.8 Cocaine loads within the sampled wastewater treatment plants.
7.9 Estimated community consumption of cocaine within the catchments
served by the sampled wastewater treatment plants.

A List of Abbreviations Mentioned in the Text.
APCl
BOD
CE
CuPT
DC
DDD
DOC
DOM
EDDP
EIC
EMEA
EPA
ERA
ESI
EtOAc
EU
FA
FePT
GAC
GC
GC-MS(1MS)
GREAT-ER
HPLC
HPTLC
IC
ICP
IMB
Atmospheric Pressure Chemical lonisation
Biochemical Oxygen Demand
Capillary Electrophoresis
Copper (11) Pyrithione
Direct Current Potential
Defined Daily Dose
Dissolved Organic Carbon
Dissolved Organic Matter
2-Ethyldine-I ,5-dimethyl-3,3-diphenyl pyrrolidine
Extracted Ion Chromatogram
European Medicines Evaluation Agency
Environmental Protection Agency, (Irish)
Environmental Risk Assesment
Electrospray lonisation
Ethyl Acetate
European Union
Formic Acid
Iron (Ill) Pyrithione
Granular Activated Carbon
Gas Chromatography
Gas Chromatography Mass Spectrometry, (tandem-MS)
Geography Referenced Regional Exposure Assessment Tool
for European Rivers
High Performance Liquid Chromatography or LC
High Performance Thin Layer Chromatography
Ion Chromatography
Inductively Coupled Plasma
Irish Medicines Board

IMO
IPA
IR
KD
Koc
Kow
LC
LC-MS(1MS)
LLE
LOD
LOEC
LOQ
LSD
MDMA
MEC
MeCN
MeOH
MES
MIPS
MnPT
MS
MSDS
MtBE
NADPH
NMR
NOEC
NOM
PAHs
PAPS
PEC
PNEC
International Marine Organisation
lsopropyl Alcohol
Infra-red Spectroscopy
Liquid-Solid Distribution Coefficient
Organic Carbon Partition Coefficient
Octanol Water Partition Coefficient
Liquid Chromatography or HPLC
Liquid Chromatography Mass Spectrometry, (tandem-MS)
Liquid-Liquid Extraction
Limit of Detection
Lowest Observed Effect Concentration
Limit of Quantitation
Lysergic Acid Diethylamide
3,4-Methylene Dioxy Methamphetamine
Measured Environmental Concentration
Acetonitrile
Methanol
Morpholino-Ethane Sulphonic Acid
Molecularly Imprinted Polymers
Manganese (11) Pyrithione
Mass Spectrometry
Material Safety Data Sheet
Methyl t-Butyl Ether
Nicotinamide Adenine Dinucleotide Phosphate
Nuclear Magnetic Resonance Spectroscopy
No Observed Effect Concentration
Natural Organic Matter
Polynuclear Aromatic Hydrocarbons
3'-Phosphoadenosine-5'-Posphosulphate
Predicted Environmental Concentration
Predicted No Effect concentration
Parts Per Billion, (CIg~-l)

PPCPs
P P ~
QsQ QSAR
RF
RSD
SPE
TD
TFA
A'-TH c TIC
ToF
TRlS
UDP
uv VWD
WWTP
ZnPT
Pharmaceuticals and Personal Care Products
Parts Per Trillion, (ng~-I)
Triple Quadrupole Mass Analyser
Quantitative Structural Activity Relationship
Radio Frequency
Relative Standard Deviation, (%)
Solid Phase Extraction
Thermal Desorption
Trifluoroacetic Acid
A'-~etrahydrocannabinol
Total Ion Current Chromatogram
Time of Flight Mass Analyser
Tris-(hydroxymethyl)-aminomethane
Uridine Diphosphate
Ultra Violet
Variable Wavelength Detector
Wastewater Treatment Plant
Zinc (11) Pyrithione
I .O Pharmaceuticals and Personal Care Products -
An emerging class of environmental pollutants.
1 . 1 Introduction:
Until relatively recently pharmaceuticals and personal care products (PPCPs),
enjoyed anonymity as an undiscovered class of environmental micro
contaminants. In 1985 Richardson and Bowron hypothesised that PPCPs may
indeed enter the aquatic environment as a result of either industrial or human
waste disposal to wastewater treatment plants (WWTPs) where they may
totally biodegrade, partially biodegrade or persist. Therefore, as a consequence
treated effluents that are discharged into receiving waters may contain residues
of pharmaceutical compounds [I ] . The concept that PPCPs may be present in
the environment was a new one. However, the presence of PPCPs in the
environment received little attention until the late 1990s and the advent of
sophisticated analytical instrumentation and methodologies capable of
detecting the ultra trace quantities of PPCPs likely to be present. Up to then
research focused on classes of pollutants that could be readily analysed with
confidence using traditional 'gold standard' gas chromatographic mass
spectrometric (GC-MS) methods such as polynuclear aromatic hydrocarbons
(PAHs), chlorinated organics and pesticides to name but a few [2]. The fact that
PPCPs reflect an emerging class of organic micro pollutants is clearly
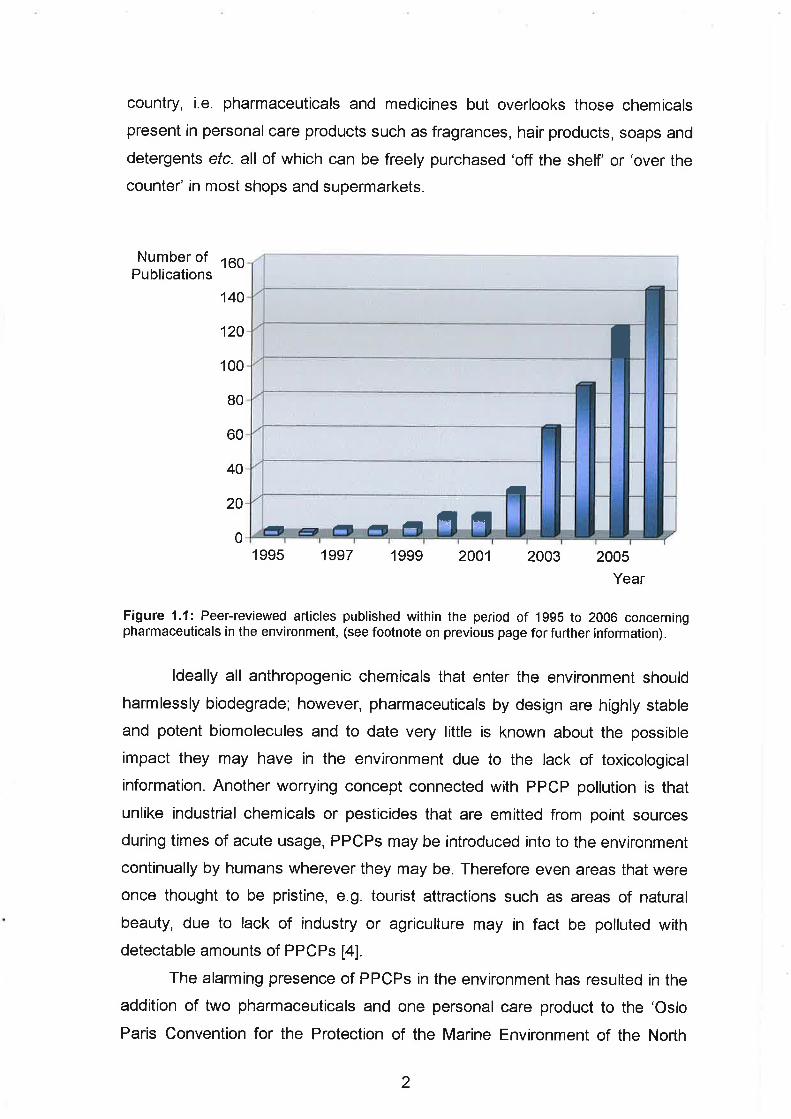
demonstrated by Fig. 1 .I, which depicts the number of peer-reviewed articles
concerning PPCPs in the environment published within the last decade'.
Pollution arising from PPCP presence presents an immense and
troubling problem. In Ireland alone there are -3,000 compounds licensed by the
Irish Medicines Board (IMB), for market and use as human and veterinary
medicines [3] and consequently each of these compounds along with their
range of metabolites may possibly enter the environment. This number of
-3,000 only accounts for compounds that require a license for sale in this
' Fig. 1 .I was constructed by searching for term 'Pharmaceutical* AND Environment' within the IS1 Web of Science 'Science Citation Index'. Returned results were screened for suitability. The search was last performed on 2oth December 2006; the database was last updated 16 '~ ~ecember 2006.
country, i.e. pharmaceuticals and medicines but overlooks those chemicals
present in personal care products such as fragrances, hair products, soaps and
detergents etc. all of which can be freely purchased 'off the shelf' or 'over the
counter' in most shops and supermarkets.
1995 1997 1999 2001 2003 2005
Year
Figure 1.1: Peer-reviewed articles published within the period of 1995 to 2006 concerning pharmaceuticals in the environment, (see footnote on previous page for further information).
Ideally all anthropogenic chemicals that enter the environment should
harmlessly biodegrade; however, pharmaceuticals by design are highly stable
and potent biomolecules and to date very little is known about the possible
impact they may have in the environment due to the lack of toxicological
information. Another worrying concept connected with PPCP pollution is that
unlike industrial chemicals or pesticides that are emitted from point sources
during times of acute usage, PPCPs may be introduced into to the environment
continually by humans wherever they may be. Therefore even areas that were
once thought to be pristine, e.g. tourist attractions such as areas of natural
beauty, due to lack of industry or agriculture may in fact be polluted with
detectable amounts of PPCPs [4].
The alarming presence of PPCPs in the environment has resulted in the
addition of two pharmaceuticals and one personal care product to the 'Oslo
Paris Convention for the Protection of the Marine Environment of the North

East Atlantic - OSPAR' priority chemical list [5]. The said pharmaceutical
substances are clotrimazole (antifungal agent) and diosgenin, (steroid
hormone); the personal care product is musk xylene, (synthetic musk present in
perfumes and fragrances). These substances were chosen due to their
persistence, ability to bioaccumulate and also their toxicity and rank as highly
as other pollutants such as heavy metals, organo halogens and biocides.
This section aims to present the reader with a concise review of current
knowledge concerning the occurrence, fate and effects of pharmaceutically
active compounds in the environment. Future prospects concerning the
removal and avoidance of PPCP pollution will also be presented.
1.2 Sources of Pharmaceuticals in the Environment:
The detection of a multitude of pharmaceutical compounds in the environment
posed the question of how such speciality compounds, specifically designed for
use in human and veterinary medical practice could end up in ground and
surface waters. When compared to other aquatic pollutants such as pesticide
residues, the entry of pharmaceuticals into the environment depends on a
number of integral factors [6]. These factors include the overall pharmaceutical
consumption rate, the pharmacological fate of the drug within the body, the
behaviour of the drug during the wastewater treatment process and the ability
of the receiving water to provide adequate dilution [6,7,8]. Information
concerning each factor is important when attempting to predict which
pharmaceuticals may be present in the environment. Although it is
acknowledged that the treatment of wastewater provides the biggest
contribution to the environmental pharmaceutical load other sources including
landfill leachate and aquacultural processes may also play their part. Wastes
and effluents from pharmaceutical production are not, however, expected to be
significant emitters due to 'Good Manufacturing Practice' regulations that
require the manufacturing process to quantitatively account for all the
intermediates and products during a particular synthesis [9]. Possible sources
of entry of pharmaceutical compounds are visible in Fig. 1.2.

I Human Pharmaceuticals Veterinary Pharmaceuticals
Figure 1.2: Possible sources and entry pathways of human and veterinary pharmaceuticals into the environment, adapted from, [6].
1.3 The Role of Druq Metabolism:
Pharmacokinetics is the branch of pharmacology that describes the processes
affecting the absorption, distribution, metabolism and elimination of
pharmaceutically active compounds in the body [lo]. From the perspective of
PPCPs as environmental pollutants the most important pharmacokinetic
process is drug metabolism as it provides information as to whether:
A drug will be metabolised within the body or be excreted in an unchanged
form.
If metabolism does occur, the proportions that will be excreted as parent
molecule and metabolites.
The types of metabolites that might be expected, i.e. which metabolic
pathway dominates.
An important aspect of drug design is that of drug delivery, i.e. ensuring
that the compound arrives at the desired site in the desired form to evoke its
pharmacological effect. In order to cross cell membranes, pharmaceuticals
must possess sufficient lipophilicity and consequently the primary function of
drug metabolism is to transform these lipophilic compounds into more polar

metabolites that are suitable for elimination and excretion primarily through the
kidneys via the urine [ I I ] .
Metabolism is an enzymatic process and involves transformation of the
compound via Phase I and Phase II reactions. Phase I processes involve the
functionalisation of the parent molecule in preparation for Phase II processes to
occur and normally consists of the addition or activation of a reactive functional
group on the parent molecule. Typical Phase I processes include oxidation,
reduction, hydrolysis, hydration or dealkylation [ I 21. These reactions are
predominantly governed by cytochrome P450 microsomal oxidase enzymes
located in the endoplasmic reticulum of cells and require the presence of
cofactors such as nicotinamide adenine dinucleotide phosphate (NADPH).
Phase II processes involve the conjugation of an extremely polar moiety to the
Phase I product leading to a hydrophilic drug conjugate that is readily removed
by Glomerular filtration in the kidney. Typical conjugates include sugars or
glucuronides, sulphate, amino acids, glutathione or acetyl groups [12]. A
diverse group of enzymes regulate Phase II reactions individual to the
conjugate, e.g. sulphotransferases, glucuronyltransferases etc. each requiring
its own individual cofactor such as 3'phosphoadenosine-5'-phosphosulphate
(PAPS), or uridine diphosphate (UDP), respectively [12]. An example of Phase I
& II processes is depicted in Fig. 1.3 [I I ] .
Phase I , Phase I1 Conlugat~on Hydroxylation
HO
D~clofenac 4'Hydroxy D~clofenac Glucuronide
Figure 1.3: The metabolism of the non steroidal anti-inflammatory drug diclofenac by Phase I & I I reactions, adapted from [I I].
As demonstrated by Fig. 1.3 most pharmaceuticals are metabolised into
a certain array of metabolites. However, the process becomes considerably
more complicated as the enzymes involved in the metabolic reactions may be
induced or inhibited by other chemicals to which a person may be exposed to
either intentionally, accidentally or unknowingly through daily life [13]. Induction
will increase elimination rates whilst conversely inhibition will reduce the rate of

elimination and promote retention of the parent compound within the body.
Therefore, prediction of the most prominent form likely to be encountered in the
environment is made increasingly difficult.
While the primary function of metabolism is to remove pharmaceutical
compounds from the body, conversion by Phase I & II reactions may yield two
ultimate outcomes. The first and more favourable of these is that the drug in
question is rendered pharmacologically inactive and therefore, should it enter
the environment it should be no major cause of concern. The second more
worrying scenario is that metabolism converts the pharmaceutical compound
into a more potent or toxic form, (through either pro-drug activation or parent
compound conversion). Examples of more potent metabolites include the
conversion of codeine and heroin into morphine whilst common drugs used in
high quantities such as paracetamol are know to have highly toxic metabolites
such as N-acetyl-p-benzo quinone imine [ I I ] .
1.4 The Treatment of Wastewater:
In the course of everyday life human activity consumes large quantities of
water. The discharge from households and industry into drains and sewers is
referred to as wastewater. Wastewater is on average >99.9% spent water with
the other 0.1% comprising of dissolved and suspended solids [14]. The actual
composition of wastewater is highly variable, however, likely components
include micro organisms including pathogens, organic material, inorganic
nutrients such as nitrogen and phosphorous compounds and metals [15]. Each
of these components may exhibit their own unwanted effects if wastewater
were discharged directly into ground and surface waters. Therefore, in an
attempt to reduce the threat of pollution wastewater usually receives some form
of treatment before final discharge into the environment. In Ireland the
treatment of wastewater is governed by the Environmental Protection Agency
Act of 1992 and more so by the 'Urban Wastewater Treatment Regulations
1994' passed to enact into Irish law EU directive 911271EEC [16]. Under Section
85 of the 1992 Act, discharges to sewers must be monitored and are licensed
under the Integrated Pollution Control system to protect the receiving treatment
plant and the general aquatic environment in the long run [16]. A schematic of
wastewater treatment processes is depicted in Fig. 1.4.
Preliminary Treatment
Primary Secondary Treatment Tertiary Treatment Treatment and Disinfection
through screens and into holding tank
,I -%i Tank
Removal 1 Refeed
I
I Sludge Treatment
Figure 1.4: An overview of wastewater treatment, adapted from [14].
Wastewater treatment is a stepwise process of physical, biological and
chemical means designed to remove the aforementioned wastewater
components and protect the effluent receiving water body. Physical processes
are usually involved in the preliminary and primary treatment stages.
Preliminary treatment involves the filtration of influents to remove debris and
large particles. The screened influent then passes into holding basins where
the wastewater is held for sufficient periods of time to allow solids to settle to
the bottom of the basin while organic matter such as oils, fats and greases float
to the top. Solids may settle out in a variety of ways depending on their physical
properties, i.e. size and density, formation of associated masses of particles or
compression; whereby settling particles drag other dissolved solids downwards
[16]. Both layers can then be physically removed before the next process
occurs.
Biological treatment of wastewater occurs during the secondary stage, a
process that is generally referred to as activated sludge treatment. Activated
sludge consists of a complicated ecosystem of micro organisms ranging from
heterotrophic and facultative bacterial species of Achromobacter, Arthrobacter,
Citromonas, Flavobacterium, Nitrobacter, Nitrosomonas and Pseudomonas to
higher protozoa such as Amoeba, Opercularia and Trachelophyllum and also
rotifers and nematodes [ I 71. Activated sludge treatment involves the mixing of a

concentrated microbial population with wastewater under aerobic conditions, in
order to provide both oxygen and a carbon source necessary for microbial
respiration. Such conditions encourage high rates of microbial growth and
consequently increased rates of microbial respiration leading to a reduction in
the quantity of organic matter present within the wastewater [17]. Bacteria
account for the highest proportion of microbes within the sludge and as
bacterial cells grow they may produce a slime layer surrounding the cell wall.
The slime layer imparts an absorptive surface onto the bacterial cell allowing for
the formation of flocculated agglomerations of microbes, commonly referred to
as 'flocs' [18]. The forming floc surface also absorbs colloidal and suspended
matter; ionic substances may also be absorbed due to interaction with
oppositely charged biomolecules within the bacterial cell wall [17]. Activated
sludge treatment is a dynamic process as bacteria within a floc assimilate and
utilise the adsorbed material, therefore producing free sites on the surface of
the floc capable of adsorbing more and more of the wastewater matrix.
However, a crucial factor is the treatment time, (or the hydraulic retention time)
spent within the aeration tank in order to allow sufficient microbial activity; if the
treatment time is not long enough, little organic material will be removed. The
ecological make up of activated sludge is another important factor in
maintaining a viable process. Protozoa species ,aid with treatment process by
feeding off the bacterial populations thereby preventing the bacteria from
reaching excessive lag phase numbers. Protozoal feeding also helps with the
removal of suspended matter [17]. The final process involved with sludge
treatment is clarification, i.e. liquid solid separation; the flocculated biomass is
allowed to settle out of solution yielding a clarified effluent [16]. The effluent
may then by subjected to tertiary treatment or be discharged into a receiving
water body. The remaining sludge is either reintroduced, into the aeration tank
as bacterial innoculum or is itself inactivated and disposed [16].
Tertiary treatment of wastewater may be physical or chemical in nature.
The objective of tertiary treatment processes is to remove non biodegradable
organic materials, metals and nutrients present even after the primary and
secondary processes. Chemical methods are used for the removal of
eutrophication nutrients, i.e. nitrates and phosphates. Phosphates can be
precipitated out of solution by the addition of calcium or iron [18], while nitrates
can be converted to volatile ammonia at high pH which is easily purged from

solution by aeration. Nitrates may also be reduced at low pH to nitrogen gas or
nitrous oxides [ I 81. Disinfection to inactivate any residual microbes, particularly
pathogens may also be required and practices such as chlorination may also
aid with the removal of some pharmaceuticals [19,20,21,22]. Non-
biodegradable organics may be subjected to advanced oxidation using ozone,
whilst metallic elements maybe precipitated out of solution by reaction with an
appropriate chelating agent [23]. Physical methods such as UV radiation may
also be used for non biodegradable organic removal.
An important parameter for determining the performance of the
treatment process is a measurement of the dissolved oxygen concentration of
the wastewater influent and effluents. The most common measurement
performed is that of biochemical oxygen demand (BOD) which measures the
quantity of oxygen required by microbes for organic matter consumption [16].
Each treatment stage is designed to reduce the BOD of the wastewater with the
highest proportion as expected being removed by the activated sludge process.
The more efficient the treatment process, the lower the expected BOD of the
effluent.
1.5 The Behaviour o f Pharmaceuticals in WWTPs:
Richardson and Bowron proposed three possi,ble outcomes for pharmaceutical
compounds during the treatment of wastewater [I]; mainly full degradation or
partial degradation or persistence and discharge into the receiving environment
with the treated effluents. The two most probable means for- the removal of
pharmaceuticals in wastewater treatment plants include microbial degradation
either to produce compounds of lower molecular weight or ideally complete
metabolism into C02 and H20, or the sorption of pharmaceuticals to particles
and solid matter that can be removed by filtration or settling [4].
In 1996, Rogers reviewed the behaviour of many classes of organic
contaminants including some pharmaceuticals in sewage sludge [24]. At the
time, information concerning the behaviour of pharmaceuticals was mostly
speculative due to lack of suitably sensitive analytical methods, however, it was
suggested that the presence of pharmaceutical compounds need not be a
cause of concern and it was acknowledged that many compounds, mostly
antibiotics, were readily biodegradable [24]. The occurrence and behaviour of

pharmaceuticals in wastewater treatment plants was further investigated by
Ternes in 1998 [25], who reported the presence of a multitude of drug residues
from many pharmacological classes in the influent, effluent and receiving water
of a municipal treatment plant near Frankfurt in Germany. By determining the
difference between the concentrations detected in the plant effluent and influent
the overall removal efficiency of the treatment process was estimated. It was
reported that on average r 60% of the detected drug residues were removed
however, some compounds showed particularly low removal, e.g. the
antiepileptic drug carbamazepine and clofibric acid, a metabolite of many lipid
lowering agents and these compounds were ubiquitously present in the aquatic
environment as a result [25]. Ternes also examined the presence and
behaviour of highly polar and ionic compounds used as x-ray contrast media in
the treatment plant and discovered that such chemicals were not removed
during treatment and passed freely through the plant contaminating the
receiving waters [26]. Other studies conducted have reported similar findings
both in the United ~ ingdom [27] and Spain [28]. Carballa et a/. focused upon
sampling at each stage of the treatment process in an attempt to ascertain
which treatment step provided the highest rate of removal, [28]. It was found
that the degree of hydrophobicity of the analyte was important as more non
polar compounds were observed to adsorb onto the primary and secondary
sludge with more polar analytes remaining in the water phase and therefore,
passing unhindered through the treatment plant [28]. Interestingly levels of
some compounds, e.g. 17P-estradiol, were observed to increase after
secondary treatment suggesting the cleavage of Phase II metabolites during
biological processes. Information regarding the behaviour and removal of
pharmaceutical compounds in wastewater treatment plants is of great
importance when attempting to estimate the loading of such compounds into
the environment. For example, Fischer and Borland estimate that between 15
to 30 tonnes of active pharmaceutical ingredients are released into the
environment surrounding Sydney, Australia on a yearly basis [29] due to the
insufficient treatment of wastes. With appropriate treatment these quantities
could be significantly reduced.
The microbial processes leading to the removal of pharmaceuticals
during wastewater treatment have not been fully investigated. Studies
conducted have shown that the microbiological usage of pharmaceutical

compounds as carbon or nitrogen sources for metabolism occurs only in the
absence of a primary substrate [30]. However, an equal probability exists that
microbes may show no preference and metabolise pharmaceuticals even in the
presence of a primary substrate depending on the affinity and resistance of the
microbes enzymes to such pharmaceuticals. The removal rate of some
pharmaceutical compounds in WWTPs is observed to increase with increased
residence time [27], possible explanations for such an observation include the
increased diversity of the microbial community with increasing sludge age or
the ability of microbes to respond to limiting organic carbon availability [31].
Sorption to filterable solids during wastewater treatment has received
more attention as it is generally a more understandable process than microbial
degradation. Pharmaceuticals present in the aqueous phase of a WWTP may
adsorb onto particulate and suspended material by hydrophobic interaction
between nonpolar moieties of the molecule and lipid rich cell membranes of
microbes or other agglomerations of fatty material on the sludge. Electrostatic
interactions between oppositely charged groups on the pharmaceutical and the
surface of microbes or particles may also be involved [31,32]. The distribution
of pharmaceuticals between the aqueous phase and the solid phase is an
equilibrium process, represented by solid water distribution coefficient; KD,
whereby;
(Eq. 1.1)
Csorbed and C,,,,o,, are the concentrations of pharmaceutical in the solid and
water phases respectively [32]. KD values allow for the prediction of whether a
substance will show appreciable adsorption or will preferentially remain in the
aqueous phase. KD values for several pharmaceuticals have been
experimentally investigated but found to be quite low thereby suggesting that
the drugs chosen would be expected to exhibit negligible adsorption and
therefore, microbial degradation plays a major part in the removal of
pharmaceuticals in actual treatment plants [33,34]. Another study performed by
Urase and Kikuta attempted to estimate both the sorption and degradation of
pharmaceuticals during activated sludge treatment [35]. They observed that the
pH of the sludge played an important role in determining whether drugs would
adsorb onto the sludge, however, microbial life would be eliminated under
acidic conditions and therefore, the use of acidic conditions is not feasible. A

theoretical model for the prediction of probable concentrations and subsequent
removal rates was described by Khan and Ongerth [36] for the 'Top 50'
prescribed pharmaceuticals in Australia. Parameters included within the model
included data on pharmaceutical quantities used, metabolic and excretory data,
chemical and physical properties for each compound and operating data for the
types of treatment plants involved. The model predicted that removal rates
ranging from 14% for the antibiotic roxithromycin to 99% for the
antihypertensive irbesartan.
Two other items which were observed to affect the behaviour of
pharmaceuticals during the treatment process were rainfall and the
infrastructure of the plant [25,37]. Ternes reported that the removal of several
pharmaceuticals, predominantly analgesics, was significantly reduced during
periods of increased rainfall [25]. It was also observed that the rate of removal
took several days to recover to its previous level. It was suggested that the
reasons for decreased pharmaceutical removal may include a reduction in
microbial activity or a change in the sorption and flocculation due to increased
fluid flow though the plant. Wolf et a/. investigated the effect of sewer
infrastructure in the German city of Rastatt and its role in the release of
pharmaceutical compounds to the environment [37]. High concentrations of
iodinated x-ray contrast media were detected in groundwater in the vicinity of
sewer pipes illustrating that significant leakage of untreated sewage was
occurring underneath the city and also that measurable quantities of
pharmaceutical compounds were being introduced to groundwater as a result.
lodinated x-ray contrast media were therefore suggested as an anthropogenic
maker species for monitoring the presence of untreated wastewater in
environmental waters.
1.6 Pharmaceutical Disposal and Landfill Leachate:
According to Slack et a/. approximately 60-7O0/0 of all municipal waste produced
in the developed world is disposed of in landfill sites [38] and up to 5% of such
wastes may contain hazardous materials originating solely from household use.
However, as there is no legal definition of what constitutes hazardous
household wastes and therefore, no enforced segregation procedures; it is
difficult to accurately predict the quantities of hazardous substances being

placed in landfill sites [38]. Slack et a/. conducted a survey in the United
Kingdom in order to gauge the amounts of hazardous materials held in
households and the disposal routes for such products including expired or
unused pharmaceuticals [38]. It was discovered in the case of pharmaceuticals,
the public did not understand that pharmaceuticals constituted a hazard or how
to safely dispose of such waste. Only 19% of expired or unused
pharmaceuticals were returned to pharmacies for proper disposal with -50%
being dumped in the bin and ultimately landfill and another -20% being flushed
down the toilet [38].
Emissions from landfill sites are normally gases, airborne particles or
more importantly leachate in the case of pharmaceutical pollution. Leachate is
expected to be complex and heterogeneous in composition depending on the
types of wastes disposed in the landfill, contain both inorganic and organic
constituents which pose a multitude of risks [39]. An important parameter in
leachate analysis is the quantity of dissolved organic carbon (DOC), as it
provides a surface for adsorption and also affects the mobility of metallic
elements [39].
The first report of pharmaceutical compounds in landfill leachate was in
1995 when Holm et a/. detected large amounts of sulphonamides, barbiturates
and phenazone type analgesics in leachate plumes and groundwater in the
vicinity of a landfill in Sweden that received both municipal waste and waste
from pharmaceutical production over the course of its lifetime [40]. It was also
observed that concentrations of the detected pharmaceuticals decreased with
increasing distance from the landfill site. Phenazone type analgesics were also
detected by Ahel and Jelicic in soils and groundwater below a Croatian landfill
site [41]. It was estimated that the landfill site could contain up to 800 kg of
phenazone and that such a level was adequate to maintain high levels of
phenazone compounds in the groundwater surrounding the landfill for more
than 100 years [41].
The design and upkeep of landfill sites is important in preventing the
introduction of pharmaceuticals into the environment through leachate. A study
of the organo-geochemical composition of seepage and leakage waters from a
landfill site was undertaken by Schwarzbauer et a/. using GC-MS [42]. More
than 180 individual organic compounds were identified, mostly acids or
molecules with polar groups. Pharmaceuticals detected in both seepage and

leakage water included ibuprofen, propylphenazone, clofibric acid and various
sulfonamides [42]. Of these compounds propylphenazone was quantified to
levels of 110-140 pg~ - ' . The study concluded that the organic character of
seepage water contained a mixture of natural and plant derived materials but
also significant quantities of xenobiotic compounds suitable as tracer molecules
for environmental contamination originating from landfill sites. A further study
was performed by the same group to test this hypothesis [43]. It was observed
that the selected marker species were indeed highly suitable for contamination
tracing with propylphenazone and the insect repellent N,N-diethyl toluamide
being detected in all samples taken surrounding the landfill site. It was also
found that the concentration of the selected marker species decreased with
increasing spatial distribution from the site. Sampling was performed at monthly
intervals over the space of a year in order to assess time dependence on the
concentration of the selected marker species. Only slight decreases were
observed with detected levels remaining rather stable suggesting that landfills
act as a constant source of pharmaceuticals into the environment.
1.7 Environmental Processes and Fate of PPCPs:
Once pharmaceutical compounds enter the environment the question exists as
to their fate, i.e. are they transported along the watercourse and diluted to such
levels whereby their presence becomes negligible, do they adsorb onto solids
and accumulate over time leading to increased concentrations, or are they
degraded or transformed into various other chemicals in the presence of
sunlight. Few studies have been undertaken in an attempt to answer such
questions but primary findings will be discussed in the following sections.
1.7.7 Environmental Transport:
Pharmaceuticals are predominantly introduced into the aquatic environment
with treated wastewater at levels in the ngL-' to the low pgL-I range; the dilution
of such residues, (and therefore, the dilution of the risk that they pose) depends
upon the volume of the receiving water body and its ability to adequately
disperse such chemicals. Ashton et al. investigated the introduction of drug
residues into surface water from treatment plants in the United Kingdom [44].
Samples of surface water were collected upstream and downstream of the

plant along with the discharged effluent. In four instances, pharmaceuticals
were detected prior to the treatment plant, the highest detection was the
analgesic ibuprofen at a level of 181 n g ~ ' . It was suggested that the detection
of drug residues before the plant indicates that these chemicals were
transported over a long range and therefore, have adequate stability to survive
in the aquatic environment [44]. A statistical analysis of the concentrations of
pharmaceuticals detected in the discharged effluent and receiving surface
water was also performed and it was found that a positive correlation existed
between the two, i.e. the levels of pharmaceuticals detected in surface water is
a 'diluted' reflection of the quantities present in effluent which in turn is a
reflection of overall usage of those particular pharmaceuticals [44].
Other studies conducted have also illustrated that pharmaceuticals can
undergo long range transport in the aquatic environment. Thomas and Hilton
detected fourteen pharmaceuticals in British estuaries of the Thames, the Tyne,
the Mersey, the Tees and Belfast Lough [45] and suggest that the detection of
pharmaceutical analytes in estuaries is a result of contaminated surface water
infiltration. Two separate studies were conducted to determine pharmaceutical
residues in the North Sea [46,47]. The North Sea is a particularly sensitive
water mass which accepts rivers from the United Kingdom, Norway, Sweden,
Denmark, Germany, Holland, Belgium and France. Clofibric acid was detected
in both studies; it was observed that a concentration gradient existed from the
mouth of certain rivers, in particular the Elbe, to the open sea and that levels
detected were relatively stable over a considerable period of time and
comparable with other "classic" pollutants such as Lindane [46,47].
A detailed study of the river Elbe in Germany was conducted by Wiegel
et a/. [48]. It was found that the river was heavily polluted with pharmaceutical
residues due to the large number of WWTPs discharging into the river.
Transport of pharmaceutical residues can be observed with increasing
concentrations being detected with distance from the rivers source to its exit;
-700 km [48]. Levels of clofibric acid were detected in the rivers plume into its
North Sea estuary and the authors conceded that the river is a significant
source of clofibric acid in to the monitored marine environment.
The stability of pharmaceuticals in the environment is significant
however, it is also acknowledged that due to a 'steady state' of introduction,
levels entering the environment are sufficient to replace those being removed

[49]. Pharmaceutical residues therefore, lend themselves as appropriate
marker species for tracking the transport and dilution of wastewater in the
environment [50].
I . 7.2 Photochemical Attenuation:
Knowledge concerning the fate of pharmaceutical compounds in the natural
environment is essential when attempting to quantify the risk that they pose.
Pharmaceuticals may be subject to both biotic processes, e.g. biological
transformation and abiotic processes e.g. hydrolysis, photolysis or sorption in
aquatic systems. Of the above processes, studies have shown that photolysis
of pharmaceutical compounds in aquatic systems is significantly more
important than other biotic and abiotic processes [51]. Two distinct pathways
exist by which photolytic reactions may occur; direct photolysis, wherein a
molecule upon the absorption of light becomes unstable and decomposes or
indirect photolysis, wherein molecules interact with the reactive intermediate of
another species produced by its absorption of light [52,53]. Research on the
photochemical fate of pharmaceutical chemicals is limited, with only a handful
of papers on the subject published to date. Of those only two have attempted to
evaluate the fate of a variety of compounds while the majority have focused on
a single analyte or chemically similar analytes.
The fate of the bactericide Triclosan was investigated in two separate
studies. Lindstrom et a/. examined the behaviour of Triclosan and methyl
Triclosan in Swiss wastewater effluents and surface water [54]. They observed
that Triclosan showed no appreciable sorption to sediments due to its presence
in the phenolate anionic form at the pH of the lake water. The primary method
of Triclosan removal from the lake was due to direct photolysis of the anionic
form of Triclosan due to a spectral shift upon dissociation that allowed for
significant overlap with the spectrum of natural light. It was also noticed that the
levels of Triclosan present in the lake varied seasonally with sunlight intensity,
with increased quantities present in the winter. In summer a stratification of the
lake occurred leading to significant degradation of Triclosan in the surface layer
[54]. Mezcua et a/. focused upon the formation of 2,7- and 2,8-dibenzodichloro-
p-dioxin as products of the photodegradation of Triclosan [55]. Again it was
observed that only the dissociated form of Triclosan displayed significant
photoactivity. . ..

Buser et a/. reported the rapid photodegradation of the non steroidal
inflammatory diclofenac in Swiss lakes [51] and found that photolysis
accounted for the removal of up to 90% of the pharmaceutical. Again, as was
the case with Triclosan, sorption to suspended solids and sediments was
discounted as an important attenuation process. Direct photolysis was found to
be an extremely fast process with >95% removal in just 4 hours of exposure.
Seasonal variations of light intensity were also examined and observed to
follow the same patterns as Triclosan with higher concentrations being detected
and predicted during the winter months. Schmitt-Jansen et a/. also examined
the photodegradation of diclofenac and noted the formation of six
photoproducts, four more polar than the parent molecule and two less polar
than diclofenac, within a period of 53 hours of irradiation using LC-UV [56]. The
observed photoproduct peaks were the observed to decrease in intensity after
such time and were completely absent after 144 hours of irradiation with natural
sunlight. The chemical identification of the observed photoproducts was not
undertaken. Similar research was also undertaken by Packer et a/. [57], Lam et
a/. [58] and Zhang et a/. [59].
The presence of antibiotic compounds in the environment has caused
concern due to the possible development of microbial antibiotic resistance.
Turiel et a/. investigated the photochemical fate of two commonly used and
potent quinolone and fluoroquinolone antibiotics; oxolinic acid and ciprofloxacin
respectively [60]. It was noted that ciprofloxacin degraded much faster than
oxolinic acid upon irradiation. The matrix in which the experiment was
performed also played an import role as humic material was observed to
decrease the rate of photodegradation [60]. Results suggested that quinolone
antibiotics, due to their much slower rates of degradation may pose more of a
risk to the development of microbial resistance than fluoroquinolones. However,
attempts to identify the photoproducts of ciprofloxacin revealed that those
compounds still contained the active centre of the molecule. Therefore it was
suggested that in attempting to perform environmental risk assessments both
the parent molecule and degradation products should be considered. lsidori et
a/. recommended the same approach as they investigated the ecotoxicity of
both the anti-inflammatory naproxen and its photoproducts and the diuretic
furosemide and its photoproduct and observed that the photoproducts were
more toxic than the parent pharmaceuticals [61,62].
A detailed investigation into the direct and indirect photolysis of the
selective serotonin reuptake inhibitor, fluoxetine, in surface waters was
performed by Lam et al. [53]. The direct first order photolytic half life of
fluoxetine was experimentally determined to be 7 days but the reaction was
observed to proceed faster at alkaline pH. Degradation pathways were
elucidated by mass spectrometric studies and three decomposition products
were identified. Indirect photolysis was observed to proceed considerably faster
than direct photolysis with an experimentally determined half life of 55.2 hours
in reagent water and even lower values recorded in surface water [53]. The
authors acknowledge that indirect photochemical reactions through hydroxyl
radical mediated pathways could play an important role in the removal of
fluoxetine from surface waters [53].
The role of innate photosensitisers such as nitrate and humic material on
the photodegradation of a range of pharmaceuticals was investigated by
Andreozzi et al. [52]. Humic material may act as a reactive intermediate due to
its ability to produce hydroxyl radicals; however, it can also decrease the effect
of radiation on other molecules by acting as a protective filter [52]. As was
observed in other studies, seasonal variations affected. the rates of
photodegradation. The presence of nitrate caused an increase in the rate of
photodegradation of pharmaceutical compounds due to the production of
reactive hydroxyl radicals during the photolysis of nitrate. The noted effects of
humic acid were twofold, humic materials appeared to act as photosensitisers
and increase the photodegradation of the antibiotic ofloxacin, the sulphonamide
sulfamethoxazole, the P-blocker propranolol and clofibric acid, while the
opposite 'filtering' effect was observed to reduce the photodegradation of
carbamazepine and diclofenac [52]. However, although humic materials add a
degree of complexity to the photochemical process, it is still the most significant
abiotic process affecting pharmaceuticals in the natural environment.
1.7.3 Sorption and Mobility in Solid Matrices:
Pharmaceuticals may adsorb onto solids during the treatment of wastewater
and therefore, be removed with the sludge. While this process attenuates the
levels of pharmaceuticals being discharged along with the treated effluent, a
problem exists with the disposal of sludge, which as a result is likely to contain
quite significant quantities of pharmaceuticals, e.g. a German study found

levels of Triclosan at -50 n g ~ - ' in WWTP effluent and -1200 ngg-' in the
corresponding sludge [63]. Therefore, the probability exists that
pharmaceuticals may leach out under suitable conditions. A similar problem
exists with veterinary medicines that may be introduced into the environment
through the spreading of treated animal wastes on lands as fertiliser thereby
contaminating soils, groundwater and surface water through overland flow
164,651.
The sorption of drug residues in the environment leads to increased
localised concentrations of those particular analytes. One particular analyte
known to accumulate is the antibacterial agent Triclosan. As discussed
previously (section 1.7.2) , it has been demonstrated that at high pH Triclosan
is readily photo degraded, but the associated form of the molecule is relatively
stable, so much so that it has been shown to bioaccumulate in fish exposed to
treated wastewater effluent and even in human milk [66]. However, conflicting
reports were published by the manufacturers of Triclosan who claim that the
molecule is not persistent [67]. The sorption of veterinary pharmaceuticals to
soils was reviewed by Tolls [68] who reported that traditional approaches to
describe sorption such as KD, Kw and kc that cater solely for sorption through
hydrophobic interaction do not properly portray the sorption behaviour of drugs
in soils. These parameters fail to account for hydrogen bonding, ion exchange
and chelation, which are more important sorption and retention mechanisms for
pharmaceuticals likely to be charged at soil pH, [68]. Christian et a/. determined
antibiotics in German soil, [69] and observed.that one particular sulphonamide;
sulfadimidine, was stable for long periods of time after application.
The potential for pharmaceuticals bound to soils to leach and
contaminate groundwater has become the focus for many studies. Oppel et a/.
investigated the leaching behaviour of six drugs from two different soil columns
of different pH and organic content [70]. The study reported that
carbamazepine, diazepam, ibuprofen and ivermectin were retained on both soil
columns, while clofibric acid and iopromide were determined solely in the
leachate. Using radio-labelled standards it was possible to determine the depth
penetration of the pharmaceuticals in the column. In the low pH high organic
content soil the radioactivity was recorded only up to a depth of 5 cm whilst in
the high pH low organic content soil penetration of up to 20 cm was noted [70].
It was concluded that the retained drugs pose little threat to groundwater as a

result of soil leachate and vice versa. The pH of the soil and the organic content
were also important factors affecting the mobility of the monitored
pharmaceuticals [71,72]. Kay et a/. published two studies concerning the
mobility of three veterinary antibiotics in soil treated with slurry [73,74]. Both
studies detailed that oxytetracycline and the macrolide tylosin do not leach from
soil with the application of slurry but the sulphonamide; sulfachloropyridazine
was highly motile, with quantitative recovery of the applied quantity used during
the study. The high mobility of the sulfonamide was attributed to macropores in
the soil structure that allowed for unhindered transport to drainage systems and
ultimately surface water [73]. The application of slurry was observed to cause
an increase in soil pH but tillage of the soil prior to application was found to
remove the risk for all the studied compounds [74]. Similar findings to the above
studies were reported by Drillia et a/. [75]. Again it was observed that the soil
type and channels within the soil were important, however, simulated rainfall
events were performed and it was observed that the flow and volume of rain
affected the adsorption and the mobility of the drug through the soil. The higher
the volume and flow, the less drug adsorbed, suggesting that high
concentrations of pharmaceuticals may be released to surface and ground
water during intense rainfall, although the increased volume will aid with dilution
[751.
The processes affecting the concentrations and fate of pharmaceuticals in the
environment are highly complex. Pharmaceuticals have adequate stability and
can be transported over considerable distance through the water course. Soils
may adsorb some pharmaceutical residues, however, such an effect was
observed to concentrate levels in the uppermost topsoil layer [76]. Rainfall can
affect sorption and lead to increased introduction of drug residues into
groundwater. Photolysis is an important process in the removal of
pharmaceuticals from the natural environment but is itself a complicated
process as many transformation products may still contain active groups and
express pharmacodynamic effects.

1.8 Assessinq the Ecotoxicoloqv and Risk ~ o s e d b~ PPCPs:
The presence of pharmaceutical residues in the environment has caused
concern as these chemicals are specifically designed to exhibit a pronounced
biological effect on the organism for which they were developed. The possibility
also exists that drug residues may also affect different species that express the
same receptors or more worryingly cause unknown chronic toxicological effects
in other unrelated organisms that may go unnoticed until it becomes too late. In
Europe an environmental risk assessment (ERA) is required to be performed
prior to a licence being granted to a particular pharmaceutical in an attempt to
predict whether or not the drug poses a significant toxicological risk to the
environment. The assessment is a legal obligation and enforced under EU
Directive 93139lEEC. A centralised agency, the European Medicines Evaluation
Agency (EMEA), was also established under Regulation 2309193lEEC with
responsibility for the licence and registration of medical products for use within
the EU [77]. Reviews of the above legal framework have been undertaken with
the updated Directives 2001182lEC and 2001183lEC now enforced. These
directives cover the licensing of veterinary and human medicines respectively
and undertaking appropriate environmental risk assessments are primary
functions of both documents [78].
The EMEA risk assessment procedure is a tiered process as depicted in
Fig. 1.5 below.
Tier 7
through PEC calculation.
Tier 2
PEC < 0.01 pgL-' Calculation of PNEC from acute toxicity data.
1 Tier 3
Refine data or further toxicity consideration required.
1
1 ERA ~ e p o r t complete. I
4 1
Figure 1.5: Schematic of ERA, adapted from [79].
Product labeling. Possible precautionary or
I safety measures needed.

The first tier of the ERA process involves the calculation of a crude
predicted environmental concentration (PEC) for the pharmaceutical in question
or its metabolites. PECs are usually calculated using Equations 1.2, (initial
directive) or 1.3, (updated directive) below, which account for approximate
quantities of the drug used, its removal rate and dilution in receiving water.
Ax(100-R) PEC =
3 6 5 x P x V x D x l 0 0
Where:
A is the amount used per year, (kg.year').
R is the removal rate.
P is the population considered.
V is the volume of wastewater produced per capita per day, (m3).
D is the dilution factor in the receiving body.
OR:
DDD x F,,, PEC =
V x D x 1 0 0
Where:
DDD is the defined daily dose in mg per person per day.
Fpen is referred to as the penetration factor, i.e. the faction of the population
being treated with the particular drug.
If the calculated PEC value is less that the 0.01 p g ~ - l limit no further
(Eq. 1.3), [80].
action is required and the investigation is complete. If, however, the calculated
PEC is above the limit, the investigation proceeds to Tier 2 and the predicted
no effect concentration (PNEC) is estimated by examining acute toxicity data
performed on algae, Daphnia or fish and dividing the reported worst case
endpoints, (i.e. EC50 or LC50) by an assessment factor to impart a margin of
safety [81]. If the PECIPNEC ratio is less than one, i.e. the level of
pharmaceutical that may exhibit a toxicological response is less than the
predicted amount likely to be present, then the ERA is considered complete. If
the ratio is greater than one, the third tier of the assessment should be
performed which may involve carrying out chronic toxicity studies such as fish
life cycle studies or the recommendation that the product is only administered
and used in a controlled environment [77]. It is also noted the PEC limits are
not set in stone and maybe changed accordingly to account for low dose high
potency situations and vice versa. Also potential benefits out weigh
environmental concerns as even if the compound is found to pose a significant
risk it will still be granted a licence if it is proved to be a highly effective
medicine [77].
A number of studies have been undertaken to evaluate the risk posed by
established pharmaceutical compounds to the environment. By evaluating
PECs, analytes likely to pose an environmental risk can be identified.
Castiglioni et a/. undertook such an approach and using the results from
developed analytical methods, compared the measured environmental
concentration (MEC) with the calculated PECs [82]. It was observed that a
refined PEC, corrected for metabolism and environmental half life provided a
good estimation of the MEC, although PECs were generally higher than MEC. It
was also observed that using the Equations 1.2 and 1.3 above to calculate
crude PEC values leads to an over estimation. A similar investigation was
performed by Ferrari et a/. and again it was noted that the PEC was a useful
approximation of the MEC [79]. However, in all cases the PEC and MEC were
above the Tier 1 so a Tier 2 assessment was performed. The results of the Tier
2 assessment suggested that calculating the PNEC based upon acute toxicity
bioassays may lead to confusing results and to avoid such situations PNEC
values based upon chronic toxicity data may be more suitable. The reason
being that the levels of pharmaceuticals in question are considerably lower than
the minimum concentrations needed to exhibit a response in an acute toxicity
bioassay [79]. Another ERA report by Christenen [83] found that three potent
pharmaceuticals; 17-a-ethinylestradiol, phenoxymethylpenicillin and
cyclophosphamide posed no threat to aquatic organisms or humans at the
PEC. Similar research was also undertaken by Hernando et a/. [84],
Lissemnore et a/. [85] and Pomati et a/. [86].
Jones et a/. assessed the 'Top 25' pharmaceuticals in the United
Kingdom using the EMEA ERA approach in the aquatic compartment and
attempted an assessment for sludge 1871. Using a lower Tier 1 limit of 1 n g ~ - ' it
was necessary to perform a Tier 2 assessment for all pharmaceuticals on the
list. Again it was noted that Tier 2 results can be ambiguous due to the use of
acute rather than chronic toxicity data to calculate the PNEC but the
PECIPNEC ratio was less than unity for all but four compounds. Even in these
situations it was acknowledged that calculations were performed using 'worst
case scenarios' and likely environmental concentrations would be significantly

lower, thereby minimising the risk [87]. In the case of sludge, as no toxicity data
was available, no risk assessment was performed, however, modelled results
suggest that sorption and accumulation in sludge are not likely to be major
processes [87]. Similar results were reported by Stuer-Lauridsen et a/. who also
noted the lack of toxicity data for sludge [88]. The calculation of PEC values for
sludge were noted to be considerably more difficult as it requires masses of
pharmaceutical consumed and masses of sludge produced. Large variations in
the sludge PEC were observed depending on whether or not the value of KD
was corrected to include all forms present, (i.e. the inclusion of pK, and pH into
the expression). The results were found to vary by several orders of magnitude
but it was noted that PEC values calculated using uncorrected KD may simulate
a 'worst case scenario' [88].
Often the ERA procedure is performed only for a single compound and
the possibility that the cumulative or even synergistic effects by functionally
similar compounds are ignored. Such possible effects were investigated by
Cleuvers [89,90] using a 'concentration addition' estimation. It was concluded
that acute effects due to pharmaceuticals are rather unlikely due to
heterogeneous toxicity in the mixture of drugs tested and also that the
likelihood for increased mixture toxicity is reduced if any of the compounds
present is below its no observed effect concentration (NOEC). As this is the
most likely scenario due to the ultra trace concentrations of pharmaceuticals
suspected to be present, acute mixture toxicity is not expected but further
research to evaluate chronic mixture toxicity is recommended [89]. Golet et a/.
estimated the exposure and risk of various fluoroquinolone antibiotics in
Switzerland [91], using the combined concentration of fluoroquinolones
detected to estimate the toxicity of a similar acting group of chemicals. The
calculated risk quotients, (MECIPNEC) was less than unity in both river water
and WWTP effluent and therefore, it was reported that there was only a low risk
of fluoroquinolones exhibiting adverse effects [91].
A prioritisation of veterinary medicines -in the United Kingdom was
performed by Boxall et a/. using a developed ERA approach specific for animal
treatments [92]. The assessment focused upon quantity used, format of usage,
metabolic data and existing toxicity data where available. Based upon the
prioritisation, eleven compounds received the top score and it was
recommended that further studies be performed to asses their environmental

impact [92]. PEC values for veterinary medicines in soil were estimated by
Blackwell et a/. [93] and it was found that the PEC was a conservative estimate
of the MEC and although it does not account for persistence or accumulation a
sufficient margin of safety was included and therefore acute toxicity was not
expected. Koschorreck et a/. reported ERAS for three veterinary medicines [94].
In all cases Tier I & 2 exposures were required and for two compounds; a
helmentic and a mastitis treatment, the active ingredients were found to pose a
serious environmental threat after the Tier 2 assessment and warning levels
were required to be fitted to the products. In the other case the Tier 2 exposure
reported that the antibiotic posed no ecotoxicological threat [94].
Conceptual and computerised models have also been employed to
asses the risk posed by pharmaceuticals. Conceptual ideas have attempted to
link the pharmacodynamics with ecotoxicological risk posed [95,96]. It is
proposed that such an assessment may be useful as unlike many other
chemicals, a wealth of data exists for pharmaceuticals ranging from the activity
for which the drug was designed, to mammalian data from clinical trials. No
results exist to date using such conceptual approaches. Computerised models
using quantitative structural activity relationships (QSARs), have also been
reported [97,98,99]. QSARs allow for the generation of various types of data for
a molecule based upon its structure and composition by comparison with
similar molecules for which such information already exists [99]. The
applicability of QSAR modelling was investigated by Sanderson et a/. who
ranked 2986 different pharmaceuticals relative to the risk they pose to algae,
daphnids and fish [99]. It was found that the QSAR model was fast and
provided reasonable PEC approximations but the results obtained could be
improved by using a combination of models [99]. The Geography Referenced
Regional Exposure Assessment Tool for European Rivers (GREAT-ER) model,
was applied by Schowanek and Webb to simulate European rivers to
pharmaceutical exposure [98]. It was found that the model again provided
reasonable PEC estimations, however, the authors acknowledged that a
refinement to include information from monitoring programs would improve the
data in order to avoid deviations in the returned results [98].
Results from actual toxicity studies have also been reported in the
literature. Laville et a/. examined the effects of nine human pharmaceuticals on
the enzyme activity of fish hepatocytes [loo]. The pharmaceuticals were

classified and it was found that clofibrate, fenofibrate and fluoxetine were the
most cytotoxic of the drugs studied and the majority of the pharmaceuticals
exhibited enzyme inhibition. However, the concentrations required were >I000
times than those that are environmentally relevant [loo]. Similar toxicological
tests using cell cultures were also undertaken by Caminada et a/. and Gagne et
a/. [101,102]. In the first instance, Caminada et al. reported effects at the mgL-'
concentration level for twenty one common pharmaceuticals and therefore,
concluded that no risk was posed at environmentally relevant levels. Gagne et
a/. employed environmentally relevant concentrations by using treated
wastewater as the matrix under investigation in their study and noted that the
compounds investigated had the ability to exhibit an accelerating effect upon
the rate of NADPH oxidation in the fish liver cells. A study into the estrogenic
activity of thirty seven common pharmaceuticals was also performed using
yeast cultures by Fent et a/. [103]. Six of the investigated pharmaceuticals, i.e.
cimetidine, fenofibrate, furosemide, paracetamol, phenazone and tamoxifen
were observed to exhibit weak estrogenic activity at the high y g ~ - '
concentration level.
Mimeault et a/. exposed goldfish to the lipid regulator gemfibrozil at an
environmentally relevant concentration of 1.5 pg~ ' l and observed
bioaccumulation in the plasma of goldfish and also reduced the levels of
circulating testosterone, thereby causing a disruption to the endocrine system
of the test subjects [104,105]. A similar study reported feminisation of the
'fathead minnow' exposed to oestrogen in a life cycle test [106]. Emblidge and
DeLorenzo investigated the risk posed by clofibric acid to three estuarine
species; algae, crustaceans and fish, but concluded that clofibric acid poses no
risk to the investigated species at relevant environmental levels [107]. Nalecz-
Jawecki and Persoone examined the effect of twenty eight pharmaceuticals
upon crustaceans and reported that seventeen were neither toxic nor slightly
toxic at a concentration level of 200 m g ~ - ' [ I 081.
Perhaps the most worrying effect was reported by Schwartz et a/. and
Ohlsen et a/. who detail the presence of antibiotic resistant bacteria in biofilms
on the distribution systems of wastewater, surface water and drinking water
[log]. Bacteria carrying resistant genes were found in drinking water, this is
unusual as the resistance genes detected are normally associated with
enterobacteria detected in wastewater and WWTPs. Both studies suggest that
the transfer of drug resistant genes and plasmids via bacterial conjugation is
extremely likely and therefore, the threat of further emergence of antibiotic and
drug resistant microbes is increased due to the exposure to pharmaceuticals in
the environment [ I 09,110].
1.9 PPCPs and Drinkinq Water:
The presence of pharmaceutically active compounds in surface and
groundwater poses a troubling concern as such systems are often used as
supply for the production of potable water. Although the previous section
focused upon the ecotoxicological risk caused by pharmaceutical residues to
exposed marine organisms, the presence of drugs in drinking water would
provide direct entry into human body for any residues present. To-date there
have been very few published reports . confirming the presence of
pharmaceuticals in drinking water, the reason for such a small number may be
two fold: firstly the concentrations present may be too low and therefore,
beyond the detection limits of most current analytical methods or secondly
pharmaceutical residues may be efficiently removed during drinking water
treatment [ I I I ] .
The presence of phenazone drugs and their metabolites in German
drinking water was reported by Reddersen et a/. [ I 121 and Zuhlke et a/. [ I 131.
Levels detected in both studies were in the p g ~ - I range using GC-MS for the
analysis of samples of Berlin's potable water. Clofibric acid, the macrolide
antibiotic tylosin and the benzodiazepine diazepam were detected in Italian
drinking water, albeit in the low n g ~ - ' range [114]. The levels detected in
finished potable water were higher than those measured in the river from which
the source supply was taken and such an unusual fact was unexplained by the
authors. Stackelberg et a/. investigated the presence of organic compounds
attributed in origin to wastewater infiltration in a drinking water treatment plant
in the USA [115]. Pharmaceuticals were among the compounds detected,
carbamazepine was present in the largest quantity at 0.258 v g ~ - ' along with
caffeine and trace quantities of a metabolite of nicotine [115]. Analyses for
pharmaceuticals were performed at the various stages of drinking water
production in plants in Louisiana, USA and Ontario, Canada 11161. In both
plants the analgesic naproxen was determined at -60 ngL-' in raw supply but

was absent from all finished samples suggesting that the drug was efficiently
removed during the final disinfection process, (ozonation and chlorination).
Although the levels of drugs present in drinking water are extremely low
the risk posed to humans through continual exposure needs to be assessed.
Webb et a/. estimated the lifetime exposure of the average person who drinks
two litres of drinking water per day every day over the course of a seventy year
lifespan for sixty pharmaceutical compounds [117,118]. Assuming the worst
case scenario, the lifetime ingestion of pharmaceutically contaminated drinking
water was less than the daily recommended dose for the vast majority of
compounds investigated [118]. Similar findings were recently reported by
Schwab et a/. who employed an analogous model [ I 191. In the case where the
lifetime exposure was greater than a recommended daily dose, (e.g. for
ethinylestradiol and the x-ray contrast medium iopromide) the calculation could
be refined and corrected to include metabolic and WWTP removal data. The
question of the presence of antineoplastic and cytotoxic pharmaceuticals was
also raised, as although these chemicals are used in the treatment of cancer,
many are inherent carcinogens themselves and therefore, a significant risk is
posed by any level, even the most minute exposure [118]. The general
conclusion from both studies was that the risk is indeed low. However, further
investigations need to be undertaken to asses the risk posed to more
vulnerable groups of society such as infants, the elderly, dialysis patients etc.
[ I 1 I ] . Despite the low risk public perception will be an important factor, to quote
from Ref. [120], "As a friend of mine said, even if there's no toxicological
problem, it makes you a little uncomfortable to know that you are drinking
something that's been through someone else's kidneys".
1 . I 0 Technoloqies for the Removal of PPCPs:
In the previous section the second proposed reason for the low levels of
pharmaceutical compounds detected in drinking water was attributed to the so
called 'polishing' treatments used during production. Disinfection of treated
water is essential to prevent the outbreak of disease and is normally performed
using strong oxidants such as chlorine, ozone, UV, peroxide etc. The
applicability of such established techniques for the removal of anthropogenic
chemicals, including pharmaceuticals, has attracted considerable attention of
late.
The first report of the oxidative treatment of pharmaceuticals in water
was in 2000 by Zwiener and Frimmel [I211 who investigated the ability of
ozone, and ozone along with hydrogen peroxide, to degrade three
environmentally relevant pharmaceuticals. Results showed that the anti-
inflammatory diclofenac was readily degraded at an exposed dose of 1 mgL".
Using a combination of ozone and hydrogen peroxide diclofenac was again
removed and ibuprofen and clofibric acid that were previously persistent could
be reduced to approximately 50% of their initial concentration [121]. The study
also examined the role of DOM present in natural waters. Such natural
materials may also react with hydroxyl radicals formed during ozonelH202
treatment in a scavenging manner, thereby reducing the efficiency of the
oxidation process. In order to avoid such effects it was found that the quantity
of ozone needed should equal the quantity of DOM present. Under such
conditions the oxidative procedure was efficient in removing the drug residues
present [121]. Ternes et a/. examined the removal of pharmaceutical residues
using four different processes common to drinking water treatment [122]. Both
slow sand filtration under both aerobic and anoxic conditions and flocculation
using ferric chloride were inefficient in removing pharmaceutical residues.
Granular activated carbon (GAC), was efficient at removing three of the four
investigated analytes, however, as expected the most polar; clofibric acid
showed little affinity for the carbon sorbent. Ozonation was also found to be
efficient but also highly selective. It was observed that specific doses were
required to remove each investigated pharmaceutical [I221 and in agreement
with Zwiener and Frimmel, clofibric acid was stable even at high doses
indicating that it may persist and be present in drinking water samples. Another
paper investigating ozone applicability published by Ternes et a/., concerning
the removal of pharmaceuticals and x-ray conti-ast media from wastewater, also
confirmed that ozonation is a suitable tool for the removal of drug residues
[123]. It was, however, noted that the ionic contrast agent diatrizoate was
extremely persistent with a maximum removal of only 15% under extremely
high ozone doses [123]. Ozonation was also examined as a feasible option for
the removal of estrogenic activity during drinking water treatment [124]. By
applying doses normally used during treatment, -1 mgL-' or higher, the three

estrogenic compounds investigated and their estrogenic activity was almost
completely removed. It was estimated that the half life of the most potent
oestrogen, 17-a-ethinylestradiol at pH 8 was in the order of 1 ms [124].
A potential problem with the oxidative treatment of pharmaceutical
compounds is the formation of unknown oxidation by-products. The oxidation of
diclofenac using ozone and UV/H202 was investigated by Vogna et a/. [125].
Diclofenac degradation was found to be quite fast and efficient using both
oxidation systems. Treatment with both oxidants was found to add hydroxyl
groups to the molecule followed by cleavage of the carbon nitrogen bond to
yield dihydrophenyl acetic acid, dichlorohydroquinone and dichloroaniline
amongst others. By-products were identified by GC-MS, preparative thin layer
chromatography (TLC) and 'H and I3c nuclear magnetic resonance
spectroscopy (NMR). The identified oxidation by-products were further
degraded into organic acids upon further ozone exposure [125]. Therefore, it
may be concluded that oxidative treatment may have sufficient ability to
completely remove pharmacological activity, however, diclofenac is a rather
simple molecule and further research will indeed be necessary to evaluate the
risk posed by the oxidation by-products formed during the degradation of more
complex and potent chemicals.
The oxidation of clofibric acid using ozone and UV/H202 was performed
by Andreozzi et a/. [126]. The mineralisation of the compound under applied
oxidant dose was monitored by the formation of chloride ions. As with previous
studies it was observed that ozone degradation of clofibric acid was a faster
process than UV/H202 but both oxidation systems were efficient. The degree of
mineralisation was better under ozone with all chlorine quantitatively recovered
as chloride indicating that no chlorinated oxidation by-products were formed
[ I 261.
The kinetics of the oxidation processes are important in attempting to
evaluate the doses oxidant and contact times needed. Andreozzi et a/.
evaluated the kinetics of clofibric acid oxidation using the two aforementioned
oxidants [126]. It was observed that the kinetics of ozonation depended greatly
upon the pH at which the experiments were performed, i.e. at higher pH the
clofibric anion is the dominant species in solution and this moiety was much
more reactive with ozone than the associated parent acid [126]. The pH of the
experimental solution during the UV/H202 oxidation system was found not to

play a major role. These findings can be explained by the fact that ozone is
selective to certain functional groups while hydroxyl radicals are unselective
and reacts with many sites on molecules [124]. The kinetics of the oxidation
using UV/H202 were determined for two pharmaceutical intermediates by
Lopez et a/. [127], it was found that second order rate constants were quite
large, (1 08-1 0'' M-~S-') suggesting that the oxidation is quite efficient. The
doses of oxidant required for complete substrate removal were significantly
higher than those commonly used during disinfection treatments and therefore,
maybe uneconomically feasible for large scale implementation 11271. The
importance of pH on the kinetics and efficiency of the degradation were also
noted by Balcioglu and Otker [I281 and Huber et a/., [I291 using ozone/H202 or
ozone for the removal of antibiotics and mixed environmentally relevant
pharmaceuticals respectively. It was found that antibiotics were efficiently
removed at neutral pH, whilst at acidic pH the oxidation power of hydroxyl
radicals was suppressed and at alkaline pH ozone depletion by cross reaction
with hydroxide was observed [128]. As pH obviously affects the speciation of
pharmaceuticals in aqueous solution Huber et a/. reported that sample pH
values in the range of 5-10 allowed for the most efficient degradation of the
analytes investigated [129]. The proposed reason is that in this pH range many
pharmaceuticals can be considered as strong nucleophiles and therefore, are
more prone to attack by electrophilic ozone [129]. Second order rate constants
calculated for most of the test pharmaceuticals were in average two to three
times higher than for other investigated organic pollutants such as MtBE or
trichloroethylene, as a consequence it is expected that the oxidative
degradation of pharmaceuticals is expected to be extremely efficient [129]. In a
separate investigation Huber et a/. performed a pilot study to determine the
applicability of ozonation for the oxidation of pharmaceutical contaminants in
wastewater [130]. The effect of suspended material, that may scavenge ozone
and hydroxyl radicals, was investigated but it was found that suspended matter
did not affect the oxidation of the pharmaceutical analytes but as previously
mentioned the ozone dose required was proportional to the quantity of DOM
[130]. In practical terms it was observed that the ozone doses required were
similar to those needed for microbe inactivation and therefore, ozonation or
advanced oxidation procedures may indeed be a feasible option for the removal
of pharmaceutical residues from both treated wastewater and drinking water.
Biological methods have also been investigated as more ecofriendly
means for pharmaceutical removal. Using biofilms and biofilm reactors it was
investigated whether environmentally relevant pharmaceuticals such as clofibric
acid, ibuprofen and diclofenac could be degraded [131,132]. Biofilms consist of
eukaryotic and prokaryotic microbes agglomerated through extracellular
secretions and may be static or dynamic. Ibuprofen was readily biodegradable,
however, as the concentration of ibuprofen decreased, its two metabolites,
hydroxyl-ibuprofen and carboxy-ibuprofen, were observed to increase in
solution [132]. The experiment was performed using both isomers of ibuprofen
and it was noted that microbial biodegradation of the inactive R-isomer readily
occurred whilst worryingly the pharmacologically active S-isomer was observed
to be resistant to degradation. Clofibric acid was also unsuccessfully removed
by the biofilm [132]. Zwiener and Frimmel also reported that clofibric acid and
diclofenac were also resistant to biodegradation under aerobic conditions but a
slight removal improvement was reported when the films were operated under
anoxic conditions. The formation of hydroxyl-ibuprofen as a function of
ibuprofen removal was also noted [131]. The applicability of biofilms therefore,
appears to be limited when compared to the excellent removal efficiency of
chemical oxidants.
1.1 1 Prevention is better than Cure:
As pharmaceuticals are continually being introduced into the environment along
with treated wastewater effluents the problem appears to be persistent. Finding
a solution will not be an easy task as the benefit to medicine outweighs
environmental presence and risk. The advent of environmentally friendly
pharmaceuticals is not going to happen in: the short term considering the
amount of time and money required for drug development. A concept
introduced in Sweden may provide some promise. Pharmaceuticals were
ranked based upon the threat they pose to the environment allowing doctors to
prescribe, or patients to choose, more environmentally friendly treatments from
existing medicines [133]. The use of the 'precautionary principle', which can be
interpreted as the lack of scientific facts concerning a potential hazard not
justifying inaction to prevent such a hazard [133], is inappropriate of
pharmaceuticals for the above reasons.

As the majority of pharmaceuticals and their metabolites are excreted
from the body through the urine, urine separation and subsequent treatment
may be a viable for minimising the quantities of pharmaceuticals released to the
environment [134]. Urine separation offers a number of potential benefits,
primarily the removal of 80% of the nitrogen and 45% of the phosphate loading
into wastewater treatment plants [ I 351. Larsen et a/. note that in the absence of
urine a carbon nitrogen balance is achievable in WWTPs and under such
conditions the microbial population feeding on organic matter could
successfully remove all nitrogen content [134]. Urine separation does not
require massive capital investment to be performed, simply the change over
from standard to so called 'NoMix' toilets which store the urine in a tank for later
remote controlled discharge [134]. Rauch et a/. developed a model for urine
production in the average household that would help with planning the
frequency of collection and subsequent treatment [136]. A report of urine
separation in practice was also recently published [137]. A urine separation
system was included when a student dormitory was being constructed. The
system did not function as well as planned for nutrient removal, however, it was
found that user attitudes and ignorance were to blame. Also the cost of
implementing the system lay with the management company when compared
with municipal sewer systems, whereby the expense is completely on the local
authority. The author acknowledged that administrative change may be
required to make the system more attractive. Urine separation is still hoped to
be a prospect in minimising environmental contamination with pharmaceutical
compounds, especially if used in conjunction with the aforementioned chemical
oxidants [ I 331.
An alternative use for spent activated sludge was proposed by Otero et
at. [I381 who used sludge for the removal of two dyes and phenol from water.
The sludge underwent pyrolysis and acid activation and it was found that such
treatment imparted high porosity and a large surface area to the new sorbent.
Studies with the three chosen compounds revealed that they could be
efficiently removed from water although the interaction mechanism was not
evaluated. It was suggested that the material may be used for the successful
removal of other organic micro pollutants.
It appears that finding an acceptable solution for the prevention of
pharmaceutical compounds contaminating the aqueous environment is by no
means an easy task and therefore, an area that requires significant research.
References:
1. M.J. Richardson & J.M. Bowron, Journal of Pharmacy and Pharmacology 37, (1 985), 1.
2. R.N. Reeve, lntroduction to Environmental Analysis, (2002), J. Wiley & Sons, New York.
3. The complete list of licensed pharmaceuticals in Ireland as provided by the Irish Medicines
Board, www.imb.ie, personal communication, January 2004.
4. C.G. Daughton & T.A. Ternes, Environmental Health Perspectives, 107, (1999), 907.
5. OSPAR List of Chemicals for Priority Action; Update 2002. Reference number 2002-18,
OSPAR 02/21/1-E Annex 5, last viewed 2oth December 2006, available through,
http:/lwww.ospar.orglenlhtml/substances/dselected~subsances.html
6. C.G. Daughton, Pharmaceuticals and Personal Care Products in the Environment: Scientific
and Regulatory Issues, ACS Symposium Series, (2001), 1-37.
7. T. Heberer, Journal of Hydrology, 266, (2002), 175.
8. T. Heberer, Toxicology Letters, 131, (2002), 5.
9. R. Velagaleti et. al. Environmental Health Perspectives, (2002), 11 0, 21 3.
10. S.P. Kourosh et. a/. Instant Pharmacology, (1999), J . Wiley & Sons, New York.
11. H.P. Rang, M.M. Dale & J.M. Ritter, Pharmacology, 3rd Edition, (1995), 82-90, Churchill
Livingstone Publishers, New York.
12. G.G. Gibson & P. Skett, Introduction to Drug Metabolism, Second Edition, (1994) 1-35,
Blackie Academic & Professional Publishing, New York.
13. J.M. Ritter, L.D. Lewis, T.G.K. Mart, A Textbook of Clinical Pharmacology, 4th Edition,
(1995), 37, Oxford University Press, London.
14. Wastewater Treatment Principles and Regulations, last viewed 2oth December 2006,
available through, http:llohioline.osu.edu/aex~fact~0768.html.
15. M. Henze, Wastewater Treatment: Biological and Chemical Processes, (2002), Springer,
London.
16. Enviromental Protection Agency, Wastewater Treatment Manuals, 1997.
17. N.F. Gray, The Biology of Wastewater Treatment, 1989, 334-479, Oxford University Press,
London.
18. L.M. Prescott, J.P. Harley & D.A. Klein, Microbiology, 4th Edition, 868-873, ra raw Hill
Publishers, New York.
19. A. Kumar Gautam, S. Kumar & P. Sabumon, Journal of Environmental Management, Article
in press (2006), doi: 10.1 01 6lj.envman.2006.03.009.
20. S.T. Glassmeyer & J.A. Shoemaker, Bulletin of Environmental Contamination and
Toxicology, 74, (2005), 24.
21. M. Bedner & W.A. MacCrehan, Chemosphere, 65, (2006), 21 30.

22. T.E. Doll & F.H. Frimmel, Catalysis Today, 101, (2005), 195.
23. W.J. Eilbeck & G. Mattock, Chemical Processes in Wastewater Treatment, 1987, 232-293,
Chichester, New York.
24. H.R. Rogers, The Science of the Total Environment, 185, (1996), 3.
25. T.A. Ternes, Water Research, 322, (1 998), 3254.
26. T.A. Ternes & R. Hirsch, Environmental Science & Technology, 34, (2000), 2741.
27. R. Kanda, P. Griffin, H.A. James & J. Fothergill, Journal of Environmental Monitoring, 5,
(2003), 823.
28. M Carballa, F. Omil, J.M. Lema, M. Llompart, C. Garcia-Jares, I. Rodriguez, M. Gomez &
T.A. Ternes, Water Research, 38, (2004), 291 8.
29. P.M.J. Fisher & R. Borland, Journal of Cleaner Production, 11, (2003), 31 5.
30. P. Drillia, S.N. Dokianakis, M.S. Fountoulakis, K. Kornaros, K. Stamatelatou & G. Lyberatos,
Journal of Hazardous Materials, 122, (2005), 259.
31 .T.A. Ternes, A. Joss, H, Siegrist, Environmental Science &. Technology A-Page Magazine,
October 1 5th, (2004), 392A.
32. M.S. Diaz-Cruz, M.J. Lopez de Alda & D. Barcelo, TrAC Trends in Analytical Chemistry, 22,
(2003), 340.
33. T.A. Ternes, N. Herrmann, M. Bonerz, T. Knacker, H. Siegrest & A. Joss, Water Research,
38, (2004), 4075.
34. J.T. Yu, E.J. Bouwer & M. Coelhan, Agricultural Water Management, 86, (2006), 72.
35. T. Urase & T. Kikuta, Water Research, 39, (2005), 1289.
36. S.J. Khan & J.E. Ongerth, Chemosphere, 54, (2004), 355.
37. L. Wolf, I. Held, M. Eiswirth & H. Hotzl, Acta Hydrochimica et Hydrobiologica, 32, (2004),
361.
38. R.J. Slack, P. Zerva, J.R. Gronow & N. Voulvoulis, Environmental Science & Technology,
39, (2005), 191 2.
39. R.J. Slack, J.R. Gronow & N. Voulvoulis, The Science of the Total Environment, 337,
(2005), 1 19.
40. J.V. Holm, K. Rugge, P.L. Bjerg & T.H. Christensen, Environmental Science & Technology,
29, (1 995), 141 5.
41. M. Ahel & I. Jelicic, 'Phenazone Analgesics in Soil and Groundwater below a Municipal
Solid Waste Landfill', Pharmaceuticals and Personal Care Products in the Environment:
Scientific and Regulatory Issues, ACS Symposium Series, (2001), 100.
42. J. Schwarzbauer, S. Heim, S. Brinker & R. Littke, Water Research, 36, (2002), 2275.
43. S. Heim, J. Schwarzbauer & R. Littke, Environmental Chemistry Letters, 2, (2004), 21.
44. D. Ashton, M. Hilton & K.V. Thomas, The Science of the Total Environment, 333, (2004),
167.
45. K.V. Thomas & M.J. Hilton, Marine Pollution Bulletin, 49, (2004), 436.
46. S. Wiegel, J. Kuhlmann & H. Huhnerfuss, The Science of the Total Environment, 295,
(2002), 131.

- -
47. H.R. Buser, M.D. Muller & N. Theobald, Environmental Science & Technology, 32, (1998),
188.
48. S. Wiegel, A. Aulinger, R. Brockmeyer, H. Harms, J. Loffler, H. Reincke, R. Schmidt, B.
Stachel, W. von Tumpling & A. Wanke, Chemosphere, 57, (2004), 107.
49. D. Bendz, N.A. Paxeus, T.R. Ginn & F.J. Loge, Journal of Hazardous Materials, 122, (2005),
195.
50. M. Clara, B. Strenn & N. Kreuzinger, Water Research, 38, (2004), 947.
51. H.R. Buser, T. Poiger & M.D. Muller, Environmental Science & Technology, 32, (1998),
3449.
52. R. Andreozzi, M. Raffaele & P. Nicklas, Chemosphere, 50, (2003), 1319.
53. M.W. Lam, C.J. Young & S.A. Mabury, Environmental Science & Technology, 39, (2005),
51 3.
54. A. Lindstrom, I.J. Buerge, T. Poiger, P.A. Bergqvist, M.D. Muller & H.R. Buser,
Environmental Science & Technology, 36, (2002), 2322.
55. M. Mezcua, M.J. Gomez, I. Ferrer, A. Aguera, M.D. Hernando & A.R. Fernandez-Alba,
Analytica Chimica Acta, 524, (2004), 241.
56. M. Schmitt-Jansen, P. Bartels, N. Adler & R. Altenburger, Analytical & Bioanalytical
Chemistry, Article in press (2006), doi: 10.1 007/s00216-006-0825-3.
57. J.L. Packer, J.J. Werner, D.E. Latch, K. McNeill & W.A. Arnold, Aquatic Sciences, 65,
(2003), 342,
58. M.W. Lam & S.A. Mabury, Aquatic Sciences, 67, (2005), 177.
59. Y. Zhang, J.L. Zhou & B. Ning, Water Research, 41, (2007), 19.
60. E. Turiel, G. Bordin & A.R. Rodriguez, Journal of Environmental Monitoring, 7, (2005), 189.
61. M. Isidori, M. Lavorgna, A. Nardelli, A. Parallax, L. Preliterate & M. Rubin, The Science of
the Total Environment, 348, (2005), 93.
62. M. Isidori, A. Nardelli, A. Parrella, L. Pascarella & L. Previtera, Chemosphere, 63, (2006),
785.
63. K. Bester, Water Research, 37, (2003), 3891.
64. A.B.A. Boxall, P. Blackwell, R. Cavallo, P. Kay & J. Tolls, Toxicology Letters, 131, (2002),
19.
65. P. Kay, P.A. Blackwell &. A.B.A. Boxall, Chemosphere, 59, (2005), 951.
66. M. Adolfsson-Erici, M. Petterson, J. Parkkonen & J. Sturve, Chemosphere, 46, (2002),
1485.
67. D. Sabaliunas, S.F. Webb, A. Haul, M. Jacob & W.S. Eckhoff, Water Research, 37, (2003),
3145.
68. J. Tolls, Environmental Science & Technology, 35, (2001), 3397.
69. T. Christian, R.J. Schneider, H.A. Farber, D. Skutlarek, M.T. Meyer & H.E. Goldbach, Acta
Hydrochimica et Hydrobiologica, 31, (2003), 36.
70. J. Oppel, G. Broll, D. Loffler, M. Meller, J. Rombke & T.A. Ternes, The Science of the Total
Environment, 328, (2004), 265.

71. D. Loffler, J. Rombke, M .Meller & T.A. Ternes, Environmental Science & Technology, 39,
(2005), 5209.
72. A.C. Hari, R.A. Paruchuri, D.A. Sabatini & T.C.G. Kibbey, Environmental Science &
Technology, 39, (2005), 2592.
73. P. Kay, P.A. Blackwell & A.B.A. Boxall, Environmental Pollution, 134, (2005), 333.
74. P. Kay, P.A. Blackwell & A.B.A. Boxall, Chemosphere, 60, (2005), 497.
75. P. Drillia, K. Stamatelatou & G. Lyberatos, Chemosphere, 60, (2005), 1034.
76. E.M. Golet, I. Xifra, H. Siegrist, A.C. Alder & W. Geiger, Environmental Science &
Technology, 37, (2003), 3245.
77. J.O. Straub, Toxicology Letters, 131, (2002), 137.
78. R. Clayton, Analytica Chimica Acta, 529, (2005), 3.
79. B. Ferrari, R. Mons, B. Vollat, B. Frayasse, N. Paxeus, R. Lo Guidice, A. Pollio & J. Garric,
Environmental Toxicology & Chemistry, 23, (2004), 1344.
80. G. Huschek, P.D. Hansen, H.H. Maurer, D. Krengel &A. Kayser, Environmental Toxicology,
19, (2004), 226.
81. J.P. Bound & N. Voulvoulis, Chemosphere, 56, (2004), 1143.
82. S. Castiglioni, R. Fanelli, D. Calamari, R. Bagnati & E. Zuccato, Regulatory Toxicology &
Pharmacology, 39, (2004), 25.
83. F.M. Christensen, Regulatory Toxicology & Pharmacology, 28, (1 998), 21 2.
84. M.D. Hernando, M. Mecuza, A.R. Fernandez-Alba & D. Barcelo, Talanta, 69, (2006), 334.
85. L. Lissemore, C. Hao, P. Yang, P.K. Sibley, S. Mabury & K.R. Solomon, Chemosphere, 64,
(2006), 71 7.
86. F. Pomati, S. Castiglioni, E. Zucatto, R. Fanelli, D. Vigetti, C. Rossetti & D. Calamari,
Environmental Science & Technology, 40, (2006), 2442.
87. O.A.H. Jones, N. Voulvoulis & J.N. Lester, Water Research, 36, (2002), 5013.
88. F. Stuer-Lauridsen, M. Birkved, L.P. Hansen, H.C. Holten Lutzhoft & B. Halling-Sorensen,
Chemosphere, 40, (2000), 783.
89. M. Cleuvers, Toxicology Letters, 142, (2003), 185.
90. M. Cleuvers, Chemosphere, 59, (2005), 199.
91. E.M. Golet, A.C. Alder & W. Giger, Environmental Science & Technology, 36, (2002), 3645.
92. A.B.A. Boxall, L.A. Fogg, P. Kay, P.A. Blackwell, E.J. Pemberton & A. Croxford, Toxicology
Letters, 142, (2003), 207.
93. P.A. Blackwell, A.B.A. Boxall, P. Kay & H. Noble, Journal of Agriculture & Food Chemistry,
53, (2005), 2192.
94. J. Koschorreck, C. Koch & I. Ronnefahrt, Toxicology Letters, 131, (2002), 117.-
95. R. Lange & D. Dietrich, Toxicology Letters, 131, (2002), 97.
96. J.P. Seiler, Toxicology Letters, 131, (2002), 105.
97. H. Sanderson, D.J. Johnson, C.J. Wilson, R.A. Brain & K.R. Solomon, Toxicology Letters,
144, (2003), 383.
98. D. Schowanek & S. Webb, Toxicology Letters, 131, (2002), 39.

99. H. Sanderson, D.J. Johnson, T. Reitsma, R.A. Brain, C.J. Wilson & K.R. Solomon,
Regulatory Toxicology & Pharmacology, 39, (2004), 158.
100. N. Laville, S. Ati-Aissa, E. Gomez, C. Casellas & J.M. Porcher, Toxicology, 196, (2004),
41.
101. D. Caminada, C. Escher & K. Fent, Aquatic Toxicology, 79, (2006), 114.
102. G. Gagne, C. Blaise & C. Andre, Ecotoxicology and Environmental Safety, 64, (2006),
329.
103. K. Fent, C. Escher & D. Caminada, Reproductive Toxicology, 22, (2006), 175.
104. C. Mimeault, A.J. Woodhouse, X.S. Miao, C.D. Metcalfe, T.W. Moon & V.L. Trudeau,
Aquatic Toxicology, 73, (2005), 44.
105. C. Mimeault, V.L. Trudeau & T.W. Moon, Toxicology, 228, (2006), 140.
106. R. Lange, T.H. Hutchinson, C.R. Croudace, F. Siegmund, H Schweinfurth, P. Hampe, G.H.
Panter & J.P. Sumpter, Environmental Toxicology & Chemistry, 20, (2001). 121 6.
107. J.P. Emblidge & M.E. DeLorenzo, Environmental Research, 100, (2006), 216.
108. G. Nalecz-Jawecki & G. Persoone, Environmental Science & Pollution Research, 13,
(2006), 22.
109. T. Schwartz, W. Kohnen. B. Jansen & U. Obst, FEMS Microbiology Ecology, 43, (2003),
325.
110. K. Ohlsen, T. Ternes, G. Werner, U. Wallner, D. Loffler, W. Ziebuhr, W. Witte & J. Hacker,
Environmental Microbiology, 5, (2003), 71 1.
11 1. O.A. Jones, J.N. Lester & N. Voulvoulis, TRENDS in Biotechnology, 23, (2005), 163.
112. K. Reddersen, T. Heberer & U. Dunnbier, Chemosphere, 49, (2002), 539.
113. S. Zuhlke, U. Dunnbier & T. Heberer, Journal of Chromatography A, 1050, (2004), 201.
114. E. Zucatto, D. Calamari, M. Natangelo & R. Fanelli, The Lancet, 355, (2000), 1789.
115. P.E. Stackelberg, E.T. Furlong, M.T. Meyer, S.D. Zaugg, A.K. Henderson & D.B.
Reissman, The Science of the Total Environment, 329, (2004), 99.
116. G.R. Boyd, H. Reemtsma, D.A. Grimm & S. Mitra, The Science of the Total Environment,
311, (2003), 135.
117. S.F. Webb, 'A data based perspective on the environmental risk assessment of human
pharmaceuficals 111 - Indirect human exposure' in 'Pharmaceuticals in the Environment' edited
by K. Kummerer, 221, Springer, New York.
118. S. Webb, T. Ternes, M. Gilbert & K. Olejniczak, Toxicology Letters, 142, (2003), 157.
119. B.W. Schwab, E.P. Hayes, J.M. Fiori, F.J. Mastrocco, N.M. Roden, D. Cragin, R.D.
Meyerhoff, V.J. D'Aco & P.D. Anderson, Regulatory Toxicology & Pharmacology, 42, (2005),
296.
120. P.S. Zurer, Chemistry & Engineering News, April 1 oth, (2003).
121. C. Zweiner & F.H. Frimmel, Water Research, 34, (2000), 1881.
122. T.A. Ternes, M. Meisenheimer, D. MCDowell, F. Sacher, H.J. Brauch, B. Haist-Gulde, G.
Preuss, U. Wilme & N. Zulei-Seibert, Environmental Science & Technology, 36, (2002), 3855.
123. T.A. Ternes, J. Stuber, N. Herrmann, D. MCDowell, A. Reid, M. Kampmann & B. Teiser,
Water Research, 37, (2003), 1976,

124. M.M. Huber, T.A. Ternes & U. von Gunten, Environmental Science & Technology, 38,
(2004), 51 77.
125. D. Vogna, R. Marotta, A. Napolitano, R. Andreozzi & M. d'lschia, Water Research, 38,
(2004), 414.
126. R. Andreozzi, V. Caprio, R. Marotta & A. Radovnikovic, Journal of Hazardous Materials,
103, (2003), 233.
127. A. Lopez, A. Bozzi, G. Mascolo & J. Kiwi, Journal of Photochemistry and Photobiology A:
Chemistry, 156, (2003), 121.
128. I.A. Balcioglu & M. Otker, Chemosphere, 50, (2003), 85.
129. M.M. Huber, S. Canonica, G.Y. Park & U. von Gunten, Environmental Science &
Technology, 37, (2003), 101 6.
130. M.M. Huber, A. Gobel, A. Joss, N. Hermann, D. Loffler, C.S. MCArdel, T.A. Ternes & U. von
Gunten, Environmental Science & Technology, 39, (2005), 4290.
131. C. Zwiener & F.H. Frimmel, The Science of the Total Environment, 309, (2003), 201.
132. M. Wnkler, J.R. Lawrence& T.R. Neu, Water Research, 35, (2001), 3197.
133. T.A. Larsen, J. Lienert, A. Joss & A. Siegrist, Journal of Biotechnology, 113, (2004), 295.
134. T.A. Larsen, I. Peters, A. Alder, R. Eggen, M. Maurer & J. Muncke, Environmental Science
& Technology, May 1 '', (2001), 192A.
135. J.A. Wilsenach &. M.C.M. van Loosdrecht, Environmental Science & Technology, 38,
(2004), 1 208.
136. W. Rauch, D. Brockmann, I. Peters, T.A. Larsen & W. Gujer, Water Research, 37, (2003),
681.
137. J.C. Berndtson, Building and Environment, 41, (2006), 427.
138. M. Otero, F. Rozada, L.F. Calvo, A.I. Garcia & A. Moran, Dyes and Pigments, 57, (2003),
55.

2.0 A Review o f the Analytical Approaches used for
the Determination of Pharmaceutical Residues in
Environmental Samples.
2.1 Introduction:
Recent advances in analytical technology have allowed chemists to detect
compounds at concentrations that were previously unattainable. The advent of
commercially available interfaces for the coupling of LC with MS and reports of
pharmaceutical compounds as environmental contaminants can be seen as two
interrelated events. The traditional 'gold standard' GC-MS approach is not
inherently suitable for the determination of pharmaceutical residues and
consequently a derivatisation procedure must be incorporated into the procedure.
Such an approach is not favourable as it increases the levels of variability of the
method and also as derivatisation procedures are not specific the likelihood of
multiple peaks for a single analyte with many functional groups increases,
thereby making quantitation extremely complicated. The methods developed for
the determination of pharmaceutically active compounds in the environment to
date have focused upon the use of a three step procedure; i.e. sample
preconcentration to increase method sensitivity, the use of liquid chromatography
as an analytical separation method and finally specific detection using mass
spectrometry. This section aims to review the theory and application of the
analytical approaches used by researchers for the determination of trace
residues of environmentally relevant pharmaceuticals to the present day.
2.2 Sample Preparation:
2.2.1 Considerations for sample preparation:
It is unfortunately all too often the case that in environmental samples the
analytes of interest are present at concentrations below or near to the limits of
detection of the technique used to perform the analytical measurement. This is
especially true in the case of pharmaceutical residues, whereby levels detected
to date have been in the low I Jg~ - ' to the n g ~ - ' range [I]. In order to ensure that
there is confidence in the analytical measurement and that the generated results
reflect the composition of the original sample, it is therefore, required that the
sample preparation process leads to an enrichment of the analyte to a level more
amenable for detection by the analytical technique being employed.
Consequently, the resultant analyte signal is significantly higher than the baseline
noise. Therefore, the first consideration for the inclusion of a sample preparation
technique into the analytical method is to yield lower overall method detection
limits, i.e. increased analytical sensitivity [2].
The second consideration for the inclusion of a sample preparation
procedure into the analytical method may include the need to 'clean up' the
sample by removing the matrix prior to analysis [2]. Environmental samples
contain a high proportion of DOM as a result of natural processes that may
interfere with the analytical determination, e.g. DOM may spoil chromatography
columns or absorb at the same wavelengths used in spectrophotometric methods
etc. Therefore, it is often necessary to completely isolate the analyte of interest
from the matrix which may then be discarded in order to increase the selectivity
of the method [3].
The last consideration for the inclusion of a sample preparation procedure
may involve the exchange of the analyte from the natural matrix, e.g. water, into
a solvent more compatible with the analytical technique to be used [2]. It is a
necessity for techniques such as infrared spectroscopy (IR) or nuclear magnetic
resonance spectroscopy (NMR) and GC that the analyte must be present in a
specific environment prior to analysis, usually an organic solvent, (or deuterated
solvent in the case of NMR) as the sensitivity of such techniques is negatively
affected by the presence of water [2].
Although a sample preparation procedure may be necessary for any or all
of the above reasons, the following conditions must also be fulfilled in order to
ensure that it is an efficient and viable process. It is desired that the sample
preparation procedure is convenient and easy to perform and relatively
inexpensive, that sample loss as a result of the procedure is at an absolute
minimum, that there is sufficient analyte selectivity and that the procedure does
not lead to the creation of conditions that may adversely affect the analytical
measurement, i.e. extremely acidic extracts may ruin chromatography columns
P I .

2.2.2 The move towards solid phase extraction:
In the past, the primary method of extracting and preconcentrating aqueous
samples was solvent extraction, referred to as liquid-liquid extraction; (LLE). LLE
involves the distribution of analytes between two immiscible liquids, usually water
and an organic solvent such as ether or hexane and is normally performed by
agitating the solvents to ensure mixing and mass transport and then allowing the
two immiscible phases to coalesce and separate [5]. Although LLE is relatively
simple to perform and manipulate, it does suffer from a number of drawbacks
which include the large consumption of organic solvents, the high costs caused
by spent solvent disposal, problems with inefficient phase separation and
emulsion formation that may lead to ruination of the sample. Another significant
problem with LLE is the small preconcentration factors achievable. The ability of
LLE to enrich sample components is governed by the ratio of the two liquid
phases and therefore, it is impossible or impractical to extract large volumes of
sample often needed for suitable analyte enrichment with small volumes of
organic solvent [5]. As a consequence of the above factors the reported use of
LLE for environmental analysis has declined, however, LLE based techniques
are still popular for the processing of small volume samples of biological fluids
[6,71.
A historical review of the advent of solid phase extraction (SPE) was
presented by Liska in 2000 [8]. In the 1970's the first SPE procedures involved
the use of activated carbon as a sorbent for the extraction of organic
contaminants from water samples, chloroform was used as an eluent. However,
the process was rather ineffective due to the low affinity of polar pollutants for the
activated carbon sorbent and the inability of chloroform to elute high affinity
compounds from the sorbent mass 181. The first successful SPE methods applied
the use of porous polystyrene polymers, (XAD resins) whereby up to 150L of
water sample could be passed through the sorbent and then eluted using 15 mL
of diethyl ether which in turn was reduced in volume and analysed by GC [9].
Such a method allowed for the determination of previously unmeasured organic
contaminants, e.g. polynuclear aromatic hydrocarbons at the low p g ~ - l levels in
the aquatic environment. The first reports of silica based SPE materials were
also published in the 1970's [8]. The use of porous polymers was limited until the
1980's and the advent of commercially available sorbents in pre-packed columns
[9]. The 1990's saw the development of SPE disks and new sorbents based upon

immunoaffinity interaction and molecularly imprinted polymer supports (MIPS),
which offered increased levels of selectivity and specificity previously
unachievable [a]. The progress of SPE continues with the development and
commercialisation of hydrophilic lipophilic balanced polymers such as Waters
Oasis HLB" that allow for the preconcentration of compounds displaying a broad
spectrum of polarity in a single extraction [lo], along with the availability of fully
automated and instrument compatible SPE systems like prospektTM and
symbosism by Spark Holland [8] that allow for fast and more effective sample
preparation.
The change from LLE to SPE based sample preparation techniques arose
due to the lower costs involved with both equipment and solvents, (SPE was
considered a 'greener' option compared with LLE) and the ease at which the
procedure could be performed or even automated. SPE also offered chemists the
ability to extract samples in the field allowing for easier sample transport and
storage [ I I ] . However, a number of limitations are also known. Because SPE
involves the use of a synthetic sorbent, problems may arise with the batch-to-
batch reproducibility of the product or the surface chemical modification. Also
impurities present from the manufacturing process may adversely affect the
performance of the sorbent [ I I ] . As the sorbent bed is of limited smaller capacity
compared to a bulk liquid phase as used in LLE, the possibility of sample loss
exists due to overloading and breakthrough. The particulate nature of the sorbent
bed and the use of frits can be prone to blockage under certain conditions or may
permit channelling and therefore, poor sample sorbent interaction leading to low
analyte retention [12]. Despite these limitations SPE has emerged as a preferred
sample preparation option due to economic and safety reasons.
2.2.3 The four steps of SPE:
Regardless of the intended application, each SPE procedure consists of four
basic steps, i.e., conditioning, sample adsorption, washing and elution, Fig. 2.1
following depicts the four steps of SPE in practice. Other sample pre-treatment
procedures may also be necessary such as filtration to remove particulate matter
and pH adjustment.
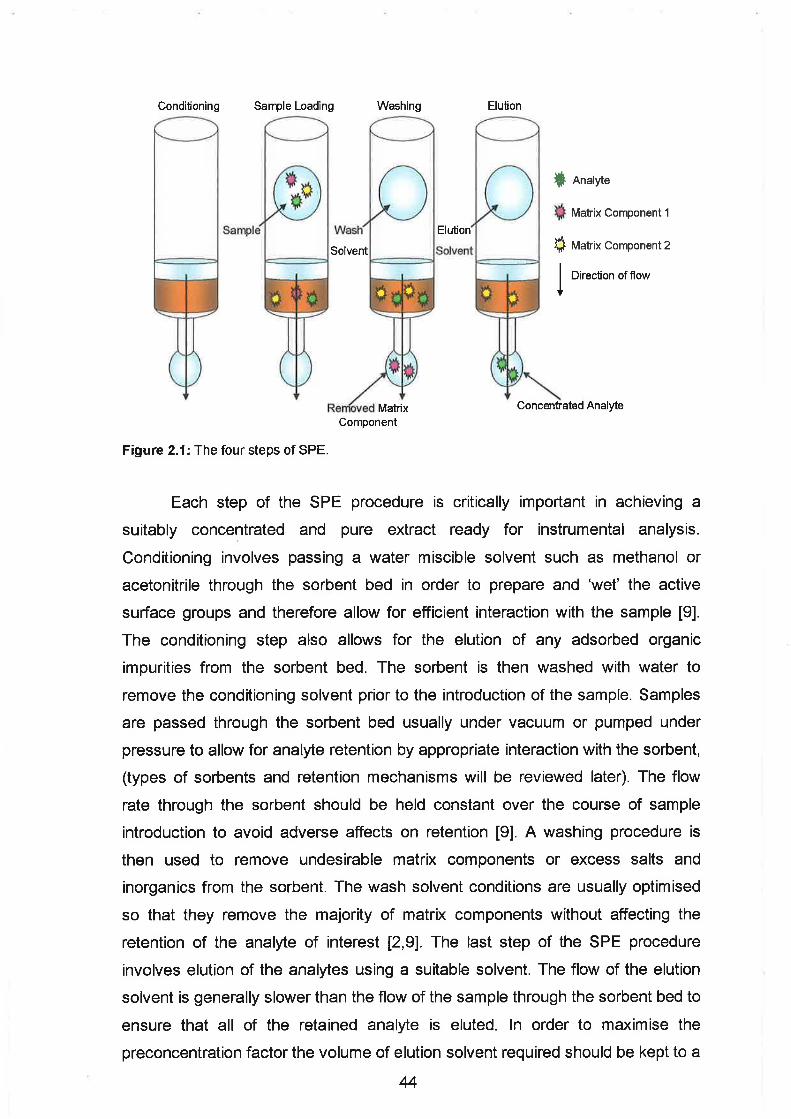
Conditioning Sarrple Loading Washing Elution
Component
Analyte -* Matrix Component 1
$ Matrix Component 2
1 Direction of flow
Concentrated Analyte
Figure 2.1: The four steps of SPE.
Each step of the SPE procedure is critically important in achieving a
suitably concentrated and pure extract ready for instrumental analysis.
Conditioning involves passing a water miscible solvent such as methanol or
acetonitrile through the sorbent bed in order to prepare and 'wet' the active
surface groups and therefore allow for efficient interaction with the sample [9].
The conditioning step also allows for the elution of any adsorbed organic
impurities from the sorbent bed. The sorbent is then washed with water to
remove the conditioning solvent prior to the introduction of the sample. Samples
are passed through the sorbent bed usually under vacuum or pumped under
pressure to allow for analyte retention by appropriate interaction with the sorbent,
(types of sorbents and retention mechanisms will be reviewed later). The flow
rate through the sorbent should be held constant over the course of sample
introduction to avoid adverse affects on retention [9]. A washing procedure is
then used to remove undesirable matrix components or excess salts and
inorganics from the sorbent. The wash solvent conditions are usually optimised
so that they remove the majority of matrix components without affecting the
retention of the analyte of interest [2,9]. The last step of the SPE procedure
involves elution of the analytes using a suitable solvent. The flow of the elution
solvent is generally slower than the flow of the sample through the sorbent bed to
ensure that all of the retained analyte is eluted. In order to maximise the
preconcentration factor the volume of elution solvent required should be kept to a
44
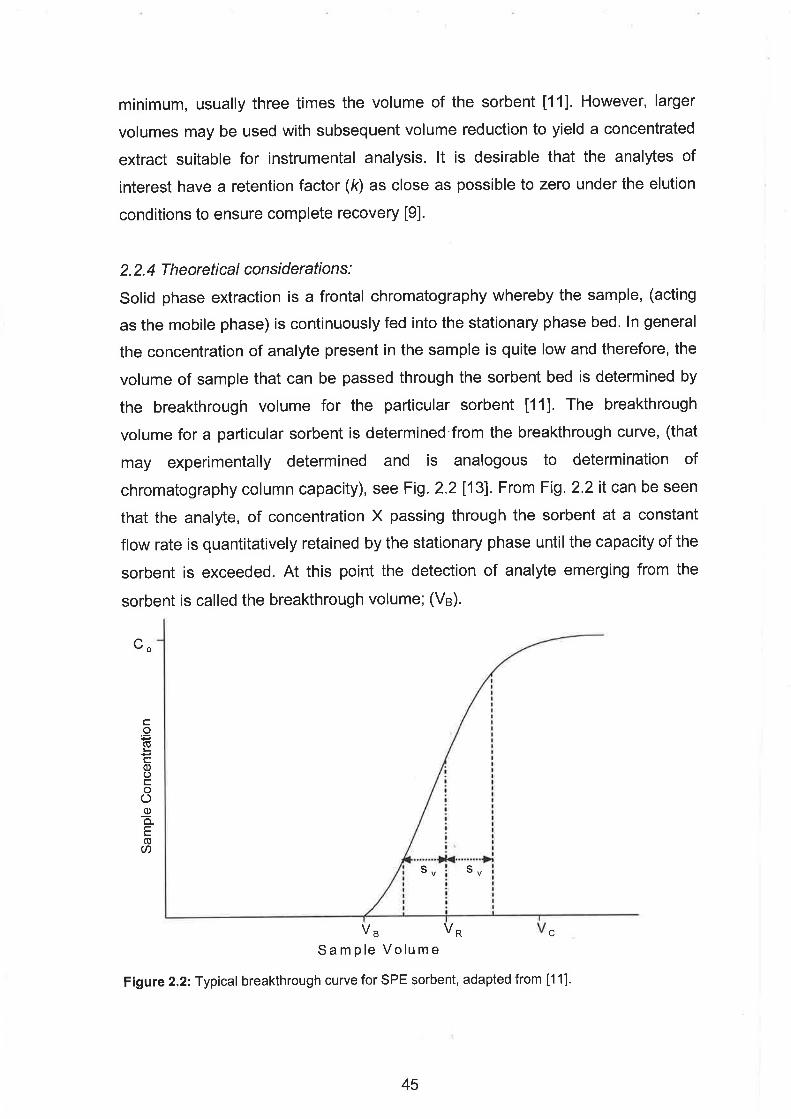
minimum, usually three times the volume of the sorbent [I I]. However, larger
volumes may be used with subsequent volume reduction to yield a concentrated
extract suitable for instrumental analysis. It is desirable that the analytes of
interest have a retention factor (k) as close as possible to zero under the elution
conditions to ensure complete recovery [9].
2.2.4 Theoretical considerations:
Solid phase extraction is a frontal chromatography whereby the sample, (acting
as the mobile phase) is continuously fed into the stationary phase bed. In general
the concentration of analyte present in the sample is quite low and therefore, the
volume of sample that can be passed through the sorbent bed is determined by
the breakthrough volume for the particular sorbent [Ill. The breakthrough
volume for a particular sorbent is determined from the breakthrough curve, (that
may experimentally determined and is analogous to determination of
chromatography column capacity), see Fig. 2.2 [I 31. From Fig. 2.2 it can be seen
that the analyte, of concentration X passing through the sorbent at a constant
flow rate is quantitatively retained by the stationary phase until the capacity of the
sorbent is exceeded. At this point the detection of analyte emerging from the
sorbent is called the breakthrough volume; (VB).
S a m p l e V o l u m e
Figure 2.2: Typical breakthrough curve for SPE sorbent, adapted from [I I].
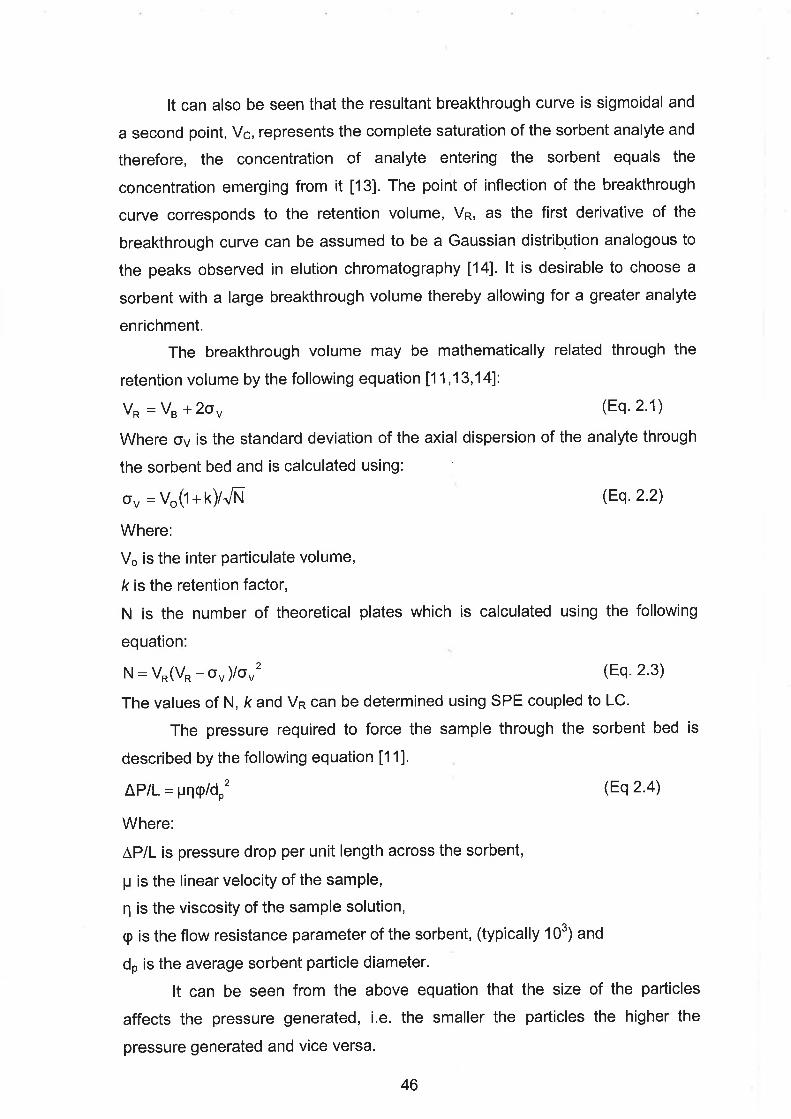
It can also be seen that the resultant breakthrough curve is sigmoidal and
a second point, Vc, represents the complete saturation of the sorbent analyte and
therefore, the concentration of analyte entering the sorbent equals the
concentration emerging from it [13]. The point of inflection of the breakthrough
curve corresponds to the retention volume, VR, as the first derivative of the
breakthrough curve can be assumed to be a Gaussian distribution analogous to
the peaks observed in elution chromatography [14]. It is desirable to choose a
sorbent with a large breakthrough volume thereby allowing for a greater analyte
enrichment.
The breakthrough volume may be mathematically related through the
retention volume by the following equation [ I 1 , I 3,141:
V, = V, + 20, (Eq. 2.1)
Where a" is the standard deviation of the axial dispersion of the analyte through
the sorbent bed and is calculated using:
V (I + k ) / a (Jv= o (Eq. 2.2)
Where:
V, is the inter particulate volume,
k is the retention factor,
N is the number of theoretical plates which is calculated using the following
equation: 2 N = V,(V, - oV )/av (Eq. 2.3)
The values of N, k and VR can be determined using SPE coupled to LC.
The pressure required to force the sample through the sorbent bed is
described by the following equation [I I].
APIL = pq(p/dp2 (Eq 2-41
Where:
APIL is pressure drop per unit length across the sorbent,
p is the linear velocity of the sample,
q is the viscosity of the sample solution,
cp is the flow resistance parameter of the sorbent, (typically 1 03) and
d, is the average sorbent particle diameter.
It can be seen from the above equation that the size of the particles
affects the pressure generated, i.e. the smaller the particles the higher the
pressure generated and vice versa.

The elution volume required for the recovery of greater than 99% of the
analytes from the sorbent of bed volume V, may be calculated by [ I 31:
V, = V,[l + k][I+ (2.3/fi] (Eq. 2.5)
The volume of solvent required may be reduced by minimising the inter
particulate volume of the sorbent or by minimising the value of k.
2.2.5 Sorbent types and retention:
The popularity of SPE is reflected by the large choice of commercially available
sorbents for all manner of applications. As with chromatography columns the
majority of SPE sorbents are either silica or polymeric based. The retention
mechanism depends upon the sorbent used, although reversed-phase sorbents
are by far the most common, normal phase, ion exchange and mixed mode
formats also exist. In order for efficient extractions leading to concentrated pure
extracts it is desired that the sorbent used have a high active surface area in
order to shift the equilibrium in favour of the solid phase and therefore, promote
analyte retention. The interaction between the analytes and the stationary phase
should be suitably strong to allow for retention but easily reversed to guarantee a
high degree of analyte recovery. The sorbent should be pure and free from
impurities that may leach out and contaminate the extract and the sorbent should
allow for good contact between the sample and active groups [9].
Normal phase sorbents are available using inorganic oxides like silica,
alumina or Florisil and allow for the retention of polar analytes based upon
dipole-dipole or hydrogen bonding interaction [ I I ] . Inorganic oxides offer a high
active surface area for interaction and under pH conditions that promote the
dissociation of surface hydroxyl groups allow the sorbent to be used as an ion
exchanger [15]. However, drawbacks of inorganic oxides include pH instability
and the possibility of irreversible adsorption or catalytic transformation of the
adsorbed analyte [ I I]. The majority of applications of normal phase SPE have
reported its use for the clean up of complex matrices and the removal of polar
interferants prior to instrumental analysis [ I 6,17,18].
Reversed-phase sorbents consisting of bonded phase silica, (alkyl silicas
such as Cq8 or C8) or polymeric based materials are widely used for the
extraction of organic pollutants from aqueous solutions [15]. Retention is based
upon either van der Waals interactions or n-n interactions with available groups
[19]. Silica based sorbents are widely used, however, they suffer from limited pH
47

stability. Residual silanol activity can cause problems with the elution of basic
analytes and breakthrough volumes can be small for polar analytes [15].
Polymeric supports using styrene or methacrylate as monomers and divinyl
benzene as cross linking agents offer pH complete stability compared to silica
based materials and the increased interaction and retention involving n-n
interactions [20]. However, reversed-phase polymers are generally hydrophobic
and can shrink or swell in some organic solvents 1211. The hydrophobicity of
polymeric supports can be reduced by the inclusion of a hydrophilic co-monomer
during the polymerisation process; successful examples of such an approach
includes Waters Oasis H L B ~ ~ which incorporates the water wettable N-vinyl
pyrrolidone monomer and can be used directly with aqueous samples and
without the need for a sorbent conditioning step [10,21,22]. Solvents used for the
elution of reversed-phase sorbents include methanol, acetonitrile, acetone
amongst others. Reversed-phase sorbents have been used for the extraction of a
wide variety of organics from numerous sample matrices [23].
Ion exchange sorbents retain analytes based upon electrostatic
interactions between oppositely charged groups on the analyte and the sorbent
surface. In general sulphonic or carboxylic &acid groups are used as cation
exchange groups while quaternary, secondary or primary amines are used as
anion exchangers [24]. Both silica and polymeric based supports have been used
in the preparation of ion exchange resins [ I I ] . Ion exchange sorbents may also
contain some reversed-phase groups thereby allowing the retention of more
bulky organics containing ionisable groups. Another application of ion exchange
sorbents has focused upon the removal of interfering ionic species prior to
analysis by ion chromatography (IC) or capillary electrophoresis (CE) [25,26].
Such processes allow for the removal of nitrate and hydroxide, chloride and
sulphate by passing the sample through sulphonic acid sorbents in the hydrogen,
silver or barium form, respectively.
A rather underused alternative to ion exchange sorbents is to use ion-pair
SPE whereby an ion pairing reagent is added 'to the sample in order to increase
the retention of polar and ionic compounds using reversed-phase sorbents [27].
Typical ion pairing reagents used have included linear alkyl sulphonic acids for
the extraction of basic analytes and amines or quaternary ammonium salts for
the extraction of acidic analytes, concentrations used are generally in the milli-
molar range [27]. Few reports of ion-pair SPE exist in the literature primarily due
48

to the extra uncertainty introduced by the inclusion of an ion pairing reagent, the
extra extraction optimisation steps required and the possibility that the ion pairing
reagent may negatively affect the chromatographic separation or may be
incompatible with MS detection [27]. Reported applications of ion-pair SPE
include the determination of naphthalene sulphonates in water using
tetrabutylammonium bromide as the ion pairing reagent [28], the determination of
pamoic acid in animal serum [29] and the extraction of the diabetes treatment
metformin from plasma using sodium dodecyl sulphate as the ion-pairing reagent
[30]. However, it is worth noticing that in each instance the ion-pair extraction
was followed by determination using ion-pair HPLC with optical detection,
thereby suggesting that the analytical method may have to be changed in order
to facilitate the ion-pair extraction.
2.2.6 The SPE approach used for the determination of PPCPs:
As stated previously, due to the ultra trace levels of pharmaceutical compounds
that may be present in the aquatic environment the preconcentration of samples
prior to instrumental analysis is often a prerequisite and to facilitate this sample
enrichment SPE has been the favoured approach reported to date. Reports of
SPE in both the off-line format using disposable cartridges and in the on-line
mode using short columns for the determination of drug residues have been
reported in recent years.
Of the reported methods, those that use reversed-phase disposable
cartridges in the off-line mode are in the majority. Sorbents used for the
enrichment of drug residues from environmental matrices have included silica C8
and Cq8 [31,32,33], cross linked polystyrene divinyl benzene [34,35,36], phenyl
[37], silica C2 for the extraction of antibiotics [38] and an immunosorbent for the
extraction of sulfamethazine from soil and aquatic samples [39]. Passive
sampling techniques have also been reported [40]. However, the greatest
proportion of reported methods have focused upon hydrophilic lipophilic balanced
polymers such as Waters Oasis H L B ~ ~ or strata-xTM by Phenomenex,
[41 ,42,43,44,45,46,47,48149150151 ,52,53]. The popularity of such polymeric
sorbents is reflected by the reasons discussed previously, i.e. the ability to
extract compounds of varying polarity in a single extraction, increased retention
and ease of use. Aguera et a/. favoured the use of CI8 over Oasis H L B ~ ~ for the
extraction of Triclosan and biphenyl01 from sediment and wastewater due to

increased rates of analyte recovery determined when using the silica based
material, however, it was also reported that the initial elution solvent used,
(methanol) for the evaluation of the SPE sorbents was later replaced with
acetone due to excessive retention of biphenyl01 on the C18 sorbent, however,
the other sorbents investigated were not re-evaluated under the revised
conditions [33]. In some instances the use of tandem SPE was also reported
whereby a sacrificial sorbent was included to selectively retain possible matrix
interferences [54,55,56]. Although such an approach may be useful for the clean
up of particularly matrix rich samples, the extra costs involved and possible loss
of target analytes due to retention on the sacrificial sorbent may make tandem
SPE an unfeasible procedure.
A rather under investigated approach for the determination of ultra trace
organic contaminants and particularly pharmaceutical residues is the use of on-
line SPE. On-line met hods offer greatly increased levels of sensitivity compared
to off-line methods as the entire enriched sample components can be analysed
instead of a small proportion of the concentrated extract. On-line methods also
offer reduced sample handling and the greater possibility for complete
automation. Chen et a/. reported the use of on-line SPE using column switching
for the determination of caffeine as an anthropogenic maker for the tracking of
sewage effluent in natural waters 1571. Detection limits on the range of 0.1 pgL-'
were attainable from 50 mL of sample. Endocrine disrupting chemicals such as
estrogens and alkyl phenols were also determined using an on-line SPE
approach [58,59,60] and method detection limits in the pgL-' range were
frequently reported from moderate quantities of sample (250 mL) [59]. Sancho et
a/. used on-line SPE for the determination of 50 compounds comprising
pesticides and their transformation products from water samples [61] and again
limits of detection in the low ngl-' range from just 1.3 mL of sample were
attainable using LC-MSIMS.
From a theoretical standpoint, on-line SPE allows for the easier
determination of breakthrough volumes compared to off-line extractions thereby
allowing for a rapid optimisation of the sorbent and extraction parameters. A
notable limitation of on-line methods involves the quantity of sorbent that can be
used. As stated previously the pressure generated is proportional to the particle
size, as are the number of theoretical plates available and therefore, the retention
efficiency of the sorbent. Therefore, the use of long columns of small particles for

rapid extraction will be impractical due to the excessive backpressure generated
as would the use of large particles for selective extractions due to low theoretical
plate numbers consequently available. In order for on-line SPE to be a viable and
successful process a careful examination of the sorbent material is essential.
2.3 Analytical Separation:
2.3.7 The importance of liquid chromatography:
An efficient separation of all analytes targeted for environmental monitoring is a
vital component of the overall analytical approach. Due to the complexity of
extracted samples and the lack of detection mechanisms with the ability to
confidently identify and quantitate the analyte of interest in the presence of all
other matrix components, the need for a chemical separation is paramount.
The concept of chromatographic separation was first introduced by Tswett
in 1903 who reported the separation of plant pigments using calcium carbonate
as an adsorbent [62]. Due to the inability of others to repeat the work of Tswett
and language barriers, the method lay dormant for over thirty years until German
scientists investigated and accepted its applicability for the purification of natural
products [63]. A further problem with Tswetts work was the solubility of the
adsorbent in water. However, in the 1940's. Martin and Synge developed an
alternative using partition chromatography based upon the distribution of an
analyte between two liquid phases and followed on with the invention of GC in
the early 1950's [63]. GC developed and matured rather quickly as an analytical
technique due to the influence of the petrochemical industry but a major
drawback of GC was its limited applicability for the determination of analytes with
low volatility or thermal stability. A solution to these problems was offered by
liquid chromatography and many experts in the GC field turned their attention to
a resurgence of liquid phase separations [64]. Modern LC evolved due to the
advance of small porous silica particles, chemically modified stable supports and
more reliable and user friendly instrumentation [63]. Smaller and more
reproducible particles leading to more efficient separations and faster analysis
times were reported through the late 1970's to the 1990's. Just as the
petrochemical industry had played a critical role in the development of GC, the
pharmaceutical industry and its associated regulatory authorities were similarly
important in the development of modern LC. It is now estimated that modern LC
instrumentation is the most important piece of equipment in analytical
laboratories across the world after balances and pH meters [63]. The versatility
and superior selectivity of LC along with the desire to perform faster and more
efficient separations are the current driving forces for the continuous
development and application of modern LC for the separation and determination
of a wide variety of analytes.
Methods for the determination of pharmaceutical residues in
environmental samples have focused primarily on the use of liquid
chromatographic separations rather than the use of GC that was previously
employed for the determination of the majority of environmentally relevant
analytes. The reason why LC is preferred to GC for pharmaceutical analysis is as
previously mentioned; pharmaceuticals are polar molecules of moderate
molecular weight and lack volatility [65]. Reported methods for the determination
of pharmaceutical residues reflect the superiority of LC for the determination of
polar analytes.
2.3.2 Liquid chromatography - theoretical considerations:
Chromatography may be defined as the distribution of analytes between two
phases; a stationary phase and a moving mobile phase. The separation arises
due to differential rates of migration of the analytes through the chromatographic
column based upon their affinity for either the stationary or the mobile phase [66].
In liquid chromatography the mobile phase consists of a solvent or a mixture of
solvents whilst the stationary phase is a solid support with or without chemical
modification. Depending upon the polarity of the stationary phase the separation
is termed either normal phase; whereby the stationary phase is a polar solid and
the mobile phase is a nonpolar solvent, or reversed-phase; whereby the
stationary phase is a nonpolar support and the mobile phase is a polar solvent
[67]. As reversed-phase separations are the most common, indeed as all the
reported methods for the determination of pharmaceutical residues to date are
based upon reversed-phase LC, normal phase LC will no longer be considered in
this review.
The concept of analyte retention is demonstrated by Fig. 2.3. A three
component mixture is injected onto the top of the column and is carried through
the column by the continuous flow of mobile phase. The separation of the mixture
arises due to differential migration through the column.
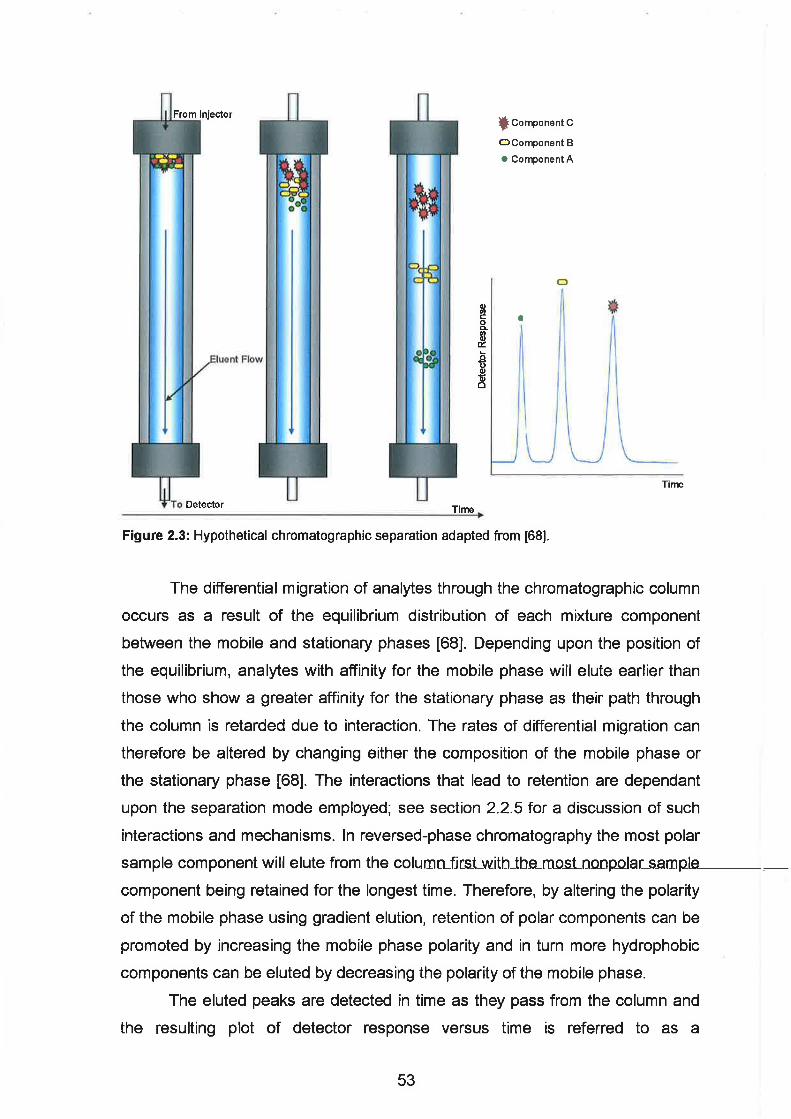
#component C
OComponent B
Component A
?ector ' uw Time
Figure 2.3: Hypothetical chromatographic separation adapted from [68].
The differential migration of analytes through the chromatographic column
occurs as a result of the equilibrium distribution of each mixture component
between the mobile and stationary phases [68]. Depending upon the position of
the equilibrium, analytes with affinity for the mobile phase will elute earlier than
those who show a greater affinity for the stationary phase as their path through
the column is retarded due to interaction. The rates of differential migration can
therefore be altered by changing either the composition of the mobile phase or
the stationary phase [68]. The interactions that lead to retention are dependant
upon the separation mode employed; see section 2.2.5 for a discussion of such
interactions and mechanisms. In reversed-phase chromatography the most polar
sample component will elute from the colum~ffjcs_t~\~ith_the~rn~st~n~ngnIa~sampk
component being retained for the longest time. Therefore, by altering the polarity
of the mobile phase using gradient elution, retention of polar components can be
promoted by increasing the mobile phase polarity and in turn more hydrophobic
components can be eluted by decreasing the polarity of the mobile phase.
The eluted peaks are detected in time as they pass from the column and
the resulting plot of detector response versus time is referred to as a

chromatogram. The eluting peaks are generally bell shaped similar to the
Gaussian distribution [69]. The amount of time it takes a component to elute from
the column and be detected following injection is referred to as the retention time
(TR) and is characteristic for that component under the specific conditions used.
The time taken for the mobile phase to pass through the column is assigned (To).
The retention factor (k) calculated using the following equation, is a numerical
representation of the actual quantity of time a component spends in the
stationary phase,
(Eq. 2.6)
Low values of k for a particular component indicate that the majority of its time is
spent in the mobile phase and vice versa. It is generally desirable to have k
values in the range of 1-5 which suggests that all analytes are suitably but not
excessively retained on the column [67]. If two or more sample components have
the same k value they will not be separated under the conditions used [69]. The
ratio of retention factors of two sample components is called the separation factor
(a), given as:
k a = 2 (Eq. 2.7) kl
The higher the value of a, the greater the degree of separation between the two
components. If the value of a equals one, the two sample components will not
separate and will therefore coelute [70].
The efficiency of the separation can be- evaluated from the degree of
resolution between the separated components calculated using the following
equation:
(Eq. 2.8)
Where W is the baseline width of peaks 1 and 2 respectively.
The larger the value of Rs the more resolved the two peaks are. Rs value
of 1.5 or greater suggests that the two components are completely baseline
resolved [68]. A quantitative estimation of the efficiency of the column and
therefore the separation is determined by calculating the number of theoretical
plates (N) using the following equation:
(Eq. 2.9)
The concept of the theoretical plate was first presented by Martin and Synge in
an attempt to elucidate the theory of the separation. The term arises from the
theory of fractional distillation [67]. Each plate can be assumed to represent a
single equilibrium distribution of the analyte between the mobile and stationary
phases and therefore the higher the value of N, the greater the number of
equilibrium distributions involved and consequently the more efficient the
separation. The effective height of a theoretical plate (H) may be determined by
dividing the length of the column by the theoretical plate count. The smaller the
value of H the greater the efficiency of the peak.
The resolution of the separation is dependant upon the above variables
and can be calculated mathematically using the following equation:
(Eq. 2.10)
Where k2 is the retention factor of peak 2 and k,, is the average retention factor
of the two components.
From the above equation it can be seen that the resolution can be
improved by increasing N, i.e. by increasing the column length, by altering the
selectivity of the separation and increasing the retention of the analytes.
2.3.3 Band broadening in liquid chromatography:
Although samples are applied to chromatographic columns as discrete plugs the
resultant peaks become distorted during their passage through the
chromatographic system leading to the formation of bell shaped peaks similar to
the Gaussian distribution. The diffusive variance associated with a Gaussian
peak is described by the expression [70]:
a2 = 2D,t (Eq. 2.1 1)
Where:
Dm is the diffusion coefficient and
t is the time spent within the chromatographic system.
From the above expression it can be deduced that the width of the
chromatographic band is proportional to the square root of the retention time and
therefore, increasing the retention time leads to the formation of broader peaks
[70]. The actual processes that assist with the broadening of chromatographic
peaks can be attributed to column and extra-column effects.
Extra-column effects are processes that cause the spreading of
chromatographic bands outside the column and arise primarily due to
mismatches in tubing diameter or large sources of dead volume within the
system, e.g. large volume detector flow cells etc. Extra-column effects can be
minimised by choosing suitable lengths of tubing of appropriately small internal
diameter in order to minimise the loss of the resulting separation or the
dispersion of the injected sample within the mobile phase prior to entering the
chromatographic column.
The contribution of the chromatographic column to band broadening can
be evaluated using the van Deemter equation which states that the separation
efficiency, (in terms of H) is affected by the mobile phase flow rate and the
column itself, [70]:
(Eq. 2.12)
Where:
A, B and C are constants for a column and stationary phase and
p is the mobile phase linear velocity.
Therefore, from the above equation it can be seen that the mechanisms of
band broadening are independent of, directly proportional and inversely
proportional to the flow of mobile phase through the column [70].
The A term in Equation 2.12 is referred to as the multiple path term or
Eddy diffusion and describes the multiple possible random paths of the molecule
through the particulate bed leading to the distortion of the chromatographic band
due to the fact that some molecules will take a shorter path than others and will
consequently elute from the column earlier [69]. Such a fact is depicted pictorially
in Fig. 2.4.
The B term in the van Deemter equation represents longitudinal diffusion
along the axis of the column. Longitudinal diffusion arises due to the random
distribution of sample molecules in all directions due to the existence of a
concentration gradient, from an area of high concentration inside the band to
areas of low concentration on the edges of the band [68,70]. The net result as
can be seen in Fig. 2.4 again leads to the spreading of the chromatographic
band.
The C term of the van Deemter equation accounts for the mass transfer of
each analyte from the mobile phase to the stationary phase and back again.

From Fig. 2.4 it can be seen that there is a layer of mobile phase surrounding
each particle that is essentially stagnant when compared to the mobile phase in
the inter particulate spaces. Therefore, this stagnant layer of mobile phase may
contribute to band broadening as molecules present in this layer are not moving
at the same velocity when compared to molecules in the 'bulk' mobile phase [68].
,Eddy Diffusion (A term)
Longitudinal Diffusion (B ter Initial / \With time
Mass Transfer (C term) --IT- /Bulk Mobile Phase
!--stagnant Mobile Phase
,Stationary Phase
Silica Particle
Figure 2.4: A pictorial representation of band broadening mechanisms, adapted from [68,69,70].
The stagnant mobile phase is also important as it impedes the interaction
of molecules in the bulk mobile phase with the stationary phase, i.e. sample
molecules must diffuse from the bulk into the stagnant layer and then from the
stagnant layer onto and into the stationary phase and then back out again [68].
The net effect leads to a retardation of molecular movement again leading to a
distortion of the chromatographic band. As these processes are continuously
occurring as the sample passes long the length of the column it can be seen that
the longer the column residence time the greater the effect of band broadening.
Therefore the effects of band broadening need to be minimised in order to
maximise the efficiency and resolution of the separation and also to avoid
problems with quantitation. A plot of H versus p should in theory yield a minimum
value of H that suggests the optimum linear velocity for maximum efficiency.
Another alternative is offered by capillary or monolithic columns which reduce the

A and C terms of the van Deemter equation allowing for more efficient
separations.
2.3.4 LC Instrumentation:
Instrumentation for LC consists of basic but integral parts, i.e. a pump capable of
delivering solvents steadily at high pressures, a sample injection system, the
chromatography column, a detector to monitor the column output and a data
handling system. It is essential that all components of the system operate
efficiently and reproducibly, e.g. disturbances in solvent delivery will manifest
themselves as baseline noise in the detector output and therefore, cause a
reduction in the sensitivity of the analysis.
A variety of pumping systems for LC have been developed ranging from
displacement pumps whereby the solvent is forced out of the reservoir by
external pressure to syringe pumps, however, the majority of modern LC pumps
use double head reciprocating pumps, a schematic of which is shown in Fig. 2.5.
Such a pump operates using sinusoidal dual piston movements that are 180' out
of phase and allows for a constant flow of solvent with minimal pulse disturbance
[71]. Dual head reciprocating pumps also allow for the performance of flow
gradients as the volume delivered can be changed rapidly be adjusting the
displacement stroke volume or the stroke frequency [68].
The introduction of samples into a high pressure mobile phase as a
discrete plug to avoid band broadening and also to avoid disturbing the mobile
phase flow is usually performed using sample loop type injectors, e.g. Rheodyne
injectorsTM [71], (see Fig. 4.1). Injection is performed by loading the sample into a
loop of defined volume when the valve is in the load position, by switching the
valve to the inject position the mobile phase is redirected through the sample
loop and carries the loaded sample onto the chromatographic column 1721. Loop
injectors are also easily automated and are incorporated into autosamplers by
many manufacturers. Column switching and selection can also easily be
performed using sample loop type injectors.

f Solvent out to
High Pressure Piq0n
CAM Wheel for Piston Moveme1
Solw from Reservoir Sapphire Ball
Figure 2.5: Dual head reciprocating pump, adapted from [73].
Detection of separated bands as they emerge from the chromatographic
column is normally performed by monitoring a bulk property of the mobile phase,
i.e. a change in refractive index due to the presence of dissolved solute or more
selectively by monitoring a property of the solute itself, e.g. its UV absorption as it
elutes from the column [68]. Detectors have been developed and commercialised
that exploit some property of the analyte. However, regardless of the detector
type there are a number of characteristics that a detector should ideally fulfil.
These include; sensitivity, linearity, stability and reproducibility, a rapid response,
selectivity and the detector must not contribute significantly to band broadening
[72,74]. The detector used must also be compatible with the separation
conditions, e.g. electrochemical detectors cannot be used with gradient elution or
only volatile mobile phase modifiers may be used in conjunction with mass
spectrometry [70]. Due to its versatility and fulfilment of many of the above
conditions the UV detector is the most commonly used for the detection of
pharmaceutical analytes, e.g. it is estimated that approximately 95% of all
separations of pharmaceuticals using LC employ UV as the detection mechanism
~ 5 1 .
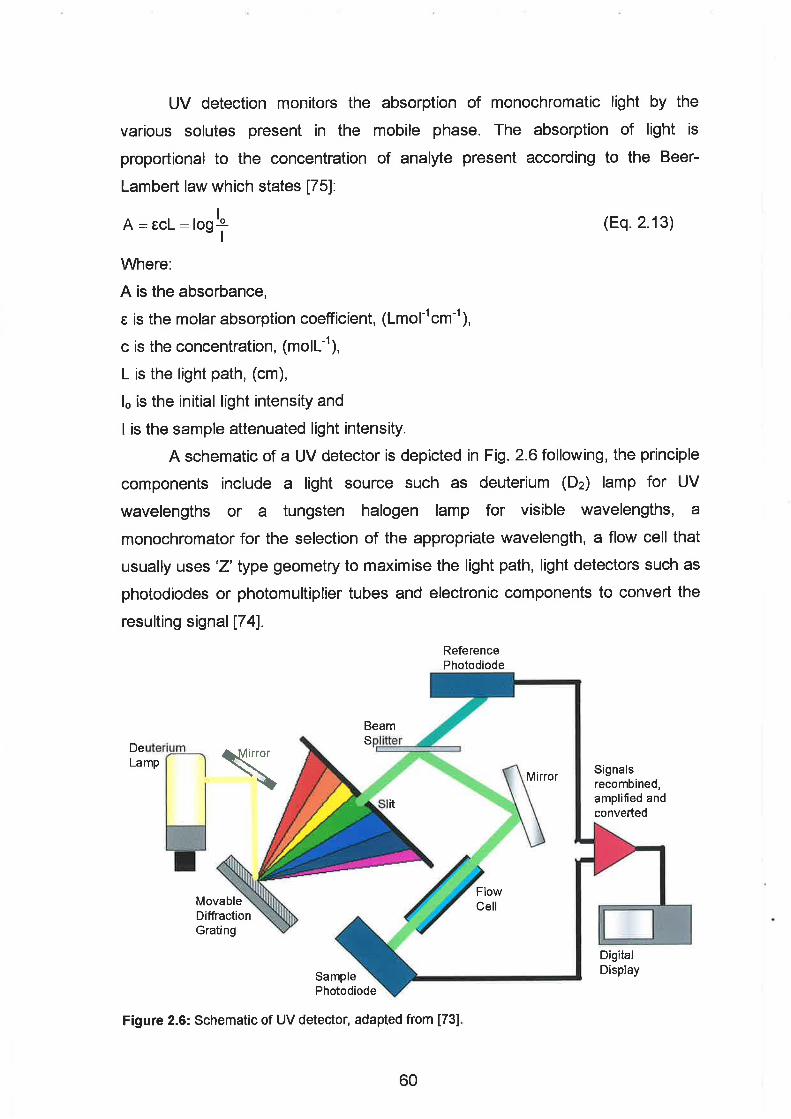
UV detection monitors the absorption of monochromatic light by the
various solutes present in the mobile phase. The absorption of light is
proportional to the concentration of analyte present according to the Beer-
Lambert law which states [75]:
(Eq. 2.13)
Where:
A is the absorbance,
E is the molar absorption coefficient, (~rnol~~crn~') ,
c is the concentration, OIL-I), L is the light path, (cm),
I, is the initial light intensity and
I is the sample attenuated light intensity.
A schematic of a UV detector is depicted in Fig. 2.6 following, the principle
components include a light source such as deuterium (D2) lamp for UV
wavelengths or a tungsten halogen lamp for visible wavelengths, a
monochromator for the selection of the appropriate wavelength, a flow cell that
usually uses 'Z' type geometry to maximise the light path, light detectors such as
photodiodes or photomultiplier tubes and electronic components to convert the
resulting signal [74].
Reference Photodiode
Deuterium irror Lamp
Diffraction Grating
Beam
7 Sample Photodiode 7
r Flow
Signals recombined, amplified and converted
Digital Display
Figure 2.6: Schematic of UV detector, adapted from [73].
The popularity of UV detectors is due to their versatility. The majority of
analytes contain some chromophoric moiety or indeed can be tagged with a
chromophore to aid with their detection. UV detectors are quite sensitive with
detection limits in the range of 100 pg - I ng achievable [72].
The use of photodiode array detectors adds an extra degree of selectivity
to the analysis with the ability to record complete UV spectra over the course of
the elution of the peak. Therefore, qualitative information may be obtained using
spectral matching. Other advantages of the use of photodiode array detectors
includes the assessment of peak purity and deconvolution of unresolved peaks.
However, for such an approach to be successful it requires the unresolved
components to have different UV spectra [74].
2.3.5 Column chemistry & monolithic silica:
Most modern forms of LC are performed using stationary phases consisting of a
particulate support that may or may not be chemically modified. This is especially
true in reversed-phase chromatography whereby columns are usually based
upon silica functionalised via siloxane bonds with nonpolar hydrophobic organic
chains such as C8, CI8 etc. The preparation of such reversed-phase materials is
performed by reacting organochlorosilanes with silanol groups on the silica
surface, for a detailed review see that of Kirkland [76]. The widespread use of
silica as the support material is due to the ability to manufacture silica particles
with suitably small diameters and a controlled pore distribution. Silica also has
high mechanical strength and provides a large active surface area that promotes
mass transfer [77]. However, the biggest limitation to the use of silica as a
chromatographic support is its pH instability at acidic and basic pH values and
also the presence of un-functionalised and un-endcapped silanol groups on the
surface that interfere with the chromatographic process, leading to poor peak
shapes [77]. Recent trends in LC have been driven by the need for fast and
efficient separations in the fields of pharmaceutical and combinatorial chemistry
research, metabolomics and proteomics [78]. To fulfil these aims columns with
smaller particles and narrower internal diameters have been developed.
However, limitations in the form of excessive backpressure generation or
incapability with standard LC instrumentation can be encountered [78].
A relatively new development in the field of LC separations is the use of
monolithic based stationary phases. Monoliths consist of a single piece of

homogenous phase and have been reportedly constructed using polymeric, (e.g.
polymethacrylates) or silica based materials [79]. The history of polymeric
monoliths has recently been reviewed by Tennikova and Reusch [80]. Monolithic
silica was first reported as a chromatographic support by Japanese scientists at
the 22"d International Symposium on High Performance Liquid Phase
Separations and Related Techniques 1998, however, the technology was
subsequently further developed and commercialised by Merck KGaA [79]. The
preparation of monolithic silica columns is based upon sol-gel technology, which
involves the hydrolysis and condensation of metal alkoxides to form ceramic like
materials. A detailed account is beyond the scope of this text and therefore, the
reader is referred to the reviews of Collinson [81] and lshizuka et a/. [82]. The
commercially available monolithic columns are imparted a unique bimodal pore
structure consisting of macropores of -2 pm internal diameter and mesopores of
-13 nm internal diameter [83,84,85]. The macropores act as flow through pores
whilst the mesopores provide a large active surface area on which the separation
may occur. The bimodal pore structure also imparts a significantly higher
permeability to the monolith when compared with particle packed columns [85].
The increased level of permeability may be attributed to the absence of inter
particulate voids and pools of stagnant mobile phase that lead to the generation
of higher backpressure in particle packed columns [86]. Therefore, monoliths
generate less backpressure and allow for increased rates of mass transfer and
as a consequence higher separation efficiencies compared to particle packed
columns may be achieved [87,88]. Such properties allow for monolithic columns
to be operated at high flow rates without compromising the separation efficiency.
The adsorption capacity of monolithic columns may also be higher than their
particle packed counterparts which allows for increased analyte stationary phase
interaction and therefore, efficiency and selectivity on monolithic columns is often
equivalent to that attainable on 3.5 ym particulate columns 1891. To date
monolithic silica columns are only commercially available in either bare silica, C8
or CI8 phases whilst polymeric monoliths such as C I M ~ ~ disks are available in a
choice of chemistries allowing for easy column coupling for multidimensional
chromatography [86].

2.3.6 The LC separation approach used for PPCP determination:
As stated previously in section 2.1, all reported methods for the determination of
pharmaceutical residues in environmental samples have focused upon the
development of reversed-phase separation methods prior to MS with either
electrospray (ESI) or atmospheric pressure chemical ionisation (APCI). In the
vast majority of methods a CI8 column was used along with a mobile phase
consisting of water and either methanol or acetonitrile. Modifiers used for
adjusting the pH or ionic strength have included acetic or formic acids or
ammonium formate and ammonium acetate [38,45,48,49,50,90]. Blackwell et a/.
published two methods for the determination of three antibiotics again using a
CI8 column [55,56], a mobile phase consisting of tetrahydrofuran, acetonitrile and
water containing trifluoroacetic acid (TFA), was used. In one instance, UV
detection was used with multiple wavelength monitoring, i.e. 285, 355, 260 and
370 nm for extra selectivity whilst on the other occasion pre-column fluorescence
derivatisation using fluorescamine as a fluorophore was employed [56]. Two
reports concerning the use of C8 phases were presented by Augeura et a/. [33]
for the determination of Triclosan and biphenyl01 in marine sediments and also by
Miao et a/. for the determination of carbamazepine and its metabolites. Augeura
et a/. used a mobile phase of ammonium hydroxide at pH 10.5 along with
acetonitrile to promote the dissociation of Triclosan prior to ESI-MS
determination, [33], however, it is worth recalling that the upper recommended
pH limit of silica based materials is pH 7.5, (section 2.2.5). A complex mobile
phase was used by Miao et a/. [43] consisting of 2:3 methanol acetonitrile and
ammonium acetate in water. Vandetford et a/. employed a CIS column with a
methanol water mobile phase modified with formic acid for the separation of
acidic and basic pharmaceuticals, personal care products such as Triclosan and
hormones. Detection was performed using ESI-MS, however, the mobile phase
flow rate was 0.70 m~min", with no adverse affects on the ESI intensity as a
result of the high flow rate being reported. Other detection mechanisms have
also been reported, although, reports of such are scarce. Santos et a/. report the
use of fluorescence detection for the determination of pharmaceutical residues in
treated wastewater [91].
Capillary LC-MS was used by van der Ven et a/. for the determination of
diazepam in aquatic samples [92]. The limit of detection for the analysis was
approximately 0.1 n g m ~ ' for a 5 pL injection of un-preconcentrated sample into

the CIS capillary LC-MS system, as with normal and microbore methods a mobile
phase consisting of ammonium acetate and methanol was employed but with a
flow rate of only 15 p~min". Another alternative approach was reported by
Quintana and Reemtsma [93] who employed ion-pair LC with tandem MS
detection for the determination of acidic pharmaceuticals. Tributylamine was
used as the ion-pairing agent in a methanol water mobile phase and a phenyl-
hexyl column. The ion-paring agent was indeed found to aid retention of acid
drugs such as salicylic acid but its affects were less pronounced with decreasing
analyte polarity and an incomplete separation of the analytes was reported. An
ion chromatography approach was also reported by Sacher et a/. who used anion
exchange chromatography in conjunction with inductively coupled plasma mass
spectrometric detection (ICP-MS) [94]. Reports of capillary electrophoretic
separations are also rare, Buchberger et a/. report the use of CE-MS for the
determination of antidepressants in wastewater and surface water in association
with SPE [95]. Detection limits reported concern only an instrumental validation;
however, low p g ~ - l levels were easily achieved in a relatively fast run, less than
20 minutes per sample. It should be noted that the majority of published methods
lack complete separation of the target analytes and in many cases excessive
runtimes or unsuitable conditions are employed. Therefore, further research to
improve the chromatographic performance of many monitoring methods needs to
be undertaken.
2.4 Selective Detection usins Mass Spectrometrv:
2.4. I The power of mass spectrometry:
Mass spectrometry; (MS) is the separation and identification of gaseous ions
based upon their mass to charge ratio (mlz) [96]. MS is one of the most powerful
tools available to the analytical chemist as it permits elemental and isotopic
analysis, structural elucidation of molecules and surfaces and when used in
conjunction with an analytical separation technique, a wealth of qualitative and
quantitative data may be obtained for complex mixtures [96]. MS was pioneered
through the research of Thomson and Aston, both Nobel Prize winners in physics
and chemistry respectively for their work investigating the separation of non
radioactive isotopes using electric and magnetic fields [97]. The technique
received much attention and developed rapidly with the first commercial mass
spectrometer becoming available in 1948 [98]. Other significant developments in
MS were the introduction of GC-MS instrumentation in 1956 followed by the
development of liquid phase introduction techniques in the 1980s [98]. The most
recent Nobel Prize winners for pioneering research in the MS field were Fenn
and Tanaka in 2002 for the development of ionisation methods for the mass
spectrometric analyses of biological macromolecules [98].
The importance of MS in environmental analysis, especially for the
identification of pharmaceutical residues has been discussed by Daughton [99]
who noted the necessity for highly sensitive and selective analytical methods
when attempting to evaluate the sources of, and risks posed by drugs and also
for the forensic identification of other previously unknown environmental organic
micro contaminants. It is therefore, not surprising that the majority of published
methods for determining the extent of environmental contamination with
pharmaceutical residues report the use of either single or tandem MS detection
based upon the ability to unambiguously identify compounds using mass spectral
data.
Mass spectrometers consist of the following components, a sample
introduction system, an ionisation source, a mass analyser and a detection
system. A discernible operating characteristic of MS is the need for the
instrument to be kept under high vacuum in order to ensure that ions reach the
detector without undergoing unwanted gas phase collisions. Therefore, the
incompatibility with LC that uses significant quantities of solvents over the course
of the separation is clearly apparent. Other notable incompatibilities are that LC
is suited to the analysis of polar non-volatile compounds, while MS requires the
formation of gaseous ions and also the use of unsuitable mobile phase modifiers.
The development of suitable interfaces to remove the mobile phase and convert
dissolved solutes into gaseous ions was a necessity for the coupling of LC with
MS. The inte'rface serves two purposes; it facilitates the use of LC as a sample
introduction technique for MS and also the use of MS as a chromatography
detector. As a consequence MS must fulfil the requirements of a suitable LC
detector [loo]. Initial attempts to interface the two techniques focused upon the
use of a moving belt interface. However, the technology rapidly improved with
each new available interface superseding the previous [loo]. Today only two
interfaces are commonly used in LC-MS analjlses, ESI and APCI. Both of these

have been applied to the determination of pharmaceutical residues and will now
be reviewed.
2.4.2 Atmospheric pressure Interfaces for LC-MS; ESI & A PC/:
As said previously in section 2.4.1, there is an apparent mismatch in the coupling
of LC with MS and therefore, an interface is required not only to remove the
mobile phase but also act as a link between the atmospheric pressure output of
the LC and the high vacuum MS. The design of suitable interfaces must therefore
include components to allow for liquid introduction, an atmospheric pressure
region wherein the ionisation occurs, ionic sampling apertures, a vacuum
interface and finally ion optics to ensure the ionised analytes reach the mass
analyser [ l o l l . The two interfaces currently used for the vast majority of LC-MS
applications are the ESI and APCl interfaces.
The concept of ESI was first described by Fenn and co-workers in 1984
for the mass spectrometric analysis of proteins and macromolecules from the
liquid phase [97]. ESI involves the transitory of ionised species from the liquid
phase into the gas phase as individual entities [102]. The mechanism of
electrospray can be seen in Fig 2.7. ESI involves passing a solution of the
analyte, i.e. the column effluent, through a capillary to which a high potential is
applied, the effect of the applied electric field causes the generation of a fine mist
of highly charged droplets as the solution emerges from the capillary [102]. The
charged droplets are attracted towards the endplate electrode due to the
influence of both the potential difference and the pressure gradient that exists
within the source, during this time the droplets reduce in size as a result of
solvent evaporation and also due to 'coulomb explosions' that occur due to the
build up of ions of one polarity on the surface of the drop, creating coulomb
forces of repulsion that are greater than the surface tension of the liquid, (i.e. the
Rayleigh limit) [100,103,104,105]. The net result is the formation of a smaller
droplet rich in one ion polarity and the process reoccurs until the formation of
extremely small droplets in the range of 3-10 nm diameter that are capable of
producing gas phase ions upon fission [I 02,103,104,105]. The formed ions are
then sampled using skimmer cones and transported through the ion optics to the
mass analyser.
ESI is an extremely soft ionisation technique and yields the production of
gaseous ions with the same charged state as was present in the liquid phase, the

process is also non energetic and as a consequence none or very little molecular
fragmentation will occur [102]. The mechanism can be perceived to involve a
step-wise removal of solvent molecules from the analyte without detrimentally
affecting the confirmation of the analyte. As a result the technique is important in
the investigation of biologically important macromolecules [ I 03,1041.
I Column Eluate+
Atmospheric Pressure
Capillary Endpl P
Solvent Droplet approaching C ~ u l ~ r n b Explosion and Evaporation Rayleigh Limit ion evaporation yielding
desolved ions
Figure 2.7: The mechanism of electrospray ionisation, adapted from [loo].
Choosing suitable LC separation parameters is also extremely important
when using ESI-MS as a chromatography detector. The flow rate used must be
compatible with ESI as it affects the size distribution of the aerosol droplets and
therefore, the level of charge on each droplet [104]. Mobile phase modifiers that
are suitably volatile must be used to avoid build up of residues on the source
components. Accordingly, it is worth recalling that the approach used by the
majority of analysts for the determination of pharmaceutical residues has focused
upon the use of microbore LC columns with mobile phases containing acetic or
formic acids or their volatile ammonium salts (section 2.3.6 previous).
The production of ions by ESI is often heavily dependant upon solution
chemistry and is highly suited to the analysis of ionic compounds, polar and
neutral compounds that may be readily protonated or deprotonated by altering
the solution conditions, e.g. pH and compounds that can be oxidised or reduced
under the applied electric field at the capillary tip [104]. Pharmaceuticals are
therefore suited to ESI-MS analysis as they are often weak acids or bases and
contain polarisable groups, e.g. carbonyl moieties etc.
For compounds that do not fulfil the above requirements APCl may be
used as an alternative. In APCl the column effluent is nebulised and heated to
form an aerosol. lonisation is then achieved using a corona discharge (i.e. the
ionisation of the nebuliser gas using a high applied voltage to the tip of a metallic
electrode) [ I 00,104,106,107]. The corona discharge ionises both analyte and
eluent molecules and both species can react by gas phase ion molecule
interactions such as proton transfer etc. as shown in Fig. 2.8, leading to
ionisation of the analyte which is then sampled in an analogous manner to ESI
[100,104,106,107]. As with ESI, APCl is a rather 'soft' process leading to the
formation of molecular ions via protonation, deprotonation or adduct formation
with mobile phase modifiers. [ I 041.
A significant difference between the two interfaces is the LC flow rates that
can be accommodated. As mentioned previously ESI demands lower flow rates
in order to be efficient, however, APCl is compatible with flow rates normally
used in conjunction with standard bore chromatography columns, even up to
2.00 m~min- ' [IOO]. Higher flow rates help prevent damage to the corona needle
and the stability of the discharge. APCl is extremely useful for the ionisation of
nonpolar to moderately polar compounds that posses a degree of volatility and
thermal stability as common APCl performance temperatures are in the region of
350-500°C [loo]. APCI-MS has also been applied to the determination of drug
residues in environmental samples, particularly for analytes that exhibit no ESI
response, e.g. Loffler and Ternes used LC-APCI-MS for the determination of
acidic analgesics and the parasiticide ivermectin in river sediments [34] and
Vanderford et a/. employed LC-APCI-MS for the analysis of hormones in aquatic
samples, [41]. Other reported applications of LC-APCI-MS include the
determination of antifouling agents [ I 081, narcotics [I091 and pesticides [ I 101.

Analytt & Eluent Vapor W J a r y Endplate
I Heater
1. Column Eluate-.-
v Nebuliser Gas
Atmospheric Pressure
Heater
Analyte I
;Q+ Collision Region " 2 0
High Voltage Corona Discharge Needle
>;o':ass Analyser 7 Figure 2.8: The mechanism of APCI, adapted from 1981.
2.4.3 Mass analysers used in LC-MS:
After the interface has ionised the sample molecules or transferred them into the
gas phase, they are then swept into the mass analyser as a result of potential
dfferences and a vacuum gradient. The mass analyser separates ions based
upon their mlz ratio. Mass analysers frequently reported in conjunction with liquid
chromatography include the quadrupole, the ion trap and the time of flight mass
analysers.
Quadrupole mass analysers consist of four rods that are arranged in a
perfectly parallel orientation as depicted in Fig. 2.9. The rods are oppositely
charged and have a fixed direct current (DC) potential and an oscillating radio
frequency (RF) potential applied to them [I 1 I]. Introduced ions are passed along
the centre of the quadrupole and by varying the RF potential ions of different mlz
can be selectively allowed to pass through and reach the detector thereby
permitting the collection of the mass spectrum [I 1 I].
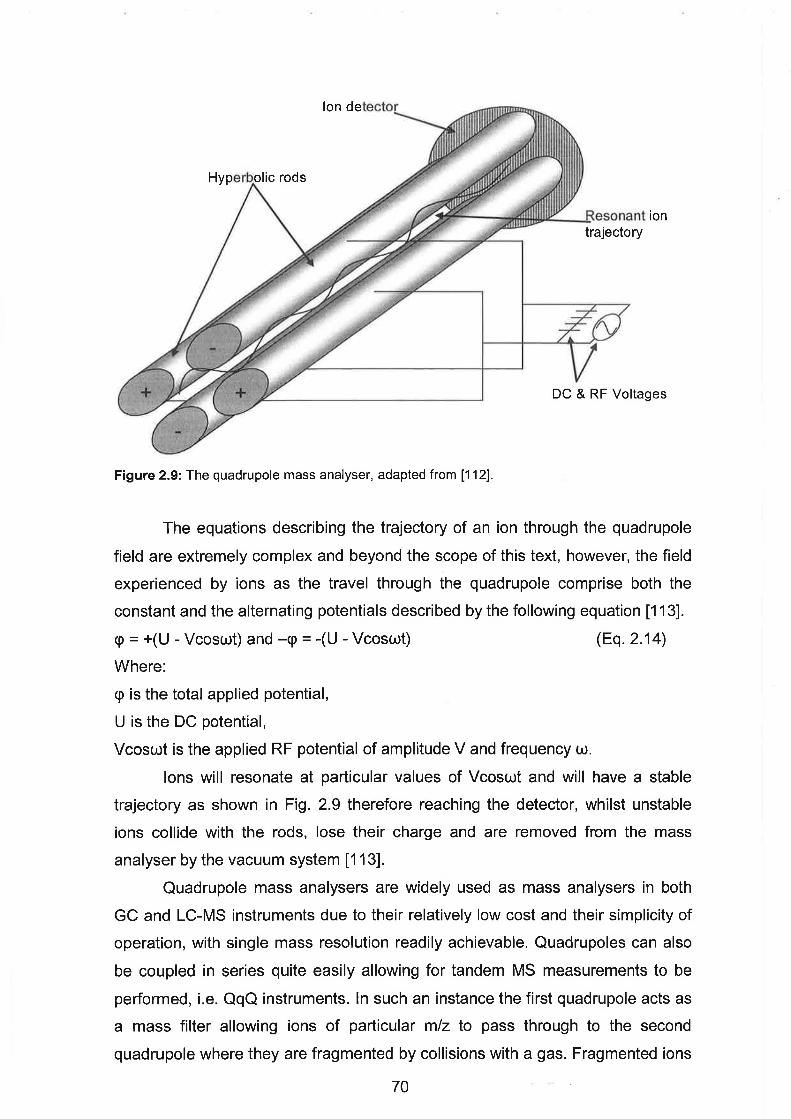
u
Figure 2.9: The quadrupole mass analyser, adapted from [I 121.
The equations describing the trajectory of an ion through the quadrupole
field are extremely complex and beyond the scope of this text, however, the field
experienced by ions as the travel through the quadrupole comprise both the
constant and the alternating potentials described by the following equation [ I 131.
cp = +(U - Vcoswt) and -cp = -(U - Vcoswt) (Eq. 2.14)
Where:
cp is the total applied potential,
U is the DC potential,
Vcoswt is the applied RF potential of amplitude V and frequency w.
Ions will resonate at particular values of Vcoswt and will have a stable
trajectory as shown in Fig. 2.9 therefore reaching the detector, whilst unstable
ions collide with the rods, lose their charge and are removed from the mass
analyser by the vacuum system [I 131.
Quadrupole mass analysers are widely used as mass analysers in both
GC and LC-MS instruments due to their relatively low cost and their simplicity of
operation, with single mass resolution readily achievable. Quadrupoles can also
be coupled in series quite easily allowing for tandem MS measurements to be
performed, i.e. QqQ instruments. In such an instance the first quadrupole acts as
a mass filter allowing ions of particular mlz to pass through to the second
quadrupole where they are fragmented by collisions with a gas. Fragmented ions
70 -.

then pass into the third quadrupole where the fragmented ions are measured and
identified [ I 1 I ] . Tandem MS measurements can be used to increase selectivity,
sensitivity and structural elucidation, approaches frequently used in the articles
cited previously for the determination of pharmaceutical residues, (section 2.3.6).
The ion trap mass analyser is a form of quadrupole and consists of two
end-cap electrodes and a ring electrode as shown in Fig. 2.10.
Ion Path from Source I
Ring
Endca~ Electrodes
Voltage r-- /C
Stable Ion Trajectory % Multiplier I Ion Detector
Figure 2.10: The ion trap mass analyser, adapted from, [98].
The ion trap operates using the same principles as the quadrupole mass
analyser by the creation of a three dimensional quadrupole field upon the
application of stable and variable potentials across the electrodes which allows
for the trapping of all ions within the trap cavity. By ramping the RF potential ions
of increasing mlz are ejected from the trap and detected [ I 131. Ions of similar
charge will naturally repel each other inside the trap with a detrimental effect
upon their trajectory, to avoid such an effect the trap is filled with helium at
pressure of 10" torr which acts as a 'shock absorber' and removes excess
energy by collision [ I 131. ton traps are also widely used as mass selective
chromatographic detectors as they are small and relatively inexpensive and offer
unit mass resolution [ I 1 I ] . The ion trap also allows for tandem MS
measurements to be performed by isolating the ion of interest within the trap
during the first mass analysis, fragmenting it using an excitation pulse and helium
collisions and then analysing the product ions in the normal scanning manner
during the second mass analysis [ I 1 I ] .
7 1

The time of flight; (ToF) mass analyser as shown in Fig. 2.1 1 operates on
a much simpler principle than the previously discussed mass analysers. With
ToF-MS ions are introduced directly from the source or if in a tandem instrument
from the previous mass analyser as a controlled pulse, which imparts the same
kinetic energy to all ions [ I 11 ,I 131. As they pass through the drift tube the ions
separate based upon their mass, i.e. light ions travel faster than heavier ions and
therefore, reach the detector first [98].
Detector Drift tube Ion flight path
..... I I
- 7 * A
7 * - ... am,
Reflectron
Figure 2.1 1 : The time of flight mass analyser, adapted from [I 041.
Equation 2.15 describes the relationship between the flight time and ionic
mass, [I 131:
(Eq. 2.15)
Where:
t is the time it takes to reach the detector,
d is the length of the drift tube,
V, is the applied pulse potential and
e is the charge on an electron.
Therefore, from the above equation it can be seen that mlz can be
calculated from the drift time as the values in brackets are constant. However,
this also requires accurate time measurements for accurate mass measurement
and fast electronics. The ToF analyser has no mass limits and high mass
accuracy is readily achievable with extremely high sensitivity.

Few reports exist of the application of ToF-MS for the determination
pharmaceutical residues in environmental samples. Marchese et a/. examined
the use of QqQ-MS and Q-ToF-MS for the LC-MSIMS determination of non
steroidal anti inflammatory compounds in surface water [ I 141 and it was found
that the QqQ system was more sensitive with calculated detection limits lower
than the Q-ToF system by a factor of 3. However, the Q-ToF system was more
selective for the analysis of real samples as it was not as prone to matrix
interference as the QqQ-MS [ I 141. Ferrer and Thurman reviewed the application
of LC-ToF-MS for the determination of emerging environmental contaminants
including pharmaceuticals and remarked that only two articles concerning drug
residue analysis were reported, both of which were submitted for review [ I 151. It
was however, noted that LC-ToF-MS is a powerful tool for the elucidation of
previously unknown organic micro pollutants. Such an approach was further
employed by Aguera et a/. who demonstrated the ability to identify photo
transformation products of the non steroidal anti-inflammatory drug diclofenac
using ToF-MS. It was possible to perform accurate mass measurements with
very low mass error and consequently identify thirteen previously unknown
photoproducts of the drug [ I 161. Perez et a/. performed a similar study using ion
trap MS to determine and characterise metabolites of the x-ray contrast agent
iopromide in activated sludge. Although ion trap MS lacks the same mass
accuracy as ToF-MS it was still possible to identify four possible biodegradation
products of iopromide in activated sludge using hydrogen deuterium exchange in
order to increase the accuracy of the measurements [ I 171.
2.4.4 Ion detectors:
Detection of the separated ions is the final parameter in the collection of mass
spectral data. Typical ion detectors include electron multipliers, Faraday cups
and array detectors. Electron multipliers operate in an analogous fashion to
photomultiplier tubes in optical spectroscopy with signal multiplication arising due
to the enhancement of charged particles across dynodes [113]. Electron
multipliers consist of a SnISnO or PbIPbO doped glass funnel that acts as a
continuous dynode under a voltage gradient to attract electrons to the bottom of
the multiplier, a gain of l o 7 electrons per ion is readily achievable [I 131.
With Faraday cup detectors the ion exiting the mass analyser strike a
collector electrode that is surrounded by a Faraday cage, which captures

reflected ions or ejected secondary electrons [ I 121. The collector electrode and
the Faraday cage are connected to a resistor and the analytical signal is
recorded as the feedback current required across the resistor in order to maintain
a base level potential [112]. Faraday cups are not as sensitive as electron
multipliers and also exhibit a slower response and as a consequence are not
suitable for rapid analysis, they are, however, relatively inexpensive.
Array detectors consist of a plate into which parallel cylindrical channels
have been drilled and a potential difference is applied across the plate (inlet to
outlet) [113]. Channels are coated with a semiconductor that acts as the
continuous dynode, readily allowing gains of l o 5 to l o 8 per incident ion at a
metallic collector anode. The plate can be used to detect ions of various mlz in
different channels over the course of a single scan [ I 131.
References:
1. T.A. Ternes, TrAC Trends in Analytical Chemistry, 20, (2001), 41 9.
2. N.J.K. Simpson & M.J.M. Wells, 'Introduction to Solid Phase ExtractionJ, in Solid Phase
Extraction - Principles, Techniques and Applications, edited by N.J.K. Simpson, (2000), 1, CRC
Publishers, London.
3. J. Pawliszyn, 'Unified Theory of Extraction', in Wilson & Wilson's Comprehensive Analytical
Chemistry Volume XXXVII, 'Sampling and Sample Preparation for Field and Laboratory' edited
by J. Pawliszyn, (2002), 253, Elsevier Science, Amsterdam.
4. H. Kataoka, TrA C Trends in Analytical Chemistry, 22, (2003), 232.
5. F.F. Cantwell & M. Losier, 'Liquid-Liquid Extraction', in Wilson & Wilson's Comprehensive
Analytical Chemistry Volume XXXVII, 'Sampling and Sample Preparation for Field and
Laboratory' edited by J. Pawliszyn, (2002), 297.
6. E. Psillakis & N. Kalogerakis, TrAC Trends in Analytical Chemistry, 22, (2003), 565.
7. S. Pedersen-Bjergaard, K. E. Rasmussen & T.G. Halvorsen, Journal of Chromatography A,
902, (2000), 91.
8. 1. Liska, Journal of Chromatography A, 885, (2000), 3.
9. J.S. Fritz & M. Macka, Journal of Chromatography A, 902, (2000), 137.
10. Waters Oasis Applications Notebook, (2003), Waters Corporation.
11. C.F. Poole, 'Principles and Practice of Solid Phase Extraction: in Wilson & Wilson's
Comprehensive Analytical Chemistry Volume XXXVII, 'Sampling and Sample Preparation for
Field and Laboratory' edited by J. Pawliszyn, (2002), 341.
12. Z.S. Ferrera, C.P. Sanz, C.M. Santana & J.J. Santana-Rodriguez, TrAC Trends in Analytical
Chemistry, 23, (2004), 496.
13. C.F. Poole, A.D. Gunatilleka & R. Sethuraman, Journal of Chromatography A, 885, (2000),
17.
74

14. C.F. Poole & S.K. Poole, 'Theory Meets Practice', in Solid Phase Extraction - Principles,
Techniques and Applications, edited by N.J.K. Simpson, (2000), 183.
15. C.F. Poole, TrAC Trends in Analytical Chemistry, 22, (2003), 362.
16. M.R. Criado, D.H. Fernandez, I. Rodriguez Pereiro & R. Cela Torrijos, Journal of
Chromatography A, 1056, (2004), 187.
17. B. Shao, D. Dong, Y. Wu, J. Hu, J. Meng, X. Tu & S. Xu, Analytica Chimica Acta, 546,
(2005), 174.
18. J. Sunderland, A.M. Lovering, C.M. Tobin, A.P. MacGowan, J.M. Roe & A.A. Delsol,
International Journal of Antimicrobial Agents, 24, (2004), 51 1.
19. 1. Ferrer & D. Barcelo, TrAC Trends in Analytical Chemistry, 18, (1999), 180.
20. M.E. Leon-Gonzalez & L.V. Perez-Arribas, Journal of Chromatography A, 902, (2000), 3.
21. J.J. Pesek & M.T. Matyska, 'SPE Sorbents and Formats', in Solid Phase Extraction - Principles, Techniques and Applications, edited by N.J.K. Simpson, (2000), 19, CRC
Publishers, London.
22. C.W. Huck & G.K. Bonn, Journal of Chromatography A, 885, (2000), 51.
23. V. Pichon, Journal of Chromatography A, 885, (2000), 195.
24. N. Masque, R.M. Marce & F. Borrull, TrAC Trends in Analytical Chemistry, 17, (1998), 384.
25. R. Saan-Nordhaus & J.M. Anderson, Journal of Chromatography A, 706, (1 995), 563.
26. P.R. Haddad, P. Doble & M. Macka, Journal of Chromatography A, 856, (1999), 145.
27.M.C. Carson, Journal of Chromatography A, 885, (2000), 343.
28. R.A. Gimeno, J.L. Beltran, R.M. Marce & F. Borrull, Journal of Chromatography A, 890,
(2000), 289.
29. M. Jorgensen, Journal of Chromatography 6, 71 6, (1 998), 31 5.
30. S. AbuRuz, J. Millership & J. MCElnay, Journal of Chromatography 6, 798, (2003), 203.
31. S.N. Mahnik, 6. Rizovski, M. Fuerhacker & R.M. Mader, Chemosphere, 65, (2006), 1419.
32. T.A. Ternes, M. Bonerz, N. Herrmann, D. Loffler, E. Keller, B. Bago Lacida & A.C. Alder,
Journal of Chromatography A, 1067, (2005), 21 3.
33. A. Aguera, A.R. Fernandez-Alba, L. Piedra, M. Mezcua & M.J. Gomez, Analytica Chimica
Acta, 480, (2003), 193.
34. T. Vasskog, U. Berger, P-J. Samuelsen, R. Kallenborn & E. Jensen, Journal of
Chromatography A, 11 15, (2006), 187.
35. D. Loffler & T.A. Ternes, Journal of Chromatography A, 1021, (2003), 133.
36. S. Zuhlke, U. Dunnbier &T. Heberer, Journal of Chromatography A, 1050, (2004), 201.
37. J.C. van de Steene, K.A. Mortier & W. E. Lambert, Journal of Chromatography A, 1123,
(2006), 71.
38. R. Lindberg, P.A. Jarnhimer, B. Olsen, M. Johansson & M. Tysklind, Chemosphere, 57,
(2004), 1479.
39. G.A. Grant, S.L. Frison & P. Sporns, Journal of Agricultural & Food Chemistry, 51, (2003),
5367.
40. G.A. Mills, B. Vrana, I. Allan, D.A. Alvarez, J.N. Huckins & R. Greenwood, Analytical &
Bioanalytical Chemistry, article in press 2006, doi. 10.1 007/s00216-006-0773-y

41. B.J. Vanderford, R.A. Pearson, D.J. Rexing & S.A. Snyder, Analytical Chemistry, 75, (2003),
6265.
42. S. Yang, J. Cha & K. Carlson, Rapid Communications in Mass Spectrometry, 18, (2004),
2131.
43. X.S. Miao & C.D. Metcalfe, Analytical Chemistry, 75, (2003), 3731.
44. S. Yang & K.H. Carlson, Journal of Chromatography A. 1038, (2004), 141.
45. S. Marchese, D. Perret, A. Gentili, R. Curini & F. Pastori, Chromatographia, 58, (2003), 263.
46. S. Ollers, H.P. Singer, P. Fassler & S.R. Muller, Journal of Chromatography A, 91 1, (2001 ),
225.
47. S. Weigel, R. Kallenborn & H. Huhnerfuss, Journal of Chromatography A, 1023, (2004),
183.
48. S. Weigel, U. Berger, E. Jensen, R. Kallenborn, H. Thoresen & H. Huhnerfuss,
Chemosphere, 56, (2004), 583.
49. J.D. Cahill, E.T. Furlong, M.R. Burkhardt, D. Koplin & L.G. Anderson, Journal of
Chromatography A, 1041, (2004), 1 71 . 50. M.J. Hilton & K.V. Thomas, Journal of Chromatography A, I01 5, (2003), 129.
51. N.M. Vieno, T. Tuhkanen & L. Kronberg, Journal of Chromatography A, 1134, (2006), 101.
52. M. Gros, M. Petrovic & D. Barcelo, Analytical & Bioanalytical Chemistry, 386, (2006), 941.
53. C. Hao, L. Lissemore, B. Nguyen, S. Kleywegt, P. Yang & K. Solomon, Analytical &
Bioanalytical Chemistry, 384, (2006), 505.
54. J.E. Renew & C.H. Huang, Journal of Chromatography A, 1042, (2004), I 1 3.
55. P.A. Blackwell, H.C. Holten Lutzhoft, H.P. Ma, B. Halling-Sorensen, A.B.A. Boxall & P. Kay,
Journal of Chromatography A, I 045, (2004), 1 1 1 . 56. P.A. Blackwell, H.C. Holten Lutzhoft, H.P. Ma, B. Halling-Sorensen, A.B.A. Boxall & P. Kay,
Talanta, 64, (2004), 1058.
57. 2. Cheng, P: Pavelic, P. Dillon & R. Naidu, Water Research, 36, (2002), 4830.
58. A. Motoyama, A. Suzuki, 0. Shirota & R. Namba, Rapid Communications in Mass
Spectrometry, 13, (1 999), 2204.
59. S. Rodriguez-Mozaz, M.J. Lopez de Alda & D. Barcelo, Analytical Chemistry, 76, (2004),
6998.
60. M.J. Lopez de Alda & D. Barcelo, Journal of Chromatography A. 911, (2001), 203.
61. J.V. Sancho, O.J. Pozo & F. Hernandez, Analyst, 129, 38.
62. G.A. Guichon, Analytica Chimica Acta, 283, (1993), 309.
63.H. Engelhardt, Journal of Chromatography B, 800, (2004), 3.
64. K.K. Unger, Journal of Chromatography A, 1060, (2004), 1.
65. R. Nageswara Rao & V. Nagaraju, Journal of Pharmaceutical and Biomedical Analysis, 33,
(2003), 335.
66. A. Rizzi, 'Retention and Selectivity', in The Handbook of HPLC edited by Katz et al. (1998),
1, Marcel Dekker, New York.
67. D.A. Skoog, D.M. West & F.J. Holler, Fundamentals of Analytical Chemistry, 7th Edition,
(1996), 708, Saunders College Publishing, Philadelphia.
68. L.R. Snyder & J.J. Kirkland, Introduction to Modern Liquid Chromatography, (1979), 16, J.
Wiley & Sons, New York.
69. V.R. Meyer, Practical High Performance Liquid Chromatography, 2nd Edition, (1994), 17,
Chichester Publishers, New York.
70. D.C. Harris, Quantitative Chemical Analysis, sth Edition, (1999), 650, Freeman, New York.
71. H. Colin, G. Guichon & M. Martin, 'Liquid Chromatographic Equipment', in Practice of High
Performance Liquid Chromatography edited by H. Engelhardt, (1 986), 1, Springer, Berlin.
72. D.A. Skoog, F.J. Holler & T.A. Nieman, Principles of Instrumental Analysis, sth Edition,
(1998), 725, Saclnders College Publishing, Philadelphia.
73. Seton Hall University On-line HPLC Textbook, last viewed 2oth December 2006, available
through: http://hplc.chem.shu.edu/book/html/intstrum.
74. W.T. Kok, 'Principles of Detection', in The Handbook of HPLC edited by Katz et al. (1998),
143, Marcel Dekker, New York.
75. B.E. Lendi & V.R. Meyer, LC-GC Europe, 18, (2005), 156.
76. J.J. Kirkland, Journal of ChromatographyA, 1060, (2004), 9.
77. C.A. Doyle & J.G. Dorsey, 'Reversed-phase HPLC: Preparation and Characterisation of
Reversed-phase Stationary Phases', in The Handbook of HPLC edited by Katz et a/. (1998),
293, Marcel Dekker, New York.
78. G. Rozing, LC-GC Europe, June 2003.
79. R.E. Majors, LC-GC Europe, June 2003.
80. T.B. Tennikova & J. Reusch, Journal of Chromatography A, 1065, (2005), 13.
81. M.M. Collinson, TrAC Trends in Analytical Chemistry, 21, (2002), 30.
82. N. Ishizuka, H. Minakuchi, K. Nakanishi, N. Soga & N. Tanaka, Journal of Chromatography
A, 797, (1 998), 133.
83. K. Cabrera, D. Lubda, K. Sinz &C. Schafer, American Laboratory, February 2001.
84. C. Schafer, K. Cabrera, D. Lubda, K. Sinz & D. Cunningham, American Laboratory, April
2001, 25.
85. F. Rabel, K. Cabrera & D. Lubda, American Laboratory, December 2000, 20.
86. F. Svec, LC-GC Europe, June 2003.
87. K. Cabrera, G. Weiland, D. Lubda, K. Nakanishi, N. Soga, H. Minakuchi & K.K. Unger, TrAC
Trends in Analytical Chemistry, 17, (1 998), 50.
88. N. Tanaka, H. Kobayashi, N. Ishizuka, H. Minakuchi, K. Nakanishi, K. Hosoya & T. Ikegami,
Journal of Chromatography A, 965, (2002), 35.
89. K. Cabrera, Journal of Separation Science, 27, (2004), 843.
90. W. Ahrer, E. Scherwenk & W. Buchberger, Journal of Chromatography A, 910, (2001), 69.
91. J.L. Santos, I. Aparicio, E. Alonso & M. Callejon, Analytical Chimica Acta, 550,(2005), 1 16.
92. K. van der Ven, W. van Dongen, B.U.W. Maes, E.L. Esmans, R. Blust & W.M. de Coen,
Chemosphere, 57, (2004), 967.
93. J. B. Quintana & T. Reemtsma, Rapid Communications in Mass Spectrometry, 18, (2004),
765.
94. F. Sacher, B. Raue & H-J. Brauch, Journalof Chromatography A, 1085, (2005), 117.

95. M. Himmelsbach, W. Buchberger & C.W. Klampfl, Electrophoresis, 27, (2006), 1220.
96. D.A. Skoog, F.J. Holler & T.A. Nieman, Principles of lnstrumental Analysis, 5th Edition,
(1 998), 498, Saunders College Publishing, Philadelphia.
97. J.H. Beynon & A.G. Brenton, An Introduction to Mass Spectrometry, (1982), I , University of
Wales Press, Cardiff.
98. P. Gates, The University of Bristol Mass Spectrometry Resource, available on-line at
www.chm.bris.ac.uk/ms, cited July 25th 2005.
99. C.G. Daughton, Journal of the American Society for Mass Spectrometry, 12, (2001), 1067.
100. F. Lemiere, 'Interfaces for LC-MS', LC-GC Europe, December 2001, 21.
101. W.M.A. Niessen, Journal of Chromatography A, 794, (1998), 407.
102. S.J. Gaskell, Journal of Mass Spectrometry, 32, (1997), 677.
103. P. Kebarle & Y. Ho, 'On the Mechanism of Electrospray Mass Spectrometry: in
Electrospray lonisation Mass Spectrometry, edited by R.B. Cole, (1997), 3, J. Wiley & Sons,
New York.
104. B. Ardrey, Liquid Chromatography-Mass Spectrometry: An Introduction, (2003), 100, J.
Wiley & Sons, New York.
105. A.P. Bruins, Journal of Chromatography A, 794, (1 998), 345.
106. J. Abian, Journal of Mass Spectrometry, 34, (1 999), 157.
107. W .M.A. Niessen, 'Developments in Interface Technology for Combined Liquid
Chromatography, Capillary Electrophoresis and Supercritical Fluid Chromatography-Mass
Spectrometry', in Applications of LC-MS in Environmental Chemistry, edited by D. Barcelo,
(1 996), 3, Elsevier Science, Amsterdam.
108. K.V. Thomas, Journal of Chromatography A, 833, (1 999), 105.
109. W. Weinmann, M. Goerner, S. Vogt, R. Goerke & S. Pollak, Forensic Science International,
121, (2001), 103.
1 10. P.G.M. Kienhuis & R.B. Geerdink, TrAC Trends in Analytical Chemistry, 19, (2000), 460.
11 1. F. Lemiere, 'Mass Analysers for LC-MS' LC-GC Europe, December 2001, 14.
112. D.A. Skoog, F.J. Holler & T.A. Nieman, Principles of Instrumental Analysis, 5th Edition,
(1998), 258.
1 1 3. E. de Hoffmann & V. Stroobant, Mass Spectrometry: Principles & Applications, 2" Edition,
(2001), 63, J. Wiley & Sons, New York.
114. S. Marchese, A. Gentili, D. Perret, G. D'Ascenzo & F. Pastori, Rapid Communications in
Mass Spectrometry, 17, (2003), 879.
1 1 5. 1. Ferrer & E.M. Thurman, TrAC Trends in Analytical Chemistry, 22, (2003), 750.
116. A. Aguera, L.A. Perez Estrada, I. Ferrer, E.M. Thurman, S. Malato & A.R. Fernandez-Alba,
Journal of Mass Spectrometry, 40, (2005), 908.
1 17. S. Perez, P. Eichhorn, M.D. Celiz & D.S. Aga, Analytical Chemistry, 78, (2006), 1867.

- -
3.0 Development of Dual Gradient Monolithic HPLC for
the Determination of Pharmaceutical Residues in
Environmental Samples.
3.1 Introduction:
A large number of HPLC methods have been published in the peer-reviewed
literature for the determination of pharmaceutical substances spanning across
analgesics [1,2,3,4,5,6], antibiotics [7,8], antifungal agents [9], lipid regulating
agents [ I 0,l I ] , preservatives [ I 21, personal care products [ I 3,141, prospective drug
candidates [I51 to narcotics and banned or forensically interesting substances
[16,17]. Stereo specific methods have also been reported but to a much lesser
degree than standard assays [18,19,20]. The majority of reported methods have
focused upon the use of reversed-phase particle packed columns and UV
absorbance detection with the primary aims of the above studies being
pharmacokinetic monitoring or finished and commercial product analysis. Many of
the reported methods, while suited to the task at hand and often fully validated, are
unsuitable for application to environmental monitoring or incompatible with MS due
to the use of inorganic buffers in the mobile phase such as large amounts of
phosphate, unsuitable flow rates, (flow rates of up to 0.7 m~min-' were reportedly
used with ESI [8]), lack of sensitivity and often lengthy runtimes for single
compound analysis. Very few reports of the use of microbore columns exist, not
even in conjunction with MS.
Pharmaceutical residues have been detected in a variety of environmental
matrices, in both aqueous and terrestrial compartments, i.e. soils and sludge
[21,22,23,24]. In contrast with the previous methods, the developed procedures for
environmental pharmaceutical residue analysis are primarily based upon the use of
small particle high resolution; (3-5 pm), microbore column LC-MS or LC-MSIMS to
increase the sensitivity and specificity of the method. As a consequence of the use
of MS detection, complete chromatographic separation of all analytes is no longer
crucial, however, in order to avoid adverse or unwanted effects upon the ESI
intensity a suitable separation of the chosen analytes is still desired. A shortcoming
of many of the reported methods is poor analytical separation. For example, four
individual methods were required by Milton and Thomas [21] for the separation of
thirteen pharmaceuticals leading to a single sample analysis time of greater than
two hours, excluding re-equilibration time. In the case where a single
chromatographic method was used it was often observed that a significant number
of analytes were noticed to coelute [22,24]. In the case of Aguera et a/. [23] the
mobile phase employed was adjusted to pH 10.5 with hydroxide prior to use with
an octyl silica column (it is worth remembering that the upper limit of silica based
chromatography columns is usually pH 7.5 in order to prevent the stationary phase
from dissolving, section 2.3.5). Therefore, it can be seen that although the methods
published to date are suitably sensitive and fit for the purpose intended, an efficient
chromatographic separation of the chosen analytes is often overlooked.
Monolithic silica columns are a relatively underused concept in
environmental and pharmaceutical analyses. To date the majority of published
reports have focused upon the use of monolithic silica columns to reduce analysis
times and therefore, increase sample throughput [25,26,27]. However, monolithic
silica columns also allow for more efficient separations with theoretical plate counts
often far superior to those obtainable with 3.5 pm particulate columns due to higher
permeability and increased rates of mass transfer [28,29]. Therefore, monolithic
columns unlike their particle packed counterparts allow for highly efficient
separations at high flow rates. The increased rate of column permeability, >80%
compared to -65% in a particle packed column, also allows for the use of
significant flow gradients that are not possible due to excessive backpressure
production in particle packed supports [30].
The aim of this initial research was to develop a high efficiency separation of
chosen environmentally relevant pharmaceuticals using monolithic silica columns
and to apply the developed method for the preliminary determination of
pharmaceutical residues in environmental samples. A SPE procedure was also
incorporated into the method in order to lower detection limits. In order to select a
suitable sorbent various commercially available SPE cartridges based upon silica
or polymeric supports were evaluated. Photodiode array detection was used for the
80

determination of sample extracts in an attempt to increase the specificity of the
developed method.
3.2 Experimental:
3.2.1 Analyte test group:
Analytes chosen for monitoring include those that showed prevalence in both the
published literature and also the list of the most prescribed pharmaceuticals in
Ireland for the year ending December 31'' 2003 [31]. The chemical structures of
the selected analytes are depicted in Table 3.1.
Table 3.1: Chemical structures of the pharmaceuticals and metabolites selected for study,
Analyte Chemical Structure Analyte Chemical Structure
Acetaminophen lndomethacin HO
0
Salicylic acid
Trimethoprim Mefenamic acid I
4'2N

Clotrimazole O I
Caffeine
Propranolol Gemfibrozil
0
Clofibric Acid Triclosan
I C!
Ketoprofen d",H Flurbiprofen F
OWOH
Bezafi brate o-Toluic acid
Naproxen 2-Naphthoic acid
Warfarin

lvermectin
3.2.2 Chemicals and reagents:
Reagent water used throughout, unless otherwise stated was obtained from a
Millipore Milli-Q water purification system (Millipore, Bedford, MA, USA) and was
18.2 M a or greater. Methanol (MeOH) was purchased from Labscan (Dublin,
Ireland), acetone and ethyl acetate were obtained from Aldrich (Gillingham, UK).
All solvents used were HPLC grade. Dichlorodimethylsilane, ammonium formate
and formic acid were also purchased from Aldrich. BDH Analar grade sulphuric
acid was used for sample pH adjustment (Poole, UK). Metformin hydrochloride,
acetaminophen, salicylic acid, o-toluic acid, propranolol hydrochloride, clofibric
acid, ketoprofen, diclofenac sodium salt, clotrimazole and 2-naphthoic acid were
obtained from Aldrich (Steinheim, Germany). Trimethoprim, caffeine, naproxen and
Triclosan were received from Fluka (Buchs, Switzerland). Bezafi brate, warfarin,
flurbiprofen, indomethacin, ibuprofen sodium salt, meclofenamic acid sodium salt,
mefenamic acid, gemfibrozil and ivermectin were all obtained from Sigma
(Steinheim, Germany). All analytes were of a purity >95%.
Stock 1000 m g ~ ~ ' solutions of each analyte were prepared in MeOH and
were stored as described on the material safety data sheets (MSDS) sheets for
maximum stability, i.e. refrigerated if necessary and in the dark. In the case of
salts, standards were prepared in terms of the parent analyte. These standards
were periodically replaced. Working standards were prepared from these stock
standards by appropriate dilution using MeOH.
3.2.3 Glassware preparation:
Prior to use all glassware was silanised by rinsing thoroughly with a 10% vlv
solution of dichlorodimethylsilane in dichloromethane, followed by rinsing twice with
dichloromethane and twice with MeOH.
3.2.4 Sample extraction:
A variety of sorbents were investigated as suitable stationary phases for sample
extraction. These included Phenomenex Strata 200 mg I3 mL,
Phenomenex strata-xTM; 200 mg 16 mL, (Phenomenex, Macclesfield, UK), Merck
LiChrolut EN^^; 200 mg 13 mL, (Merck, Darmstadt, Germany), Waters Oasis H L B ~ ~ ;
200 mg 16 mL and Waters Oasis MAX"; 150 mg 16 mL, (Waters, Milford, MA,
USA). From initial investigations the Phenomenex strata-xTM and Oasis HLB'~
sorbents demonstrated high analyte recovery and were therefore chosen for further
study. Prior to extraction, 1 L water samples were filtered through Whatman GFIC
glass micro fibre filters to remove particulate matter, (Whatman, Maidstone, UK).
The filtrate was then spiked with surrogate standards (to yield an overall
concentration of 2 p g ~ - ' of both o-toluic acid and meclofenamic acid) to assess
extraction performance and adjusted to pH 4.0 with concentrated sulphuric acid.
The SPE cartridge was conditioned with 6 mL of MeOH and 6 mL of water
respectively. Samples were introduced by vacuum through Teflon tubing and
extracted under an operating pressure of 20" Hg on a vacuum manifold. After
complete sample introduction but without letting the cartridge run dry, the sorbent
was washed with 1 mL of water that was discarded. The sorbents were then dried
by vacuum aspiration for a minimum of 30 minutes. Elution was then performed
using 10 mL of a 50% v/v solution of ethyl acetate in acetone [20]. The eluate was
collected and reduced in volume to near dryness under a stream of N2. The
residue was reconstituted in 1 mL of internal standard solution (1 m g ~ - ' naphthoic
acid in MeOH) and transferred to an autosampler vial for LC analysis.
3.2.5 Liquid chromatography:
A Hewlett Packard HP 1050 Series HPLC was used throughout and consisted of a
quaternary pump with online vacuum degasser, a variable wavelength detector
model 79853C and an autosampler. Agilent ChemStation for LC systems version
84

A.09.03 was used for system control and data analysis, (Agilent Technologies,
Palo Alto, CA, USA). The analytical column used consisted of two Chromolith
Performance RP18e; 100.0 x 4.6 mm monolithic octadecyl silica columns
combined in series using a Chromolith column coupler. A 10.0 x 4.6 mm
Chromolith RPI Be guard cartridge was also incorporated to prevent spoilage of the
analytical columns, (Merck, Darmstadt, Germany). A multi-step binary gradient,
(Table 3.2) in conjunction with a flow gradient was employed for analyte elution
using a mobile phase consisting of MeOH and 1 mM ammonium formate I formic
acid buffer at pH 4.5. The temperature was held at 25OC throughout. A 20 pL
injection volume was employed for both samples and standards. The total analysis
time per injection was 70 minutes followed by a 10-minute re-equilibration period.
Absorbance was monitored at 225 nm. At lower wavelengths the mobile phase
itself showed significant absorbance and at higher wavelengths detector sensitivity
for the majority of the pharmaceuticals was reduced.
Table 3.2: Liquid chromatographic method parameters.
Time Flow solvent A' solvent B~
(minutes) (m~min-')
- -- -
35 52.5 47.5 40 65 3 5 c c C T CaE
1 9 Can
- -
70 90 10 2.30 Solvent A was MeOH.
2 Solvent B was 1 mM ammonium formate buffer, pH 4.5.

3 .3 Results and Discussion.
3.3.1 Methanol gradient:
Using an initial mobile phase consisting of MeOH and water adjusted to pH 3.0
using formic acid, simple linear gradients were investigated. Initial experiments
involved starting conditions of 40% MeOH that was held isocratically for 10 minutes
and then raised to 70%. However, results showed that for polar analytes such as
trimethoprim, caffeine and paracetamol the initial percentage of MeOH in the
mobile phase was too high, leading to subsequent poor retention. A number of
peak pairs were also found to coelute, these included ketoprofen and clofibric acid,
warfarin and bezafibrate and gemfibrozil and Triclosan.
Therefore, the starting percentage of MeOH was reduced in order to
promote retention of polar analytes. It was found that at 10% MeOH, polar analytes
like paracetamol could be retained for approximately 8 minutes. A series of
individual linear gradients were then investigated to reduce the retention of all other
less polar species and avoid the co-elution of the above mentioned peak pairs. To
facilitate the complete elution and separation of all of the pharmaceuticals
investigated, including ivermectin, the MeOH concentration had to be gradually
increased over three individual linear gradients to 90% over a 75 min
chromatographic run.
Fig. 3.1 depicts a 10 m g ~ - ' standard chromatogram (excluding ivermectin)
recorded under optimum conditions, a near complete separation of all analytes is
observable with the exception of gemfibrozil and Triclosan. The dashed line
describes the % MeOH gradient used.
3.3.2 pH and buffer strength:
Using the previously optimised organic modifier the pH and the buffer strength of
the aqueous proportion of the mobile phase was systematically varied to evaluate
selectivity effects.
Buffers considered included ammonium formate and ammonium acetate for
compatibility with possible MS detection. Of the buffered phases ammonium
acetate demonstrated considerable absorbance at 225 nm and caused baseline
disruption over the course of the gradient. Ammonium formate demonstrated a

considerably lower absorbance and although baseline disturbance was observed it
was considerably less. Based on the above ammonium formate was chosen as the
most suitable modifier.
Time, (mins)
Figure 3.1: Optimised MeOH gradient separation of 19 pharmaceuticals on 20 cm reversed-phase silica monolithic column (pH 3.0 formic acid). Peak identification: 1 paracetamol; 2 trimethoprirn; 3 caffeine; 4 salicylic acid; 5 o-toluic acid; 6 clotrimazole; 7 2-naphthoic acid, (internal standard); 8 ketoprofen; 9 clofibric acid; 10 naproxen; 11 warfarin; 12 bezafibrate; 13 flurbiprofen; 14 diclofenac; 15 ibuprofen; 16 meclofenamic acid; 17 mefenamic acid; 18 & 19 gemfibrozil and Triclosan.
For optimisation, an experimental space was designed, governed by the
buffering activity of formate, (pK, = 3.75) and the desire to keep the ionic strength
low enough to prevent salt precipitation at high proportions of organic solvent.
Therefore, mobile phases containing ammonium formate concentrations of 1 to 5
mM, over the pH range of 2.5 to 5.5 were investigated. Twelve individual
experiments were run within the above concentration and pH range. The resulting
chromatograms were assessed using the resolution product criterion, R, calculated
according to Equation 3.1 [32].

(Eq. 3.1)
Where:
n is the number of analytes present.
RS(ili-I) is the resolution between peaks i and i + I. Calculated using,
(Eq. 3.2)
Where:
Tri+, is the retention time of peak i + 1.
Tri is the retention time of peak i.
Wi+, is the baseline width of peak i + 1.
Wi is the baseline width of peak i.
R has values in the range of OeRcI. A value of 1 indicates that the
resolution between all peaks is evenly distributed over the span of the separation
and conversely a value of 0 indicates co-elution of two or more peaks somewhere
within the chromatogram. From the calculated R-values a response surface was
constructed, which is shown as Fig. 3.2. The optimum combination of pH and
buffer strength was determined from the apex of the response surface within the
experimental space.
The response curve depicts a mobile phase condition where all analytes
were optimally resolved, this being 1 mM ammonium formate at pH 4.5. Fig. 3.3
depicts a standard chromatogram recorded under the optimised pH and buffer
strength.

Figure 3.2: Resolution response surface for pH and buffer strength optimisation. Standard mixture as in Fig. 3.1.
A complete separation of all chosen analytes can be observed in the
optimised chromatogram, including the previously co-eluting peak pair. It is also
notable that a change in the retention order of certain basic compounds is also
observable, for example clotrimazole is now retained for -58 minutes as opposed
to -28 minutes at pH 3.0, and increase in retention of some 30 minutes due to the
higher pH of the mobile phase, attributable to the deprotonation of the nitrogen
atoms of the imidazole group leading to a neutral moiety as opposed to the cationic
moiety that exists at the lower pH.

Time, (mins)
Figure 3.3: Optimised MeOH gradient separation of 19 pharmaceuticals on 20 cm reversed-phase silica monolithic column (pH 4.5, 1 mM formic acid). Peak identification: 1 paracetamol; 2 salicylic acid; 3 trimethoprim; 4 caffeine; 5 o-toluic acid; 6 clofibric acid; 7 2-naphthoic acid, (internal standard); 8 ketoprofen; 9 bezafibrate; 10 naproxen; 11 warfarin; 12 flurbiprofen; 13 diclofenac; 14 ibuprofen; 15 meclofenamic acid; 16 mefenamic acid; 17 clotrimazole; 18 gemfibrozil; 19 Triclosan.
3.3.3 Combined solvent and flow gradients:
Although a complete separation of all pharmaceuticals in the optimisation standard
is shown in Fig. 3.3, the overall analysis time is quite long at 90 minutes per
injection (including re-equilibrium time). The high permeability of the porous
monolithic columns is ideally suited for use at elevated flow rates. In this case
operation under constant (isofluentic) elevated flow conditions were not suitable
due to the desire to maintain resolution of early eluting peaks. Therefore, an
approach first used by Paci et a/. was investigated [33]. Paci et a/. utilised a flow
gradient combined with an elution gradient to reduce the retention of the anti-
malarial agents chloroquine and proguanil on a 250.0 x 4.0 mm particulate C18
column. However, due to the pressure constraints of the particulate packed column
used in the study, the flow could only be increased by 0.3 mlmin-I. More recently,
Paull et a/. have reported more significant reductions in analysis times, together
with increased efficiency, when a 'dual gradient' was applied to the separation of
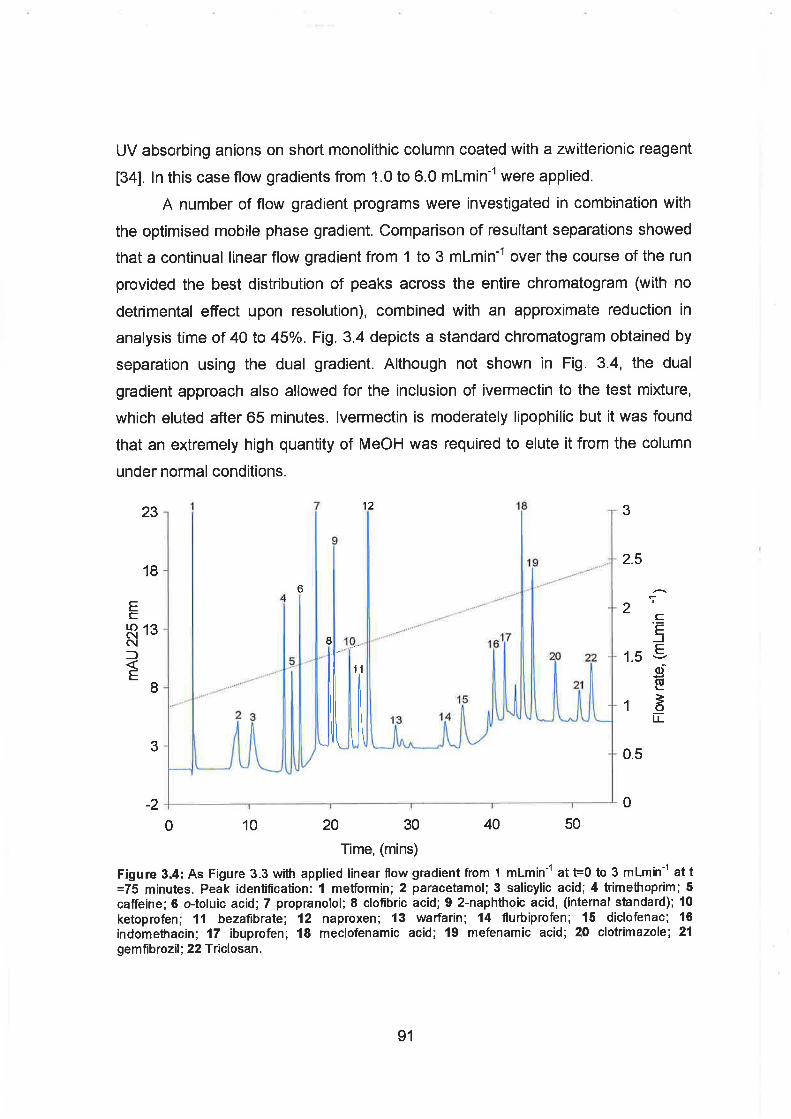
UV absorbing anions on short monolithic column coated with a zwitterionic reagent
[34]. In this case flow gradients from 1.0 to 6.0 mlmin-' were applied.
A number of flow gradient programs were investigated in combination with
the optimised mobile phase gradient. Comparison of resultant separations showed
that a continual linear flow gradient from I to 3 mlmin-' over the course of the run
provided the best distribution of peaks across the entire chromatogram (with no
detrimental effect upon resolution), combined with an approximate reduction in
analysis time of 40 to 45%. Fig. 3.4 depicts a standard chromatogram obtained by
separation using the dual gradient. Although not shown in Fig. 3.4, the dual
gradient approach also allowed for the inclusion of iverrnectin to the test mixture,
which eluted after 65 minutes. lvermectin is moderately lipophilic but it was found
that an extremely high quantity of MeOH was required to elute it from the column
under normal conditions.
Time, (mins) Figure 3.4: As Figure 3.3 with applied linear flow gradient from 1 mlmin" at ~FO to 3 mlmin-' at t =75 minutes. Peak identification: 1 metlormin; 2 paracetamol; 3 salicylic acid; 4 trimethoprim; 5 caffeine; 6 o-toluic acid; 7 propranolol; 8 clofibric acid; 9 2-naphthoic acid, (internal standard); 10 ketoprofen; 11 bezafibrate; 12 naproxen; 13 warfarin; 14 flurbiprofen; 15 diclofenac; 16 indomethacin; 17 ibuprofen; 18 meclofenamic acid; 19 mefenamic acid; 20 clotrimazole; 21 gemfibrozil; 22 Triclosan.

3.3.4 Temperature effects:
Temperature is an important parameter in chromatographic separations that
requires optimisation as fluctuations in temperature can drastically affect analyte
retention. Temperature governs both the viscosity of the mobile phase and also the
mobility of the analyte through the analytical column. For initial method
development studies the column was kept isothermally at 25OC. The separation
temperature was optimised over the range of 25 to 45OC in 5OC increments using a
column oven. 45OC was chosen as the upper temperature limit as upon referral to
the Chromolith column information, it is recommended not to heat the column
greater than 45OC as higher temperatures can lead to strain and even breakage of
the bond between the monolithic silica surface and the C18 ligand [35]. The
resolution product was calculated for each resulting chromatogram.
0 I I I I I I
20 25 30 35 40 45 50
Separation Temperature, (OC)
Figure 3.5: Investigation into the effect of increasing the operational separation temperature on the overall resolution product, (R). Separation conditions were as per those previously described in Table 3.2.
It can be seen that the resolution decreases as the temperature at which the
separation is performed increases as demonstrated by Fig. 3.5. This can most
probably be attributed to decreased analyte retention at elevated temperatures.
The chromatographic efficiency was also observed to decrease as the separation
temperature increased, theoretically it would have been expected to increase as

often by raising the operating temperature the kinetics of interaction are improved
[36]. As the flow rate is constantly increasing, a uniform distribution of heat may not
occur at elevated temperatures that may also lead to band distortion and therefore,
decrease the efficiency of the separation.
3.3.5 Method validation:
Having developed and optimised the dual gradient separation the performance of
the method was then investigated. In all instances method validation was
performed according to the 'ICH Harmonised Tripartite Guidelines for the
Validation of Analytical Procedures' [37]. The method was validated for linearity,
reproducibility and repeatability and the instrumental limits of detection (LOD) and
quantitation (LOQ) were calculated. The results for the validated parameters are
presented in Table 3.3.
Table 3.3: Dual gradient HPLC method performance data.
Analyte Linearity LOD LOQ Reproducibility Repeatability
(R2) (rngcl) (rng~-') (%RSD) (%RSD)
Metformin 0.9999 0.02 0.07 0.42 2.10 Paracetamol 0.9967 0.14 0.46 9.30 5.32 Salicylic acid 0.9999 0.22 0.72 2.37 7.97 Trimethoprim 0.9999 0.02 0.07 - 0.35 1.30
Caffeine 0.9982 0.09 0.29 1.91 3.41 o-Toluic acid 0.9999 0.06 0.19 0.75 1.03 - -
Propranolol 0.9973 0.03 0.10 2.30 1.38 Clofibric acid 0.9955 0.02 0.06 3.28 3.59 2-Na~hthoic - - - acid; (I.S.) Ketoprofen 0.9931 0.08 0.26 4.17 7.03 Bezafibrate 0.9954 0.06 0.21 1.09 7.17 Naproxen 0.9999 0.01 0.04 0.35 1.52 Warfarin 0.9999 0.24 0.81 7.49 10.24
Flurbiprofen 0.9999 0.24 0.81 0.91 11.10 Diclofenac 0.9998 0.15 0.49 9.70 15.09
lndomethacin 0.9997 0.10 0.33 2.02 9.31 Ibu rofen 0.9999 9 5.94 7.85
Meclofenamic 0.9999 0.04 0.13 0.61 2.47 acid
Mefenamic acid 0.9999 0.05 0.1 5 2.10 3.68 Clotrimazole 0.9998 0.1 1 0.37 1.81 7.05 Gemfibrozil 0.9999 0.25 0.84 1.58 2.18 Triclosan 0.9999 0.12 0.40 2.74 3.70 lvermectin 0.9996 0.12 0.40 4.20 3.52

Linearity was determined at five individual concentration levels within the
range of 0.1 to 20 mg~- ' . A linear response was observed for each analyte as
demonstrated by the regression coefficients that were all greater than R~ = 0.99.
The limit of detection was defined as a signal three times the standard deviation of
the baseline noise and the limit of quantitation was defined as ten times the
standard deviation of the baseline noise. Using the ChemStation software, version
A.09.03, the 'peak-to-peak' baseline noise was measured for a triplicate blank
injection, (HPLC grade MeOH) over a window of twenty times the peak width either
side of each peak. The peak heights of a combined 0.5 m g ~ - ' standard were
measured and from these measurements the LOD and LOQ for each analyte were
determined. The reproducibility of the method was determined by performing six
replicate injections of the same standard at the LOQ level using the same mobile
phase. Reproducibility is acceptably low for most analytes, generally lower than 5%
relative standard deviation (RSD) [37]. Repeatability was determined by the
injection of six individual standards at the LOQ level using six fresh preparations of
mobile phase for the separation. The calculated repeatability values are also quite I
I
low, ~ 1 0 % RSD for all analytes with the exception of flurbiprofen and diclofenac. I
Paci et a/. [33] acknowledge that dual gradient separations suffer from lower
precision due to the more complex dynamic processes occurring during the
separation, however, the observed reproducibility and repeatability values were
within acceptable limits in this study.
3.3.6 Solid phase extraction:
3.3.6. I Sorbent selection.
The chosen group of pharmaceuticals displayed a range of chemical properties,
ranging from very hydrophilic to hydrophobic, and acidic to basic. Due to these
distinct differences the selection of an extraction sorbent that showed good
recoveries for all species was not trivial. Sorbents examined included those based
upon standard octadecyl silica, hyper cross-linked styrene divinyl benzene,
hydrophilic lipophilic balanced polymers and mixed functionality reversed-phase
anion exchangers. Five commercial SPE phases were evaluated using recovery
performance data for a 5 c (~L- ' test mix of all analytes listed in section 3.2.1. The
resultant data is presented in Table 3.4.
94

Table 3.4: Sorbent selection performance data (calculated O/O recoveries).
Merck Waters Waters Phenomenex Phenomenex
Analyte LiChrolut Oasis Oasis strata-CI 8~~~ strata-xTM EN^^ HLB'" MAX^^
Paracetamol - 11 76 19 15 Salicylic acid - 79 49 70 58 Trimethoprim 20 98 44 89 65
Caffeine 14 90 82 - 76 289 o-Toluic acid, _o 6 62 53 57 47
Propranolol 13 78 36 72 54 Clofibric acid 66 89 83 77 65 2-Naphthoic - - - - acid, (I.S.) Ketoprofen 7 1 85 77 79 23 Bezafibrate 7 1 86 81 78 46 Naproxen 66 83 76 78 22 Warfarin 74 89 9 5 90 27
Flurbiprofen 83 9 1 85 90 45 D~clofenac 63 75 80 72 15
lndomethacin 6 1 56 238 Ibuprofen 69 88 69 86 38
Meclofenamic 85 83 75 65 acid, (S2)
Mefenamic acid 45 78 74 76 63 Clotrirn-nlo - 711 41 59 30 Gemi .-. . -
Triclosan 66 79 79 7 5 45
From initial studies the hydrophilic lipophilic balanced sorbents, i.e. Waters
Oasis H L B ~ ~ and Phenomenex strata-xTM showed the greatest promise as
relatively high recovery was observed across the range with these sorbents. The
CI8 sorbent demonstrated poor ability to extract and retain the more polar analytes.
Recovery was generally good using the Merck LiChrolut EN" sorbent, however,
indomethacin was completely unretained on the styrene divinylbenzene resin,
although it was retained on all of the other polymeric sorbents investigated in Table
3.4. As the majority of the pharmaceuticals were acidic, a mixed functionality
reversed-phase anion exchange sorbent, Oasis MAX'" was investigated. The
extraction was performed at pH 6.0 so as to promote the dissociation of carboxyl
functionalities. Recovery for acidic analytes was low, generally <5O0/0 and recovery
of basic and neutral analytes was also lower than that calculated from the
reversed-phase sorbents, suggesting ion exclusion based upon electrostatic
repulsion.
As the Oasis H L B ~ ~ and the Phenomenex strata-xTM were chemically similar
and share common retention chemistry, a t-Test was performed using the
calculated percentage recovery values for a 5 pgL-' spike standard to determine
whether the two sorbents were significantly different using Microsoft E X C ~ I ~ ~ . It was
discovered that at the 95% confidence interval that there was no significant
difference between the two sorbents (t-Experimental = 0.31 < t-Critical = 2.03, two
tailed assuming equal variances).
3.3.6.2 Extraction pH.
A subset of six analytes was chosen to optimise extraction pH. The selected
analytes were salicylic acid, clofibric acid, ketoprofen, diclofenac, ibuprofen and
mefenamic acid. These solutes were selected as they span across the
chromatographic separation. Buffer solutions were prepared within the pH range of
2-8 and spiked with 5 p g ~ - ' of each. Samples were extracted using the Oasis HLB
cartridges and eluted with 10 ml MeOH, reduced in volume, reconstituted and
analysed using the HPLC method. It was observed that an extraction pH of 4.0 , 1
provided optimum analyte recovery for all compounds.
3.3.6.3 Elution solvent.
Within the literature many SPE procedures recommend elution with MeOH.
However, MeOH is difficult to reduce in volume under N2 without significant sample
loss and so alternative solvents were investigated. These included; acetone,
acetonitrile, ethyl acetate, isopropyl alcohol (IPA), 50% v/v ethyl acetate in acetone
[38], and 10% v/v MeOH in methyl t-butyl ether (MtBE) [39]. Using the Oasis H L B ~ ~
sorbent, a 5 p g ~ - ' mixed standard was extracted and eluted using each of the
above solvents and solvent mixtures. Recovery from cartridges eluted with ethyl
acetate and acetonitrile were unacceptably low, ~ 5 0 % for the test solutes.
Recovery was in the range of 70-90% with IPA and acetone. For the mixed
solvents, recovery was -50% or less for cartridges eluted with 10% vlv MeOH in
MtBE, however, 50% v/v ethyl acetate in acetone provided near quantitative
recovery for all analytes, >go%. Of all the solvents examined the 50% v/v ethyl
acetate in acetone mixture provided the highest recoveries, (due to increased
solvent strength) and it is also easily reduced in volume under N2 with minimal
96

splashing and sample loss. The recovery of salicylic acid was low in all extraction
experiments, however, it is the most polar of the compounds examined (pK, -3.0).
At this stage in the study it was noted that during the SPE procedural development
that there was significant batch-to-batch variability with the Oasis H L B ~ ~ sorbent,
reflected in some cases by large reductions in solute recovery. Such batch
variability was not apparent with the Phenomenex strata-x"" phase and therefore
these cartridges were preferred in further sample extractions.
3.3.6.4 Elution volume.
The optimum volume of elution was determined by eluting an extracted 5 p g ~ - l
standard with ten 2 mL portions of 50 % vlv ethyl acetate in acetone. Each 2 mL
fraction was collected, reduced in volume and reconstituted in 100 pL of MeOH.
The relative recovery of each analyte was determined and plotted against the
elution volume, Fig. 3.6. It was observed that 10 mL of elution solvent was
sufficient to completely elute all compounds from the sorbent bed. It was also
observed that as expected the more polar the solute the less solvent was required
for complete elution.
3.3.6.5 Surrogate Performance.
Two surrogate standards were also included in the method at a concentration level
of 2 p g ~ - l to assess the extraction procedure. The recovery of o-toluic acid is quite
low and outside the acceptable limits, (i.e. 70-130%, [37]) at 56%, while the
recovery of meclofenamic acid is more acceptable at 80%. o-Toluic acid is the
more polar of the pair and although it is not in itself a pharmaceutical compound, it
was chosen as it shares a common functionality with many of the more polar
pharmaceuticals. Meclofenamic acid was previously used as a surrogate standard
by Clara et a/. [40].

0 ! I 1 I 1 I I I + 1 I
0 2 4 6 8 10 12 14 16 18 20
Elution Volume, (mL)
Figure 3.6: Plot of relative % recovery versus SPE elution volume, (mL) using strata-X~ SPE cartridges and elution with 50 % vlv ethyl acetate in acetone. Key: black trace; ibuprofen, green trace; clofibric acid, pink trace; ketoprofen, orange trace; diclofenac, blue trace; mefenamic acid, red trace; salicylic acid.
3.3.6.6 Overall method performance data.
Using the optimised parameters six 1 p g ~ ' spikes prepared in water collected from
the River Boyne near Navan, Co. Meath, Ireland were extracted using the
Phenomenex strata-xTM cartridges and analysed using the dual gradient method.
From the six replicate extractions the overall level of method precision was
estimated (as the percentage RSD for the six replicate extractions). Unspiked
aliquots of estuarine and river water were also extracted and analysed. The overall
levels of sensitivity, (LOD and LOQ) were then calculated by determining the
baseline noise in the unspiked extracts. Overall method performance data is
presented in Tables 3.5 and 3.6.
Table 3.5: Extraction repeatability and overall method precision calculated using 1 CIg~-l spikes in river water, (*actual spiking level was 2 pg~-l).
% Recovery Repeatability, Method Precision, Analyte
(n=6) (% RSD, n=6)
Metformin - - Paracetamol - Salicylic Acid 67 f 19.8 29.38 Trimethoprim - -
Caffeine - o-Toluic Acid 45 f 12.3 27.27 Propranolol -
Clofibric Acid 77 f 18.4 23.90 Keto~rofen 81 f 15.6 19.32
Warfarin 97 f 18.2 18.86 ~lurbiarofen 77 + 16.0 20.83 Diclofenac 73 f 15.2 20.63
Meclofenamic Acid 72 f 13.0 17.95 Mefenamic Acid 75 + 13.9 18.42
Clotrimazole- .. Gemfibrozil 72 + 7.3 10.20
Triclosan 104 f 24.4 23.57 lvermectin 42 f 5.3 12.65
Table 3.6: Overall method sensitivity data calculated in two different sample matrices (1 L extraction volume), values quoted are in vg~ - ' .
Estuarine Water River Water Analyte
LOD LOQ LOD LOQ
Metformin 0.35 1.17 - Paracetamol 0.33 1.09 - Salicylic Acid 0.66 2.21 0.18 0.62 Trimethoprim 0.03 0.1 1 - -
Caffeine 0.27 0.91 - - o-Toluic Acid 0.13 0.44 0.17 0.58 Propranolol 0.04 0.13 - +
Clofibric Acid 0.12 0.41 0.07 0.23 Ketoprofen 0.16 0.53 0.1 1 0.38 Bezafibrate 0.13 0.45 0.08 0.28 Na proxen 0.02 0.08 0.02 0.08 Warfarin 0.73 2.42 0.55 1.85
Flurbiprofen 0.41 1.36 0.32 1.06 Diclofenac 0.29 0.96 0.18 0.62
lndomethacin 0.09 0.31 0.15 0.49 Ibuprofen 0.19 0.64 0.33 1.12
Meclofenamic Acid 0.1 1 0.36 0.12 0.39 Mefenamic Ac~d 0.1 1 0.38 0.12 0.39
Clotrimazole 0.24 0.80 Gemfibrozil 0.46 1.52 0.37 1.24

Triclosan 0.23 0.78 0.14 0.46 lvermectin 0.32 1.08 0.43 1.42
The determined recovery data from the Strata-X sorbent was generally in
the acceptable range of 70-130% and for many analytes is near quantitative. As
expected from the LC method development, the water solubility of the analytes
limits its retention on the polymeric sorbent, i.e. the more hydrophilic the analyte
the less retention. This fact is clearly demonstrated by metformin that shows little
retention. The retention of basic analytes was generally lower than their acidic
counterparts, which was due to the low pH at which the extraction was performed.
Repeatability was generally in the range of 10-20% RSD for the six replicate
extractions which is acceptable considering the complexity of the method and the
number or steps involved before achieving a concentrate extract. The levels of
precision achievable will depend upon the influence of the sample matrix, i.e.
interference from component of the matrix present, possible co-elution etc. Analyte
recovery was also noted to be higher from estuarine water samples compared to
fresh water samples, this is attributed to the increased ionic strength of the
estuarine sample and resulting 'salting out' effects. The homogeneity of the
extraction material is also important in providing repeatable recovery values. Based
upon the levels of repeatability calculated it can be deduced that the Strata-X
sorbent is quite homogenous with acceptable inter batch repeatability and the
sample matrix is not excessively preconcentrated under the method conditions
allowing for clear identification of the target analytes.
The calculated LOD and LOQ values in a real sample matrix are on average
in the low to sub p g ~ - l range therefore suggesting that the developed method is
suitably sensitive for its intended purpose. It can be observed that components of
the sample matrix that are extracted along with the target analytes reduce the
sensitivity of the method, this is particularly visible for trimethoprim and propranolol
amongst others which exhibit strong responses under standard conditions but were
completely obscured by co-extracted matrix components. It is also interesting to
note that the calculated detection and quantitation limits are lower in estuarine
water than in river water. This may be due to lower matrix content or the influence
of increased ionic strength on the extraction compared to river water. The
calculated sensitivity data also compares well with other methods developed for
the determination of pharmaceutical residues from complex environmental
samples. For example Blackwell et a/. reported detection limits in the range of
0.25-0.35 p g ~ - ' for the determination of three antibiotics in surface water samples,
however, a much more complicated extraction procedure was employed and
detection was performed at longer wavelengths that would not be expected to
suffer as much from matrix interference [41]. Similarly Gonzalez-Barreiro et a/.
employed photochemically induced fluorescence for the determination of ten
pharmaceuticals in wastewater and detection limits were in the region of 2-120
p g ~ - ' [42]. It can therefore, be seen that the developed method compares
favourable with other reported LC procedures with optical detection.
. .
3.3.7 Application to environmental samples:
Grab samples were collected in silanised 2 L amber glass bottles from areas in
north Co. Dublin and Co. Meath, Ireland namely the Malahide Estuary (which
receives treated effluent from sewage treatment plants in north Co. Dublin), in the
vicinity of sewage sea outfalls near Howth and Portmarnock, and from the River
Boyne downstream of the Navan Wastewater Treatment Centre in Co. Meath
(>40,000 population equivalents). A sample of potable water from the laboratory
was also analysed. Samples were filtered and extracted as previously described in
section 3.2.4 and analysed using the dual gradient method, Table 3.2. A 1 L
portion of each sample was also spiked with 1 p g ~ - ' of each pharmaceutical and
extracted and analysed using the dual gradient method. None of the chosen
analytes were detected in any of the samples collected. However, the spiked
samples showed very clear peaks for all of the pharmaceuticals added at the
expected retention times. Fig. 3.7 depicts the resulting chromatogram of extracted
spiked Malahide Estuary sample.
30 40
Time, (mins)
Figure 3.7: Chromatogram of the extracted 1 p g ~ - ' spiked Malahide Estuary sample. Separation conditions as in Figure 3.4. Peak identification: 1 metformin, 2 paracetamol, 3 salicylic acid, 4 bimethoprim, 5 caffeine, 6 o-toluic acid, 7 propranolol, 8 clofibric acid, 9 2-naphthoic acid, (internal standard, 10 ketoprofen, 11 bezafibrate, 12 naproxen, 13 warfarin, 14 flurbiprofen, 15 diclofenac, 16 indomethacin*, 17 ibuprofen, 18 meclofenamic acid, 19 mefenamic acid, 20 cloirimazole*, 21 gemfibrozil*, 22 Triclosan, 23 ivermectin*, (*Actual spiking level: 2 ppb).
Samples and spikes were also analysed using a photodiode array detector
and a portion of an extracted contour plot is displayed in Fig. 3.8. It can be seen
that distinguishable UV spectra can be obtained even from ultra trace levels on
complex matrices when suitable preconcentration is employed. Preliminary
qualitative data can be achieved by UV library searching if available and therefore
the method may be of use in environmental laboratories where LC-MS
instrumentation is not available.
2-Naphthoic Acid, (1,s.)
Propranolol
Figure 3.8: Partial contour plot of spiked Malahide estuary sample, distinguishable UV spectra can be obtained even for ultra trace residues with sample preconcentration using SPE.
3.4 Conclusions:
A simple method has been developed that allows for the preconcentration and
determination of acidic and basic pharmaceuticals. Using monolithic columns a
highly efficient separation is achievable with calculated theoretical plate counts far
superior to those attainable using particulate columns. Acceptable SPE recoveries
for the majority of analytes permit the lowering of instrumental detection limits by
one thousand fold thereby allowing low p g ~ - ' levels to be determined using LC-UV.
When combined with photodiode array detection preliminary qualitative information
is achievable especially if a spectral library search function is available. The
method has been applied to a variety of environmental waters. The method may
become useful to those who wish to determine the selected pharmaceuticals in
environmental samples but who do not have access to LC-MS instrumentation.

References:
1. M.J. Martin, F. Pablos & A.G. Gonzalez, Talanta, 49, (1999), 453.
2. E. Mikami, T. Goto, T. Ohnom H. Matsumato & M. Nishida, Journal of Pharmaceutical and
Biomedical Analysis, 23, (2000), 9 17.
3. Y. Sun, K. Takaba, H. Kido, M.N. Nakashima & K. Nakashima, Journal of Pharmaceutical and
Biomedical Analysis, 30, (2003), 161 1.
4. J. Dey, A. Mohanty, S. Roy & D. Khatua, Journal of ChromatographyA, 1048, (2004), 127.
5. C. Arcelloni, R. Lanzi, S. Pedercini, G. Molteni, I. Fermo, A. Pontiroli & R. Paroni, Journal of
Chromatography B, 763, (2001), 195.
6. T. Hirai, S. Matsumoto & I. Kishi, Journal of Chromatography B, 692, (1997), 375.
7. C. Akay & S.A. Ozkan, Journal of Pharmaceutical and Biomedical Analysis, 30, (2002), 1207.
8. M. Dubois, D. Fluchard, E. Sior & Ph. Delahunt, Journal of Chromatography B, 753, (2001), 189.
9. E.M. Abdel-Moety, F.I. Khattab, K.M. Kelani &A.M. AbouAl-Alamein, I1 Farmaco, 57, (2002), 931.
10. E. Gonzalez-Penas, S. Agarraberes, A. Lopez-Ocariz, E. Gacia-Quetglas, M.A. Campanero,
J.J. Carballal & J. Honorato, Journal of Pharmaceutical and Biomedical Analysis, 26, (2001), 7.
11. E.J. Park, D. Lee, Y.G. Shin, D.D. Lantvit, R.B. van Breemen, A.D. Kinghorn & J.M. Pezzuto,
Journal of Chromatography B, 754, (2001), 327.
12. E. Mikami, T. Goto, T. Ohno, H. Matsumoto & M. Nishida, Journal of Pharmaceutical and
Biomedical Analysis, 28, (2002), 261.
13. D.J. Schakel, D. Kalsbeek & K. Boer, Journal of ChromatographyA, 1049, (2004), 127.
14. A. Piccoli, J. Fiori, V. Andrisano & M. Orioli, I1 Farmaco, 57, (2002), 369.
15. Y. Hsieh, J.M. Brisson, G. Wang, K. Ng & W.A. Korfmacher, Journal of Pharmaceutical and
Biomedical Analysis, 33, (2003), 251.
16. K. Pihlainen, E. Sippola & R. Kostiainen, Journal of ChromatographyA, 994, (2003), 93.
17. R.C. Schneider & K.A. Hovar, Chromatographia, 57, (2003), 287.
18. S.C. Tan, S.H.D. Jackson, C.G. Swift & A.J. Hutt, Journal of Chromatography B, 701, (1997),
53.
19. G.A. Jacobson, F.V. Chong & N.W. Davies, Journal of Pharmaceutical and Biomedical Analysis,
31, (2003), 1237.
20. X.W. Teng, S.W. J. Wang & N.M. Davies, Journal of Pharmaceutical and Biomedical Analysis,
33, (2003), 95.
21. M.J. Hilton & K.V. Thomas, Journal of ChromatographyA, 1015, (2003), 129.
22. S. Yang, J. Cha & K. Carlson, Rapid Communications in Mass Spectrometry, 18, (2004), 2131.
23. A. Aguera, A.R. Fernandez-Alba, L. Pedra, M. Mezcua & M.J. Gomez, Analytica Chimica Acta,
480, (2003), 193.
24. D. Loffler & T.A. Ternes, Journal of Chromatography A, 1021, (2003), 133.
25. A.M. van Nederkassel, A. Aerts, A. Dierick, D.L. Massart & Y. Vander Heyden, Journal of
Pharmaceutical and Biomedical Analysis, 32, (2003), 233.
104

26. J.H. Smith & H.M. MCNair, Journal of Chromatographic Science, 41, (2003), 209.
27. A. Bugey & C. Staub, Journal of Pharmaceutical and Biomedical Analysis, 35, (2004), 555.
28. V.V. Tolstihov, A. Lommen, K. Nakanishi, N. Tanaka & 0. Fiehn, Analytical Chemistry, 75,
(2003), 6737.
29. N. Tanaka, H. Kobayashi, N. Ishizuka, H. Minakuchi, K. Nakanishim K. Hosoya & T. Ikegami,
Journal of Chromatography A, 965, (2002), 35.
30. C. Schafer, K. Cabrera, D. Lubda, K. Sinz & D. Cunningham, American Laboratory, April 2001,
25.
31. General Medical Services (Payments) Board report for year ending 31"' December 2003,
available through www.gmspb.ie
32. K.L. Ng, B. Paull, P.R. Haddad & K. Tanaka, Journalof ChromatographyA, 850, (1999), 17.
33. A. Paci, A.M. Caire-Maurisier, A. Rieutord, F. Brion & P. Clair, Journal of Pharmaceutical and
Biomedical Analysis, 27, (2002), 1 . 34. B. Paull, C. O'Riordain & P. Nesterenko, Chemical Communications, 2, (2005), 215.
35. Merck product literature, "General Chromolith Information and Applications" received with
columns.
36. R.G. Wolcott, J.W. Dolan, L.R. Snder, E.R. Bakalyar, M.A. Arnold & J.A. Nichols, Journal of
Chromatography A, 869, (2000), 21 1.
37. International Conference on Harmonisation of Technical Requirements for Registration of
Pharmaceuticals for Human Use, ICH Tripartite Guideline, 'Validation of Analytical Procedures:
Methodology', available on-line at http://www.nihs.go.jp/dig/ich/quality/q2b/q2bstep4.pdf, multiple
consultations.
38. S. Ollers, H.P. Singer, P. Fassler & S.R. Muller, Journal of Chromatography A, 91 1, (2001) 225.
39. B.J. Vanderford, R.A. Pearson, D.J. Rexing & S.A. Snyder, Analytical Chemistry, 75, (2003),
6265.
40. M. Clara, Water Research, 38, (2004), 947.
41. P.A. Blackwell, H.C. Holtan Lutzhoft, H.P. Ma, B. Halling-Sorenson, A.B.A. Boxall & P. Kay,
Journal of Chromatography A, 1045, (2004), 1 1 1 . 42. C Gonzales-Barreiro, M. Lores, M.C. Casais & R. Cela, Journal of Chromatography A, 993,
(2003), 29.

4.0 On-line Preconcentration of Pharmaceutical
Residues from Large Volume Water Samples using
Short Reversed-Phase Monolithic Cartridges Coupled
to LC-UV-ESI-MS.
4.1 Introduction:
Within the last decade pharmaceuticals and personal care products have emerged
as a new class of organic micro contaminants that are frequently detected in the
aquatic environment [1,2]. As a result, the number of methods appearing in the
peer-reviewed literature for their determination has increased. Due to the ultra
trace levels of pharmaceuticals that may be present, normally sub parts per billion
[3] a sample enrichment procedure is necessary in order to attain the desired
levels of analytical sensitivity. The foremost approach reported to date has been
the use of solid phase extraction (SPE) techniques predominantly using disposable
cartridges in the off-line mode [4,5,6]. A drawback of off-line SPE procedures is
that they can be quite cumbersome to perform, often requiring many steps before
reaching a concentrated extract suitable for instrumental analysis, of which only a
small proportion is actually injected onto the chromatographic column. In contrast
on-line SPE techniques offer increased sensitivity with reduced sampling handling
as all the extracted components can easily be introduced to the analytical column.
Reported detection limits in the p g ~ ' range are not uncommon [7,8]. One of the
driving forces for on-line SPE methods is higher throughput and faster analysis as
required for pharmacokinetic and metabolomic studies [9]. The formats of on-line
SPE reported in the literature vary from column switching techniques
[ I 0,11,12,13,14,15,16,17,18] to automated SPE instruments coupled to liquid
chromatographs [8,19,20,21]. With automated systems only a small portion of the
extract is actually injected onto the analytical column compared with complete
introduction b.y mobile phase back flush when column switching is employed.
Therefore it would be more appropriate to refer to such procedures as automated

SPE rather than true on-line SPE. Although on-line SPE is an attractive prospect it
is not without limitations. Extraction columns are generally quite small and
therefore can only contain a limited quantity of sorbent leading to problems with
analyte retention [lo]. Sorbents are generally particulate in nature and small
particles with a large active surface area may be required. However, the speed of
the extraction may then be limited due to the excessive backpressure generated.
Sorbents must also be chosen with high analyte affinity thereby allowing higher
volumes of sample required for increased sensitivity to be extracted without the
possibility of analyte breakthrough. Application of on-line SPE and automated SPE
include the preconcentration of pharmaceuticals [ I 0,181, estrogens and endocrine
disruptors [8,20] and nonylphenol [I41 with subsequent LC and photodiode array or
MS detection.
Monolithic silica consists of a unique bimodal pore structure, (macropores of
-2 pm and mesopores of -13 nm, section 2.3.5) which imparts high porosity and a
higher available active surface area to the column [22]. Such high porosity also
allows monolithic columns to be used at elevated flow rates without the generation
of excessive backpressure. The approach taken with this research has focused
upon the use of short reversed-phase monolithic silica columns for the on-line SPE
of acidic, basic and neutral pharmaceutical residues from aquatic samples. The
monolithic column allows for the rapid extraction of a large sample volume at
relatively low pressure. A longer reversed-phase monolithic column was employed
for the analytical separation using the method developed in Chapter 3.0. Coupling
the on-line SPE-LC procedure with ion trap MS increased the selectivity of the
method.
4.2 Experimental:
4.2. I Analyte selection:
Analytes chosen for monitoring include those that showed prevalence in both the
published literature and also the list of the most prescribed pharmaceuticals in
Ireland for the year ending December 31'' 2003 [23]. In addition to the analytes
mentioned in Chapter 3.0 Table 3.1, the pharmaceuticals depicted in Table 4.1
were also included.

Table 4.1: The chemical structures of the additionally included pharmaceuticals.
Analyte Chemical Structure Analyte Chemical Structure
Atenoiol
Furosemide Carbamazeplne
A 0 NH,
Sulfamethoxazole
Suffamethazine

Salbutamol
4.2.2 Chemicals and reagents:
Chemicals and reagents used in this study were as per section 3.2.2 unless
otherwise stated. Ciprofloxacin was received from Fluka, (Buchs, Switzerland).
Atenolol, salbutamol, amoxicillin, sulfamethoxazole, sulfamethazine sodium salt,
furosemide, carbamazepine, nimesulide and fluoxetine were all obtained from
Sigma, (Steinheim, Germany). All pharmaceuticals were of a purity >95%.
Stock 1000 m g ~ - ' solutions of each pharmaceutical were prepared in MeOH
with the exception of ciprofloxacin which was prepared in water. In the case of
salts, standards were prepared in terms of the parent analyte. These standards
were periodically replaced. Working standards were prepared from these stock
standards by appropriate dilution using MeOH.
Buffer solutions used for the optimisation of the extraction pH were prepared
by mixing appropriate amounts of acid and its conjugate base for formate and
acetate, respectively. In the case of MES and HEPES weighed proportions of salt
were dissolved in -900 mL Milli-Q water and titrated to the desired pH using either
1 M HCI or 1 M NaOH.
4.2.3 Glassware preparation:
Silanisation was performed as described in section 3.2.3.
4.2.4 On-line SPE:
On-line SPE was performed using a Rheodyne 7000 six-port column-switching
valve (Cotati, CA, USA). The extraction column was a Merck Chromolith RP18e
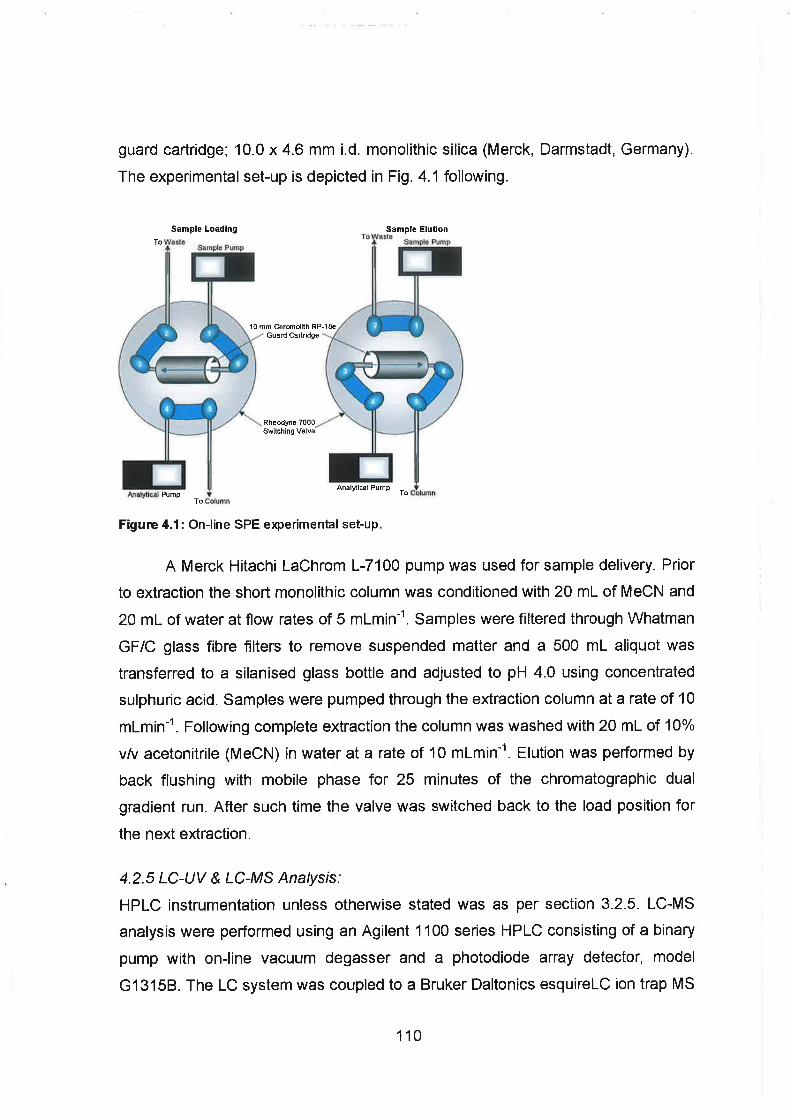
guard cartridge; 10.0 x 4.6 mm i.d. monolithic silica (Merck, Darmstadt, Germany).
The experimental set-up is depicted in Fig. 4.1 following.
Sample Loading
tRheodme Switching Vdv
Figure 4.1: On-line SPE experimental set-up.
A Merck Hitachi LaChrom L-7100 pump was used for sample delivery. Prior
to extraction the short monolithic column was conditioned with 20 mL of MeCN and
20 mL of water at flow rates of 5 mlmin-'. Samples were filtered through Whatman
GFIC glass fibre filters to remove suspended matter and a 500 mL aliquot was
transferred to a silanised glass bottle and adjusted to pH 4.0 using concentrated
sulphuric acid. Samples were pumped through the extraction column at a rate of 10
mlmin-'. Following complete extraction the column was washed with 20 mL of 10%
v h acetonitrile (MeCN) in water at a rate of 10 mlmin". Elution was performed by
back flushing with mobile phase for 25 minutes of the chromatographic dual
gradient run. After such time the valve was switched back to the load position for
the next extraction.
4.2.5 LC-UV & LC-MS Analysis:
HPLC instrumentation unless otherwise stated was as per section 3.2.5. LC-MS
analysis were performed using an Agilent 1100 series HPLC consisting of a binary
pump with on-line vacuum degasser and a photodiode array detector, model
G1315B. The LC system was coupled to a Bruker Daltonics esquireLC ion trap MS

complete with an atmospheric pressure ESI interface. Agilent ChemStation version
A.06.01, (Agilent Technologies, Palo Alto, CA, USA) and Bruker Daltonics esquire
control version 6.08, (Bruker Daltonics, Coventry, UK), were used for LC-MS
system control, Bruker Daltonics DataAnalysis version 3.0 was used for data
processing. For ESI optimisation solutions of analyte were directly infused into the
MS using a Cole Parmer 74900 series syringe pump at a rate of 300 p~h' l (Cole
Parmer, Vernon Hills, IL, USA).
Analytical separations were performed using two Merck Chromolith
Performance RP18e; 100.0 x 4.6 mm i.d. monolithic silica columns joined in series
using a Chromolith volumeless column coupler (Merck KgaA, Darmstadt,
Germany). Details of the dual gradient separation parameters were previously
reported, (Table 3.1). Prior to entering the ESI interface the flow was split -1120
using an UpChurch Scientific graduated micro splitter valve, model P-470,
(UpChurch Scientific, Oak Harbor, WA, USA).
4.3 Results & Discussion:
4.3.1 Liquid chromatography:
The chosen set of pharmaceutical analytes is quite chemically diverse spanning
across acidic, neutral and basic chemicals. The pK, values and both
experimentally determined and theoretical octanol water partition coefficients (Log
P and XLog P), data of the selected pharmaceuticals can be seen in Table 4.2
following.
During previous LC method development it was observed that the pH of the
mobile phase exhibited the most pronounced effect on the selectivity of the
separation. It was found that a pH of 4.5 provided sufficient separation of all
chosen analytes. Additional pharmaceuticals have been included because a
complete separation of all analytes is not completely necessary when
accompanied by MS detection. Fig. 4.2 depicts the separation of a 5 mgL" mix
standard of the chosen pharmaceuticals with UV detection at 225 nm, for the
purposes of clarity the set of chosen analytes was subdivided and each resulting
chromatogram is offset to easily permit the resulting peaks to be identified.
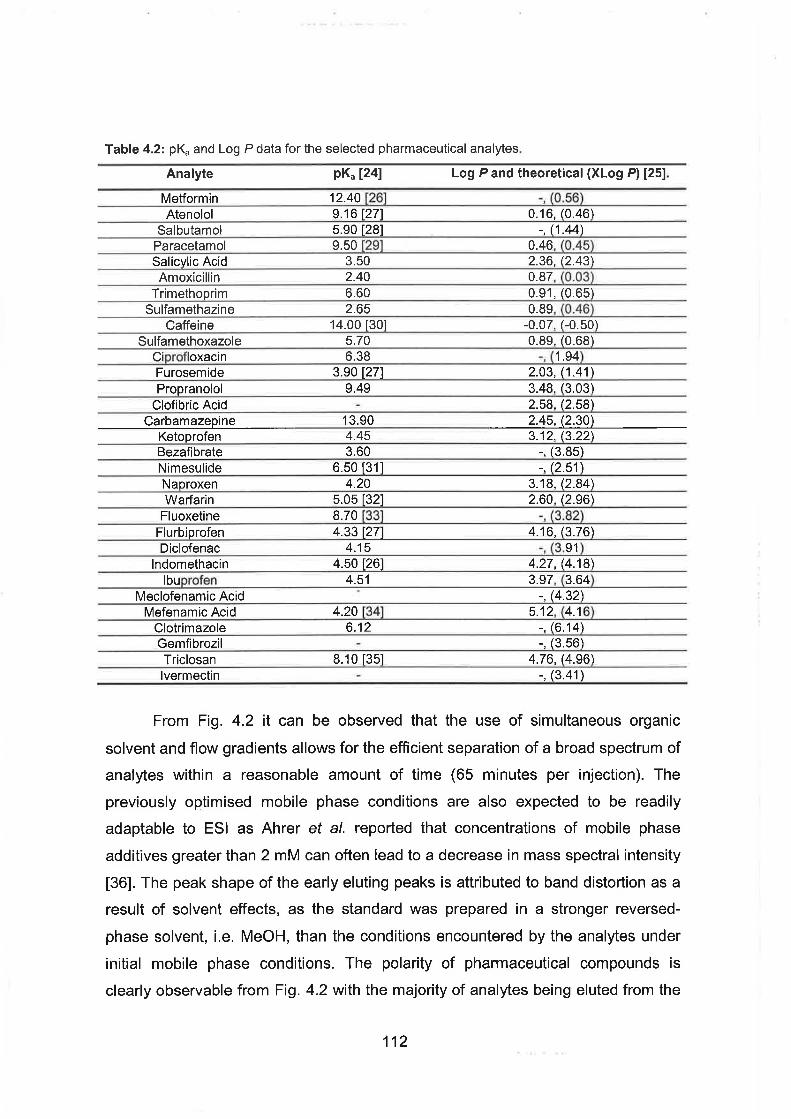
Table 4.2: pK, and Log P data for the selected pharmaceutical analytes,
Analyte PK, 1241 Log P and theoretical (XLog P) [25].
Metformin 12.40 1261 -, (0.56) Atenolol 9.1 6 [27] 0.16, (0.46)
Salbutamol 5.90 [28] -, (1.44) Paracetamol 9.50 [29] 0.46, (0.45) Salicylic Acid 3.50 2.36, (2.43) Amoxicillin 2.40 0.87, (0.03)
Trimethoprim 6.60 0.91, (0.65) Sulfamethazine 2.65 0.89, (0.46)
Caffeine 14.00 [30] -0.07, (-0.50) Sulfamethoxazole 5.70 0.89, (0.68)
Ciprofloxacin 6.38 -, ( I .94) Furosemide 3.90 [27] 2.03, (1.41) Propranolol 9.49 3.48, (3.03)
Clofibric Acid - 2.58, (2.58) Carbamazepine 13.90 2.45, (2.30)
Ketoprofen 4.45 3.12, (3.22) Bezafibrate 3.60 -, (3.85) Nimesulide 6.50 [31] -, (2.51)
Meclofenamic Acid -, (4.32) Mefenamic Acid 4.20 [34] 5.12, (4.16)
Clotrimazole 6.12 -, (6.14) Gemfibrozil - -, (3.56) Triclosan 8.10 1351 4.76, (4.96) lvermectin - -, (3.41)
Naproxen 4.20 3.18, (2.84)
From Fig. 4.2 it can be observed that the use of simultaneous organic
Warfarin 5.05 Fluoxetine 8.70
Flurbiprofen 4.33
solvent and flow gradients allows for the efficient separation of a broad spectrum of
analytes within a reasonable amount of time (65 minutes per injection). The
Diclofenac 4.1 5 -, (3.91) lndomethacin 4.50 [26] 4.27, (4.1 8)
Ibuprofen 4.51 3.97, (3.64)
[32: :33: 127:
previously optimised mobile phase conditions are also expected to be readily
2.60, (2.96) -, (3.82)
4.16, (3.76)
adaptable to ESI as Ahrer et a/. reported that concentrations of mobile phase
additives greater than 2 mM can often lead to a decrease in mass spectral intensity
[36]. The peak shape of the early eluting peaks is attributed to band distortion as a
result of solvent effects, as the standard was prepared in a stronger reversed-
phase solvent, i.e. MeOH, than the conditions encountered by the analytes under
initial mobile phase conditions. The polarity of pharmaceutical compounds is
clearly observable from Fig. 4.2 with the majority of analytes being eluted from the

reversed-phase column within the first twenty minutes of the chromatographic run,
suggesting perhaps that other stationary phase chemistries such as C8, phenyl or
even ion exchange sorbents may warrant investigation to improve the retention
and increase selectivity for such early eluting analytes.
30 40 Time, (mins)
Figure 4.2: Standard separation of chosen pharmaceuticals. Peak identification: 1; Metformin, 2; Atenolol, 3; Salbutarnol, 4; Acetaminophen, 5; Amoxicillin, 6; Salicylic acid, 7; Trimethoprim, 8; Sulfarnethazine, 9; Sulfamethoxazole, 10; Caffeine, 11; Ciprofloxacin, 12; Furosemide, 13; Propranolol, 14; Clofibric acid, 15; Carbamazepine, 16; Ketoprofen, 17; Bezafibrate, 18; Nimesulide, 19; Naproxen, 20; Fluoxetine, 21; Warfarin, 22; Flurbiprofen, 23; Diclofenac, 24; Indornethacin, 25; Ibuprofen, 26; Meclofenarnic acid, 27; Mefenarnic acid, 28; Clotrirnazole, 29; Gemfibrozil, 30; Triclosan, 31; Iverrnectin. The blue trace is offset by 2.5 minutes in time and 5 rnAU, the red trace is offset by 5 minutes in time and 10 mAU for the purposes of clarity, separation conditions as per Table 3.1.
4.3.2 On-line SPE - optimisation of the sample loading flow:
The unique bimodal pore structure of monolithic silica allows for the use of
elevated flow rates without the generation of excessive backpressure normally
encountered when using particulate-based media under the same conditions. In
this study, the use of a short monolith as an on-line concentrator column with LC
was investigated, configured as shown in Fig. 4.1. On-line SPE using short
monolithic trap columns offers the following potential advantages over using an off-
line SPE approach. Firstly, despite the surface area of the short monolith being
-350 m2g" compared to higher surface areas for commercial packed SPE
cartridges (Oasis HLB = 700 m2g", LiChrolut EN = 1000 m2g-'), it was envisaged
the relatively small dead volume within the monolithic phase and the comparatively
small flow through channels would result in equal or improved extraction
efficiencies for analytes exhibiting some reasonable degree of hydrophobicity.
Secondly, the system would permit rapid sample loading, equivalent to the loading
rates used with off-line SPE using commercial cartridges, but also permit
automated washing and elution steps. Thirdly, the elution of the retained analytes
would be possible using the LC mobile phase and the direct back flushing of the
analytes and sharp sample bands onto the analytical column possible, without any
analyte loss. Finally, the system allowed for simultaneous loading of the next
sample during the chromatographic separation of the previous sample. Such a
feature allows for the reduction of analysis times significantly, in this instance the
desire was to use short monolithic columns for the rapid extraction of reasonably
large volumes of sample. In order to determine the maximum possible flow rate,
reagent water was pumped through the extraction column at various flow rates and
the resultant backpressure was measured. Fig. 4.3 depicts the average of ten
replicate backpressure measurements at each of the different flow rates.
From the Fig. 4.3 it can be seen that the backpressure generated increases
linearly as the flow rate increases. The maximum recommended operating
pressure according to the product literature is not more than 200 bar [37] and
therefore, from Fig. 4.3 it is estimated that the maximum possible flow rate is -19
mlmin-' via linear extrapolation. However, the maximum flow rate possible with the
Merck Hitachi pump was 10 m~min- ' thereby limiting the minimum possible
extraction time. The inserted error bars indicate acceptable flow reproducibility that
suggests that the flow of sample through the column should be homogenous.
The effect of flow rate on analyte recovery was measured by extracting 500
mL portions of 200 ngL-' mixed analyte standards prepared in Milli-Q water and
adjusted to pH 4.0 with sulphuric acid. Flow rates investigated were as in Fig. 4.3
above and all extractions were performed in duplicate. Table 4.3 following lists the
calculated recovery values at each of the investigated sample loading flow rates.
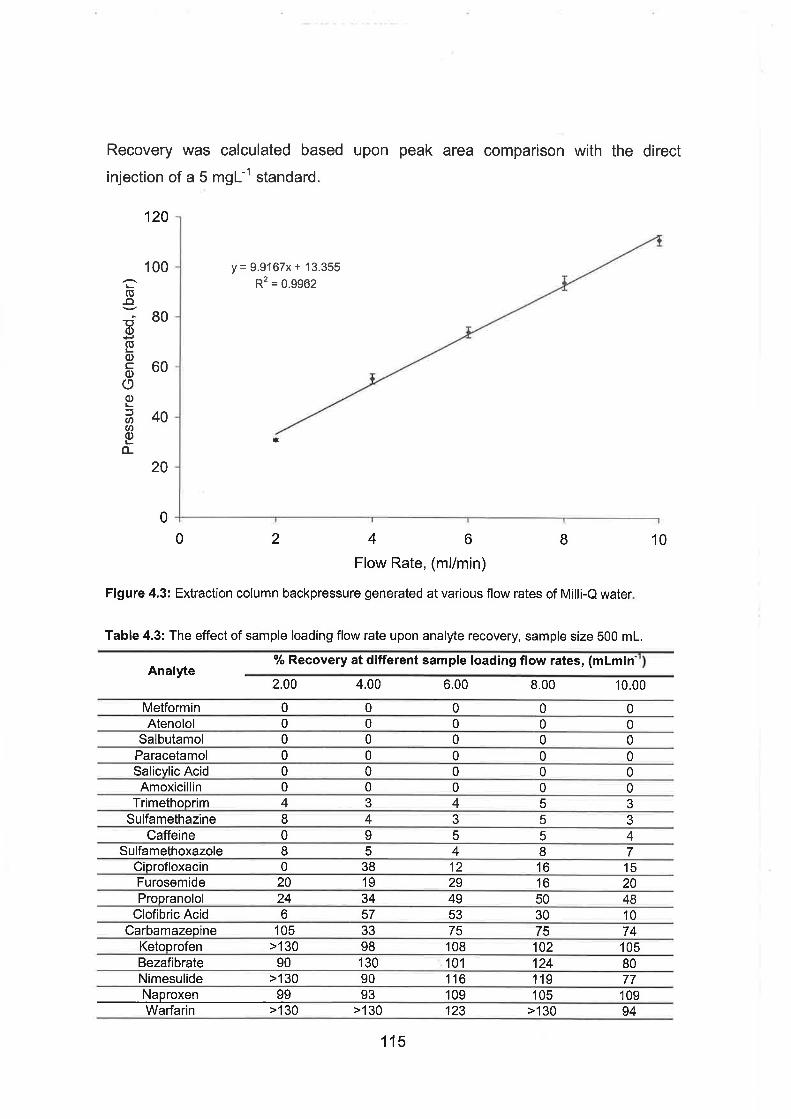
Recovery was calculated based upon peak area comparison with the direct
injection of a 5 rng~-' standard.
0 I I I I 1 1
0 2 4 6 8 10
Flow Rate, (mllmin)
Figure 4.3: Extraction column backpressure generated at various flow rates of Milli-Q water.
Table 4.3: The effect of sample loading flow rate upon analyte recovery, sample size 500 mL.
% Recovery at different sample loading flow rates, (m~min-I) Analyte
2.00 4.00 6.00 8.00 10.00
Metformin 0 0 0 0 0 Atenolol 0 0 0 0 0
Salbutamol 0 0 0 0 0 Paracetamol 0 0 0 0 0 Salicylic Acid 0 0 0 0 0 Amoxicillin 0 - 0 0 0 0
Trimethoprim 4 3 4 5 3 Sulfamethazine 8 4 3 5 3 -
Caffeine 0 9 5 5 4 Sulfamethoxazole 8 5 4 8 7
Ci rofloxacin 12 16 15 Furosemide 20 19 29 16 20 Pro~ranolol 24 34 49 50 48

Fluoxetine 69 92 97 101 92 - ~~ - -
Flurbiprofen 64 126 95 >I 30 82 Diclofenac 30 28 85 90 65
lndomethacin 103 85 100 96 112 Ibuprofen 106 118 83 99 130
Meclofenamic Acid 57 103 75 83 63 Mefenamic Acid 80 84 87 84 92
Clotrimazole 43 98 28 14 20 Gemfibrozil 75 109 87 72 69 - -
Triclosan 54 55 61 60 66 lvermectin -
From Table 4.2 it can be observed that there is little recovery of the more
polar analytes from the extraction column suggesting that there is insufficient
interaction between these polar compounds and the reversed-phase sorbent. This
also suggests that the pH at which the extraction is performed will be of critical
importance in attempting to promote retention of such analytes. However, as was
observed in Fig. 4.2, these analytes also elute extremely early from the analytical
column, within starting mobile phase conditions of maximum aqueous modifier.
Therefore, as previously suggested, the use of more polar or ionic stationary
phases may be needed to sufficiently retain and extract these compounds. This is
an unfortunate observation as it is expected that these analytes that clearly
demonstrate high aqueous affinity are those that are expected to show prevalence
in discharged wastewater effluent and the receiving aquatic system.
In a number of instances the percentage analyte recovery was greater than
130%, particularly in the case of warfarin. Such excessive recovery is attributed to
co-adsorbed trace organic contaminants present in the reagent water. Based upon
a mass balance approach there is a 25000-fold magnification of both analytes and
matrix and therefore, impurities that are normally at such minute levels suddenly
become significant interferants and leading to problems with peak integration. Such
effects were particularly prevalent at lower flow rates. It was also observed that due
to the increased path through the on-line SPE system retention times slightly
increased when compared to those recorded by direct standard injection. In most
instances such an effect caused no problems except in the case of ivermectin that
elutes just before a system peak, (later identified using ESI-MSIMS to be diethyl
hexyl phthalate, mlz 391 . I , a plasticizer contaminant present in the MeOH used)

during standard injection and was observed to coelute with the system peak in the
chromatograms of on-line SPE extracts.
Analyte recovery, with the exception of the aforementioned polar analytes
was quite high, on average >70% and near quantitative in many cases. For the
majority of analytes recovery was unaffected by increasing the rate of extraction,
thereby allowing for reduced extraction times. Practicality must also be taken into
consideration and therefore, it was decided to use a flow rate of 10 mlmin-' for
sample extraction for all further development.
4.3.3 On-line SPE - optimisation of the sample pH:
In an attempt to increase the retention of the more polar pharmaceuticals the
extraction pH was optimised. As the extraction column is a silica-based material
and according to the product literature is only stable within the range of pH 2 - 7.5
[37], pH values in the range of 3 - 7 were investigated using appropriate buffer
solutions prepared in Milli-Q water. Table 4.4 lists analyte recovery at each of the
experimental pH values.
Table 4.4: Analyte recovery as a function of sample pH, sample size 500 mL.
% Analyte recovery
Analyte PH 3 PH 4 PH 5 PH 6 PH 7
(formate) (formate) (acetate) (MES) (HEPES)
Metformin 0 0 0 0 0 Atenolol 0 0 0 0 0
Salbutamol 0 0 0 0 0 Paracetamol 0 0 0 0 0 Salicvlic Acid 0 0 0 0 n Amoxicillin 0 0 0 0 0
Trimethoprim 4 6 9 25 33 Sulfamethazine 5 3 3 3 1
Caffeine 5 8 7 7 n Sulfamethoxazole 7 9 6 4 2
Ciprofloxacin 36 77 40 15 0 Furosemide 48 36 16 5 0 Pro~ranolol 58 40 49 82 71
Clofibric Acid 40 11 4 0 n Carbamazepine 88 97 84 84 75
Ketoprofen 93 82 98 51 28 Bezafi brate 92 94 87 83 100 - -
Nimesulide 83 104 123 85 32 Naproxen 73 78 73 16 11 W~arfarin 73 112 99 90 0
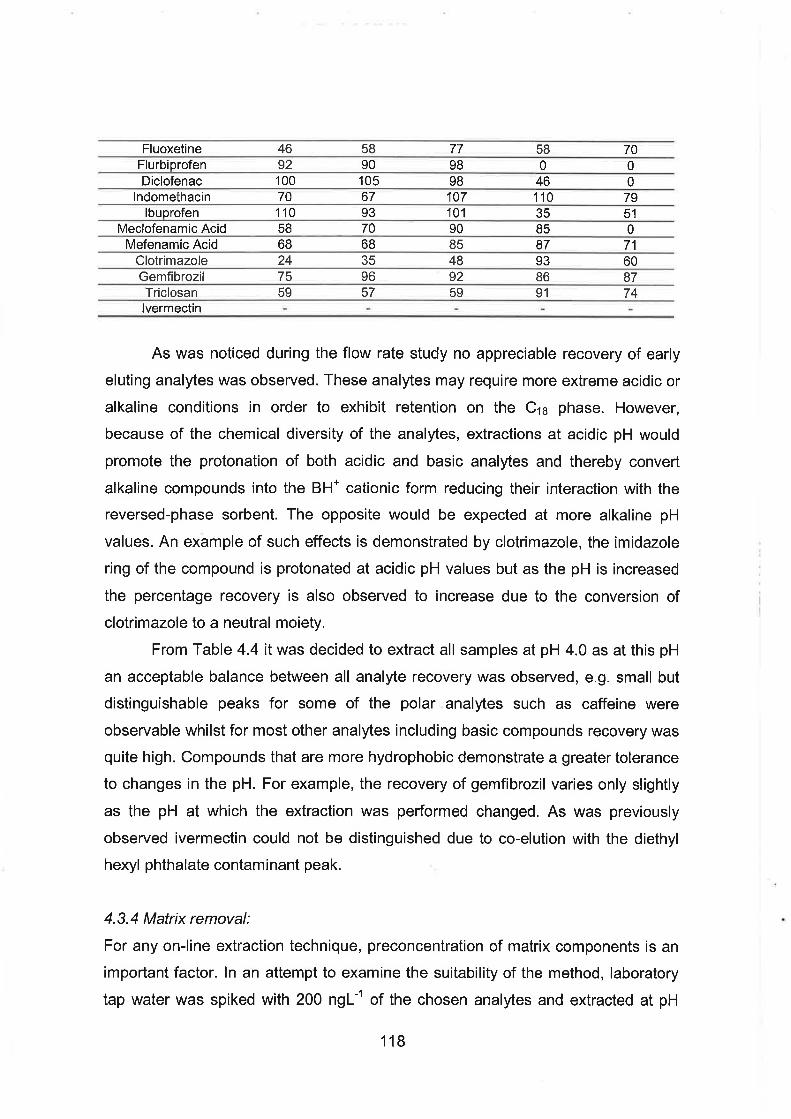
Fluoxetine 46 58 77 58 70 Flurbi rofen 92 9 0 0 Diclofenac 100 105 98 46 0
lndomethacin 70 67 107 110 79 Ibuprofen 110 93 101 35 5 1
Meclofenamic Acid 58 - 70 90 85 0 Mefenamic Acid 68 68 85 87 71
Clotrimazole 24 35 48 93 60 Gemfibrozil 75 96 92 86 87 Triclosan 59 57 59 91 74 lvermectin -
As was noticed during the flow rate study no appreciable recovery of early
eluting analytes was observed. These analytes may require more extreme acidic or
alkaline conditions in order to exhibit retention on the CI8 phase. However,
because of the chemical diversity of the analytes, extractions at acidic pH would
promote the protonation of both acidic and basic analytes and thereby convert
alkaline compounds into the BH' cationic form reducing their interaction with the
reversed-phase sorbent. The opposite would be expected at more alkaline pH
values. An example of such effects is demonstrated by clotrimazole, the imidazole
ring of the compound is protonated at acidic pH values but as the pH is increased
the percentage recovery is also observed to increase due to the conversion of
clotrimazole to a neutral moiety.
From Table 4.4 it was decided to extract all samples at pH 4.0 as at this pH
an acceptable balance between all analyte recovery was observed, e.g. small but
distinguishable peaks for some of the polar analytes such as caffeine were
observable whilst for most other analytes including basic compounds recovery was
quite high. Compounds that are more hydrophobic demonstrate a greater tolerance
to changes in the pH. For example, the recovery of gemfibrozil varies only slightly
as the pH at which the extraction was performed changed. As was previously
observed ivermectin could not be distinguished due to co-elution with the diethyl
hexyl phthalate contaminant peak.
4.3.4 Matrix removal:
For any on-line extraction technique, preconcentration of matrix components is an
important factor. In an attempt to examine the suitability of the method, laboratory
tap water was spiked with 200 n g ~ " of the chosen analytes and extracted at pH

4.0. However, the recorded UV chromatogram displayed a rather large broad peak
(-20 minutes wide). This peak is attributed to excessive preconcentration of the
sample matrix, (natural organic matter, humic and fulvic acid, tannins etc.) and was
observed to totally swamp all analyte peaks and also cause suppression of the ESI
signal during initial MS work. Previously reported methods for matrix removal in the
literature have focused upon changing the pH at which the extraction is performed
1381, sample dilution 1391, or the addition of cationic surfactants to the sample prior
to extraction [40]. However, such approaches are impractical in this instance.
Traditionally in off-line SPE methods the sorbent is washed with water containing
small portions of organic solvent and this procedure was further investigated due to
the ease at which it could be performed on-line.
For the development of the wash solvent composition 500 mL aliquots of tap
water were extracted under the previously optimised conditions. Upon complete
sample introduction the short monolithic trap column was linked directly to the UV
detector and analytes were desorbed using a linear gradient of 100% water to
100% solvent in 30 minutes. Both MeCN and MeOH were investigated but
preliminary data showed that MeCN removed a larger proportion of the matrix in a
smaller period of time than MeOH and was therefore, preferred for further
development. Upon examination of the ChemStation solvent profile it was
observed that at 20% MeCN the majority of the matrix components had been
desorbed see Fig. 4.4 (A). However, as the experiment was performed under
gradient conditions it was necessary to repeat it under isocratic conditions with a
defined lower proportion of organic solvent, in this case 10% MeCN was
investigated. Again a 500 mL aliquot of tap water was extracted and this time the
extraction column was washed with 10% vlv MeCN in water at 1 m~min-', see Fig.
4.4 (B). From this investigation it was observed that the majority of the adsorbed
matrix components were removed directly upon the introduction of the wash
solution and that after a period of 20 minutes of washing nearly all the retained
matrix components were completely removed, from the extraction column. The
effect of the washing procedure on the retention of the analytes was also
investigated by preconcentrating a 200 n g ~ " standard prepared in reagent water.
Upon complete introduction the extraction column was washed with 10% vlv MeCN
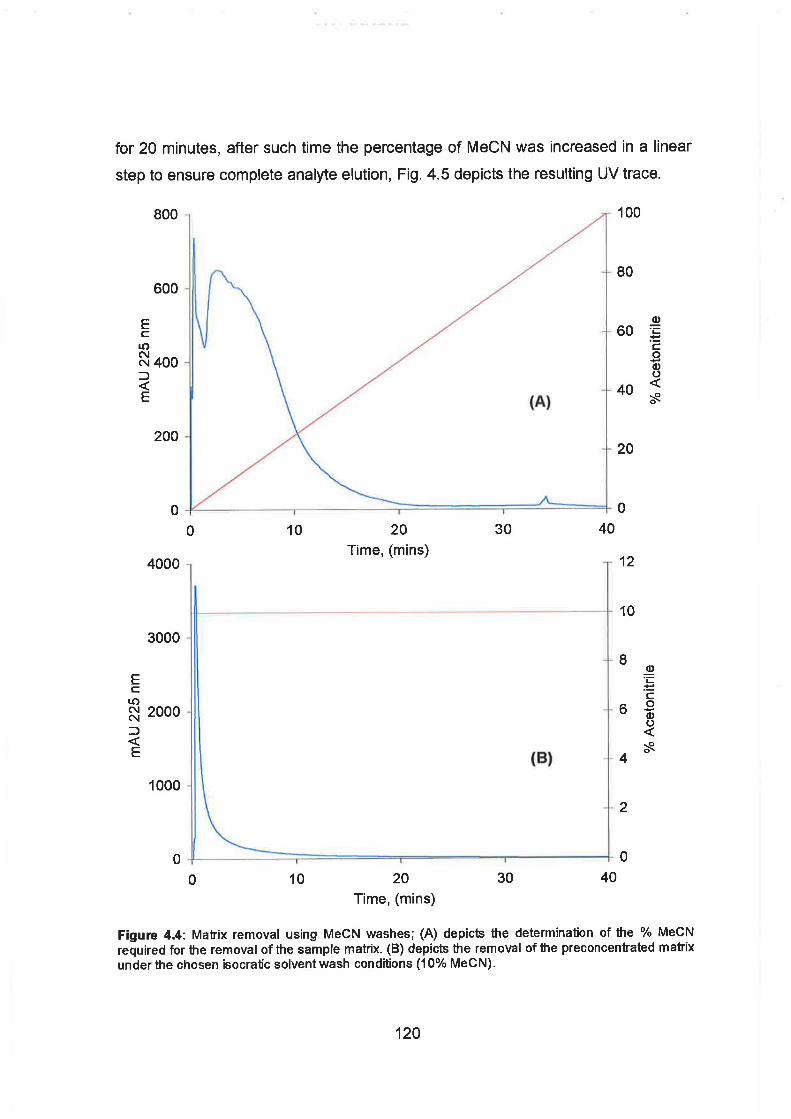
for 20 minutes, after such time the percentage of MeCN was increased in a linear
step to ensure complete analyte elution, Fig. 4.5 depicts the resulting UV trace.
Time, (mins)
0 0 0 10 20 30 40
Time, (mins)
Figurn 4.4: Malrix removal using MeCN washes; (A) depicts the determination of the % MeCN required for the removal of the sample matrix. (B) depicts the removal of the preconcenlrated matrix under the chosen isocratic solvent wash conditions (1 0% MeCN).
From Fig. 4.5 it can be observed that the retention of some analytes is
indeed affected by the washing procedure with peaks present at the beginning of
the chromatogram. These analytes that are observed to elute in the early stages of
the chromatogram elute in the same region as the majority of the matrix and as a
result are omitted from further study. However, a significant proportion of the
analytes is completely retained and was only observed to elute as the percentage
of organic solvent was increased. The higher the degree of hydrophobicity of the
compound the higher its tolerance to the washing procedure, it is expected that the
wash solvent lacks sufficient strength to elute nonpolar analytes from the 1 cm
extraction column. The volume of wash solvent required can also be estimated
from Fig. 4.5, it is clear that analyte retention is unaffected for at least 20 minutes
under conditions of 10% MeCN pumped through at a rate of 1 mlmin-'. Again
considering the porosity of the monolithic extraction column it was possible to
perform the washing procedure at an elevated flow rate of 10 mlmin-I, thereby
allowing for a reduction in the analysis time.
30 Time, (mins)
Figure 4.5: On-line SPE wash development, depicting the effect of the matrix removal wash procedure upon the retention of the analytes on the short monolithic extraction column, a MeCN gradient (dashed line), was used to completely remove the retained components from the trap column. The black trace de icts the matrix profile, the blue trace depicts the elution profile of the rp retained analytes, (200 ngL- ) and the red irace depicts a 'blank extraction' of reagent water.

4.3.5 Extraction to extraction carryover: Due to the high rate of matrix magnification, problems with extraction to extraction
carryover may be expected, leading to contamination or matrix build up and
surface spoilage within the monolithic trap column. The possibility of such
carryover was investigated by extracting a 500 mL portion of tap water without a
matrix removal wash step, i.e. a 'worst case scenario' approach. The sample was
eluted by mobile phase back flush onto the analytical column. At the end of the
chromatographic run the analytical column was analysed for residual matrix using
the dual gradient method without injection while the extraction monolith was
conditioned as normal and then examined for any residual contamination also
using the dual gradient method. Fig. 4.6 is an overlay of the resulting UV traces.
Time, (mins) Figure 4.6: Extraction to extraction carryover. The black trace depicts the elution of the 'unwashed' sample matrix from the extraction and analytical columns. The red trace depicts the resulting UV irace and shows that there is no residual matrix contamination on the analyhcal column. The blue irace is the resulting UV trace of the reconditioned monolithic trap.
From the above figure it is clear that extraction to extraction carryover is
negligible with no residual matrix peaks being observed in either the analytical or
extraction column traces. No residual matrix canyover is expected as during the
separation the percentage MeOH is increased to 90% at a flow rate of 2.3 mlmin-'

while the extraction column is conditioned with 20 mL of MeCN prior to extraction
suggesting that both sets of solvent conditions are sufficient to completely remove
any adsorbed sample or matrix from both the Cq8 phases.
4.3.6 Method performance:
The performance of the on-line SPE dual gradient LC method was evaluated using
two distinct sample matrices, river water taken from the River Boyne in Co. Meath,
Ireland and potable water obtained from the tap in the laboratory. The levels of
natural organic matter present in these sample types is expected to be quite
different with a greater proportion expected in the river water samples. Overall
method detection limits were determined in each sample matrix, LODs are quoted
as three times the standard deviation, (n = 3) of the peak-to-peak baseline noise
while the LOQs are quotes as ten times the standard deviation, (n = 3) of the peak-
to-peak baseline. Method performance data quoted was calculated from UV
chromatograms as preliminary attempts to couple the method with ESI-MS using
the flow splitter showed that there was a rather high degree of variability with the
MS signal and therefore the method is semi quantitative using UV detection and
qualitative when accompanied by ESI-MS. The calculated LOD and LOQ values
calculated by comparison with 200 n g ~ - ' spikes also prepared in both river and
potable water samples are presented in Table 4.5 following.
The calculated detection and quantitation limits are rather low suggesting
that the on-line SPE procedure imparts much greater sensitivity to the method due
to the higher levels of preconcentration obtainable and complete sample
introduction when compared to levels observed when off-line SPE methods are
employed. It can also be observed that the matrix of the sample exhibits a
pronounced effect on sensitivity, limits are lower in potable water compared to river
water and also components of the river water matrix were observed to coelute and
mask the responses of carbamazepine, fluoxetine and warfarin making their
detection at such ultra trace levels impossible by UV alone. Detection limits are in
some instances greater than two orders of magnitude lower than those previously
reported by other researchers for similar pharmaceutical analytes in similar
matrices using optical detection [41,42,43] and comparable if not superior to many
limits quoted using LC-MS and LC-MSIMS methods with off-line SPE [44].
123

Table 4.5: Overall method sensitivity using on-line SPE, values in Clg~" , sample size 500 mL.
River Water Potable Water Analyte
LOD LOQ LOD LOQ
Carbamazepine - - 0.01 0.03 Ketoprofen 0.05 0.17 0.05 0.16 Bezafi brate 0.06 0.21 0.02 0.07 Nimesulide 0.07 0.24 0.02 0.07 Naproxen 0.01 0.03 0.004 0.01 Fluoxetine - 0.05 0.01 Warfarin - - 0.04 0.12 . -
Flurbiprofen 0.20 0.68 0.06 0.19 Diclofenac 0.1 1 0.38 0.04 0.12
lndomethacin 0.17 0.56 0.03 0.09 Ibuprofen 0.09 0.30 0.03 0.08
Meclofenamic acid 0.03 0.09 0.01 0.03 Mefenamic acid 0.03 0.09 0.01 0.04
Clotrimazole 0.15 0.48 0.08 0.27 Gemfibrozil 0.14 0.46 0.05 0.17 Triclosan 0.09 0.29 0.03 0.1 1 lvermectin 0.32 1.06 0.17 0.55
Overall method precision was determined by performing ten replicate
extractions of 200 ngL-' analyte spikes prepared in both river and potable water
samples. Method precision data is presented in Table 4.6 and is quoted as the
%RSD based upon peak area measurement for the ten replicate extractions in
each matrix. The average analyte recovery was also determined in each matrix by
comparison with the direct injection of a 5 mgL-' standard.
Overall method precision shows higher variability with increased levels of
sample matrix, the %RSD values are higher in river water when compared to those
for the potable water spikes. Precision is ~ 2 0 % RSD for the majority of analytes in
both matrices with some exceptions, notably clotrimazole in river water and
naproxen in potable samples. The levels of precision attainable with on-line SPE
are expected to be dependant on the homogeneity of the sample matrix, analytes
with small responses such as warfarin and clotrimazole demonstrate this fact and
are more affected by the presence of small matrix peaks than analytes that exhibit
a larger UV response.

Table 4.6: Overall method precision and analyte recovery from two different sample matrices, (n = lo), sample size 500 mL.
River Water Potable Water
Analyte Precision Precision Recovery Recovery
(O/o RSD) (% RSD)
Carbamazepine - 14.42 9f1 Ketoprofen 20.92 71 f 15 15.90 18f 3 Bezafibrate 16.35 64f11 21.42 42 f9 Nimesulide 18.17 96f 17 7.12 107 f 8 Naproxen 13.02 88f11 47.60 41 f 19 Fluoxetine - 37.94 52 f 20 Warfarin - - 25.62 100 + 26
Flurbiprofen 16.05 65f 10 9.08 86k8 Diclofenac 22.02 60 f 13 5.72 75k4
lndomethacin 34.57 56k 19 24.57 74f 18 l buprofen 17.08 89f 15 4.55 73 k 3
Meclofenamic acid 30.13 68 f 20 6.02 77f 5 Mefenamic acid 20.31 79f 16 3.13 86f 3
Clotrimazole 44.55 37+ 17 9.31 58 f 5 Gemfibrozil 11.09 86k 10 10.53 81 +9 Triclosan 10.51 102f11 6.61 78 f 5 lvermectin 38.41 23f 9 18.78 19f4 -
The calculated rates of recovery are acceptably high for the majority of
analytes. Interestingly ivermectin that was indistinguishable from the system peak
is again completely resolved with the inclusion of the matrix removal step allowing
for its unhindered determination. There does not appear to be a trend when
correlating the calculated recovery to the type of sample matrix with some analytes
exhibiting higher rates of recovery in matrix rich river water than in tap water and
vice versa. The recovery of naproxen from tap water was much lower with higher
variability when compared to the rate calculated for the same spiking level in river
water. A possible explanation for the lower recovery and variability may include the
reaction of naproxen with residual chloride present from the drinking water
disinfection process. Boyd et a/. [45] investigated the removal of naproxen during
water chlorination and reported that naproxen is highly reactive with residual
chlorine to form a range of chlorinated disinfection by-products. The recovery of
ketoprofen and bezafibrate are also considerably lower from tap water than from
the river samples perhaps resulting from elution during the matrix removal wash.
From the ten replicate extractions the reusability of the extraction column
was estimated by examining the stability of analyte peak areas. It was found that
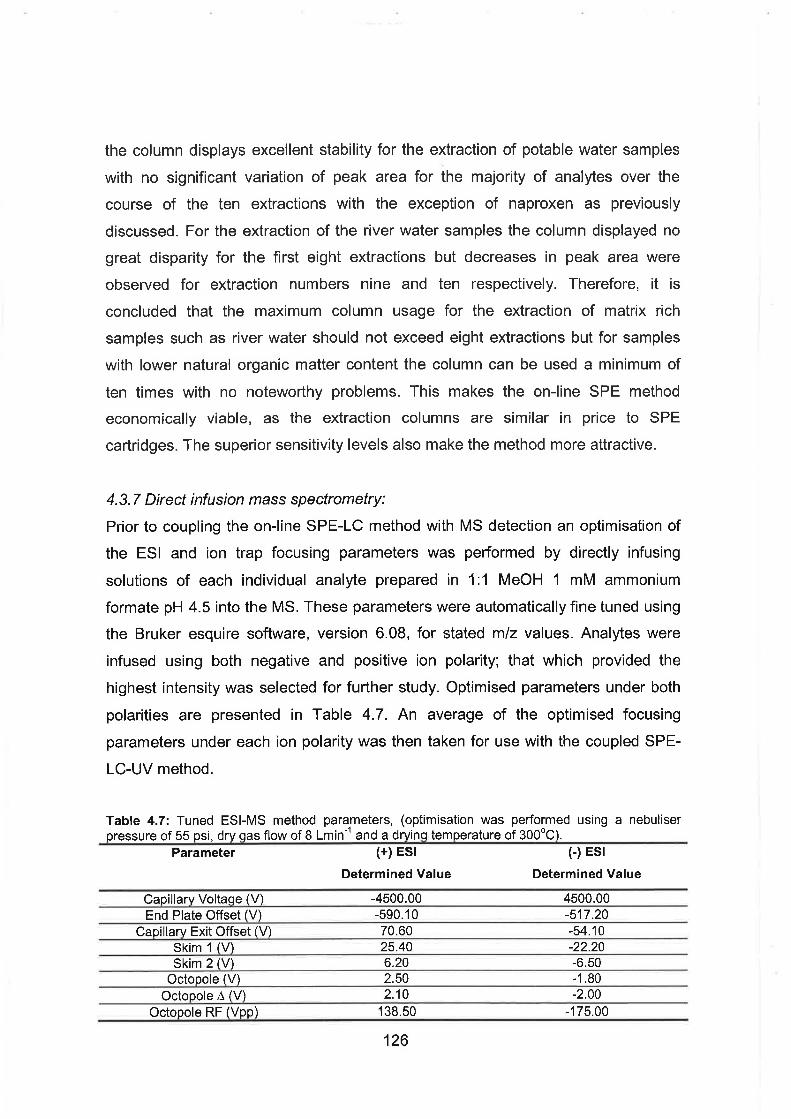
the column displays excellent stability for the extraction of potable water samples
with no significant variation of peak area for the majority of analytes over the
course of the ten extractions with the exception of naproxen as previously
discussed. For the extraction of the river water samples the column displayed no
great disparity for the first eight extractions but decreases in peak area were
observed for extraction numbers nine and ten respectively. Therefore, it is
concluded that the maximum column usage for the extraction of matrix rich
samples such as river water should not exceed eight extractions but for samples
with lower natural organic matter content the column can be used a minimum of
ten times with no noteworthy problems. This makes the on-line SPE method
economically viable, as the extraction columns are similar in price to SPE
cartridges. The superior sensitivity levels also make the method more attractive.
4.3.7 Direct infusion mass spectrometry:
Prior to coupling the on-line SPE-LC method with MS detection an optimisation of
the ESI and ion trap focusing parameters was performed by directly infusing
solutions of each individual analyte prepared in 1:l MeOH 1 mM ammonium
formate pH 4.5 into the MS. These parameters were automatically fine tuned using
the Bruker esquire software, version 6.08, for stated mlz values. Analytes were
infused using both negative and positive ion polarity; that which provided the
highest intensity was selected for further study. Optimised parameters under both
polarities are presented in Table 4.7. An average of the optimised focusing
parameters under each ion polarity was then taken for use with the coupled SPE-
LC-UV method.
Table 4.7: Tuned ESI-MS method parameters, (optimisation was performed using a nebuliser pressure of 55 psi, dry gas flow of 8 ~ m i n - ' and a drying temperature of 300°C).
Parameter (+) ESI (-) ESI
Determined Value Determined Value
Caoillarv Voltaae (V) -4500.00 4500.00
- . . . . . . . . . Skim 2 (V) 6.20 -6.50
Octopole (V) 2.50 -1.80 Octopole A (V) 2.10 -2.00
Octo p ole RF ( V pp) 138.50 -1 75.00

Trap Drive 34.10 35.20 Lens 1 (V) -2.60 2.30
Simple spectra were recorded in most instances, under positive ion polarity
the majority of analytes exhibited a [M+H]' pseudomolecular ion, e.g.
carbamazepine, ketoprofen, bezafibrate, naproxen and fluoxetine while for
clotrimazole no significant pseudomolecular ion response was observed. The
predominant ion for clotrimazole was recorded at mlz 277.0 suggesting the loss of
the imidazole moiety from the molecule. Ibuprofen also exhibited no
pseudomolecular ion response, the most intense signal being present at mlz 251 .I
suggesting the formation of a formic acid adduct of ibuprofen [M+HCOOH]'. The
monitoring of ketoprofen, bezafibrate and naproxen using positive ion conditions is
also unusual, these compounds are acidic in nature and have more usually been
reported under (-)ESI conditions and under the mobile phase conditions used
these analytes are expected to be partly deprotonated (pK, values of 4.45, 3.6 and
4.2 respectively [24]), thereby the formation of positive pseudomolecular ions
seems strange. The intensity of the pseudomolecular ions was higher in (+)ESI
than when the same standard was infused under (-)ESI and therefore (+)ESI was
chosen for further study. Under negative ion polarity again all analytes exhibited a
pseudomolecular [M-HI- ion with the exception of flurbiprofen whose most intense
signal corresponded to the decarboxylation of the molecule, [M-COOHI-. For
diclofenac and indomethacin the [M-COOHI- ion was significantly more intense
than the [M-HI- ion and was therefore more suitable for extracted ion
chromatogram (EIC) generation. Gemfibrozil was produced two distinct ions
corresponding to a [M-HI- molecular ion at mlz 249.1 and a [M-C7HI2O2]- ion at mlz
121 .I with the latter displaying higher intensity and therefore being chosen as more
suitable for EIC generation. Both Triclosan and ivermectin exhibited no response
when infused under both negative and positive ion polarity as these analytes are
neutral and nonpolar. Previous reports of ivermectin analysis by LC-MS have
focused upon the use APCl [46] which is more suitable for the determination of
higher molecular weight non-polar organics. Triclosan has been determined using
negative ion ESI-MS but requires the use of high pH mobile phases, (> pH 7.5) for
significant ion formation [47,48].
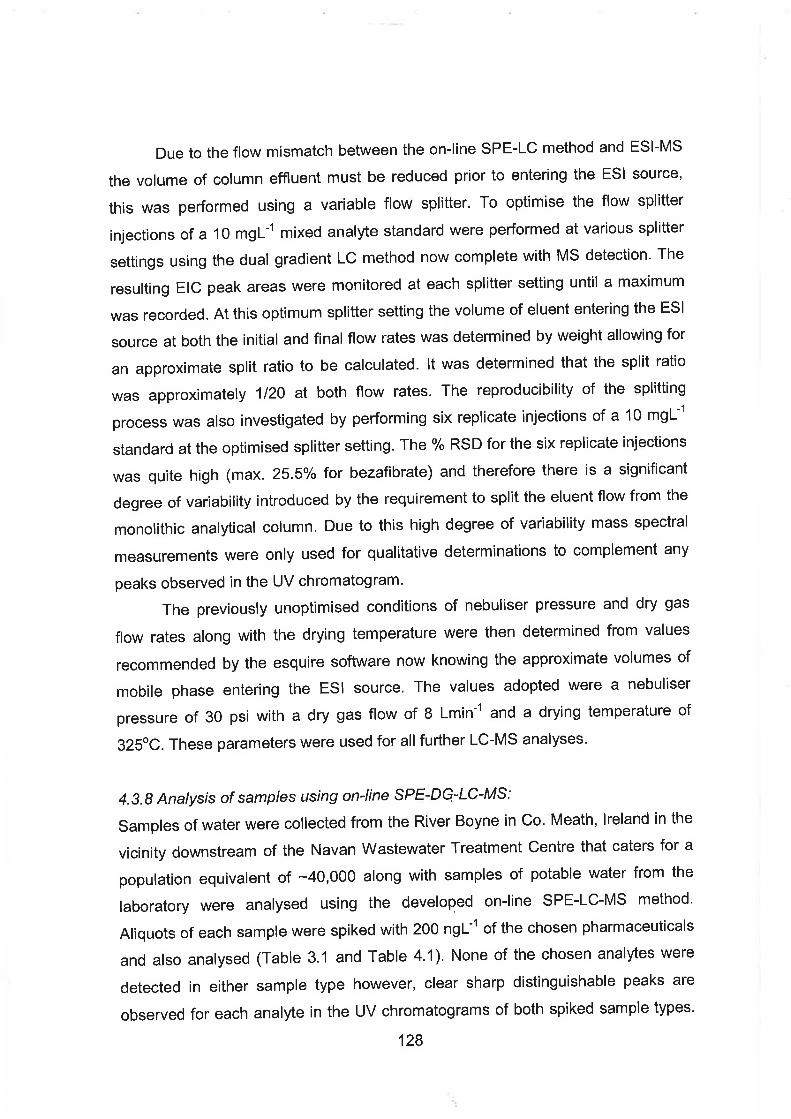
Due to the flow mismatch between the on-line SPE-LC method and ESI-MS
the volume of column effluent must be reduced prior to entering the ESI source,
this was performed using a variable flow splitter. To optimise the flow splitter
injections of a 10 mgLml mixed analyte standard were performed at various splitter
settings using the dual gradient LC method now complete with MS detection. The
resulting EIC peak areas were monitored at each splitter setting until a maximum
was recorded. At this optimum splitter setting the volume of eluent entering the ESI
source at both the initial and final flow rates was determined by weight allowing for
an approximate split ratio to be calculated. It was determined that the split ratio
was approximately 1120 at both flow rates. The reproducibility of the splitting
process was also investigated by performing six replicate injections of a 10 m g ~ - '
standard at the optimised splitter setting. The % RSD for the six replicate injections
was quite high (max. 25.5% for bezafibrate) and therefore there is a significant
degree of variability introduced by the requirement to split the eluent flow from the
monolithic analytical column. Due to this high degree of variability mass spectral
measurements were only used for qualitative determinations to complement any
peaks observed in the UV chromatogram.
The previously unoptimised conditions of nebuliser pressure and dry gas
flow rates along with the drying temperature were then determined from values
recommended by the esquire software now knowing the approximate volumes of
mobile phase entering the ESI source. The values adopted were a nebuliser
pressure of 30 psi with a dry gas flow of 8 ~min- I and a drying temperature of
32S°C. These parameters were used for all further LC-MS analyses.
4.3.8 Analysis of samples using on-line SPE-DG-LC-MS:
Samples of water were collected from the River Boyne in Co. Meath, Ireland in the
vicinity downstream of the Navan Wastewater Treatment Centre that caters for a
population equivalent of -40,000 along with samples of potable water from the
laboratory were analysed using the developed on-line SPE-LC-MS method.
Aliquots of each sample were spiked with 200 ngL-' of the chosen pharmaceuticals
and also analysed (Table 3.1 and Table 4.1). None of the chosen analytes were
detected in either sample type however, clear sharp distinguishable peaks are
observed for each analyte in the UV chromatograms of both spiked sample types.
128
Fig. 4.7 depicts the resulting UV traces for 200 n g ~ - ' spikes in both river and
potable water samples. The expanded region of the chromatogram illustrates the
sensitivity if the developed method and also shows the resolution of the spiked
pharmaceuticals from a number of unknown peaks present within the river water
and to a lesser extent the potable water sample. The excellent retention
reproducibility between the two sample types is also clear from the overlaid sample
chromatograms.
35 45 Time, (m ins)
Figure 4.7: Overlay chromatogram of 200 n g ~ - ' analyte spikes in river, (red trace) and potable water, (blue trace). Peak Identification: 1; ketoprofen, 2; bezafibrate, 3; nirnesulide, 4; naproxen, 5; fluoxetine, 6; warfarin, 7; flurbiprofen, 8; diclofenac, 9; indomethacin, 10; ibuprofen, 11; meclofenarnic acid, 12; mefenamic acid, 13; clotrimazole, 14; gemfibrozil, 15; Triclosan, 16; ivermectin. Separation conditions as per Table 3.1.
Fig. 4.8 depicts the total ion current chromatogram (TIC) and EIC traces for
blank and spiked river water. The excellent selectivity imparted by MS is clearly
visible with defined analyte peaks clearly visible even in regions of high matrix
interference in the EIC chromatograms. Both fluoxetine and warfarin can be
detected without matrix interference unlike with UV detection where the
identification of these analytes was obscured. The ability to obtain such clear mass

spectra in regions of simultaneous matrix elution illustrates the success of the
washing step that reduces this background to acceptable levels. The advantage of
the simultaneous use of UV and ESI-MS detection as shown in Figs. 4.7 and 4.8 in
overcoming problematic background interferences incurred during ultra trace
analyses is clear in this case.
4.4 Conclusions:
A highly sensitive and selective LC-MS method has been developed for the
determination of acidic, neutral and basic pharmaceuticals in complex
environmental samples using monolithic silica columns. The short monolithic
extraction column allows for the rapid extraction of rather large sample volumes
with acceptably high analyte recovery. The method was found to be repeatable and
detection limits were in the low n g ~ - ' range. In order to avoid excessive matrix
preconcentration and subsequent ESI signal a simple solvent wash step that could
easily be performed on-line was developed. It was found that such a procedure
effectively reduced the matrix signal by -90% therefore minimising the matrix effect
upon the ESI signal. Due to the necessity to split the column effluent prior to
entering the ESI interface the method is semi-quantitative using UV detection and
qualitative by MS. The method was successfully applied to environmental waters.

Ketoprofen a -
Bezafibrate 2.OE+06 *
30
Time, (mins)
Time, (mins) Figure 4.8: TIC and EIC traces of t i e r water spiked with 200ng~- ' using (A) positive and (B) negative ESI polarity. m/z Values: ketoprofen (255.0); bezafibrate (362.1); naproxen, (231.0); fluoxetine (310.0); ibuprofen (251 . I ) ; clotrirnazole (277.0); gernfibrozil (121 .I); rnefenarnic acid (240.0); rneclofenarnic acid (294.0); indornethacin (31 2.0); diclofenac (250.0); flurbiprofen (1 99.0); nirnesulide and warfarin both (307.0).
References:
1. C.G. Daughton & T.A. Ternes, Environmental Health Perspectives, 107, (1999), 907.
2. B. Halling-Sorenson, S. Nors Nielsen, P.F. Lanzky, F. Ingerslev, H.C. Holten Lutzhoft & S.E.
Jorgensen, Chemosphere, 36, (1998), 357.
3. T.A. Ternes, TrAC Trends in Analytical Chemistry, 20, (2001), 419.
4. T.A. Ternes, M. Bonerz, N. Herrmann, D. Loffler, E. Keller, B. Bago Lacida & A.C. Alder, Journal
of Chromatography A, 1067, (2005), 21 3.
5. B.J. Vanderford, R.A. Pearson, D.J. Rexing & S.A. Snyder, Analytical Chemistry, 75, (2003),
6265.
6. S. Yang, J. Cha & K. Carlson, Rapid Communications in Mass Spectrometry, 18, (2004), 21 3 1.
7. K. Inoue, M. Kawaguchi, F. Okada, Y. Yoshimura & H. Nakazawa, Analytical & Bioanalytical
Chemistry, 375, (2003), 527.
8. S. Rodriguez-Mozaz, M.J. Lopez de Alda & D. Barcelo, Analytical Chemistry, 76, (2004), 6998.
9. E. Koster & B. Ooms, LC-GC, December 2001, Column Watch, 2.
10. Z. Cheng, P. Pavelic, P. Dillon & R. Naidu, Water Research, 36, (2002), 4830.
11. J.V. Sancho, O.J. Pozo & F. Hernandez, Analyst, 129, 38.
12. H. Zeng, Y. Dend & J.T. Wu, Journal of Chromatography B, 788, (2003), 331.
13. H. Egle, R. Trittler & K. Kummerer, Rapid Communications in Mass Spectrometry, 18, (2004),
2871.
14. A. Motoyama, A. Suzuki, 0. Shirota & R. Namba, Rapid Communications in Mass
Spectrometry, 13, (1 999) 2204.
15. C.R. Mallet, Z. Lu, J. Mazzeo & U. Neue, Rapid Communications in Mass Spectrometry, 16,
(2002), 805.
16. S. Souverain, M. Mottaz, S. Cherkaoui & J.L. Veuthey, Analytical & Bioanalytical Chemistry,
377, (2003), 880.
17. Y.Q. Xia, D.Q. Liu & R. Bakhtiar, Chirality, 14, (2002), 742.
18. E. Pitarch, F. Hernandez, J. ten Hove, H. Meiring, W. Niesing, E. Dijkman, L. Stolker & E.
Hogendoorn, Journal of Chromatography A, 1031, (2004), 1.
19. Y. Alnouti, K. Srinivasan, D. Waddell, H. Bi, 0. Kavetskaia & A.I. Gusev, Journal of
Chromatography A, 1080, (2005), 99.
20. M.J. Lopez de Alda & D. Barcelo, Journal of Chromatography A. 911, (2001), 203.
21. Y.C. Barrett, B. Akinsanya, S.Y. Chang & 0. Vesterqvist, Journal of Chromatography B. 821,
(2005), 159.
22. K. Cabrera, Journal of Separation Science, 27, (2004), 843.
23. General Medical Services (Payments) Board report for year ending 31st December 2003,
available through www.gmspb.ie
24. J. Beausse, TrAC Trends in Analytical Chemistry, 23, (2004), 753.

25. VCCLAB: The virtual Computational Chemistry Laboratory, ALlogPs 2.1 LogP On-line
Calculation Software, viewed 24Ih October 2005, http:1/146.107.217.178/lablalogps/index.html.
26. RxList, The Internet Drug Index, viewed 21" October 2005, http:l/www.rxlist.coml.
27. Advanced Chemistry Development Laboratories, ACD/pK, DB vs. Experiment - A comparison of
predicted and experimental values, viewed 21 October 2005,
http:/lwww.acdslabs.com/products/phys~chem~lab/pka/exp.html~0231.
28. I.G. Dougal, D. Harper, D.M. Jackson & P. Leff, The British Journal of Pharmacology, 4, (1991),
1057.
29. W.K. Chiang, R.Y. Wang, 'Acetaminophen Toxicity' viewed 24th October 2005,
http://w.hypertension-consult.comlsecure/textbookarticles/textbookll2l~acetaminophen.htm.
30. Spectrum Laboratories, Chemical Fact Sheet CAS 58082, viewed 21St October 2005,
http://www.speclab.com/compound/c58082.htm
31. K.D. Rainsford, Rheumatology, 38, (1999), 4.
32. R. J. Julkunen, Journal of Pharmacy and Pharmacology, 6, (1 978),493.
33. Eli Lilly & Co. Material Safety Data Sheet, Olanzapine Fluoxetine Combination Capsules,
viewed 2 ls t October 2005,
http://www.ehs.lilly.com/msds/msds~olanzapine~fluoxetine~combination~capsules.html.
34. National Poisons Information Service Centre in the United Kingdom, Summary for UKPlD
Mefenamic acid, viewed 21St October 2005,
http://w.intox.org/databank/documentslpharm/mefena/ukpidO7.htm.
35. C. Tixier, H.P. Singer, S. Canonica & S.R. Muller, Environmental Science and Technology, 36,
(2002), 3482.
36. W. Ahrer, E. Scherwenk & W. Buchberger, Journal of Chromatography A, 910, (2001), 69.
37. Merck product literature, "General Chromolith Information and Applications" received with
columns, Janurary 2005.
38. V. Pichon, C. Cau Dit Coumes, L. Chen, S. Guenu & M.C. Hennion, Journal of Chromatography
A, 737, (1996), 25.
39. A. Deng, M. Himmelsbach, Q.Z. Zhu, S. Frey, M. Sengl, W. Buchberger, R. Niessner & D.
Knopp, Environmental Science & Technology, 37, (2003), 3422.
40. M. Ibanez, Y. Pico & J. Manes, Journal of Chromatography A, 823, (1 998), 137.
41. P.A. Blackwell, H.C. Holten Lutzhoft, H.P. Ma, B. Halling-Sorenson, A.B.A. Boxall & P. Kay,
Journal of Chromatography A, 1045, (2004), 1 1 1.
42. P.A. Blackwell, H.C. Holten Lutzhoft, H.P. Ma, B. Halling-Sorenson, A.B.A. Boxall & P. Kay,
Talanta, 64, (2004), 1058.
43. C. Gonzalez-Barreiro, M. Lores, M.C. Casais & R. Cela, Journal of Chromatography A, 993,
(2003), 29.
44. M. Petrovic, M.D. Hernando, M.S. Diaz-Cruz & D. Barcelo, Journal of Chromatography A, 1067,
(2005), 1.

45. GAR. Boyd, S. Zhang & D.A. Grimrn, Water Research, 39, (2005), 668.
46. D . Loffler & T. A. Temes, Journal of Chromatography a, 102f, (2003), 1 33,
47. A. Aguera, A.R. Fernandez-Alba, L. Piedra, M, Mecuza & M.J. Gomez, Analytica Chimica Acta,
480, (20031, 193.
48. W. Hua, E.R. Bennett & R.J. Letcher, Environment International, 31, (2005), 621.

5.0 Column Switching Liquid Chromatography with
Atmospheric Pressure Chemical Ionisation Mass
Spectrometry for the Determination of Zinc Pyrithione
and its Fate in the Aquatic Environment.
5.1 Introduction:
5.7.1 Background information:
From January lSt 2008 the use of antifouling paints containing organotin biocides
will be completely banned in accordance with the International Marine Organisation
(IMO), Convention on the Control of Harmful Anti-fouling Systems [I]. In Europe,
from the same date, under Regulation 78212003, ships registered, operating under
the authority of, or entering the port of Member States will be legally required to
bear a certificate stating that they have no coating containing organotin compounds
or must possess a secondary coating which acts as a protective barrier to prevent
organotin compounds from leaching into the surrounding waters, [I]. As
replacements for organotin compounds a number of organic booster biocides have
appeared on the market. These organic booster biocides have attracted increased
analytical attention due to their inherent environmental toxicity and the ability of
some chemicals such as lrgarol 1051 and diuron to persist in the environment and
perhaps bioaccumulate [2].
However, one particular organic booster biocide; zinc pyrithione; (bis-(N-
oxopyridine-2-thionato) zinc(l1)) has received little attention due to the lack of
sufficient analytical methods for its determination. Originally synthesised by Shaw
et a/. in 1950 as a functional analogue of the antibiotic aspergillic acid the
pyrithione ligand was found to be considerably more potent against
Staphylococcus, Klebsiellia and Bacillus species than was aspergillic acid [3,4].
Pyrithione exists as a tautomeric pair, (see Fig. 5.1) and reacts with some transition
metal ions via both the sulphur and the oxygen atoms to form complexes with five
membered chelation rings [5].

Figure 5.1: The structures of the pyrithione ligand tautomeric pair; (A) 2-mercaptopyridine-N-oxide and (B) N-hydroxypyridine-2-thione, (C) the structure of zinc pyrithione (ZnPT) and (D) the structure copper pyrithione (CuPT).
The use of zinc pyrithione (ZnPT) as an organic booster biocide is a
relatively new concept, to date the majority of ZnPT produced has been used as
either the active ingredient in anti-dandruff shampoo or as an additive in cosmetics
and dermatitis treatments. In Sweden for example it was estimated that at least 10
tonnes of ZnPT were consumed in the anti-dandruff shampoo sold in 2003 while
only 2.4 tonnes of ZnPT were used as an organic booster biocide in marine anti-
fouling paints [6]. The permitted levels of ZnPT usage are a maximum of 4% wlw in
marine paints and a maximum of 1% wlw in anti-dandruff shampoo [7].
Pharmacologically ZnPT acts upon the cell membrane causing
depolarisation via inactivation of the primary proton pump and other membrane ion
channels due to the interaction of ZnPT with, and consequent disaggregation of,
the membrane phospholipid phosphatidyl ethanolamine [8,9,10]. Also Guthery et
a/. note that the dipole structure of the molecule creates pseudoquaternary
ammonium groups capable of providing another, mode of antimicrobial activity and
therefore due to the multimodal activity of ZnPT, microbial resistance is unlikely to
occur [8]. As a consequence the use of personal care products containing ZnPT
would be expected to increase.
5. I . 2 Environmental entry and fate ZnPT:
Two distinct routes into the aquatic environment exist for ZnPT that depend
principally upon the mode of usage. In the case of marine antifouling paints ZnPT
may leach directly from a painted ship surface into the surrounding water. The rate
of ZnPT leaching has been estimated by Turley et a/. to be 1-3 ~gcrn-~d- ' for long -2 -1 lasting paint formulations or 3-1 1 pgcm d for self-polishing paints [ I I ] . Using this
information further, Turley et a/. modelled a PEC of 0.04 p g ~ - ' for ZnPT. Based
upon the above leach rates, coated ship surfaces would be expected to act as
continuous diffuse sources of ZnPT and other booster biocides into the
environment. However, it was noted by Thomas et a/. that the rate of introduction of
booster biocides into the environment significantly increased during high pressure
cleaning of painted ship surfaces [12]. Such practices can account for a significant
proportion of the total quantity of biocide introduced into the surrounding water over
the course of the cleaning event, but could, however, be minimised by adopting
improved cleaning practices [12].
In two separate studies Thomas et a/. report that paint particles released
into the environment during high pressure cleaning operations may . . act as further
sources of booster biocides into the aquatic environment [13,14]. It was found that
booster biocides introduced to sediment in the form of paint particles persisted for a
longer period than those introduced as a result of direct leaching [13]. The paint
particle was also observed to release booster biocides during dissolution and
therefore, cause "hot spots" of biocide pollution in docks and marinas etc.
As stated previously in section 5.1 . I , the primary use of ZnPT is in anti-
dandruff shampoo and other personal care products and therefore, ZnPT and free
pyrithione may be introduced into the aquatic environment via municipal household
wastewater where such products are used. It would also be expected due to the
topical only administration and short contact times of such products that metabolic
conversion would not occur. Galvin et a/. estimate that based upon a rate of
production of 100-200L wastewater per person per day, possible resulting
concentrations of pyrithione being introduced into the aquatic environment are in
the region of 1 x M, (-0.32 P ~ L - ' ) and consequently household wastewater is a
significant source of pyrithione with possible pollution of receiving waters [ I 51.
Once introduced into the environment the question is posed as to the fate of
ZnPT, ideally it should readily degrade and therefore, pose minimal risk to aquatic
biota. Reports concerning the environmental fate of ZnPT are mixed, however, a
general consensus exists within the published literature that photochemical
attenuation is by far the most important removal process for ZnPT and other
137
pyrithiones. Maraldo and Dahllof examined the photolytic behaviour of both ZnPT
and CuPT in seawater [I61 and reported that the photolytic half-lives for the
aforementioned complexes were -8.3 and -7.1 minutes respectively. A loss in the
toxicity of the two complexes to the test bacterial species was also noted upon
exposure of sample solutions to light. Biotic degradation was also examined during
the study but it was noted that compared to photochemical attenuation biotic
degradation was an insignificant process for the removal of the pyrithione
complexes [16]. Maraldo and Dahllof concluded that wavelengths in the region of
320-355 nm were the most efficient in the removal of the pyrithione complexes.
However, in environmental systems the dept of penetration of such wavelengths,
i.e. the turbidity of the water, and also the photon flux will be the limiting factors
governing the overall removal of the pyrithione complexes from the water column,
[16]. Turley et a/. also examined the photochemical behaviour of ZnPT and CuPT
in the environment [17]. It was determined that the pyrithione complexes rapidly
degraded upon exposure to light accompanied with a resultant loss in toxicity. The
photochemical products of both ZnPT and CuPT were identified as 2-pyridine
sulphonic acid and C02. Based upon available toxicity data for 2-pyridine sulphonic
acid it was concluded that little environmental risk was posed by the photoproducts,
(no observed effect concentration (NOEC) for 2-pyridine sulphonic was 5460 M g ~ - ' )
[171.
Pyrithione released into the aquatic environment in . either - a free or
complexed form would be expected to interact with endogenous metal ions. Galvin
hypothesised that free pyrithione introduced into surface water might accumulate
as the manganese (11) complex (MnPT) [15], however, it was previously reported
that pyrithione forms its most stable complex with Cu(ll) and therefore, all
pyrithione introduced into the aquatic environment may complex with or
transchelate to form CuPT, i.e. pyrithione complex formation follows Irving-Williams
behaviour [I 81. Formation constants for pyrithione metal complexes can be found
in Ref. [I 81.
With a reported Log KO, of 9.33 it would be expected that ZnPT would
accumulate in sediments due to very low aqueous solubility [19]. However studies
to determine the extent of the adsorption of ZnPT onto sediments are scarce. In
contrast to what would be expected, Turley et a/. proposed that free or complexed
138

pyrithione will not persist or accumulate in sediment due partly to rapid
photochemical attenuation in the water column but also through anaerobic
degradation of any pyrithione adsorbed to the sediment via reduction of the N-
oxide group [ I I ] . It was also proposed that the reason for sediment detoxification of
pyrithione was due to either a high microbial population within the sediment or
sediment surface catalysed degradation [ I I ] . Similarly Galvin et a/. hypothesised
that pyrithione might associate with suspended natural organic matter (NOM) within
the water column [15]. It was thought the carbonaceous NOM surface may play a
part in the adsorptive oxidative detoxification of pyrithione and that such a process
might be important in waters where photochemical attenuation did not efficiently
occur [ I 51.
5.1.3 Toxicity of ZnPT:
Although mentioned previously that ZnPT introduced into the aquatic environment
is expected to be rapidly degraded, concern still exists due to the inherent toxicity
of ZnPT. As was the case with its environmental fate, published reports concerning
the toxicity of ZnPT vary from declaring that the highest risk posed by ZnPT arises
solely from the Zn(ll) ion due to the photochemical instability of the pyrithione
ligand [20], to those that claim that ZnPT poses a more significant ecotoxicological
risk than organotin compounds [21]. However, a large proportion of published
toxicity studies have noted that ZnPT may adversely affect aquatic biota at
environmentally relevant concentrations. Most studies have focused upon
determining the toxicological risk posed to single species using laboratory based
tests. For example, Kobayashi and Okamura determined the effect of ZnPT and
CuPT upon the development of the sea urchin [21]. It was discovered that the
NOEC levels for ZnPT and CuPT were O.0,l f g ~ " and 1 p g ~ - I respectively
compared with tributyl tin oxide that was found to exhibit a NOEC level of 10 n g ~ - '
[21], with significant teratogenic effects noted upon fish larvae at levels of 5 pg~- ' .
Teratogenic effects were also reported in sea urchin and mussel by Bellas et a/. at
similar concentrations [22]. Goka determined the effect of ZnPT using commercial
anti-dandruff shampoo samples upon the development of fish species [23]. It was
found that exposure to ZnPT resulted in embryotoxic and teratogenic
abnormalities, namely curved vertebral columns. The author also concluded that
139

fish exposed to domestic wastewater containing ZnPT from anti-dandruff shampoo
were highly at risk [23]. Other studies conducted also found ZnPT and CuPT to be
the most toxic of all compounds currently in use as booster biocides in marine
paints [24,25]. A field study was also performed by Sanchez-Bayo and Goka to
determine the effect of ZnPT on Japanese medaka fish in an experimental rice
field, unlike the previous laboratory tests chronic teratogenic effects were not
observed, presumably due to loss of ZnPT to the environment, prompting the
authors to believe that the actual risk posed by ZnPT may be overestimated by
laboratory based studies [ I 91.
The effect of ZnPT and CuPT upon the bacterial community of sediment
was examined by Groth Petersen et al. who noted that in particular nitrogen cycling
was effected with an increase in nitrification and a decrease in denitrification [26]. It
was thought that the changes in the nitrate flux occurred due to the effect of ZnPT
on nitrifying bacteria, which are mostly Gram negative species and are more
susceptible to the membrane activity of pyrithione [26]. Other endpoints
investigated included a phosphate flux, which was observed to increase upon
exposure to ZnPT and also DNA content that was also observed to increase. The
reason for the increase of both endpoints was thought to be due to death and
degradation of cells as a result of pyrithione exposure [26].
Structural activity relationship (SARs) testing was also investigated by
Doose et a/. [27], who examined the toxicological effects of ZnPT and a number of
structural analogues to rat leukemic cells. It was discovered that analogues
containing the N-hydroxythioamide group exhibited similar toxicity to ZnPT and
therefore, it was noted that deactivation of this functionality was necessary to
ensure the toxicity threat was fully removed [27]. Based upon the results of the
SARs study it was decided that the environmental fate and effects of ZnPT, CuPT,
iron (Ill) pyrithione (FePT) and a decomposition product bis-(2-pyridiny1)-
disulfide,l ,I1-dioxide (PT2) should also be investigated prior to the recommendation
of ZnPT as a safer and greener option to organotins [27].
5.1.4 Analytical methods for the determination of ZnPT:
In many of the aforementioned studies a concluding remark noting the absence of
suitable analytical methods for the determination of ZnPT in both cosmetic and
140

environmental matrices has been made and indeed analytical procedures in the
published literature are few and far between. Chromatographic techniques for
pyrithione and ZnPT determination are not commonplace due to problems that will
be discussed here. Instead, researchers have focused upon the use of
electrochemical techniques such as polarography, voltammetry and amperometry.
However, such methods are unsuitable for the determination of ZnPT in
environmental samples due to the lack of analytical sensitivity and also problems
with electrode fouling [28,29,30,31,32].
Difficulties have been reported concerning the chromatographic analysis of
pyrithione complexes due to problematic unwanted interactions with the silica
stationary phase. The majority of researchers have reported that ZnPT readily
transchelates with metallic impurities present in the silica stationary phase such as
~ e * " ~ ' leading to severe peak tailing or adsorption of the pyrithione complex on to
the silica stationary phase [33]. The effect of silanol activity on the chromatography
of pyrithione complexes has, however, been overlooked and would be expected to
be of high significance due to the presence of the pyridyl moieties of the ligand.
Attempts to avoid such unwanted interactions have focused upon the derivatisation
of ZnPT with fluorescent reagents such as 5-dimethylaminonaphthalene-l-
sulphonylaziridine (DNS-A) or 7-Chloro-4-nitrobenzo-2-oxa-I ,3-diazole (NBD-CI),
which apparently stabilise the pyrithione complex and aid with detection [34]. More
commonly ZnPT is converted to the more stable CuPT by the addition of Cu(l1) that
thereby facilitates easier chromatography [33,35]. Due to the higher formation
constant for CuPT it is expected that the transchelation of ZnPT to CuPT should be
rapid and efficient [18]. Other problems noted with the chromatographic analysis of
pyrithione complexes have included the oxidation of pyrithione by the silica
stationary phase yielding PT2 over the course of the chromatographic run [36].
To date only one method has appeared in the literature with the desired
levels sensitivity for the determination of ZnPT in the aquatic environment. Using
LC-APCI-MS Thomas determined the levels of ZnPT in marinas in the southern
United Kingdom [37]. However, in all instances no ZnPT was detected above the
limit of detection (20 ng~") . Sample preparation was performed using copper
chelation LLE to extract any ZnPT present as CuPT thereby facilitating more
efficient chromatography. Recently another method based upon LC-APCI-MS has
141

appeared that claims to allow for the direct analysis of ZnPT using a phenyl
stationary phase [38]. However, the method is limited to concentrations in the
range of 3.5-10 m g ~ - ' and therefore is not directly applicable to the determination
of ZnPT in the environment.
This research therefore aims to do the following:
The development of a suitably sensitive validated analytical method using LC-
APCI-MS for the determination of ZnPT in the environment.
lnvestigate cleaner preconcentration chemistries based upon SPE for the
trace enrichment of ZnPT prior to LC-APCI-MS analysis and,
lnvestigate the fate of ZnPT when exposed to common environmental
constituents.
5.2 Experimental:
5.2. I Chemicals and reagents:
Chemicals and reagents unless otherwise state were as per section 3.2.2. Zinc
pyrithione (95%) was received from Sigma-Aldrich, (Steinheim, Germany) as was
copper sulphate pentahydrate (99%), copper (11) acetate (98%), 2,6-pyridine
dicarboxylic acid (99%), sodium chloride (ACS reagent grade), formic acid (95-
97%), ammonium formate (99.995%), ammonium acetate (99%), disodium
hydrogen phosphate (99%), MES (98%), pyridine (99%) and phenol (ACS reagent
grade). Ferric nitrate nonahydrate, hydrochloric acid, nitric acid, sulphuric acid,
glacial acetic acid and ammonia solution (33%) all AnalaR grade were received
from BDH Chemicals Ltd. (Poole, UK). Copper (11) nitrate trihydrate and anhydrous
sodium sulphate were both received from Riedel de Haen, (Seelze, Germany).
Potassium nitrate was purchased from Merck KGaA, (Darmstadt, Germany).
Stock 1000 m g ~ - ' solutions of ZnPT were prepared in dichloromethane and
stored in the refrigerator in darkness. These stock standards were replaced
monthly. Buffer solutions used for the optimisation of the extraction pH were
prepared by mixing the appropriate amounts of acid and its-conjugate base for
formate and acetate respectively. In the case of MES weighted proportions of salt
were dissolved in -900mL Milli-Q water and titrated to the desired pH using either
1 M HCI or I M NaOH.
5.2.2 LC-A PC/-MS analysis:
LC instrumentation unless otherwise stated was as per section 3.2.5 for method
development and section 4.2.5 for LC-MS analyses. The LC system was coupled
to a Bruker Daltonics esquireLC ion trap mass spectrometer complete with an
atmospheric pressure chemical ionisation source. For APCl optimisation, solutions
of analyte in dichloromethane were infused using a Cole Parmer 74900 series
syringe pump at a rate of 600 p~h - ' , (Cole Parmer, Vernon Hills, IL, USA) into a
flow of MeOH at a rate of 190 p~min- I from the LC pump through a mixing tee and
then into the APCl source. Gradient separations were performed on a Merck
Chromolith Performance RP18e; 100.0 x 4.6 mm i.d. monolithic silica column,
(Merck KGaA, Darmstadt, Germany) with a mobile phase of MeOH and 10 mM
ammonium acetate. Quantitation was performed upon the extracted ion
chromatogram (EIC) mlz 316.0 traces while the ratio of EIC rnlz 316.0 to EIC mlz
31 8.0, (-1 00:45) was used for qualitative confirmation.
5.2.3 On-line SPE:
On-line SPE was performed as previously described in section 4.2.4. Extraction
columns investigated included a 10.0 x 4.6 mm i.d. column packed with
imminodiacetic acid; (IDA) functionalised silica, (Nucleosil 7pm, pore size 100A,
prepared and packed by Prof. Pavel N. Nesterenko) and a Phenomenex Onyx CI8
guard cartridge; 10.0 x 4.6 mm i.d. monolithic silica, (Phenomenex, Macclesfield,
UK). The experimental set-up was previously described in Fig. 4.1. A Merck Hitachi
LaChrom L-7100 isocratic pump was used for sample delivery at flow rates of
either 6 m~min- ' for the IDA column or 10 m~min- ' for the Cq8 monolithic column.
Prior to use the IDA column was washed with 200 mM HN03 to remove any
retained metallic impurities followed by conditioning with 10 mM ammonium
acetate 1 acetic acid buffer pH 4.7 to promote dissociation of the acidic
functionalities. Depending on the desired choice of extraction chemistry the IDA
column was used directly after buffering or was modified with a solution of 20 mM
cu2' to facilitate the use of immobilised metal affinity interaction. The C18
143
monolithic column was conditioned with 20 mL MeCN and 20 mL of water
respectively prior to use. From initial investigations only the C18 monolithic column
demonstrated any applicability and was therefore, used for all further study.
Environmental samples were filtered through Whatman GFIC glass fibre filters to
remove particulate matter and adjusted to pH 7.0 prior to extraction. A 200 mL
portion of sample was extracted using the c-18 monolithic column and elution was
performed using mobile phase back flushing onto the analytical monolithic column.
Methods for the removal of matrix interference will be discussed later.
5.3 Results & Discussion:
5.3. I Liquid chromatography:
Central to the development of a chromatographic method for the determination of
ZnPT was the correct selection of the analytical column. As previously mentionedin
section 5.1.4, is was necessary to identify a stationary phase that was essentially
free from metallic impurities and also exhibited very low silanol activity. Of these
two parameters the activity of residual silanol groups was deemed to be the more
critical as metallic contamination could either removed by washing or suppressed
by the addition of additives to the mobile phase. In order to assess the silanol
activity of possible analytical columns a pyridine phenol test was performed
according to Ref. [39]. Ideally, pyridine should elute from the column before phenol,
symmetrically with minimal tailing. Active silanols cause excessive retention and
tailing of the pyridine peak. Co-elution of pyridine and phenol, although undesirable
indicates an acceptable level of silanol activity [39]. Fig. 5.2 displays the resulting
traces for the pyridine phenol test performed upon a Chromolith Performance
RP18e 100.0 x 4.6 mm monolithic silica column, a Waters Symmetry 50.0 x 2.1,
3.5 pm ODs column, a Hypersil ODs 50.0 x 2.1, 3 pm column and a Hypersil BDS
250.0 x 3.0 mm, 5 pm column.
As can be seen from Fig. 5.2 the Chromolith Performance RP18e monolithic
column out performs all the particle packed columns with a narrow co-eluting peak
observed for pyridine and phenol. Of the particle packed columns the Waters
Symmetry column appears to be the most inert, again a single peak was observed
for pyridine and phenol with more tailing present when compared with the

monolithic column. The effect of uncapped silanol groups is clearly depicted in the
trace of the Hypersil ODs column whereby an extremely broad peak can be
observed for pyridine. A similar observation was noted for the Hypersil BDS
column, which surprisingly showed quite high silanol activity considering the
column is marketed for the separation of basic analytes. Due to these results the
monolithic column and the Waters Symmetry column were selected for further
study.
Chromolith Performance RPl&
Hypersil ODS
-Waters Symnetry
Hypersil BDS
4 6 Time, (mins)
Figure 5.2: Overlaid pyridine phenol test chromatograms to examine the silanol activity of perspective analytical columns. Test conditions: mobile phase 50% MeCN in water with UV detection at 254 nm, column temperature 40°c, concenlrations; 0.5 C t ~ m ~ - l pyridine and 4 mgrn~-' phenol. Peak Identification: 1 Phenol, 2, Pyridine.
Initial gradient method development was performed using the Waters
Symmetry column but metallic contamination within the silica substrate was
encountered. Fig. 5.3 demonstrates the effect of metallic impurities within the silica
substrate upon the ZnPT peak, i.e. the ZnPT peak is diminished in size and is
fronted. Metallic contamination was removed by washing the stationary phase with
a selective chelating agent, in this case a solution of 10 mM 2,6-pyridine
dicarboxylic acid (dipicolinic acid) pH 4.0 as was used as previously by Elefterov et
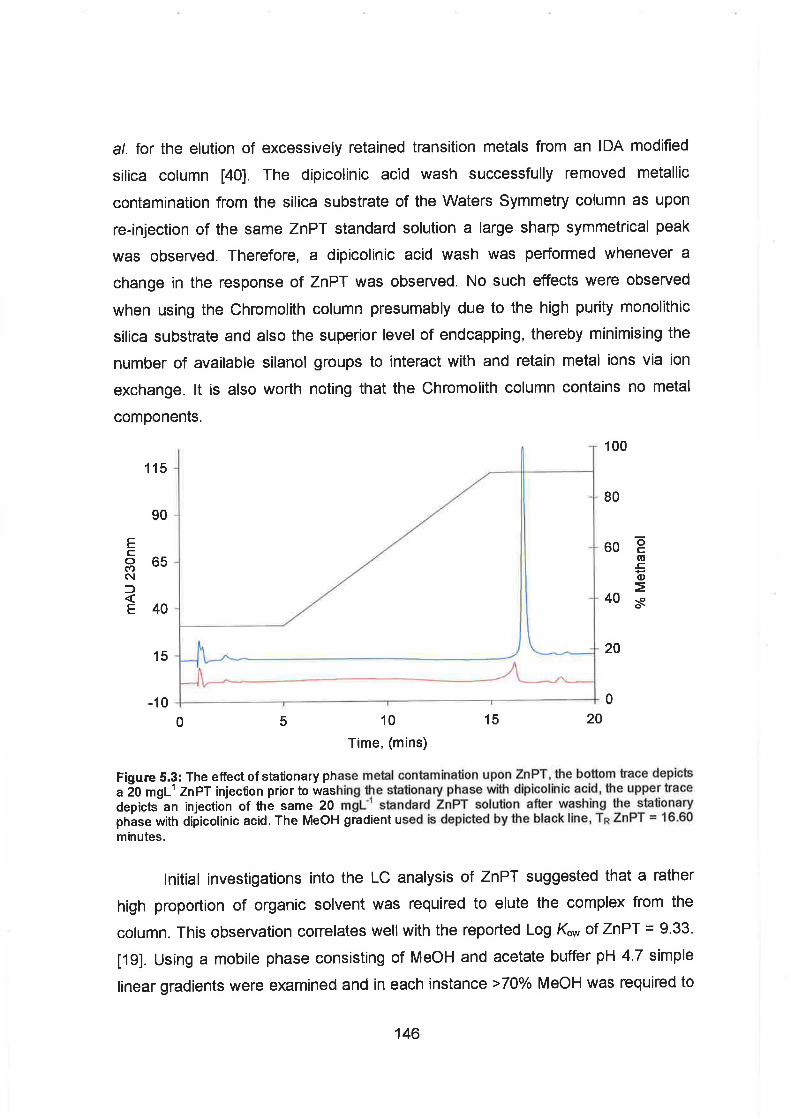
a/. for the elution of excessively retained transition metals from an IDA modified
silica column [40]. The dipicolinic acid wash successfully removed metallic
contamination from the silica substrate of the Waters Symmetry column as upon
re-injection of the same ZnPT standard solution a large sharp symmetrical peak
was observed. Therefore, a dipicolinic acid wash was performed whenever a
change in the response of ZnPT was observed. No such effects were observed
when using the Chromolith column presumably due to the high purity monolithic
silica substrate and also the superior level of endcapping, thereby minimising the
number of available silanol groups to interact with and retain metal ions via ion
exchange. It is also worth noting that the Chromolith column contains no metal
components.
10
Time, (mins)
Figure 5.3: The effect of stationary phase metal conhrnlnation upon ZnPT, the bottom trace depiGts a 20 m g ~ ' ZnPT injection prior to washing the st&tionary phase wifh dlpicolinic acid, he upper trace depicts an injection of the same 20 mg~" standard ZnPT solution after washing the stationary phase with dipicolinic acid. The MeOH gradient used b depicted by the black line, TR ZnPT = 16.60 minutes.
Initial investigations into the LC analysis of ZnPT suggested that a rather
high proportion of organic solvent was required to elute the complex from the
column. This observation correlates well with the reported Log Kw of ZnPT = 9.33.
[19]. Using a mobile phase consisting of MeOH and acetate buffer pH 4.7 simple
linear gradients were examined and in each instance >70% MeOH was required to

elute the ZnPT peak. Of the gradients examined a rapid linear sweep changing
from 30% MeOH to 90% MeOH in one minute was initially chosen as it produced a
sharp ZnPT peak with a retention time of approximately 8.3 minutes. However, it
was later found when using MS detection that the rapid linear gradient was a
significant source of ion suppression as the sharp increase in MeOH caused a
focusing effect of retained matrix components and therefore, a shallower multi-step
gradient was developed as shown in Fig. 5.4.
6 8
Time, (mins)
Figure 5.4: A 5 m g ~ " injection of ZnPT on the Chromolith Performance RP18e monolithic column using the multi-step gradient, TR ZnPT = 9.2 minutes.
From the above figure it can be seen that the multi-step gradient still allows
for the relatively rapid determination of ZnPT with a sharp peak observed at
approximately 9.2 minutes. However, when the LC method was later used in
conjunction with APCI-MS detection it was observed that the acetate buffer MeOH
mobile phase on the monolithic column yielded a peak that was slightly fronted as
shown in Fig. 5.5. The reason for the fronting was unclear. However, upon
changing the acetate buffer to a solution of ammonium acetate the fronting was
completely removed, most probably due to an increase in the conditional stability
constant of the complex with the increased pH of the aqueous modifier of the
mobile phase, i.e. pH 6.5 as compared to pH 4.7 when using the ammonium

acetate / acetic acid buffer. Therefore, the optimised LC conditions used for the
determination of ZnPT in environmental samples were a mobile phase of MeOH
and 10 mM ammonium acetate with a step-wise gradient on the Chromolith
Performance monolithic column.
6 8
Time, (mins)
Figure 5.5: 5 m g ~ - ' ZnPT standard injections using LC-APCI-MS on the Chromolith Performance RP18e monolithic column. The blue bace was recorded using a mobile phase of MeOH and 10 mM ammonium acetate 1 acetic acid buffer pH 4.7, the red trace was recorded using 10 mM ammonium acetate pH 6.5. The calculated USP asymmetry value for the red trace was 0.95.
5.3.2 APCI-MS study of transition metal pyrithione complexes:
In order to determine the optimum ionisation and ion focusing parameters a
solution of 1000 m g ~ " ZnPT in dichloromethane was split 1/20 with MeOH from the
LC pump and infused into the mass spectrometer. These parameters were
automatically fine tuned using the Bruker esquire software for the ZnPT
pseudomolecular ion; m/z 317.0. The ZnPT solution was infused using both ESI
and APCl in both positive and negative modes, however, ZnPT gave no ESI
response with either positive or negative ion polarity, only positive polarity APCl
gave an appreciable signal. The optimised ion focusing parameters are listed in
Table 5.1.

Table 5.1: Optimised ion focusing APCI-MS parameters for ZnPT, (the optimisation was performed using a nebuliser pressure of 50.0 psi, a dry gas flow of 10.0 Llmin, a drying temperature of 32S°C, a corona voltage of +3200 V and an APCl temperature of 500°C).
Parameter Measured Value
Capillary Voltage (V) -4500.00 End Plate Offset 01) -684 .OO
Capillary Exit Offset (V) 50.00 Skim 1 (V) 1 5.00 Skim 2 (V) 5.90
Octopole (V) 2.64 Octopole A (V) 1.48
Octopole RF (Vpp) 201.60 Trap Drive 40.30 Lens 1 (V) -2.90 Lens 2 (V) -49.50
The resultant APCI-MS spectrum for ZnPT is depicted in Fig. 5.6, which depicts
two significant ions, the pseudomolecular [M+H]' ion at mlz 317.0 and another ion
at m/z 221.2.
Figure 5.6: APCI-MS spectrum of ZnPT showing the [M+H]+ pseudomolecular ion at mlz 317.0 and a decomposition product ion at mlz 221 .l. lnset A shows the expanded isotopic pattern of the pseudomolecular ion and lnset B depicts the thecretical isotopic pattern as calculated by the Sheffield Chemputer re-plotted using Microsoft Excel [41].

The expanded isotopic pattern for the pseudomolecular ion at mlz 317.0 is
inserted as Insert A in Fig. 5.6 and clearly shows the isotope pattern of elemental
zinc with [M+H]', [M+H+2]' and [M+H+4]' ions in the approximate ratio of
100:60:40, it can also be seen that the recorded experimental spectrum correlates
well with the expected theoretical spectrum as calculated using the University of
Sheffield on-line Chemputer [41], which again shows an isotope pattern
characteristic of the central zinc atom. The ion at mlz 221.2 was also observed by
Thomas [37] although no definitive molecular structure was assigned. In an attempt
to elucidate the identity of the species at mlz 221.2 tandem mass spectrometry was
performed that yielded MSIMS daughter ions at mlz 11 1.2 and rnlz 187.1, with the
ion at rnlz 111.2 being significantly more intense. Upon studying the isotope
patterns for all the ions it was concluded that the complex at rnlz 221.2 did not
contain a metallic element and the daughter ion at rnlz 11 1.2 suggests that the
molecule fragments by splitting in half. From a literature search for possible
decomposition products of pyrithione it is proposed that the species at rnlz 221.2 is
pyridine disulfide and the daughter ion at mlz 221.2 arises from a-cleavage of the
disulfide bond as shown in Fig. 5.7.
Figure 5.7: Proposed structure of the ion at mlz 221.2 and the MSIMS daughter ion at m h 11 1.2.
Other metal pyrithione complexes were prepared by LLE of ZnPT with
solutions of CU*', ~ e ~ ' and ~ n ~ * and dichloromethane, the APCI-MS spectra of the
formed complexes, of which CuPT (golden) and FePT (violet) were strongly
coloured, were then recorded in a similar manner as described for ZnPT. Fig. 5.8
depicts the recorded spectrum of CuPT. Again as was observed for ZnPT, the only
significant ion present is the pseudomolecular CuPT [M+H]' ion at mlz 316.0, the
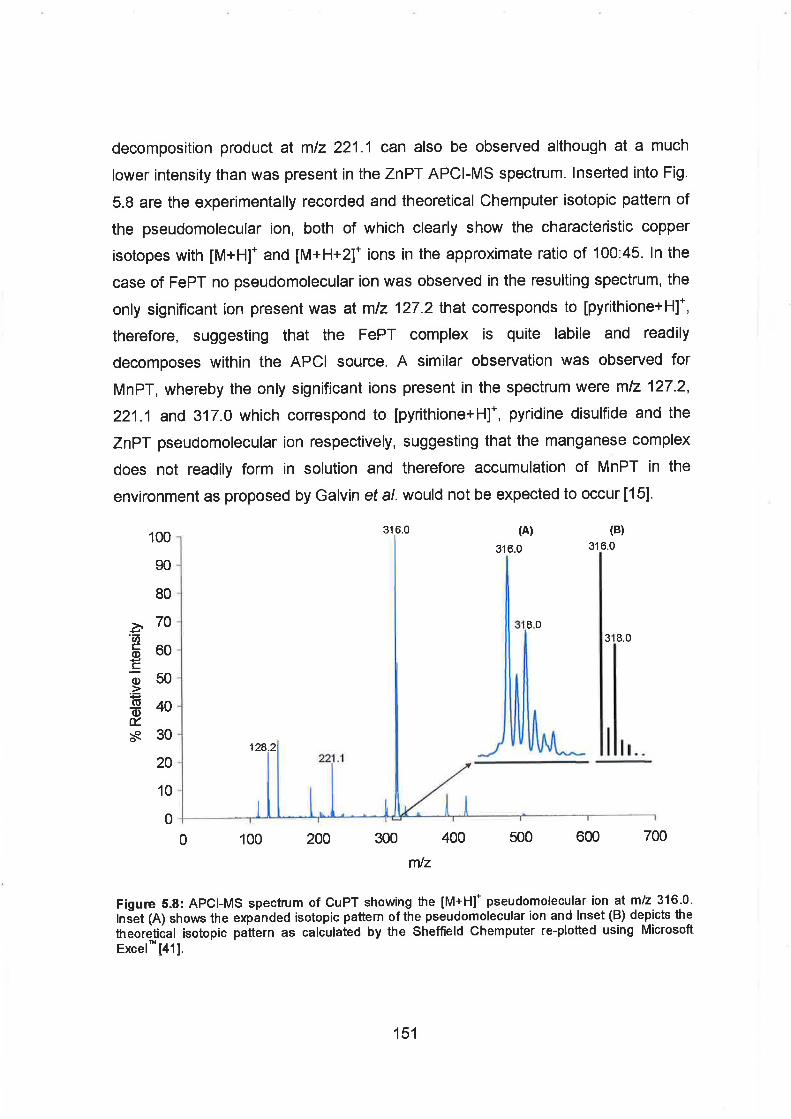
decomposition product at rnlz 221.1 can also be observed although at a much
lower intensity than was present in the ZnPT APCI-MS spectrum. Inserted into Fig.
5.8 are the experimentally recorded and theoretical Chemputer isotopic pattern of
the pseudomolecular ion, both of which clearly show the characteristic copper
isotopes with [M+H]' and [M+H+2]' ions in the approximate ratio of 100:45. In the
case of FePT no pseudomolecular ion was observed in the resulting spectrum, the
only significant ion present was at mlz 127.2 that corresponds to [pyrithione+H]',
therefore, suggesting that the FePT complex is quite labile and readily
decomposes within the APCl source. A similar observation was observed for
MnPT, whereby the only significant ions present in the spectrum were rnlz 127.2,
221.1 and 317.0 which correspond to [pyrithione+H]', pyridine disulfide and the
ZnPT pseudomolecular ion respectively, suggesting that the manganese complex
does not readily form in solution and therefore accumulation of MnPT in the
environment as proposed by Galvin et a/. would not be expected to occur [ I 51.
Figure 5.8: APCI-MS spectrum of CuPT showing the [M+H]' pseudornolecular ion at rnlz 316.0. lnset (A) shows the expanded isotopic pattern of the pseudomolecular ion and lnset (B) depicts the theorGical isotopic pattern as calculated by the Sheffield Chernputer re-plotted using Microsoft Excel [41].

Based upon the APCI-MS study it was concluded that only ZnPT and CuPT
were of relevance for further study due the lability or instability of the FePT and
MnPT complexes. It is worth noting that the CuPT and ZnPT pseudomolecular ions
only differ by one mass unit and also co-elute under the chosen LC conditions and
therefore, in an attempt to find exploitable differences between the complexes
MSIMS was performed. Under tandem conditions ZnPT yielded a daughter ion at
rnlz 192.0 that corresponds to the loss of a pyrithione ligand from the molecule and
an ion at rnlz 127.2, i.e. [pyrithione+H]+. Further tandem transitions of the ion at mlz
192.0 yielded another daughter ion at rnlz 174.0 suggesting dehydration of the
species at rnlz 192.0. CuPT did not yield any daughter ions of significant intensity
under MSIMS, therefore, suggesting the greater stability of CuPT, which correlates
well with previously reported data [18]. It was therefore concluded that tandem MS
was a viable option for distinguishing ZnPT and CuPT even with co-elution on a LC
column.
An optimisation of the APCl source ionisation parameters, i.e. applied
corona voltage and APCl reaction temperature was performed upon linking the LC
method with APCI-MS detection using repeat injections of a 5 m g ~ - ' solution of
ZnPT. The corona voltage was optimised in the region of +I000 V to +3400 V and
a sigmoidal relationship was observed between the resulting intensity and the
applied voltage, see Fig. 5.9 (A). Insignificant intensity was observed below +I000
V whilst above +3400 V excessive current was generated within the source. The
optimum applied voltage was deemed to be +2600 V above which point no
significant increase in intensity was recorded. Therefore, +2600V was used as the
optimum applied corona voltage for all subsequent analysis. The APCl temperature
was optimised in the range of 200 to 500°C using 25OC intervals, see Fig. 5.9 (B). A
linear increase in intensity with increasing APCl temperature was observed up to
-325OC followed by a linear decrease in intensity with further increases in the APCl
temperature, suggesting that at temperatures exceeding 325OC ZnPT may begin to
decompose. A temperature of 325OC was ad,opted as both the optimum APCl
reaction temperature and also the dry gas temperature set point in order to
maintain isothermal conditions within the source.

Applied corona voltage, (V)
O.OE+OO I 1 I I I
200 250 300 350 400 450 500
APCl Temperature, ( O C )
Figure 5.9: Optimisation of the APCl ionisation parameters, (A) corona voltage optimisation and (B) APCl temperature optimisation, inserted y-error bars are the standard deviation of the three replicate measurements.
5.3.3 Selection of the extraction chemistry:
As remarked previously, methods in the literature concerning the determination of
ZnPT in environmental samples are limited. The method of Thomas 1371 appears to
be the primary reference for those wishing to examine the presence of ZnPT.
However, the method uses large sample volumes and LLE for sample enrichment

with toxic dichloromethane. Little research has to date been focused upon the
development of preconcentration using SPE for the trace enrichment of ZnPT prior
to instrumental analysis. Extraction chemistries identified that may offer
applicability include immobilised metal affinity chromatography (IMAC), chelating
phases and reversed-phase interaction due to the presence of a central metal ion
within and the hydrophobicity of the pyrithione complex. IMAC and chelating
phases were identified as more selective sorbents, for example IMAC has recently
been used for the selective trace enrichment and characterisation of naturally
occurring complexing ligands of both copper and aluminium from soil and marine
water samples [42,43,44,45,46,47]. The original aim was therefore, to use copper
modified IDA functionalised silica for the IMAC extraction of ZnPT with
transchelation to the more stable CuPT occurring on the stationary phase as it was
hoped that such an extraction technique would be less prone to the co-extraction of
NOM matrix components as compared with reversed-phase sorbents. However,
initial extractions appeared to show retention of ZnPT but no elution of CuPT, even
when using abrasive conditions such as 200 mM H' and therefore, an investigation
was performed in order to determine the exact mechanism of the extraction.
The behaviour of ZnPT during its passage through the sample pump was
examined and it was found that at the low sampling flow initially used of 1 mlrninm1
only approximately 39% of the ZnPT present was actually introduced onto the
extraction column. Fig. 5.10 depicts an overlay of ElCs for the pseudomolecular
ZnPT ion (mlz 317.0) at various sampling points on the Merck sample pump.
Although not shown, EIC traces were also generated for the [pyrithione+H]' ion at
mlz 127.1 to see if the complex disintegrated but in each instance no peak was
observed. Therefore, the exact degradation mechanism of ZnPT within the sample
pump remains unclear. The experiment was repeated using CuPT and a similar
response was observed. In order to ascertain whether the contact time within the
pump had an affect upon the degradation of the pyrithione complexes the above
experiment was repeated using the max loading flow rates for both the IDA silica
column, i.e. 6 mlmin-I and the CI8 monolithic column, i.e. 10 m~min-I. It was
observed that in the case of ZnPT and CuPT when pumping at 6 mlmin-I that a
degree of degradation still occurred although it was considerably less than at 1
mlmin-' meaning that a proportion of analyte would be lost prior to extraction when
154

using the IDA silica column either modified with cu2' for IMAC or un-modified
allowing for pure chelation chemistries.
Purge valve exit - Pump exit
Switching valve exit - 5mglL ZnPT
6
Time, (mins)
Figure 5.10: Overlay of EIC mlz 317.0 traces showing the degradation of ZnPT upon its passage through the Merck sample pump at a flow rate of 6m~min-'.
In contrast, when pumping the pyrithione complexes through the sample
pump at 10 m~min-', i.e. the maximum flow rate of the Merck pump, an insignificant
amount of degradation was noticed for both ZnPT and CuPT, thereby suggesting
that the contact time within the sample pump is a critical parameter when
considering the degradation of both ZnPT and CuPT, however, in all instances
CuPT was observed to show a larger amount of degradation than ZnPT.
With the knowledge of the instability of the pyrithione complexes during
sample pumping simple qualitative retention experiments were performed in order
to evaluate which of the previously mentioned extraction chemistries showed the
most promise for use as a ZnPT trace enrichment procedure prior to LC-APCI-MS
analysis. In each instance 10 mL aliquots of 2 rng~-' solutions of ZnPT and CuPT
were extracted using previously conditioned IMAC, un-modified IDA and the C18
monolithic column and the loading effluents were tested for the presence of the
pyrithione complexes using LC-UV. Elution from both the IMAC and the un-
modified IDA was performed using 200 mM HN03, excess acid was neutralised

using concentrated ammonia solution, an excess of cu2+ was added and the
solution was then tested for the presence of CuPT. With the CI8 monolithic column
elution was performed using MeOH.
Using an IMAC interaction on the copper modified IDA silica column ZnPT
exhibited approximately 50% retention while CuPT exhibited a much higher degree
of retention, approximately 90%. It was expected that ZnPT would show a much
higher affinity for the immobilised cu2+ ion due to the higher formation constant of
the copper pyrithione complex compared to the zinc pyrithione complex thereby
suggesting fast mass transfer kinetics and it was also expected that it would be
more thermodynamically unfavourable to form CuPT on the IMAC surface from
CuPT in solution due to entropic effects. In the extracts of both pyrithione
complexes no reformed CuPT was determined suggesting that the acidic
conditions used did not elute the retained complex or formation of the copper
pyrithione complex did not occur even upon pH adjustment and the provision of an
excess of cu2+ ions.
Using the un-modified IDA silica column a similar trend was observed;
retention of both ZnPT and CuPT was noted, with more CuPT appearing to be
retained than compared with ZnPT. However, upon testing the extracts no CuPT
was present in either solution. The absence of CuPT in the tested extracts is again
attributed to the destruction of retained ZnPT and CuPT using concentrated acid to
elute the complexes from the IDA surface followed by no formation of CuPT upon
neutralisation and addition of cu2'.
Using the short CI8 monolithic column, when tested, the loading effluents for
both ZnPT and CuPT showed no presence of either complex while the MeOH
extracts demonstrated considerable peak magnification thereby suggesting that the
CI8 phase showed a considerable prospect for preconcentration and was hence
selected for further study. An additional bonus noted was the possibility of
performing on-line preconcentration using column switching as the elution
conditions tested in the preliminary experiments matched those of the analytical
mobile phase. On-line SPE attempts did provide positive promise with minimal
sample handling and therefore, this approach was pursued.

5.3.4 Optimisation of column switching LC extraction conditions:
In order to maximise the recovery of ZnPT from aqueous samples using the CI8
monolithic column, an optimisation of the extraction pH and the ionic strength of the
sample was performed. The sample pH was optimised in the working range of the
monolithic silica column, i.e. pH 2-7, by extracting solutions of 1 p g ~ - l ZnPT
prepared in either pH adjusted water or buffer solutions. The resulting percentage
recovery, calculated by peak area comparison with a 5 m g ~ - ' standard injection
was then plotted versus the extraction pH as can be seen in Fig. 5.1 1 (A). The plot
appears to show no definitive trend although the percentage recovery increases in
a somewhat linear fashion between pH 5 and pH 7. Given that the pKa of the
mercaptan group of the pyrithione ligand is -4.6 [36], low recovery of ZnPT would
be expected as observed at pH values less than the pKa, i.e. in this study pH 2-4,
due to protonation of the mercaptan group and a consequent reduction in the
overall stability of the ZnPT complex. The increase in the percentage recovery
observed in the region of pH 5-7 is therefore, attributed to an increase in the overall
stability of the pyrithione complex with increasing solution pH. Based upon Fig.
5.11 (A) the optimum extraction pH is clearly pH 7. Such an observation was
welcomed as most environmental waters are generally in the range of pH 7-8
meaning that minimal sample handling would be necessary and also previously
published reports suggested that the co-extraction of NOM containing acidic
functionalities on the CI8 monolithic column should be reduced.
Fig. 5.1 1 (B) depicts the effect of increasing the salt concentration of the
extraction solution upon the percentage recovery of ZnPT. It was observed that the
percentage recovery of ZnPT increased with increasing salt concentration due to a
salting out effect i.e. reduced solubility in a saline matrix. Such behaviour would be
expected due to the hydrophobicity of the pyrithione complex (Log KO, = 9.33 [19])
and its low solubility in aqueous solutions. From Fig. 5.1 1 (B) it can be seen that
the recovery of ZnPT is almost quantitative at salt concentrations greater than 1 M
NaCI, however, it must be noted that the above experiments were performed in
reagent water lacking an innate matrix and therefore, for environmental samples it
was proposed to adjust the salt concentration to 0.5 M NaCl for fresh water
samples with no adjustment speculated for marine samples.

40 0 0.2 0.4 0.6 0.8 I 1.2 1.4 1.6 1.8 2
[NaCI]
Figure 5.11: Optimisation of the C18 extraction parameters, (A) the sample pH and (B) the salt concentration. In each instance an increase in the % recovery is observed with increasing pH and [NaCI].
5.3.5 Matrix removal:
Primary on-line SPE investigations with real sample matrices yielded the problem
of excessive NOM extraction along with ZnPT and consequent APCI-MS ion
suppression. The co-extracted NOM was observed to elute from the analytical
column in the same region as the ZnPT peak with large intensity due to the
presence of a significant ion at each mlz value. As mentioned previously the LC
gradient and APCl ionisation parameters were altered in an attempt to minimise

APCl ion suppression. However, the natural matrix was still found to be
problematic. Therefore, the development of a matrix removal procedure was
deemed necessary.
As was performed in Section 4.3.4 a solvent wash step was developed due
to the ease at which such procedures can be performed on-line. As mentioned
previously the most exploitable parameter for the extraction of ZnPT is its
hydrophobicity with no secondary equilibria to be considered when extractions are
performed at pH neutral. Therefore, the retention of ZnPT and the percentage of
organic solvent required for elution from the C18 monolithic column were
investigated. It was found using a 1 pgL-' extracted solution that ZnPT was
retained upon the CI8 monolithic concentrator column for approximately 4.4
minutes and -45% MeOH was require for elution. Knowing the elution conditions
simple experiments to determine the wash solvent composition and the wash
duration were then carried out. Using isocratic conditions it was observed that
extracted ZnPT could be retained completely up to and including 40% MeOH in the
mobile phase with a linear increase to 90% required for complete elution, however,
when greater than 20% MeOH was used a peak was present at the start of the
extracted molecular ion chromatograms in addition to the ZnPT peak, which was
found to increase with increasing percentages of MeOH. Extracted solutions of 1
p g ~ - ' in reagent water were exposed to the wash solution for increasing periods of
time in order to evaluate the maximum wash duration without affecting the retention
of ZnPT. The maximum wash solvent exposure duration was found to be 20
minutes at a flow rate of 1 mlmin-I, with longer exposures the resulting ZnPT peak
was significantly diminished in intensity. The optimum wash conditions were
therefore, 20 mL of 20% MeOH in 80% 10 mM ammonium acetate. Due to the
bimodal pore structure and increased permeability of the CI8 monolithic column it
was however, possible to perform the wash procedure in 2 minutes using the
maximum pump flow rate of 10 mlmin-'.
The retention of NOM using a river water sample without the addition of 0.5
M NaCl was then examined upon exposure to the optimised wash solvent, (at a
flow rate of 1 mlmin-I) with the majority of the retained matrix observed to elute as
a large peak at the beginning of the chromatographic run within the first 3 minutes.
Therefore, it appeared that the solvent wash conditions were successful. However,
159
upon the addition of 0.5 M NaCl as previously optimised it was observed that even
with the wash procedure a significant proportion of NOM was extracted and
retained due to the increased ionic strength of the extraction solution and not
removed with washing. The presence of the salt was also found to cause problems
with the extraction pump such as increased backpressure generation etc. and
consequently is was decided not to add salt to sample solutions prior to extraction
in order to prevent damage to the sample pump.
In order to assess the applicability of the wash procedure a 1 p g ~ - ' ZnPT
spike in laboratory tap water was prepared, extracted and washed and the resulting
EIC mlz 316.0 trace is inserted following. It is clear from Fig. 5.12 that even with
the inclusion of the wash procedure a significant proportion of NOM is still retained
on the CI8 monolithic column and interfering with the LC-APCI-MS analysis of
ZnPT.
Possible solutions to the matrix interference problem identified in the
literature included increasing the extraction pH to promote dissociation of acidic
NOM functionalities 1481. However, the extraction was already being performed at
pH 7, i.e. near the upper stability limit for the silica monolith and therefore such a
solution was not viable. The addition of detergents or chemical reducing agents
such as NaBH4 to the extraction solution were also recommended but in the
interest of simplicity and to prevent unwanted reactions or foiling of the APCI
source such procedures were avoided [49,50].
A more feasible option identified in the literature appeared to be the use of a
sacrificial strong anion exchange sorbent (SAX) prior to the extraction column, i.e.
the Cq8 monolithic column, for the retention of NOM containing dissociated acidic
functionalities [51,52,53]. Due to the absence of an acidic functionality within the
ZnPT molecule it was decided that the use of a sacrificial SAX sorbent might be a
possibility due the ease of inclusion of a SAX pre-column prior to the CI8 monolithic
extraction column. Initial investigations were focused upon using a polymeric SAX
sorbent, (Alltech Sample Prep Anion Exchange) packed into a 50.0 x 4.0 mm
polymeric column housing. The backpressure generated by the dual column was
measured using reagent water at various flow rates in order to ascertain as to
whether the dual column could be safely used at the required loading flow of 10
mlmin-I. It was found that at 10 m~min-I the resulting backpressure was
160

acceptable at -110 bar. A 1 p g ~ - I ZnPT spike prepared in reagent water was
prepared and extracted through the dual SAX-CI8 column and elution was
performed through the CI8 monolithic column using mobile phase back flushing,
however no ZnPT was present in the resulting trace. It was expected that the ZnPT
present was retained upon the polystyrene substrate of the polymeric SAX particles
due to hydrophobic interaction. Also as the SAX sorbent was polymeric and
therefore unsuitable for use with organic solvents it was decided that the SAX
sorbent must be silica based (Si-SAX).
6 8
Time, (mins)
Figum 5.12: 1 v g ~ " ZnPT spike in laboratory tap water depicting the matrix interference even after the use of a solvent wash procedure.
The Si-SAX sohent used was Vydac 301SC anion exchange silica packed
into a 33.0 x 4.6 mm stainless steel column housing. As was the case with the
polymeric SAX the backpressure generated using reagent water at the required
sample loading rate and was found to be acceptable at -120 bar. Prior to usage
the Si-SAX column was conditioned with 0.2 M ammonium acetate and water. In
order to estimate the system suitability a 1 p g ~ - ' ZnPT solution prepared in reagent
water was extracted through the SiSAX-CI8 tandem column with elution via mobile
phase back flush performed through the Cls monolithic column only, the resulting
trace is shown in Fig. 5.13.

Tandem Elution Tandem Extraction
6 8 Time, (mins)
Figure 5.13: Overlay of EIC mlz 316 trace depicting the extraction of 1 p g ~ - l ZnPT using the Si- SAX-C18 tandem column.
The Si-SAX-C18 column was found to function effectively as can be seen
from Fig. 5.13, with a distinct peak clearly visible for ZnPT (the red trace).
Retention was evaluated and it was found that the CI8 monolithic column is solely
responsible for the retention of extracted ZnPT with only a negligible peak
observed when the Si-SAX column was eluted. The blue trace in Fig. 5.13 depicts
the resulting chromatogram when tandem extraction followed by elution through
the tandem column was performed, it can be seen that the ZnPT peak appears to
be slightly split upon passage through the tandem column. However, no such
splitting was observed when elution was performed only through the Cla monolithic
column. It is also worth noting that when elution through the tandem column was
performed the baseline of the resulting trace was considerably noisier that when
elution was performed through the Cla monolithic column only. It is suspected that
the reason for the increased level of baseline noise is due to the elution of loosely
bound NOM on the SiSAX sorbent with subsequent introduction onto the analytical
column. In order to avoid such affects elution was performed through the C18
monolithic column only.
Having devised and optimised methods of matrix removal, i.e. washing and
the use of a sacfificial SiSAX sorbent, the applicability of the on-line SPE

procedure for the preconcentration of ZnPT from river water was examined. Fig.
5.14 following depicts a 1 p g ~ " ZnPT spike prepared in river water and extracted
under optimum conditions. A clear sharp intense peak can be seen with minimal
matrix interference thereby suggesting that the Si-SAX sorbent efficiently removes
problematic NOM that was still retained using a solvent wash procedure alone.
A draw back of the Si-SAX sorbent was, that due to its efficient removal of
NOM it became rapidly soiled and caused large increases in the operating
backpressure, e.g. within 2-3 extractions. As a consequence it was decided to
dilute samples with reagent water ten fold prior to extraction in order to increase
the lifetime of the Si-SAX sorbent. Sample dilution increased the lifetime of the Si-
SAX column considerably with no adverse effects upon reproducibility observed
even after ten extractions thereby making the method more economically viable.
Dilution also led to a decrease in the baseline noise due the reduced quantity of
NOM present in the extraction solution.
6 8 Time, (mins)
Figure 5.14: EIC mlz 316 chromatogram depicting the extraction of 1 C c g ~ - ' ZnPT from river water.
Using optimised conditions a 10 ygL-' ZnPT spike was prepared in river
water, diluted ten fold and extracted. Possible sample to sample carryover was
then evaluated by checking each component of the analytical system after elution
and reconditioning. From Fig. 5.15 it can clearly be seen that there is negligible
sample to sample carryover with no traces of ZnPT detected on either the
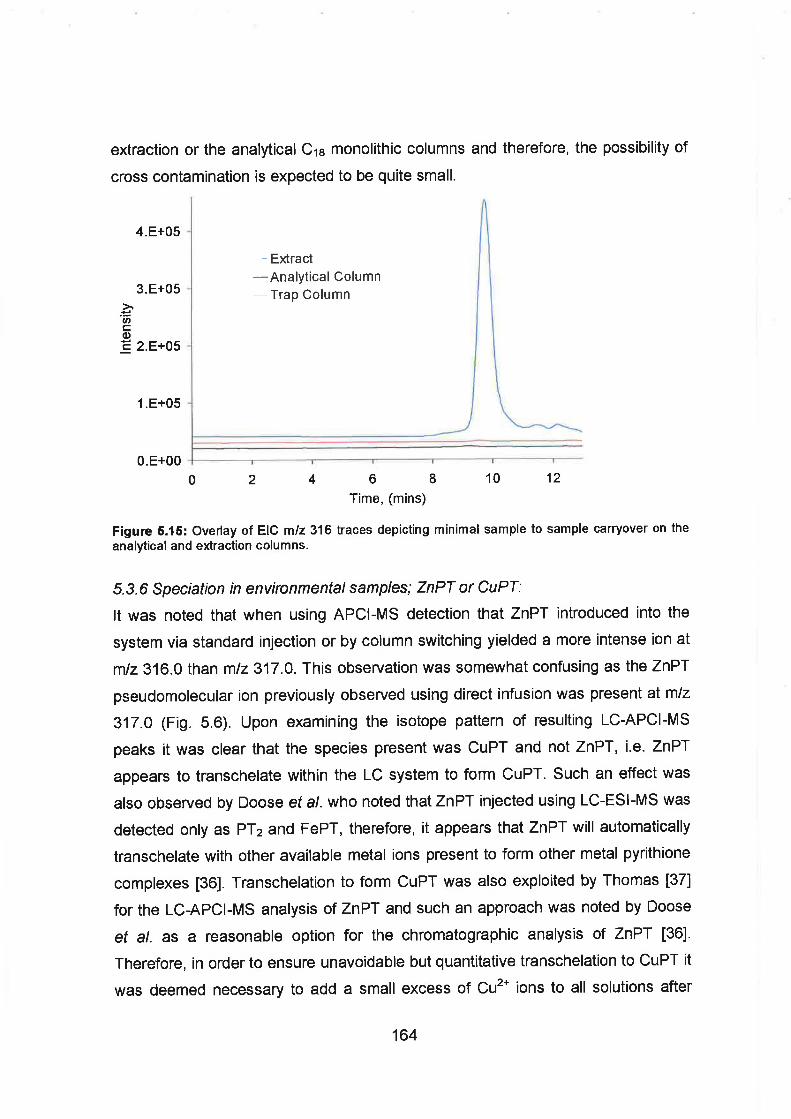
extraction or the analytical C18 monolithic columns and therefore, the possibility of
cross contamination is expected to be quite small.
Extract -Analytical Column
Trap Column
O.E+OO I- - I - I - - I I -I- I
0 2 4 6 8 10 12
Time, (rnins)
Figure 5.15: Overlay of EIC m/z 316 traces depicting minimal sample to sample carryover on the analytical and extraction columns.
5.3.6 Speciation in environmental samples; ZnPT or CuPT:
It was noted that when using APCI-MS detection that ZnPT introduced into the
system via standard injection or by column switching yielded a more intense ion at
m/z 316.0 than mlz 317.0. This observation was somewhat confusing as the ZnPT
pseudomolecular ion previously observed using direct infusion was present at mlz
317.0 (Fig. 5.6). Upon examining the isotope pattern of resulting LC-APCI-MS
peaks it was clear that the species present was CuPT and not ZnPT, i.e. ZnPT
appears to transchelate within the LC system to form CuPT. Such an effect was
also observed by Doose et a/. who noted that ZnPT injected using LC-ESI-MS was
detected only as PT2 and FePT, therefore, it appears that ZnPT will automatically
transchelate with other available metal ions present to form other metal pyrithione
complexes [36]. Transchelation to form CuPT was also exploited by Thomas [37]
for the LC-APCI-MS analysis of ZnPT and such an approach was noted by Doose
et a/. as a reasonable option for the chromatographic analysis of ZnPT [36].
Therefore, in order to ensure unavoidable but quantitative transchelation to CuPT it
was deemed necessary to add a small excess of cu2' ions to all solutions after

dilution prior to extraction, in this instance a 20 fold excess of cu2' was judged to
be adequate. Preliminary investigations were performed using copper (11) nitrate,
copper (11) sulphate and copper (11) acetate and the different counter ions were
found to have a distinct effect on the resulting CuPT peak.
Cu Acetate Cu Sulphate
-Cu Nitrate
6 8
Time, (mins)
Figure 5.16: The effect of different copper salts upon the transchelation of ZnPT to CuPT: exbacted EIC mlz 316 kaces depicting a 1 p g ~ - l ZnPT extract to which a 20 fold excess of cu2' had been added, samples prepared in river water.
It is clear from Fig. 5.16 that copper (11) acetate allowed for the
transchelation of ZnPT to CuPT without affecting the APCI-MS response whereas
both the sulphate and nitrate salts had more profound negative effects upon the
resulting CuPT peak, the reason for such an effect remains unclear as both copper
(11) sulphate and copper (11) nitrate were used to transchelate ZnPT by Thomas
[37]. Due to this observation only copper (11) acetate was used for in further studies.
5.3.7 Method performance:
The performance of the on-line SPE LC-APCI-MS was evaluated using river water
as a real sample matrix collected from the River Broadmeadow prior to its entry
into the Malahide estuary near Swords in north Co. Dublin, Ireland. Before usage,
the river water was filtered through Whatman GFIC glass fibre filters to remove
suspended material. Spike solutions were prepared in the filtered river water,
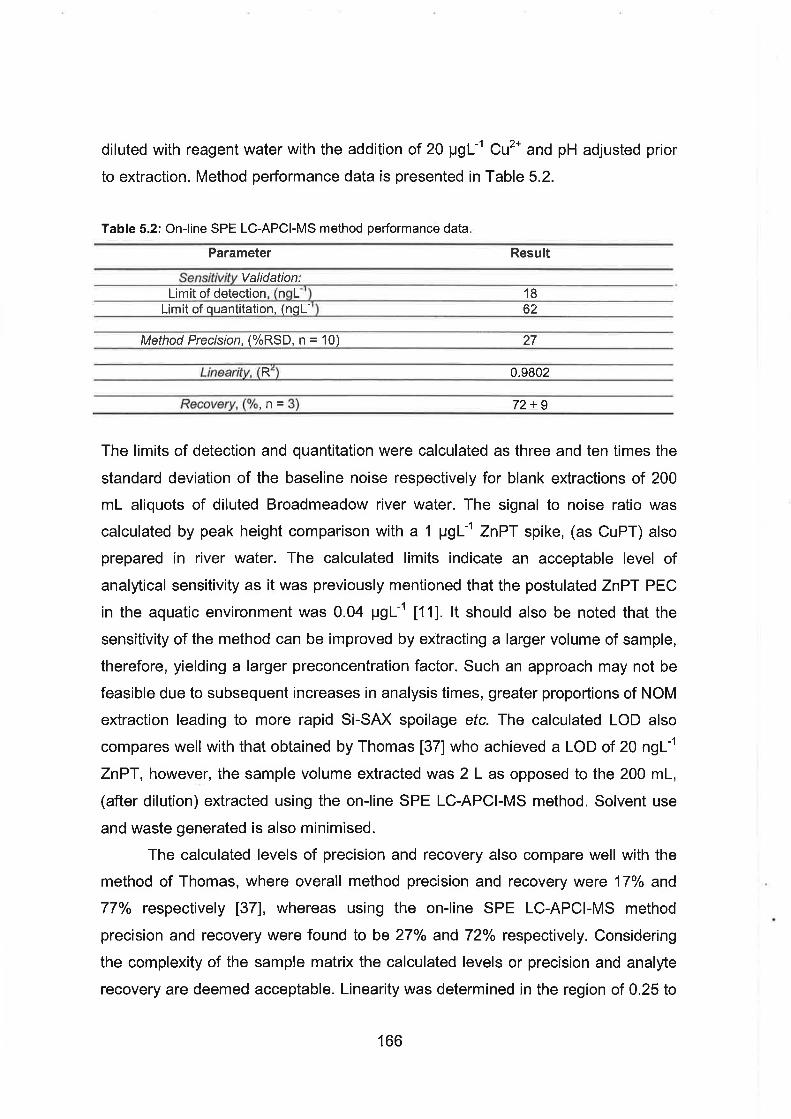
diluted with reagent water with the addition of 20 p g ~ " cu2' and pH adjusted prior
to extraction. Method performance data is presented in Table 5.2.
Table 5.2: On-line SPE LC-APCI-MS method performance data.
Parameter Result
Sensitivity Validation: Limit of detection, ( n g ~ ' ) 18
Limit of quantitation, (ng~- ' ) 62
- Method Precision, (%RSD, n = 10) 27
Linearity, ( R ~ ) 0.9802
The limits of detection and quantitation were calculated as three and ten times the
standard deviation of the baseline noise respectively for blank extractions of 200
mL aliquots of diluted Broadmeadow river water. The signal to noise ratio was
calculated by peak height comparison with a I pgL" ZnPT spike, (as CuPT) also
prepared in river water. The calculated limits indicate an acceptable level of
analytical sensitivity as it was previously mentioned that the postulated ZnPT PEC
in the aquatic environment was 0.04 pgL-' [ I l l . It should also be noted that the
sensitivity of the method can be improved by extracting a larger volume of sample,
therefore, yielding a larger preconcentration factor. Such an approach may not be
feasible due to subsequent increases in analysis times, greater proportions of NOM
extraction leading to more rapid Si-SAX spoilage etc. The calculated LOD also
compares well with that obtained by Thomas [37] who achieved a LOD of 20 ngL-'
ZnPT, however, the sample volume extracted was 2 L as opposed to the 200 mL,
(after dilution) extracted using the on-line SPE LC-APCI-MS method. Solvent use
and waste generated is also minimised.
The calculated levels of precision and recovery also compare well with the
method of Thomas, where overall method precision and recovery were 17% and
77% respectively [37], whereas using the on-line SPE LC-APCI-MS method
precision and recovery were found to be 27% and 72% respectively. Considering
the complexity of the sample matrix the calculated levels or precision and analyte
recovery are deemed acceptable. Linearity was determined in the region of 0.25 to
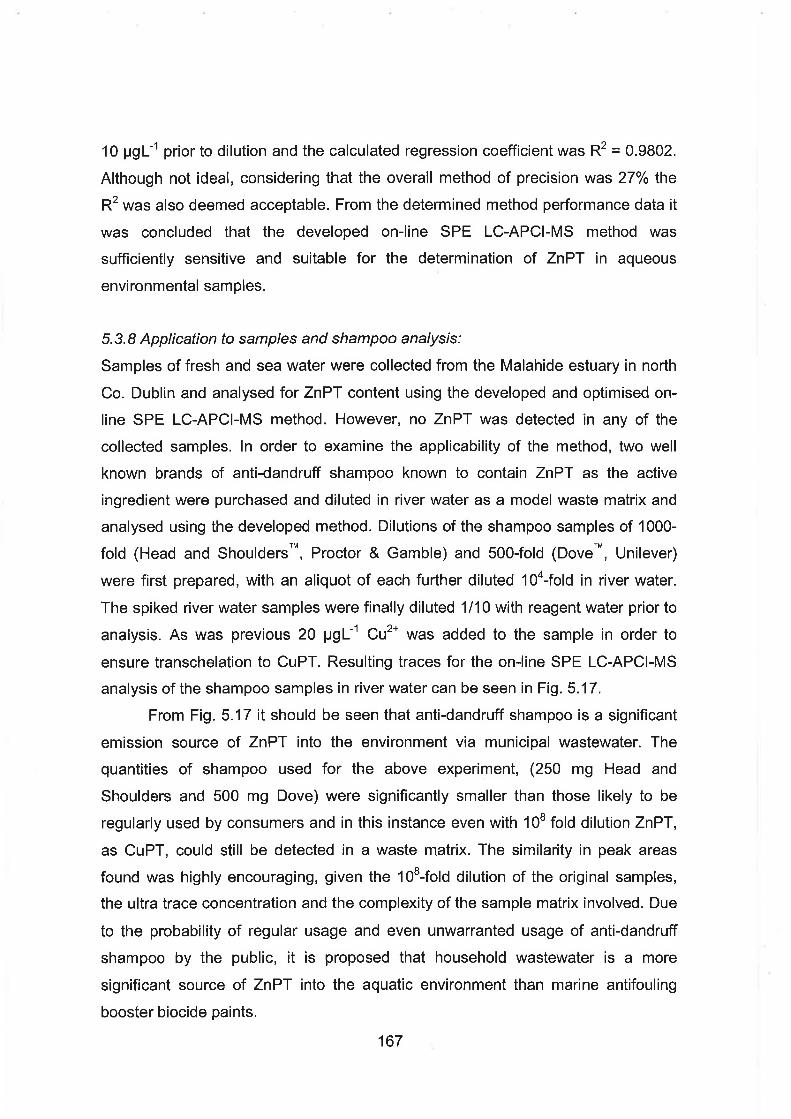
10 p g ~ - ' prior to dilution and the calculated regression coefficient was R~ = 0.9802.
Although not ideal, considering that the overall method of precision was 27% the
R~ was also deemed acceptable. From the determined method performance data it
was concluded that the developed on-line SPE LC-APCI-MS method was
sufficiently sensitive and suitable for the determination of ZnPT in aqueous
environmental samples.
5.3.8 Application to samples and shampoo analysis:
Samples of fresh and sea water were collected from the Malahide estuary in north
Co. Dublin and analysed for ZnPT content using the developed and optimised on-
line SPE LC-APCI-MS method. However, no ZnPT was detected in any of the
collected samples. In order to examine the applicability of the method, two well
known brands of anti-dandruff shampoo known to contain ZnPT as the active
ingredient were purchased and diluted in river water as a model waste matrix and
analysed using the developed method. Dilutions of the shampoo samples of 1000-
fold (Head and ~ h o u l d e r s ~ ~ , Proctor & Gamble) and 500-fold ( ~ o v e ~ ~ , Unilever)
were first prepared, with an aliquot of each further diluted lo4-fold in river water.
The spiked river water samples were finally diluted 111 0 with reagent water prior to
analysis. As was previous 20 p g ~ ' cu2' was added to the sample in order to
ensure transchelation to CuPT. Resulting traces for the on-line SPE LC-APCI-MS
analysis of the shampoo samples in river water can be seen in Fig. 5.17.
From Fig. 5.17 it should be seen that anti-dandruff shampoo is a significant
emission source of ZnPT into the environment via municipal wastewater. The
quantities of shampoo used for the above experiment, (250 mg Head and
Shoulders and 500 mg Dove) were significantly smaller than those likely to be
regularly used by consumers and in this instance even with l o8 fold dilution ZnPT,
as CuPT, could still be detected in a waste matrix. The similarity in peak areas
found was highly encouraging, given the lo8-fold dilution of the original samples,
the ultra trace concentration and the complexity of the sample matrix involved. Due
to the probability of regular usage and even unwarranted usage of anti-dandruff
shampoo by the public, it is proposed that household wastewater is a more
significant source of ZnPT into the aquatic environment than marine antifouling
booster biocide paints.
167
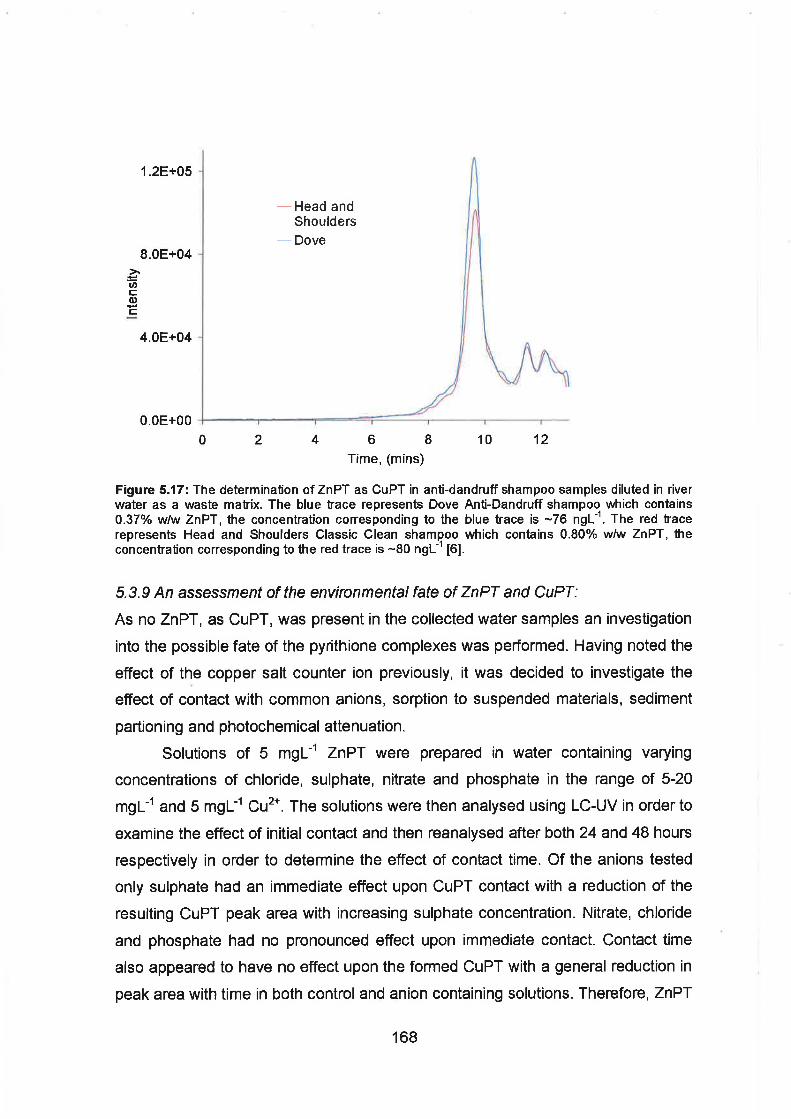
Head and Shoulders Dove
6 8 Time, (mins)
Figure 5.17: The determination of ZnPT as CuPT in anti-dandruff shampoo samples diluted in river water as a waste malrix. The blue trace represents Dove Anti-Dandruff shampoo which contains 0.37% w/w ZnPT, the concentration corresponding to the blue trace is -76 n g ~ - ' . The red lrace represents Head and Shoulders Classic Clean shampoo which contains 0.80% wlw ZnPT, the concentration corresponding to the red trace is -80 n g ~ - ' [6].
5.3.9 An assessment of the environmental fate of ZnPT and CuPT:
As no ZnPT, as CuPT, was present in the collected water samples an investigation
into the possible fate of the pyrithione complexes was performed. Having noted the
effect of the copper salt counter ion previously, it was decided to investigate the
effect of contact with common anions, sorption to suspended materials, sediment
partioning and photochemical attenuation.
Solutions of 5 mgL-' ZnPT were prepared in water containing varying
concentrations of chloride, sulphate, nitrate and phosphate in the range of 5-20
mgL-' and 5 mgL-' cu2'. The solutions were then analysed using LC-UV in order to
examine the effect of initial contact and then reanalysed after both 24 and 48 hours
respectively in order to determine the effect of contact time. Of the anions tested
only sulphate had an immediate effect upon CuPT contact with a reduction of the
resulting CuPT peak area with increasing sulphate concentration. Nitrate, chloride
and phosphate had no pronounced effect upon immediate contact. Contact time
also appeared to have no effect upon the formed CuPT with a general reduction in
peak area with time in both control and anion containing solutions. Therefore, ZnPT

as CuPT in the environment appears to be unaffected by the presence of inorganic
anions, even though some ions such as nitrates have been previously observed to
act as photosensitisers to organic micro-pollutants no such effects were observed
in this study, [54].
The sorption of pyrithione metal complexes onto suspended materials was
also evaluated. 1 L aliquots of collected river and sea water samples were filtered
through Whatman GF/C filter papers, air dried and then eluted using a solvent
mixture of 50:50 dichloromethane MeOH. The solvent was filtered through glass
wool and evaporated to near dryness under a gentle stream of NZ. Resulting
residue was reconstituted with 200 pL MeOH and analysed using direct injection
LC-APCI-MS. Both the filter paper and the glass wool used for filtration were also
checked for cross contamination. However, no CuPT was detected on any of the
extracted filter papers thereby suggesting that CuPT does not adsorb onto
suspended media in the aqueous phase.
Reports concerning the adsorption of pyrithione metal complexes onto
sediment in the published literature are quite scarce and of those published there
appears to be a consensus that pyrithione metal complexes will rapidly degrade in
the aqueous phase and the likelihood of any sediment adsorption is therefore, quite
small. Any pyrithione metal complexes that do adsorb onto sediment are thought to
be degraded via either sediment catalysed degradation or microbial degradation
etc. [ I 1,15,17]. Due to the attenuation of incident light with depth, there exists a
probability that any pyrithione metal complexes that reach sufficient depth to
intimately interact with sediment may indeed adsorb due to the absence of
wavelengths of light thought to cause photolytic degradation. Therefore, using two
certified reference sediments obtained from the National Research Council of
Canada, the adsorption of ZnPT onto the sediment phase was determined. The
two sediment reference materials varied in their total organic carbon content (TOC)
and also their metal content, of particular importance were the concentrations of
copper and zinc, values for which are inserted in Table 5.3.

Table 5.3: TOC and metal content of the two certified sediment samples.
Component BCSS-I PACS-I
C (%) 2.19 k 0.09 3.69 + 0.1 1 Zn (~ t~-g ' l ) 119f 12 824 + 22 c u (~g.g-') 18.5 f 2.7 452f 16
Sampling Location Baie des Chaleurs, Esquimalt Harbour Gulf of St. Lawrence British Colombia
Using amber glass sample vials, 5 mL of 5 m g ~ " ZnPT in water was added
to 0.5 g of sediment and repeatedly shaken by hand several times over the course
of two hours. For each sediment sample the behaviour of a control and two ZnPT
solutions were examined. An aliquot of the aqueous phase was then withdrawn
and placed in an amber vial for subsequent LC-APCI-MS analysis. The remaining
aqueous phase was removed via filtration and the sediment sample was air dried
overnight in the dark. The sediment was then transferred to another amber sample
vial and extracted with 5 mL of 50:50 dichloromethane MeOH. The solvent solution
was filtered through nylon filters, reduced in volume under N2 and finally
reconstituted with 200 pL of MeOH before LC-APCI-MS analysis. Both the nylon
and paper filters used were also analysed by LC-APCI-MS in order to examine any
possible sources of cross contamination. The concentration of CuPT was
determined from a prepared five point calibration curve and can be viewed in Table
5.4 following.
Table 5.4: Calculated concentrations of CuPT in the aqueous and sediment phases after a 2 hour mixing period.
BCSS-1 PACS-1
Aqueous phase, (rngLml) 0.1 1 0.00 Sediment phase, (mgkg") 0.43 0.86
Sediment:aqueous phase ratio 3.91 - Amount of residue in aqueous phase, (gg vial-') 0.55 0.00 Amount of residue in sediment phase, (pg viar7) 0.22 0.43
% Initial dose in aqueous phase 2.20 0.00 % Initial dose in sediment phase 0.88 1.72
From Table 5.4 it can be seen that the measured concentrations of CuPT in
each phase differ for the two sediment samples, see Fig. 5.18. The reason for the
difference is attributable to the TOC content of the sediments with a higher
proportion of ZnPT adsorbed and transformed on the PACS-1 sediment that

contains larger quantities TOC and metals. Therefore, based upon the above
findings it can be estimated that distribution ratio for the BCSS-I-sediment is -4:l
and consequently if intimate contact occurs between water containing pyrithione
metal complexes and sediment, the sediment would be expected to preferentially
concentrate the pyrithione metal complex from the water due to the high partition
coefficient of ZnPT. Such an effect is illustrated more clearly with the PACS-1
sediment whereby all of the detected CuPT was found solely on the sediment
phase. However, upon conversion of the measured data to a percentage initial
dose, it can be seen that approximately 97% of ZnPT introduced into the
experimental vial disappeared over the course of the experiment. Similar
observations were also noted by Turley et al. who found that ZnPT rapidly
converted into 2-pyridine sulphonic acid when also performing sorption
experiments as a result of light exposure [17]. From such data it can be deduced
that ZnPT and CuPT present in the environment are unlikely to accumulate on
sediment due to the existence of a more important removal mechanism despite
their high partitioning behaviour [17]. However, the need therefore, still exists for
further research to determine the effect of pyrithione metal complexes on sediment
biota and to also determine the actual fate of pyrithione metal complexes adsorbed
onto sediment.
As mentioned previously, photochemical attenuation appears to be the most
important removal mechanism of pyrithione metal complexes introduced into the
aquatic environment. However, of the photochemical attenuation studies reported
in the literature, the majority were performed using bioassays and primarily in a
marine water matrix. As observed in this study, anti-dandruff shampoo appears to
be a more significant source of ZnPT introduced into the aquatic environment,
especially into fresh water systems, than marine antifouling paints and also ZnPT
introduced into the environment will transchelate to form CuPT. Therefore, a brief
study was performed to examine the photochemical attenuation of CuPT in filtered
river water. A 10 m g ~ - ' solution of CuPT in river water,.along with a control sample
was placed in a clear glass bottle an exposed to natural sunlight on the laboratory
window during April 2006. Sacrificial samples were withdrawn from the clear glass
bottle into amber vials and immediately frozen until LC-APCI-MS analysis. The
relative presence of CuPT was plotted against time as in Fig. 5.19 following. The
171
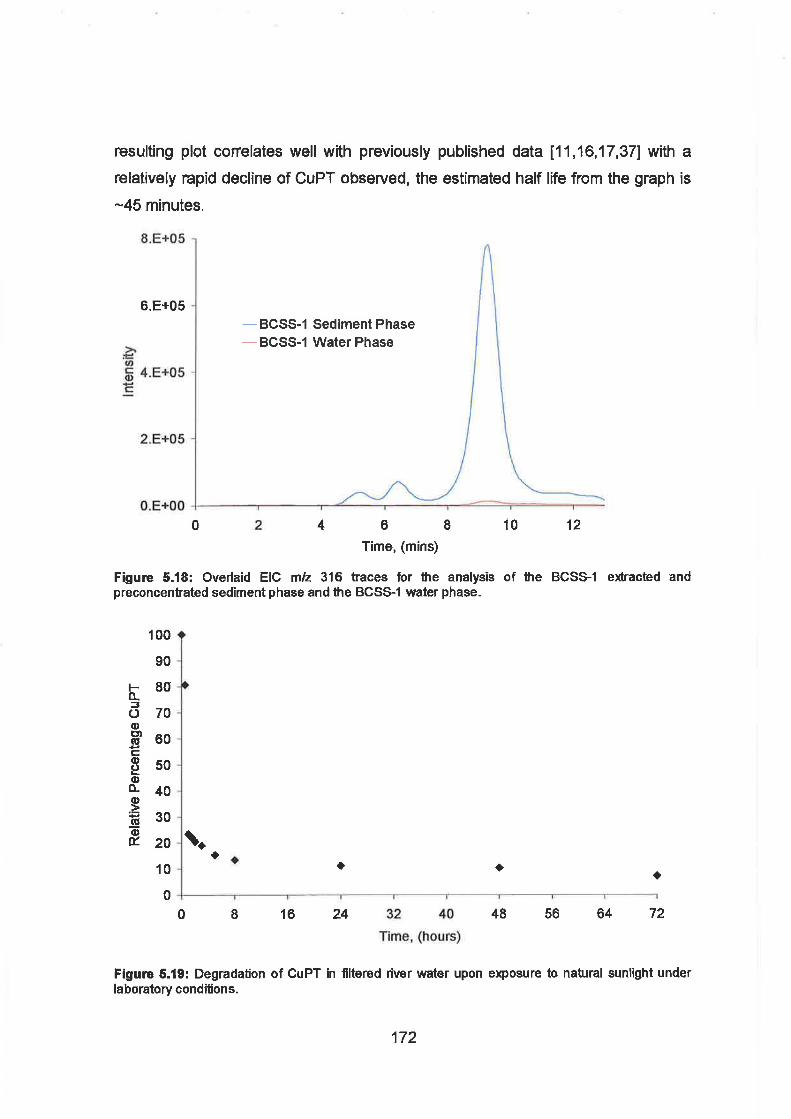
resulting plot correlates well with previously published data [11,16,17,37] with a
relatively rapid decline of CuPT observed, the estimated half life from the graph is
-45 minutes.
BCSS-1 Sediment Phase BCSS-1 Water Phase
2 4 6 8 10 12
Time, (mins)
Figure 5.18: Overlaid EIC m h 316 traces for the analysis of the BCSS-1 extracted and preconcentrated sediment phase and the BCSSl water phase.
0 l - - r t - I 1 I -1- I I
0 8 16 24 32 40 48 56 64 72
Time, (hours)
Figure 5.19: Degradation of CuPT in filtered riuer water upon exposure to natural sunUght under laboratory conditions.

Although CuPT appears to initially rapidly disappear it can be seen from the
above plot that the rate of photochemical attenuation appears to decrease with
increasing time, consequently as ZnPT is likely to be constantly introduced into the
aquatic environment via untreated municipal wastewater, the probability exists that
ZnPT may at times reach detectable concentrations depending on the input flux of
ZnPT, the availability of cu2' and also the light exposure of receiving waters.
However, in waters with high light intensity and high mixing rates it is expected that
photochemical attenuation is likely to be an extremely efficient removal process for
introduced metal pyrithione complexes.
5.4 Conclusions:
A column switching LC method in conjunction with APCI-MS detection has been
developed for the extraction and analysis of ZnPT, (as CuPT) in aquatic
environmental samples. Monolithic silica columns were chosen for use for the
analytical separation due to the low silanol activity and lack of metallic
contamination and also for the performance of on-line SPE due the ability to use
high flow rates without the generation of excessive backpressure. Excessive matrix
co-extraction and consequent ion suppression was found to be problematic and
required the use of both a sacrificial Si-SAX sorbent prior to the CI8 extraction
column and a subsequent wash step for the removal of NOM. The method was
validated in a real sample matrix and high levels of sensitivity with acceptable
analyte recovery and reproducibility attained. The method is likely to be of use to
those who wish to monitor the presence of ZnPT in the aquatic environment.
Based upon results of an environmental fate study it appears that ZnPT will
transchelate to form CuPT in environmental waters. CuPT appears to be
unaffected by the presence of inorganic anions and does not appear to adsorb onto
suspended solids. Photochemical attenuation appears to be the most important
removal mechanism of CuPT. However sediment adsorption has also been shown
to occur, particularly in sediments with a high proportion of TOC. It is therefore
concluded that ZnPT introduced into the environment e.g. via municipal wastewater
is rapidly degraded in well illuminated waters with a high rated of mixing, e.g. fast
flowing streams and rivers. Further research needs to be conducted to determine

the behaviour and removal of pyrithione metal complexes during municipal
wastewater treatment, the characterisation and risk evaluation of degradation
products in water and sediments should also be performed.
References:
-
1. Activities of the European Union, "Maritime safety: prohibition of organotin compounds on ships",
viewed February 1 3th 2006, http://europa.eu.int~scadplus/leg/en/lvb/l24256.htm.
2. S.M. Evans, A.C. Birchenough & M.S. Brancato, Marine Pollution Bulletin, 40, (2000), 204.
3. W.A. Lott and E. Shaw, Journal of the American Chemical Society, 71, (1949), 70.
4. E. Shaw, J. Berntstein , K. Losee & W.A. Lott, Journal of the American Chemical Society, 72,
(1 950), 4362.
5. B.L. Barnett, H.C. Kretschmar & F.A. Hartman, Inorganic Chemistry, 16, (1977), 1834.
6. The Swedish Society for Nature Conservation, "The Investigation of Zinc Pyrithione in Dandruff
Shampoo" (2004), viewed March 3oth 2006, http://www.snf.se/pdf/rap-hmv-dandruffeng.pdf
7. N. Voulvoulis, M.D. Scrimshaw & J.N. Lester, Applied Organometallic Chemistry, 13, (1999), 135.
8. E. Guthery, L.A. Seal & E.L. Anderson, American Journal of Infection Control, 33, (2005), 15.
9. E. Ermolayeva & D. Sanders, Applied and Environmental Microbiology, 61, (1 995), 3385.
10. R.J. Knox, N.S. Magoski, D. Wing, S.J. Barbee & L.K. Kaczmarek, Journal of Neurobiology, 60,
(2004), 41 1.
11. P.A. Turley, R.J. Fenn & C.J. Ritter, Biofouling, 15, (2000), 175.
12. K.V. Thomas, M. MCHugh & M. Waldock, The Science of the Total Environment, 293, (2002),
117.
13. K.V. Thomas, M. MCHugh, M. Hilton & M. Waldock, Environmental Pollution, 123, (2003), 153.
14. K.V. Thomas, S.J. Blake & M.J. Waldock, Marine Pollution Bulletin, 40, (2000), 739.
15. R.M. Galvin, J.M. Rodiguez Mellado & M. Ruiz Montoya, European Water Management, 1,
(1998), 61.
16. K. Maraldo & I. Dahllof, Marine Pollution Bulletin, 48, (2004), 894.
17. P.A. Turley, R.J. Fenn, J.C. Ritter & M.E. Callow, Biofouling, 21, (2005), 31.
18. P-J. Sun, Q. Fernando & H. Freiser, Analytical Chemistry, 36, (1 964), 2485.
19. F. Sanchez-Bayo & K. Goka, Aquatic Toxicology, 74, (2005), 285.
20. I.K. Konstantinou & T.A. Albanis, Environment International, 30, (2004), 235.
21. N. Kobayashi & H. Okamura, Marine Pollution Bulletin, 44, (2002), 748.
22. J. Bellas, A. Granmo & R. Beiras, Marine Pollution Bulletin, 50, (2005), 1382.
23. K. Goka, Environmental Research, 81, (1 999), 81.
24. H. Okamura, T. Watanabe, I. Aoyama & M. Hasobe, Chemosphere, 46, (2002), 945.
25. J. Karlsson & B. Eklund, Marine Pollution Bulletin, 49, (2004), 456.

26. D. Groth Petersen, I. Dahllof & L.P. Nielsen, Environmental toxicology and Chemistry, 23,
(2004), 921.
27. C.A. Doose, J. Ranke, F. Stock, U. Bottin-Weber & B. Jastorff, Green Chemistry, 6, (2004), 259.
28. A.F. Krivis, E.S. Gazda, G.R. Supp & M.A. Robinson, Analytical Chemistry, 35, (1963), 966.
29. L-H. Wang, Electroanalysis, 12, (2000), 227.
30. D.S. Mackie, C.M.G. van den Berg & J.W. Readman, Analytica Chimica Acta, 511, (2004), 47.
31. M. Ruiz Montoya, R.M. Galvin & J.M. Rodriguez Mellado, Electroanalysis, 10, (1998), 1030.
32. Y. Shih, J-M. Zen, A.S. Kumar & P-Y. Chen, Talanta, 62, (2004), 912.
33. R.J. Fenn & M.T. Alexander, Journal of Liquid Chromatography, 11, (1988), 3403.
34. N. Voulvoulis, M.D. Scrimshaw & J.N. Lester, Chemosphere, 38, (1999), 3503.
35. K. Nakajima, T. Yasuda & 1. Nakazawa, Journal of Chromatography, 502, (1990), 379.
36. C.A. Doose, M. Szaleniec, P. Behrend, A. Muller & B. Jastorff, Journal of Chromatography A,
1052, (2004), 103.
37. K.V. Thomas, Journal of Chromatography A, 833, (1 999), 105.
38. Y. Yamaguchi, A. Kumakura, S. Sugasawa, H. Harinos, Y. Yamada, K. Shibata & T. Senda,
International Journal of Environmental Analytical Chemistry, 86, (2006), 83.
39. lntersil Quality Control Manual Chromaographic tests,
www.intersil.com/technical~data/inertness.pdf, viewed
40. A.I. Elefterov, S.N. Nosal, P.N. Nesterenko & O.A. Shpigun, Analyst, 110, (1994), 1329.
41. The University of Sheffield Chemputer isotope calculator,
http://winter.group.shef.ac.uk/chemputer, viewed April 2gth 2006.
42. C. Baldwin, J. Cumming & A.T. Timperman, The Analyst, 130, (2005) 318.
43. A.R.S. Ross, M.G. lkonomou & K.J. Orians, Marine Chemistry, 83, (2003), 47.
44. F.C. Wu, R.D. Evans & P.J. Dillon, Analytica Chimica Acta, 452, (2002), 85.
45. 1. Paunovic, R. Schulin & B. Nowack, Journal of Chromatography A, 1100, (2005), 176.
46. A.S. Gordon, B.J. Dyer, R.A. Kango & J.R. Donat, Marine Chemistry, 53, (1996), 163.
47. J.R. Donat, R.A. Kango & A.S. Gordon, Marine Chemistry, 57, (1997), 1.
48. V. Pichon, C. Cau Dit Coumes, L. Chen, S. Guenu & M.C. Hennion, Journal of Chromatography.
A, 737, (1996), 25.
49. M. Ibanez, Y. Pico & J. Manes, Journal of ChromatographyA, 823, (1998), 137.
50. A. Di Corcia, A. Constantino, C. Crescenzi & R. Samperi, Journal of Chromatography A, 852,
(1999), 465.
51. J.E. Renew & C-H. Huang, Journal of Chromatography A, 1042, (2004), 113.
52. 1. Ferrer, D. Barcelo & E.M. Thurman, Analytical Chemistry, 71, (1999), 1009.
53. R.J.C.A. Steen, A.C. Hogenboom, P.E.G. Leonards, R.A.L. Peerboom, W.P. Confino & U.A.Th.
Brinkman, Journal of Chromatography A, 857, (1 999), 157.
54. R. Andreoui, M. Raffaele & P. Nicklas, Chemosphere, 50, (2003), 1319.
6.0 Comparison of Monolithic and Sub 2pm Particle
Packed Columns - Application to the Determination of
Drug Contamination on 1rish Euro Banknotes.
6.1 Introduction:
It has recently been reported that the use of illicit drugs by lrish society, in
particular cocaine, has escalated dramatically. For example, one national
newspaper stated that cocaine usage alone had increased some 829% in the
period of 2001 to 2005 with cannabis resin usage rising approximately 750% based
upon drug seizure data [I]. The illicit drug trade is big business to those involved
and conservatively estimated to be worth close to €650 million annually [2]. Official
An Garda Siochana statistics available concerning offences committed under The
Misuse of Drugs Act 1984 corroborate media reports and show that while cannabis
is still the most commonly abused illicit drug by lrish society, (accounting for -65%
of all offences), cocaine has now overtaken amphetamines and opiates to become
the second most commonly abused drug in the country [3]. Statistics mentioned
are, however, thought to greatly underestimate the actual levels of illicit drug usage
within the community as they only reflect those cases where a prosecution under
the Misuse of Drugs Act 1984 has occurred and, therefore, do not include usage
data concerning social and recreational users.
Gauging the actual levels of drug use in the country appears to be an
onerous task. Traditionally survey based methodologies have been used but such
techniques are inadequate as they are often targeted at specific subgroups within
the population, e.g. known drug addicts. Such methods are also susceptible to bias
either positive or negative, depending upon the social group studied. For example,
it would be expected that a general survey would be negatively biased and
therefore, underestimate the actual use due to the fact that recreational drug users
would not be expected to openly admit their behaviour, especially when it involves
breaking the law. As a consequence survey based methods are likely to report

anecdotal information and speculation rather than scientific facts [4]. Another
method previously used for the estimation of drug use has focused upon the
numbers of people presenting themselves for drug treatment. It was also recently
reported that such a phenomenon is no longer mainly confined to the capital city
with numbers seeking treatment in regions outside the Eastern Regional Health
Authority having almost trebled [5]. However, the problem exists that the Irish
treatment system has long been focused upon opiates and may not be sufficiently
equipped to deal with the recent surge in cocaine usage [4].
Previously published reports have demonstrated that paper currency in
general circulation may be contaminated with detectable levels of illicit materials,
most commonly cocaine [6,7,8,9]. Such contamination is likely to occur due to
rolled up bank notes being used to 'snort' substances or as a result of transfer
during drug deals [ lo l l 1,121. Cross contamination between notes during counting
processes in financial institutions is also possible as it has been demonstrated that
nanogram quantities of cocaine can be transferred from contaminated to other
bank notes using both manual and automated counting procedures 1131. Although
not a quantitative measure, the presence of illicit substances on bank notes in
general circulation provides an indication that such substances are being used
within the community under study. Recently, Zucatto et a/. have proposed
monitoring for the presence of illicit drug residues in surface waters arising from
human use, which appears to offer a more robust method for estimating drug use
within the community [14].
A limited number of analytical methods for the determination of drug
contamination on banknotes are available in the published literature and may be
divided into two groups; those which use GC-MS or GC-MSIMS [6,8,9] and those
which directly analyse banknotes using thermal desorption tandem MS (TD-
MSIMS) [ I 3,15,16,17]. Surprisingly, due to the polarity of many illicit substances,
only one method based upon liquid phase separation techniques is available in the
peer-reviewed literature, [18]. Xu et a/. explored the possibility of using CE with
electrochemiluminesence detection (CE-ECL) for the determination of heroin and
cocaine on Chinese currency. While the method was successfully applied, it is
worth noting the lack of specificity compared to MS based methods. In the case of
GC-MSIMS based methods a sample preparation step is necessary in order to
177
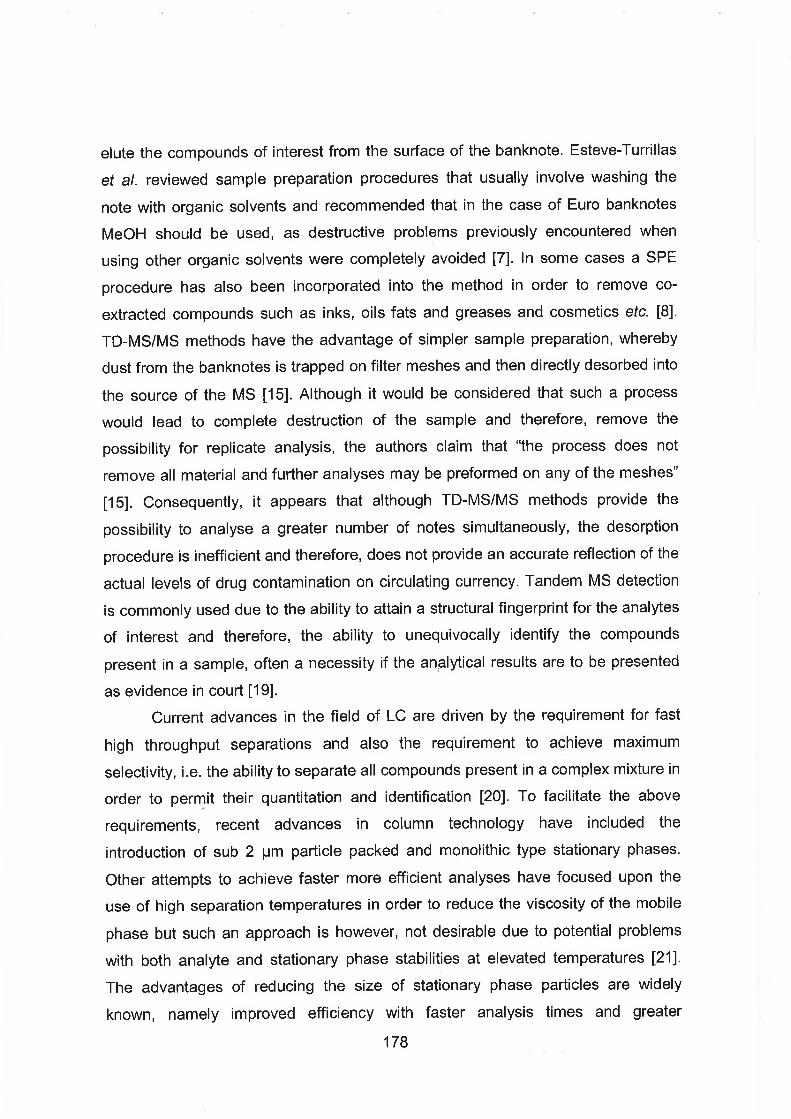
elute the compounds of interest from the surface of the banknote. Esteve-Turrillas
et a/. reviewed sample preparation procedures that usually involve washing the
note with organic solvents and recommended that in the case of Euro banknotes
MeOH should be used, as destructive problems previously encountered when
using other organic solvents were completely avoided [7]. In some cases a SPE
procedure has also been incorporated into the method in order to remove co-
extracted compounds such as inks, oils fats and greases and cosmetics etc. [8].
TD-MSIMS methods have the advantage of simpler sample preparation, whereby
dust from the banknotes is trapped on filter meshes and then directly desorbed into
the source of the MS [15]. Although it would be considered that such a process
would lead to complete destruction of the sample and therefore, remove the
possibility for replicate analysis, the authors claim that "the process does not
remove all material and further analyses may be preformed on any of the meshes"
[15]. Consequently, it appears that although TD-MSIMS methods provide the
possibility to analyse a greater number of notes simultaneously, the desorption
procedure is inefficient and therefore, does not provide an accurate reflection of the
actual levels of drug contamination on circulating currency. Tandem MS detection
is commonly used due to the ability to attain a structural fingerprint for the analytes
of interest and therefore, the ability to unequivocally identify the compounds
present in a sample, often a necessity if the analytical results are to be presented
as evidence in court [19].
Current advances in the field of LC are driven by the requirement for fast
high throughput separations and also the requirement to. achieve maximum
selectivity, i.e. the ability to separate all compounds present in a complex mixture in
order to permit their quantitation and identification [20]. To facilitate the above
requirements, recent advances in column technology have included the
introduction of sub 2 pm particle packed and monolithic type stationary phases.
Other attempts to achieve faster more efficient analyses have focused upon the
use of high separation temperatures in order to reduce the viscosity of the mobile
phase but such an approach is however, not desirable due to potential problems
with both analyte and stationary phase stabilities at elevated temperatures [21].
The advantages of reducing the size of stationary phase particles are widely
known, namely improved efficiency with faster analysis times and greater
178

sensitivity [20,22]. However, such gains are often offset by, or unattainable due to
the increased backpressure needed to pump solvents through columns containing
very small particles. In addition to the generation of excessive backpressure,
detectors capable of fast responses and rapid sampling rates are also required in
order to achieve the maximum benefit from the chromatographic analysis. Another
problem generated by the excessive backpressure required when using sub 2 pm
particles is that of frictional heating and the generation of non uniform temperature
gradients within the column and therefore, the resulting effects upon retention and
efficiency [23,24]. The effect of frictional heating and very high operating pressures
upon behaviour of analytes is currently attracting attention.
In contrast to sub 2 pm particulate media, monolithic silica columns, which
allow for the achievement of high efficiency without the generation of excessive
backpressure, are now available, (section 2.3.5). Although monolithic columns are
therefore, an attractive prospect they are not without their limitations, namely
higher solvent consumption, lack of available stationary phase chemistries and also
until recently lack of direct compatibility with MS detection [20]. However, the
recent introduction of a 3 mm i.d. monolithic silica reversed-phase column on to the
market helps to overcome the above limitations, most importantly facilitating easier
coupling to MS.
The objective of this study was first to directly compare a commercially
available 1.8 pm particle packed column with recently available 3 mm i.d.
monolithic silica columns for the reversed-phase separation of strongly basic
compounds, i.e. illicit drugs. Secondly, this work developed, for the first time, an
optimised LC-MSIMS method based upon the new monolithic phases for the
determination of illicit drug and abused pharmaceuticals and its application to
the evaluation of contamination on Irish Euro banknotes in current circulation in
the greater Dublin area, with the aim of establishing an indication of drug use,
particularly cocaine, within the community.

6.2 Experimental:
6.2. I Chemicals and reagents:
Reagent water used throughout this study was obtained from a Millipore Milli-Q
water purification system, (Millipore, Bedford, MA, USA) and was 18.2 M n or
greater. MeOH, MeCN and dichloromethane were received from Labscan
(Dublin, Ireland), all solvents used were HPLC grade. Cocaine hydrochloride,
morphine sulphate salt pentahydrate, methadone hydrochloride, ketamine
hydrochloride, heroin and A'-tetrahydrocannabinol methanolic solution (A'-THC)
were purchased under license from Sigma-Aldrich (St. Louis, MO, USA).
Benzoylecgonine hydrate, cocaethylene, D-amphetamine sulphate salt,
temazepam, diazepam, carbamazepine, fluoxetine hydrochloride, lysergic acid
diethylamide (LSD), papaverine hydrochloride, 3,4-
methylenedioxymethamphetamine hydrochloride (MDMA) and 2-ethylidine-I ,5-
dimethyl-3,3-diphenylpyrrolidine perchlorate (EDDP) were purchased under
license from Sigma-Aldrich (Poole, UK). The chemical structure of each drug is
depicted in Table 6.1. AnalaR grade glacial acetic acid and hydrochloric acid
were obtained from BDH Chemicals (Poole, UK). Ammonium acetate, (ACS
reagent grade) was purchased from Riedel de Haen (Sleeze, Germany) and
ammonium hydroxide solution, (LC-MS additive grade) was obtained from Fluka
(Steinheim, Germany).
Individual 100 m g ~ " stock solutions of each chemical were prepared in
MeOH and were stored at 4OC in the dark. Working solutions were prepared from
the individual stock standards using water as a diluent. In the case of salts,
standard solutions were prepared in terms of the parent analyte. Stock solutions
were retained for the duration of the research, working solutions were prepared
fresh prior to use.
6.2.2 Glassware preparation:
Silanisation was performed as per section 3.2.3.
6.2.3 LC-MS/MS analysis:
LC instrumentation used was as per section 3.2.5 and 4.2.5.

Table 6.1: The chemical structures of the illicit drugs and abused pharmaceuticals chosen for study.
Analyte Structure Analyte Structure
Morphine Benzoylecgonine
Amphetamine Cocaethylene
MDMA LSD
Methadone Temazepam
CI
Papaverine Fluoxetine

6.2.4 Chromatographic conditions:
Columns investigated included a Zorbax Rapid Resolution HT Eclipse XDB-CI8
50.0 x 2.1 mm i.d. 1.8 vm column (Agilent Technologies, Palo Alto, CA, USA)
and Phenomenex Onyx monolithic CI8 100.0 x 3.0 mm i.d. columns,
(Phenomenex, Macclesfield, Cheshire, UK). In order to obtain a 200.0 x 3.0 mm
i.d. column, two monolithic columns were connected in series using an Onyx
column coupler. For column comparison studies an isocratic mobile phase
consisting of 60:40 MeOH water was used for the separation of a mix standard
containing 1 m g ~ - ' carbamazepine, temazepam and diazepam. For the
separation of the complete mix of illicit drugs a multi-step linear gradient of 5
mM ammonium acetate, pH 4.5 and MeOH was used. The initial mobile phase
conditions were 20% MeOH increased linearly to 30% in 2 minutes, followed by
another linear increase in 3 minutes to 50% MeOH, then to 80% MeOH over the
next 15 minutes with a final linear increase to 95% MeOH in 2 minutes, which
was then held isocratically for the remainder of the chromatographic run. A re-
equilibration time of 8 minutes was applied. In all instances the injection volume
was 20 vL.
For least squares weighted regression analysis of van Deemter plots the
Solver add-in of Microsoft ~ x c e l ~ ~ as previously described by Harris was used [25].
6.2.5 Mass Spectrometry:
For ion optic optimisation, 20 m g ~ " solutions of analyte in 1:l MeOH 5 mM
ammonium acetate buffer, pH 4.5 were directly infused into the MS using a Cole
Parmer 74900 series syringe pump at a rate of 120 v ~ h - ' (Cole Parmer, Vernon
Hills, IL, USA). All parameters were automatically optimised using the Bruker
esquire software for the pseudomolecular ions of all analytes. An average of all
recorded values was then used in order to achieve the ionisation and focusing
parameters for use in conjunction with LC-MSIMS, (Table 6.2).

Table 6.2: Optimised ion focusing parameters for ESI-MSIMS detection, (the optimisation was performed using a nebuliser pressure of 10.0 psi, a dry gas flow of 3.0 ~ m i n - ' and a drying - - temperature of 3 0 0 " ~ . spectra were collected over the range 50 - 600 mlz).
Parameter Measured Value
End Plate Offset (V) -603.00 Capillary Exit Offset (V) 74.20
Skim 1 (V) 23.50 Skim 2 (V) 9.40 0 4.40
Octopole A (V) 3.17 -Vpp) 203.40
Trap Drive 66.90 Lens 1 (V) -4.30 -
Lens 2 (V) -87.80 Auto MSIMS Fragmentation Amplitude (V) 1.0 -
Isolation Width (mlz) 4.0
Tandem MS was performed by generating product ion spectra for the
pseudomolecular ion of each analyte. Quantitative LC-MSIMS measurements
were performed using the resulting peak areas in the ElCs for each of the
analyte pseudomolecular ions, the tandem product ion transitions listed in Table
6.3 were used for qualitative confirmation.
Table 6.3: Selected product ion transitions for MSIMS monitoring. Precursor Ion Product Ion
Analyte (mlz) (mlz)
Morphine 286 268 Amphetamine 136 119
MDMA 194 163 Benzoylecgonine 290 168
Ketamine 238 220 Heroin 370 268
Cocaine 304 182 Cocaethylene 31 8 196
LSD 324 223 EDDP - 278 249
Papaverine 340 202 Methadone 310 265 Fluoxetine 31 0 148
Temazepam 30 1 283 Diaze~am 285 257

6.2.6 Extraction of banknotes:
Euro banknotes analysed in this study were collected from a branch of a
national bank on the north side of Dublin and extracted using an adaptation of
the method of Esteve-Turrillas et al. [7]. Briefly, notes were placed in a clean 40
mL amber glass sample tube to which 10 mL of MeOH was added. The vial was
then sealed and vortexed at high speed for one minute. The MeOH was then
removed to a clean 12 mL sample vial and reduced in volume to near dryness
under a gentle stream of nitrogen. The dried extract was then reconstituted in
250 pL of initial mobile phase (80:20 5 mM ammonium acetate MeOH) and
analysed using the developed LC-MSIMS method.
6.3 Results and Discussion:
6.3.1 Comparison of monolithic and 1.8 pm particle packed columns:
The available stationary phases and column lengths were examined for
optimum chromatographic efficiency using a mixture of the three structurally
related tricyclic basic drugs; carbamazepine, temazepam and diazepam.
Experimental conditions were maintained identical throughout all investigations.
The resulting peak width at half height was used for all efficiency calculations.
Fig. 6.1 depicts the resulting van Deemter curves in terms of plate height (H)
and plate number (N) determined for each of the stationary phase
configurations using diazepam as the test analyte.
As can be seen from Fig. 6.1(A) the 1.8 pm particle packed column offers
higher efficiency due to its lower Hmin value than the 10 cm and 20 cm
monolithic columns respectively. As stated previously by Cabrera, the
chromatographic efficiency of monolithic columns is comparable to that of 3.5
pm particles and therefore, the observation that Hmin decreases with a reduction
in the particle size of the stationary phase can clearly be seen from Fig. 6.1 (A)
[26,27]. The optimum linear velocity is higher when using the monolithic
columns compared to the 1.8 pm particle packed column, optimum values were
determined to be 0.40 mms-' on the 1.8 pm particle packed column, 0.52 mms-'
on the 10 cm monolithic column and 0.98 mms-' on the 20 cm monolithic
columns.
0 1 - 1- - 1
0 100 200 300 400
Backpressure, (bar)
Figure 6.1: (A) Plot of plate height (H) versus mobile phase linear velocity using diazepam as the test analyte, (B) Plot of plate number (N) versus mobile phase linear velocity and (C) Plot of plate number (N) versus the generated backpressure on the 1.8 pm column (+), the 10 cm monolithic column (m) and the 20 cm monolithic column (A) .
Fig. 6.1 (B) depicts plate number plotted versus the linear velocity of
mobile phase. From Fig. 6.1 (B) it can be seen that a significantly higher
number of theoretical plates is attainable when using the monolithic columns
compared to the 5 cm 1.8 pm particle packed column. With the 20 cm monolithic
phase it can be seen that over twice the number of theoretical plates can be
obtained at -twice the linear velocity, compared to the particle packed column.
Fig. 6.1 (C) is a plot of plate number versus column backpressure generated. It
can clearly be seen that the primary advantage of the monolithic columns over
the 1.8 pm particle packed column is the ability to provide significantly higher N
at considerably lower operating pressures. With the 20 cm monolithic phase,
optimum N (-1 5000) was achieved at only 75 bar, compared to -1 50 bar on the
particle packed column (N = -7000).
6.3.2 Kinetic behaviour of monolithic and 1.8 pm particle packed columns:
An alternative method of comparing liquid chromatographic supports of different
geometries and sizes is to use so-called kinetic plots, whereby traditional van
Deemter couples such as (po,H) and (po,N), where po is the linear velocity of the
mobile phase, are converted into kinetic parameters that take into account the
column permeability, the mobile phase viscosity and the maximum pressure
drop across the column [28,29].
Fig. 6.2 (A) is a plot of to versus plate number and allows for the direct
visualisation of the range of plate numbers (N) wherein different supports of
different geometries can provide faster separations or increased levels of
chromatographic efficiency than the other. It can be seen that for fast
separations requiring relatively low efficiency the monolithic columns and the
1.8 pm particle packed column all behave similarly. An interesting observation is
that the 10 cm monolith and the 1.8 pm particle packed column appear to
exhibit almost identical plate generation behaviour, however, as was previously
mentioned the monolithic columns generate significantly less operating
pressure. Kinetic plots are constructed using the maximum pressure drop
(APmax) for the system, for the 1.8 pm column APmax was set to 400 bar while for
the monolithic columns a value of 200 bar was applied. Therefore, it appears
that the 10 cm monolithic column is a more suitable option for rapid, moderately
efficient separations (i.e. N -10,000) compared to sub 2 pm column
technologies. The 10 cm monolith and the 1.8 pm column also appear to
provide higher numbers of plates more rapidly than the 20 cm monolithic
column, although the inclusion of the column coupler to generate the 20 cm
monolithic column may be the reason for such an observation, due to the
introduction of additional void volume into the chromatographic system.

A noteworthy characteristic of Fig. 6.2 (B) is its similar appearance to the
van Deemter curves presented in Fig. 6.1 above. However, the advantage of the
kinetic plot over the van Deemter plots is the clearly defined minimum that
corresponds to the optimum attainable number of theoretical plates (Nopt) at the
minimum separation impedance (E,). From a .detailed discussion of the kinetic
plot method by Desmet et al. [30], it was noted that E,-H~ and therefore, the
minimum of the E, versus N/Nopt plot occurs at the same mobile phase linear
velocities as mentioned in section 6.3.1. However, in this case the minimum
corresponds to a point where the system generates the optimum number of
theoretical plates at its best possible kinetic performance / pressure cost ratio
1301. Therefore, from Fig. 6.2 (B) it can be seen that the 10 cm monolithic
column offered higher Nopt values at lower E, values, than the 20 cm monolithic
column and the 1.8 pm column. Such an observation can be explained as the
shorter monolith would be expected to exhibit a higher degree of permeability
than the longer monolithic column and in turn the particle packed column.
However, all the available information should be considered when deciding on
the actual analytical column to be used and based on the all the data presented,
it was determined that the 20 cm monolithic column, which offered the highest N
at acceptable mobile phase flow rates and column backpressures provided the
best performance for the proposed application.
6.3.3 Liquid chromatography of illicit drugs:
Using the 20 cm monolithic column a gradient separation of the chosen analytes
was investigated. An optimisation of the pH and buffer concentration of the
aqueous proportion of the mobile phase was systematically performed using an
experimental design approach to evaluate selectivity effects. For optimisation,
an experimental space was designed, governed by the buffering activity of
ammonium acetate and the desire to keep the buffer concentration low enough
to be compatible with ESI-MS. Therefore, mobile phases containing ammonium
acetate concentrations of 5 to 20 mM, over the pH range of 2.5 to 6.5 were
investigated, with a total of twelve experiments run within the above
concentration and pH range. The resulting chromatograms were assessed using
the resolution product criterion, R, calculated according to Equation 6.1, [31].
187

Figure 6.2: Kinetic comparison of the examined stationary phases; (A) a plot of to versus the pressure drop limited plate number (N ) , and (B) a plot of the t, based separation impedance E, versus the ratio of pressure drop limited plate number (N/NOpt). Symbols: 1.8 vm column (+), the 10 cm monolithic column (m) and the 20 cm monolithic column (A) .
R (i, i - I ) n - I
(Eq. 6.1)
Where:
n is the number of analytes present and

R, is the resolution between peaks i and i-1, calculated using peak width
measured at baseline.
The calculated R values a minimum resolution response surface as
shown in Fig. 6.3 was constructed for the separation of the 16 illicit drugs and
metabolites listed in Table 6.1.
From Fig. 6.3 it can be seen that two sets of possible optima were
generated from the optimisation experiments. Of these the lower buffer
concentration optimum was further refined, resulting in final mobile phase
conditions of 5 mM ammonium acetate, pH 4.5. MeOH gradient conditions were
as described earlier under (section 6.2.4 chromatographic conditions). Under
the optimum mobile phase conditions a complete separation of most analytes
was achieved with the exception of the ketamine and heroin and the
cocaethylene and LSD peak pairs wherein a slight degree of co-elution still
occurred, see Fig. 6.4. A'-THC was strongly retained, however, the total run
time of only 30 minutes per injection for full screening of all 16 drugs was
deemed acceptable.
Figure 6.3 Minimum resolution response surface for the optimisation of the pH and buffer concentration of the aqueous mobile phase. Experiments were performed using a 1 m g ~ - ' standard mixture of analytes.

O.OE+OO ! I /e 3 12 21 30
Time, (mins)
Figure 6.4: Separation of a l m g ~ ' standard solution of all analytes using a multistep gradient of MeOH and 5 mM ammonium acetate, pH 4.5 on the 200.0 mm x 3 mm i.d. monolithic column at a flow rate of 0.35 mlrnin-' using ESI-MSIMS detection. The traces have been offset for the purpose of clarity. Peak identification, '1 morphine, 2 amphetamine, 3 MDMA, 4 benzoylecgonlne, 5 ketamine, 6 heroin, 7 cocaine, 8 cocaethylene, 9 LSD, 10 EDDP, 11 papaverine, 12 methadone, 13 fiuoxetine, 14 temazepam, 15 diazepam and f 6 A'-THC.
6.3.4 MS/MS Detection:
For the detection of most drugs separated simple easily interpretable spectra
were recorded, i.e. only pseudomolecular ions [M+H]' were observed. In the
case of amphetamine and MDMA the product ions generated are as a result of
the loss of ammonia and methyl amine respectively from the precursor
pseudomolecular ions. Cocaine and its structural analogues benzoylecgonine
and cocaethylene were all observed to lose 122 mass units from the parent
molecule corresponding to the loss of the benzoic acid functionality from the
molecules. The MSIMS transition of morphine is thought to be due to loss of
water from the parent molecule while for heroin the MSlMS transition occurs
due to loss of both acetyl groups as CH3C0 followed by a dehydration to yield
the same product ion as morphine at m/z 268. Methadone is thought to lose
dimethyl amine to yield its product ion at mlz 265, its metabolite EDDP loses 29
mass units corresponding to the loss of the ethyl group while papaverine is

thought to lose a dimethoxy phenyl group to yield the product ion at mlz 202.
The product ion of LSD is suspected to arise due to the loss of CON(C2H5)2
from the molecule. Ketamine and temazepam both undergo dehydration to yield
their product ions while the MSIMS transition of diazepam occurs due to the
contraction of the 7 membered ring to a 6 membered ring with the loss of CO to
yield the ion at mlz 257 [32]. A'-THC is thought to under go a similar transition
with ring contraction and loss of HOC(CH3)2 resulting in the product ion at m/z
259. The MSIMS transition of fluoxetine arises as a result of CF3C6H40. All of
the recorded MSIMS transitions were significantly intense, with in most cases
complete fragmentation of the precursor ion. These unequivocal chemical
fingerprints were used for unambiguous identification of resulting peaks when
analysing banknote samples.
6.3.5 Method performance:
Prior to application, the performance characteristics of the developed LC-
MSIMS method were determined. Linearity was assessed from prepared five
point calibration curves in the region of 0.01 to 5 mgL-' equating 0.2 to 100 ng
note-'. Repeatability was determined by performing six replicate injections of a
0.10 mgL-' mixed standard solution while reproducibility was examined using six
individually prepared 0.5 mgL-' mixed analyte solutions. The limits of detection
and quantitation were defined as signals, corresponding to 3 and 100
respectively of the baseline noise. The determined performance characteristics
are listed in Table 6.4. Linearity was demonstrated in all cases with R~ > 0.99
with the exception of amphetamine, heroin, papaverine and A'-THC. The
calculated levels of precision were also deemed acceptable, in general
repeatability was ~ 5 % RSD while reproducibility was in the range of 5-10%
RSD. The method was also determined to be suitable sensitive with detection
and quantitation limits in the pg-ng note-', range. The levels of sensitivity
achieved in this study using LC-MSIMS out perform previously published
methods using GC-MSIMS [7] and CE-ECL [18], wherein an instrument
validation was performed. It is a noteworthy comment that many of the
published methods do not report method performance data. The superior

sensitivity data obtained in this study further supports the use of LC-MSIMS for
the determination of illicit drugs due to the majority of such chemicals occurring
as charged species in solution.
Table 6.4: Method performance data.
Linearity Repeat. Reproduc. LOD LOQ Recovery Analyte -
R~ O ~ R S D %RSD pg note-' pg note-' %
Morphine 0.9945 2.54 3.98 22 74 26 f 3 Amphetamine 0.9898 5.18 6.80 1010 3367 64k7
MDMA 0.9976 4.02 7.02 195 651 48 k 17 Benzoylecgonine 0.9981 1.25 7.65 4 14 37 + 1
Ketamine 0.9995 3.00 8.58 18 60 65 f 1 Cocaine 0.9997 3.69 4.93 3 14 87 f 8 Heroin 0.9876 2.91 11.29 5 17 53 5 5
Cocaethylene 0.9991 4.79 9.66 5 17 54k9 LSD 0.9998 3.33 7.16 10 33 28 f 3
EDDP 0.9954 3.26 6.15 3 9 74+ 10 Papaverine 0.9873 8.09 11.97 4 15 79k9 Methadone 0.9995 2.97 4.51 9 31 - 4453
Temazepam 0.9998 4.69 6.81 2 1 71 32+2 Fluoxetine 0.9992 5.01 5.65 52 175 24f 4 Diazepam 0.9994 2.33 - 4.81 5 16 30f 6 A'-THC 0.9866 8.60 4.91 150 502 71 524
-Repeatability and reproducibility have been abbreviated for the purposes of fit.
The recovery of the test materials was also assessed using a similar
procedure to that as previously described by Esteve-Turrillas et a/. [7] Recovery
experiments were performed using €5 banknotes which were first extracted as
previously described (section 6.2.6) in order to avoid any possible cross
contamination (n = 3). The cleaned banknote was spiked with 125 ng of all
analytes prepared in MeOH, after sufficient drying time the note was extracted
and the percentage recovery was determined by comparing the peak areas
recorded for the spiked note with a standard injection. The percentage
recoveries were observed to vary for each analyte, with cocaine and methadone
demonstrating quite high levels of recovery, but analytes such as LSD and
diazepam exhibiting poor recovery from the banknote. The reason for the poor
recovery of some compounds compared to others, particularly those that are
structurally analogous, is unclear. As the majority of the test analytes are basic
in nature the possibility that mixed mode retention via adsorption and ion

exchange on the cotton surface of the banknote was investigated by using
MeOH containing either 0.1% vlv acetic acid or 0.1 % vlv ammonium hydroxide
in the extraction procedure. However, the inclusion of the acidic or basic
modifiers into the extraction solution had no positive affect on the determined
percentage recoveries and therefore, further research into extraction techniques
is recommended. It should, however, be mentioned that many of the test
analytes are administered or taken in tablet form and therefore, minimal residue
would be expected on banknotes in such cases.
6.3.6 Application to banknotes:
The developed LC-MSIMS method was then applied to the determination of
illicit drug and abused pharmaceutical residue contamination on Euro
banknotes. Where possible, notes of lrish origin were preferentially collected,
(serial numbers beginning with the lrish identifier, letter 'T'), in an attempt to
locally bias the sample, although it must be mentioned that the history of the
sampled notes is unknown and they may indeed been outside Ireland and used
in other Euro zone countries. New un-circulated €5, €10 and €20 notes were
also obtained from the bank to serve as method blanks. Samples were
extracted as previously described (section 6.2.6) and the re-constituted extracts
analysed using the developed LC-MSIMS method (section 6.2.4). Fig. 6.5
shows some typical chromatograms for used (A) 5 and (B) 20 Euro banknotes,
overlaid with chromatograms from un-circulated blanks.
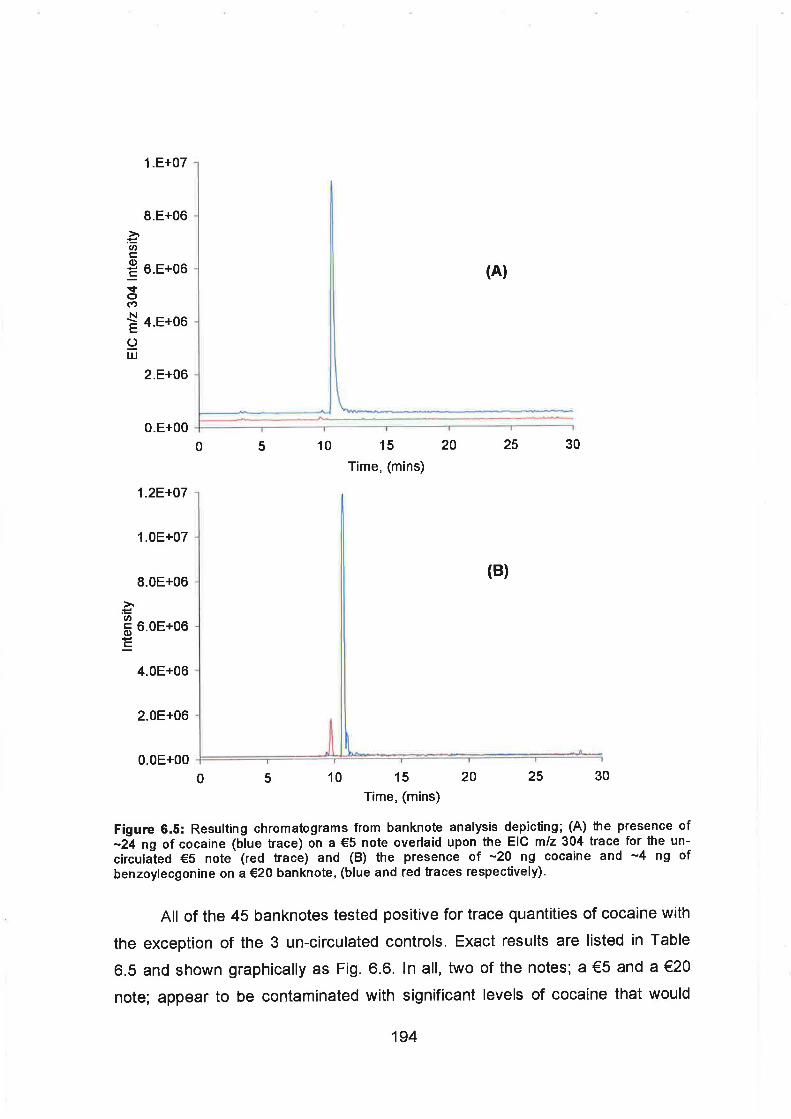
10 15 20
Time, (mins)
0 5 10 15 2 0 25 30 Time, (mins)
Figure 6.5: Resulting chromatograms from banknote analysis depicting; (A) the presence of -24 ng of cocaine (blue trace) on a €5 note overlaid upon the EIC mlz 304 trace for the un- circulated €5 note (red trace) and (B) the presence of -20 ng cocaine and -4 ng of benzoylecgonine on a €20 banknote, (blue and red traces respectively).
All of the 45 banknotes tested positive for trace quantities of cocaine with
the exception of the 3 un-circulated controls. Exact results are listed in Table
6.5 and shown graphically as Fig. 6.6. In all, two of the notes; a €5 and a €20
note; appear to be contaminated with significant levels of cocaine that would

suggest direct contact with the drug, either through drug dealing or more
probably when using the note to 'snort' the narcotic. From Fig. 6.6 it can be
seen that significantly higher average levels of cocaine are present on the
higher denomination notes compared to the smaller €5 and €10 banknotes. The
presence of benzoylecgonine, the primary breakdown product of cocaine,
suggests aging of the cocaine residue on the surface of the note, perhaps due
to hydrolysis of cocaine residues as a result of exposure to moisture. Although
not currently known, it is thought that the rate of cocaine breakdown and the
consequent rate of formation of benzoylecgonine could provide a time frame
concerning the contamination of the note with cocaine. However, the presence
of benzoylecgonine may also be due to contamination of the note via contact
with the urine of a cocaine user. Trace cocaine contamination on the remaining
notes is suspected to have occurred as a result of transfer during the counting
processes within financial institutions as previously demonstrated by Carter et
a/. [I 31.
Traces of heroin were also detected on three of the analysed notes along
with trace levels of cocaine, two €5 and one €10 note. The levels of heroin
detected were in one case less than the levels of cocaine, in one case
approximately equal and in the final case greater then the quantity of cocaine
determined.
Table 6.5: Banknote analysis.
Cocaine Benzoylecgonine Heroin Serial Number
(ng note-') (ng note-') (ng note-')
€5 Banknotes T15874943298- - - -
Un-circulated. T I 51 808431 02 0.20 + 0.01 - - TI5186514803 23.91 + 0.32 0.84 + 0.02 - T I 5051 087366 4.1 1 k 0.07 - - TI5250805205 0.09 k 0.01 - - T I 51 51331 679 2.39 + 0.12 - - T I 51 01 438289 0.43 + 0.1 3 - T I 51 371 12939 2.77 k 0.68 - - T I 561 3930023 0.35 + 0.06 - - T I 5229068657 0.67 + 0.1 0 - - T I 501 6543359 2.67 k 0.16 - -


5 Euro 10 Euro 20 Euro 50 Euro
1 5 9 13 17 1 5 9 1 5 9 1 3 5
Sample Number
Figure 6.6: Graphical representation of cocaine contamination on the analysed banknotes. The highest levels were detected on one €5 note and one €20 note as labelled in the above figure. It can also be seen that the levels of contamination are higher on the €20 and €50 notes than on the €5 and €1 0 notes.
6.4 Conclusions:
A highly sensitive and relatively rapid monolithic LC-MSIMS separation of illicit
drugs and abused pharmaceuticals preceded by simple sample preparation has
been developed and successfully applied for the determination of such
contamination on Irish Euro banknotes collected from a branch of a national
bank on the north side of the city. Trace levels of cocaine were found on all
notes tested. In some instances traces of benzoylecgonine, the breakdown
product of cocaine was also determined. Interestingly, traces of heroin were
also found on 3 of the 45 samples. The presence of such illicit material on the
studied banknote samples provides an indication of the presence of such
narcotics within the community. However, this initial study does not attempt to
draw sociological or geographical conclusions regarding the use of narcotics

within the community and therefore, any such conclusions should only be
considered with caution.
References:
1. M. O'Halloran, 'Cocaine seizures rise eight foldJ', The lrish Times, Saturday October 1" 2005.
2. 0. Kelly, "lllegal drugs trade worth E650 million annually", The lrish Times, Thursday December
22th 2005.
3. An Garda Siochana Annual Report 2005, 'Drug Offences Statistics', pages 65-69,
www.garda.ie/angarda/statistics/report2005.html, viewed July 27th 2006.
4. The National Advisory Committee on Drugs, 'An Overview of Cocaine use in Ireland', 2003,
available on-line www.nacd.ie/publicationslprevalence~cocaine.html, viewed July 27'h 2006.
5. E. Burke-Kennedy, 'Drug-use treatment outside East region soars', The lrish Times, July 2gth
2004.
6. J.C. Hudson, Journal of the Canadian Society of Forensic Science, 22, (1989), 203.
7. F.A. Esteve-Turrillas, S. Armenta, J. Moros, S. Garrigues, A. Pastor & M. de la Guardia, Journal
of Chromatography A, 1065, (2005), 321.
8. A.J. Jenkins, Forensic Science International, 121, (2001), 189.
9. D. Song, S. Zhang & K. Kohlhof, Journal of Chromatography A, 731, (1996), 355.
10. J. Oyler, W .D. Darwin & E.J. Cone, Journal of Analytical Toxicology, 20, (1 996), 213.
11. D. Paradis, RCMP Gazette, 59, (1997), 20.
12. K.A. Ebejer, J. Winn, J.F. Carter, R. Sleeman, J. Parker & F. Korber, Forensic Science
International, Article in press (2006), doi: 10.101 6/j.forsciint.2006.06.039.
13. J.F. Carter, R. Sleeman & J. Parry, Forensic Science International, 132, (2003), 106.
14. E. Zucatto, C. Chianbrando, S. Castiglioni, D. Calamari, R. Bagnati, S. Schiarea & R. Fanelli,
Environmental Health, 4, (2005), 14.
15. R. Sleeman, I. Fletcher, A. Burton, J.F. Carter & D.J. Roberts, Analyst, 124, (1999), 103.
16. K.A. Ebejer, R.G. Brereton, J.F. Carter, S.L. Ollerton & R. Sleeman, Rapid Communications in
Mass Spectrometry, 19, (2005), 21 37.
17. D.J. Roberts, J.F. Carter, R. Sleeman & I.F.A. Burton, Spectroscopy Europe, 916, (1997), 24.
18. Y. Xu, Y. Gao, H. Wei, Y. Du & E. Wang, Journal of Chromatography A, 11 15, (2006), 260.
19. M.A. Huestis & M.L. Smith, Drug Discovery Today: Technologies, 3, (2006), 49.
20. J.R. Mazzeo, U.D. Neue, M. Kele & R.S. Plumb, Analytical Chemistry, December 2005, 77,
460A.
21. H. Chen & C. Horvath, Journal of Chromatography A, 705, (1995), 3.
22. D.T.T. Nguyen, D. Guillarme, S. Rudaz & J-L. Veuthey, Journal of Separation Science, 29,
23. J.E. MacNair, K.C. Lewis & J.W. Jorgenson, Analytical Chemistry, 69, (1997), 983.

-- -
24. A. de Villiers, H. Lauer, R. Szucs, S. Goodall & P. Sandra, Journal of Chromatography A, 1113,
(2006), 84.
25. D.C. Harris, Journal of Chemical Education, 75, (1 998), 1 1 9.
26. K. Cabrera, Journal of Separation Science, 27, (2004), 843.
27. D.T.T. Nguyen, D. Guillarme, S. Rudaz & J-L. Veuthey, Journal of Chromatography A, 1128,
(2006), 105.
28. 0. Desrnet, P. Gzil & D. Clicq, LC-GC Europe, July 2005,403.
29. G. Desmet, P. Gzil, D. Cabooter & D. Clicq, The Kinetic Plot Method, available to download
from http://ww\Nir.vub.ac.be/chis/KineticPlot, last viewed 23rd October 2006.
30. G. Desmet, D. Clicq & P. Gzil, Analytical Chemistry, 777, (2005), 4058.
31. K.L. Ng, B. Paull, P.R. Haddad & K. Tanaka, Journal of ChromatographyA, 850, (1999), 17.
32. S. McClean, E.J. O'Kane & W.F. Srnyth, Electrophoresis, 21, (2000), 7381,
-
7.0 Using Environmental Analytical Data to Estimate
Levels of Community Consumption of I l l icit Drugs and
Abused Pharmaceuticals.
7.1 Introduction:
As mentioned previously in Section 6.1, there has of late, been increased media
attention concerning the escalating use of illicit drugs, in particular cocaine, by lrish
society [I]. Such media reports appear to be corroborated by official seizure data
from An Garda Siochana, wherein a search of press releases available through
their website reveals no less than eighteen major hauls of cannabis, cocaine,
opiates and amphetamines in the period of January to November 2006, including
the largest ever seizure of heroin in this country [2]. However, it was also
previously noted that current methods for the estimation of illicit drug use within
lrish society often suffer from significant shortcomings. For example, performing
surveys that focus upon specific subgroups known to abuse drugs, or attempting to
gauge cocaine abuse by measuring the numbers presenting themselves for
treatment for cocaine addiction into an opiate focused and ill-equipped system. Of
course, any information regarding the extent of the 'drug problem' in Ireland is
inherently valuable, especially to those governing the allocation of resources to
ensure adequate funding to the health services and law enforcement in order to aid
in combating a growing problem. However, the predicament exists that current
approaches to estimate drug consumption often, if not always, do not contain
information regarding the use of illicit drugs by social and recreational users and
hence, the picture of the 'drug problem' presented in the public domain may not
provide an accurate reflection of the actual state of affairs.
Several analytical procedures exist in the peer-reviewed literature for the
determination of illicit drugs. The majority of these methods are however, focused
on personal testing as part of usage or abstinence monitoring and toxicological
studies rather than community estimations of current usage. Due to the scope of
such studies the matrix investigated has always been biological in nature, spanning
across plasma and serum [3,4,5,6,7,8], to urine [9,10,11] and other bodily fluids
such as saliva and sweat [ I 2,13,14,15,16]. Hair analysis has also become a recent
focus in abstinence monitoring programs due to the ability to place a time frame to
usage periods in accordance with standard hair growth rates and consequently a
number of methods have also appeared detailing procedures for the determination
of illicit drug residues in hair [17,18,19,20,21]. To a lesser extent, reports for the
determination of mother to child substance transfer have also been published,
wherein meconium was the biological matrix under investigation [22,23]. A
common feature of the published methods is the widespread use of LC in
conjunction with either ESI or APCl with MSIMS detection allowing for separation
followed by unequivocal detection and the garnering of structural information.
Detailed discussions concerning the quality assurance of generated LC-MSIMS
data used for confirmatory analysis as part of monitoring and toxicological studies
have also been published [10,24]. However, although the above methods are all
suitably sensitive and selective for the analyte set investigated, all procedures rely
heavily upon invasive sampling procedures in order to determine the desired
information about the person under investigation.
In the past decade, a number of reports concerning the presence of
pharmaceuticals and other medicines in the aquatic environments have entered
the public domain, wherein classes of pharmaceuticals ranging from common over
the counter painkillers and analgesics such as ibuprofen and paracetamol to
specialist cytotoxic agents and x-ray contrast media have been detected in both
fresh and marine aquatic systems at trace and ultra-trace levels
[25,26,27,28,29,30]. In some instances the MECs demonstrated a statistical
relationship concerning the levels of the detected pharmaceutical in the
environment and that consumed by the population. For example Ashton et a/.
determined the levels of common pharmaceuticals, e.g. diclofenac, ibuprofen,
propranolol etc. in treated wastewater and also in the effluent receiving waters and
found that levels detected downstream of the wastewater treatment plant
statistically correlated to levels detected in the plant's discharged effluent and a
further statistical correlation may exist to actual levels of said drug usage within the
community [31].
20 1

The detection of pharmaceutically active compounds within the aquatic
environment as a direct result of treated wastewater discharge further highlights
the "intimate, immediate and inseparable relationship between humans and their
environment through personal use of chemicals" [32]. Daughton further
hypothesised that in a similar manner to medicinal compounds, residues of illicit
drugs may also be detected in the aquatic environment as a result of human usage
and hence, discharge of both parent compounds and metabolites into aquatic
systems is likely to occur via the municipal wastewater treatment system [32]. It is
also speculated that wastewater treatment plants are the primary emitters of such
compounds into the environment, as due to the effort, risk and cost involved in
obtaining and importing illicit drugs, improper disposal and dumping would not be
expected to occur.
The first report concerning the presence of illicit materials in treated
wastewater appeared in 2004, whereby low n g ~ - ' of methamphetamine and 3,4-
methylenedioxy methamphetamine (MDMA or 'ecstasy') were individually detected
in the effluent of two monitored wastewater treatment plants in Nevada and South
Carolina in the United States, respectively. Although no further research was
conducted in this instance, it was acknowledged that the detection of these two
illicit drugs corroborated evidence from the United States Drug Enforcement
Agency (USDEA) that both chemicals were becoming increasingly problematic in
the metropolitan areas surrounding the sampled plants [33]. More recently
amphetamine was also detected in sewage sludge by Austrian researchers in the
low C1gkg-' range, however, caution must be used when interpreting such results as
amphetamine and similar compounds may also be presented in wastewater
treatment plants as metabolites of prescription drugs used in the treatment of
Parkinson's disease [34].
It was also previously noted that the determination of illicit drug residues in
wastewater could provide an opportunity to non-invasively determine community
wide consumption of such substances. Pioneering research on this front was
published by Italian researchers in 2005 where levels of cocaine and its primary
metabolite, benzoylecgonine, detected in surface waters and treated wastewater
could be used to statistically estimate consumption of the parent narcotic within the
community under study [35]. The approach used was to convert MECs to daily
202

doses per thousand population equivalents (PEq) using available information
regarding the volume of wastewater through the treatment plant per day and a
correction factor of 2.33 to adjust benzoylecgonine MECs in favour of the parent
compound, cocaine [35]. Based upon their environmental monitoring data, Zucatto
et a/. estimated that on average within the general population approximately 7
doses per 1000 PEq were consumed daily which was further refined to 27 doses
per 1000 PEq aged in the range of 15-34 years [35]. This research received
considerable media attention and further sampling was also undertaken along the
River Thames in London, although the results of this study have not yet been
published, [36,37]. More recently a publication has emerged from the same group
where the levels of a broad suite of illicit drugs were determined using isotope
dilution LC-ESI-MSIMS in the treated effluents of wastewater treatment plants in
Milan, Italy and Lugano, Switzerland [38]. In both plants the majority of the target
analytes were detected in the influent samples, while reduced quantities were
detected in the treated effluent, suggesting the existence of removal mechanisms
with in the treatment plant. Interestingly, the Milan wastewater treatment plant
appeared to be extremely efficient at removing illicit drug residues with most
compounds, including cocaine, being removed . to levels below the LOQ of the
developed analytical method [38]. Although no 'community consumption'
calculations were reported in this publication, the authors acknowledge that the
results obtained could indeed be used to estimate levels of drug . . use within the
area under study.
The aims of this research are therefore, to develop a suitably sensitive
analytical method for the determination of illicit drug residues, in particular cocaine,
in treated wastewater and receiving waters using SPE-LC-MSIMS. Where residues
of illicit drugs are detected it is hoped to estimate community consumption data for
the said narcotic using the approach of Zucatto et a/. [35]. Treatment plants
identified for study include that in Ringsend, Dublin, Ireland, which currently serves
-1.7 million PEq along with smaller plants servi.ng areas in the north and south of
the capital city. Treated effluent from wastewater treatment plants in rapidly
expanding 'commuter' towns surrounding Dublin such as Navan, Co. Meath and
Leixlip, Co. Kildare were examined.
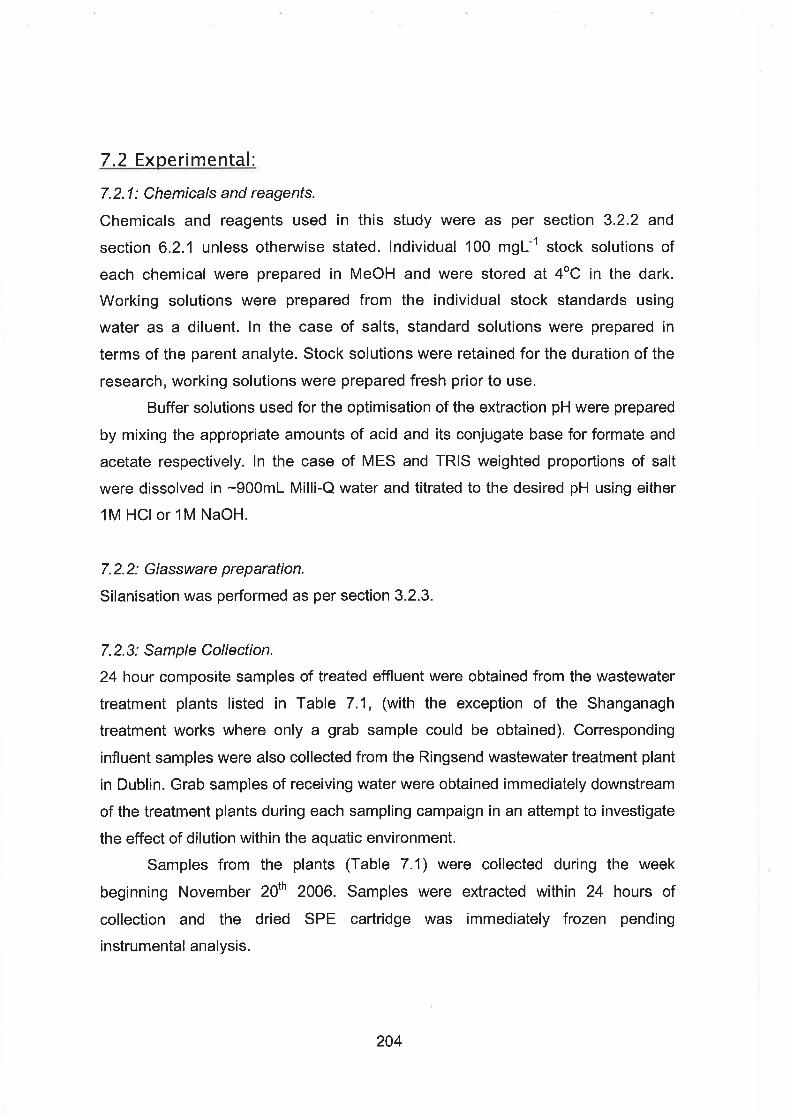
7.2 Experimental:
7.2. I : Chemicals and reagents.
Chemicals and reagents used in this study were as per section 3.2.2 and
section 6.2.1 unless otherwise stated. Individual 100 m g ~ - ' stock solutions of
each chemical were prepared in MeOH and were stored at 4OC in the dark.
Working solutions were prepared from the individual stock standards using
water as a diluent. In the case of salts, standard solutions were prepared in
terms of the parent analyte. Stock solutions were retained for the duration of the
research, working solutions were prepared fresh prior to use.
Buffer solutions used for the optimisation of the extraction pH were prepared
by mixing the appropriate amounts of acid and its conjugate base for formate and
acetate respectively. In the case of MES and TRlS weighted proportions of salt
were dissolved in -900mL Milli-Q water and titrated to the desired pH using either
1 M HCI or 1 M NaOH.
7.2.2: Glassware preparation.
Silanisation was performed as per section 3.2.3.
7.2.3: Sample Collection.
24 hour composite samples of treated effluent were obtained from the wastewater
treatment plants listed in Table 7.1, (with the exception of the Shanganagh
treatment works where only a grab sample could be obtained). Corresponding
influent samples were also collected from the Ringsend wastewater treatment plant
in Dublin. Grab samples of receiving water were obtained immediately downstream
of the treatment plants during each sampling campaign in an attempt to investigate
the effect of dilution within the aquatic environment.
Samples from the plants (Table 7.1) were collected during the week
beginning November 20" 2006. Samples were extracted within 24 hours of
collection and the dried SPE cartridge was immediately frozen pending
instrumental analysis.
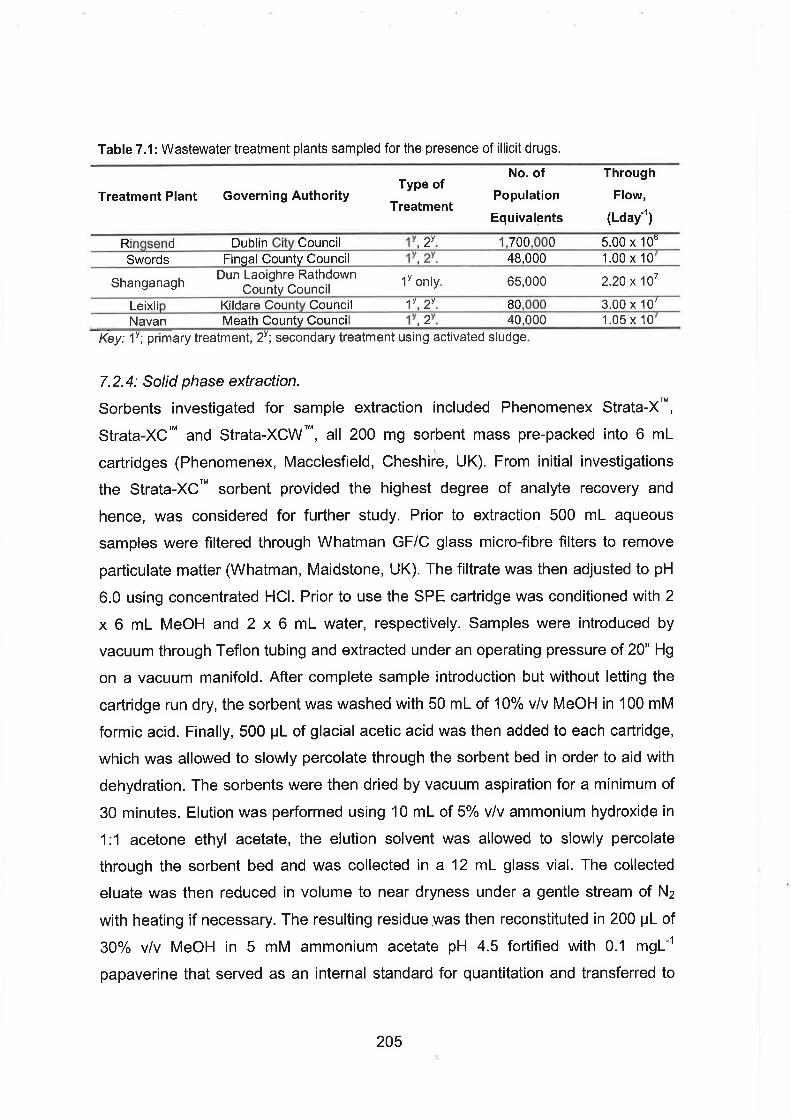
Table 7.1: Wastewater treatment plants sampled for the presence of illicit drugs.
No. of Through Tvae of -,r- - -
Treatment Plant Governing Authority Population Flow, Treatment
Equivalents (Lday")
Ringsend Dublin City Council IY, 2Y- 1,700,000 5.00 x 10' Swords Fingal County Council l Y , 2Y. 48,000 1 .OO x 10'
Dun Laoighre Rathdown Shanganagh County Council 1 only. 65,000 2.20 1 o7
Leixli 2 80,000 3.00 x 10 Navan Meath County Council IY, 2Y. 40,000 1.05 x 10'
Key: IY; primary treatment, 2y; secondary treatment using activated sludge.
7.2.4: Solid phase extraction.
Sorbents investigated for sample extraction included Phenomenex strata-xTM1
strata-xcTM and strata-XCW~", all 200 mg sorbent mass pre-packed into 6 mL
cartridges (Phenomenex, Macclesfield, hes shire, UK). From initial investigations
the strata-xcTM sorbent provided the highest degree of analyte recovery and
hence, was considered for further study. Prior to extraction 500 mL aqueous
samples were filtered through Whatman GFIC glass micro-fibre filters to remove
particulate matter (Whatman, Maidstone, UK). The filtrate was then adjusted to pH
6.0 using concentrated HCI. Prior to use the SPE cartridge was conditioned with 2
x 6 mL MeOH and 2 x 6 mL water, respectively. Samples were introduced by
vacuum through Teflon tubing and extracted under an operating pressure of 20" Hg
on a vacuum manifold. After complete sample introduction but without letting the
cartridge run dry, the sorbent was washed with 50 mL of 10% v/v MeOH in 100 mM
formic acid. Finally, 500 pL of glacial acetic acid was then added to each cartridge,
which was allowed to slowly percolate through the sorbent bed in order to aid with
dehydration. The sorbents were then dried by vacuum aspiration for a minimum of
30 minutes. Elution was performed using 10 mL of 5% vlv ammonium hydroxide in
1:l acetone ethyl acetate, the elution solvent was allowed to slowly percolate
through the sorbent bed and was collected in a 12 mL glass vial. The collected
eluate was then reduced in volume to near dryness under a gentle stream of N2
with heating if necessary. The resulting residue was then reconstituted in 200 pL of
30% vlv MeOH in 5 mM ammonium acetate pH 4.5 fortified with 0.1 m g ~ - '
papaverine that served as an internal standard for quantitation and transferred to

an autosampler vial containing a low volume polypropylene insert for LC-MSIMS
analysis.
7.2.5: Liquid chromatography tandem mass spectrometry.
LC-MSIMS analyses were performed as described in section 6.3.4. The optimised
ion optic parameters were as previously reported in Table 6.2; the nebuliser
pressure was set at 30.0 psi with a dry gas (N2) flow rate of 8.0 ~ m i n ' and a drying
temperature of 325OC. MSIMS transitions monitored were previously mentioned in
Table 6.3. Product ion MSIMS transitions were used for qualitative confirmation,
quantitation was also performed using the area from the resulting product ion peak.
Analytical separations were performed on a 200.0 x 3.0 mm i.d. Phenomenex Onyx
monolithic CAB column, (Phenomenex, Macclesfield, Cheshire, UK) using the multi-
step linear gradient of MeOH and 5 mM ammonium acetate pH 4.5 developed in
Chapter 6.0.
7 .3 Results & Discussion:
7.3. I SPE sorbent selection:
The illicit drugs and abused pharmaceuticals chosen for study comprise a set of
analytes that are weak to moderately basic, with the exception of A'-THC which is
uncharged and also span across a broad range of polarities as can be seen from
the pK, and the octanol water partition coefficient data (Log P) values in Table 7.2
following.
Due to the expectation that the majority of the chosen analytes would be
presumed to exist in their protonated cationic form in solution mixed mode cation
exchange sorbents, both weak and strong, were investigated along with the
previously used hydrophilic lipophilic balanced polymeric sorbent. The sorbents
used were from the Phenomenex Strata-X family of polymeric functionalised
phases for analyte enrichment, the structures of which are shown in Fig. 7.1.

Fig. 7.1: The structure of (A) the Phenomenex strata-xrn hydrophilic lipophilic bilanced polymeric sorbent, (B) the additional strong cation exchange functicnality of the Strata-XC sorbent and (C) the weak cation exchange functionality of the Strata-XCW sorbent [55].
Table 7.2: pK, and Log P, (as theoretically calculated XLogP) data for the selected illicit drugs and pharmaceutical anal ytes.
Analyte PKa Log P
Morphine 9.85 [39] 0.96 [40] Amphetamine 9.80 1411 1.76 I421
MQMA 9.90 [43] -0.32 [44] BenzoyJecgonine 2.25. 11.2 1451 1.29 [46]
Ketamine 7.50 (471 2.88 [42] Cocaine 8.60 [48] 2.31 [42] Heroin 7.60 [49] 1.69 [42]
Cocaet hylene LSD 7.80 [501 2.10 [42]
In order to ascertain which of the above sorbents provided the highest
degree of analyte recovery, a 500 mL aliquot of a 2 p g ~ ' mixed analyte spiked
solution prepared in reagent water was extracted using each of the above
sorbents. The solution pH was adjusted to pH 7.0, 2.0 and 5.0 for the strata-x",
strata-xcTM and strata-xcwTM sorbents, respectively. Elution was performed using
10 mL of MeOH or in the case of the mixed mode cation exchange sorbents, 10 mL
of 5% vlv ammonium hydroxide in MeOH. The percentage analyte recovery in each
Methadone 9.10 [51] 3.92 EDDP - 4.76
Pa averlne
instance was determined by comparison of the resulting peak areas with those of a
directly injected 2 m g ~ - ' mixed standard, see Table 7.3.
:42] 1421
Temazoparn 2.99 [42] Fluoxetine 7.37, 4.69 [53] 4.65 [42] Diazepam 3.40 [57] 2.92 [42] A ~ T H C 10.60 [54] 6.48 1421

Table 7.3: Initial sorbent selection investigations. Calculated analyte recovery for a 2 p g ~ - l mixed spike using the sorbents and conditions mentioned within the text, (values quoted are mean Oh recovery k standard deviation, n = 3).
Analyte Strata-X Strata-XC Strata-XCW
Morphine 143f 7 124+6 A m p h e t a m i n e 0
MDMA 44 + 1 88 + 1 75 f 5 Benzoylecgonine 78k2 70f2 58 f 1 -
Ketamine 70f3 89 + 5 66+2 Cocaine 102k 1 115_+1 94f 2 Heroin 22 + 1 26 f 1 13k1
Cocaethylene 94 + 1 106+2 91f2 LSD 56 + 4 52 f 1 57 k 1
Methadone 29 k 1 97 + 1 71 1 Temazepam 84f 1 80 + 1 73 + 1 Fluoxetine 30 + 1 71 _ + I 61 _+ 1 Diazepam 82 + 1 81 +I 70 + 1 8"-THC - -
From Table 7.3 it can be seen that the highest degree of analyte recovery
was achieved when using the strata-xcTM mixed mode string cation exchange
sorbent with acceptably high recovery of all analytes with the exception of heroin.
Although it cannot be said with certainty, it is assumed that heroin hydrolysed to
morphine under the acidic conditions used, hence the excessive recovery of
morphine. The sorbent selection study was performed using LC with UV detection
at 230 nm and therefore, the cases in which analyte recovery greater then 100%
may have arisen due to co-elution with unknown peaks. High levels of analyte
recovery were also achieved with the weak mixed mode strata-xcwTM sorbent.
However, recovery was generally less than the strata-xcTM sorbent with the
exception of LSD where results achieved with the three investigated sorbents were
similar. When using the strata-xTM sorbent, which exploits both reversed-phase and
hydrogen bonding as mechanisms of retention, analyte retention can be observed
to increase with increasing levels of hydrophobicity. Analytes such as MDMA and
methadone, which are expected to exist as cations in solution under the
experimental conditions exhibited low levels of retention as expected. It must also
be mentioned that EDDP was not included in the above study as it was received at
a later date. In all cases no appreciable recovery of both amphetamine and A'-THC
was achieved. Although the reasons for such are not inherently clear, it has
previously been noted that amphetamine is readily purged from solution during

solvent evaporation using nitrogen and often requires acidification of the elution
solvent in order to prevent such effects [34]. A'-THC was expected to be neutral in
solution under the experimental conditions, the reported pK, value corresponds to
the dissociation of the phenolic group of the molecule, and therefore, retention was
expected when using the Strata-X sorbent. A'-THC exhibits high retention during
the chromatographic analysis and therefore, the possibility of excessive retention
on the extraction sorbent was investigated. However, when the Strata-X sorbent
was eluted with larger volumes of solvent, still no recovery of A'-THC was noted.
As a result of these observations both amphetamine and A'-THC were omitted
from further study as their enrichment appeared unfeasible using the SPE
approach.
7.3.2 Elution solvent selection:
As the chosen Strata-XC sorbent contains the same sorbent 'backbone' as the
Strata-X sorbent which was previously used for the enrichment of pharmaceutical
residues in Chapter 3.0, it was decided to investigate whether the elution solvent of
5% vlv ammonium hydroxide in MeOH as recommended by the product literature
[55] could be replaced with 5% vlv ammonium hydroxide in 1:l acetone ethyl
acetate as used previously due to both the increased solvent strength and ease at
which the acetone ethyl acetate mixture can be reduced in volume under nitrogen.
To determine which solvent system provided the optimum levels of analyte
recovery, 1 p g ~ - l spiked solutions of chosen analytes prepared in reagent water
were adjusted to pH 2.0 using HCI and extracted using the selected Strata-XC
sorbent. After complete sample introduction and sorbent drying SPE cartridges
were individually eluted with 10 mL the aforementioned solvent systems that were
then reduced in volume under nitrogen, reconstituted in internal standard solution
and analysed using LC-MSIMS. Analyte recovery was determined by comparison
with the resulting peak areas of a directly injected 1 mgL-' mixed standard, see
Table 7.4.

Table 7.4: Calculated analyte recovery for the optimisation of the elution solvent.
Analyte 5% vlv NH40H in 1 :1 Acetone
5% vlv NH40H in MeOH Ethyl Acetate
Morphine 53 8 MDMA 107 60 . . . - . . . . . - -
122 - Ketamine 132 109 Cocaine 164 87 Heroin 0 27 . . - . - . . . -
Cocaethylene 100 73 LSD 33 43
EDDP 62 62 Methadone 93 83 Fluoxetine 31 36
Temazepam 8 1 - 90 Diazepam 83 77
In most instances, analyte recovery was again acceptably and comparably
high. However, recoveries obtained when using 5% vlv NH40H in MeOH were in
some instances excessively high, for example, in the case of cocaine, which was
almost double that obtained when using the 5% vlv NH40H in 1:l acetone ethyl
acetate elution solvent system. Another observation noted was that there was no
recovery of heroin when using 5% vlv NH40H in MeOH. In an attempt to ascertain
whether or not there was a significant difference between the levels of analyte
recovery obtained using both solvent systems a students t-test was performed
using Microsoft Excel assuming unequal variances, (after a previously performed
F-Test, wherein Fexperimental 0.669 was found to be greater than Fcritical 0.403 at the
95% level of confidence). From the performed t-Test it was found that there was no
significant difference between the levels of analyte recovery obtained using either
elution solvent system, (tmperimental 0.765 < tcritical 2.052 at the 95% level of
confidence) and therefore, for all subsequent investigations elution was performed
using 5% vlv NH40H in 1 :I acetone ethyl acetate.
Having selected the elution solvent, the minimum volume of solvent required
for complete analyte elution was then determined. A Strata-XC cartridge was
successively eluted with fifteen 1 mL portions of 5% vlv NH40H in 1: l acetone
ethyl acetate, each of which in turn was reduced in volume under nitrogen,
reconstituted and analysed using LC-MSIMS. The relative recovery of each analyte
was determined and plotted against the volume of elution solvent as depicted in

Fig. 7.2. For the purposes of clarity Fig. 7.2 has been simplified and only depicts
the resulting elution profiles of cocaine, methadone and temazepam, however,
identical traces were recorded in the case of all of the investigated analytes. From
Fig. 7.2 it can be seen that 8 mL of solvent is sufficient to remove all retained
analyte from the sorbent bed, however, an elution volume of 10 mL was chosen for
all further investigations in order to ensure completeness.
6 8 10 Elution Volume (mL)
Figure 7.2: Plot of % relative recovery versus SPE elution volume using Strata-XC SPE cadridges and elution with 5% v/v NH40H in 1 :I acetone ethyl acetate. Key: black trace; methadone, blue lrace; cocaine, red trace; temazepam.
7.3.3 Extraction pH optimisation:
The pH of the extraction solution was next optimised in order to determine the
sample loading pH that provided the highest levels of analyte recovery. 500 mL
aliquots of 1 pg~ - l spiked solutions were prepared in 10 mM buffer solutions and
extracted using the strata-xcTM sorbent. Extractions were performed at pH 2 using
reagent water adjusted with HCI, pH 3 and 4 using ammonium formate buffer, pH 5
using ammonium acetate buffer, pH 6 and 7 using MES and pH 8 using TRIS. After
elution with 10 mL of 5% v h NH40H in 1: l acetone ethyl acetate, solvent removal
and reconstitution, the extract was analysed using LC-MSIMS and as before, the
levels of analyte recovery were determined by area comparison with a 1 mgl-'
standard, the calculated recovery values are inserted as Table 7.5.
21 1

Table 7.5: Recovery data for extraction pH optimisation. % Recoverv
Analyte pH 2 pH 3 pH 4 pH 5 pH 6 pH 7 pH 8
Morphine 5 6 16 2 6 7 14 MDMA 62 45 55 67 62 62 - 38
Benzoylecgonine 113 90 112 99 81 106 55 Ketarnine 70 61 62 71 70 68 73 Cocaine 11 15 7 33 54 49 0 Heroin 22 11 5 33 56 55 0
Cocaethylene 36 38 31 57 69 69 2 LSD 40 46 48 48 60 60 88
EDDP 5 1 40 39 62 63 40 45 Methadone 60 63 59 74 76 74 43 Fluoxetine 43 25 32 4 1 47 52 17
Temazepam 79 7 1 87 81 82 92 61 Diazepam 78 72 85 85 82 94 71
Analyte recovery was observed to vary quite significantly with the pH of the
extraction solution and in most instances there appears to be no significant trend
between the determined levels of analyte recovery and the pH at which the
extraction was performed. It was expected that recovery would increase with
deceasing solution pH as all analytes under investigation are weakly basic and
therefore, by lowering the solution pH they should become positively charged,
thereby facilitating increased interaction with the mixed mode cation exchange
strata-xcTM sorbent. Such an effect was expected to be of particular significance
for benzoylecgonine, which exists as a zwitterion in neutral solution, whereby
performing the extraction at an acidic pH should result in protonation of the acidic
functionality of the molecule (pK, 2.25) and therefore, minimise any possible
electrostatic repulsion from the similarly charged sulphonic acid functionality of the
extraction sorbent. However, such an effect appears to be absent, with acceptably
high recovery of benzoylecgonine determined at investigated pH values in the
range of pH 2.0-7.0.
Upon examination of the recovery data in Table 7.5, it was decided that pH
6.0 appeared to be the optimum pH for sample extraction, as levels of recovery for
the majority of the chosen analytes were acceptable. It must be mentioned that the
recovery of both morphine and fluoxetine was particularly low in all instances.
Morphine is a hydrophilic basic compound and it is thought that significant
breakthrough of retained morphine occurred from the sorbent during the extraction.
Fluoxetine on the contrary is weakly basic and relatively non polar and therefore, it
was expected that higher levels of recovery would be achieved under the
experimental conditions employed. In other cases where recovery was found to be
less that 70% it was hoped that desired levels of analytical sensitivity would still be
achieved when using the previously developed LC-MSIMS method for the
determination of preconcentrated residues.
7.3.4 Matrix removal using selective washing:
Having optimised the SPE loading and elution procedures attention was then
focused upon the development of a selective washing step in order to achieve
cleaner 'matrix free' extracts. The approach undertaken focused upon the
determination of the volume of wash solution to which the retained analytes could
be exposed without the occurrence of significant breakthrough and hence, analyte
loss from the sorbent bed. From the product literature it was recommended that
washing be performed with solutions containing low proportions of organic solvent
and also when using mixed mode cation exchangers the wash solution should also
be acidic in order to 'lock' retained basic analytes onto the sulphonic acid sorbent
[55]. Based upon these guidelines, the wash solvent investigated was a solution of
10% vlv MeOH in 0.1 M formic acid. In order to examine the effect this solution on
the retained analytes, a 500 mL aliquot of a 5 p g ~ - l spiked solution, prepared in
MES buffer pH 6.0, was extracted using the strata-XC'" SPE cartridges. The
spiking level was deliberately higher than usually used during method development
so as any analyte breakthrough during the sorbent washing procedure was clearly
detectable upon LC-MSIMS analysis. Without allowing the cartridge run dry, the
sorbent was successively washed with twenty 1 mL portions of the wash solution,
each of which was collected and individually determined using LC-MSIMS. After
washing the sorbent with the first 20 mL of wash solution, a further 3 x 10 mL
washings were performed leading to a total of 50 mL solvent washing altogether.
The final mL of wash solution was collected and analysed in each of these
instances. Upon complete sorbent washing, 500 pL of glacial acetic acid were then
added to the sorbent and allowed to percolate slowly through the packed bed in
order to aid with drying. In an attempt to ascertain as to whether or not the addition
of the glacial acetic acid had any effect upon analyte retention, the 500 pL portion
added was also collected and subsequently determined using LC-MSIMS.
The ElCs for both the pseudomolecular ion and the MSIMS product ion
transitions were generated for each of the test analytes in all of the determined
wash solutions and also the 500 pL addition of glacial acetic acid. However, no
traces of any analyte were detected in any of the collected wash solution fractions.
Based upon this finding it was suggested that the sorbent could be washed with 50
mL of the 10% v/v MeOH in 0.1 M formic acid solution without any significant
analyte loss. Knowing the minimum volume of wash solvent that could be applied
to the sorbent bed, the effect of washing upon a real sample matrix, in this case
river water collected from the River Boyne, near Navan, Co. Meath, Ireland was
then investigated. Fig. 7.3 depicts the resulting chromatogram for a 200 ng~ - ' spike
in river water adjusted to pH 6.0.
From Fig. 7.3 it can clearly be seen that the washing procedure appears to
be highly effective in removing any retained matrix components as large
distinguished peaks, corresponding to the MSIMS product ion transitions, can
easily be detected at a low spiking level in a real sample matrix. It is worth noting
that the recorded baseline in each EIC is extremely stable and relatively free of
noise, therefore, it was hoped that high levels of analytical sensitivity could be
achieved, even when using a moderate sample size of 500 mL.

O.OE+OO 1 I I I I I
0 5 10 15 20 25
Time, (mins)
Figure 7.3: Extracted ion chromatograms for a 200 n g ~ ' mixed analyte spike solution prepared in river water collected from the River Boyne. Peak identification: 1 Morphine mlz 286 - rnlz 268, TR 4.1 mins; 2 MDMA rnlz 194 - rnlz 163, TR 8.6 mins; 3 Benzoylecgonine rnlz 290 - m/z 168, TR 9.7 mins; 4 Ketamine mlz 238 - rnlz 220, TR 10.0 mins; 5 Cocaine rnlz 304 - mlz 182, TR 10.2 mins; 6 Cocaethylene rnlz 318 - rnlz 196, TR 11.5 mins; 7 LSD mlz 324 - rnlz 223, TR 11.8 mins; 8 EDDP m/z 278 - rnlz 249, TR 12.5 mins; 9 Papaverine (Internal Standard) mlz 340 - m/z 202, TR 13.9 mins; 10 Methadone rnlz 310 - rnlz 265, TR 16.8 mins; 11 Temazepam m/z 301 - rnlz 283, TR 17.9 mins; 12 Fluoxetine rnlz 301 - rnlz 148, TR 18.3 mins; 13 Diazepam rnlz 285 - rnlz 257, TR 20.0 mins.
7.3.5 Method performance:
Prior to application, the performance characteristics of the developed SPE LC-
MSIMS method were determined using Boyne river water as a sample matrix.
Linearity was assessed using seven point curves prepared by extracting mixed
analyte spike solutions in the region of 0.01 to 1 p g ~ " (concentrations quoted are
those prior to extraction). Repeatability was determined by performing six replicate
injections of a 0.20 pgL-' mixed extract while reproducibility was examined using
six individually extracted 1 pgL-' mixed analyte solutions. The limits of detection
and quantitation were defined as signals corresponding to 3 and 100 respectively
of the baseline noise in each of the extracted MSIMS production ion transition
traces. The determined performance characteristics are listed in Table 7.6.
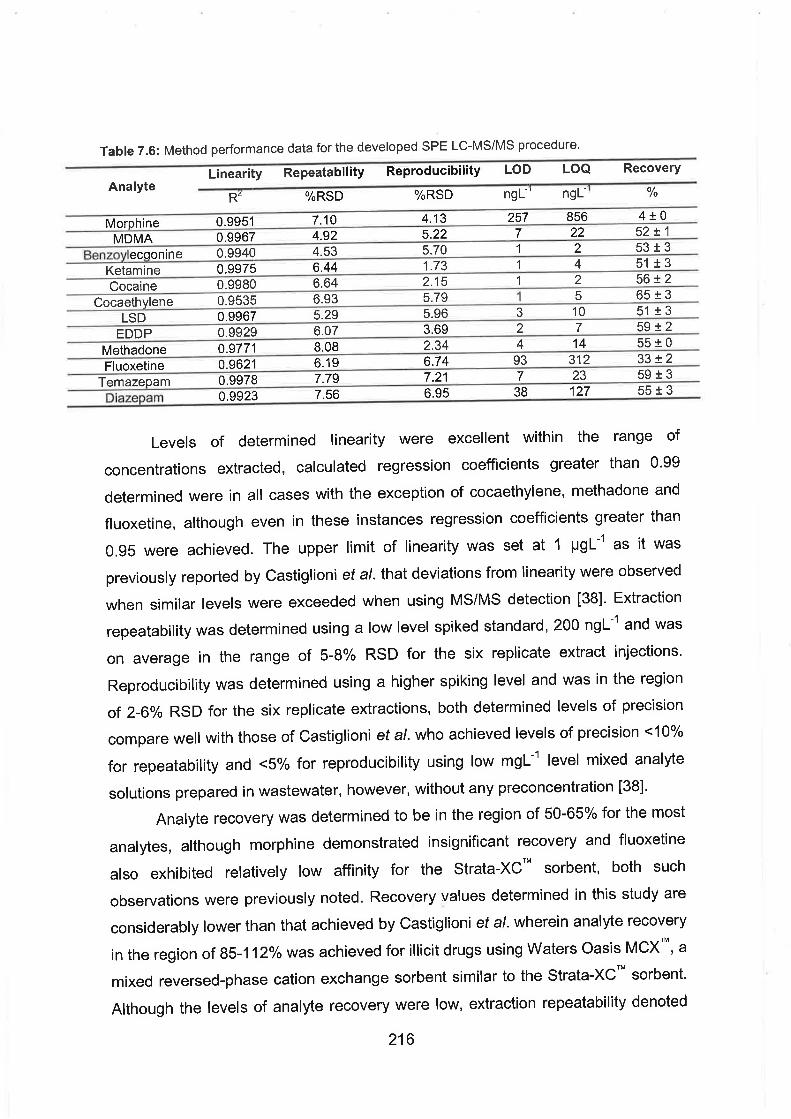
Table 7.6: Method performance data for the developed SPE LC-MSIMS procedure.
Linearity Repeatability Reproducibility LOD LOQ Recovery Analyte
R~ %RSD %RSD n g ~ ' n g ~ ' YO
Morphine 0.9951 7.10 4.13 257 856 4 k O MDMA 0.9967 4.92 5.22 7 22 52 k 1
Benzoylecgonine 0.9940 4.53 5.70 1 2 53 + 3 Ketamine 0.9975 6.44 1.73 1 4 51 f 3 Cocaine 0.9980 6.64 2.15 1 2 56 + 2
Cocaethylene 0.9535 6.93 5.79 1 5 65 + 3 LSD 0.9967 5.29 5.96 3 10 51 k 3
EDDP 0.9929 6.07 3.69 2 7 59 k 2 Methadone 0.9771 8.08 2.34 4 14 55 k 0 Fluoxetine 0.9621 6.19 6.74 93 312 3 3 k 2
Temazepam 0.9978 7.79 7.21 7 23 59 k 3 Diazepam 0.9923 7.56 6.95 38 127 55 k 3
Levels of determined linearity were excellent within the range of
concentrations extracted, calculated regression coefficients greater than 0.99
determined were in all cases with the exception of cocaethylene, methadone and
fluoxetine, although even in these instances regression coefficients greater than
0.95 were achieved. The upper limit of linearity was set at 1 CIg~-l as it was
previously reported by Castiglioni et a/. that deviations from linearity were observed
when similar levels were exceeded when using MSIMS detection [38]. Extraction
repeatability was determined using a low level spiked standard, 200 n g ~ " and was
on average in the range of 5-8% RSD for the six replicate extract injections.
Reproducibility was determined using a higher spiking level and was in the region
of 2-6% RSD for the six replicate extractions, both determined levels of precision
compare well with those of Castiglioni et a/. who achieved levels of precision 4 0 %
for repeatability and 4% for reproducibility using low rng~- ' level mixed analyte
solutions prepared in wastewater, however, without any preconcentration [38].
Analyte recovery was determined to be in the region of 50-65% for the most
analytes, although morphine demonstrated insignificant recovery and fluoxetine
also exhibited relatively low affinity for the strata-xcTM sorbent, both such
observations were previously noted. Recovery values determined in this study are
considerably lower than that achieved by Castiglioni et a/. wherein analyte recovery
in the region of 85-1 12% was achieved for illicit drugs using Waters Oasis MCX'~, a
mixed reversed-phase cation exchange sorbent similar to the strata-XC" sorbent.
Although the levels of analyte recovery were low, extraction repeatability denoted

by the quoted standard deviation values in Table 7.6 were acceptable. The reason
for the determined low levels of analyte recovery is not clear, although, the use of
the large volume of wash solvent appears not to be to blame, as no breakthrough
from the sorbent was determined during the development of the selective washing
step.
An unfortunate consequence of the low levels of analyte recovery was a
possible limitation on the levels of analytical sensitivity attainable during the study.
However, it should be noted from Table 7.6 that the levels of analytical sensitivity
obtained are still suitable for the determination of ultra-trace quantities of any illicit
drug residues that may be present in wastewater and surface waters, even when
using a moderate sample volume of 500 mL. Detection limits presented in Table
7.6, calculated as 30 of the peak-to-peak baseline noise in each of the extracted
ion chromatograms for each analyte MSIMS transition using river water as a
sample matrix were all found to lie in the low n g ~ ' region. LODs calculated
compare favourably with those achieved by both Zucatto et a/. and Castiglioni et a/.
who then successfully determined residues of illicit drugs in treated wastewater and
surface water in both Italy and Switzerland [35,38]. Again the LODs for morphine
and fluoxetine are higher than those achieved for other analytes but this is directly
attributed to their low levels of recovery during the extractive enrichment step. The
calculated LOD for diazepam was also high. It is thought that this is due to the low
intensity of the rnlz 257 MSlMS product ion. However, similar sensitivity data was
obtained when calculated using the EIC for the pseudomolecular ion; mlz 285,
(LOD: 36 ng~- ' , LOQ: 120 ng~ - ' ) and therefore, due to the higher level of specificity
imparted, it is recommended that the MSlMS product ion would still be used for all
quantitative purposes.
7.3.6 Determination of illicit drug residues in wastewater and surface waters:
The developed analytical method was then applied for the determination of illicit
drug residues in wastewater treatment plants and their receiving waters in Dublin
and also in the surrounding counties of Meath and Kildare, both of which have
experienced large increases in population in the last decade. In Dublin, wastewater
treatment plants investigated included the Ringsend Wastewater Treatment Works
which is located at the mouth of the River Liffey on the south side of Dublin Bay
21 7
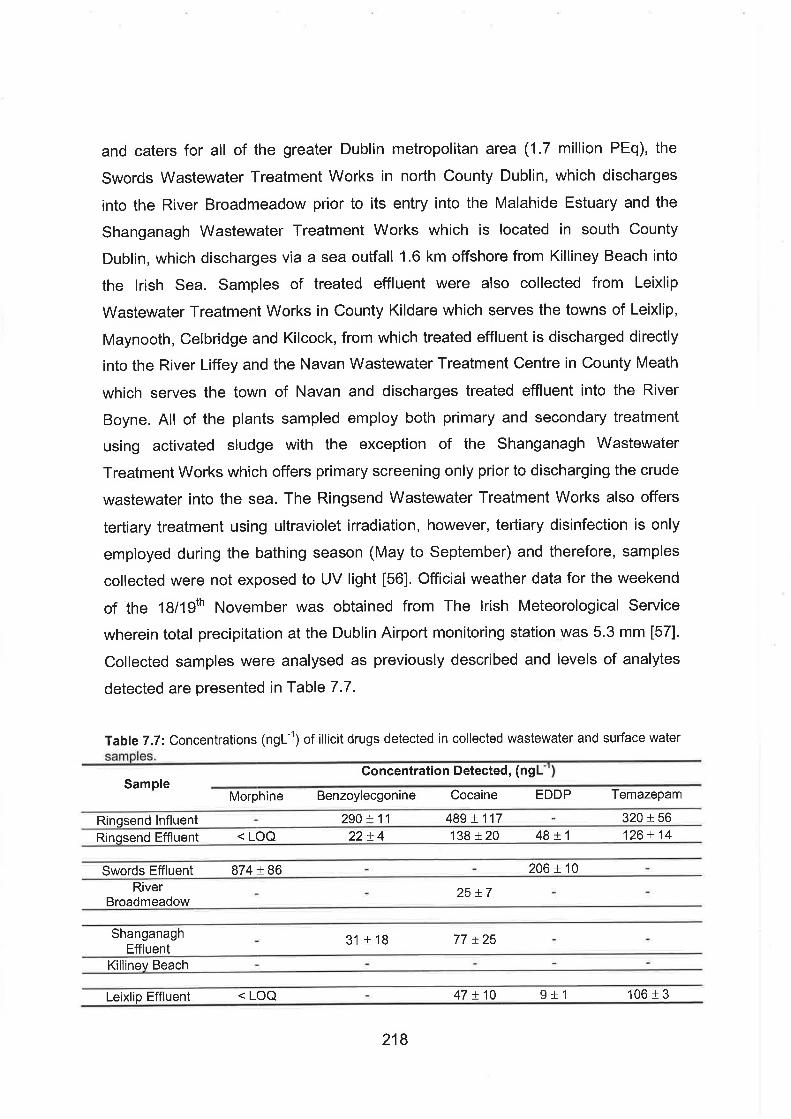
and caters for all of the greater Dublin metropolitan area (1.7 million PEq), the
Swords Wastewater Treatment Works in north County Dublin, which discharges
into the River Broadmeadow prior to its entry into the Malahide Estuary and the
Shanganagh Wastewater Treatment Works which is located in south County
Dublin, which discharges via a sea ouffall 1.6 km offshore from Killiney Beach into
the lrish Sea. Samples of treated effluent were also collected from Leixlip
Wastewater Treatment Works in County Kildare which serves the towns of Leixlip,
Maynooth, Celbridge and Kilcock, from which treated effluent is discharged directly
into the River Liffey and the Navan Wastewater Treatment Centre in County Meath
which serves the town of Navan and discharges treated effluent into the River
Boyne. All of the plants sampled employ both primary and secondary treatment
using activated sludge with the exception of the Shanganagh Wastewater
Treatment Works which offers primary screening only prior to discharging the crude
wastewater into the sea. The Ringsend Wastewater Treatment Works also offers
tertiary treatment using ultraviolet irradiation, however, tertiary disinfection is only
employed during the bathing season (May to September) and therefore, samples
collected were not exposed to UV light [56]. Official weather data for the weekend
of the 18119'~ November was obtained from The lrish Meteorological Service
wherein total precipitation at the Dublin Airport monitoring station was 5.3 mm [57].
Collected samples were analysed as previously described and levels of analytes
detected are presented in Table 7.7.
Table 7.7: Concentrations (ng~- ' ) of illicit drugs detected in collected wastewater and surface water samples.
Concentration Detected. ~na l " l a , " .
Sample Morphine Benzoylecgonine Cocaine EDDP Temazepam
Ringsend Influent - 290 + 1 1 489 k 117 320 + 56 Ringsend Effluent < LOQ 22 +4 138 f 20 48 f I 126 k 14
Swords Effluent 874 + 86 - 206 5 10 - River - - 25+7 - -
Broadmeadow
Shanganagh 31 -1 18 77 f 25 - Effluent Killiney Beach - - - - Leixlip Effluent < LOQ - 47k 10 951 106 k3

River Liffey 33k11 - - Navan Effluent 452 + 86 - 111_+15 67_+10 - River Boyne - * *
From the list of selected analytes only morphine, benzoylecgonine, cocaine,
EDDP and temazepam were detected in the collected wastewater and surface
water samples. Morphine was detected in relatively high concentrations in the
treated effluents of the Swords and Navan wastewater treatment plants. However,
such levels are more likely to be attributable to medicinal use of morphine and
related opiates rather than consumption of illicit heroin. Morphine was not detected
in the influent of the Ringsend Wastewater Treatment Works but was present at a
detectable level below the LOQ in the corresponding effluent sample. Such an
observation may occur due to cleavage of glucuronide metabolites of morphine
during the treatment process [26,38].
Benzoylecgonine and cocaine were detected in both the influent and effluent
samples of the Ringsend Wastewater Treatment Works and also in the grab
sample collected from the Shanganagh Wastewater Treatment Works. Cocaine
was also detected at low n g ~ - ' levels in the treated effluent of the Navan and
Leixlip treatment plants. The presence of cocaine and its primary urinary metabolite
benzoylecgonine provides a reliable indication of human consumption of cocaine.
However, unlike previous reports from Zucatto et a/. and Castiglioni et a/. the levels
of cocaine detected in the present study were higher than those of
benzoylecgonine [35,38]. Previous pharmacokinetic studies reveal that cocaine is
readily metabolised into benzoylecgonine and therefore, it was expected that
higher quantities of benzoylecgonine should be present compared to those of
cocaine [58]. A reason for the low levels of benzoylecgonine detected may be due
to higher rates of removal via either degradation or sorption during the treatment
process compared to cocaine. Based upon the levels of both benzoylecgonine and
cocaine detected in the influent and effluent of the Ringsend Wastewater
Treatment Works it is estimated that the removal rates within the plant on the day
of sampling were 93% and 72% for benzoylecgonine and cocaine, respectively.
Levels detected compare well with those reported by Castiglioni et a/. when
analysing the effluents of wastewater treatment plants in Italy and Switzerland [38].
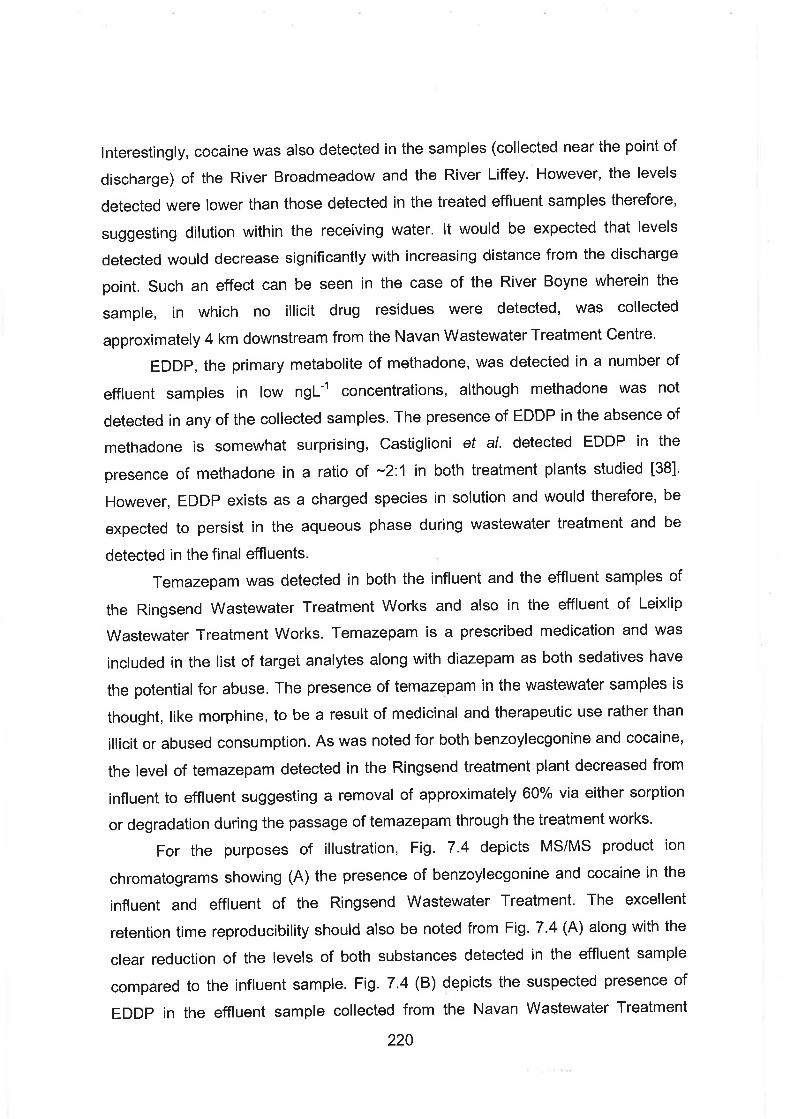
Interestingly, cocaine was also detected in the samples (collected near the point of
discharge) of the River Broadmeadow and the River Liffey. However, the levels
detected were lower than those detected in the treated effluent samples therefore,
suggesting dilution within the receiving water. It would be expected that levels
detected would decrease significantly with increasing distance from the discharge
point. Such an effect can be seen in the case of the River Boyne wherein the
sample, in which no illicit drug residues were detected, was collected
approximately 4 km downstream from the Navan Wastewater Treatment Centre.
EDDP, the primary metabolite of methadone, was detected in a number of
effluent samples in low n g ~ - ' concentrations, although methadone was not
detected in any of the collected samples. The presence of EDDP in the absence of
methadone is somewhat surprising, Castiglioni et a/. detected EDDP in the
presence of methadone in a ratio of -2: l in both treatment plants studied [38].
However, EDDP exists as a charged species in solution and would therefore, be
expected to persist in the aqueous phase during wastewater treatment and be
detected in the final effluents.
Temazepam was detected in both the influent and the effluent samples of
the Ringsend Wastewater Treatment Works and also in the effluent of Leixlip
Wastewater Treatment Works. Temazepam is a prescribed medication and was
included in the list of target analytes along with diazepam as both sedatives have
the potential for abuse. The presence of temazepam in the wastewater samples is
thought, like morphine, to be a result of medicinal and therapeutic use rather than
illicit or abused consumption. As was noted for both benzoylecgonine and cocaine,
the level of temazepam detected in the Ringsend treatment plant decreased from
influent to effluent suggesting a removal of approximately 60% via either sorption
or degradation during the passage of temazepam through the treatment works.
For the purposes of illustration, Fig. 7.4 depicts MSIMS product ion
chromatograms showing (A) the presence of benzoylecgonine and cocaine in the
influent and effluent of the Ringsend Wastewater Treatment. The excellent
retention time reproducibility should also be noted from Fig. 7.4 (A) along with the
clear reduction of the levels of both substances detected in the effluent sample
compared to the influent sample. Fig. 7.4 (6) depicts the suspected presence of
EDDP in the effluent sample collected from the Navan Wastewater Treatment
220
Centre. The term 'suspected' is used only due to the absence of methadone in the
sample. However, Fig. 7.4 (B) unequivocally shows the presence of trace levels of
EDDP in the collected sample.
O.OE+OO I A x - -
I - - -
0 5 10 15 2 0
Time, (mins)
Figure 7.4: (A) The presence of n g ~ - ' quantities of benzoylecgonine and cocaine in the influent and effluent of the Ringsend Wastewater Treatment Works, key: benzoylecgonine influent; red trace, benzoylecgonine effluent; pink trace, cocaine influent; blue trace, cocaine effluent; black trace, and (B) the presence of ngL- quantities of EDDP in the treated effluent of the Navan Wastewater Treatment Centre.
O.OE+OO * - .* -0 I
0 5 10 15 20
Time, (mins)
7.3.7 Estimation of community consumption of cocaine from environmental data:
Having detected levels of illicit drugs, in particular cocaine, in the effluents of the
examined wastewater treatment plants, an attempt was made to estimate
consumption of cocaine within the community served by those treatment works. As
mentioned previously, the presence of morphine and temazepam in treated effluent
is most likely to be attributed to medicinal and therapeutic use of such compounds
and therefore, it would be inappropriate to relate such levels to heroin consumption
or benzodiazepine abuse, respectively. Calculations were not performed on
measured EDDP concentrations due to the absence of the parent compound
methadone, and also a lack of available pharmacokinetic information regarding the
transformation of methadone.
The approach used in this instance is based upon that of Zucatto et a/.
however, as previously mentioned, cocaine was found in greater quantities in this
study than its primary urinary metabolite benzoylecgonine and was therefore used
for the performance of community consumption calculations rather than
benzoylecgonine [35]. From the levels of cocaine detected it is possible . . to calculate
the load of cocaine within the treatment plant on the day in which the sample was
collected simply by multiplying the analytical data by the flow through the plant,
such data is presented in Table 7.8.
However, a further refinement of the data can be performed when
considering the pharmacokinetic behaviour of cocaine, wherein only approximately
10% of the parent dose ingested is excreted as cocaine via the urine [59].
Therefore, based upon such information, the data in Table 7.8 can be further
refined as displayed in column 3 of Table 7.8. Even though the calculated cocaine
loads may seem high, it is thought, that results generated are actually conservative
when considering consumption of the drug within the community under study as a
high probability exists that analyte degradation or removal within the treatment
plant or wastewater transport system may have occurred prior to collection of the
sample. The cocaine load value quoted for the Ringsend Wastewater Treatment
Works refers to that determined in the influent sample in order to minimise extra
variability such as analyte removal during treatment etc. Although the value for the
Ringsend Wastewater Treatment Works appears high it should be remembered
that the plant caters for the entire Dublin metropolitan area, (1.7 million PEq) and
222
also the sample corresponds to the weekend, a time in which cocaine consumption
would be thought to be at a maximum.
Table 7.8: Cocaine loads within the sampled wastewater treatment plants.
Cocaine Load Refined Cocaine Load Wastewater Treatment Plant
(9.day-'1 (g.day-')
Ringsend 224.50 2245.00 Shanganagh 1.69 16.90
Leixlio 1.41 14.10 Navan 1.17 11.70
From the cocaine load within the plant it is possible to estimate the use of
cocaine by the population catchments served by the wastewater treatment plants.
Combining the data from Tables 7.1 and 7.8 the estimated use of cocaine within
the community is presented in Table 7.9.
Table 7.9: Estimated community consumption of cocaine within the catchments served by the sampled wastewater treatment plants.
Estimated Cocaine Consumption
Catchment Per 1000 PEq Per 1000 PEq
(9 day-') (doses day-')
Rinasend 1.44 14.38
The results presented in Table 7.9 compare favourably with those previously
published by Zucatto et a/. [35]. The dose per day data presented in Table 7.9 were
calculated based upon information present in [59], which states that one dose
equals approximately 100 mg cocaine. Zucatto et a/. further refined their data to
include a positive bias against young adults in the age bracket of 15 to 34 years old
due to a higher consumption of cocaine by persons within this age bracket when
compared to the general population. It was hoped to undertake a similar
transformation in this study. However, official statistics available from The Central
Statistics Office concerning the population census 2006 are only preliminary in
nature. It is stated in the opening lines of the available preliminary report that
record increases in population have been recorded within the four year period
since the last census in the catchment areas studies, particularly due to the influx
of young immigrants and therefore, it was felt that it would be incorrect to use the
data from the previous census conducted in 2002 [60].
The levels of cocaine consumption estimated in this approach suggest that
large quantities of the drug are being consumed within Dublin but it can also be
said that the problem of cocaine consumption is not wholly confined to the capital
city but present in smaller towns outside Dublin. The detection of cocaine and its
urinary metabolite in the wastewater treatment plants adds weight to the
assumption that the presence of cocaine arises due to human consumption and not
improper disposal of the narcotic. The problem exists in Ireland that there are
currently no reliable statistics regarding cocaine consumption to compare the
generated data against. The developed analytical procedure could be applied for
the routine monitoring of cocaine consumption within the community in order to
assess sociologically whether usage trends are stable, thereby indicating regular
use and possibly addiction within the community or whether trends are sporadic,
which may indicate whether cocaine lives up to its 'party drug' reputation. It is also
felt that the developed method and any results generated provide a much more
reliable snapshot of community consumption of cocaine compared to survey based
population investigations due to the non invasive sampling employed in the current
study.
7.4 Conclusions:
A suitably sensitive and validated analytical method using SPE LC-MSIMS for the
determination of residues of illicit drugs in wastewater and surface water has been
described. Cocaine was detected in samples of wastewater and subsequent
receiving waters collected from treatment plants in Dublin city and surrounding
counties. From the environmental analytical data it was possible to estimate
community consumption of cocaine within the catchment areas of the sampled
wastewater treatment plants. Estimations of cocaine consumption as doses per
1000 PEq per day compare well with previously published data from Italian
researchers. From the estimated consumption data it is concluded that cocaine is
widely used within the country at present and that such an observation is not solely
confined to the capital city. The present study provides a precedent in Ireland
concerning drug consumption within the community and it is therefore,
recommended that the approach presented here should be used for the continuous
'real time' monitoring of illicit drug consumption within society by regulatory bodies.
The method is cheaper and faster to apply than survey based methodologies and
offers a new prospect to social scientists and those with a key interest in monitoring
the lrish drug problem.
References:
1. M. OrHalloran, 'Cocaine seizures rise eight fold, The lrish Times, Saturday October 1'' 2005.
2. The Press Releases Section of the website of An Garda Siochana, viewed 5Ih December 2006,
http://www.garda.ie/angarda/press.html.
3. G. Singh, V. Arora, P.T. Fenn, B. Mets & I.A. Blair, Analytical Chemistry, 71, (1999), 2021.
4. R.J. Lewis, R.D. Johnson, K.M. Angier & R.M. Ritter, Journal of Chromatography B, 806, (2004),
141.
5. F. Sadeghipour & J-L. Veuthey, Journal of Chromatography A, 787, (1997), 137.
6. M. Concheiro, A. de Castro, 0 . Quintela, M. Lopez-Rivadulla & A. Cruz, Journal of
Chromatography B, 832, (2006), 8 1 . 7. M.R. Moeller, S. Steinmeyer & T. Kraemer, Journal of Chromatography B, 713, (1998), 91.
8. H.Z. Rofael & M.S. Abdel-Rahman, Journal of Applied Toxicology, 22, (2002), 123.
9. K-C. Wang, T-S. Shih & S-G. Cheng, Forensic Science International, 147, (2005), 81,
10. B. Maralikova & W. Weinmann, Journal of Chromatography B, 81 1, (2004), 21.
11. V. Bianchi & G. Donzelli, Journal of Chromatography B, 675, (1 996), 162.
12. R. Dams, C.M. Murphy, R.E. Choo, W.E. Lambert, A.P. de Leenheer & M.A. Huestis, Analytical
Chemistry, 75, (2003), 798.
13. P. Kintz, M. Villain, M. Concheiro & V. Cirimele, Forensic Science International, 150, (2005),
213.
14. M. Wood, M. Laloup, M. del Mar Remirez Fernandez, K.M. Jenkins, M.S. Young, J.G.
Ramaekers, G, de Boeck & N. Samyn, Forensic Science International, 150, (2005), 227.
15. K.A. Mortier, K.E. Maudens, W.E. Lambert, K.M. Clauwaert, J.F. van Bocxlaer, D.L. Deforce,
C.H. van Peteghem & A.P. de Leenheer, Journal of Chromatography B, (2002), 321.
16. D.A. Kidwell, J.C. Holland & S. Athanaselis, Journal of Chromatography 8, 713, (1998), 11 1.
17. K.M. Clauwaert, J.F. van Bocxlaer, W.E. Lambert, E.G. van den Ecekhout, F. Lemierem, E.L.
Esmans & A.P de Leenheer, Analytical Chemistry, 70, (1998), 2336.
18. K.B. Scheidweiler & M.A. Huestis, Analytical Chemistry, 76, (2004), 4358.
19. F. Musshoff, F. Driever, K. Lachenmeier, D.W. Lachenmeier, M. Banger & B. Madea, Forensic
Science International, 156, (2006), 118.
20. M. Cheze, G. Duffort, M. Deveaux & G. Pepin, Forensic Science International, 153, (2005), 3.
21. M. Villain, M. Concheiro, V. Cirimele & P. Kintz, Journal of Chromatography B, 825, (2005), 72.
22. J. Gareri, J. Klein & G. Koren, Clinica Chimica Acta, 366, (2006), 101.
23. S. Pichini, R. Pacifici, M. Pellegrini, J. Lozano, J. Murillo, 0. Vall & 0. Garcia-Algar, Analytical
Chemistry, 76, (2004), 21 24.
24. D. Thieme & H. Sachs, Analytica Chimica Acta, 492, (2003),171.
25. C.G. Daughton & T.A. Ternes, Environmental Health Perspectives, 107, (1999), 907.
26. T.A. Ternes, Water Research, 322, (1998), 3254.
27. M.J. Hilton & K.V. Thomas, Journal of Chromatography A, 1015, (2003), 129.
28. S. Zuehlke, U. Duennbier & T. Heberer, Analytical Chemistry, 76, (2004), 6548.
29. P.H. Roberts & K.V. Thomas, Science of the Total Environment, 356, (2006), 143.
30. P.H. Roberts & P. Bersuder, Journal of ChromatographyA, 1134, (2006), 143.
31. D. Ashton, M. Hilton & K.V. Thomas, Science of the Total Environment, 333, (2004), 167.
32. C.G. Daughton, "Illicit Drugs in Municipal Sewage" in "Pharmaceuticals and Personal Care
Products in the Environment: Scientific and Regulatory IssuesJ', ACS Symposium Series, (2001),
348, The American Chemical Society.
33. T.L. Jones-Lepp, D.A. Alvarez, J.D. Petty & J.N. Huckins, Archives of Environmental
Contamination and Toxicology, 47, (2004), 427.
34. A. Kaleta, M. Ferdig & W. Buchberger, Journal of Separation Science, 29, (2006) 1662.
35. E. Zucatto, C. Chiabrando, S. Castiglioni, D. Calamari, R. Bagnati, S. Schiarea & R. Fanelli,
Environmental Health, 4, (2005), 14.
36. J. Orr & N. Goswami, 'River of cocaine' The Telegraph, London, November 6th 2005.
37. K. Ross, Analytical Chemistry, 'AC Detective Article' January 1'' 2006, 78, 13.
38. S. Castiglioni, E. Zucatto, E. Crisci, C. Chiabrando, R. Fanelli & R. Bagnati, Analytical
Chemistry, 78, (2006), 8421.
39. Morphine Products information, www.rxlist.com/cgi/generic/ms.htm, viewed July 12'h 2006.
40. Morphine information, HIV/OI Chemical Biological Database,
http://chemdb2.niaid.nih.gov/struct~search/all/urlsearch.asp?aidsno=OOl987, viewed July 12 '~
2006.
41. FDA Adderall XR Capsules product information,
www.fda.gov/cder/foi/label2005/02130350091bI.pdf, viewed July 1 2th 2006.
42. Virtual Computational Chemistry Laboratory LogP Calculator, (XLogP Data),
http://l46.107.217.178/lab/alogps/start/html, viewed July 12 '~ 2006.
43. S. Pichini, 'Distribution of 3,4-Methylenedioxy Methamphetamine in non conventional matrices
and its application in clinical toxicologyJ', www.tdx.cesce.es~TDX-0119106-195119/, viewed July 1 2th
2006.
44. S. Seidel, E.S. Singer, H. Just, H. Farhan, P. Scholze, 0. Kudlacek, M. Holy, K. Koppatz, P.
Kirvanek, M. Freissmuth & H.H. Sitte, Molecular Pharmacology, 67, (2005), 140.
45. G. Skopp & L. Potsch, International Journalof Legal Medicine, 112, (1999), 213.
46. Benzoylecgonine information, HIVIOI Chemical Biological Database,
http://chemdb2.niaid.nih.gov/struct~search/all/urlsearch.asp?aidsno=OOl987, viewed July 12 '~
2006.
47. J.F. MacDonald, M.C. Bartlet, I. Mody, P. Pahapill, J.N. Reynolds, M.W. Slater, J.H.
Schneiderman & P.S. Pennefather, Journal of Physiology, 432, (1991), 483.
48. L. Barkley Barnett, "Toxicity, cocaine", http:l/www.emedicine.comlemerg/topicl02.htm, viewed
July 1 2 ' ~ 2006.
49. D.A. Kidwell & F.P. Smith, "Susceptibility of PharmChek Drugs of Abuse Patch to Environmental
Contamination", http://www.ncjrs.gov/pdff1les/nij/l95986.pdf, viewed July 12 '~ 2006.
50. S. Kerrigan, Clinical & Forensic Technology News March 2000,
http:llwww.eaacc.org/cftnlissues/2000/marOO.pdf, viewed July 1 2th 2006.
51. D.L. Roerig, R.R. Dahl, C.A. Dawson & R.I. Warp, Drug Metabolism and Disposition, 12, (1984),
536.
52. H. Choe, Y-K Lee, Y-T Lee, H. Choe, S-H KO, C-U Joo, M-H Kim, G-S Kim, J-S Eun, J-H Kim,
S-W Chae & Y-G Kwak, The Journal of Pharmacology and Experimental Theraputics, 304, (2003),
706.
53. Eli Lilly Product MSDS,
http://www.ehs.lilly.com/msds/msds~olanzapinefluoxetinecombinationcapsules.htm, viewed July
1 2th 2006.
54. Wikipedia A'-THC information, http:llen.wikipedia.org/wikiltetrahydrocannabinol, viewed July
1 2th 2006.
55. Phenomenex product information, 'Polymeric Sorbents for Sample Preparation', received with
cartridges purchased from Phenomenex, Macclesfield, United Kingdom.
56. Dublin Drainage Consultancy, 'Greater Dublin Strategic Drainage Study - Assessment of
Existing Wastewater Treatment Works', July 2002, available online at
http://www.fingalcoco.ie/YourLocalCouncil/Services~aterservices/GreaterDublinStrategicDrainage
Study/GDSDS/Appendix%20E-Assesment0h20of0/~2OTWNVWTS%assesment0/~2Oreport.pdf, last
viewed December 1 5th 2006.
57. Dublin Airport weather station data for the 18/19/20'~ November 2006 available through
http:/lwww.meteireann.ielclimate/daily-dataasp viewed 18th December 2006.
58. J. Ambre, Journal of Analytical Toxicology, 9, (1 985), 241.
59. O.H. Drummer, Forensic Science International, 142, (2004), 101.
60. The Central Statistics Office, Census 2006 - Preliminary Report: available through
http:llwww.cso.ie, viewed December 21St 2006.

8.0 Overall Conclusions & Future Research Direction.
8.1 Overall Conclusions:
In the research presented here, efficient and sensitive methods for the
determination of pharmaceuticals and illicit drugs residues in environmental
samples, based upon monolithic silica column technology were developed. In the
first instance a highly efficient dual gradient LC separation of a selection of
environmentally relevant pharmaceuticals was developed using a 20 cm
monolithic CI8 column. It was found that when combined with SPE, detection
limits were in the sub pgL-' range and the method was applied to the monitoring
of the selected drugs in a variety of environmental matrices. The use of PDA
detection imparted a greater degree of selectivity to the developed method
allowing for the collection of UV spectra at the ultra trace level from which semi-
qualitative data could be obtained. The method may be particularly useful to
those who wish to monitor pharmaceutical residues but who do not have access
to LC-MS instrumentation.
The second developed method involved the adaptation of the dual
gradient LC method with the coupling to ESI-MS to increase detection specificity.
The use of short monolithic columns as online SPE extraction traps was also
evaluated and it was found that detection limits in the low ngL-' region were
readily achievable. It was however, noted that excessive matrix magnification
was a major problem but the incorporation of a simple solvent wash step was
found to remove the preconcentrated matrix by >80%. A major limitation to the
use of monolithic silica columns in conjunction with ESI-MS detection was
encountered as due to the flow mismatch and the need for the incorporation of a
splitting device. Therefore, ESI-MS could only be used to provide qualitative
information and could not be used as a quantitative detector.
Monolithic silica columns were also effectively used for the development of
an analytical procedure for the determination of the highly toxic antifouling and
anti-dandruff agent zinc pyrithione in environmental waters. Due to the low silanol
activity of the high purity monolithic silica stationary phase, easier LC was
facilitated, wherein previous problems concerning tailing and non specific
interaction with metal ion contamination were completely avoided. Short
monolithic columns were successfully employed for the rapid trace enrichment of
low n g ~ - ' levels of ZnPT from water samples. The inclusion of both a sacrificial
silica strong anion exchange sorbent prior to the monolithic trap column and a
solvent wash procedure aided with the minimisation of APCI-MS ion suppression
by co-extracted matrix components. Using the developed method it was found
that ZnPT transchelates with cu2' ions to form the more stable CuPT complex in
the environment. The formed CuPT is rapidly degraded upon exposure to
sunlight, with and experimentally determined half life of 45 minutes under
laboratory conditions. It therefore, appears that ZnPT, (as CuPT) does not pose
an environmental problem provided that the rates of photolytic removal exceed
the rates of introduction.
Two methods were then presented concerning non invasive analytical
procedures for the estimation of illicit drug use within the community. A
comparison of the efficiency and kinetic behaviour of newly available 3.0 mm i.d.
monolithic silica reversed-phase columns and sub 2 pm particle packed columns
was also undertaken and it was observed that the monolithic columns were
considerably more efficient chromatographic supports with significantly lower
operating pressures than the sub 2 pm particle packed columns. The first
approach to estimate drug use within the community focused upon the
determination of illicit drug contamination of banknotes in general circulation
using simple sample preparation followed by LC-MSIMS analysis. 45 notes of
different denominations were collected along with three un-circulated controls.
Trace levels of cocaine were detected on all of the investigated samples
accompanied by benzoylecgonine in many instances. Traces of heroin were
found on three lower denomination notes. Of the levels of cocaine detected, it
appears that the majority of contamination is thought to result due to transfer
during counting in financial institutions. Two notes out of the 45 tested showed
levels significantly high to suggest direct contact with the drug; most likely the
note was used to snort cocaine. To further refine the estimation, a solid phase
extraction procedure was developed in order to increase the sensitivity of the
analytical procedure and samples of wastewater and surface water were
analysed for the presence of illicit drug residues. In cases where drugs were
detected, it was possible to apply an adaptation of the approach previously
presented by Italian researchers for the estimation of cocaine consumption in
both weight' and doses per 1000 population equivalents. Based upon the

generated analytical data it was estimated that 14 100 mg doses of cocaine were
consumed per 1000 population equivalents in the twenty four hour period of the
collected Ringsend Wastewater Treatment Works composite sample, which
caters for the entire Dublin metropolitan area. It is thought that the developed
analytical method should be further applied for the routine monitoring of illicit
drug consumption within the community by the State and relevant interested
authorities.
Interesting data was generated using each of the developed methods.
With regard to the samples tested, levels of illicit drug residues were detected
more often than levels of medicinal pharmaceuticals. However, the reason for
such an observation lies in the matrices tested and also the detection
mechanisms employed. The methods developed concerning the use of LC-
MSIMS for the determination of the illicit drug residues highlight the need for both
the sensitivity and specificity imparted by mass selective detection. The lack of
analyte detection when using the dual gradient methods is a combination of the
use of optical detection to determine ultra trace residues in samples wherein high
dilution of any possible pharmaceutical input is guaranteed, i.e. fast flowing
rivers. Although not applied to treated wastewater, a level of confidence exists
that traces of the investigated analytes would indeed have been found as the
levels of sensitivity attainable with the dual gradient methods is suitable for the
monitoring of such.
Another notable conclusion from the research undertaken in the present
study is that of the unwanted effects of the sample matrix. Co-extraction and
magnification of the sample matrix presents a limiting problem, especially when
mass selective detection is employed as problems such as ion suppression are
readily encountered, thereby adversely affecting sensitivity and detection in
general. It was also noted that distinct matrix diversity exists across the range of
samples investigated, with some more problematic than others. A solution
encountered in the literature is often to develop methods that are matrix specific,
i.e. one for wastewater, one for surface water, etc. However, such an approach
increases both the time and cost of the analysis and is therefore, not a feasible
solution. The need therefore, exists for the development of more specific
extraction chemistries and procedures. For example, as was previously
mentioned in Chapter 5.0, the incorporation of a sacrificial anion exchange
sorbent prior to the reversed-phase trap column radically minimised the matrix

suppression of the APCI-MS signal. When using polymeric SPE cartridges efforts
should be focused upon sample washing and clean up, again referring back to
Chapter 7.0 the effect of a selective washing procedure allowed for almost
complete removal of the sample matrix with no observed effects on analyte
recovery or the ESI-MSIMS signal. It is therefore, recommended to those
developing methods for trace enrichment of organic micro contaminants in
complex matrices that selective sample clean up will be of paramount importance
in order to achieve the desired levels of sensitivity.
The advantages offered by monolithic silica columns, in particular the
newly available 3.0 mm i.d. column are also worth mentioning again. The high
purity of the silica substrate and low silanol activity of the functionalised
stationary phase should be noted, especially for the chromatography of basic
compounds and as demonstrated in Chapter 5.0 labile compounds such as metal
ligand complexes. As shown in Chapters 6.0 the primary advantage of monolithic
silica columns lies within their high inherent porosity and therefore, the ability to
use longer columns with high chromatographic efficiency. It is hoped that further
reduction in the 'bore size' of the monoliths and a wider array of stationary phase
chemistries will soon become commercially available.
One last question to be posed concerns the detection of pharmaceutically
active compounds in the environment. It can be suggested that the levels
detected are so small, they pose no environmental risk or toxicological threat.
This indeed may be true; it is only with recent advances in analytical chemistry
that the detection of such residues has become possible, even though the
introduction of such compounds to the environment has been occurring for years
previous. Although the presence of many drug residues at low environmental
concentrations may be harmless, the ability to demonstrate the presence of
pharmaceutically active compounds in the environment is still important. As
shown in this research, it affords to opportunity to non invasively monitor
community behaviour and consumption of drugs and other substances. The
threat, however, exits in cases where the presence of high potency low dose
compounds such as anti-neoplastic agents and hormones and therefore, the
development and application of methods for the determination of such are of high
importance. With continuing advances in analytical methodologies and
instrumentation we may soon approach the situation of 'seek and you shall find'.
8.2 Future Research Direction:
The following areas have been identified as possibly requiring further research
and may be of relevance to those undertaking similar studies:
The development of more specific and selective extraction methods is an area
which undoubtedly requires increased attention by the analytical community.
The availability of high performance sorbents such as the hydrophilic lipophilic
balanced polymers has increased the applicability of SPE. However, as
discovered in this study, these sorbents also magnify the matrix significantly
and therefore, the development of complimentary wash steps to selectively
remove or minimise matrix retention is an area that requires attention.
The inclusion of metabolites into the analytical methods should also be
addressed. This will require availability of both information and reference
standards for pharmaceutical manufacturers. A current limitation in the area is
the lack of reference standards, especially of pharmaceuticals that are still
under patent.
It is felt that the non invasive community consumption approach presented in
Chapter 7.0 should be routinely applied by the State and relevant authorities
or interested bodies in order to gather accurate data regarding the use of illicit
drugs within the community. The method presented is specific and sensitive, a
further refinement could, however, focus upon the substitution of the
Phenomenex strata-XC" SPE sorbent used by the Waters Oasis MCX" SPE
sorbent in order to see if analyte recovery and hence analytical sensitivity can
be further improved.
. The behaviour of pharmaceutically active compounds during the wastewater
treatment process also requires further investigation, particularly the
adsorption of drug residues to solids and estimations of partitioning behaviour.
Other environmental processes, such as photo transformation of
pharmaceutical residues should also be examined, thereby allowing for the
refinement of analytical methods to include relevant compounds, e.g.
photoproducts rather than parent compounds etc.