extractable copper, lead, zinc and cadmium in northern ireland soils
TRANSCRIPT
J. Sci. Food Agric. 1983,34,1197-1205
Extractable Copper, Lead, Zmc and Cadmium in Northern Ireland Soils
E. Leslie Dicksona and R. James Steven@
a Agricultural and Food Chemistry Research Division, Newforge
(Manmcript received 19 January 1983)
me, Belfast BlY 5PX, Northern Ireland and Department of Agricultural and Food Chemistry, Queen’s University of Belfast, Northern Ireland
A survey of extractable copper, lead, zinc and cadmium in Northern Ireland’s top soils was carried out to see if the trace element concentrations could be related to the parent material of the soils and to the influence of human activity.
Using ordnance-survey identification, 1305 samples were selected as representative of the soils of Northern Ireland. Duplicate subsamples of each soil were shaken with 0.05~ EDTA (pH 7.0) for 60 min and the supernatant analysed for copper, lead, zinc and cadmium by atomic absorption techniques. Ranges and medians for each trace element are recorded and comparisons with results of copper reported for other countries have been identified.
Relative distribution diagrams are presented for each of the elements under investi- gation and computer-drawn symbol maps have been produced showing the distri- bution of the concentration of each element in comparison to the parent geology.
Finally correlation coefficients between the concentration of each trace element and the ammonium acetate/acetic acid (pH 4.2) extracted phosphorus and potassium have been calculated and used to show that a specific relationship between the extractable trace elements and man’s additions to the soil, as indicated by the soil fertility, is poorly developed.
1. Introduction
Information on soil trace element concentrations is useful in defining deficiencies and toxicities, and in deciding the capacity of the soils for the disposal of trace element containing wastes. A limited survey of extractable copper and zinc was carried out in 1969 in Northern Ireland soils. In the present study, Northern Ireland soils were systematically sampled and the samples analysed for extractable copper, lead, zinc and cadmium. The concentrations obtained were compared with concentrations found in the soils of other countries. Attempts were made to relate the trace element concentrations to soil parent material as indicated by the underlying geology and to the influence of man’s additions of fertilisers and slurries as indicated by available soil phosphorus and potassium status.
2. Methods 2.1. Sampling In Northern Ireland, the Department of Agriculture provide an advisory service of soil sampling, analysis and reporting on the fertility status of soils for farmers. About 10000 soil samples from throughout the Province are received each year. Each soil sample is a composite of a number of cores taken with a half-core auger to a depth of 10 cm. A number of these composite samples were selected for a survey of copper, lead, zinc and cadmium as extracted with ethylene diamine tetra- acetic acid (EDTA).
The contents of this paper were presented to the Agriculture Group Symposium of the Society of Chemical Industry in Belgrave Square, London on 19 October 1982.
1197
1198 E. L. Dickson and R. J. Stevens
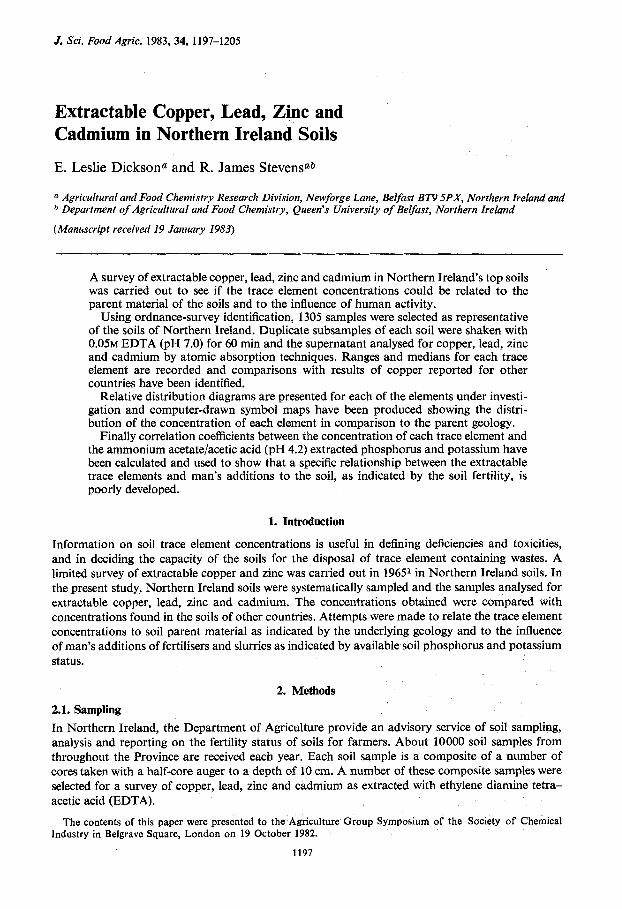
To make the selected samples as representative as possible of Northern Ireland's soils, the origin of each sample brought into the Department during the year 1981-82 was identified using the six- digit coordinates of the Irish Grid on a scale 1 : 250000. A map to such a scale had a 10 km square grid imposed upon it. Where possible at least ten samples per square were selected for analysis. In all, 1305 samples were analysed representing 117 of the 181 grid squares which cover Northern Ireland (Figure 1).
Figure 1. A map of Northern Ireland showing the numbers of samples collected from each area.
2.2. Experimental The soil samples were air-dried and the fraction passing a 2 mm sieve retained for analysis. Sub- samples were extracted in duplicate with 0.05~ EDTA at pH 7.0 according to the method recom- mended by ADAS2 with the modifications that a weighed sample of air-dried soil was used rather than a measured volume, and after extraction the suspensions were centrifuged for 1 h at 2000 g rather than being filtered. The supernatants from the EDTA extractions of the soils were analysed for copper, lead, zinc and cadmium on a Perkin-Elmer 5000 atomic absorption spectrophotometer. Trace element concentrations have been reported as mg kg-l dry soil.
3. Results and discussion 3.1. Minimum, median and maximum trace element concentrations The minimum, median and maximum values obtained for the EDTA extractable copper, lead, zinc and cadmium are summarised in Table 1. The range and median levels for copper, lead and zinc were much greater than those for cadmium.
Soil trace element concentrations 1199
Table 1. The median and range of concentrations of EDTA extractable elements from Northern
Ireland soils in mg kg-1
Range
Element Median Min Max
c u 12.11 0.15 56.87 Pb 8.18 0.50 138.19 Zn 4.49 0.05 60.62 Cd 0.17 0.05 2.59
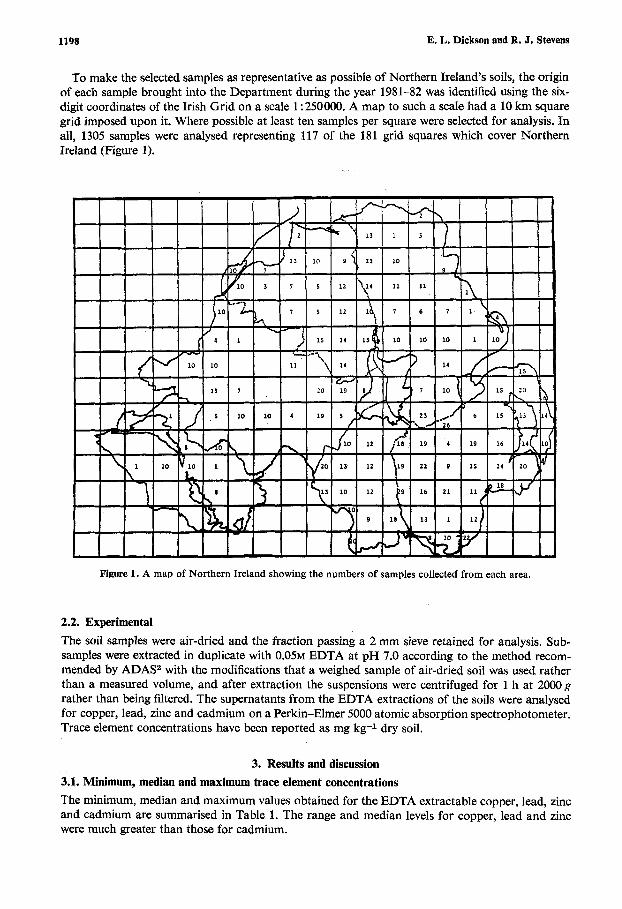
3.2. Comparison of EDTA extractable copper in soils from several countries A relative frequency distribution diagram for EDTA extractable copper is given in Figure 2. Seventy-eight per cent of the concentrations were between 5 and 20 mg kg-1. This compares well with results reported in 1965,l where the range found in 131 samples of Northern Ireland soils was 1.5 to 53.0 mg kg-1 with 70% of the concentrations between 5 and 20 mg kg-l.
Figure 2. The relative frequency distribu- tion diagram of EDTA-extractable copper concentrations in Northern Ireland soils.
mg Cu kg-'
A comparison of the EDTA-extractable copper levels for Northern Ireland soils with values found for soils in Finland, Denmark and England and Wales is given in Table 2. The range reported fdr the 57 Finnish soils3 was similar to the Northern Ireland soils but a much higher per- eentage had less than 6 mg Cu kg-1. This also applies to the 688 Danish soils,4 where the range is similar and an equally high percentage had less than 2.5 mg Cu kg-1.
Table 2. Ranges of EDTA-extractable copper in soils from various sources
No. of EDTA-extracted Source samples Cu concentration Distribution
Finland 57 1.8-11 .O mg kg-1 91 % < 6 . 0 mg kg-1 Denmark 688 0,l-63.0 mg kg-1 7 5 X 1 2 . 5 mg kg-1 England and Wales 662 0.5-74.0 mg litre-' 92 % < 10.0 mg litre-' N. Ireland 1305 0.15-57.0 mg kg-1 36%<10.0 mg kg-1
1200 E. L. Dickson and R. J. Stevens
Recently, a random selection of soils from 201 different farms in England and Wales5 gave a reasonably similar range to that found in Northern Ireland but once again a much higher percentage had less than 10 mg Cu kg-1 than that found in this study. The EDTA extractable values for copper in Northern Ireland soils are therefore higher than the values found in Finland, Denmark and England and Wales.
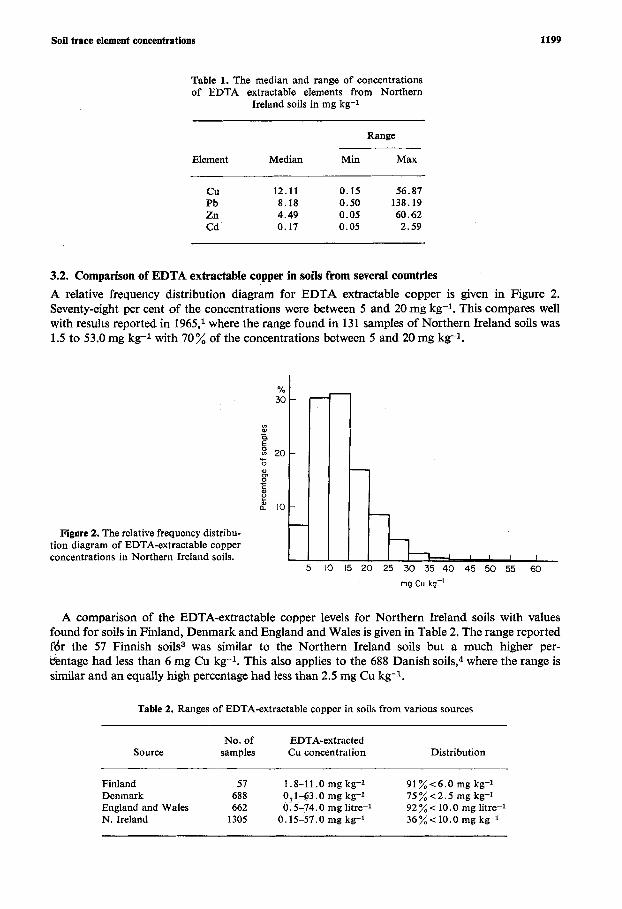
Figure 3. The copper distribution symbolmap of Northern Ireland.
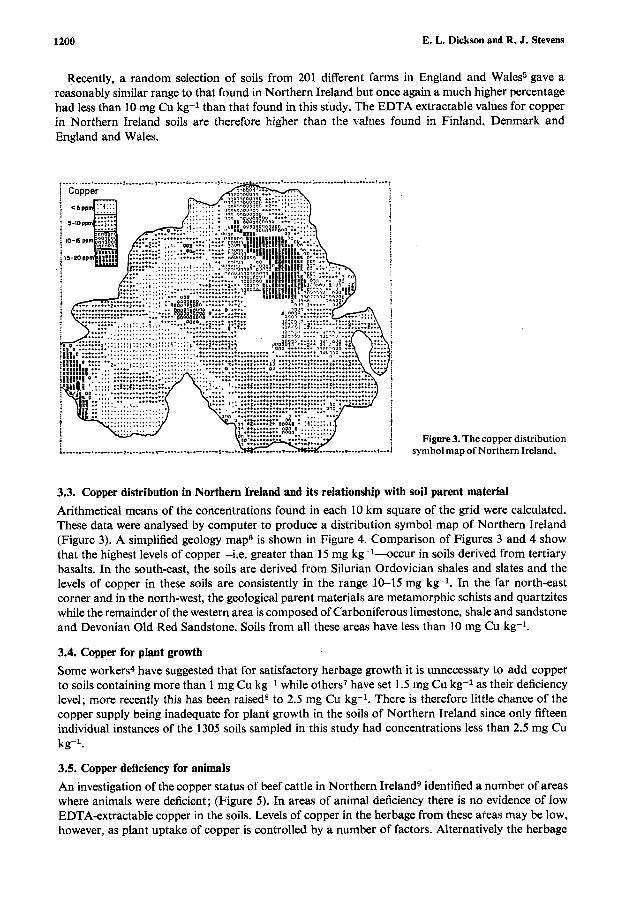
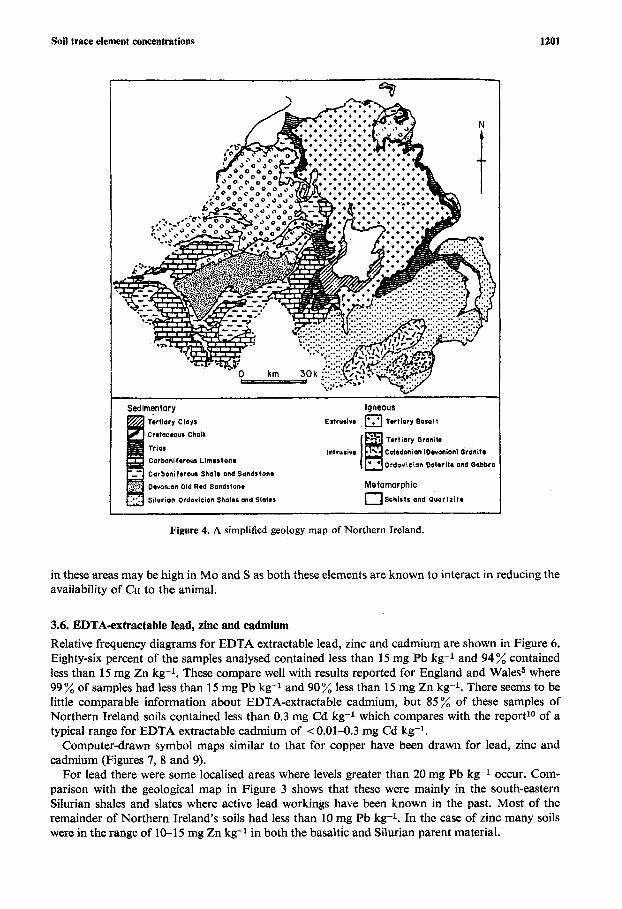
3.3. Copper distribution in Northern Ireland and its relationship with soil parent material Arithmetical means of the concentrations found in each 10 km square of the grid were calculated. These data were analysed by computer to produce a distribution symbol map of Northern Ireland (Figure 3). A simplified geology map6 is shown in Figure 4. Comparison of Figures 3 and 4 show that the highest levels of copper-i.e. greater than 15 mg kg-l-occur in soils derived from tertiary basalts. In the south-east, the soils are derived from Silurian Ordovician shales and slates and the levels of copper in these soils are consistently in the range 10-15 mg kg-1. In the far north-east corner and in the north-west, the geological parent materials are metamorphic schists and quartzites while the remainder of the western area is composed of Carboniferous limestone, shale and sandstone and Devonian Old Red Sandstone. Soils from all these areas have less than 10 mg Cu kg-1.
3.4. Copper for plant growth Some workers4 have suggested that for satisfactory herbage growth it is unnecessary to add copper to soils containing more than 1 mg Cu kg-1 while others7 have set 1.5 mg Cu kg-1 as their deficiency level; more recently this has been raised8 to 2.5 mg Cu kg-l. There is therefore little chance of the copper supply being inadequate for plant growth in the soils of Northern Ireland since only fifteen individual instances of the 1305 soils sampled in this study had concentrations less than 2.5 mg Cu kg-l.
3.5. Copper deficiency for animals An investigation of the copper status of beef cattle in Northern Ireland9 identified a number of areas where animals were deficient; (Figure 5). In areas of animal deficiency there is no evidence of low EDTA-extractable copper in the soils. Levels of copper in the herbage from these areas may be low, however, as plant uptake of copper is controlled by a number of factors. Alternatively the herbage
Soil trace element concentrations 1201
Sedimentary Igneous Tertiary Clays
Cretacmous Chalk
Trias
Carbanifrraus Limmstonm
Carboniferous Shale and Sandstonm
Extrurivm a Tirtiary Basalt
Devonian Old Red Sandstonm Metamorphic Silurian Ordovician Shales and Stat*% D S c h l s t s and Quarlzilm
Figure 4. A simplified geology map of Northern Ireland.
in these areas may be high in Mo and S as both these elements are known to interact in reducing the availability of Cu to the animal.
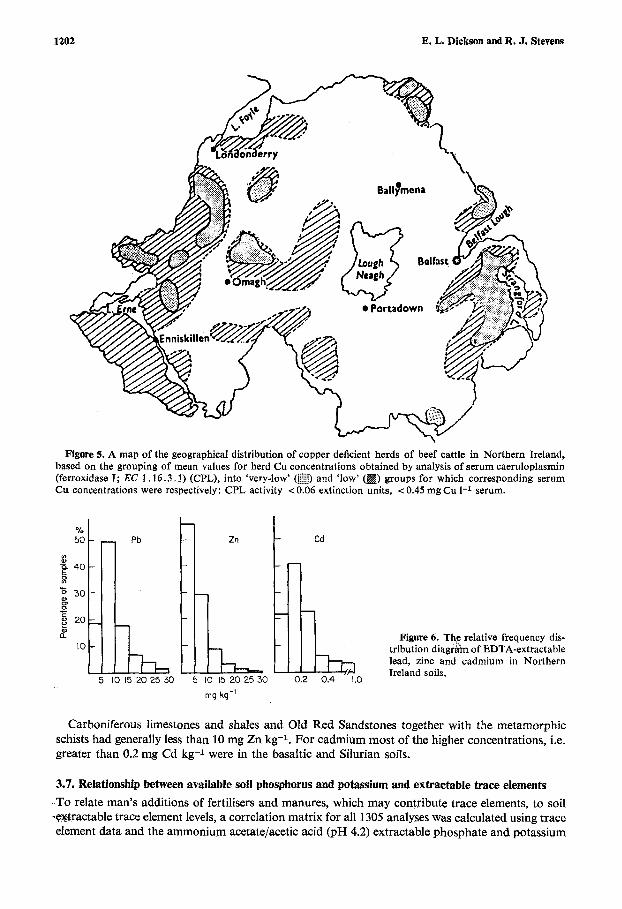
3.6. EDTA-extractable lead, zinc and cadmium Relative frequency diagrams for EDTA extractable lead, zinc and cadmium are shown in Figure 6. Eighty-six percent of the samples analysed contained less than 15 mg Pb kg-l and 94% contained Iess than 15 mg Zn kg-1. These compare well with results reported for England and Wales5 where 99% of samples had less than 15 mg Pb kg-1 and 90% less than 15 mg Zn kg-l. There seems to be little comparable information about EDTA-extractable cadmium, but 85 % of these samples of Northern Ireland soils contained less than 0.3 mg Cd kg-1 which compares with the reportlo of a typical range for EDTA extractable cadmium of < 0.01-0.3 mg Cd kg-l.
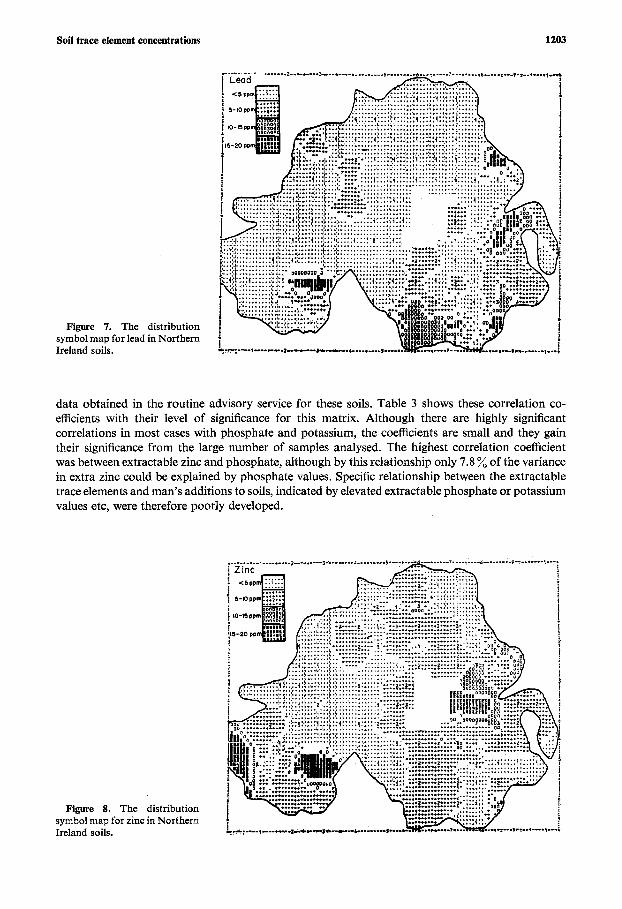
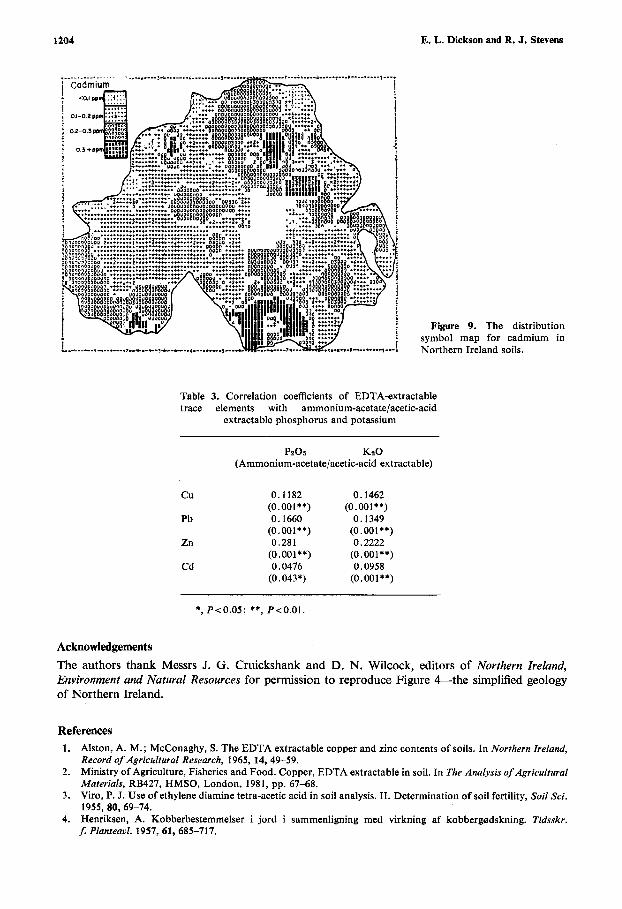
Computer-drawn symbol maps similar to that for copper have been drawn for lead, zinc and cadmium (Figures 7, 8 and 9).
For lead there were some localised areas where levels greater than 20 mg Pb kg-l occur. Com- parison with the geological map in Figure 3 shows that these were mainly in the south-eastern Silurian shales and slates where active lead workings have been known in the past. Most of the remainder of Northern Ireland’s soils had less than 10 mg Pb kg-1. In the case of zinc many soils were in the range of 10-15 mg Zn kg-1 in both the basaltic and Silurian parent material.
1202 E. L. Dickson and R. J. Stevens
Figure 5. A map of the geographical distribution of copper deficient herds of beef cattle in Northern Ireland, based on the grouping of mean values for herd Cu concentrations obtained by analysis of serum caeruloplasmin (ferroxidase I; EC 1.16.3.1) (CPL), into ‘very-low’ @ ~ ) and ‘low’ (m) groups for which corresponding serum Cu concentrations were respectively: CPL activity < 0.06 extinction units, < 0.45 mg Cu 1-1 serum.
L 5 10 15 20 25 30
Cd
IiL 0.2 0.4 1.0
Figure 6. The relative frequency dis- tribution diagrdm of EDTA-extractable lead, zinc and cadmium in Northern Ireland soils.
mq kq-’
Carboniferous limestones and shales and Old Red Sandstones together with the metamorphic schists had generally less than 10 mg Zn kg-l. For cadmium most of the higher concentrations, i.e. greater than 0.2 mg Cd kg-1 were in the basaltic and Silurian soils.
3.7. Relationship between available soil phosphorus and potassium and extractable trace elements To relate man’s additions of fertilisers and manures, which may contribute trace elements, to soil
,e&ractable trace element levels, a correlation matrix for all 1305 analyses was calculated using trace element data and the ammonium acetate/acetic acid (pH 4.2) extractable phosphate and potassium
Soil trace element concentrations 1203
Figure 7. The distribution symbol map for lead in Northern Ireland soils.
data obtained in the routine advisory service for these soils. Table 3 shows these correlation co- efficients with their level of significance for this matrix. Although there are highly significant correlations in most cases with phosphate and potassium, the coefficients are small and they gain their significance from the large number of samples analysed. The highest correlation coefficient was between extractable zinc and phosphate, although by this relationship only 7.8 % of the variance in extra zinc could be explained by phosphate values. Specific relationship between the extractable trace elements and man’s additions to soils, indicated by elevated extractable phosphate or potassium values etc, were therefore poorly developed.
Figure 8. The distribution symbol map for zinc in Northern Ireland soils.
1204 E. L. Dickson and R. J. Stevens
Figure 9. The distribut symbol map for cadmium Northern Ireland soils.
Table 3. Correlation coefficients of EDTA-extractable trace elements with ammonium-acetate/acetic-acid
extractable phosphorus and potassium
PZo5 KzO (Ammonium-acetatelacetic-acid extractable)
.ion in
c u 0.1182
Pb 0.1660
Zn 0.281
Cd 0.0476
(0.001**)
(0.001 **)
(0.001**)
(0.043*)
0.1462 (0.001 * *)
0.1349 (0.00 1 **) 0 * 2222
(0.001 **) 0.0958
(0.001 * *)
*, P<0.05; **, P<O.OI.
Acknowledgements The authors thank Messrs J. G. Cruickshank and D. N. Wilcock, editors of Northern Ireland, Environment and Natural Resources for permission to reproduce Figure A t h e simplified geology of Northern Ireland.
References 1. Alston, A. M.; McConaghy, S. The EDTA extractable copper and zinc contents of soils. In Northern Ireland,
Record of Agricdtural Research, 1965, 14, 49-59. 2. Ministry of Agriculture, Fisheries and Food. Copper, EDTA extractable in soil. In The Analysis of Agricultural
Materials, RB427, HMSO, London, 1981, pp. 67-68. 3. Viro, P. J. Use of ethylene diamine tetra-acetic acid in soil analysis. 11. Determination of soil fertility, Soil Sci.
4 . Henriksen, A. Kobberbestemmelser i jord i sammenligning med virkning af kobbergedskning. Tidsskr. 5 Planteaul. 1957, 61, 685-717.
1955,80,69-74.
Soil trace element concentrations 1205
5 . Archer, F. C. Trace elements in soils in England and Wales. Inorganic Pollution and Agriculture, RB 326, HMSO, London, 1977. pp. 184-190.
6. Roberts, J. C. Rocks and Minerals, Northern Ireland Environment and Natural Resources (Cruickshank, J . G . ; Wilcock, D. N., Eds), Queen’s University, Belfast and New University of Ulster, 1982, pp. 149-164.
7. Mitchell, R. L.; Reith, J. W. S.; Johnston, I. M. Trace element uptake in relation to soil content. J. Sci. Food Agric. 1957, 8, S 5 1 4 5 9 .
8. Unwin, R. J. The application of copper in sewage sludge and pig manure to agricultural land in England and Wales. In Copper in Animal Wastes and Sewage Sludge (L‘Hermite, P.; Dehandtschutter, Eds), D. Reidel, 1980,
9. Thompson, R. H.; Todd, J. R. The copper status of beef cattle in Northern Ireland, Er. J . Nutr. 1976, 36,
10. Berrow, M. L.; Burridge, J. C. Trace element levels in soil; effects of sewage sludge. In Inorganic Pollution and Agriculture, RB 326, HMSO, London, 1977, pp. 159-183.
pp. 102-116.
299-303.