external sector performance – may 2014
DESCRIPTION
External Sector Performance – May 2014TRANSCRIPT

1
Communications Department 30, Janadhipathi Mawatha, Colombo 01, Sri Lanka.
Tel : 2477424, 2477423, 2477311
Fax: 2346257, 2477739
E-mail: [email protected], [email protected]
Web: www.cbsl.gov.lk
Press Release Issued By
Date 14.07.2014
External Sector Performance – May 2014
Overview
The trade deficit continued to improve in May 2014, strengthening the performance
in the external sector. Earnings from exports increased, while expenditure on
imports reduced driven mainly by the reduction in fuel imports. This outcome,
together with higher inflows on account of workers’ remittances, increased tourist
earnings and continued inflows to the financial account resulted in a healthy surplus
in the Balance of Payments (BOP) during the first five months of 2014, compared to
the corresponding period of 2013.
Trade Account of the BOP
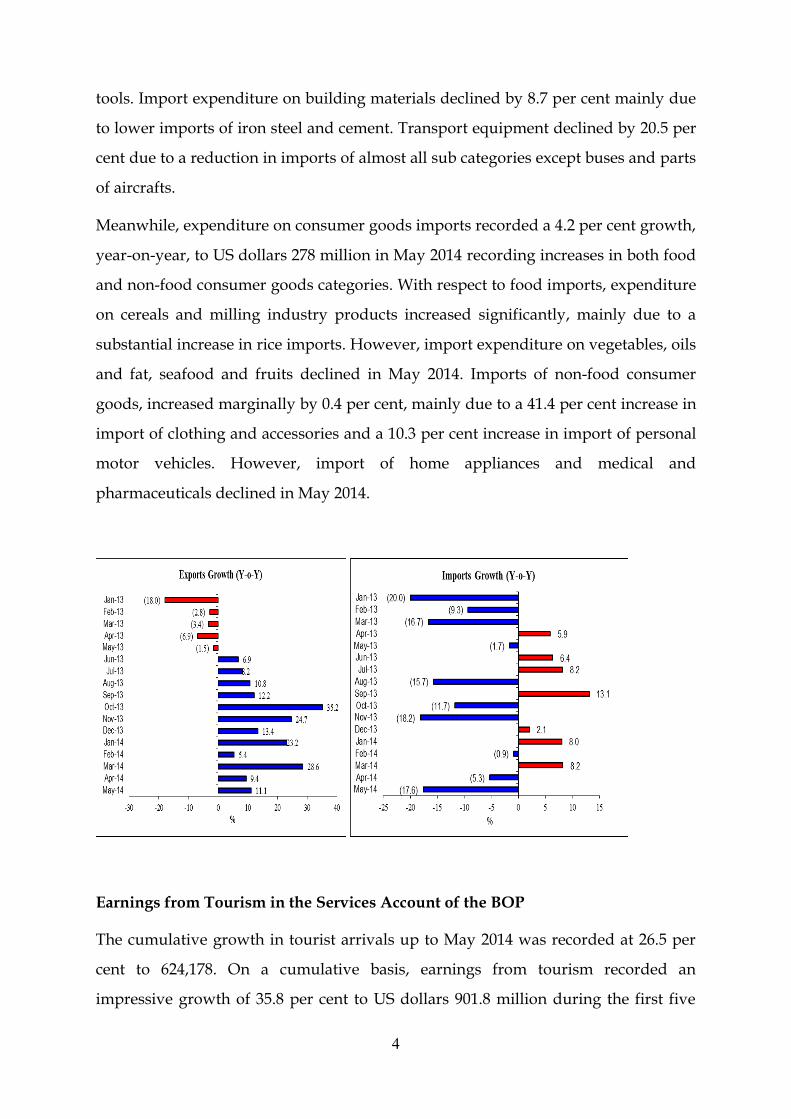
On a year-on-year basis, earnings from exports in May 2014 increased by 11.1 per
cent to US dollars 882 million, while expenditure on imports declined by 17.6 per
cent to US dollars 1,275 million. Accordingly, the trade deficit contracted for the
eight consecutive month in May 2014, by 47.9 per cent to US dollars 393 million. The
cumulative trade deficit for the first five months of 2014 contracted by 19.3 per cent,
as a result of a 15.7 per cent growth in export earnings and a 1.5 per cent decline in
import expenditure.
Economic Research Department
24.04.2014
2
Export Performance
Expansion in all major export categories contributed to the growth in exports in May
2014. However, the largest contribution to the overall growth came from industrial
exports followed by agricultural exports. Earnings from industrial exports grew by
7.7 per cent, year-on-year, to US dollars 639 million reflecting positive performance
in almost all sub categories. As the leading driver of growth in industrial exports,
textiles and garment exports grew by 14.5 per cent, year-on-year, to US dollars 365
million in May 2014, as a result of significant increases in exports to both traditional
and non-traditional markets. Sri Lanka’s apparel industry has been increasing its
value addition through strategies such as backward integration, establishment of
brands and improved reputation as a quality and timely apparel supplier. Rubber
product exports also increased by 14.6 per cent to US dollars 78 million mainly due
to an increase in export of rubber tyres, the main rubber product of Sri Lanka. Raw
rubber prices fell to a 5 year low in May 2014 benefitting manufacturers of rubber
products. Earnings from export of machinery and mechanical appliances, food
beverages and tobacco and leather products also contributed to the growth in
industrial product exports. Meanwhile, earnings from transport equipment and
petroleum products declined by 77.6 per cent and 40.0 per cent, respectively mainly
due to the high base in the previous period.
Earnings from agricultural exports rose by 21.2 per cent, year-on-year, to US dollars
240 million in May 2014 with significant contributions from tea and coconut.
Earnings from export of coconut increased sharply by 91.3 per cent to US dollars 30
million led by kernel product exports. The favourable developments in coconut
exports during 2014 reflect the impact of favourable weather conditions in the
previous year on coconut production. Earnings from tea exports recorded a healthy
growth of 9.7 per cent to US dollars 141 million in May 2014. This was a combined
outcome of 5.5 per cent increase in tea export volumes and a 4.0 per cent increase in
the average export price of tea. However, the average export price of tea declined
continuously during the first five months of 2014 from the highest price recorded in
January 2014. Export earnings from minor agricultural products and seafood also

3
contributed significantly to the growth in agricultural exports. However, in May
2014, earnings from rubber exports contracted by 21.0 per cent compared to May
2013, due to the continuous decline in export volumes and prices, owing to low
demand from major rubber consumers and increased production from new
plantations in Vietnam, Thailand and Indonesia.
Import Performance
Expenditure on imports declined by 17.6 per cent to US dollars 1,275 million in May
2014, due to the significant decline in expenditure on imports of intermediate and
investment goods. Expenditure on imports of intermediate goods declined by 21.0
per cent, year-on-year, to US dollars 717 million in May 2014 mainly due to the
significant declines in importation of crude oil, diamonds and gold. Negligible
imports of gold in May contributed to the decline in import of gold, precious stones
and metals by 87.0 per cent to US dollars 13.2 million in May 2014. Expenditure on
fuel imports showed a temporary decline of 35.4 per cent in May 2014, mainly due to
the delay in unloading crude oil imports during the month due to maintenance
activities in oil pipelines. Import expenditure on wheat and unmanufactured
tobacco also declined by 42.8 per cent and 75.8 per cent, respectively, contributing to
the decline in intermediate goods imports. However, import expenditure on textiles
and textile articles, fertilizers and paper and paperboard articles grew during the
month under review. Imports of textile and textile articles, grew by 11.2 per cent,
year-on-year, indicating higher export orders for apparel products in the coming
months. Further, fertilizer imports increased by 36.7 per cent, year-on-year, to US
dollars 32 million in May 2014, mainly due to the increased usage of fertilizer for
paddy and other crops during the Yala season and upcoming Maha season.
Expenditure on imports of investment goods declined by 25.2 per cent, to US dollars
280 million in May 2014 due to declines in imports of all major categories of
investment goods, reflecting the build-up of inventory stocks in the recent past.
Expenditure on machinery and equipment imports declined by 34.4 per cent, due to
the decline in almost all categories of machinery and equipment except textile
industry machinery, audio and video related apparatus and hand and machinery
4
tools. Import expenditure on building materials declined by 8.7 per cent mainly due
to lower imports of iron steel and cement. Transport equipment declined by 20.5 per
cent due to a reduction in imports of almost all sub categories except buses and parts
of aircrafts.
Meanwhile, expenditure on consumer goods imports recorded a 4.2 per cent growth,
year-on-year, to US dollars 278 million in May 2014 recording increases in both food
and non-food consumer goods categories. With respect to food imports, expenditure
on cereals and milling industry products increased significantly, mainly due to a
substantial increase in rice imports. However, import expenditure on vegetables, oils
and fat, seafood and fruits declined in May 2014. Imports of non-food consumer
goods, increased marginally by 0.4 per cent, mainly due to a 41.4 per cent increase in
import of clothing and accessories and a 10.3 per cent increase in import of personal
motor vehicles. However, import of home appliances and medical and
pharmaceuticals declined in May 2014.
Earnings from Tourism in the Services Account of the BOP
The cumulative growth in tourist arrivals up to May 2014 was recorded at 26.5 per
cent to 624,178. On a cumulative basis, earnings from tourism recorded an
impressive growth of 35.8 per cent to US dollars 901.8 million during the first five
5
months of 2014. Meanwhile, June tourist arrivals grew at a rate of 14.3 per cent, year-
on-year, to 103,175, while earnings from tourism increased by 22.7 per cent to US
dollars 149.1 million. The top five sources of tourist arrivals in June 2014 were India,
China, UK, Maldives and Australia accounting for about 47 per cent of tourist
arrivals during the month.
Current Transfers in the BOP
Workers’ remittances increased by 8.8 per cent, year-on-year, to US dollars 557.5
million in May 2014 from US dollars 512.4 million in May 2013. Workers’ remittances
during the period from January to May 2014 grew by 10.5 per cent to US dollars
2,774.8 million compared to US dollars 2,510.7 million recorded in the corresponding
period in 2013. The growth in remittances continues to be driven by increased labour
migration in the professional and skilled categories.
Financial Account of the BOP
Net inflows to the Government securities market from January to end May 2014
amounted to US dollars 229.4 million, which comprised net inflows to Treasury bills
and Treasury bonds amounting to US dollars 92.3 million and US dollars 137.1
million, respectively. Long term loans obtained by the government during 2014 upto
end May 2014 amounted to US dollars 820.9 million, compared to US dollars 685.3
million recorded during the corresponding period in 2013. Meanwhile, the inflows to
the Licensed Commercial Banks (LCBs) and Licensed Specialised Banks (LSBs)
during the first five months in 2014 amounted to US dollars 93.8 million. Further, net
foreign inflows to the Colombo Stock Exchange (CSE) in May 2014 amounted to US
dollars 69.9 million compared to US dollars 35.4 million recorded in the
corresponding period in 2013. On a cumulative basis, the net inflows to the CSE upto
end May 2014 amounted to US dollars 19.3 million.

6
Overall BOP Position
During the year upto end May 2014, the overall BOP is estimated to have recorded a
surplus of US dollars 1,667.6 million compared to a surplus of US dollars 126.5
million recorded during the corresponding period of 2013.
International Reserve Position
By end May 2014, Sri Lanka’s gross official reserves amounted to US dollars 8.8
billion, while total foreign assets, which include foreign assets of the banking sector
amounted to US dollars 10.2 billion. In terms of months of imports, gross official
reserves were equivalent to 5.9 months of imports at end May 2014, while total
foreign assets were equivalent to 6.9 months of imports. It is noteworthy that a
healthy level of reserves was maintained, despite outflows on account of foreign debt
service payments of US dollars 987.4 million and IMF-SBA payments of US dollars
264.7 million.
Exchange Rate Behaviour
The domestic foreign exchange market has remained relatively stable year-to-date,
with the rupee marginally appreciating by 0.4 per cent against the US dollar during
the year upto 11 July 2014. Based on cross currency exchange rate movements, the
Sri Lanka rupee appreciated against the euro by 1.9 per cent, the Canadian dollar by
0.2 per cent and the Chinese renminbi by 2.8 per cent. In the meantime, the rupee
depreciated against the Japanese yen by 3.1 per cent, the pound sterling by 3.4 per
cent, the Indian rupee by 2.5 per cent, the Singapore dollar by 1.5 per cent and the
Australian dollar by 4.6 per cent during this period.
7
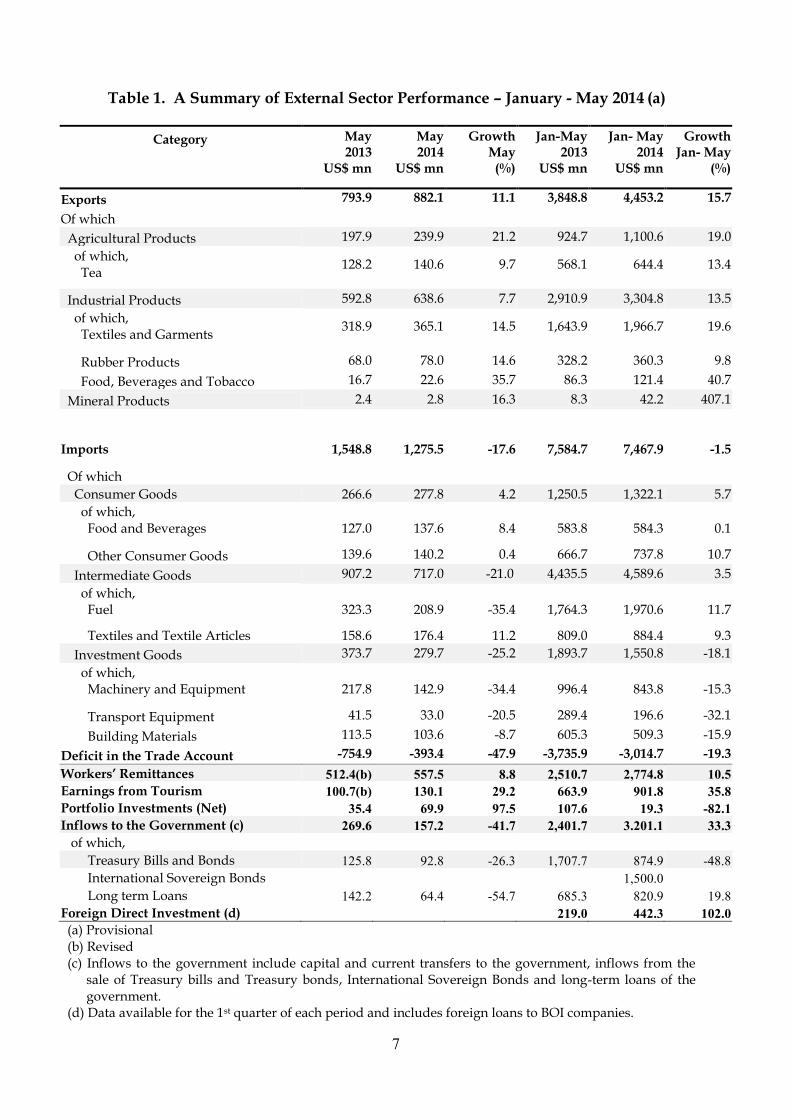
Table 1. A Summary of External Sector Performance – January - May 2014 (a)
Category
May 2013
US$ mn
May 2014
US$ mn
Growth May (%)
Jan-May 2013
US$ mn
Jan- May 2014
US$ mn
Growth Jan- May
(%)
Exports 793.9 882.1 11.1 3,848.8 4,453.2 15.7
Of which
Agricultural Products 197.9 239.9 21.2 924.7 1,100.6 19.0
of which, Tea
128.2 140.6 9.7 568.1 644.4 13.4
Industrial Products 592.8 638.6 7.7 2,910.9 3,304.8 13.5
of which, Textiles and Garments
318.9 365.1 14.5 1,643.9 1,966.7 19.6
Rubber Products 68.0 78.0 14.6 328.2 360.3 9.8
Food, Beverages and Tobacco 16.7 22.6 35.7 86.3 121.4 40.7
Mineral Products 2.4 2.8 16.3 8.3 42.2 407.1
Imports 1,548.8 1,275.5 -17.6 7,584.7 7,467.9 -1.5
Of which
Consumer Goods 266.6 277.8 4.2 1,250.5 1,322.1 5.7
of which, Food and Beverages 127.0 137.6 8.4 583.8 584.3 0.1
Other Consumer Goods 139.6 140.2 0.4 666.7 737.8 10.7
Intermediate Goods 907.2 717.0 -21.0 4,435.5 4,589.6 3.5
of which, Fuel 323.3 208.9 -35.4 1,764.3 1,970.6 11.7
Textiles and Textile Articles 158.6 176.4 11.2 809.0 884.4 9.3
Investment Goods 373.7 279.7 -25.2 1,893.7 1,550.8 -18.1
of which, Machinery and Equipment 217.8 142.9 -34.4 996.4 843.8 -15.3
Transport Equipment 41.5 33.0 -20.5 289.4 196.6 -32.1
Building Materials 113.5 103.6 -8.7 605.3 509.3 -15.9
Deficit in the Trade Account -754.9 -393.4 -47.9 -3,735.9 -3,014.7 -19.3
Workers’ Remittances 512.4(b) 557.5 8.8 2,510.7 2,774.8 10.5
Earnings from Tourism 100.7(b) 130.1 29.2 663.9 901.8 35.8
Portfolio Investments (Net) 35.4 69.9 97.5 107.6 19.3 -82.1
Inflows to the Government (c) 269.6 157.2 -41.7 2,401.7 3.201.1 33.3
of which,
Treasury Bills and Bonds 125.8 92.8 -26.3 1,707.7 874.9 -48.8
International Sovereign Bonds 1,500.0
Long term Loans 142.2 64.4 -54.7 685.3 820.9 19.8
Foreign Direct Investment (d) 219.0 442.3 102.0
(a) Provisional (b) Revised (c) Inflows to the government include capital and current transfers to the government, inflows from the
sale of Treasury bills and Treasury bonds, International Sovereign Bonds and long-term loans of the government.
(d) Data available for the 1st quarter of each period and includes foreign loans to BOI companies.