external quality assessment survey for ... - sysmex.co.jp · sysmex journal international vol. 19...
TRANSCRIPT

Sysmex Journal International Vol. 19 No. 2 (2010)
− 1 −
To evaluate the inter-laboratory variation of CBC parameters among hematology laboratories in Mongolia, we first set up theExternal Quality Assessment (EQA) scheme, called "Mongolian External Quality Assessment Scheme (MEQAS) forHematology" in the national capital (Ulaanbaatar) region in 2008, under organization of Ministry of Health. Control blood andfresh whole blood were used to investigate the effectiveness of survey materials for the national and local EQA scheme, where awide range of technology and methods are implemented among laboratories. The number of participants has been increasing;56 for 1st, 90 for 2nd and 106 for 3rd MEQAS in 2008 and 2009. To evaluate each laboratory's result, we divided into 2 peergroups (G1: automated hematology analyzer, G2: manual method) and calculate standard deviation index (SDI) based on peergroup mean and group SD. The ratio of G1: Auto and G2: Manual were 61% and 39%, respectively in the 3rd MEQAS. 3 units ofstandard hematology analyzers were used for validating the accuracy of peer group mean and monitoring the quality of surveymaterials. The peer group mean for CBC 5 parameters of G1: Auto were very close to the target values assigned by the standardanalyzers. As for the inter-laboratory variation, G1: Auto showed smaller CV% values than G2: Manual (e.g. 3.8% (G1) and7.3% (G2) for HGB). From these surveys, we obtained a good reference and clues for future laboratory improvement.
Complete Blood Count, External Quality Assessment (EQA), Hematology
Received 23 October, 2009; Accepted 18 Deccember, 2009
Key Words
External Quality Assessment Survey forHematological Laboratories in Mongolia
Artbazar BAYARZAYA*1, Sukhee ENKHZAYA*1, Gurjav NARAN*1 and Atsushi SHIRAKAMI*2
*1 The Referral laboratory in Hematology, Shastin Central Hospital, Ard Ayush No 1, Bayangol district, Ulaanbaatar, Mongolia*2 Scientific Affairs, Sysmex Corporation,1-3-2, Murotani, Nishiku, Kobe 651-2241, Japan
INTRODUCTIONMongolia is a landlocked country in the northern part ofCentral Asia located between Russia and China, with arelatively small population (2.5 million) living a largegeographical territory of 1.56 million square kilometer.Administratively Mongolia is divided into 21 provinces.The capital city is Ulaanbaatar of Mongolia, where 1.2million of the total population lives. Hematologylaboratories, over the capital city and 21 provincesincluding governmental and private sectors in thiscountry, have to take responsibility for providinghematology data. A wide range of technology andmethods have been implemented among theselaboratories. Harmonization of the hematologylaboratories with standard service all over the country isthe major goal to reach. We organized the MEQAS(Mongolian External Quality Assessment Scheme) in2008 on basis of the cooperation agreement between theMinistry of Health (Mongolia) and Sysmex Corporation(Kobe, Japan) in the establishment of a hematologyexternal quality control and reference laboratory systemin Mongolia. We report our 1-year experience ofMEQAS as the national project, covering increasing
numbers of laboratory members. In 2008-2009 years weset up 1st, 2nd, 3rd MEQAS in Mongolia. This is the reportof these surveys.
MATERIALS AND METHODS
Materials
Survey Materials
In each survey, the following two kinds of surveymaterials were used;
Sample A : Eightcheck-C® Normal Level (2.0 mL / vial) *
Sample B : Fresh Whole Blood Sample **
* Hematology Control Material provided by SysmexCorporation
** Under cooperation of National Center forTransfusiology, a fresh whole blood sample wasdrawn from a healthy donor and prepared on the sameday of sample delivery, according to the proceduresreported by Kondo et al 1).

Sysmex Journal International Vol. 19 No. 2 (2010)
− 2 −
Standard Analyzers
3 units of fully-automated standard analyzers (KX-21,pocH-100i, XS-1000i), installed at the Shastin CentralHospital, were used to assign the target values for thesurvey materials. These standard analyzers have beencalibrated with SCS-1000® (Sysmex Corporation, Kobe,Japan) before the survey, and monitored with hematologycontrols, e-CHECK(XS)® (Sysmex Corporation, Kobe,Japan) and EIGHTCHECK-3WP® (Sysmex Corporation,Kobe, Japan) on daily basis.
Methods
Instructions & Sample Distribution
On every survey, the workshop was held to giveguidance and distribute the survey samples to eachparticipant. (Fig. 1, Fig. 2 (a), (b)).
Fig. 1 Photo of survey workshop
(a) (b)
Fig. 2 Instructions (a) and Data Submission Sheet (b)

Sysmex Journal International Vol. 19 No. 2 (2010)
− 3 −
Categorization of Peer Group
Participating data were divided into two peer groups,based on methodology; Group 1: automated hematologyanalyzer group (G1: Auto), Group 2: manual methodgroup (G2: Manual). Each laboratory was given IDnumber and was asked to analyze the samples 3 timesand report all data for the CBC 5 parameters.
Statistical Evaluation Method
After categorizing into the above two groups, results foreach participant were evaluated and expressed accordingto peer group mean and standard deviation index (SDI)methods. The group mean was derived from the groupmean after removing outliers detected by double-
truncation with ± 3SD. The SDI was calculatedaccording to the following formula:
SDI = (Participant Data - Peer Group Mean)/ PeerGroup SD
The SDI indicates the relative position of eachparticipant. See report form and historical SDI reportform (Fig. 3 (a), (b)).
Scoring System
Based on the historical SDI data, continuous laboratoryperformance was evaluated as "converted-score" for thesurvey programs (Table 1 (a), (b)).
Table 1 Basic Rule of "Scoring System"
(a) Scoring Rule (b) An example of scoring based on SDI values
SDI
0 ~ ±1.0
±1.0 ~ ±2.0
±2.0 ~ ±3.0
±3.0 ~ ±4.0
±4.0 ~ ±5.0
±5.0 ~
Score
5
4
3
2
1
0
SDI
Sample A (WBC)
Sample B (WBC)
1st
0.11
-0.14
2nd
2.50
3.41
3rd
0.40
1.50
Score
Sample A (WBC)
Sample B (WBC)
Score
1st
5
5
10
2nd
3
2
5
3rd
5
4
9
(a) (b)
Fig. 3 Report Form (a) and Histrical SDI Report Form (b)

Sysmex Journal International Vol. 19 No. 2 (2010)
− 4 −
Determining the Target Values
The target values of the survey samples were assigned,based on the multiple measurement (n = 20) with thestandard analyzers of Shastin Central Hospital.
Monitoring the Quality of the Survey Samples
During the period of the survey, the stability of thesurvey samples was monitored on the standard analyzersin Shastin Central Hospital.
RESULTS
Participating laboratories
Table 2 shows the change in the number of participatinglaboratories and its peer group from 1st to 3rd survey. Thetotal number of participating laboratories has increased
from 56 to 106. The percentage of G1: Auto and G2:Manual was 61% and 39%, respectively in the 3rd
MEQAS.
Fig. 4 shows the change in the number of participants bymanufacturer (G1: Auto) from 1st to 3rd survey. It wasfound that a wide variety of manufacturers' analyzerswere used among the laboratories.
STATISTICAL SUMMARY OF 3rd
MEQAS
The statistical results for sample A (control blood) andsample B (fresh whole blood) of the 3rd MEQAS aresummarized in Table 3 (a) ~ (d).
Fig. 5 (1) ~ (10) shows the Box plots by peer group forthe CBC 5 parameters of the 3rd MEQAS.
total
G1: Auto
G2: Manual
Number of participant
Period of survey
1st MEQAS
July, 2008
56
43 (74%)
15 (26%)
2nd MEQAS
December, 2008
90
55 (61%)
35 (39%)
3rd MEQAS
June, 2009
106
65 (61%)
41 (39%)
Table 2 Summary of 1st - 3rd MEQAS
Surv
ey
1st
2nd
3rd
0
9
1515
1919 1919 8 1010 3 2 2 2
1616 8 7 5 2 20
1515 6 3 6 1 3 09
15
19 19 8 10 3 2 2 2
16 8 7 5 2 20
15 6 3 6 1 3 0
10 20 30 40 50 60 70 # of participants
SysmexSwelabHumanMindrayHospitexB.CoulterERMAOthers
Fig. 4 Change of number of participants by manufacturer (G1: Auto)

Sysmex Journal International Vol. 19 No. 2 (2010)
− 5 −
Parameter
MEAN
SD
CV%
MAX
MIN
N
(a) Sample A (G1: Auto)
WBC
7.09
0.44
6.2%
8.23
6.07
63
RBC
4.239
0.196
4.6%
4.703
3.720
64
HGB
13.08
0.52
4.0%
14.70
11.77
63
HCT
36.34
2.08
5.7%
43.0
32.7
63
MCV
85.70
4.45
5.2%
97.8
77.4
64
MCH
31.21
1.88
6.0%
36.6
27.0
63
MCHC
36.33
2.55
7.0%
42.8
29.5
64
PLT
214.2
25.1
11.7%
270.7
148.7
64
Parameter
MEAN
SD
CV%
MAX
MIN
N
(b) Sample A (G2: Manual)
WBC
5.64
1.23
21.8%
7.73
2.97
40
RBC
3.937
0.551
14.0%
4.927
2.363
40
HGB
13.07
1.04
8.0%
14.67
10.93
39
HCT
35.50
3.78
10.6%
43.5
31.0
9
MCV
90.86
16.39
18.0%
131.2
79.2
9
MCH
33.18
5.42
16.3%
48.2
17.9
39
MCHC
38.16
3.26
8.5%
43.5
33.6
9
PLT
218.8
40.0
18.3%
313.0
103.3
34
Parameter
MEAN
SD
CV%
MAX
MIN
N
(c) Sample B (G1: Auto)
WBC
6.10
0.50
8.3%
7.03
4.67
64
RBC
4.009
0.139
3.5%
4.320
3.643
63
HGB
12.48
0.48
3.8%
13.93
11.20
63
HCT
36.32
2.00
5.5%
42.3
30.6
64
MCV
90.24
3.70
4.1%
98.8
79.4
61
MCH
31.25
1.84
5.9%
36.8
26.3
64
MCHC
34.52
2.09
6.0%
39.7
28.5
63
PLT
248.2
24.8
10.0%
302.7
173.0
63
Parameter
MEAN
SD
CV%
MAX
MIN
N
(d) Sample B (G2: Manual)
Note: The above statistical results were obtained after excluding outliers outside Mean +/- 3SD.
Unit: WBC ( × 103/µL), RBC ( × 106/µL), HGB(g/dL), HCT(%), MCV(fL), MCH(pg), MCHC(g/dL), PLT ( × 103/µL)
WBC
5.34
1.07
20.1%
7.07
2.63
40
RBC
3.802
0.425
11.2%
4.750
2.667
41
HGB
12.57
0.92
7.3%
14.67
9.90
40
HCT
38.19
3.17
8.3%
43.5
34.8
9
MCV
99.50
14.70
14.8%
133.3
87.7
9
MCH
32.88
3.30
10.0%
41.4
23.7
39
MCHC
34.20
1.99
5.8%
36.8
30.8
9
PLT
215.5
40.0
18.6%
325.0
133.3
35
Table 3 Statistical Summary (3rd MEQAS)

Sysmex Journal International Vol. 19 No. 2 (2010)
− 6 −
(1) WBC / Sample A (2) WBC / Sample B
(3) RBC / Sample A (4) RBC / Sample B
(5) HGB / Sample A (6) HBG / Sample B
A11 (G1+G2)
G1: Auto
G2: Manual
A11 (G1+G2)
G1: Auto
G2: Manual
A11 (G1+G2)
G1: Auto
G2: Manual
A11 (G1+G2)
G1: Auto
G2: Manual
A11 (G1+G2)
G1: Auto
G2: Manual
A11 (G1+G2)
G1: Auto
G2: Manual
Fig. 5 Box plots by peer group for CBC 5 parameters (3rd MEQAS)
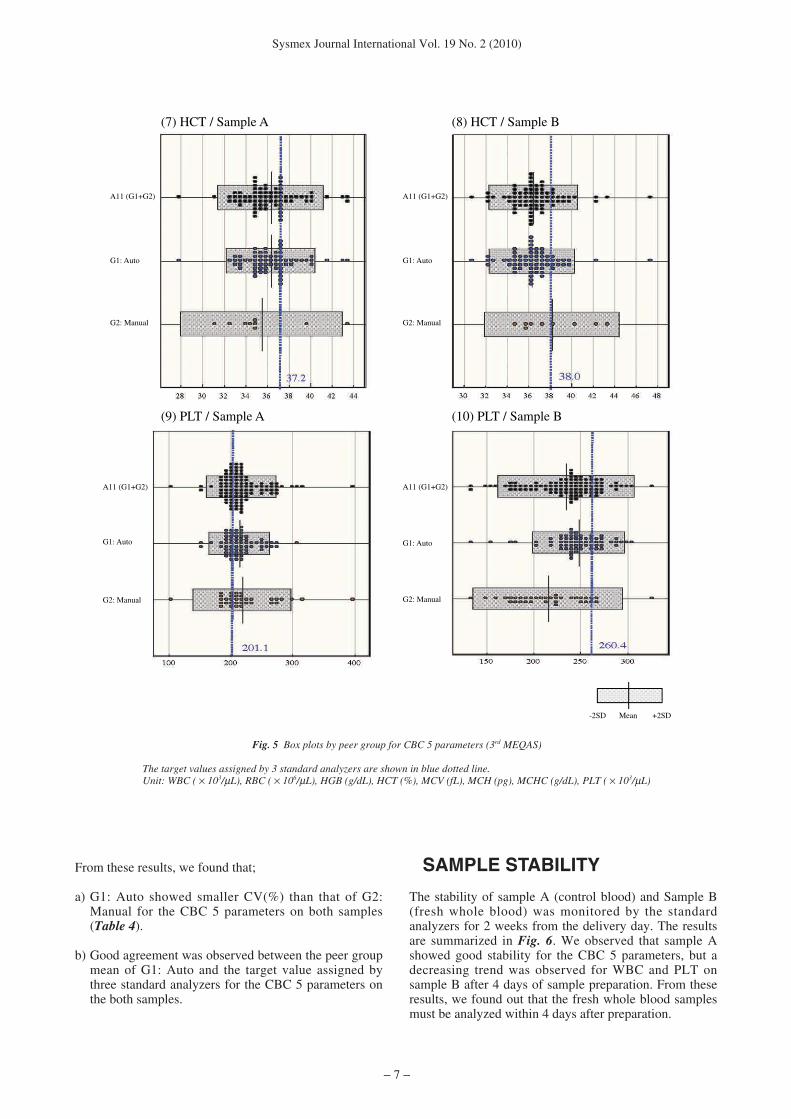
From these results, we found that;
a) G1: Auto showed smaller CV(%) than that of G2:Manual for the CBC 5 parameters on both samples(Table 4).
b) Good agreement was observed between the peer groupmean of G1: Auto and the target value assigned bythree standard analyzers for the CBC 5 parameters onthe both samples.
SAMPLE STABILITY
The stability of sample A (control blood) and Sample B(fresh whole blood) was monitored by the standardanalyzers for 2 weeks from the delivery day. The resultsare summarized in Fig. 6. We observed that sample Ashowed good stability for the CBC 5 parameters, but adecreasing trend was observed for WBC and PLT onsample B after 4 days of sample preparation. From theseresults, we found out that the fresh whole blood samplesmust be analyzed within 4 days after preparation.
Sysmex Journal International Vol. 19 No. 2 (2010)
− 7 −
(7) HCT / Sample A (8) HCT / Sample B
(9) PLT / Sample A (10) PLT / Sample B
A11 (G1+G2)
G1: Auto
G2: Manual
A11 (G1+G2)
G1: Auto
G2: Manual
A11 (G1+G2)
G1: Auto
G2: Manual
A11 (G1+G2)
G1: Auto
G2: Manual
-2SD Mean +2SD
Fig. 5 Box plots by peer group for CBC 5 parameters (3rd MEQAS)
The target values assigned by 3 standard analyzers are shown in blue dotted line. Unit: WBC ( × 103/µL), RBC ( × 106/µL), HGB (g/dL), HCT (%), MCV (fL), MCH (pg), MCHC (g/dL), PLT ( × 103/µL)

Sysmex Journal International Vol. 19 No. 2 (2010)
− 8 −
Fig. 6 Comparison of Stability between Sample A (control blood) and Sample B (fresh whole blood)
6/18
6/19
6/20
6/21
6/22
6/23
6/24
6/25
6/26
6/27
6/28
6/29
6/30 7/1
Date
6/18
6/19
6/20
6/21
6/22
6/23
6/24
6/25
6/26
6/27
6/28
6/29
6/30 7/1
Date
6/18
6/19
6/20
6/21
6/22
6/23
6/24
6/25
6/26
6/27
6/28
6/29
6/30 7/1
Date
6/18
6/19
6/20
6/21
6/22
6/23
6/24
6/25
6/26
6/27
6/28
6/29
6/30 7/1
Date
6/18
6/19
6/20
6/21
6/22
6/23
6/24
6/25
6/26
6/27
6/28
6/29
6/30 7/1
Date
6/18
6/19
6/20
6/21
6/22
6/23
6/24
6/25
6/26
6/27
6/28
6/29
6/30 7/1
Date
WBC ( × 103/µL) RBC ( × 106/µL) PLT ( × 103/µL)
WBC ( × 103/µL) RBC ( × 106/µL) PLT ( × 103/µL)
9.0 4.6
7.0
6.0
5.0
4.0
3.0
2.0
1.0
250
240
230
220
210
200
190
180
170
160
4.5
4.5275
265
255
245
235
225
215
205
195
185
4.4
4.3
4.2
4.1
4.0
3.9
3.8
4.4
4.3
4.2
4.1
4.0
8.0
7.0
6.0
5.0
XS-1000i KX-21 pocH-100i Sample delivery day
(1) Sample A stability
(2) Sample B stability
Parameter
Sample A(Control Blood)
Sample B(Fresh Whole Blood)
Peer Group
G1: Auto
G2: Manual
G1: Auto
G2: Manual
WBC
6.2%
21.8%
8.3%
20.1%
RBC
4.6%
14.0%
3.5%
11.2%
HGB
4.0%
8.0%
3.8%
7.3%
HCT
5.7%
10.6%
5.5%
8.3%
PLT
11.7%
18.3%
10.0%
18.6%
Table 4 Comparison of CV% by peer group (from 3rd MEQAS results)

CHANGE OFINTER-LABOLATORY CV
Fig. 7 shows the time-series change of inter-laboratoryvariation (CV) from 1st to 3rd MEQAS by sample (A:control blood, B: fresh whole blood) and peer group (G1:Auto, G2: Manual) for WBC, RBC, HGB and PLT.From these result, we found that;
a) For RBC and PLT, CVs of G1: Auto has beendecreasing for the both samples. (e.g. for PLT, CV ofsample B has decreased from 14.5% to 10.0%)
b) For WBC, G2: Manual data showed different trendbetween sample A and sample B. CVs of G1: Autowere stable through 1st to 3rd survey.
c) For HGB, CVs of G2 : Manual showed decreasingtrend for the both samples.
d) G1: Auto data showed much lower CV values thanG2: Manual for all parameters.
Sysmex Journal International Vol. 19 No. 2 (2010)
− 9 −
A - G1: Auto A - G2: Manual B - G1: Auto B - G2: Manual
WB
C-C
V (
%)
RB
C-C
V (
%)
HG
B-C
V (
%)
PLT
-CV
(%
)
1st 2nd 3rd
30.0
12.0
10.0
8.0
6.0
4.0
2.0
0.0 0.0
5.0
10.0
15.0
20.0
25.0
25.0
20.0
15.0
10.0
5.0
0.01st 2nd 3rd
1st 2nd 3rd 1st 2nd 3rd
18.0
0.0
2.0
4.0
6.0
8.0
10.0
12.0
14.0
16.0
Fig. 7 Time-series change of CV among 1st, 2nd and 3rd MEQAS (by peer group)

DISCUSSION
Since 2008, under collaboration between the Ministry ofHealth and Sysmex Corporation, we've established aunique External Quality Assessment Scheme forhematological laboratories in Mongolia, on the followingpoints;
• Setting up the referral laboratory in Hematology toassign the target values and monitor sample stability
• Holding workshop for guidance and sample delivery toparticipants
• Evaluating laboratory's data based on SDI methodusing control blood and fresh whole blood
• Holding scientific seminar on QC/QM concepts(IQC/EQA, Traceability, ISO15189) to educateparticipants for improving the laboratory performance
The total numbers of participating laboratories haveincreased from 56 (1st) to 106 (3rd) laboratories in 1 year.As was expected results from the group with automationis in better control than the manual method.
Examination of the 1st to 3rd MEQAS, shows the EQAresults to be at a satisfactory level — only a minority ofthe participating members (15.6%) were out of range.
Some of laboratory's results are out of range ± 3SD andpoor repeatability is also not acceptable. This is why weneed to improve the ACTION, follow by PDCA cycle inthese laboratories:
a) Check the analyzer and reagentb) Do and check internal QCc) Check pre- and post- analytical process
However, to enroot the continuous laboratoryimprovement activities nationwide in this country, weneed to improve the EQA scheme step-by-step andmotivate laboratories to participate in such EQA schemecontinuously.
ACKNOWLEDGEMENTS
Here we would like to thank Mr. Keiji Fujimoto ofSysmex Corporation for his technical assistance andfruitful discussions.
References1) Kondo H et al. A method of preparing fresh blood samples for
external quality assessment. Journal of Analytical Bio-Science.2002; 25(3): 275-278.
Sysmex Journal International Vol. 19 No. 2 (2010)
− 10 −