external forces driving isu’s future national trends and hoosier realities
TRANSCRIPT

External Forces External Forces Driving Driving
ISU’s FutureISU’s Future
National Trends and National Trends and Hoosier RealitiesHoosier Realities
The World is ChangingThe World is Changing
Year 2000 is less than 30 Months away

Six External Forces are Six External Forces are Helping Drive Changes at Helping Drive Changes at
ISUISUPublic
Perception
Economy/F
iscal Accountability
Technology Demographics
CompetitionCompetition
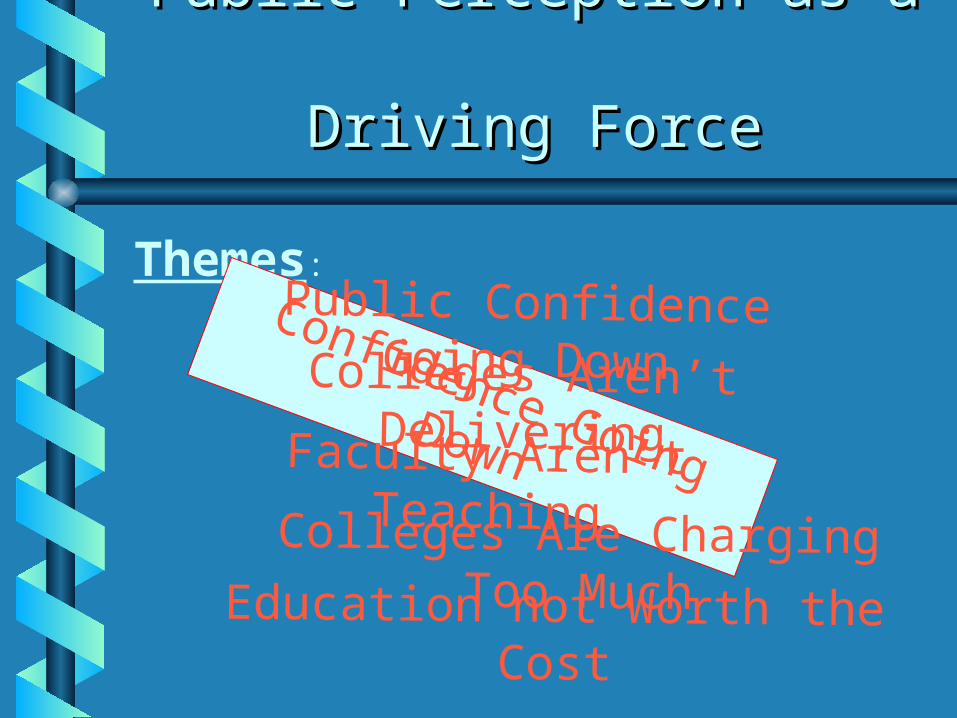
Public Perception as a Public Perception as a Driving ForceDriving Force
Themes:
Confidence Going Down
Public Confidence Going Down
Colleges Aren’t Delivering
Education not Worth the Cost
Faculty Aren’t TeachingColleges Are Charging Too
Much

Public Perception as a Public Perception as a Driving ForceDriving Force
The NewsHour with Jim LehrerThe NewsHour with Jim LehrerMay 1, 1997May 1, 1997
Rep. Buck McKeon, Rep. Buck McKeon, Chairman, Committee on Chairman, Committee on
EducationEducation

Accountability as a Driving Accountability as a Driving ForceForce
at the National Levelat the National Level
Student Right-to-know Act in full swing
National Panel to Study Higher Ed Costs Named
Faculty Tenure being QuestionedDepartment of Justice
impacting International EnrollmentsFlorida forces articulation and
limits subsidies to set number of credit hours

The Impact of The Impact of Accountability on Indiana Accountability on Indiana
and onand on ISU ISU
Greater Scrutiny ISU asked to provide information n :
Faculty WorkloadFinances
Enrollment
Student Success (Graduation & Retention)
Student Mix

The Impact of The Impact of Accountability on Indiana Accountability on Indiana and onand on ISU ISU
Greater Involvement -
ICHE sets performance objectives for ISU:Increase matriculation of high school students in service area
Accept high percentage of students completing CORE 40
Increase 21st Century Scholars
Retention and graduation ratesAsks for justification of financingLegislators becoming more involved

The Impact of The Impact of Accountability on Indiana Accountability on Indiana and onand on ISU: An Example ISU: An Example
Student Right to Know:
Public Law 101-542
1990
Student Success in College a
National Concern

The Impact of The Impact of Accountability on Indiana Accountability on Indiana and onand on ISU: An Example ISU: An Example
ICHE Begins to Gather
Graduation & Retention Data
ICHE sets performance objectives by school
Commission proposing funding formulas take into account student
success.
REVIEW DRAFT: NOT FOR CITATION OR DISTRIBUTIONAUGUST 1, 1997
REPORT ON DEGREE COMPLETION AND PERSISTENCEIN INDIANA PUBLIC POSTSECONDARY EDUCATION,
1990 ENTERING FRESHMEN:
BIENNIEL REPORT TO THE GENERAL ASSEMBLY
August 1, 1997
Indiana Commission for Higher Education101 West Ohio Street, Suite 550
Indianapolis, Indiana 46204-1971Tel: (317) 464-4400Fax: (317) 464-4410
http://www.che.state.in.us
Retention &
Graduation
Report
Retention &
Graduation
Report
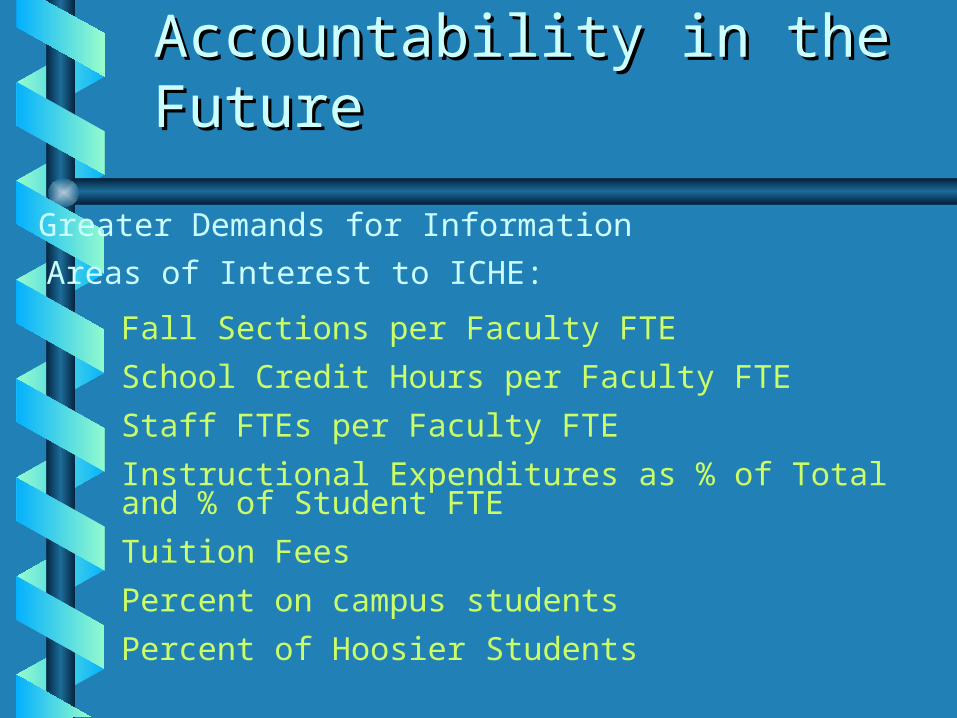
Accountability in the Accountability in the FutureFuture
Greater Demands for Information
Areas of Interest to ICHE:
Fall Sections per Faculty FTE
School Credit Hours per Faculty FTE
Staff FTEs per Faculty FTE
Instructional Expenditures as % of Total and % of Student FTE
Tuition Fees
Percent on campus students
Percent of Hoosier Students
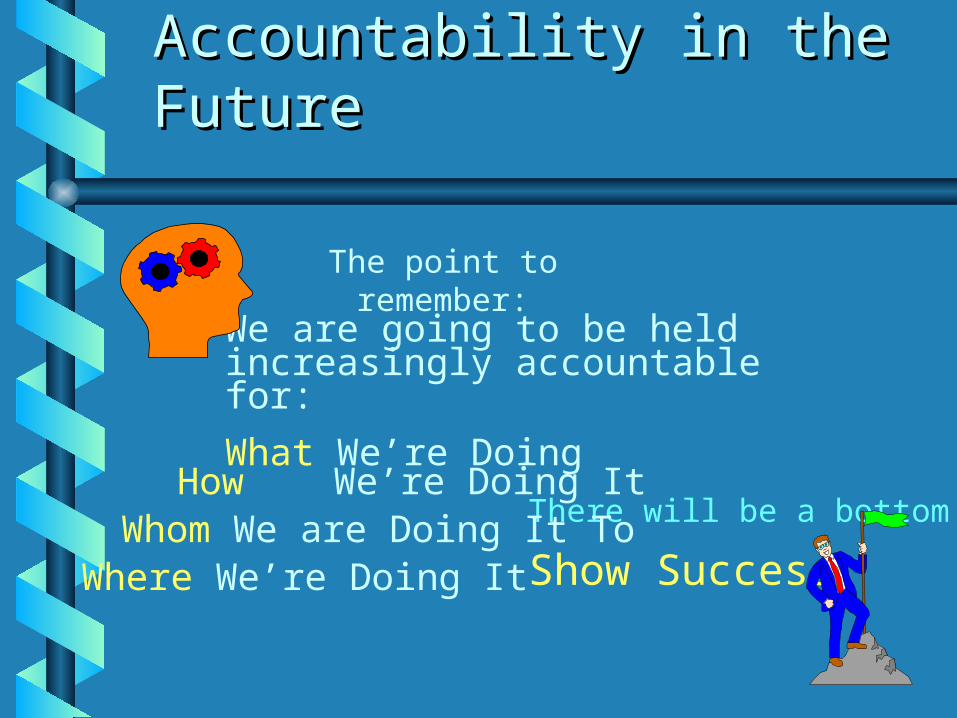
Accountability in the Accountability in the FutureFuture
The point to remember:
We are going to be held increasingly accountable for:
What We’re Doing
There will be a bottom line:
Show SuccessWhom We are Doing It To
Where We’re Doing It
How We’re Doing It

Demographics as a Driving Demographics as a Driving Force at the National Level Force at the National Level
Growth in Number of Traditional Growth in Number of Traditional StudentsStudents
Students will be more Ethnically Students will be more Ethnically DiverseDiverse
Students will be more Age DiverseStudents will be more Age Diverse

Percent Change in Number of High School Graduates, by Region: 1994-1995 to 2006-2007
0 0.1 0.2 0.3 0.4
Northeast
Midwest
South
West
Regio
n
Percent Change
Demographics as a Driving Force at the National Level

The Impact of The Impact of Demographics on Indiana Demographics on Indiana
and Indiana Stateand Indiana StateProjected H.S. Graduates 2007
% Increase 1997-2007
Number Projected

The Impact of The Impact of Demographics on Indiana Demographics on Indiana
and Indiana Stateand Indiana State
The Point to
ISU is not going to grow if it relies on its traditional markets:
a. Numbers in markets are small
b. Competition is increasing
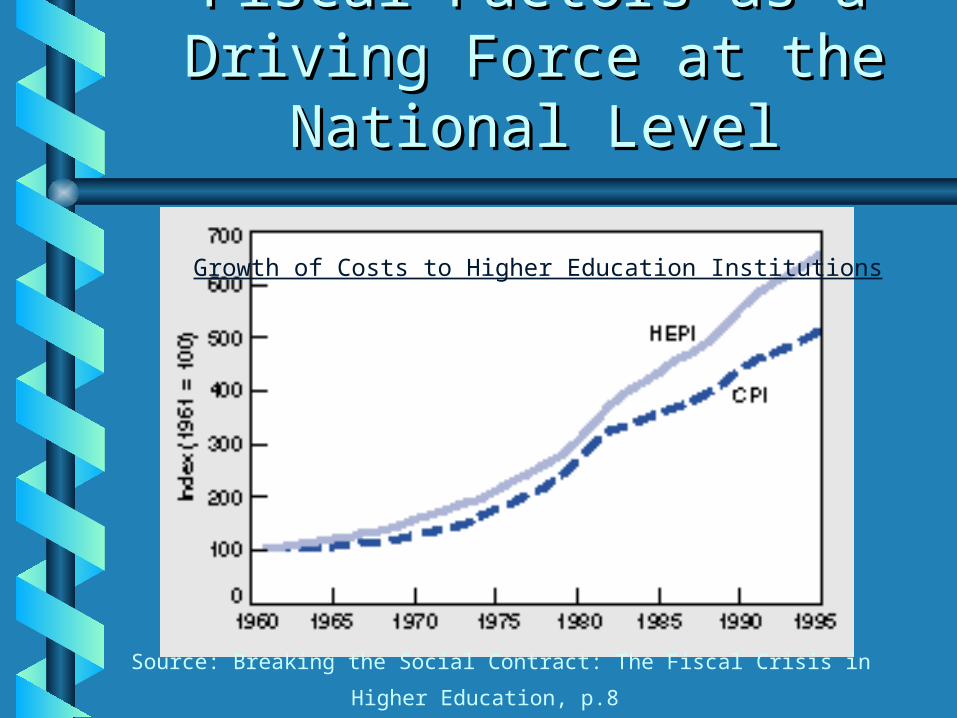
Fiscal Factors as a Driving Fiscal Factors as a Driving Force at the National LevelForce at the National Level
Source: Breaking the Social Contract: The Fiscal Crisis in Higher Education,
p.8
Growth of Costs to Higher Education Institutions

Fiscal Factors as a Driving Force for Fiscal Factors as a Driving Force for ISU:ISU:
ISU’s Operating Budget vs. CPIISU’s Operating Budget vs. CPI
0.00%
0.50%
1.00%
1.50%
2.00%
2.50%
3.00%
3.50%
Per
cen
t o
f In
crea
se
FY92 FY93 FY94 FY95 FY96
Increase in Operating Budget Increase in CPI

Fiscal Factors as a Driving Fiscal Factors as a Driving Force at the National LevelForce at the National Level
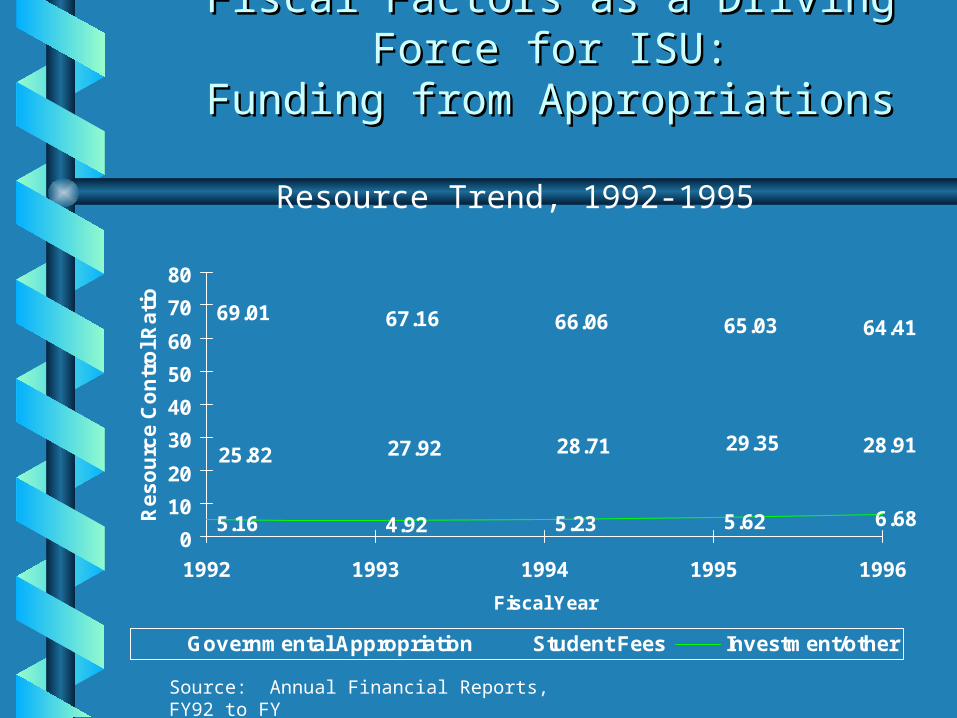
Fiscal Factors as a Driving Force for Fiscal Factors as a Driving Force for ISU:ISU:
Funding from AppropriationsFunding from Appropriations
69.01 67.16 66.06 65.03 64.41
25.82 27.92 28.71 29.35 28.91
5.16 4.92 5.23 5.62 6.680
10
20
30
40
50
60
70
80
1992 1993 1994 1995 1996
Fiscal Year
Re
so
urc
e C
on
tro
l Ra
tio
Governmental Appropriation Student Fees Investment/other
Source: Annual Financial Reports, FY92 to FY
Resource Trend, 1992-1995
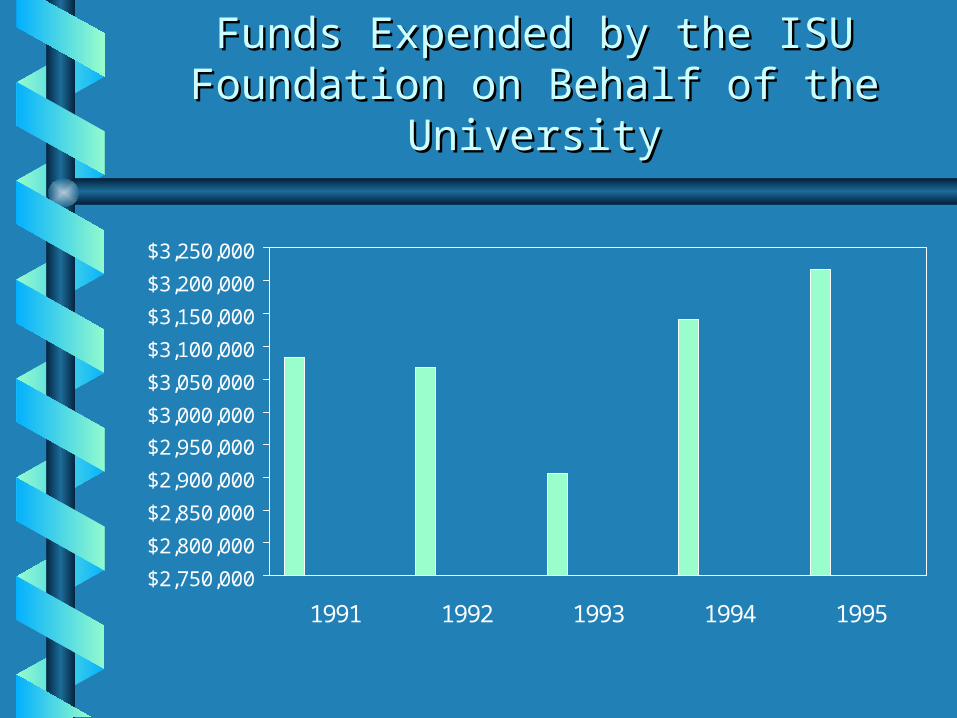
Fiscal Factors as a Driving Force for Fiscal Factors as a Driving Force for ISU:ISU:
Funds Expended by the ISU Funds Expended by the ISU Foundation on Behalf of the Foundation on Behalf of the
UniversityUniversity
$2,750,000
$2,800,000
$2,850,000
$2,900,000
$2,950,000
$3,000,000
$3,050,000
$3,100,000
$3,150,000
$3,200,000
$3,250,000
1991 1992 1993 1994 1995
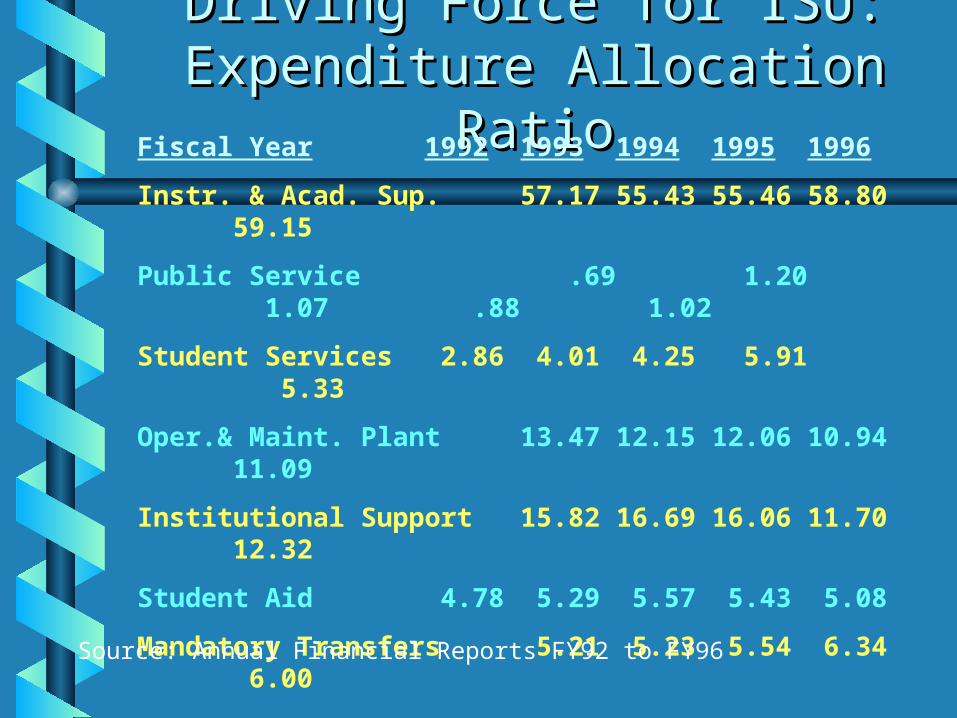
Fiscal Factors as a Driving Fiscal Factors as a Driving Force for ISU: Expenditure Force for ISU: Expenditure
Allocation RatioAllocation Ratio
Fiscal Year 1992 1993 1994 1995 1996
Instr. & Acad. Sup. 57.17 55.43 55.46 58.80 59.15
Public Service .69 1.20 1.07 .88 1.02
Student Services 2.86 4.01 4.25 5.91 5.33
Oper.& Maint. Plant 13.47 12.15 12.06 10.94 11.09
Institutional Support 15.82 16.69 16.06 11.70 12.32
Student Aid 4.78 5.29 5.57 5.43 5.08
Mandatory Transfers 5.21 5.23 5.54 6.34 6.00
Source: Annual Financial Reports FY92 to FY96

Fiscal Factors as a Driving Fiscal Factors as a Driving Force for ISU: Increase Force for ISU: Increase Efficiency of FinancesEfficiency of Finances
$0
$1
$2
$3
$4
$5
$6
FY92 FY93 FY94 FY95 FY96
Utilities as a % of Total E&G Expenditures
The Future Impact of Fiscal The Future Impact of Fiscal ForcesForces
Revenue sources will remain Revenue sources will remain relatively constantrelatively constant
New ongoing activities New ongoing activities will have to be funded will have to be funded with existing resourceswith existing resources
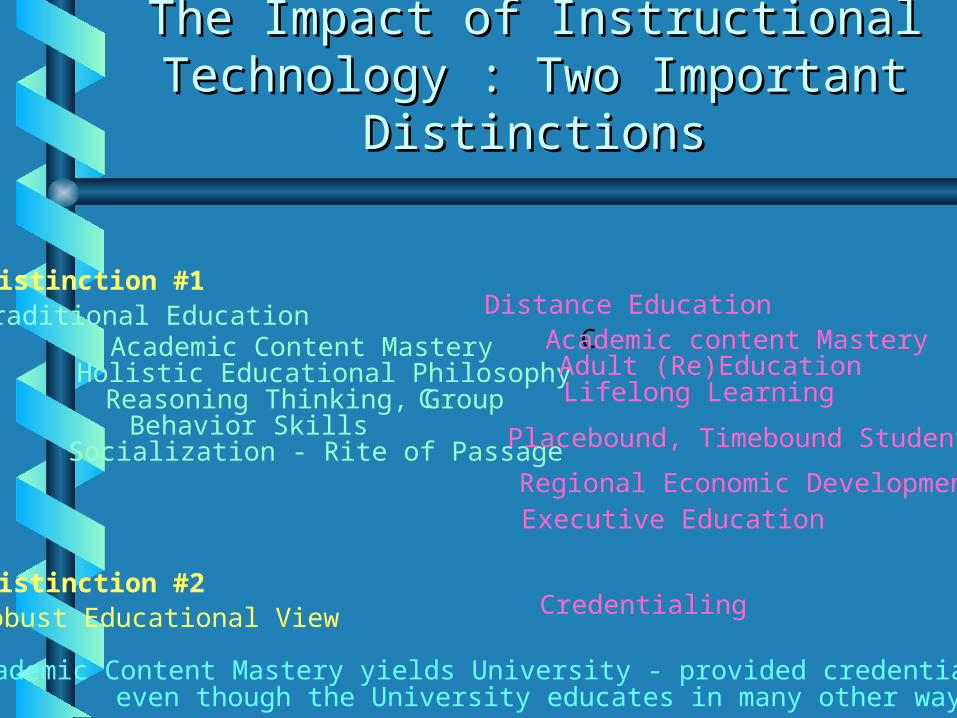
The Impact of Instructional The Impact of Instructional Technology : Two Important Technology : Two Important
DistinctionsDistinctions
Distinction #1Traditional Education Distance Education
Academic Content Mastery C Academic content Mastery Holistic Educational Philosophy Adult (Re)Education
C Reasoning Thinking, GroupBehavior Skills
Lifelong Learning
Socialization - Rite of Passage Placebound, Timebound Students Regional Economic Development
Executive Education
Distinction #2Robust Educational View Credentialing
Academic Content Mastery yields University - provided credentialseven though the University educates in many other ways

The Impact of Instructional The Impact of Instructional Technology: Two PropositionsTechnology: Two Propositions
PropositionProposition 1:1:
PropositionProposition 2:2:
Instructional Technology: driven Market forces will affect
ISU’s CoreTechnology (Teaching & Learning)
Instructional Technology: driven Market forces will affect
ISU’s CoreTechnology (Teaching & Learning)
Instructional Technology: driven expectations for flexibility
will affect ISU’s Access Mission
*Instructional Technology > Flexibility> Access
No Instructional Technology < Flexibility< Access
Instructional Technology: driven expectations for flexibility
will affect ISU’s Access Mission
*Instructional Technology > Flexibility> Access
No Instructional Technology < Flexibility< Access
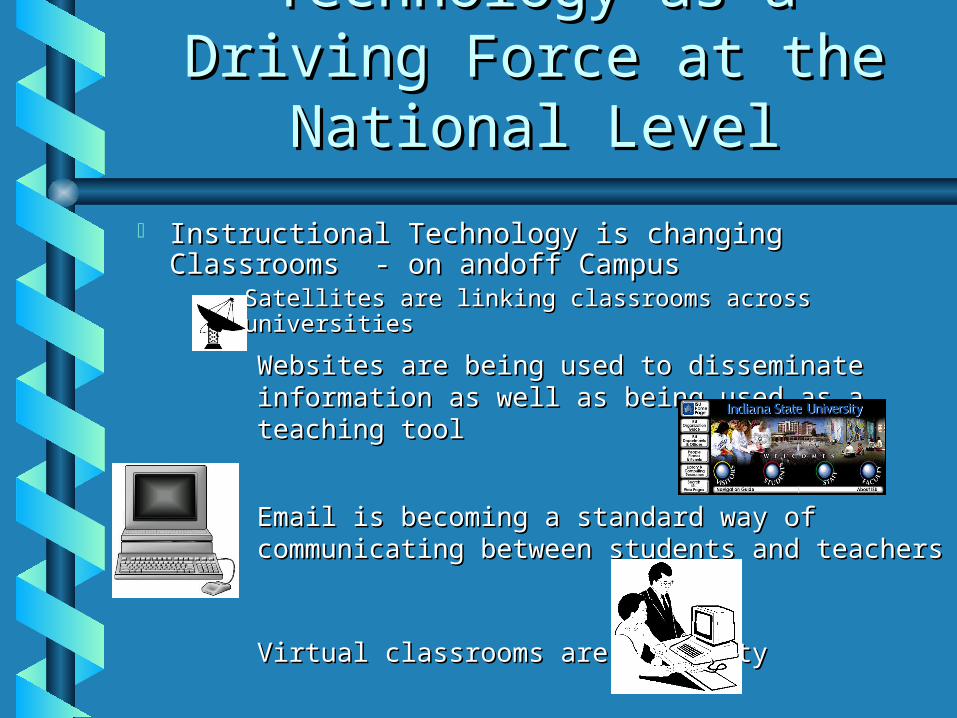
Technology as a Driving Technology as a Driving Force at the National LevelForce at the National Level
Instructional Technology is changing Classrooms Instructional Technology is changing Classrooms - on andoff Campus- on andoff Campus
– Satellites are linking classrooms across universitiesSatellites are linking classrooms across universities
Websites are being used to disseminate Websites are being used to disseminate information as well as being used as a teaching information as well as being used as a teaching tooltool
Email is becoming a standard way of Email is becoming a standard way of communicating between students and teacherscommunicating between students and teachers
Virtual classrooms are a realityVirtual classrooms are a reality
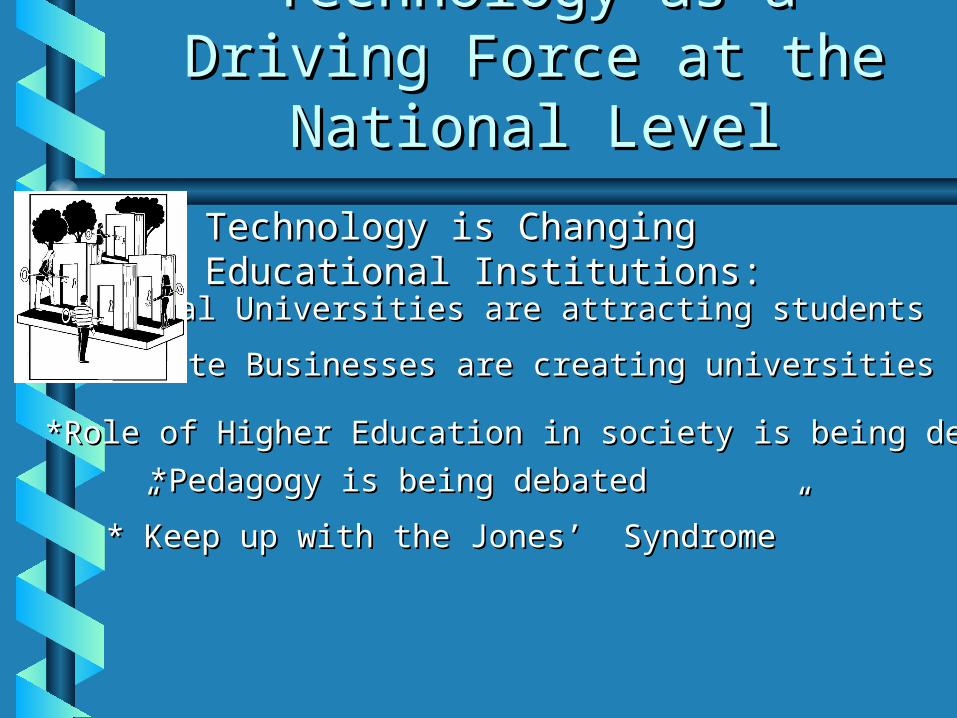
Technology as a Driving Technology as a Driving Force at the National LevelForce at the National Level
*Virtual Universities are attracting students*Virtual Universities are attracting students
*Private Businesses are creating universities*Private Businesses are creating universities
*”Keep up with the Jones’ Syndrome”*”Keep up with the Jones’ Syndrome”
*Pedagogy is being debated*Pedagogy is being debated*Role of Higher Education in society is being debated*Role of Higher Education in society is being debated
Technology is Changing Educational Technology is Changing Educational Institutions:Institutions:

The Impact of Technology The Impact of Technology on Indiana and ISUon Indiana and ISU
Technology is here: Technology is here: IU-BloomingtonIU-Bloomington is rated the best is rated the best prepared technological public prepared technological public campus in the country.campus in the country.Competitors are using technology to access Competitors are using technology to access new & existing marketsnew & existing markets Legislators are interested in funding Legislators are interested in funding technology to increase accesstechnology to increase accessLong distance vs. on campus education is an Long distance vs. on campus education is an issue throughout the stateissue throughout the state
The Impact of Technology The Impact of Technology on the Future of ISUon the Future of ISU
Technology is a Potent Technology is a Potent Tool Being Used in Tool Being Used in EducationEducationIt’s Use in Every It’s Use in Every Classroom is Expected Classroom is Expected and Supported by and Supported by National and Hoosier National and Hoosier policymakerspolicymakers
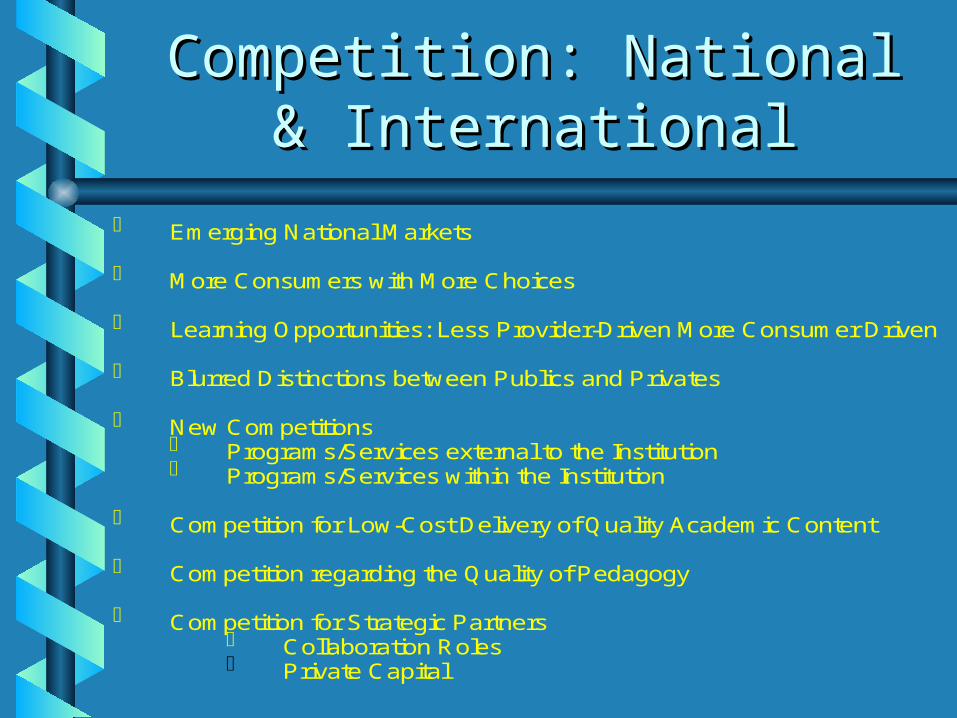
Competition: National & Competition: National & InternationalInternational
Emerging National Markets
More Consumers with More Choices
Learning Opportunities: Less Provider-Driven More Consumer Driven
Blurred Distinctions between Publics and Privates
New Competitions Programs/Services external to the Institution Programs/Services within the Institution
Competition for Low-Cost Delivery of Quality Academic Content
Competition regarding the Quality of Pedagogy
Competition for Strategic Partners Collaboration Roles Private Capital

Competition: IndianaCompetition: Indiana
Flat Residential Market Growth in Commuter Campuses Increase Competition for Market Share
Indiana Wesleyan Currency of Enrollments Marketing Expansion
Increase Competition for Residential Students ICHE Incentives USI Dorms IU Regionals Dorms
Expanded Interest in Distance Delivery Purdue Executive MBA Ivy Tech State College Ball State University Indiana University
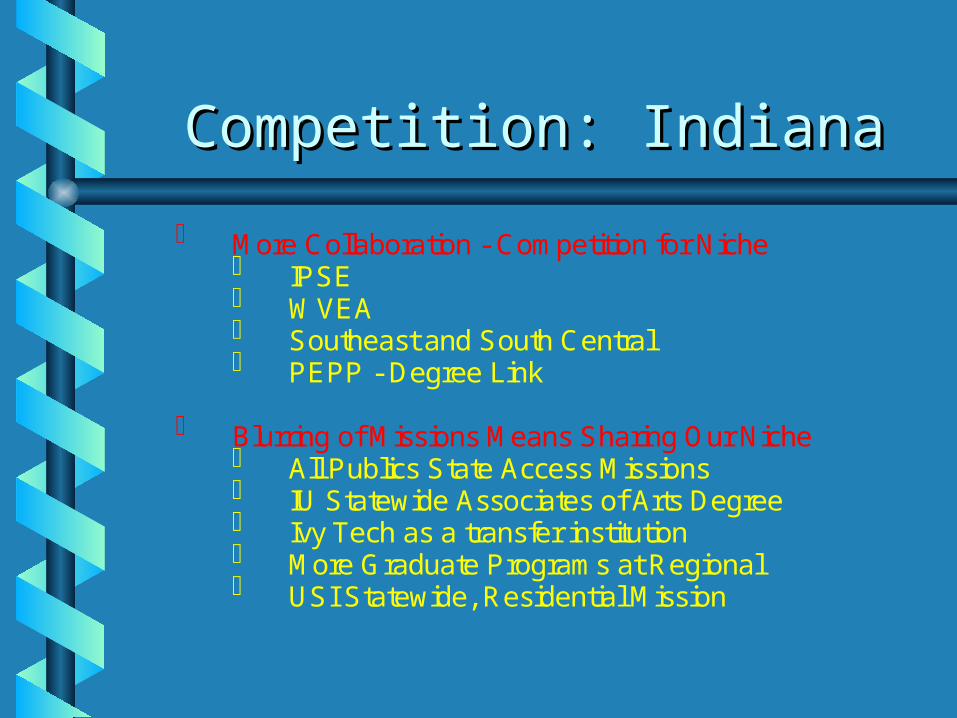
Competition: IndianaCompetition: Indiana
More Collaboration - Competition for Niche IPSE WVEA Southeast and South Central PEPP - Degree Link
Blurring of Missions Means Sharing Our Niche All Publics State Access Missions IU Statewide Associates of Arts Degree Ivy Tech as a transfer institution More Graduate Programs at Regional USI Statewide, Residential Mission
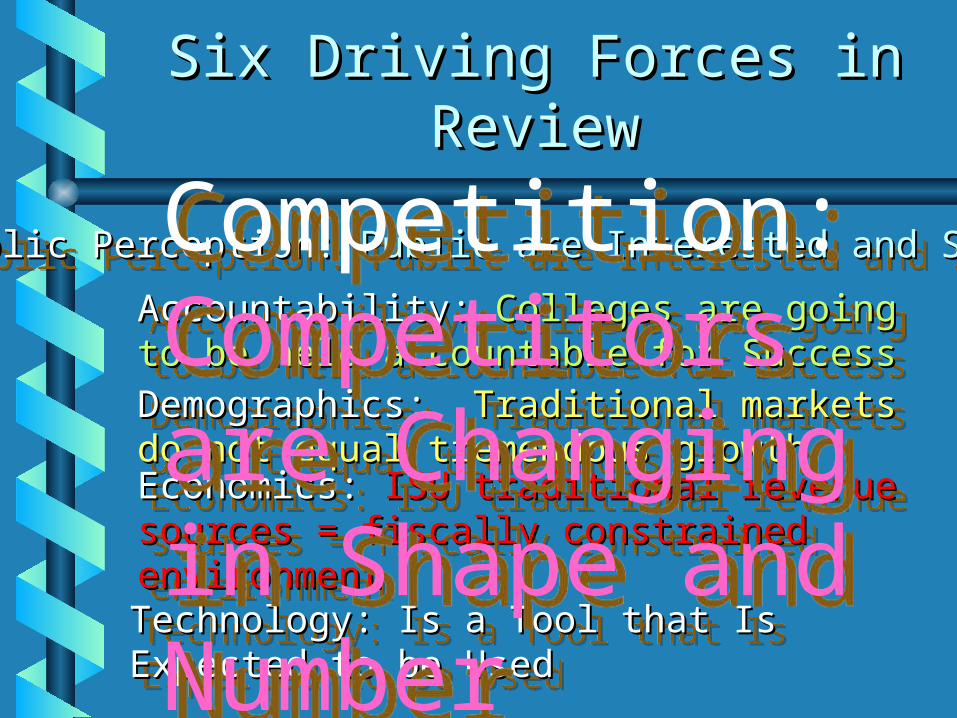
Six Driving Forces in Six Driving Forces in ReviewReview
Public Perception: Public Perception: Public are Interested and SkepticalPublic are Interested and SkepticalPublic Perception: Public Perception: Public are Interested and SkepticalPublic are Interested and Skeptical
Accountability: Accountability: Colleges are going to be Colleges are going to be held accountable for Successheld accountable for Success
Accountability: Accountability: Colleges are going to be Colleges are going to be held accountable for Successheld accountable for Success
Demographics: Demographics: Traditional markets do Traditional markets do not equal tremendous growthnot equal tremendous growth
Demographics: Demographics: Traditional markets do Traditional markets do not equal tremendous growthnot equal tremendous growthEconomics: Economics: ISU traditional revenue ISU traditional revenue sources = fiscally constrained sources = fiscally constrained environmentenvironment
Economics: Economics: ISU traditional revenue ISU traditional revenue sources = fiscally constrained sources = fiscally constrained environmentenvironment
Technology: Is a Tool that Is Expected to Technology: Is a Tool that Is Expected to be Usedbe Used
Technology: Is a Tool that Is Expected to Technology: Is a Tool that Is Expected to be Usedbe Used
Competition: Competitors are Changing in Shape and Number
Competition: Competitors are Changing in Shape and Number

Demographics as a Driving Demographics as a Driving Force at the National LevelForce at the National Level
Percent Change in number of Public High School Graduates, by
State: 1994-95 to 2006-07
-15.0 to 0%
Growth
0.1 to 14.9%
15.0 to 29.9%
30 to 105%

Demographics as a Driving Demographics as a Driving Force at the National LevelForce at the National Level

Demographics as a Driving Demographics as a Driving Force at the National LevelForce at the National Level
Projected Minority Growth Rates to Total Population
Source:, Current Population Reports Census Bureau