extensive neurological recovery from a complete spinal...
TRANSCRIPT
CLINICAL CASE STUDYpublished: 25 June 2013
doi: 10.3389/fnhum.2013.00290
Extensive neurological recovery from a complete spinalcord injury: a case report and hypothesis on the role ofcortical plasticityAnn S. Choe1,2,3†, Visar Belegu1,2†, Shoko Yoshida4, Suresh Joel3,4, Cristina L. Sadowsky2,5,Seth A. Smith6, Peter C. M. van Zijl3,4, James J. Pekar3,4 and John W. McDonald1,2,5*
1 Department of Neurology, Johns Hopkins University School of Medicine, Baltimore, MD, USA2 International Center for Spinal Cord Injury, Hugo W. Moser Research Institute at Kennedy Krieger, Inc., Baltimore, MD, USA3 F. M. Kirby Research Center for Functional Brain Imaging, Kennedy Krieger Institute, Baltimore, MD, USA4 Russell H. Morgan Department of Radiology and Radiological Science, Johns Hopkins University School of Medicine, Baltimore, MD, USA5 Physical Medicine and Rehabilitation, Johns Hopkins University School of Medicine, Baltimore, MD, USA6 Department of Radiology and Radiological Science, Institute of Imaging Science, Vanderbilt University, Nashville, TN, USA
Edited by:
Sven Bestmann, University CollegeLondon, UK
Reviewed by:
Patrick Freund, University CollegeLondon Institute of Neurology, UKAntonio Oliviero, Hospital Nacionalde Paraplejicos, Spain
*Correspondence:
John W. McDonald, KennedyKrieger Institute, Johns HopkinsUniversity School of Medicine, 707N. Broadway, Baltimore, MD 21205,USAe-mail: [email protected]†These authors have contributedequally to this work.
Neurological recovery in patients with severe spinal cord injury (SCI) is extremelyrare. We have identified a patient with chronic cervical traumatic SCI, who suffereda complete loss of motor and sensory function below the injury for 6 weeks afterthe injury, but experienced a progressive neurological recovery that continued for 17years. The extent of the patient’s recovery from the severe trauma-induced paralysisis rare and remarkable. A detailed study of this patient using diffusion tensor imaging(DTI), magnetization transfer imaging (MTI), and resting state fMRI (rs-fMRI) revealedstructural and functional changes in the central nervous system that may be associatedwith the neurological recovery. Sixty-two percent cervical cord white matter atrophy wasobserved. DTI-derived quantities, more sensitive to axons, demonstrated focal changes,while MTI-derived quantity, more sensitive to myelin, showed a diffuse change. Nosignificant cortical structural changes were observed, while rs-fMRI revealed increasedbrain functional connectivity between sensorimotor and visual networks. The studyprovides comprehensive description of the structural and functional changes in the patientusing advanced MR imaging technique. This multimodal MR imaging study also showsthe potential of rs-fMRI to measure the extent of cortical plasticity.
Keywords: spinal cord injury, trauma, diffusion tensor imaging, magnetization transfer imaging, resting state fMRI,
plasticity
CASE PRESENTATIONThe patient, a 58-year-old male, endured vertebral fractures atcervical levels C3–C6 in a motor vehicle accident at the ageof 22. The patient did not have any respiratory problem andhis stay in the ICU was limited to 5 days. Following the injury,the patient underwent manual motor testing of lower and upperbody muscles groups as well as sensory testing. The motor test-ing involved examination of flexion and extension of upper body(shoulder, elbow, and wrist), and lower body joints (hip, knee,and ankle), and sensory testing involved examination of sensa-tion to pinprick and light touch on both hands and feet. Initially,the patient had no motor or sensory function below the levelof injury. Motor and sensory function at the sacral level wasalso absent, which was tested during the bladder evacuation andcatheter placement procedure. This injury is equivalent to anASIA A (ASIA: American Spinal Injury Association), or a “com-plete” injury, according to today’s ASIA impairment scale (AIS)(Maynard et al., 1997), which did not exist at the time of thepatient’s injury.
Spinal cord stabilization was accomplished with a halo.His rehabilitation regimen consisted of active-assisted range of
motion (ROM) exercises of the lower and upper limb performedat home. Lower limb ROM exercise was performed for 30 min,three times a day, and the upper limb ROM exercise was per-formed for 30 min, two times a day. The exercise was performedat home, assisted by his family members.
He experienced slow and progressive neurological recoverythat continued for 17 years after the injury. The first neurologicalrecovery, movement of the left big toe (a grade 1 motor func-tion), occurred 6 weeks after the injury. The first recovery ofsensation occurred 6 months after the injury in the form of apainful dysesthetic sensation in the pelvis. Eleven months afterthe injury, the patient was able to perform complex upper bodymotor functions such as sitting up without assistance. Complexlower body motor functions such as ability to walk unassistedwere recovered 15 months after the injury. Concomitantly, thepatient recovered autonomic nervous system functions (i.e., ahigh degree of bladder and bowel functions were recovered upto 64 months after the injury) although many remain abnormal(Table 1). Currently, his injury is categorized as ASIA D. His lat-est AIS evaluation (Figure 1) showed that he has regained 94% ofmotor function in the upper body and 100% in the lower body.
Frontiers in Human Neuroscience www.frontiersin.org June 2013 | Volume 7 | Article 290 | 1
HUMAN NEUROSCIENCE

Choe et al. Neurological recovery from complete SCI
Table 1 | Detailed timeline of the patient’s recovery.
Date Description
0 Sep-74 Accident
1 Nov-74 Flicker of contraction present at left big toe. No sensoryrecovery
2 Mar-75 Flicker of contraction present at left quadriceps
3 Mar-75 Dysesthetic (abnormal) sensation at pelvis
4 Mar-75 Flick of sensation present at left bicep
5 Mar-75 Flick of sensation present at left fingers
6 Apr-75 Flicker of contraction present at right big toe
7 May-75 Begin to gain trunk movement
8 May-75 Begin working on trunk balance
9 Jun-75 Sit with 50% assistance
10 Jun-75 Flicker of contraction present at left triceps
11 Oct-75 Sit without assistance
12 Dec-75 Active movement of left arm against gravity
13 Jan-76 Stand with 50% assistance
14 Feb-76 Regain ability to grip with hands
15 May-76 Regained ability to ejaculate
16 Jun-76 Stand without assistance
17 Sep-76 First swim
18 Jan-77 Begin to gain control of bladder movement (incomplete)
19 Jan-78 First walk 40 feet without assistance
20 Jun-78 Could walk in community
21 Jan-79 Begin to gain control of bowel movements (incomplete)
22 1978–1980 Functional recovery rate begins to plateau
23 Apr-91 First run
The 1974 motor accident [0] resulted in a complete loss of motor and sensory
function below the injury epicenter that lasted 6 weeks after the injury.
Initial regaining of motor and sensory function [1, 3] was then followed by a long
but steady recovery process that continued for 17 years after the injury, where
at the end of the 17 years, he was able to run without assistance [23].
The patient manifests incomplete and asymmetric motor recov-ery in his hands—i.e., his left hand is more functional then theright one. He has also regained 23% of sensory function in theupper body (above the level of T7), but only 10% in the lowerbody. The patient reports that his walking and functions he per-forms with his feet depend heavily on visual feedback; he alsomanifests autonomic dysreflexia. It should be noted that the AISevaluation of the motor function is based on muscle strength inthe extremities, and that sensory function is evaluated based onconscious sensation of light touch and pin prick on the skin, anddoes not include proprioception.
BACKGROUNDThe spinal cord is a conduit for the exchange of informationbetween the brain and the body, and damage to it disrupts con-duction of sensory and motor signals across the lesion epicenter(Belegu et al., 2007). The extent of the neurological impairmentfollowing spinal cord injury (SCI) varies, and the severity of theinjury limits the subsequent neurological recovery (McDonaldand Sadowsky, 2002; Kirshblum et al., 2004). Severely injuredSCI patients, classified as ASIA A on the AIS (Maynard et al.,1997), experience limited neurological recovery that often does
not translate to functional improvements. Patients with lesssevere injuries, classified as ASIA B-D, experience greater recovery(Kirshblum et al., 2004). This is further corroborated by a retro-spective study of 173 traumatic SCI patients with 5-year followup (Vazquez et al., 2008), which reported relatively good recov-ery results for patients with incomplete injury; at the time oftheir discharge, 33.3% the ASIA B patients, 76.4% of the ASIA Cpatients, and 100% of the ASIA D patients showed some degreeof neurological recovery. The same study also reported, however,that 94% of the ASIA A patients remained complete upon dis-charge without any neurological recovery and none of them werefunctional at the time of their discharge (Vazquez et al., 2008).Chances of neurological recovery for ASIA A patients becomeeven smaller in chronic phase of SCI (McDonald and Sadowsky,2002).
Two variables that contribute to the capacity for neurologicalrecovery are well understood. First, preservation of longitudinallyoriented axonal tracts in the white matter is required (Blight,1983; Nathan, 1994). Second, proper conductance through thespared white matter axons and hence proper myelination isrequired. However, only 5% of intact axons in the white mattertracts are needed to procure locomotion following SCI in cats(Blight, 1983), while in humans, locomotion can recover afterresection of 25% of the spinal cord (Nathan, 1994), indicatingthat preservations of axons and myelination are not proportionalto the degree of neurological recovery. Task-activated functionalMRI (fMRI) studies show different activation pattern betweenpatients who experience neurological recovery and those whodo not (Jurkiewicz et al., 2007, 2010), suggesting that corticalplasticity may be a third variable. While the occurrence of cor-tical plasticity subsequent to SCI has been observed (Endo et al.,2007; Jurkiewicz et al., 2007, 2010), it is unclear how it leads toneurological recovery.
Here, we present a report of a patient with a chronic cervicaltraumatic SCI, who suffered a complete loss of motor and sensoryfunction below the injury epicenter for 6 weeks after the injury,and experienced a slow and progressive neurological recovery thatcontinued for 17 years. The extent of the recovery is so remark-able that it represents a pragmatic cure from trauma inducedcomplete paralysis. We utilized advanced MRI technologies suchas diffusion tensor imaging (DTI), magnetization transfer imag-ing (MTI), and resting state fMRI (rs-fMRI) to investigate thepatient’s late recovery. While DTI and MTI showed abnormalitiesin the spinal cord that indicate axonal and myelin damage, but arenot associated with the patient’s late recovery, rs-fMRI provideda picture of cortical plasticity that is associated with the patient’slate recovery.
MATERIALS AND METHODSPARTICIPANTSSpinal cord DTI, brain DTI, and brain rs-fMRI data of healthycontrols were obtained from previously acquired and separatedatabases that exist in the International Center for Spinal CordInjury (ICSCI) and F.M. Kirby center. Spinal cord imaging wasperformed in ten healthy volunteers (21–49 years, mean 33,M/F ratio: 6/4). For brain imaging, DTI was performed in sixage matched healthy volunteers (55–61 years, mean 59, M/F
Frontiers in Human Neuroscience www.frontiersin.org June 2013 | Volume 7 | Article 290 | 2

Choe et al. Neurological recovery from complete SCI
FIGURE 1 | ASIA classification of the patient after recovery, performed according to the International Standards for Neurological Classification.
ratio: 2:4), and rs-fMRI was performed in 21 (22–61 years,mean 32, M/F ratio: 11/10; available on web: www.nitrc.org/projects/multimodal) healthy volunteers (Landman et al., 2011).Only the six healthy participants from the brain DTI databasewere age matched due to the limited number of older healthy par-ticipants in the spinal cord DTI and brain rs-fMRI databases. Allparticipants gave their informed consent, and the study protocolwas approved by the institutional review board at Johns HopkinsUniversity.
IMAGE ACQUISITIONParticipants were scanned on a Philips 3T scanner. The scanroom was lit during the scan, but the lights were kept off insidethe scanner bore. For spinal cord imaging, DTI was performedusing a multi-slice, pulsed gradient spin echo (PGSE) sequence(b = 0, 500 s/mm2, 16 diffusion weighting directions, TR/TE =6300/63 ms, SENSE factor = 2, 1.5 × 1.5 × 3 mm3 original res-olution (axial sections of 3 mm thickness), 0.57 × 0.57 × 3 mm3
final resolution (after zero-fill), scan time = 2 min, 16-channelneurovascular coil) (Figures 2D,H). MT-weighted images were
acquired using a three dimensional (3D) spoiled gradient-echosequence with an EPI readout (EPI factor = 3, TR/TE =102/13 ms, α = 9◦, and SENSE factor = 2, 0.61 × 0.69 × 3 mm3
resolution, scan time = 8 min, 16-channel neurovascular coil)(Figures 2C,G). A sagittal T2 weighted (T2-w) was also acquired(Figures 2A,B,E,F). The total scan time for the spinal cord imag-ing was 28 min.
Brain DTI was performed using a multi-slice PGSE sequence(b = 0, 700 s/mm2, 32 directions, TR/TE = 7270/71 ms, SENSEfactor = 2.5, 2.2 × 2.2 × 2.2 mm3 original resolution, 0.83 ×0.83 × 2.2 mm3 final resolution, scan time = 5 min, 16-channelneurovascular coil). A high resolution T1 weighted (T1-w)MPRAGE image (TR/TE = 10/6 ms, SENSE factor = 2, 1.10 ×1.10 × 1.17 mm3 original resolution, 0.83 × 0.83 × 1.17 mm3
final resolution, scan time = 5 min, 16-channel neurovascularcoil) was also obtained.
Each rs-fMRI scan of the controls (Landman et al., 2011) wasacquired using a single-shot SENSE-EPI (TR/TE = 2000/30 ms,SENSE factor = 2, 3 × 3 × 3 mm3 resolution, 1 mm gap, scantime = 420 s, 32-channel head coil). Identical imaging parameters
Frontiers in Human Neuroscience www.frontiersin.org June 2013 | Volume 7 | Article 290 | 3
Choe et al. Neurological recovery from complete SCI
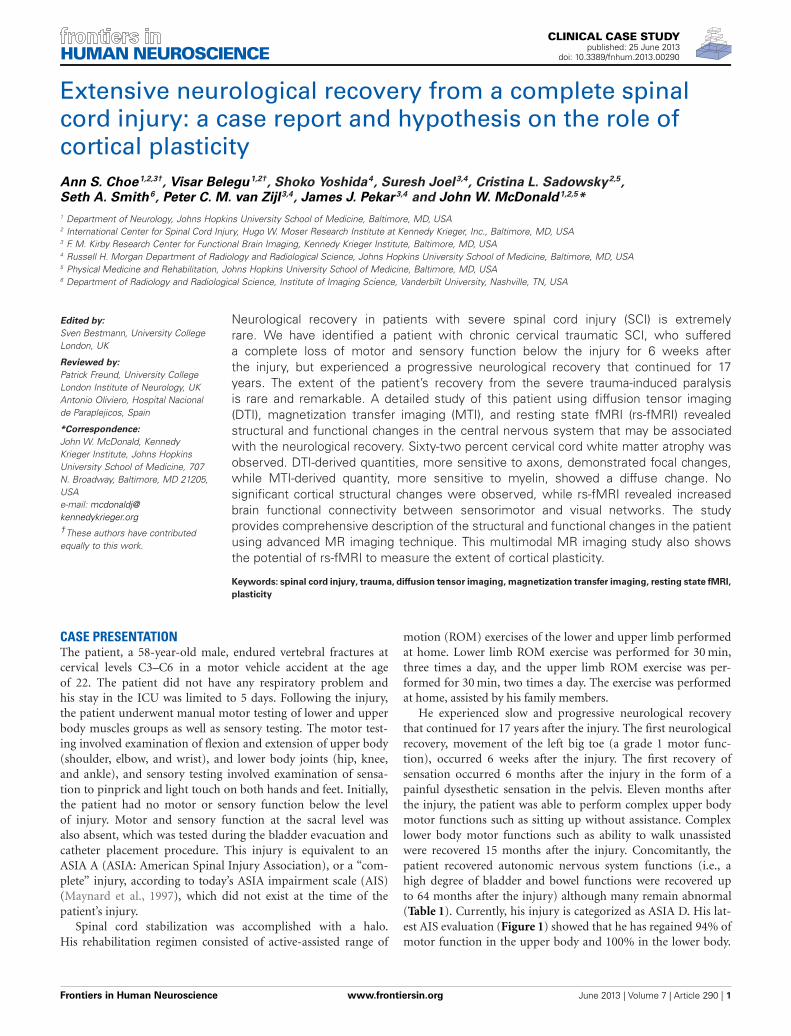
FIGURE 2 | Structural MR images acquired from the patient (top row)
and a control (bottom row). (A,E) Sagittal T2-w images. Bracket in (A)
highlights injury epicenter of the patient. (B,F) Axial T2-w images. (C,G) AxialMTCSF images. (D,H) Axial FA color maps. The FA maps are color-coded
using a standard diffusion color-encoding scheme (r/l: red, a/p: green, s/i:blue). Each row of (B–D) shows a section from: (1) above the injury epicenter,(2) injury epicenter, and (3) below the injury epicenter. Images from thecorresponding cervical levels in the control are shown in each row of (F–H).
were used to acquire the rs-fMRI data of the SCI patient, withthese differences: (1) time of each run: 360 s, (2) number of runsacquired: 8. For the controls, the first 360 s of the data was usedfor further analysis. Total scan time for the brain imaging was30 min. The rs-fMRI scans were always acquired after the brainT1-w image acquisition to allow the participants to get acclimatedto the noise and the new environment inside the scanner. The par-ticipants were instructed to stay as still as possible with their eyesclosed during the entire scan. A dataset from one of the healthycontrols was excluded due to excessive motion.
IMAGE REGISTRATION FOR SPINAL CORD IMAGINGBasic eddy current correction was performed on the spinalcord and brain DTI datasets using CATNAP (Coregistration,Adjustment, and Tensor-solving, a Nicely Automated Program)(Landman et al., 2007), which performs volume-wise coregistra-tion using a method based on FLIRT (FMRIB’s Linear ImagingRegistration Tool, Oxford, UK) (Jenkinson et al., 2002). Each dif-fusion weighted image was registered to an initial b = 0 s/mm2
(b0, non-diffusion weighted image) volume using a six degrees offreedom, rigid-body registration. Diffusion gradient tables wereupdated to account for any rotation.
The registration of the MTI dataset to the mean b0 volumewas performed in two steps. First, the MTI dataset was regis-tered to the b0 volume using a 3D, six degrees of freedom, rigidbody transformation using a similar method proposed by Maeset al. (1999). This 3D registration procedure was then followedby a two-dimensional (2D) registration, using a three degrees offreedom rigid body transformation that involved two in-planetranslations and one rotation. The second coregistration proce-dure was implemented for added accuracy of the result (Smithet al., 2010).
MEASUREMENT OF WHOLE CORD AND WHITE MATTERCROSS-SECTIONAL AREAThe whole cord and white matter atrophy of the patient’s spinalcord was measured using fractional anisotropy (FA) maps. Wefirst separated the spinal cord and the surrounding cerebrospinalfluid (CSF) area from the rest of the neck region by perform-ing manual segmentation. This was done by placing ellipsoidalbinary masks around the spinal cord and the surrounding CSFarea. Once the segmentation of the spinal cord and CSF wasdone, the whole cord cross-sectional area (wca) of each slice ofthe controls and the patient was measured automatically using
Frontiers in Human Neuroscience www.frontiersin.org June 2013 | Volume 7 | Article 290 | 4

Choe et al. Neurological recovery from complete SCI
the Otsu’s thresholding method, therefore reducing rater bias.The segmented FA maps of the cords were then thresholded at0.2—the same threshold used during the subsequent fiber trac-tograophy for the column-specific data analysis—to create themasks of the white matter only area (wma). We have previouslyshown that FA measures performed in this manner have accept-able inter-rater and test-retest reliability (Smith et al., 2010), andthis is expected to extend to the volume measures based on thisparameter.
DIFFUSION FIBER TRACTOGRAPHY OF SPINAL COLUMNS ANDCREATION OF COLUMN PROFILESAfter the registration of DTI and MTI images and the calcula-tion of DTI- and MTI-derived quantities, diffusion fiber trac-tography was performed using DTIStudio (Jiang et al., 2006).Higher contrast MTCSF (MT-weighted signal intensity relativeto cerebrospinal fluid) images—compared to T2-w images andFA maps—were used to manually draw regions of interest (ROIs)within left and right lateral, dorsal, and ventral columns of thespinal cords. This manual ROI selection was performed on everythird section along the entire cervical cord, to be used as seedregions for the fiber tractography to follow. Note that the regis-tered MTCSF images are in the same image space as that of theDTI images. FA threshold of 0.2 and a maximum tract turningangle of 60◦ were used as the fiber tractography stopping crite-rion. Spurious fibers, such as those that cross from one spinalcolumn to the next or move out of the spinal cord, were manuallyexcluded.
Once each spinal column was reconstructed, vertebrae level ofC2 and C6 were identified and the corresponding column pro-files (Smith et al., 2010; Cohen-Adad et al., 2013) were created.In our previous study (Smith et al., 2010), typical neck length ofstudy participants was found to be 75 mm, which corresponds to25, 3 mm thickness image sections. Using this information, eachcolumn profile was spatially normalized to 25 points spanningC2–C6.
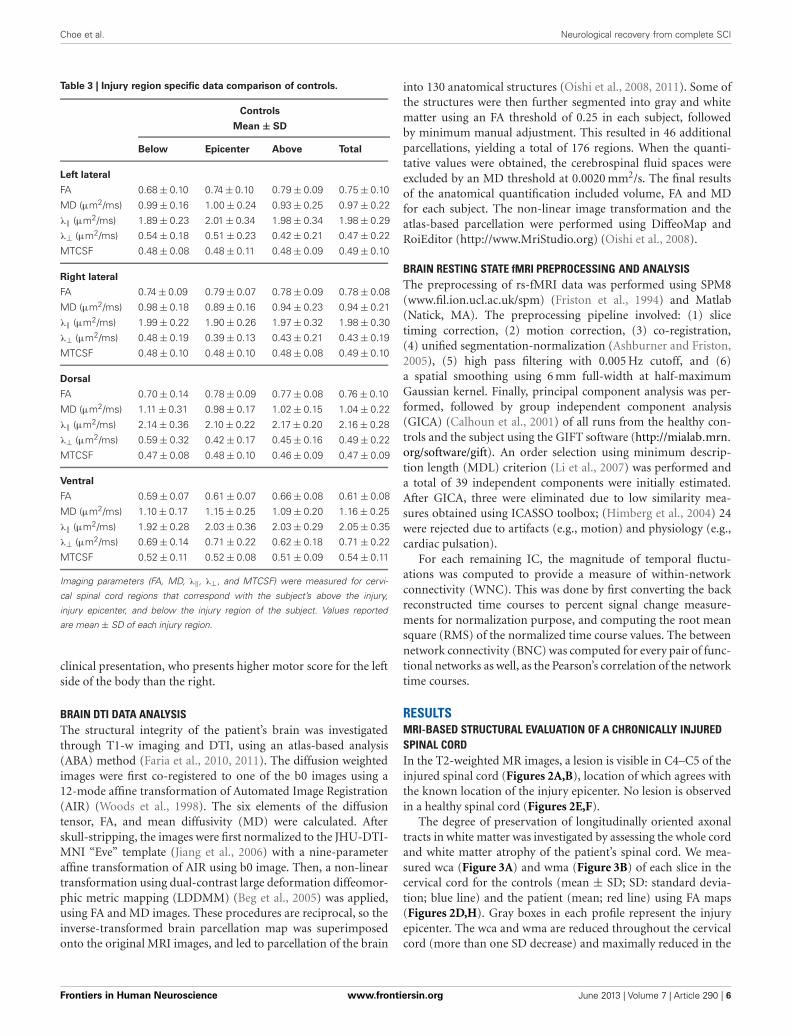
INJURY REGION SPECIFIC DATA ANALYSISTables 2, 3 report the column profile values of the patient (mean)and the controls (mean ± SD) for three spinal cord regions: (1)above the injury epicenter, (2) injury epicenter, and (3) belowthe injury epicenter. The injury epicenter was identified using thepatient’s T2-w images (Figure 2B). One vertebrae level (approxi-mately 15 mm) above the beginning of the lesion site was definedas the region “above” the injury epicenter, and one vertebraelevel down from the end of the lesion site was defined as the“below” the injury epicenter. The three spinal cord regions ofthe controls were defined to match the location of the patient’sregions.
Each cell in Table 2 is color coded according to the degree ofdifference between the values of the controls and patient: (1) cellswithout color indicate difference less than one SD, (2) light graycells indicate difference of more than one SD but less than twicethe SD, (3) dark gray cells indicate difference of bigger than twicethe SD. When DTI and MTI derived parameters were averagedalong the whole cord, only FA of the right lateral column andMTCSF of the dorsal column were found to have changes of more
Table 2 | Injury region specific data comparison of the patient.
Patient
Mean
Below Epicenter Above Total
Left lateral
FA 0.62 0.67 0.69 0.67
MD (μm2/ms) 1.2 1.02 0.83 1
λ‖ (μm2/ms) 2.08 1.86 1.58 1.83
λ⊥ (μm2/ms) 0.76 0.62 0.47 0.6
MTCSF 0.69 0.72 0.62 0.65
Right lateral
FA 0.59 0.49 0.72 0.61
MD (μm2/ms) 1.03 1.40 0.79 1.14
λ‖ (μm2/ms) 1.76 2.18 1.53 1.93
λ⊥ (μm2/ms) 0.66 1.01 0.43 0.76
MTCSF 0.78 0.68 0.63 0.68
Dorsal
FA 0.71 0.55 0.73 0.67
MD (μm2/ms) 1.13 1.40 0.97 1.14
λ‖ (μm2/ms) 2.19 2.33 1.96 2.1
λ⊥ (μm2/ms) 0.6 0.94 0.48 0.66
MTCSF 0.65 0.72 0.67 0.65
Ventral
FA 0.55 0.46 0.67 0.55
MD (μm2/ms) 1.27 1.79 0.91 1.33
λ‖ (μm2/ms) 2.06 2.61 1.67 2.12
λ⊥ (μm2/ms) 0.87 1.38 0.54 0.94
MTCSF 0.73 0.71 0.63 0.66
Imaging parameters (FA, MD, λ‖, λ⊥, and MTCSF) were measured for the
regions of above the injury, injury epicenter, and below the injury.
Values reported are mean of each injury region. Examining the cervical cord in an
injury region specific way provides better insight into the actual changes occur-
ring along the patient’s cervical spinal cord, as opposed to looking at a single
average values of an entire spinal column.
Difference compared to the controls.
Within normal range
Difference is bigger than 1 × SD
Difference is bigger than 2 × SD
than twice the SD (Table 2). A detailed look at the Tables 2, 3,however, reveals that there are substantial changes of DTI- andMTI-derived parameters above, at, and below the injury epicen-ter of different spinal columns. FA, MD, and λ⊥ altered more thantwo SD at the injury epicenter of right lateral, dorsal, and ventralcolumns. λ‖ altered more than two SD at the injury epicenter ofventral column. MTCSF changed more than two SD at the injuryepicenter of the left lateral, dorsal, and ventral column, below theinjury epicenter at the right lateral, dorsal, and ventral column,and above the injury epicenter at the dorsal column. All DTI-derived quantities values for the left lateral column were withinthe normal range, suggesting the left lateral column is the mostwell preserved spinal column. This corresponds with the patient’s
Frontiers in Human Neuroscience www.frontiersin.org June 2013 | Volume 7 | Article 290 | 5
Choe et al. Neurological recovery from complete SCI
Table 3 | Injury region specific data comparison of controls.
Controls
Mean ± SD
Below Epicenter Above Total
Left lateral
FA 0.68 ± 0.10 0.74 ± 0.10 0.79 ± 0.09 0.75 ± 0.10
MD (μm2/ms) 0.99 ± 0.16 1.00 ± 0.24 0.93 ± 0.25 0.97 ± 0.22
λ‖ (μm2/ms) 1.89 ± 0.23 2.01 ± 0.34 1.98 ± 0.34 1.98 ± 0.29
λ⊥ (μm2/ms) 0.54 ± 0.18 0.51 ± 0.23 0.42 ± 0.21 0.47 ± 0.22
MTCSF 0.48 ± 0.08 0.48 ± 0.11 0.48 ± 0.09 0.49 ± 0.10
Right lateral
FA 0.74 ± 0.09 0.79 ± 0.07 0.78 ± 0.09 0.78 ± 0.08
MD (μm2/ms) 0.98 ± 0.18 0.89 ± 0.16 0.94 ± 0.23 0.94 ± 0.21
λ‖ (μm2/ms) 1.99 ± 0.22 1.90 ± 0.26 1.97 ± 0.32 1.98 ± 0.30
λ⊥ (μm2/ms) 0.48 ± 0.19 0.39 ± 0.13 0.43 ± 0.21 0.43 ± 0.19
MTCSF 0.48 ± 0.10 0.48 ± 0.10 0.48 ± 0.08 0.49 ± 0.10
Dorsal
FA 0.70 ± 0.14 0.78 ± 0.09 0.77 ± 0.08 0.76 ± 0.10
MD (μm2/ms) 1.11 ± 0.31 0.98 ± 0.17 1.02 ± 0.15 1.04 ± 0.22
λ‖ (μm2/ms) 2.14 ± 0.36 2.10 ± 0.22 2.17 ± 0.20 2.16 ± 0.28
λ⊥ (μm2/ms) 0.59 ± 0.32 0.42 ± 0.17 0.45 ± 0.16 0.49 ± 0.22
MTCSF 0.47 ± 0.08 0.48 ± 0.10 0.46 ± 0.09 0.47 ± 0.09
Ventral
FA 0.59 ± 0.07 0.61 ± 0.07 0.66 ± 0.08 0.61 ± 0.08
MD (μm2/ms) 1.10 ± 0.17 1.15 ± 0.25 1.09 ± 0.20 1.16 ± 0.25
λ‖ (μm2/ms) 1.92 ± 0.28 2.03 ± 0.36 2.03 ± 0.29 2.05 ± 0.35
λ⊥ (μm2/ms) 0.69 ± 0.14 0.71 ± 0.22 0.62 ± 0.18 0.71 ± 0.22
MTCSF 0.52 ± 0.11 0.52 ± 0.08 0.51 ± 0.09 0.54 ± 0.11
Imaging parameters (FA, MD, λ‖, λ⊥, and MTCSF) were measured for cervi-
cal spinal cord regions that correspond with the subject’s above the injury,
injury epicenter, and below the injury region of the subject. Values reported
are mean ± SD of each injury region.
clinical presentation, who presents higher motor score for the leftside of the body than the right.
BRAIN DTI DATA ANALYSISThe structural integrity of the patient’s brain was investigatedthrough T1-w imaging and DTI, using an atlas-based analysis(ABA) method (Faria et al., 2010, 2011). The diffusion weightedimages were first co-registered to one of the b0 images using a12-mode affine transformation of Automated Image Registration(AIR) (Woods et al., 1998). The six elements of the diffusiontensor, FA, and mean diffusivity (MD) were calculated. Afterskull-stripping, the images were first normalized to the JHU-DTI-MNI “Eve” template (Jiang et al., 2006) with a nine-parameteraffine transformation of AIR using b0 image. Then, a non-lineartransformation using dual-contrast large deformation diffeomor-phic metric mapping (LDDMM) (Beg et al., 2005) was applied,using FA and MD images. These procedures are reciprocal, so theinverse-transformed brain parcellation map was superimposedonto the original MRI images, and led to parcellation of the brain
into 130 anatomical structures (Oishi et al., 2008, 2011). Some ofthe structures were then further segmented into gray and whitematter using an FA threshold of 0.25 in each subject, followedby minimum manual adjustment. This resulted in 46 additionalparcellations, yielding a total of 176 regions. When the quanti-tative values were obtained, the cerebrospinal fluid spaces wereexcluded by an MD threshold at 0.0020 mm2/s. The final resultsof the anatomical quantification included volume, FA and MDfor each subject. The non-linear image transformation and theatlas-based parcellation were performed using DiffeoMap andRoiEditor (http://www.MriStudio.org) (Oishi et al., 2008).
BRAIN RESTING STATE fMRI PREPROCESSING AND ANALYSISThe preprocessing of rs-fMRI data was performed using SPM8(www.fil.ion.ucl.ac.uk/spm) (Friston et al., 1994) and Matlab(Natick, MA). The preprocessing pipeline involved: (1) slicetiming correction, (2) motion correction, (3) co-registration,(4) unified segmentation-normalization (Ashburner and Friston,2005), (5) high pass filtering with 0.005 Hz cutoff, and (6)a spatial smoothing using 6 mm full-width at half-maximumGaussian kernel. Finally, principal component analysis was per-formed, followed by group independent component analysis(GICA) (Calhoun et al., 2001) of all runs from the healthy con-trols and the subject using the GIFT software (http://mialab.mrn.
org/software/gift). An order selection using minimum descrip-tion length (MDL) criterion (Li et al., 2007) was performed anda total of 39 independent components were initially estimated.After GICA, three were eliminated due to low similarity mea-sures obtained using ICASSO toolbox; (Himberg et al., 2004) 24were rejected due to artifacts (e.g., motion) and physiology (e.g.,cardiac pulsation).
For each remaining IC, the magnitude of temporal fluctu-ations was computed to provide a measure of within-networkconnectivity (WNC). This was done by first converting the backreconstructed time courses to percent signal change measure-ments for normalization purpose, and computing the root meansquare (RMS) of the normalized time course values. The betweennetwork connectivity (BNC) was computed for every pair of func-tional networks as well, as the Pearson’s correlation of the networktime courses.
RESULTSMRI-BASED STRUCTURAL EVALUATION OF A CHRONICALLY INJUREDSPINAL CORDIn the T2-weighted MR images, a lesion is visible in C4–C5 of theinjured spinal cord (Figures 2A,B), location of which agrees withthe known location of the injury epicenter. No lesion is observedin a healthy spinal cord (Figures 2E,F).
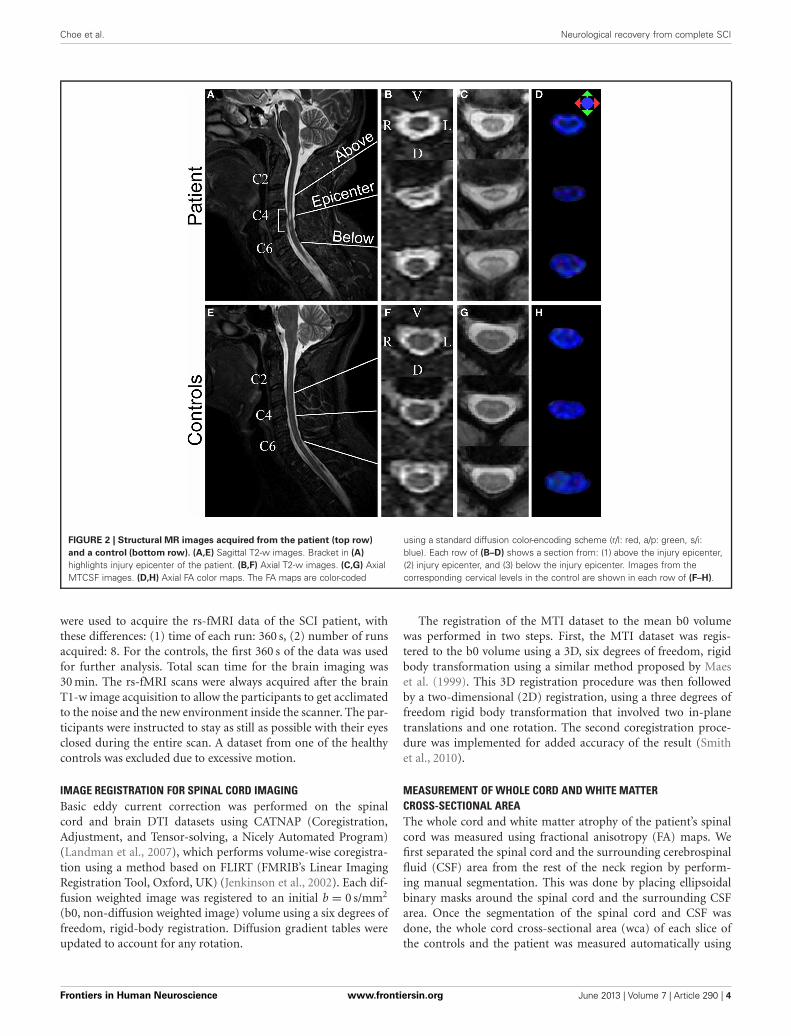
The degree of preservation of longitudinally oriented axonaltracts in white matter was investigated by assessing the whole cordand white matter atrophy of the patient’s spinal cord. We mea-sured wca (Figure 3A) and wma (Figure 3B) of each slice in thecervical cord for the controls (mean ± SD; SD: standard devia-tion; blue line) and the patient (mean; red line) using FA maps(Figures 2D,H). Gray boxes in each profile represent the injuryepicenter. The wca and wma are reduced throughout the cervicalcord (more than one SD decrease) and maximally reduced in the
Frontiers in Human Neuroscience www.frontiersin.org June 2013 | Volume 7 | Article 290 | 6
Choe et al. Neurological recovery from complete SCI
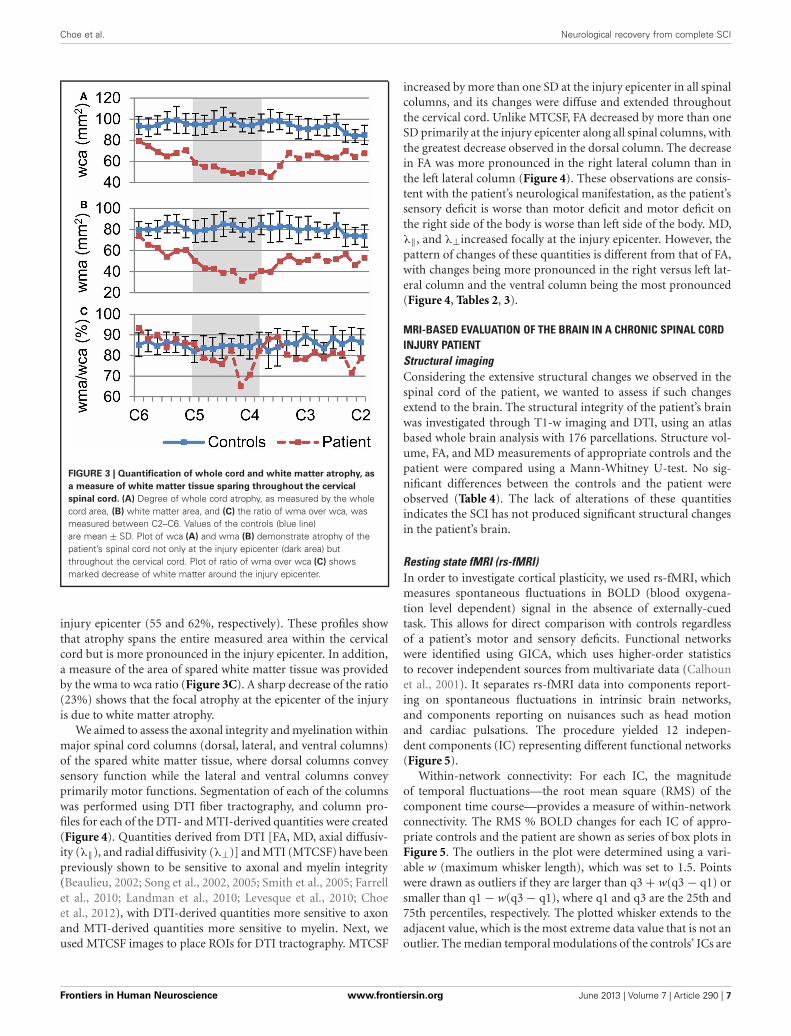
FIGURE 3 | Quantification of whole cord and white matter atrophy, as
a measure of white matter tissue sparing throughout the cervical
spinal cord. (A) Degree of whole cord atrophy, as measured by the wholecord area, (B) white matter area, and (C) the ratio of wma over wca, wasmeasured between C2–C6. Values of the controls (blue line)are mean ± SD. Plot of wca (A) and wma (B) demonstrate atrophy of thepatient’s spinal cord not only at the injury epicenter (dark area) butthroughout the cervical cord. Plot of ratio of wma over wca (C) showsmarked decrease of white matter around the injury epicenter.
injury epicenter (55 and 62%, respectively). These profiles showthat atrophy spans the entire measured area within the cervicalcord but is more pronounced in the injury epicenter. In addition,a measure of the area of spared white matter tissue was providedby the wma to wca ratio (Figure 3C). A sharp decrease of the ratio(23%) shows that the focal atrophy at the epicenter of the injuryis due to white matter atrophy.
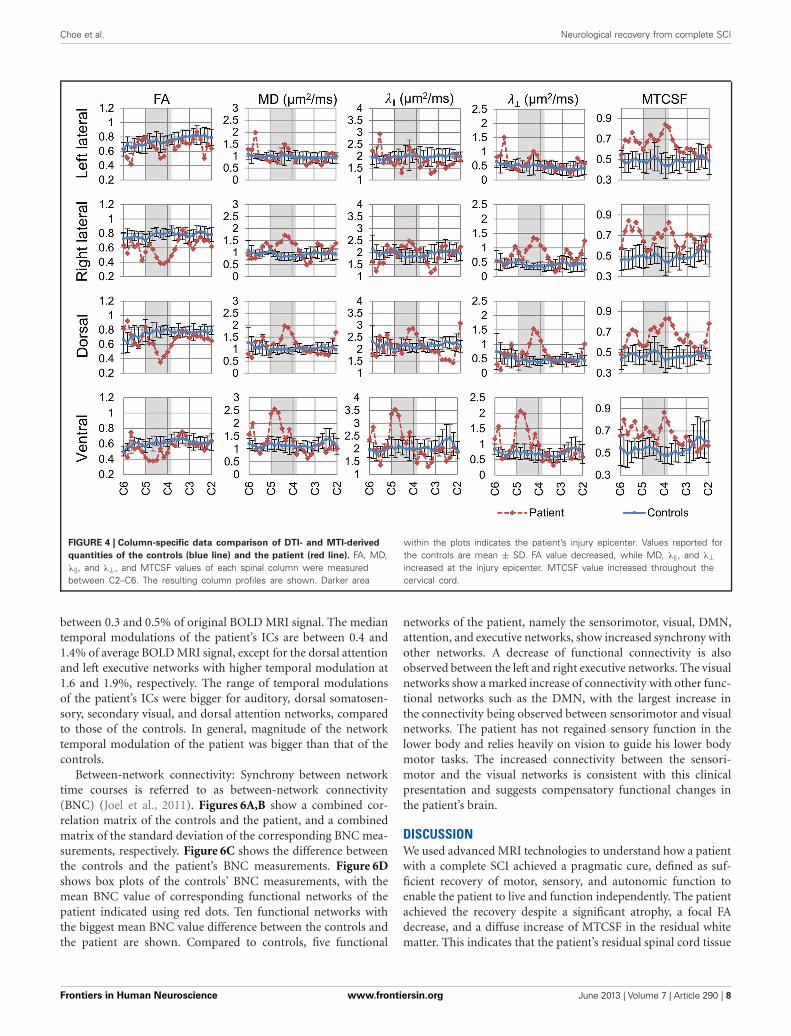
We aimed to assess the axonal integrity and myelination withinmajor spinal cord columns (dorsal, lateral, and ventral columns)of the spared white matter tissue, where dorsal columns conveysensory function while the lateral and ventral columns conveyprimarily motor functions. Segmentation of each of the columnswas performed using DTI fiber tractography, and column pro-files for each of the DTI- and MTI-derived quantities were created(Figure 4). Quantities derived from DTI [FA, MD, axial diffusiv-ity (λ‖), and radial diffusivity (λ⊥)] and MTI (MTCSF) have beenpreviously shown to be sensitive to axonal and myelin integrity(Beaulieu, 2002; Song et al., 2002, 2005; Smith et al., 2005; Farrellet al., 2010; Landman et al., 2010; Levesque et al., 2010; Choeet al., 2012), with DTI-derived quantities more sensitive to axonand MTI-derived quantities more sensitive to myelin. Next, weused MTCSF images to place ROIs for DTI tractography. MTCSF
increased by more than one SD at the injury epicenter in all spinalcolumns, and its changes were diffuse and extended throughoutthe cervical cord. Unlike MTCSF, FA decreased by more than oneSD primarily at the injury epicenter along all spinal columns, withthe greatest decrease observed in the dorsal column. The decreasein FA was more pronounced in the right lateral column than inthe left lateral column (Figure 4). These observations are consis-tent with the patient’s neurological manifestation, as the patient’ssensory deficit is worse than motor deficit and motor deficit onthe right side of the body is worse than left side of the body. MD,λ‖, and λ⊥increased focally at the injury epicenter. However, thepattern of changes of these quantities is different from that of FA,with changes being more pronounced in the right versus left lat-eral column and the ventral column being the most pronounced(Figure 4, Tables 2, 3).
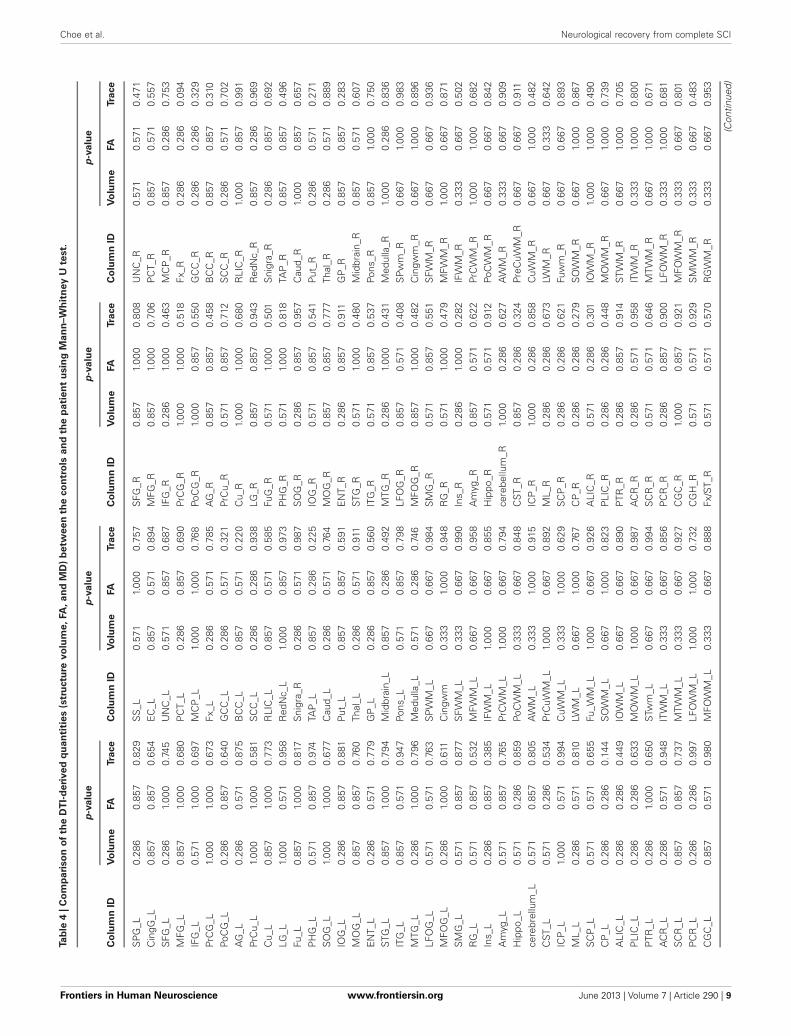
MRI-BASED EVALUATION OF THE BRAIN IN A CHRONIC SPINAL CORDINJURY PATIENTStructural imagingConsidering the extensive structural changes we observed in thespinal cord of the patient, we wanted to assess if such changesextend to the brain. The structural integrity of the patient’s brainwas investigated through T1-w imaging and DTI, using an atlasbased whole brain analysis with 176 parcellations. Structure vol-ume, FA, and MD measurements of appropriate controls and thepatient were compared using a Mann-Whitney U-test. No sig-nificant differences between the controls and the patient wereobserved (Table 4). The lack of alterations of these quantitiesindicates the SCI has not produced significant structural changesin the patient’s brain.
Resting state fMRI (rs-fMRI)In order to investigate cortical plasticity, we used rs-fMRI, whichmeasures spontaneous fluctuations in BOLD (blood oxygena-tion level dependent) signal in the absence of externally-cuedtask. This allows for direct comparison with controls regardlessof a patient’s motor and sensory deficits. Functional networkswere identified using GICA, which uses higher-order statisticsto recover independent sources from multivariate data (Calhounet al., 2001). It separates rs-fMRI data into components report-ing on spontaneous fluctuations in intrinsic brain networks,and components reporting on nuisances such as head motionand cardiac pulsations. The procedure yielded 12 indepen-dent components (IC) representing different functional networks(Figure 5).
Within-network connectivity: For each IC, the magnitudeof temporal fluctuations—the root mean square (RMS) of thecomponent time course—provides a measure of within-networkconnectivity. The RMS % BOLD changes for each IC of appro-priate controls and the patient are shown as series of box plots inFigure 5. The outliers in the plot were determined using a vari-able w (maximum whisker length), which was set to 1.5. Pointswere drawn as outliers if they are larger than q3 + w(q3 − q1) orsmaller than q1 − w(q3 − q1), where q1 and q3 are the 25th and75th percentiles, respectively. The plotted whisker extends to theadjacent value, which is the most extreme data value that is not anoutlier. The median temporal modulations of the controls’ ICs are
Frontiers in Human Neuroscience www.frontiersin.org June 2013 | Volume 7 | Article 290 | 7
Choe et al. Neurological recovery from complete SCI
FIGURE 4 | Column-specific data comparison of DTI- and MTI-derived
quantities of the controls (blue line) and the patient (red line). FA, MD,λ‖, and λ⊥, and MTCSF values of each spinal column were measuredbetween C2–C6. The resulting column profiles are shown. Darker area
within the plots indicates the patient’s injury epicenter. Values reported forthe controls are mean ± SD. FA value decreased, while MD, λ‖ , and λ⊥increased at the injury epicenter. MTCSF value increased throughout thecervical cord.
between 0.3 and 0.5% of original BOLD MRI signal. The mediantemporal modulations of the patient’s ICs are between 0.4 and1.4% of average BOLD MRI signal, except for the dorsal attentionand left executive networks with higher temporal modulation at1.6 and 1.9%, respectively. The range of temporal modulationsof the patient’s ICs were bigger for auditory, dorsal somatosen-sory, secondary visual, and dorsal attention networks, comparedto those of the controls. In general, magnitude of the networktemporal modulation of the patient was bigger than that of thecontrols.
Between-network connectivity: Synchrony between networktime courses is referred to as between-network connectivity(BNC) (Joel et al., 2011). Figures 6A,B show a combined cor-relation matrix of the controls and the patient, and a combinedmatrix of the standard deviation of the corresponding BNC mea-surements, respectively. Figure 6C shows the difference betweenthe controls and the patient’s BNC measurements. Figure 6Dshows box plots of the controls’ BNC measurements, with themean BNC value of corresponding functional networks of thepatient indicated using red dots. Ten functional networks withthe biggest mean BNC value difference between the controls andthe patient are shown. Compared to controls, five functional
networks of the patient, namely the sensorimotor, visual, DMN,attention, and executive networks, show increased synchrony withother networks. A decrease of functional connectivity is alsoobserved between the left and right executive networks. The visualnetworks show a marked increase of connectivity with other func-tional networks such as the DMN, with the largest increase inthe connectivity being observed between sensorimotor and visualnetworks. The patient has not regained sensory function in thelower body and relies heavily on vision to guide his lower bodymotor tasks. The increased connectivity between the sensori-motor and the visual networks is consistent with this clinicalpresentation and suggests compensatory functional changes inthe patient’s brain.
DISCUSSIONWe used advanced MRI technologies to understand how a patientwith a complete SCI achieved a pragmatic cure, defined as suf-ficient recovery of motor, sensory, and autonomic function toenable the patient to live and function independently. The patientachieved the recovery despite a significant atrophy, a focal FAdecrease, and a diffuse increase of MTCSF in the residual whitematter. This indicates that the patient’s residual spinal cord tissue
Frontiers in Human Neuroscience www.frontiersin.org June 2013 | Volume 7 | Article 290 | 8
Choe et al. Neurological recovery from complete SCI
Ta
ble
4|
Co
mp
ari
so
no
fth
eD
TI-
de
rive
dq
ua
nti
tie
s(s
tru
ctu
revo
lum
e,
FA
,a
nd
MD
)b
etw
ee
nth
eco
ntr
ols
an
dth
ep
ati
en
tu
sin
gM
an
n–W
hit
ney
Ute
st.
p-v
alu
ep
-va
lue
p-v
alu
ep
-va
lue
Co
lum
nID
Vo
lum
eFA
Tra
ce
Co
lum
nID
Vo
lum
eFA
Tra
ce
Co
lum
nID
Vo
lum
eFA
Tra
ce
Co
lum
nID
Vo
lum
eFA
Tra
ce
SP
G_L
0.28
60.
857
0.82
9S
S_L
0.57
11.
000
0.75
7S
FG_R
0.85
71.
000
0.80
8U
NC
_R0.
571
0.57
10.
471
Cin
gG_L
0.85
70.
857
0.65
4E
C_L
0.85
70.
571
0.89
4M
FG_R
0.85
71.
000
0.70
6P
CT_
R0.
857
0.57
10.
557
SFG
_L0.
286
1.00
00.
745
UN
C_L
0.57
10.
857
0.68
7IF
G_R
0.28
61.
000
0.46
3M
CP
_R0.
857
0.28
60.
753
MFG
_L0.
857
1.00
00.
680
PC
T_L
0.28
60.
857
0.69
0Pr
CG
_R1.
000
1.00
00.
518
Fx_R
0.28
60.
286
0.09
4IF
G_L
0.57
11.
000
0.69
7M
CP
_L1.
000
1.00
00.
768
PoC
G_R
1.00
00.
857
0.55
0G
CC
_R0.
286
0.28
60.
329
PrC
G_L
1.00
01.
000
0.67
3Fx
_L0.
286
0.57
10.
785
AG
_R0.
857
0.85
70.
458
BC
C_R
0.85
70.
857
0.31
0Po
CG
_L0.
286
0.85
70.
640
GC
C_L
0.28
60.
571
0.32
1Pr
Cu_
R0.
571
0.85
70.
712
SC
C_R
0.28
60.
571
0.70
2A
G_L
0.28
60.
571
0.87
5B
CC
_L0.
857
0.57
10.
220
Cu_
R1.
000
1.00
00.
680
RLI
C_R
1.00
00.
857
0.99
1Pr
Cu_
L1.
000
1.00
00.
581
SC
C_L
0.28
60.
286
0.93
8LG
_R0.
857
0.85
70.
943
Red
Nc_
R0.
857
0.28
60.
969
Cu_
L0.
857
1.00
00.
773
RLI
C_L
0.85
70.
571
0.58
5Fu
G_R
0.57
11.
000
0.50
1S
nigr
a_R
0.28
60.
857
0.69
2LG
_L1.
000
0.57
10.
958
Red
Nc_
L1.
000
0.85
70.
973
PH
G_R
0.57
11.
000
0.81
8TA
P_R
0.85
70.
857
0.49
6Fu
_L0.
857
1.00
00.
817
Sni
gra_
R0.
286
0.57
10.
987
SO
G_R
0.28
60.
857
0.95
7C
aud_
R1.
000
0.85
70.
657
PH
G_L
0.57
10.
857
0.97
4TA
P_L
0.85
70.
286
0.22
5IO
G_R
0.57
10.
857
0.54
1Pu
t_R
0.28
60.
571
0.27
1S
OG
_L1.
000
1.00
00.
677
Cau
d_L
0.28
60.
571
0.76
4M
OG
_R0.
857
0.85
70.
777
Thal
_R0.
286
0.57
10.
889
IOG
_L0.
286
0.85
70.
881
Put_
L0.
857
0.85
70.
591
EN
T_R
0.28
60.
857
0.91
1G
P_R
0.85
70.
857
0.28
3M
OG
_L0.
857
0.85
70.
760
Thal
_L0.
286
0.57
10.
911
STG
_R0.
571
1.00
00.
480
Mid
brai
n_R
0.85
70.
571
0.60
7E
NT_
L0.
286
0.57
10.
779
GP
_L0.
286
0.85
70.
560
ITG
_R0.
571
0.85
70.
537
Pons
_R0.
857
1.00
00.
750
STG
_L0.
857
1.00
00.
794
Mid
brai
n_L
0.85
70.
286
0.49
2M
TG_R
0.28
61.
000
0.43
1M
edul
la_R
1.00
00.
286
0.83
6IT
G_L
0.85
70.
571
0.94
7Po
ns_L
0.57
10.
857
0.79
8LF
OG
_R0.
857
0.57
10.
408
SP
wm
_R0.
667
1.00
00.
983
MTG
_L0.
286
1.00
00.
796
Med
ulla
_L0.
571
0.28
60.
746
MFO
G_R
0.85
71.
000
0.48
2C
ingw
m_R
0.66
71.
000
0.89
6LF
OG
_L0.
571
0.57
10.
763
SP
WM
_L0.
667
0.66
70.
984
SM
G_R
0.57
10.
857
0.55
1S
FWM
_R0.
667
0.66
70.
936
MFO
G_L
0.28
61.
000
0.61
1C
ingw
m0.
333
1.00
00.
948
RG
_R0.
571
1.00
00.
479
MFW
M_R
1.00
00.
667
0.87
1S
MG
_L0.
571
0.85
70.
877
SFW
M_L
0.33
30.
667
0.99
0In
s_R
0.28
61.
000
0.28
2IF
WM
_R0.
333
0.66
70.
502
RG
_L0.
571
0.85
70.
532
MFW
M_L
0.66
70.
667
0.95
8A
myg
_R0.
857
0.57
10.
622
PrC
WM
_R1.
000
1.00
00.
682
Ins_
L0.
286
0.85
70.
385
IFW
M_L
1.00
00.
667
0.85
5H
ippo
_R0.
571
0.57
10.
912
PoC
WM
_R0.
667
0.66
70.
842
Am
yg_L
0.57
10.
857
0.76
5Pr
CW
M_L
1.00
00.
667
0.79
4ce
rebe
llum
_R1.
000
0.28
60.
627
AW
M_R
0.33
30.
667
0.90
9H
ippo
_L0.
571
0.28
60.
859
PoC
WM
_L0.
333
0.66
70.
848
CST
_R0.
857
0.28
60.
324
PreC
uWM
_R0.
667
0.66
70.
911
cere
brel
lum
_L0.
571
0.85
70.
805
AW
M_L
0.33
31.
000
0.91
5IC
P_R
1.00
00.
286
0.85
8C
uWM
_R0.
667
1.00
00.
482
CST
_L0.
571
0.28
60.
534
PrC
uWM
_L1.
000
0.66
70.
892
ML_
R0.
286
0.28
60.
673
LWM
_R0.
667
0.33
30.
642
ICP
_L1.
000
0.57
10.
994
CuW
M_L
0.33
31.
000
0.62
9S
CP
_R0.
286
0.28
60.
621
Fuw
m_R
0.66
70.
667
0.89
3M
L_L
0.28
60.
571
0.81
0LW
M_L
0.66
71.
000
0.76
7C
P_R
0.28
60.
286
0.27
9S
OW
M_R
0.66
71.
000
0.86
7S
CP
_L0.
571
0.57
10.
655
Fu_W
M_L
1.00
00.
667
0.92
6A
LIC
_R0.
571
0.28
60.
301
IOW
M_R
1.00
01.
000
0.49
0C
P_L
0.28
60.
286
0.14
4S
OW
M_L
0.66
71.
000
0.82
3P
LIC
_R0.
286
0.28
60.
448
MO
WM
_R0.
667
1.00
00.
739
ALI
C_L
0.28
60.
286
0.44
9IO
WM
_L0.
667
0.66
70.
890
PTR
_R0.
286
0.85
70.
914
STW
M_R
0.66
71.
000
0.70
5P
LIC
_L0.
286
0.28
60.
633
MO
WM
_L1.
000
0.66
70.
987
AC
R_R
0.28
60.
571
0.95
8IT
WM
_R0.
333
1.00
00.
800
PTR
_L0.
286
1.00
00.
650
STw
m_L
0.66
70.
667
0.99
4S
CR
_R0.
571
0.57
10.
646
MTW
M_R
0.66
71.
000
0.67
1A
CR
_L0.
286
0.57
10.
948
ITW
M_L
0.33
30.
667
0.85
6P
CR
_R0.
286
0.85
70.
900
LFO
WM
_R0.
333
1.00
00.
681
SC
R_L
0.85
70.
857
0.73
7M
TWM
_L0.
333
0.66
70.
927
CG
C_R
1.00
00.
857
0.92
1M
FOW
M_R
0.33
30.
667
0.80
1P
CR
_L0.
286
0.28
60.
997
LFO
WM
_L1.
000
1.00
00.
732
CG
H_R
0.57
10.
571
0.92
9S
MW
M_R
0.33
30.
667
0.48
3C
GC
_L0.
857
0.57
10.
980
MFO
WM
_L0.
333
0.66
70.
888
Fx/S
T_R
0.57
10.
571
0.57
0R
GW
M_R
0.33
30.
667
0.95
3
(Con
tinue
d)
Frontiers in Human Neuroscience www.frontiersin.org June 2013 | Volume 7 | Article 290 | 9

Choe et al. Neurological recovery from complete SCI
Ta
ble
4|
Co
nti
nu
ed
p-v
alu
ep
-va
lue
p-v
alu
ep
-va
lue
Co
lum
nID
Vo
lum
eFA
Tra
ce
Co
lum
nID
Vo
lum
eFA
Tra
ce
Co
lum
nID
Vo
lum
eFA
Tra
ce
Co
lum
nID
Vo
lum
eFA
Tra
ce
CG
H_L
0.85
70.
857
0.87
7S
MW
M_L
0.33
30.
667
0.70
9S
LF_R
0.28
60.
857
0.72
5ce
rebr
ellu
mw
m_R
0.33
30.
667
0.58
7Fx
/ST_
L0.
857
0.28
60.
952
RG
WM
_L0.
333
0.66
70.
737
SFO
_R1.
000
0.57
10.
712
IFO
_L0.
286
0.57
10.
750
SLF
_L0.
286
0.85
70.
972
cere
brel
lum
wm
_L0.
667
0.66
70.
632
IFO
_R0.
286
0.85
70.
399
Cin
gG_R
0.85
71.
000
0.70
6S
FO_L
1.00
00.
571
0.93
6S
PG
_R0.
571
1.00
00.
769
SS
_R0.
571
0.85
70.
966
EC
_R0.
857
0.57
10.
608
SP
G,s
uper
ior
parie
tall
obul
e;C
ingG
,cin
gula
tegy
rus;
SFG
,sup
erio
rfr
onta
lgyr
us;M
FG,m
iddl
efr
onta
lgyr
us;I
FG,i
nfer
ior
fron
talg
yrus
;PrC
G,p
rece
ntra
lgyr
us;P
oCG
,pos
tcen
tral
gyru
s;A
G,a
ngul
argy
rus;
PrC
u,
pre-
cune
us;
Cu,
cune
us;
LG,
lingu
algy
rus;
Fu,
fusi
form
gyru
s;P
HG
,par
ahip
poca
mpa
lgy
rus;
SO
G,s
uper
ior
occi
pita
lgyr
us;
IOG
,in
ferio
roc
cipi
talg
yrus
;M
OG
,mid
dle
occi
pita
lgyr
us;
EN
T,en
torh
inal
area
;S
TG,
supe
rior
tem
pora
lgyr
us;
ITG
,in
ferio
rte
mpo
ralg
yrus
;M
TG,
mid
dle
tem
pora
lgyr
us;
LFO
G,
late
ralf
ront
o-or
bita
lgy
rus;
MFO
G,
mid
dle
fron
to-o
rbita
lgy
rus;
RG
,gyr
usre
ctus
;In
s,in
sula
r;A
myg
,am
ygda
la;
Hip
po,
hipp
ocam
pus;
cere
brel
lum
,ce
rebe
llum
;C
ST,
cort
icos
pina
ltra
ct;
ICP,
infe
rior
cere
bella
rpe
dunc
le;
ML,
med
iall
emni
scus
;S
CP,
supe
rior
cere
bella
rpe
dunc
le;
CP,
cere
bral
pedu
ncle
;A
LIC
,an
terio
rlim
bof
inte
rnal
caps
ule;
PLI
C,
post
erio
rlim
bof
inte
rnal
caps
ule;
PTR
,po
ster
ior
thal
amic
radi
atio
n;A
CR
,an
terio
rco
rona
radi
ata;
SC
R,
supe
rior
coro
nara
diat
a;P
CR
,po
ster
ior
coro
nara
diat
a;C
GC
,ci
ngul
um(c
ingu
late
gyru
s);
CG
H,c
ingu
lum
(hip
poca
mpu
s);
Fx/S
T,fo
rnix
(cre
s)/s
tria
term
inal
is;S
LF,s
uper
ior
long
itudi
nalf
asci
culu
s;S
FO,s
uper
ior
fron
to-o
ccip
italf
asci
culu
s;S
MG
,sup
ram
argi
nalg
yrus
;IFO
,inf
erio
rfr
onto
-occ
ipita
lfas
cicu
lus;
SS,
sagi
ttal
stra
tum
;E
C,
exte
rnal
caps
ule;
UN
C,
unci
nate
fasc
icul
us;
PC
T,po
ntin
ecr
ossi
ngtr
act;
MC
P,m
iddl
ece
rebe
llar
pedu
ncle
;Fx
,fo
rnix
;G
CC
,ge
nuof
corp
usca
llosu
m;
BC
C,
body
ofco
rpus
callo
sum
;
SC
C,s
plen
ium
ofco
rpus
callo
sum
;R
LIC
,ret
role
ntic
ular
part
ofin
tern
alca
psul
e;R
edN
c,re
dnu
cleu
s;S
nigr
a_R
,sub
stan
cia
nigr
a;TA
P,ta
patu
m;
Cau
d,ca
udat
enu
cleu
s;Pu
t,pu
tam
en;
Thal
,tha
lam
us;
GP,
glob
us
palli
dus;
Mid
brai
n,m
idbr
ain;
Pons
,po
ns;
Med
ulla
,m
edul
la;
SP
WM
,su
perio
rpa
rieta
lwm
;C
ingw
m,
cing
ulum
wm
;S
FWM
,su
perio
rfr
onta
lwm
;IF
WM
,in
ferio
rfr
onta
lwm
;M
FWM
,m
iddl
efr
onta
lwm
;Pr
CW
M,
prec
entr
alw
m;
PoC
WM
,po
stce
ntra
lwm
;A
WM
,an
gula
rwm
;Pr
CuW
M,
pre-
cune
usw
m;
CuW
M,
cune
usw
m;
LWM
,lin
gual
wm
;Fu
_WM
,fu
sifo
rmw
m;
SO
WM
,su
perio
roc
cipi
talw
m;
IOW
M,
infe
rior
occi
pita
l
wm
;M
OW
M,
mid
dle
occi
pita
lw
m;
STw
m,
supe
rior
tem
pora
lwm
;IT
WM
,in
ferio
rte
mpo
ralw
m;
MTW
M,
mid
dle
tem
pora
lwm
;LF
OW
M,
late
ral
fron
to-o
rbita
lwm
;M
FOW
M,
mid
dle
fron
to-o
rbita
lwm
;S
MW
M,
supr
amar
gina
lwm
;RG
WM
,rec
tusw
m;c
ereb
rellu
mw
m,c
ereb
ellu
mw
m.
has sufficient integrity to enable function. The rs-fMRI showedincreased functional connectivity between the patient’s sensori-motor and the visual networks, indicating cortical plasticity; thiscortical plasticity was not accompanied by structural changes inthe brain.
MRI-BASED STRUCTURAL EVALUATION OF A CHRONICALLY INJUREDSPINAL CORDWhole cord cross-sectional area was shown to correlate withthe motor and sensory scores of SCI patients (Lundell et al.,2011). However, the atrophy of the whole cord is accompaniedby increased scar tissues in the cord and the degree of whitematter atrophy can be greater than that of the whole cord, asour data shows (Figure 3). We used FA images, which can dif-ferentiate white matter from gray matter and scar tissues, tosegment white matter from the injured cord. The wca and wmavalues of the healthy spinal cords measured using this approachwere comparable to those values measured using higher resolu-tion structural images acquired through 7T MRI (Sigmund et al.,2011), CT (Fountas et al., 1998), cadaver anatomy (Ko et al.,2004), as well as other previous histological methods (Kameyamaet al., 1996; White et al., 1997; Gilmore et al., 2005). Ourresults showed that the patient’s neurological recovery is achieveddespite a 62% atrophy of the white mater tissue at the injuryepicenter.
Structural integrity of the major columns directly affectsneurological recovery of specific motor and sensory functions.Column-specific data analysis (Smith et al., 2010) enabledincorporation of manual and tractography-based ROI selectionapproach, allowing more time efficient data analysis, and com-parison of DTI- and MTI-derived quantities of the controlsand the patient in the residual tissue from the major columns(Figure 4). DTI and MTI are advanced MR imaging modali-ties that are sensitive to tissue microstructures. DTI provides anindirect measure of tissue structure on a microscopic scale byprobing water diffusion (Basser et al., 1994), while MTI does so bymeasuring the magnetization interaction between bulk water pro-tons and semi-solid macromolecular protons (Wolff and Balaban,1989; Smith et al., 2005). FA, λ‖, and MTCSF are sensitive tochanges in both axonal and myelin integrity, but previous stud-ies have shown that λ‖ is more sensitive to axonal damages (Songet al., 2002, 2005; Budde et al., 2009) while FA is not specific(Farrell et al., 2010; Landman et al., 2010). In our patient, focalchanges of DTI-derived quantities (Figure 4) were found thatindicate mixed damage types over the cervical cord—i.e., thereduction in FA is caused mainly by increases in λ‖ that couldbe due to axonal and myelin damage. MTCSF is more sensitiveto myelination and the diffuse increase of MTCSF throughoutthe cervical cord (Figure 4) suggests diffuse demyelination ordysmyelination throughout the cervical cord. Overall, the DTIparameters describe the extensive damage but not how it affectedthe recovery.
A high correlation between FA and total AIS scores in chronicSCI patients has been described (Cohen-Adad et al., 2011). Fromthat data we extrapolate a FA value (0.47) for chronic SCI patientswith the same AIS score as our patient (124). The FA value of thepatient (0.63) is higher than the extrapolated FA value (0.47). The
Frontiers in Human Neuroscience www.frontiersin.org June 2013 | Volume 7 | Article 290 | 10

Choe et al. Neurological recovery from complete SCI
FIGURE 5 | Functional networks of the controls and the patient
estimated using GICA. GICA was performed to delineate same functionalnetworks in the controls and the patient. ICs are overlaid on the MontrealNeurological Institute (MNI) template. (A–L) First column corresponds to thesagittal, coronal, and axial view of the controls’ functional networks. Secondcolumn corresponds to the patient’s functional networks. Coordinates (in
mm) for each view are indicated on top of the subfigures, along with the ICnumbers assigned during GICA. WNC of the controls (in blue) and the patient(in red) for each network are shown as a series of box plots. On each box,central mark is the median and edges of the box are the 25th and 75thpercentiles. Aud, auditory; Smot, seonsorimotor; Vis, visual; DMN, defaultmode network; Attn, attention; Exec, executive; Sal, salience.
higher FA of the patient is driven by the higher λ‖. The higher λ‖value can be explained in part by the previously reported trend ofMD and λ‖ change in different stages of traumatic injuries, withinitial decrease during the acute phase of injury (Loy et al., 2007)and increased values during the chronic phase of injury (Naismithet al., 2009; Klawiter et al., 2011). This trend alone, however,does not fully explain the higher λ‖ observed in the patient, asthe patient cohort observed in Cohen-Adad et al. (2011) are alsochronic SCI patients with comparable delay after injury as thepatient in this report. The higher λ‖ of the patient therefore maysuggest higher axonal integrity. The DTI- and MTI-derived quan-tities of the controls were comparable to those reported in similarstudies (Zackowski et al., 2009; Smith et al., 2010).
The small size of a spinal cord presents major imaging chal-lenges. High resolution images are often desired, and the sizemakes the images more vulnerable to partial volume effect andvarious motions artifacts. While longer scan time and gating maybe used to alleviate these issues to an extent, keeping patientswith movement difficulties in the scanner for a long time is unde-sirable. Issue of misregistration cannot be ignored either, as theconsequence of misregistration is greater in the spinal cord dueto its size. One source of such misregistration is the use of anEPI read out during DTI acquisition, which can result in sub-stantial eddy current effects. In order to minimize the effect ofeddy current and misregistration, a robust registration schemeutilizing CATNAP (Farrell et al., 2007; Landman et al., 2007) was
Frontiers in Human Neuroscience www.frontiersin.org June 2013 | Volume 7 | Article 290 | 11

Choe et al. Neurological recovery from complete SCI
FIGURE 6 | Between-network connectivity. (A) BNC correlation matrixshows synchrony between pairs of functional networks. (B) Combined matrixof the standard deviation of the corresponding BNC measurements. (A,B) Inreference to the top–left to bottom–right diagonal axis, bottom–left portioncorresponds to the controls and top–right portion corresponds to the patient.
Diagonal elements have been zeroed for display purposes. (C) Differencebetween the controls and the patient’s BNC measurements. (D) Box plots ofcontrols’ BNC measurements, with the patient’s mean BNC values indicatedby red dots. Shown are the 10 functional networks with the largestdifferences between the patient and controls.
used to correct artifacts in DTI, using optimized input parame-ters (Farrell et al., 2008). While a more sophisticated eddy currentcorrection scheme that uses field maps may improve the regis-tration accuracy further, the tract-specific data comparison ofthis study showed good correlation between structural and func-tional information provided by MRI and clinical evaluation of thepatient.
MRI-BASED EVALUATION OF THE BRAIN IN A CHRONIC SPINAL CORDINJURY PATIENTConsidering the extensive structural changes of the patient’sspinal cord, and based on previous studies that report marked
atrophy in the sensorimotor cortex (Crawley et al., 2004;Jurkiewicz et al., 2006; Wrigley et al., 2009; Freund et al., 2011;Henderson et al., 2011), our initial hypothesis was that we wouldobserve similar gray matter atrophy in the patient’s brain. Ourresult indicates, however, that the injury did not lead to significantstructural changes in the patient’s brain. One possible explanationis that unlike other SCI patients, the patient’s structural changeswere small and intracortical, and we did not have enough samplesize and statistical power to detect the subtle changes. One study(Henderson et al., 2011), for example, shows that an extensivefunctional reorganization such as the one the patient demon-strates, may work to minimize the anatomical atrophy in the
Frontiers in Human Neuroscience www.frontiersin.org June 2013 | Volume 7 | Article 290 | 12
Choe et al. Neurological recovery from complete SCI
sensorimotor cortex. This hypothesis is also in part supported bythe initial observations of chronic deafferentiation and its effecton cortical anatomy (Florence et al., 1998) where major func-tional reorganization following limb amputation of a macaquemonkey was accompanied by significant increase of intracorit-cal connections but not by any significant changes of majorthalamocortical fiber tracts.
In order to differentiate functional networks, GICA (Calhounet al., 2001) was performed using all eight runs of the subject andone run from 20 healthy controls. This enabled us to identify simi-lar functional networks in both the control group and the subject,effectively eliminating the necessity to perform ICA separatelyon each subject and allowing differentiation of the same func-tional networks with different activation patterns. While therehave been some concerns that the identification of aggregate func-tional networks using a single dataset of multiple groups maybias the results, a simulation study (Schmithorst and Holland,2004) showed that GICA can identify a functional network that ispresent in only 10–15% of the total population. Another advan-tage of GICA is that the method is model-free and does not makeany assumptions about the nature of BNC.
A novel finding of this study is the increased connectivitybetween sensorimotor and visual networks. The patient regainedonly 10% of sensory function in the lower body and relies heav-ily on vision to guide his movements. In light of this clinicalpresentation, our observation suggests plastic changes in the sen-sorimotor and visual networks of the patient. Studies on strokepatients have shown that visual guidance of movement con-tributes to the recovery of hand motor function (Kalra et al.,1997; Seitz et al., 1999), while lack of it may be detrimentalfor the recovery of sensorimotor function (Kalra et al., 1997).The increased functional connectivity between the sensorimotorand visual networks suggests that deprivation of sensory inputthat resulted from the SCI may have led to compensatory func-tional changes in the patient’s brain. Another possibility is thatthe patient had increased connectivity between the two networksprior to the injury and this contributed to his recovery.
We also observed increased connectivity of the left executivenetwork to other brain networks. The executive network (Seeleyet al., 2007) links dorsolateral frontal and parietal cortex and isa task positive network that is related to working memory andcontrol processes (Dosenbach et al., 2007; Stevens, 2009). Theasymmetrical nature of the increased connectivity (left more than
right) may be related to the asymmetric recovery of motor andsensory function of the patient. It should be noted that the mag-nitude of the asymmetry of the motor and sensory function isnot fully appreciated through the AIS score, which is well-suitedto describe the neurological level of the injury but ill-suited todescribe the degree of functional loss.
The study presented here is a case report; therefore we are lim-ited in our ability to draw statistically significant conclusions—forspatial differences of ICs as well as changes in BNC. This isbecause we are comparing single run data from multiple controls,subject to an inter-subject variability, to multiple run data fromthe subject, subject to an intra-subject variability. A larger cohortof SCI population is necessary in order to draw statistically sig-nificant conclusion about the changes in ICs and BNC of SCIpatients. Nevertheless, the study showed good agreement betweenthe rs-fMRI results and the clinical presentation of the subject andpresents the possibility that rs-fMRI may aid in better SCI diag-nosis and prognosis, as well as better monitoring and optimizingtherapies for SCI subjects.
CONCLUDING REMARKSIn conclusion, the current study provides a detailed analysis ofstructural and functional changes in the central nervous sys-tem of a patient with chronic SCI who underwent a remarkableneurological recovery that continued for 17 years. To the bestof our knowledge, this is the first study which used rs-fMRI toinvestigate cortical functional changes in SCI patients, alongsidethe investigation of structural changes using spinal cord imag-ing. Furthermore, the study has theoretical significance becauseit may identify variables—i.e., sufficient structural integrity forproper signal conduction in the spinal cord and compensatoryplastic changes in the brain—that are necessary for neurologicaland functional improvements. Additionally, this work shows thepotential of rs-fMRI to evaluate the extent of cortical plasticityrequired for functional recovery in patients whose neurologicaldeficits prohibit completion of externally cued motor or sensorytasks.
ACKNOWLEDGMENTSThe authors would like to thank Dr. Jeffrey D. Rothstein forhelpful discussion and advice. This work was supported in partby grants from the DOD (W81XWH-08-1-0192) and NIH (R21EB006120-01A2 and P41 EB015909).
REFERENCESAshburner, J., and Friston, K. J.
(2005). Unified segmentation.Neuroimage 26, 839–851. doi:10.1016/j.neuroimage.2005.02.018
Basser, P. J., Mattiello, J., and LeBihan,D. (1994). MR diffusion tensorspectroscopy and imaging. Biophys.J. 66, 259–267. doi: 10.1016/S0006-3495(94)80775-1
Beaulieu, C. (2002). The basis ofanisotropic water diffusion in thenervous system – a technical review.NMR Biomed. 15, 435–455. doi:10.1002/nbm.782
Beg, M., Miller, M., Trouve, A., andYounes, L. (2005). Computing largedeformation metric mappings viagoodesic flows of diffeomorphisms.Int. J. Comput. Vis. 61, 139–157.doi: 10.1023/B:VISI.0000043755.93987.aa
Belegu, V., Oudega, M., Gary, D. S., andMcDonald, J. W. (2007). Restoringfunction after spinal cord injury:promoting spontaneous regenera-tion with stem cells and activity-based therapies. Neurosurg. Clin.North Am. 18, 143–168, xi. doi:10.1016/j.nec.2006.10.012
Blight, A. R. (1983). Cellular mor-phology of chronic spinal cordinjury in the cat: analysis of myeli-nated axons by line-sampling.Neuroscience 10, 521–543. doi:10.1016/0306-4522(83)90150-1
Budde, M. D., Xie, M., Cross, A. H.,and Song, S. K. (2009). Axial dif-fusivity is the primary correlate ofaxonal injury in the experimentalautoimmune encephalomyelitisspinal cord: a quantitative pixelwiseanalysis. J. Neurosci. 29, 2805–2813.doi: 10.1523/JNEUROSCI.4605-08.2009
Calhoun, V. D., Adali, T., Pearlson, G.D., and Pekar, J. J. (2001). A methodfor making group inferences fromfunctional MRI data using inde-pendent component analysis. Hum.Brain Mapp. 14, 140–151. doi:10.1002/hbm.1048
Choe, A. S., Stepniewska, I., Colvin,D. C., Ding, Z., and Anderson, A.W. (2012). Validation of diffusiontensor MRI in the central nervoussystem using light microscopy:quantitative comparison of fiberproperties. NMR Biomed. 25,900–908. doi: 10.1002/nbm.1810
Frontiers in Human Neuroscience www.frontiersin.org June 2013 | Volume 7 | Article 290 | 13
Choe et al. Neurological recovery from complete SCI
Cohen-Adad, J., El Mendili, M. M.,Lehericy, S., Pradat, P. F., Blancho,S., Rossignol, S., et al. (2011).Demyelination and degenera-tion in the injured human spinalcord detected with diffusion andmagnetization transfer MRI.Neuroimage 55, 1024–1033. doi:10.1016/j.neuroimage.2010.11.089
Cohen-Adad, J., El Mendili, M. M.,Morizot-Koutlidis, R., Lehericy,S., Meininger, V., Blancho, S.,et al. (2013). Involvement ofspinal sensory pathway in ALSand specificity of cord atrophyto lower motor neuron degener-ation. Amyotroph. Lateral Scler.Frontotemporal Degener. 14, 30–38.doi: 10.3109/17482968.2012.701308
Crawley, A. P., Jurkiewicz, M. T.,Yim, A., Heyn, S., Verrier, M.C., Fehlings, M. G., et al. (2004).Absence of localized grey mattervolume changes in the motorcortex following spinal cordinjury. Brain Res. 1028, 19–25. doi:10.1016/j.brainres.2004.08.060
Dosenbach, N. U., Fair, D. A., Miezin,F. M., Cohen, A. L., Wenger, K.K., Dosenbach, R. A., et al. (2007).Distinct brain networks for adap-tive and stable task control inhumans. Proc. Natl. Acad. Sci.U.S.A. 104, 11073–11078. doi:10.1073/pnas.0704320104
Endo, T., Spenger, C., Tominaga, T.,Brene, S., and Olson, L. (2007).Cortical sensory map rearrange-ment after spinal cord injury: FMRIresponses linked to nogo signalling.Brain 130, 2951–2961. doi: 10.1093/brain/awm237
Faria, A. V., Hoon, A., Stashinko, E.,Li, X., Jiang, H., Mashayekh, A.,et al. (2011). Quantitative anal-ysis of brain pathology basedon MRI and brain atlases–applications for cerebral palsy.Neuroimage 54, 1854–1861. doi:10.1016/j.neuroimage.2010.09.061
Faria, A. V., Zhang, J., Oishi, K., Li,X., Jiang, H., Akhter, K., et al.(2010). Atlas-based analysis ofneurodevelopment from infancyto adulthood using diffusion ten-sor imaging and applications forautomated abnormality detection.Neuroimage 52, 415–428. doi:10.1016/j.neuroimage.2010.04.238
Farrell, J. A., Landman, B. A., Jones, C.K., Smith, S. A., Prince, J. L., vanZijl, P. C., et al. (2007). Effects ofsignal-to-noise ratio on the accu-racy and reproducibility of diffu-sion tensor imaging-derived frac-tional anisotropy, mean diffusivity,and principal eigenvector measure-ments at 1.5 T. JMRI 26, 756–767.doi: 10.1002/jmri.21053
Farrell, J. A., Smith, S. A., Gordon-Lipkin, E. M., Reich, D. S., Calabresi,P. A., and van Zijl, P. C. (2008).High b-value q-space diffusion-weighted MRI of the human cervicalspinal cord in vivo: feasibility andapplication to multiple sclerosis.Magn. Reson. Med. 59, 1079–1089.doi: 10.1002/mrm.21563
Farrell, J. A., Zhang, J., Jones, M.V., Deboy, C. A., Hoffman, P. N.,Landman, B. A., et al. (2010).Q-space and conventional diffusionimaging of axon and myelin damagein the rat spinal cord after axotomy.Magn. Reson. Med. 63, 1323–1335.doi: 10.1002/mrm.22389
Florence, S. L., Taub, H. B., and Kaas, J.H. (1998). Large-scale sprouting ofcortical connections after peripheralinjury in adult macaque monkeys.Science (N.Y.) 282, 1117–1121. doi:10.1126/science.282.5391.1117
Fountas, K. N., Kapsalaki, E. Z., Jackson,J., Vogel, R. L., and Robinson, J.S. Jr. (1998). Cervical spinal cord–smaller than considered? Spine 23,1513–1516. doi: 10.1097/00007632-199807150-00001
Freund, P., Weiskopf, N., Ward, N. S.,Hutton, C., Gall, A., Ciccarelli,O., et al. (2011). Disability,atrophy and cortical reorga-nization following spinal cordinjury. Brain 134, 1610–1622. doi:10.1093/brain/awr093
Friston, K. J., Holmes, A. P., Worsley,K. J., Poline, J. P., Frith, C.D., and Frackowiak, R. S. J.(1994). Statistical parametricmaps in functional imaging: ageneral linear approach. Hum.Brain Mapp. 2, 189–210. doi:10.1002/hbm.460020402
Gilmore, C. P., DeLuca, G. C., Bo, L.,Owens, T., Lowe, J., Esiri, et al.(2005). Spinal cord atrophy inmultiple sclerosis caused by whitematter volume loss. Arch. Neurol.62, 1859–1862. doi: 10.1001/arch-neur.62.12.1859
Henderson, L. A., Gustin, S. M.,Macey, P. M., Wrigley, P. J., andSiddall, P. J. (2011). Functionalreorganization of the brain inhumans following spinal cordinjury: evidence for underlyingchanges in cortical anatomy. J.Neurosci. 31, 2630–2637. doi:10.1523/JNEUROSCI.2717-10.2011
Himberg, J., Hyvarinen, A., andEsposito, F. (2004). Validatingthe independent componentsof neuroimaging time seriesvia clustering and visualization.Neuroimage 22, 1214–1222. doi:10.1016/j.neuroimage.2004.03.027
Jenkinson, M., Bannister, P., Brady,M., and Smith, S. (2002). Improved
optimization for the robust andaccurate linear registration andmotion correction of brain images.Neuroimage 17, 825–841. doi:10.1006/nimg.2002.1132
Jiang, H., van Zijl, P. C., Kim, J.,Pearlson, G. D., and Mori, S.(2006). DtiStudio: resourceprogram for diffusion tensorcomputation and fiber bun-dle tracking. Comput. MethodsProgr. Biomed. 81, 106–116. doi:10.1016/j.cmpb.2005.08.004
Joel, S. E., Caffo, B. S., van Zijl, P. C.,and Pekar, J. J. (2011). On the rela-tionship between seed-based andICA-based measures of functionalconnectivity. Magn. Reson. Med. 66,644–657. doi: 10.1002/mrm.22818
Jurkiewicz, M. T., Crawley, A. P.,Verrier, M. C., Fehlings, M.G., and Mikulis, D. J. (2006).Somatosensory cortical atro-phy after spinal cord injury:a voxel-based morphometrystudy. Neurology 66, 762–764.doi: 10.1212/01.wnl.0000201276.28141.40
Jurkiewicz, M. T., Mikulis, D. J.,Fehlings, M. G., and Verrier, M.C. (2010). Sensorimotor corti-cal activation in patients withcervical spinal cord injury withpersisting paralysis. Neurorehabil.Neural Repair 24, 136–140. doi:10.1177/1545968309347680
Jurkiewicz, M. T., Mikulis, D. J.,McIlroy, W. E., Fehlings, M. G., andVerrier, M. C. (2007). Sensorimotorcortical plasticity during recoveryfollowing spinal cord injury: a lon-gitudinal fMRI study. Neurorehabil.Neural Repair 21, 527–538. doi:10.1177/1545968307301872
Kalra, L., Perez, I., Gupta, S., andWittink, M. (1997). The influenceof visual neglect on stroke rehabil-itation. Stroke 28, 1386–1391. doi:10.1161/01.STR.28.7.1386
Kameyama, T., Hashizume, Y., andSobue, G. (1996). Morphologicfeatures of the normal humancadaveric spinal cord. Spine 21,1285–1290. doi: 10.1097/00007632-199606010-00001
Kirshblum, S., Millis, S., McKinley,W., and Tulsky, D. (2004). Lateneurologic recovery after traumaticspinal cord injury. Arch. Phys.Med. Rehab. 85, 1811–1817. doi:10.1016/j.apmr.2004.03.015
Klawiter, E. C., Schmidt, R. E.,Trinkaus, K., Liang, H. F., Budde,M. D., Naismith, R. T., et al.(2011). Radial diffusivity pre-dicts demyelination in ex vivomultiple sclerosis spinal cords.Neuroimage 55, 1454–1460. doi:10.1016/j.neuroimage.2011.01.007
Ko, H. Y., Park, J. H., Shin, Y. B., andBaek, S. Y. (2004). Gross quanti-tative measurements of spinal cordsegments in human. Spinal Cord 42,35–40. doi: 10.1038/sj.sc.3101538
Landman, B. A., Farrell, J. A., Jones,C. K., Smith, S. A., Prince, J.L., and Mori, S. (2007). Effectsof diffusion weighting schemeson the reproducibility of DTI-derived fractional anisotropy,mean diffusivity, and principaleigenvector measurements at 1.5T.Neuroimage 36, 1123–1138. doi:10.1016/j.neuroimage.2007.02.056
Landman, B. A., Farrell, J. A., Smith,S. A., Reich, D. S., Calabresi, P. A.,and van Zijl, P. C. (2010). Complexgeometric models of diffusion andrelaxation in healthy and damagedwhite matter. NMR Biomed. 23,152–162. doi: 10.1002/nbm.1437
Landman, B. A., Huang, A. J., Gifford,A., Vikram, D. S., Lim, I. A., Farrell,J. A., et al. (2011). Multi-parametricneuroimaging reproducibil-ity: A 3-T resource study.Neuroimage 54, 2854–2866. doi:10.1016/j.neuroimage.2010.11.047
Levesque, I. R., Giacomini, P. S.,Narayanan, S., Ribeiro, L. T., Sled,J. G., Arnold, D. L., et al. (2010).Quantitative magnetization transferand myelin water imaging of theevolution of acute multiple sclero-sis lesions. Magn. Reson. Med. 63,633–640. doi: 10.1002/mrm.22244
Li, Y. O., Adali, T., and Calhoun,V. D. (2007). Estimating thenumber of independent com-ponents for functional magneticresonance imaging data. Hum.Brain Mapp. 28, 1251–1266. doi:10.1002/hbm.20359
Loy, D. N., Kim, J. H., Xie, M.,Schmidt, R. E., Trinkaus, K., andSong, S. K. (2007). Diffusiontensor imaging predicts hypera-cute spinal cord injury severity.J. Neurotr. 24, 979–990. doi:10.1089/neu.2006.0253
Lundell, H., Barthelemy, D.,Skimminge, A., Dyrby, T. B.,Biering-Sorensen, F., and Nielsen, J.B. (2011). Independent spinal cordatrophy measures correlate to motorand sensory deficits in individualswith spinal cord injury. SpinalCord 49, 70–75. doi: 10.1038/sc.2010.87
Maes, F., Vandermeulen, D., andSuetens, P. (1999). Comparativeevaluation of multiresolutionoptimization strategies formultimodality image regis-tration by maximization ofmutual information. Med.Image Anal. 3, 373–386. doi:10.1016/S1361-8415(99)80030-9
Frontiers in Human Neuroscience www.frontiersin.org June 2013 | Volume 7 | Article 290 | 14

Choe et al. Neurological recovery from complete SCI
Maynard, F. M. Jr., Bracken, M. B.,Creasey, G., Ditunno, J. F. Jr.,Donovan, W. H., Ducker, T. B.,et al. (1997). International stan-dards for neurological and func-tional classification of spinal cordinjury. american spinal injury asso-ciation. Spinal Cord 35, 266–274.doi: 10.1038/sj.sc.3100432
McDonald, J. W., and Sadowsky, C.(2002). Spinal-cord injury. Lancet359, 417–425. doi: 10.1016/S0140-6736(02)07603-1
Naismith, R. T., Xu, J., Tutlam, N. T.,Snyder, A., Benzinger, T., Shimony,J., et al. (2009). Disability in opticneuritis correlates with diffusiontensor-derived directional diffu-sivities. Neurology 72, 589–594.doi: 10.1212/01.wnl.0000335766.22758.cd
Nathan, P. W. (1994). Effects onmovement of surgical incisionsinto the human spinal cord.Brain 117(Pt 2), 337–346. doi:10.1093/brain/117.2.337
Oishi, K., Mori, S., Donohue, P. K.,Ernst, T., Anderson, L., Buchthal, S.,et al. (2011). Multi-contrast humanneonatal brain atlas: application tonormal neonate development anal-ysis. Neuroimage 56, 8–20. doi:10.1016/j.neuroimage.2011.01.051
Oishi, K., Zilles, K., Amunts, K., Faria,A., Jiang, H., Li, X., et al. (2008).Human brain white matter atlas:identification and assignmentof common anatomical struc-tures in superficial white matter.Neuroimage 43, 447–457. doi:10.1016/j.neuroimage.2008.07.009
Schmithorst, V. J., and Holland, S.K. (2004). Comparison of threemethods for generating groupstatistical inferences from inde-pendent component analysis offunctional magnetic resonanceimaging data. JMRI 19, 365–368.doi: 10.1002/jmri.20009
Seeley, W. W., Menon, V., Schatzberg,A. F., Keller, J., Glover, G.H., Kenna, H., et al. (2007).Dissociable intrinsic connectivitynetworks for salience process-ing and executive control. J.Neurosci. 27, 2349–2356. doi:10.1523/JNEUROSCI.5587-06.2007
Seitz, R. J., Knorr, U., Azari, N. P.,Herzog, H., and Freund, H. J.(1999). Visual network activation inrecovery from sensorimotor stroke.Restor. Neurol. Neurosci. 14, 25–33.
Sigmund, E. E., Suero, G. A., Hu,C., McGorty, K., Sodickson, D.K., Wiggins, G. C., et al. (2011).High-resolution human cervi-cal spinal cord imaging at 7 T.NMR Biomed. 25, 891–899. doi:10.1002/nbm.1809
Smith, S. A., Golay, X., Fatemi, A.,Jones, C. K., Raymond, G. V., Moser,H. W., et al. (2005). Magnetizationtransfer weighted imaging inthe upper cervical spinal cordusing cerebrospinal fluid as inter-subject normalization reference(MTCSF imaging). Magn. Reson.Med. 54, 201–206. doi: 10.1002/mrm.20553
Smith, S. A., Jones, C. K., Gifford, A.,Belegu, V., Chodkowski, B., Farrell,J. A., et al. (2010). Reproducibility oftract-specific magnetization trans-fer and diffusion tensor imagingin the cervical spinal cord at 3tesla. NMR Biomed. 23, 207–217.10.1002/nbm.1447
Song, S. K., Sun, S. W., Ramsbottom,M. J., Chang, C., Russell,J., and Cross, A. H. (2002).Dysmyelination revealed throughMRI as increased radial (butunchanged axial) diffusion of water.Neuroimage 17, 1429–1436. doi:10.1006/nimg.2002.1267
Song, S. K., Yoshino, J., Le, T. Q.,Lin, S. J., Sun, S. W., Cross, A.H., et al. (2005). Demyelination
increases radial diffusivity in cor-pus callosum of mouse brain.Neuroimage 26, 132–140. doi:10.1016/j.neuroimage.2005.01.028
Stevens, M. C. (2009). The develop-mental cognitive neuroscienceof functional connectivity.Brain Cogn. 70, 1–12. doi:10.1016/j.bandc.2008.12.009
Vazquez, X. M., Rodriguez, M. S.,Penaranda, J. M., Concheiro, L.,and Barus, J. I. (2008). Determiningprognosis after spinal cord injury.J. Foren. Legal Med. 15, 20–23. doi:10.1016/j.jflm.2007.06.003
White, L. E., Andrews, T. J., Hulette, C.,Richards, A., Groelle, M., Paydarfar,J., et al. (1997). Structure of thehuman sensorimotor system. II: lat-eral symmetry. Cereb. Cortex (N.Y)7, 31–47.
Wolff, S. D., and Balaban, R. S.(1989). Magnetization transfercontrast (MTC) and tissue waterproton relaxation in vivo. Magn.Reson. Med. 10, 135–144. doi:10.1002/mrm.1910100113
Woods, R. P., Grafton, S. T., Holmes, C.J., Cherry, S. R., and Mazziotta, J. C.(1998). Automated image registra-tion: I. general methods and intra-subject, intramodality validation. J.Comput. Ass. Tomogr. 22, 139–152.doi: 10.1097/00004728-199801000-00027
Wrigley, P. J., Gustin, S. M., Macey,P. M., Nash, P. G., Gandevia, S.C., Macefield, V. G., et al. (2009).Anatomical changes in humanmotor cortex and motor path-ways following complete thoracicspinal cord injury. Cereb. Cortex(N.Y) 19, 224–232.
Zackowski, K. M., Smith, S. A.,Reich, D. S., Gordon-Lipkin, E.,Chodkowski, B. A., Sambandan,D. R., et al. (2009). Sensorimotordysfunction in multiple scle-rosis and column-specific
magnetization transfer-imagingabnormalities in the spinalcord. Brain 132, 1200–1209.doi: 10.1093/brain/awp032
Conflict of Interest Statement: Dr.Pekar serves as Manager of the F. M.Kirby Research Center for FunctionalBrain Imaging, which receives researchsupport from Philips HealthCare,which manufactures the MRI scannersused in this study. Dr. van Zijl has grantfunding from Philips Healthcare. Inaddition, Dr. van Zijl is the inventor oftechnology that is licensed to Philipsand is a paid lecturer for Philips. Thisarrangement has been approved byJohns Hopkins University in accor-dance with its conflict of interestpolicies. The other authors declarethat the research was conducted inthe absence of any commercial orfinancial relationships that could beconstrued as a potential conflict ofinterest.
Received: 25 February 2013; accepted:03 June 2013; published online: 25 June2013.Citation: Choe AS, Belegu V, Yoshida S,Joel S, Sadowsky CL, Smith SA, van ZijlPCM, Pekar JJ and McDonald JW (2013)Extensive neurological recovery from acomplete spinal cord injury: a case reportand hypothesis on the role of corticalplasticity. Front. Hum. Neurosci. 7:290.doi: 10.3389/fnhum.2013.00290Copyright © 2013 Choe, Belegu,Yoshida, Joel, Sadowsky, Smith, van Zijl,Pekar and McDonald. This is an open-access article distributed under the termsof the Creative Commons AttributionLicense, which permits use, distributionand reproduction in other forums,provided the original authors and sourceare credited and subject to any copyrightnotices concerning any third-partygraphics etc.
Frontiers in Human Neuroscience www.frontiersin.org June 2013 | Volume 7 | Article 290 | 15