extending asphalt pavement life using thin whitetopping report # matc-ksu
TRANSCRIPT

®
The contents of this report reflect the views of the authors, who are responsible for the facts and the accuracy of the information presented herein. This document is disseminated under the sponsorship of the Department of Transportation
University Transportation Centers Program, in the interest of information exchange. The U.S. Government assumes no liability for the contents or use thereof.
Extending Asphalt Pavement Life Using Thin Whitetopping
Report # MATC-KSU: 251 Final Report
Mustaque Hossain, Ph.D., P.E.Professor Department of Civil EngineeringKansas State University
2010
A Cooperative Research Project sponsored by the U.S. Department of Transportation Research and Innovative Technology Administration

Extending Asphalt Pavement Life Using Thin Whitetopping
Mustaque Hossain, Ph.D., P.E.
Professor
Department of Civil Engineering
Kansas State University
Sharmin Sultana
Graduate Research Assistant
Department of Civil Engineering
Kansas State University
A Report on Research Sponsored by:
Mid-America Transportation Center
University of Nebraska-Lincoln
December 2010

1. Report No. 2. 3. Recipient’s Accession No.
25-1121-0001-251
4. Title and Subtitle 5. Report Date
Extending Asphalt Pavement Life Using Thin
Whitetopping
December 2010
6.
7. Author(s) 8. Performing Organization Report No.
Mustaque Hossain and Sharmin Sultana
9. Performing Organization Name and Address 10. Project/Task/Work Unit No.
Kansas State University
Fairchild Hall, Room No. 2
Manhattan, KS 66506-1103
11. Contract © or Grant (G) No.
12. Sponsoring Organization Name and Address 13. Type of Report and Period Covered
Mid-America Transportation Center
Region VII University Transportation Center
University of Nebraska-Lincoln
2200 Vine Street, 262 Whittier Building
P.O. Box 830851
Lincoln, Nebraska 68583-0851
14. Sponsoring Agency Code
MATC TRB RiP No. 18465
15. Supplementary Notes
16. Abstract (Limit: 200 words)
Due to budget constraints, many highway agencies are becoming interested in pavement preservation or rehabilitation
rather than reconstruction to ensure pavement is in serviceable condition. Thin whitetopping (TWT) is the process of
rehabilitating distressed asphalt concrete (AC) pavements by using a concrete overlay. This study was done to develop a design
catalog for existing AC pavements to be overlaid with TWT. The finite element (FE) analysis was performed with SolidWorks,
which is the 3-D FE software program used to develop this design catalog. The design considered different TWT thicknesses,
existing AC layer thickness and modulus, the bonding condition between TWT and the existing AC layer, shoulder conditions
and temperature differentials. Each model was built as a three-layer pavement system—composed of concrete (TWT), asphalt
layer, and subgrade soil. The traffic load was modeled as a constant pressure with a rectangular area applied at the surface and
with intensity equal to the tire inflation pressure of 100 psi. The expected lives of TWT overlays were estimated using fatigue
equations developed by the Portland Cement Association (PCA).
Results obtained from this study show that interface bonding condition is the most important factor affecting the
behavior of TWT. With the increase of TWT thickness or existing AC thickness or AC modulus and the addition of a paved
shoulder, concrete tensile stress decreases. Curling stress increases with the increase of TWT thickness and is not a function of
AC properties. A design catalog was developed in terms of service life of the pavement. Unlike the unbonded TWT with an
unpaved shoulder that results in catastrophic loss of rehabilitated pavement life, bonded TWT is expected to last 10 years,
assumed in design. Thus, proper bonding must be ensured in order to have extended pavement life.
17. Document Analysis/Descriptors 18. Availability Statement
19. Security Class (this report) 20. Security Class (this page) 21. No. of Pages 22. Price
83

iii
Table of Contents
List of Figures ................................................................................................................................ vi
List of Tables .................................................................................................................................. x
Acknowledgements ........................................................................................................................ xi
Abstract……………………………………………………………………………. ……………xi
CHAPTER 1 - INTRODUCTION .................................................................................................. 1
1.1 Introduction ........................................................................................................................... 1
1.2 Asphalt Pavement Treatments .............................................................................................. 1
1.4 Problem Statement ................................................................................................................ 3
1.4 Objectives of the Study ......................................................................................................... 3
1.5 Organization of the Thesis .................................................................................................... 4
CHAPTER 2 - LITERATURE REVIEW ....................................................................................... 5
2.1 Introduction ........................................................................................................................... 5
2.1.1 Types of Whitetopping .................................................................................................. 6
2.1.2 Benefits of Whitetopping ............................................................................................... 9
2.1.3 Feasibility of Whitetopping ......................................................................................... 10
2.2 Overview of Thin Whitetopping ......................................................................................... 11
2.2.1 Design Parameters ....................................................................................................... 11
2.2.2 Design Procedures ....................................................................................................... 13
AASHTO .......................................................................................................... 14
Colorado Procedure .......................................................................................... 19
Texas Procedure ................................................................................................ 25
2.2.3 Construction ................................................................................................................. 27

iv
2.2.3.1 Pre-Overlay Works ............................................................................................... 27
2.2.3.2 Overlay Materials.................................................................................................. 28
2.2.3.3 Concrete Placement and Finishing ........................................................................ 30
2.2.3.4 Curing ................................................................................................................... 32
2.2.3.5 Joint Sawing .......................................................................................................... 32
2.2.4 Performance of Thin Whitetopping Projects ............................................................... 32
Colorado ............................................................................................................ 32
Illinois ............................................................................................................... 38
Florida ............................................................................................................... 39
Montana ............................................................................................................ 40
Minnesota .......................................................................................................... 41
2.3 Summary ............................................................................................................................. 41
CHAPTER 3 - METHODOLOGY ............................................................................................... 43
3.1 Introduction ......................................................................................................................... 43
3.2 Finite Element Model ......................................................................................................... 43
3.2.1 Model Geometry .......................................................................................................... 44
3.2.2 Material Properties ....................................................................................................... 45
3.2.3 Model Meshing ............................................................................................................ 45
3.2.4 Restraints ...................................................................................................................... 47
3.2.5 Model Loading ............................................................................................................. 47
CHAPTER 4 - RESULTS AND DISCUSSIONS ........................................................................ 53
4.1 Load-Induced Stresses ........................................................................................................ 53
4.1.1 Effect of Interface Bonding Condition ........................................................................ 54

v
4.1.2 Effect of Thin Whitetopping Thickness ....................................................................... 60
4.1.3 Effect of Existing AC Thickness ................................................................................. 62
4.1.4 Effect of AC Modulus .................................................................................................. 64
4.1.5 Effect of Shoulder Condition ....................................................................................... 67
4.2 Curling Effect ..................................................................................................................... 70
4.3 Verification of the FE Model .............................................................................................. 72
4.4 Service Lives and Design Catalog ...................................................................................... 74
CHAPTER 5 - CONCLUSIONS AND RECOMMENDATIONS ............................................... 78
5.1 Conclusions ......................................................................................................................... 78
5.2 Recommendations ............................................................................................................... 79
REFERENCES ............................................................................................................................. 80
vi
List of Figures
Figure 2.1 Typical Pavement Condition Curve over Time and Actions Needed .......................... 5
Figure 2.2 Bonded WT ................................................................................................................... 8
Figure 2.3 Unbonded WT ............................................................................................................... 8
Figure 2.4 Chart for Estimating Composite Modulus of Subgrade Reaction ............................... 16
Figure 2.5 Design Chart for Rigid Pavement Based on Using Mean Values for Each Input
Variable (Segment 1) ............................................................................................................ 18
Figure 2.6 Design Chart for Rigid Pavement Based on Using Mean Values for Each Input
Variable (Segment 2) ............................................................................................................ 19
Figure 2.7 TWT Model Using ISLAB2000 .................................................................................. 25
Figure 2.8 Use of Fixed Forms ..................................................................................................... 31
Figure 2.9 Use of Slip Forms ........................................................................................................ 31
Figure 2.10 Typical Pavement Conditions Observed at Santa Fe Drive Site ............................... 35
Figure 2.11 Stop Sign Approach Distressed Area Observed at Santa Fe Drive Site .................... 35
Figure 2.12 Typical Pavement Conditions Observed at the S.H. 119 Longmont Site ................. 36
Figure 2.13 Typical Slab Cracking Observed in S.H. 119 Test Section No. 2 ............................. 36
Figure 2. 14 Typical Pavement Conditions Observed at the U.S. 287 Lamar Site ....................... 37
Figure 2.15 Typical Cracked Slab Conditions Observed at the U.S. 287 Lamar Site .................. 37
Figure 2.16 Panel Corner Breaks in Tuscola Project .................................................................... 39
Figure 3.1 Three-Layer Pavement System .................................................................................... 44
Figure 3.2 Convergence Check Using Z-Normal Stress as a Measure ......................................... 46
Figure 3.3 Draft-Quality and High-Quality Solid Element .......................................................... 47
Figure 3.4 Model Mesh ................................................................................................................. 48

vii
Figure 3.5 Restraints of the Model ............................................................................................... 49
Figure 3.6 Load Model ................................................................................................................. 50
Figure 3.7 Loading Model in SW ................................................................................................. 51
Figure 3.8 Loading Model for Temperature Differential .............................................................. 52
Figure 4.1 Transverse Stress Contour of TWT ............................................................................. 53
Figure 4.2 Deflection Contour of TWT ........................................................................................ 54
Figure 4.3 PCC Stress vs. Interface Bonding Condition Graph for 5-in. Existing AC Layer and
Unpaved Shoulder ................................................................................................................. 55
Figure 4.4 PCC Stress vs. Interface Bonding Condition Graph for 5-in. Existing AC Layer and
Paved Shoulder ..................................................................................................................... 55
Figure 4.5 PCC Stress vs. Interface Bonding Condition Graph for 7-in. Existing AC Layer and
Unpaved Shoulder ................................................................................................................. 56
Figure 4.6 PCC Stress vs. Interface Bonding Condition Graph for 7-in. Existing AC Layer and
Paved Shoulder ..................................................................................................................... 56
Figure 4.7 PCC Stress vs. Interface Bonding Condition Graph for 9-in. Existing AC Layer and
Unpaved Shoulder ................................................................................................................. 57
Figure 4.8 PCC Stress vs. Interface Bonding Condition Graph for 9-in. Existing AC Layer and
Paved Shoulder ..................................................................................................................... 57
Figure 4.9 PCC Stress vs. Frictional Coefficient Graph for Unpaved TWT ................................ 59
Figure 4.10 PCC Stress vs. Frictional Coefficient Graph for Paved TWT ................................... 59
Figure 4.11 PCC Stress vs. TWT Thickness Graph for Bonded Condition and Unpaved Shoulder
............................................................................................................................................... 60

viii
Figure 4.12 PCC Stress vs. TWT Thickness Graph for Unbonded Condition and Unpaved
Shoulder ................................................................................................................................ 61
Figure 4.13 PCC Stress vs. TWT Thickness Graph for Bonded Condition and Paved Shoulder 61
Figure 4.14 PCC Stress vs. TWT Thickness Graph for Unbonded Condition and Paved Shoulder
............................................................................................................................................... 62
Figure 4.15 PCC Stress vs. Existing AC Thickness Graph for Bonded Condition and Unpaved
Shoulder ................................................................................................................................ 63
Figure 4.16 PCC Stress vs. Existing AC Thickness Graph for Unbonded Condition and Unpaved
Shoulder ................................................................................................................................ 63
Figure 4.17 PCC Stress vs. Existing AC Thickness Graph for Bonded Condition and Paved
Shoulder ................................................................................................................................ 64
Figure 4.18 PCC Stress vs. Existing AC Thickness Graph for Unbonded Condition and Paved
Shoulder ................................................................................................................................ 64
Figure 4.19 PCC Stress vs. Existing AC Modulus Graph for 5-in. TWT and Unpaved Shoulder 65
Figure 4.20 PCC Stress vs. Existing AC Modulus Graph for 5-in. TWT and Paved Shoulder ... 65
Figure 4.21 PCC Stress vs. Existing AC Modulus Graph for 6-in. TWT and Unpaved Shoulder
............................................................................................................................................... 66
Figure 4.22 PCC Stress vs. Existing AC Modulus Graph for 6-in. TWT and Paved Shoulder ... 66
Figure 4.23 PCC Stress vs. Existing AC Modulus Graph for 7.5-in. TWT and Unpaved Shoulder
............................................................................................................................................... 67
Figure 4.24 PCC Stress vs. Existing AC Modulus Graph for 7.5-in. TWT and Paved Shoulder 67
Figure 4.25 PCC Stress vs. Shoulder Condition Graph for 5-in. Bonded TWT ........................... 68
Figure 4.26 PCC Stress vs. Shoulder Condition Graph for 5-in. Unbonded TWT ...................... 68

ix
Figure 4.27 PCC Stress vs. Shoulder Condition Graph for 6-in. Bonded TWT ........................... 69
Figure 4.28 PCC Stress vs. Shoulder Condition Graph for 6-in. Unbonded TWT ...................... 69
Figure 4.29 PCC Stress vs. Shoulder Condition Graph for 7.5-in. Bonded TWT ........................ 70
Figure 4.30 PCC Stress vs. Shoulder Condition Graph for 7.5-in. Unbonded TWT ................... 70
Figure 4.31 Contour Plot of Curling Stress .................................................................................. 71
Figure 4.32 PCC Stress vs. TWT Thickness for AC Modulus 250 ksi ........................................ 72
Figure 4.33 PCC Stress vs. TWT Thickness for AC Modulus 350 ksi ........................................ 72

x
List of Tables
Table 2.1 Summary of Whitetopping Overlays .............................................................................. 7
Table 2.2 Feasibility Guidelines for Whitetopping....................................................................... 11
Table 2.3 Recommended Load-Transfer Coefficients for Various Pavement Types and Design
Conditions ............................................................................................................................. 17
Table 2.4 Typical Ranges of Loss of Support (LS) Factors for Various Types of Materials ....... 17
Table 2.5 Suggested Level of Reliability for Various Functional Classifications ........................ 17
Table 2.6 Recommended Values of Drainage Coefficient, Cd, for Rigid Pavement Design ........ 18
Table 2.7 Possible Pre-Overlay Works for Bonded TWT ............................................................ 28
Table 2.8 Possible Pre-Overlay Works for Unbonded TWT ........................................................ 28
Table 4.1 Comparison of Stresses Obtained from SolidWorks and ANSYS ............................... 73
Table 4.2 Comparison of Stresses Obtained from SolidWorks and KENSLABS ........................ 73
Table 4.3 Design Catalog for Thin Whitetopping for No Traffic Growth.................................... 75
Table 4.4 Design Catalog for Thin Whitetopping for 3% Traffic Growth ................................... 76
Table 4.5 Design Catalog for Thin Whitetopping for 6% Traffic Growth ................................... 77

xi
Acknowledgements
The authors gratefully acknowledge the Mid-America Transportation Center (MATC) for
the sponsorship of this study.
xii
Abstract
Due to budget constraints, many highway agencies are becoming interested in pavement
preservation or rehabilitation rather than reconstruction to ensure pavement is in serviceable
condition. Thin whitetopping (TWT) is the process of rehabilitating distressed asphalt concrete
(AC) pavements by using a concrete overlay. This study was done to develop a design catalog
for existing AC pavements to be overlaid with TWT. The finite element (FE) analysis was
performed with SolidWorks, which is the 3-D FE software program used to develop this design
catalog. The design considered different TWT thicknesses, existing AC layer thickness and
modulus, the bonding condition between TWT and the existing AC layer, shoulder conditions
and temperature differentials. Each model was built as a three-layer pavement system—
composed of concrete (TWT), asphalt layer, and subgrade soil. The traffic load was modeled as
a constant pressure with a rectangular area applied at the surface and with intensity equal to the
tire inflation pressure of 100 psi. The expected lives of TWT overlays were estimated using
fatigue equations developed by the Portland Cement Association (PCA).
Results obtained from this study show that interface bonding condition is the most
important factor affecting the behavior of TWT. With the increase of TWT thickness or existing
AC thickness or AC modulus and the addition of a paved shoulder, concrete tensile stress
decreases. Curling stress increases with the increase of TWT thickness and is not a function of
AC properties. A design catalog was developed in terms of service life of the pavement. Unlike
the unbonded TWT with an unpaved shoulder that results in catastrophic loss of rehabilitated
pavement life, bonded TWT is expected to last 10 years, assumed in design. Thus, proper
bonding must be ensured in order to have extended pavement life.

1
CHAPTER 1 Introduction
1.1 Introduction
The extensive U.S. highway network, the economic backbone of the country, allows
for almost 3 trillion miles of travel annually (TRIP 2010). But the condition of this network
is deteriorating due to a limitation of funds to maintain it in good condition. As a result,
32% of the major roads are in poor or mediocre condition, which is responsible for $67
billion in vehicle repair and operating costs. The American Reinvestment and Recovery
Act of 2009 provided $27 billion for highway projects. But about $166 billion is needed
annually to invest in highways and bridges to improve the condition and performance,
while more than half of this amount is needed for pavement preservation (AASHTO 2010).
Routine, preventive and corrective maintenance fall in the pavement preservation strategy.
Due to budget constraints, pavements are left to deteriorate without timely maintenance
treatment and, as such, become candidates for rehabilitation later on.
1.2 Asphalt Pavement Preservation Treatments
Both rigid and flexible pavement must withstand wheel loads, environmental
effects, and temperature variations. Asphalt pavements deteriorate as a result of a
combination of environmental and wheel load-related factors. Load-related stresses
develop fatigue cracking and rutting, whereas environmental factors induce thermal
cracking, block cracking, and weathering and raveling (Uzarowski and Bashir 2007). Due
to these cracks, pavement loses load-carrying capacity and becomes more susceptible to
adverse conditions leading to deterioration.
Asphalt pavement preservation works are divided into three major categories
(Uzarowski and Bashir 2007):

2
1. Routine Maintenance Treatment:
i. Crack filling/ sealing
ii. Patching
2. Preventive Maintenance Treatment:
i. Fog seals
ii. Surface rejuvenating
iii. Micro-milling
iv. Thin surfacing (a-f):
a. Chip seal
b. Slurry seal
c. Micro surfacing
d. Metro-mat
e. Nova chip
f. Thin hot-mix asphalt
overlays
3. Corrective Maintenance:
i. Full-depth patching
ii. Milling
iii. Overlays
Major rehabilitation treatments for asphalt pavements are (Uzarowski and Bashir
2007) (1) structural overlays; (2) recycling, either hot or cold in-place recycling (HIR or
CIR) with emulsion or foamed asphalt, or full-depth reclamation (FDR) with foamed
asphalt; and (3) reconstruction.
Rehabilitation with structural overlays contributes to the structural capacity of
pavements. Structural overlays used for asphalt pavements are as follows: asphalt concrete,
whitetopping and ultra-thin whitetopping.
Asphalt pavement can be overlaid with asphalt concrete (AC) or with a concrete
layer. Whitetopping and ultra-thin whitetopping are the concrete overlays placed on
distressed asphalt pavements.
Life-cycle cost (LCC) analysis of whitetopping and AC overlays were conducted by
Lowey (2005). From the analysis, it was found that the initial cost of whitetopping is much
higher than an AC overlay. When user cost with initial cost is considered however,

3
whitetopping is cheaper than AC overlay as whitetopping requires less maintenance during
its service life. Moreover, concrete has a much higher albedo value, 0.35-0.4 for new
concrete and 0.2-0.3 for most old concrete, than AC, which is 0.05-0.1 for new asphalt and
0.10-0.15 for aged asphalt (ACPA 2002). Albedo is defined as the ratio of reflected solar
radiation to incoming solar radiation on the surface. Higher albedo values decrease
absorbed heat preventing the formation of a heat island (HI). Heat islands are areas that are
hotter than neighboring rural areas and influence energy demand, air and water quality, and
warming in the city area. Thus, whitetopping may become a more cost-effective and
greener rehabilitation alternative for AC overlay.
1.3 Problem Statement
There are a number of design procedures for whitetopping developed by various
agencies: AASHTO (AASHTO 1993); the state of Colorado (Sheehan et al. 2004; Tarr et
al. 1998); Portland Cement Association (PCA)/American Concrete Pavement Association
(ACPA) (Wu et al. 1998); the state of New Jersey (Nenad et al. 1998); the modified ACPA
(Riley et al. 2005); the state of Illinois (Roesler et al., 2008); and the state of Texas (Chul et
al. 2008). Among these, only the AASHTO, Colorado and Texas procedures offer
guidelines for thin and conventional whitetopping, whereas the other procedures are for
ultra-thin whitetopping. All these procedures deal with slab thickness, support
characteristics, pre-overlay preparation, and slab dimensions. No procedure provides
guidelines for whitetopping responses as it concerns bonding conditions between
whitetopping and the existing AC layer, existing AC layer modulus, AC thicknesses, and
shoulder conditions.
1.4 Objectives of the Study

4
The objective of this study was to asses the behavior of 5 in., 6 in., and 7.5 in. thin
whitetoppings on existing 5 in., 7 in., and 9 in. AC pavements for different bonding
conditions with the AC layer, shoulder conditions, and existing AC moduli. Whitetopping
responses for different temperature differentials were also assessed. Based on the behavior
of TWT, service lives were calculated for different truck traffic, and a design catalog was
developed for AC pavements overlaid with a thin whitetopping.
1.5 Organization of the Report
The report is divided into five chapters. Chapter 1 is the introduction to the study.
Chapter 2 is the overview of thin whitetopping. Chapter 3 describes the methodology, and
Chapter 4 contains the results of this study. Finally, conclusions of this study and
recommendations for further study are presented in Chapter 5.

5
CHAPTER 2 Literature Review
2.1 Introduction
Budget constraints are forcing many state transportation agencies to look at
pavement preservation or rehabilitation rather than reconstruction to ensure pavements are
in serviceable condition. Figure 2.1 shows a pavement condition curve over time and the
actions needed to retain the pavement in a desirable condition. Routine maintenance,
preventive maintenance, and minor rehabilitation are preservation actions which extend the
service life of pavement and defer the need for major rehabilitation. Major rehabilitation is
undertaken when the pavement is in need of structural improvement.
Figure 2.1 Typical Pavement Condition Curve over Time and Actions Needed
(Harrington 2008)
The process of rehabilitating asphalt concrete (AC) pavement with a concrete
overlay is known as whitetopping (WT).

6
The first whitetopping project constructed in the United States was in 1918 in Terre
Haute, Indiana (Hutchinson 1982). According to McGhee (1994), from 1918 to 1992
approximately 200 whitetopping projects were completed. Among them, 158 were jointed
plain concrete pavement, 14 continuously reinforced concrete, 10 fiber-reinforced concrete,
and 7 were jointed reinforced concrete pavement. Construction of whitetopping is not
limited to the U.S. only. Other countries including Belgium, Sweden, Canada, Mexico,
Brazil, the Republic of (South) Korea, Japan, France, Austria, and the Netherlands have
undertaken recent projects with whitetopping (Rasmussen and Rozycki 2004). Agencies are
widely expected to use whitetopping as it is a cost-competitive technique, can be
constructed with minimal interruption of the traveling system, and a means of green
construction as compared to asphalt concrete overlay.
2.1.1 Types of Whitetopping
Considering the thickness of this material, there are three types of whitetopping
(WT) that can be utilized for restoration projects (Sheehan et al. 2004): conventional
(thickness 8 in); thin (thickness 4-8 in); and ultra-thin (thickness 2-4 in). A summary of
whitetopping characteristics has been listed in Table 2.1. In this table, concrete overlays
with a thickness greater than 4 in. are considered conventional whitetopping.

7
Table 2.1 Summary of Whitetopping Overlays (NHI)
A WT system can be classified into two types, depending on the bonding condition
between the WT and AC layers:
1. Bonded: In bonded WT, a sound bond between the WT and the AC layer is
maintained through proper construction techniques. Bonded WT is built to improve
structural capacity and eliminate surface distresses of existing AC, which is in
structurally good condition (Harrington 2008). Figure 2.2 shows the behavior of a
bonded overlay under flexural loading.
2. Unbonded: In unbonded WT, a separation layer is provided at the interface of the
WT and AC layer to prevent a bond between them. Unbonded WT is used to

8
rehabilitate AC pavement which is not in structurally good condition. Unbonded
WT and its behavior under loading are shown in Figure 2.3.
(a) (b)
Figure 2.2 (a) Bonded WT and (b) Behavior of Bonded WT under Loading (Rasmussen
and Rozycki 2004)
(a) (b)
Figure 2.3 (a) Unbonded WT and (b) Behavior of Unbonded WT under Loading
(Rasmussen and Rozycki 2004)

9
2.1.2 Benefits of Whitetopping
The formation of heat islands (HI) is a major concern in city areas by influencing energy
demand, air and water quality and global warming. Heat islands are areas that are hotter
than the neighboring rural area. Along with other factors, engineering materials such as
asphalt concrete, Portland cement concrete, stone, and steel used in urban development are
responsible for HI formation. Ting et al. (2001) conducted an evaluation of life-cycle costs
(LCC) of reflective materials. They found that although asphalt concrete pavement (AC)
has lower initial cost for rehabilitation work than that of whitetopping, the maintenance
cost is much lower for whitetopping. Field measurements have shown that Portland cement
concrete (PCC) has a much higher albedo value (0.35-0.4 for new concrete and 0.2-0.3 for
most old concrete) than AC (0.05-0.1 for new asphalt and 0.10-0.15 for aged asphalt)
(ACPA 2002). Albedo is defined as the ratio of reflected solar radiation to incoming solar
radiation on the surface, and a higher albedo value provides better nighttime visibility.
Thus, because of its high albedo rating, whitetopping may become a greener choice for
rehabilitation of AC pavements.
Other benefits of using WT are as follows: it does not develop typical distresses as
does asphalt overlay, repair is easy, it improves safety conditions, it is less affected by
seasonal variations, it can be used as preventive maintenance or major rehabilitation, and it
provides high level of serviceability (Harrington 2008; ACPA 1991). Moreover,
construction of WT is quick and convenient: existing pavement can provide support, there
is no need for extensive pre-overlay preparation, normal paving systems can be used, and
overlaid pavement can be opened to traffic quickly (Harrington 2008; ACPA 1991).

10
2.1.3 Feasibility of Whitetopping
Whitetoppings can be applied to almost all existing pavements. In certain
conditions, it is more cost effective than an AC overlay. That said, whitetoppings are
generally not feasible under the following conditions (AASHTO 1993):
1. When the existing AC pavement is not highly deteriorated and other alternatives
would be more cost effective.
2. When there is not adequate vertical clearance to accommodate the whitetopping.
3. When the existing AC pavement is prone to settlement and requires removal of the
AC layer and stabilization of base layer.
Factors that should be considered in evaluating overall feasibility of whitetopping are listed
in Table 2.2.

11
Table 2.2 Feasibility Guidelines for Whitetopping (NHI)
2.2 Overview of Thin Whitetopping
2.2.1 Design Parameters
The design process starts with the determination of structural performance
requirements and expected design life. Generally, the design process of WT consists of the
following steps:
1. Characterization of Existing Pavement: The condition of the pavement is an
important factor in the selection of a design process. It can be subcategorized into
the following steps (Harrington 2008):

12
i. Surface condition: The existing surface condition is important for both bonded
and unbonded concrete overlays. The remaining pavement thickness after
milling should be investigated, because this thickness needs to provide
structural support of the new overlay. Depending on the surface distresses, the
decision is made whether the overlay will be bonded or unbonded.
ii. Structural condition: Investigation into what structural support the existing
pavement can provide is needed. Joint condition and inhibitors for load
transfer are also determined.
2. Traffic Characterization: Pavement truck loads are accurately determined.
Additional detailed information is also necessary for exact prediction of traffic,
such as axle-load spectra, seasonal distribution of traffic, growth, and day-night
duration (Rasmussen and Rozycki 2004).
3. Concrete Materials: Concrete strength, coefficient of thermal expansion, aggregate
properties, supplementary cementitious materials, and admixtures should be
considered carefully.
4. Climatic Factor: Climatic conditions during both construction and service life affect
overlay behavior. Material should be compatible with weather conditions and joints
should be provided depending on seasonal changes in pavement temperatures
(Harrington 2008).
5. Whitetopping thickness: Determination of whitetopping thickness reliability is the
main factor. Reliability is determined depending on the importance of the roadway.
After whitetopping thickness is selected, it is checked for overhead clearance, and

13
curb and gutter. Reduction of the existing AC thickness is also a factor at this stage
(Harrington 2008).
6. Joint Spacing: In whitetopping, shorter joints are provided for reducing corner
cracking and providing proper aggregate interlocking. The most common rule of
thumb for whitetopping is the joint spacing (in inches) should be 12 to 18 times the
slab thickness in inches (ACPA 1998). In many whitetopping projects, dowel and
tie bars are provided to minimize movement along longitudinal joints, reducing the
significance of joints.
7. Transition Area: During the design process, the transition area between the overlay
and the adjacent AC layer should be given proper consideration. A thickened slab is
recommended for these types of transitions (Rasmussen and Rozycki 2004).
2.2.2 Design Procedures
There are a number of procedures for design of whitetopping. Existing procedures
include the AASHTO Guide (AASHTO 1993); the state of Colorado procedure (Sheehan et
al. 2004; Tarr et al. 1998); the Portland Cement Association (PCA)/American Concrete
Pavement Association (ACPA) method (Wu et al. 1998); the state of New Jersey method
(Nenad 1998); the modified ACPA approach (Riley et al. 2005); the state of Illinois method
(Roesler et al. 2008); and the state of Texas method (Chul et al. 2008). Among these,
AASHTO, Colorado, and Texas provide design procedures which can be used for
designing TWT, while the rest are for procedures for ultra-thin whitetopping (UTW).
Recently, MnDOT (2010) has developed a design technique for thin whitetopping. A brief
description of TWT design procedures is presented in the following section.

14
AASHTO
According to AASHTO (AASHTO 1993) the required design thickness is
fol DD (2.1)
Where,
Dol = required thickness of PCC overlays (WT), in.; and
Df = slab thickness to carry future traffic, in.
The design thickness of WT depends on the structural capacity needed to carry
future traffic and the condition of the existing AC layer. The design procedure involves the
following steps: (1) the determination of material types and layer thicknesses of existing
pavement; (2) prediction of future traffic for the design period, Nf; and (3) a general survey
of existing pavement distresses of heaves and swell, stripping of AC pavement, and large
transverse cracks is required as these distresses may affect the service life of WT.
Furthermore, as a fourth step, an adequate assessment of pavement condition by deflection
testing with a heavy-load deflection device (generally of magnitude of 9,000 pounds) at a
sufficient interval is recommended. The subgrade modulus (MR) and effective pavement
modulus (EP) at each point are calculated according to the following equations.
rd
PM
r
R
24.0 (2.2)
Where,
MR = backcalculated subgrade resilient modulus, psi;
P = applied load, pounds;
dr = deflection at a distance r from the center of the load, in.; and
r = distance from center of load, in.

15
2
32 aa
R
Pe
M
ED (2.3)
Where,
ae = radius of stress bulb at the subgrade-pavement interface, in.;
a = NDT load plate radius, in.;
D = total thickness of pavement layers above the subgrade, in.; and
Ep = effective modulus of all pavement layers above the subgrade, psi.
Note that the effective dynamic k-value is determined from Figure 2.4 using MR, EP, and D.
After these four steps have been completed, the fifth recommended step, according
to the AASHTO guidelines, is to complete coring and material testing if there is an unusual
distress condition. Step six is to determine the required slab thickness using specific
criteria in conjunction with the equations presented in step four, as indicated by the
following instructions:
i. The effective static k-value is determined from one of the following methods, along
with the adjustment for seasonal effects:
a) The effective dynamic k-value obtained in step 4 is divided by 2 to obtain the
effective static k-value. The obtained static k-value is adjusted for seasonal
effects.
b) The effective static k-value is obtained from soils data and pavement layer types
and thicknesses using Figure 2.4.
ii. The design PSI (Present Serviceability Index) loss is determined by subtracting the PSI
at time of next rehabilitation from the PSI immediately after overlay.
iii. Joint load transfer, J, is determined from Table 2.3.

16
iv. 28-day, 3rd
point loading modulus of rupture is used as WT modulus of rupture.
v. 28-day, elastic modulus is used as WT modulus.
vi. Loss of support is determined from Table 2.4.
vii. WT reliability, R (%) is selected from Table 2.5.
viii. Overall standard deviation is selected to be between 0.30 and 0.40.
ix. Drainage coefficient, Cd, is determined from Table 2.6.
Note that slab thickness Df (thickness to carry future traffic) is determined from the
nomograph shown in Figures 2.5 and 2.6.
Figure 2.4 Chart for Estimating Composite Modulus of Subgrade Reaction
(AASHTO 1993)

17
Table 2.3 Recommended Load-Transfer Coefficients for Various Pavement Types and
Design Conditions (AASHTO 1993)
Shoulder Asphalt Tied P.C.C.
Load-Transfer Devices
Yes
No
Yes
No Pavement Type
1. Plain jointed and jointed reinforced 3.2 3.8-4.4 2.5-3.1 3.6-4.2
2. CRCP 2.9-3.2 N/A 2.3-2.9 N/A
Table 2.4 Typical Ranges of Loss of Support (LS) Factors for Various Types of Materials
(AASHTO 1993)
Type of Material Loss of
Support (LS)
Cement-Treated Granular Base (E = 1,000,000 to 2,000,000 psi) 0.0 to 1.0
Cement Aggregate Mixtures (E = 500,000 to 1,000,000 psi) 0.0 to 1.0
Asphalt-Treated Base (E = 350,000 to 1,000,000 psi) 0.0 to 1.0
Bituminous Stabilized Mixture (E = 40,000 to 300,000 psi) 0.0 to 1.0
Lime Stabilized (E = 20,000 to 70,000 psi) 1.0 to 3.0
Unbound Granular Materials (E = 15,000 to 45,000 psi) 1.0 to 3.0
Fine-Grained or Natural Subgrade Materials (E = 3,000 to 40,000 psi) 2.0 to 3.0
Table 2.5 Suggested Level of Reliability for Various Functional Classifications
(AASHTO 1993)
Functional Classification Recommended Level of Reliability
Urban Rural
Interstate and Other Freeways 85-99.9 80-99.9
Principal Arterials 80-99 75-95
Collectors 80-95 75-95
Local 50-80 50-80

18
Table 2.6 Recommended Values of Drainage Coefficient, Cd, for Rigid Pavement Design
(AASHTO 1993)
Quality of
Drainage
Percent of Time Pavement Structure Is Exposed to Moisture Levels
Approaching Saturation
Less Than 1% 1-5% 5-25% Greater Than 25%
Excellent 1.25-1.2 1.20-1.15 1.15-1.00 1.10
Good 1.20-1.15 1.15-1.10 1.10-1.00 1.00
Fair 1.15-1.10 1.10-1.00 1.00-0.90 0.90
Poor 1.10-1.00 1.00-0.90 0.90-0.80 0.80
Very Poor 1.00-0.90 0.90-0.80 0.80-0.70 0.70
Figure 2.5 Design Chart for Rigid Pavement Based on Using Mean Values for Each Input
Variable (Segment 1) (AASHTO 1993)

19
Figure 2.6 Design Chart for Rigid Pavement Based on Using Mean Values for Each Input
Variable (Segment 2) (AASHTO 1993)
The seventh, and final step, is to determine the PCC overlay thickness using Eq. 2.1.
Colorado Procedure
In 1998, Tarr et al. developed the model for designing TWT, then in 2004 Sheehan
et al. adjusted the model. Major findings of the Colorado design procedure (Sheehan et al.
2004; Tarr et al. 1998) can be summarized as follows:

20
1. For the design of TWT, critical load locations were identified and verified with field
data. For a zero-temperature gradient (at early morning), the critical load-induced
stresses were found.
2. A relationship was developed between the theoretical fully bonded TWT stress with
partial-bonded stress from the analysis of experimental and theoretical concrete stress
data. Correction factors for measured stress are shown in Eqs. 2.4 (a) and 2.4 (b).
The original model (Tarr et al. 1998):
thex 65.1 (2.4 a)
The adjusted model (Sheehan et al. 2004):
thex 51.1 (2.4 b)
Where,
σex = measured experimental partially bonded stress, psi; and
σth = calculated fully bonded stress, psi.
A relationship between theoretical fully-bonded maximum asphalt flexural strains and
partially bonded strains was also developed. Correction factors for measured asphalt
flexural strains are shown in Eqs. 2.5 (a) and 2.5 ( b).
The original model (Tarr et al. 1998):
pccac 842.0 (2.5 a)
The adjusted model (Sheehan et al. 2004):
776.0897.0 pccac (2.5 b)
Where,
ac = measured asphalt surface strain, microstrain; and
pcc = measured concrete bottom strain, microstrain.

21
3. The design procedure considers tied longitudinal joints. The relationship between the
free-edge stress and tied-edge stress was also developed, which is shown by Eq. 2.6.
TEFE 87.1 (2.6)
Where,
σFE = longitudinal free-joint load-induced stress, psi, and
σTE = longitudinal tied-joint load-induced stress, psi.
4. The finite element program ILSL2 (Khazanovich and Ionnides 1993) was used to
determine concrete stress and asphalt strain. For prediction of concrete stress and
asphalt strain, equations were derived from the least-square linear regression technique.
The prediction relationships are shown in Eqs. 2.7 through Eq. 2.10. For 20-kip single-
axle-load concrete stress:
The original model (Tarr et al., 1998) is
ac
e
pcc Ekl
000133.0log3.575492,18
919 (2.7 a)
The adjusted model (Sheehan et al., 2004) is
LkElt
tac
eac
pcc
pcc 0133.0log0366.910955.644.425
918.2879.18)( 62
1
(2.7 b)
For 20-kip single-axle-load asphalt strain:
The original model (Tarr et al., 1998) is
L
lE e
ac
ac
008619.01051114.81 9
(2.8 a)
The adjusted model (Sheehan et al., 2004) is

22
kElt
tace
ac
pcc
ac log1027.110897.604419.02590.0224.8)( 74
1
(2.8 b)
For 40-kip tandem-axle-load concrete stress:
The original model (Tarr et al., 1998) is
ac
e
pcc Ekl
000099.0log1.43710582.1
2.6714
(2.9 a)
The adjusted model (Sheehan et al., 2004) is
LkElt
tac
eac
pcc
pcc 00622.0log3576.810455.652.408
668.2669.17)( 62
1
(2.9 b)
For 40-kip tandem-axle-load asphalt strain:
The original model (Tarr et al., 1998) is
L
lE e
ac
ac
009776.01061792.91 9
(2.10 a)
The adjusted model (Sheehan et al., 2004) is
kElt
tace
ac
pcc
ac log0451.110746.60433.02503.0923.7)( 74
1
(2.10 b)
Where,
σpcc = maximum stress in concrete slab, psi;
ac = maximum strains at bottom of asphalt layer, microstrain;
Epcc= concrete modulus of elasticity, assumed 4 million psi;
Epcc= asphalt modulus of elasticity, psi;

23
tpcc = thickness of concrete layer, in;
tpcc = thickness of asphalt layer, in;
k = modulus of subgrade reaction, pci;
le = effective radius of relative stiffness for fully bonded slabs, in;
Is equal to:
25.0
2
23
2
23
1
212
1
212
ac
acpccac
ac
acpcc
pcc
pcc
pcc
pcck
tNAtt
t
Ek
tNAt
t
E
And,
NA = neutral axis from top of concrete slab, in.
= acacpccpcc
acpccacac
pcc
pcc
tEtE
tttE
tE
22
2
Where,
µpcc = poisons ratio for concrete, assumed 0.15;
µac = poisons ratio for asphalt, assumed 0.35; and
L = joint spacing, in.
5. Concrete fatigue criterion (PCA 1984) is based on the theory that fatigue resistance
which remains after one load application is available for other load repetitions (Miner
1945). The PCA fatigue criterion is as follows.
For stress ratio (SR) > 0.55:
0828.0
97187.0)(log10
SRN
(2.11)

24
For 0.45 ≤ SR ≤ 0.55:
268.3
43248.0
2577.4
SRN (2.12)
For SR < 0.45:
N = Unlimited (2.13)
Where,
SR = flexural stress to strength (modulus of rapture of concrete) ratio; and
N = number of allowable load repetitions.
The asphalt concrete fatigue equation (Asphalt Institute 1981) was also used in this
study, as follows:
854.029.3
3 111032.44.18
acac ECN
(2.14)
Where,
N = number of load repetitions for 20 % or greater AC fatigue cracking;
ac= maximum tensile strain in the asphalt layer;
Eac= asphalt modulus of elasticity, psi;
C = correction factor = 10M
.
69.084.4
bv
b
VV
VM
Vb = volume of asphalt, percent; and
Vv = volume of air voids, percent.

25
Texas Procedure
In 2008, Chul et al. developed mechanistic procedures for designing TWT. A finite
element program, ISLAB 2000, was used to model TWT behavior under load. The
pavement structure consisting of TWT, an AC layer, base, and subgrade were analyzed for
different geometry and loading conditions. The dimension of TWT is 18 ft 18 ft, and 6 ft
joint spacing was provided. The loading conditions with a 20-kip single axle load and 34-
kip tandem axle load have been shown in Figures 2.7 (a) and 2.7 (b).
(a) (b)
Figure 2.7 TWT Model Using ISLAB2000 (a) Single Axle Load and (b) Tandem Axle
Load (Chul et al. 2008)
The Texas design procedure for TWT outlines four steps. Step one recommends
that the structural condition and material properties be evaluated using a dynamic cone
penetrometer (DCP) and a falling weight deflectometer (FWD). In step two, the subgrade
resilient modulus is estimated using the following relationship:

26
12.1
000,438
DCPM R (2.15)
Where,
MR = resilient (elastic) modulus, psi; and
DCP = DCP index (mm/blow).
The ELSYM5 layered program is recommended for estimating the subgrade
reaction modulus with the calculated modulus value from Eq. 2.15. The value of the static
subgrade modulus is one half of the subgrade modulus.
In step three, the resilient modulus obtained in step two is used in a back-calculation
program to estimate the resilient modulus of the subbase layer. Asphalt layer thickness that
is more than 3 in. is treated as a separate layer in the back-calculation program—otherwise
the AC layer is combined with the base layer. For step four, the required slab thickness is
calculated using Eq. 2.16.
MR
kEtE
tEESALst
BSBSAC
ACpccpcc
log2250.1
log0287.0log0891.0log2695.0log3624.0
log7232.0log4982.0log1017.05615.3log
(2.16)
Where,
tpcc = required thickness of the TWT, in.;
ESALs=expected number of 18-kips ESALs;
Epcc = concrete modulus of elasticity, psi;
tAC = thickness of the asphalt layer, in.;
EAC = asphalt modulus of elasticity, psi;
tBS = thickness of the base layer, in.;
27
EBS = base modulus of elasticity, psi;
k = modulus of subgrade reaction, pci; and
MR = modulus of rupture of concrete in TWT, psi.
2.2.3 Construction
The performance of TWT is highly dependent on the construction process. As the
thickness of whitetopping is much thinner than the conventional overlay, there should not
be much variability in the concrete layer. The construction process includes the following:
pre-overlay works, overlay materials, placement and finishing, curing, and joint sawing.
2.2.3.1 Pre-Overlay Works
Pre-overlay works are very important to ensure long-term durability of TWT.
Although existing AC distresses do not reflect through TWT as in asphalt overlay, there is
still a need to repair the asphalt distresses to avoid different types of failure such as
faulting, roughness, or shattered slab. Possible pre-overlay works on existing AC
pavements for bonded TWT are tabulated in Table 2.7. Pre-overlay works for unbonded
TWT are listed in Table 2.8.
Milling plays an important role by producing a sound bond between whitetopping
and the AC layer. It levels out surface distortions, and removes soft loose asphalt and high
spots which cause an inadequate bond. Milling also enhances the bond by roughening the
surface, finishing the grade line before concrete placement, and establishing a cross slope
for the new pavements (Rasmussen and Rozycki 2004).
For unbonded whitetopping, a separation layer is introduced between the TWT and
AC layer so that no bond develops at the interface.

28
Table 2.7 Possible Pre-Overlay Works for Bonded TWT (Harrington 2008)
Existing Pavement Distress Repair Work Performed
Rutting (<2inches) None
Deep rutting (>2inches) Milling
Shoving, slippage Milling
Thermal cracking Fill crack when opening is greater than
maximum-size aggregate in the overlay
Fatigue cracking Full-depth concrete patch
Pothole Full-depth concrete patch
For bonded TWT, before concrete placement, the surface is properly cleaned by
sweeping and using compressed air. No moisture is allowed at the asphalt surface prior to
overlay placement.
Table 2.8 Possible Pre-Overlay Works for Unbonded TWT (Harrington 2008)
Existing Pavement Distress Repair Work Performed
Area of subgrade/ subbase failure Remove and replace with stable material;
correct water problems
Severe distress that results in
variation in strength of asphalt
Remove and replace with stable material;
correct water problems
Potholes Fill with asphalt
Shoving Mill
Rutting (<2inches) None or mill
Deep rutting (>2inches) Mill
Crack width ≥ 4 in. Fill with asphalt
Crack width ≤ 4 in. None
2.2.3.2 Overlay Materials
During the concrete mixture proportioning, both faster construction and high
concrete strength are considered. According to ACI 325.13R (ACI 2006) for whitetopping
concrete mixtures, Type I and Type II cements are used. In some cases, Type III cements
are used for the development of high early strength. Typical cement content varies between

29
500 and 700 lb/yd3. High-quality stones, river gravel and glacial deposits are used as
aggregates for the overlay to ensure longevity. The maximum aggregate size is selected
depending upon the design thickness of whitetopping. A maximum water-cement (w/c)
ratio of 0.45 is recommended for moist environments and areas prone to the freeze-thaw
cycle (PCA 2002). For bonded overlay, the w/c ratio is kept lower than the unbonded
overlay to ensure proper bond strength, which can be affected by drying shrinkage,
resulting from a high w/c (McGhee 1994). According to ACI 212.3R (ACI 2004), the
following admixtures are recommended for sound concrete:
1. Air entrainment in the range of 4-6 % is recommended, which helps to increase
workability and protects from segregation, bleeding and freeze thaw.
2. To increase the development rate of early strength, calcium chloride is used as
an accelerator. For reinforced concrete, non-chloride accelerators are used;
3. Water reducers are added for lowering the w/c to maintain the desired slump;
and
4. Supplementary cementitious materials, such as fly ash, slag, and silica fume
may be used for improved workability, reduced permeability and alkali-silica
reactivity, and increased long-term strength.
Typical values of 28 day compressive and flexural strengths for TWT mix are 4,000
psi and 650 psi, respectively (ACI 2004).
For bonded concrete overlay, generally the bond between the concrete and AC layer
is achieved through cleaning the AC surface and removing surface contaminations. But,
many agencies use cement grout of w/c ratio of 0.65 as a boning agent at the interface
(ACPA 1990).
30
For unbonded TWT, materials used as a separator layer can include polyethylene
sheeting, wax-based curing compounds, liquid asphalts, and hot-mixed asphalt (McGhee
1994).
Hot-poured rubberized materials, silicon materials, or preformed compression seals
are used as joint-sealant materials (ACI 2006).
2.2.3.3 Concrete Placement and Finishing
During placement of concrete, the surface temperature of the asphalt should not be
higher than 1200 F to avoid plastic shrinkage cracking (Harrington 2008). For placing the
concrete either fixed-form or slip-form paving practices can be used (Rasmussen and
Rozycki 2004). For fixed-form paving, the forms are supported in such a way that no
movement can occur, and are designed to withstand lateral pressure from concrete, which is
placed by a ready-mix truck, pump or other means. Figure 2.8 shows the use of a fixed
form. With a slip-form paver, fresh concrete is placed by truck, pump, and other means in
one operation. In this case, stringlines are needed for horizontal and vertical grade control.
Figure 2.9 shows use of slip-form paving. Texturing of the finished concrete surface is
performed by brooming, burlap dragging, turf dragging, or a tining comb, depending on the
speed limit for the facility. Tining of the concrete surface is performed immediately after
the moisture sheen evaporates (ACI 2006).

31
Figure 2.8 Use of Fixed Forms (Rasmussen and Rozycki 2004)
Figure 2.9 Use of Slip Forms (Rasmussen and Rozycki 2004)

32
2.2.3.4 Curing
Good curing practice is important to achieve the intended performance of TWT. As
the TWT surface area-to-volume ratio is high, there is high potential for moisture loss. The
curing compound should be applied at twice the normal rate used for conventional concrete
pavement (Harrington 2008).
2.2.3.5 Joint Sawing
Joints should be properly sawed to avoid random cracking. It is done as soon as the
concrete is hard enough for cutting without raveling or cracking. Transverse joints can be
sawed by a conventional saw set to one-fourth of the slab thickness or by early-entry
sawing set to not less than 1.25 in. Longitudinal joints are sawed to one-third of the slab
thickness (Harrington 2008).
2.2.4 Performance of Thin Whitetopping Projects
A number of whitetopping projects have recently been constructed. In this section, a
brief discussion is presented about TWT project performance in different states.
Colorado
In the state of Colorado, three whitetopping test pavements were constructed from
1996 to 1997 with different combinations of design and construction variables. In 2002 and
2005, two other projects were constructed. The first pavement (CDOT1) was on Santa Fe
Drive, the second (CDOT2) on State Road 119 near Longmont, and the third (CDOT3) on
US 287 near Lamar (Tarr et al. 1998). Other projects were constructed on SH 121 between
Colorado Route C 470 and Park Hill Avenue in 2002 (Wu and Shehaan 2002), and at SH
83, Parker Road in 2005 (CPTP 2007).

33
CDOT1 had two sections, each 500 ft long and with a 60 in. joint spacing. The first
500 ft long section consisted of a 4 in. whitetopping placed on a 5 in. newly placed AC
layer with no special surface preparation. The second section had 5 in. whitetopping on top
of 4 in. AC pavement, and a portion of which had been milled before placing the concrete.
On all sections, tie bars were used, longitudinal and transverse joints were sawcut, the soil
underneath the pavement was A-7-6, and the modulus of subgrade reaction was
approximately 150 pci.
CDOT2 was about one mile long and had two lanes of existing AC pavement. This
project consisted of a number of sections. The east half of the section had a 1.5 in. new AC
layer constructed on top of the existing AC pavement before placing a 5 in. whitetopping.
On the other half, a 4.5 in. concrete layer was placed directly on top of the old pavement. In
the other traffic lane, the existing AC layer was milled to 1.5 in. and a 6 in. whitetopping
was placed on top of it. On all sections, old AC pavements were washed before placing the
new concrete. Tie bars and dowel bars were used where the joint spacing was more than 12
ft. The modulus of subgrade reaction was found to be 340 pci.
The CDOT3 project had heavily trafficked three-mile long sections. A 6 in.
concrete layer was placed on top of the milled and cleaned existing AC layer. The milled
AC layer thickness and modulus of subgrade reaction were found to be 7 in. and 225 pci,
respectively. Dowel bars were used on all sections except one, and tie bars were installed at
all longitudinal joints.
At SH 121, the project was a four mile long section on a four-lane divided
secondary arterial road. The 6 in. whitetopping was constructed on a 5-1/2 in. existing AC
layer with 6 ft joint spacings. The TWT was constructed for a 10 year design period for

34
carrying approximately 1.3 million 18 kip-equivalent single-axle loads. The existing AC
surface was milled to provide a desired bond at the interface. The SH 83 project was 1.9
miles long and on a six lane urban highway. The concrete overlay was 6 in. thick with 6 ft
joint spacing. Performance of these two projects has not been reported to date.
In 2003, the first three projects were revisited and reviewed (Sheehan et al. 2004).
Figures 2.10 to 2.15 show photographs from these projects.
The evaluation of these test pavements can be summarized as follows:
1. The overall condition of Santa Fe Drive was very good, except for some isolated
longitudinal cracking with a few corner cracks and transverse shrinkage cracks over
them. There were a number of shattered slabs at the stop sign approach on this
pavement.
2. State Road 119 was also in a very good condition. Only one section containing 10-ft
by 12-ft panels showed a number of mid-panel cracks. Considerable joint spalling,
resulting from snow plow abrasion, was found. Overall ride quality of this test
section was excellent.
3. U.S. Route 287 was also in very good condition. Minor transverse joint spalling
was found frequently. Longitudinal cracks were also observed on 6 ft. by 6 ft
panels. During initial construction, the northbound lane experienced significant
cracking resulting from the placement of concrete on the hot asphalt layer, which
initiated shrinkage cracking. Consequently, cooling of asphalt surface prior to
concrete placement was recommended.

35
Figure 2.10 Typical Pavement Conditions Observed at Santa Fe Drive Site
(Sheehan et al. 2004)
Figure 2.11 Stop Sign Approach Distressed Area Observed at Santa Fe Drive Site
(Sheehan et al. 2004)

36
Figure 2.12 Typical Pavement Conditions Observed at the S.H. 119 Longmont Site
(Sheehan et al. 2004)
Figure 2.13 Typical Slab Cracking Observed in S.H. 119 Test Section No. 2
(Sheehan et al. 2004)

37
Figure 2.14 Typical Pavement Conditions Observed at the U.S. 287 Lamar Site
(Sheehan et al. 2004)
Figure 2.15 Typical Cracked Slab Conditions Observed at the U.S. 287 Lamar Site
(Sheehan et al. 2004)

38
Illinois
From 1998 to 2001, four experimental TWT projects were constructed at Clay
county, Tuscola, Platt county, and Cumberland county in the state of Illinois (Winkelman
2002).
In August 1998, there were 5 in. and 6 in. TWTs constructed on AC pavements
which had minor edge cracking and rutting, and small potholes on County Highway 3 in
Clay county. The whitetopping sections had partial-depth saw cuts. The concrete overlay
was placed on the AC layer after milling for proper bond and construction platform, and for
removing surface defects.
US Highway 36, east of Tuscola, had whitetopping constructed in May 1999. The
existing AC pavement had moderate-to-high-severity transverse cracks and was overlaid
with 4-7.5 in. TWT. Typical panel dimensions in feet were 0.7 to 1.3 times the overlay
thickness in inches.
During September and October of 2000, the experimental TWT project was
constructed in Platt county on County Highway 4. A 5 in. concrete overlay was placed
prior to milling of the existing AC surface. The panels were either 5.5 ft by 5.5 ft or 11 ft
by 11 ft.
In September 2001, a 3.5 mile section of County Highway 2 in Cumberland county
was overlaid with a 5.75 in. concrete layer. Prior to concrete placement, the existing AC
layer was milled to about three inches. The panels of TWT were 5.5 ft by 6.0 ft.
Early performance evaluation in 2001 showed good pavement performance which
can be summarized as follows:
1. No crack or distress was found in the Clay county project.
39
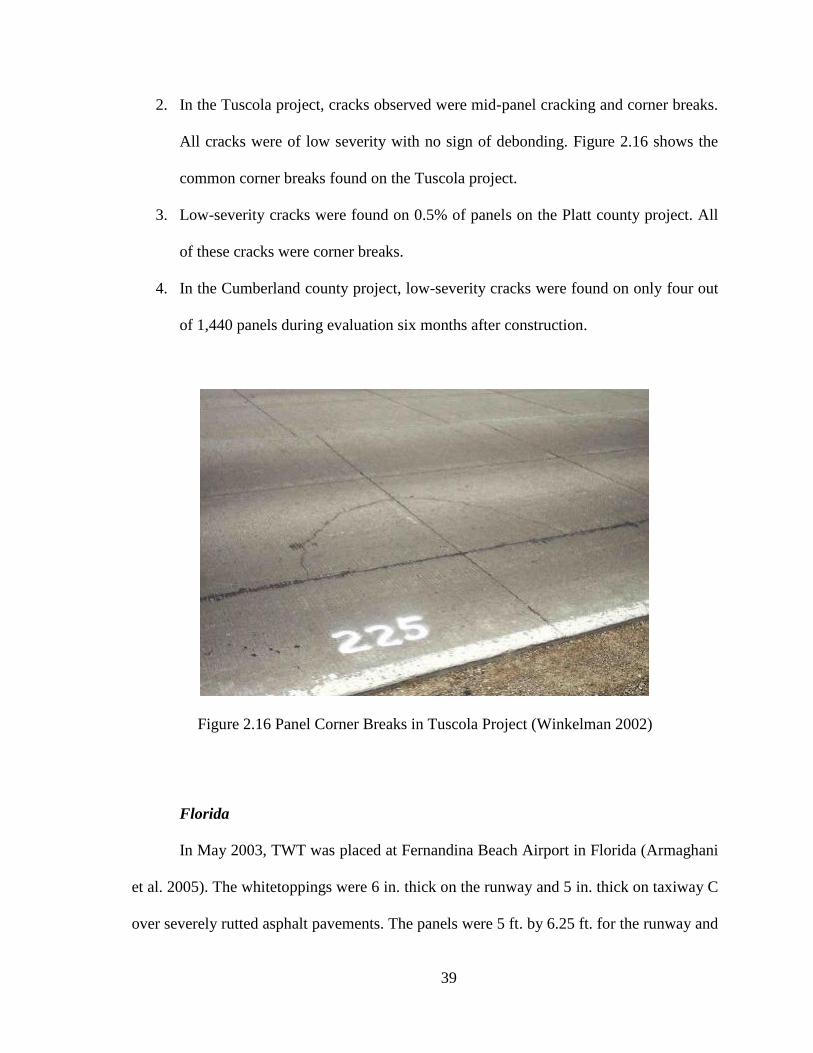
2. In the Tuscola project, cracks observed were mid-panel cracking and corner breaks.
All cracks were of low severity with no sign of debonding. Figure 2.16 shows the
common corner breaks found on the Tuscola project.
3. Low-severity cracks were found on 0.5% of panels on the Platt county project. All
of these cracks were corner breaks.
4. In the Cumberland county project, low-severity cracks were found on only four out
of 1,440 panels during evaluation six months after construction.
Figure 2.16 Panel Corner Breaks in Tuscola Project (Winkelman 2002)
Florida
In May 2003, TWT was placed at Fernandina Beach Airport in Florida (Armaghani
et al. 2005). The whitetoppings were 6 in. thick on the runway and 5 in. thick on taxiway C
over severely rutted asphalt pavements. The panels were 5 ft. by 6.25 ft. for the runway and

40
4 ft. by 4 ft. for taxiway C. In 2004, a condition survey of this project was conducted.
Findings from the survey can be summarized as follows:
1. No cracking of the whitetopping was found except some corner chipping, which
might have resulted from inadequate timing of joint sawing. The shoulder was in
good condition with no sign of erosion and skid resistance was very high according
to FDOT’s Runway Friction Tester results.
2. Stiffness of the pavement system resulting from whitetopping placement increased
by an average of 300%, which indicated enhanced load-carrying capacity. Good
bond between whitetopping and the AC layer was found from the falling weight
deflectometer (FWD) testing.
Montana
In 1999, a TWT overlay was constructed at Great Falls in Montana with a TWT
thickness of 4.5 in (MtDOT 2001). After two years, the overlaid pavement showed
localized failure, and slab shattering was also observed. After inspection, an underlying
storm drain was found to be the moisture source that led to such damage of the TWT. In
2000, another resurfacing was done with a 5 in. TWT overlay at East Idaho St. in the city
of Kalispell (MtDOT 2001). Milling, vacuuming, and sweeping of the existing asphalt
surface were completed for producing a sound bond at the interface. After concrete
placement, one small section was found in poor condition as a result of improper vibration
during construction. The MtDOT evaluation report (MtDOT 2008) showed that the TWT
was found to be in good condition except for some minor hairline cracks (Figure 2.17) and
spalling. No sign of debonding or faulting was found.

41
Figure 2.17 Hairline Crack in Kalispell Project Pavement (MtDOT 2008)
Minnesota
In 1996, a TWT project was constructed on Lor Ray Drive, in North Mankato with
other ultra-thin whitetopping projects (Vandenbossche and Rettner 1999). A 6 in. concrete
overlay with 10 ft by 12 ft panels was constructed on the southbound lanes south of U.S. 14
and another 4.5 in. TWT with 5 ft by 6 ft panels was constructed on the northbound lanes
on top of an 11.5 in., full-depth AC layer. The AC pavement was severely rutted.
After 3.5 years and approximately 4.7 million ESALs, the pavement section was
evaluated. No noticeable distresses or reflection cracks were found. Few corner cracks
occurred and those were very tight. Ride quality of this section was excellent
(Vandenbossche and Fagerness 2002).
2.3 Summary

42
Thin whitetopping (TWT) is a highly promising rehabilitation technique for AC
pavements. Performance of TWT in different states is good and it can significantly increase
the service life of existing AC pavements. AASHTO Colorado, and Texas procedures
provide guidelines for designing thin whitetopping. AASHTO offers an empirical method,
whereas Colorado and Texas provide mechanistic-empirical methods for design. TWT
requires proper pre-overlay treatments to produce the intended interface condition.
Placement, finishing, and joint sawing are done in the same way as conventional concrete
pavement construction.
43
CHAPTER 3 Methodology
3.1 Introduction
Complex engineering problems like composite pavements cannot be analyzed
through analytical methods. An advanced numerical procedure is required to solve the
problem as it consists of modeling multiple layers—concrete slab, asphalt layer, subgrade,
and the interaction between asphalt and the concrete layer. The first step of any numerical
procedure is discretization, which is the process of dividing the analysis model into a
number of subregions and nodes called finite elements. The finite element method (FEM)
creates algebraic equations using integral formulations, and a complete solution is
produced by assembling individual solutions for each element (Moaveni 1999). Well-
defined material properties are applied to each element to represent the model.
Cheung and Zienkiewicz (1965) were the first to apply FEM to analyze pavement.
There are two-dimensional (2-D) finite element programs available for composite
pavement analysis such as ISLAB2000, J-SLAB, KENPAVE, and FECONS (Cable et al.
2005). These programs use classical theories based on a Winkler foundation. Two-
dimensional software requires less memory and run time, but traffic loading needs to be
modeled as linear. For more accurate results, three-dimensional (3-D) software such as
ABAQUS, ADINA, ANSYS and SolidWorks is available. In this study, the 3-D software
package SolidWorks (version 2009) was used to investigate the response of thin
whitetopping.
3.2 Finite Element Model
44
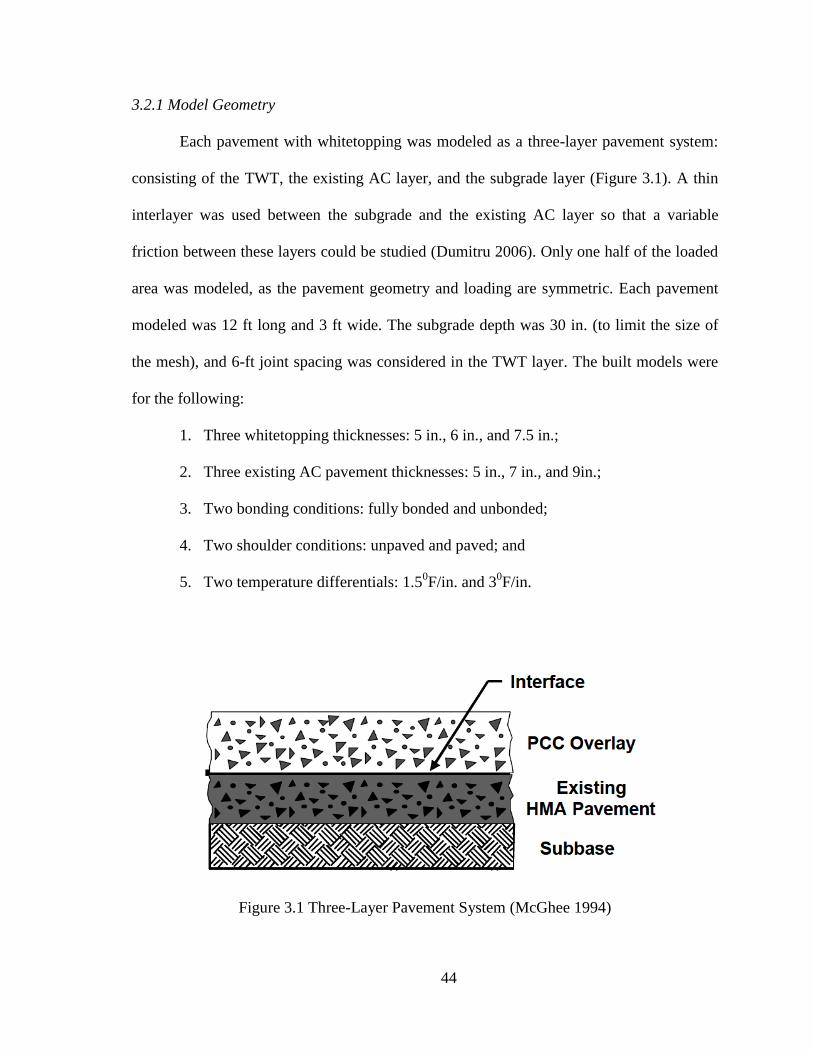
3.2.1 Model Geometry
Each pavement with whitetopping was modeled as a three-layer pavement system:
consisting of the TWT, the existing AC layer, and the subgrade layer (Figure 3.1). A thin
interlayer was used between the subgrade and the existing AC layer so that a variable
friction between these layers could be studied (Dumitru 2006). Only one half of the loaded
area was modeled, as the pavement geometry and loading are symmetric. Each pavement
modeled was 12 ft long and 3 ft wide. The subgrade depth was 30 in. (to limit the size of
the mesh), and 6-ft joint spacing was considered in the TWT layer. The built models were
for the following:
1. Three whitetopping thicknesses: 5 in., 6 in., and 7.5 in.;
2. Three existing AC pavement thicknesses: 5 in., 7 in., and 9in.;
3. Two bonding conditions: fully bonded and unbonded;
4. Two shoulder conditions: unpaved and paved; and
5. Two temperature differentials: 1.50F/in. and 3
0F/in.
Figure 3.1 Three-Layer Pavement System (McGhee 1994)

45
3.2.2 Material Properties
All layer materials were considered isotropic and linear elastic except the interlayer
between the subgrade and the AC layer. That interlayer was considered orthotropic having
no stiffness in horizontal direction and the same properties of subgrade was provided in the
vertical direction (Dumitru 2006). Properties of layer materials were as follows:
1. TWT:
Modulus of Elasticity = 4,000,000 psi
Poisson’s Ratio = 0.15
Coefficient of Thermal Expansion = 5.5 × 10⁻⁶
(/oF)
2. AC layer:
Modulus of Elasticity = 250,000 and 350,000 psi
Poisson’s Ratio = 0.4
Coefficient of Thermal Expansion = 13 × 10-6
(/oF)
3. Subgrade:
Modulus of Elasticity = 20,000 psi
Poisson’s Ratio = 0.45
Coefficient of Thermal Expansion = 2 × 10⁻⁶
(/oF)
3.2.3 Model Meshing
Mesh size and mesh quality of the models affect the accuracy of the results. In
general, a finer mesh gives more accurate results. A finer mesh results in a larger problem
as it concerns size, which in turn results in higher computational effort and increased cost.
To get better accuracy and to minimize project expenses, mesh size should be chosen in
such a way that reasonably accurate results can be obtained at optimized computational

46
expenses. For this reason, convergence was checked to find out the optimum mesh size
(Figure 3.2), and the TWT and AC layers were refined at their periphery (Figures 3.4a and
3.4b).
In this analysis, a high-quality mesh was used to get better results. Two types of
meshing are available in SolidWorks (SolidWorks 2009): draft-quality mesh and high-
quality mesh (Figure 3.3). The draft quality element has only four end nodes which provide
a linear (1st order) displacement field. Thus, the strain field will be constant (0
th order). As
the stress is proportional to the strain, the stress field in a draft-quality mesh is also constant
(0th
order). The high-quality element has four corner nodes and six mid-edge nodes which
can model a parabolic (2nd
order) displacement field. Thus, the stress and strain fields are
linear (1st order).
Convergence Check Graph
0
50
100
150
200
250
300
350
0 10000 20000 30000 40000 50000 60000
Number of Elements
Z-n
orm
al S
tress (
psi)
Figure 3.2 Convergence Check Using Z-Normal Stress as a Measure
Element numbers
after refinement

47
Figure 3.3 Draft-Quality and High-Quality Solid Element (after SolidWorks 2009)
3.2.4 Restraints
The bottom of the subgrade was fixed in all directions. Symmetry restraints were
applied at all three directions of the model except on the left side (Figure 3.5a). That side
was restrained in the direction of pavement width. All restraints of the model are shown in
Figures 3.5a and 3.5b.
3.2.5 Model Loading
The typical model loaded area was assumed to be rectangular, constant over the
applied surface and equal to the tire inflation pressure, as shown in Figure 3.6. The
loading—20,000 lbs on a single axle with dual tires (legal load in Kansas)—was applied to
the model as a pressure on the element faces (Dumitru 2006). Self-weight was considered
for all layers.
Length of the contact rectangle Lx was computed from the tire width and inflation
pressure.
25.610082
000,10
xL in.
The resulting SolidWorks model loading is shown in Figures 3.7a and 3.7b.
Draft-quality element High-quality element

48
To observe the curling effect, temperature differentials of 1.5 0F/in and 3
0F/in were
applied on the TWT surface. Figure 3.8 shows the application of the temperature
differential. Temperature load was applied at the surface of TWT.
(a)
(b)
Figure 3.4 Model Mesh (a) No Paved Shoulder and (b) Paved Shoulder

49
(a)
(b)
Figure 3.5 Restraints of the Model (a) No Shoulder and (b) Shoulder

50
Figure 3.6 Load Model (after Dumitru 2006)
10,000 lbs 10,000 lbs 10,000 lbs

51
(a)
(b)
Figure 3.7 Loading Model in SW (a) No Shoulder and (b) Shoulder

52
Figure 3.8 Loading Model for Temperature Differential

53
CHAPTER 4 Results and Discussions
4.1 Load-Induced Stresses
TWT has shorter joint spacings (4 ft–6 ft) compared to conventional concrete
pavement that help in reducing concrete stresses. Thus, TWT behaves differently than
conventional concrete pavement. The theoretical response (maximum transverse tensile
stress) of TWT under the wheel load and varying temperature differentials was studied
using the finite element model (FEM) in SolidWorks. The response was calculated at the
bottom of the TWT layer. The stress calculation was done for different TWT thicknesses,
existing AC thickness, AC modulus and for different bonding conditions between TWT
and the existing AC layer. Maximum service lives of TWT were also estimated from the
stress generated from the wheel loading. Contour plots of stress and deflection of TWT
have been shown in Figures 4.1 and 4.2. Depending on the condition, tensile stress varied
from 75 psi for bonded 7.5 in. TWT to as much as 442 psi for unbonded 5 in. TWT.
Figure 4.1 Transverse Stress Contour of TWT
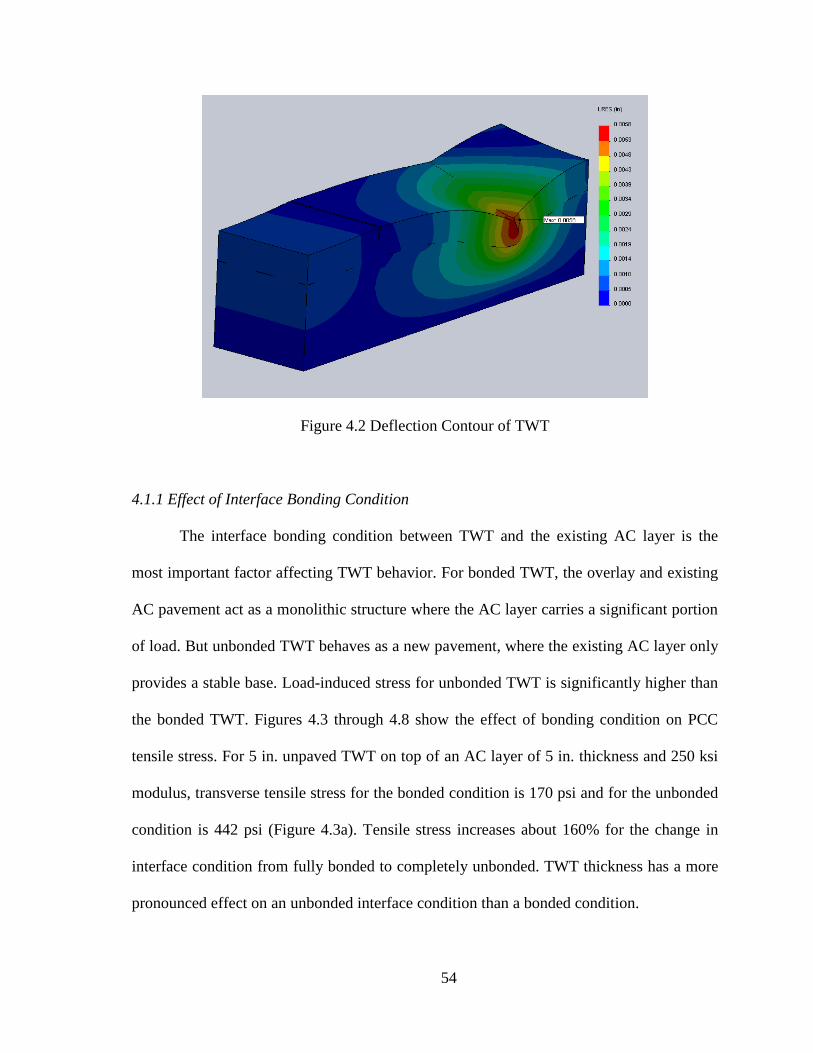
54
Figure 4.2 Deflection Contour of TWT
4.1.1 Effect of Interface Bonding Condition
The interface bonding condition between TWT and the existing AC layer is the
most important factor affecting TWT behavior. For bonded TWT, the overlay and existing
AC pavement act as a monolithic structure where the AC layer carries a significant portion
of load. But unbonded TWT behaves as a new pavement, where the existing AC layer only
provides a stable base. Load-induced stress for unbonded TWT is significantly higher than
the bonded TWT. Figures 4.3 through 4.8 show the effect of bonding condition on PCC
tensile stress. For 5 in. unpaved TWT on top of an AC layer of 5 in. thickness and 250 ksi
modulus, transverse tensile stress for the bonded condition is 170 psi and for the unbonded
condition is 442 psi (Figure 4.3a). Tensile stress increases about 160% for the change in
interface condition from fully bonded to completely unbonded. TWT thickness has a more
pronounced effect on an unbonded interface condition than a bonded condition.
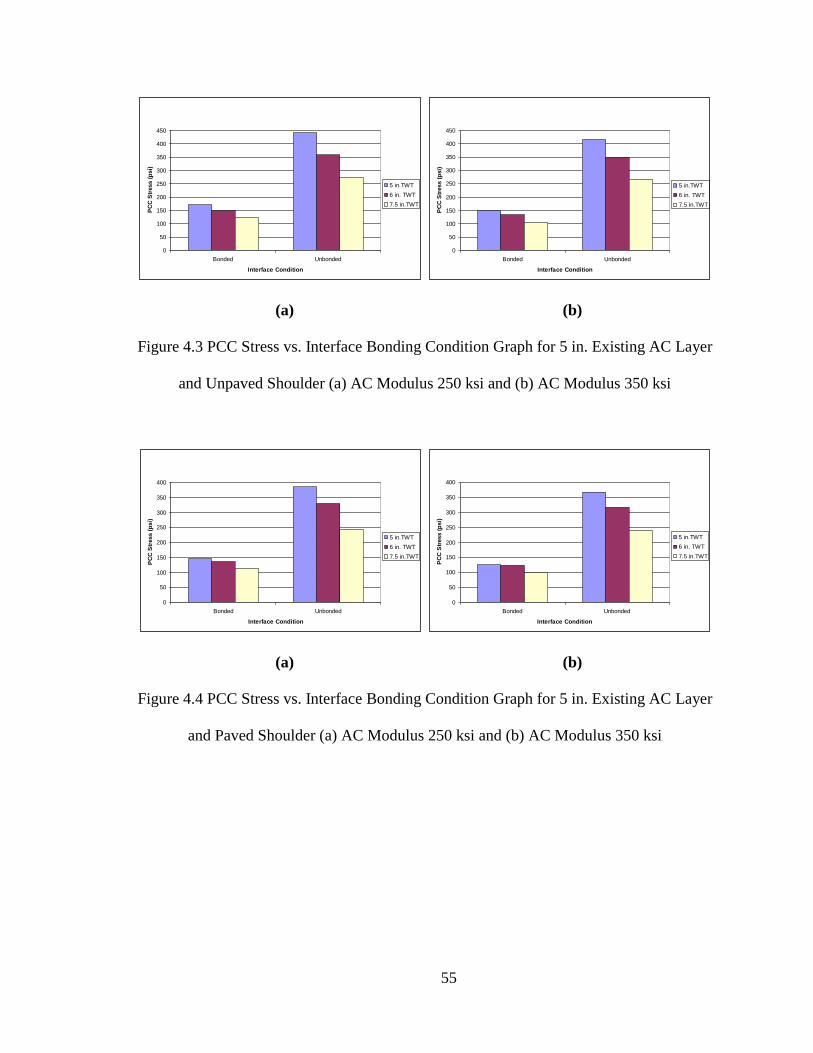
55
0
50
100
150
200
250
300
350
400
450
Bonded Unbonded
Interface Condition
PC
C S
tress (
psi)
5 in.TWT
6 in. TWT
7.5 in.TWT
0
50
100
150
200
250
300
350
400
450
Bonded Unbonded
Interface Condition
PC
C S
tress (
psi)
5 in.TWT
6 in. TWT
7.5 in.TWT
(a) (b)
Figure 4.3 PCC Stress vs. Interface Bonding Condition Graph for 5 in. Existing AC Layer
and Unpaved Shoulder (a) AC Modulus 250 ksi and (b) AC Modulus 350 ksi
0
50
100
150
200
250
300
350
400
Bonded Unbonded
Interface Condition
PC
C S
tress (
psi)
5 in.TWT
6 in. TWT
7.5 in.TWT
0
50
100
150
200
250
300
350
400
Bonded Unbonded
Interface Condition
PC
C S
tress (
psi)
5 in.TWT
6 in. TWT
7.5 in.TWT
(a) (b)
Figure 4.4 PCC Stress vs. Interface Bonding Condition Graph for 5 in. Existing AC Layer
and Paved Shoulder (a) AC Modulus 250 ksi and (b) AC Modulus 350 ksi

56
0
50
100
150
200
250
300
350
400
Bonded Unbonded
Interface Condition
PC
C S
tress (
psi)
5 in.TWT
6 in. TWT
7.5 in.TWT
0
50
100
150
200
250
300
350
400
Bonded Unbonded
Interface Condition
PC
C S
tress (
psi)
5 in.TWT
6 in. TWT
7.5 in.TWT
(a) (b)
Figure 4.5 PCC Stress vs. Interface Bonding Condition Graph for 7 in. Existing AC Layer
and Unpaved Shoulder (a) AC Modulus 250 ksi and (b) AC Modulus 350 ksi
0
50
100
150
200
250
300
350
Bonded Unbonded
Interface Condition
PC
C S
tress (
psi)
5 in.TWT
6 in. TWT
7.5 in.TWT
0
50
100
150
200
250
300
350
Bonded Unbonded
Interface Condition
PC
C S
tress (
psi)
5 in.TWT
6 in. TWT
7.5 in.TWT
(a) (b)
Figure 4.6 PCC Stress vs. Interface Bonding Condition Graph for 7 in. Existing AC Layer
and Paved Shoulder (a) AC Modulus 250 ksi and (b) AC Modulus 350 ksi

57
0
50
100
150
200
250
300
350
Bonded Unbonded
Interface Condition
PC
C S
tress (
psi)
5 in.TWT
6 in. TWT
7.5 in.TWT
0
50
100
150
200
250
300
350
Bonded Unbonded
Interface Condition
PC
C S
tress (
psi)
5 in.TWT
6 in. TWT
7.5 in.TWT
(a) (b)
Figure 4.7 PCC Stress vs. Interface Bonding Condition Graph for 9 in. Existing AC Layer
and Unpaved Shoulder (a) AC Modulus 250 ksi and (b) AC Modulus 350 ksi
0
50
100
150
200
250
300
350
Bonded Unbonded
Interface Condition
PC
C S
tress (
psi)
5 in.TWT
6 in. TWT
7.5 in.TWT
0
50
100
150
200
250
300
350
Bonded Unbonded
Interface Condition
PC
C S
tress (
psi)
5 in.TWT
6 in. TWT
7.5 in.TWT
(a) (b)
Figure 4.8 PCC Stress vs. Interface Bonding Condition Graph for 9 in. Existing AC Layer
and Paved Shoulder (a) AC Modulus 250 ksi and (b) AC Modulus 350 ksi
Unbonded TWT induces much higher stress, but there is no mathematical
relationship between bonded and unbonded concrete stresses. Colorado DOT (Sheehan et
al. 2004) provided a relationship (Eq. 2.4 b) for bonded and partial-bonded whitetopping.

58
As interface bonding condition plays a major role in the behavior of TWT, partial
bonding between the interfaces was also considered in this study. For this purpose,
frictional coefficients other than 1 (for bonded condition) were assumed at the interface.
Friction is a resistive force that occurs at the contact surface. The SolidWorks software
calculates static friction forces by multiplying the normal forces generated at the contacting
locations by the specified coefficient of friction. The direction of the friction force at that
location is opposite to the direction of motion. Frictional coefficient value is specified for
use with no penetration (unbonded) contact for static and nonlinear studies (SolidWorks
2009). The addition of frictional coefficient resulted in a considerable drop in transverse
tensile stress for an unpaved shoulder condition, but did not show any significant effect for
the paved shoulder condition. Figures 4.9 and 4.10 show the PCC stress variation for
different frictional coefficients used at the interface for unpaved and paved TWT. For
frictional coefficients 1 (fully bonded), 0.75, 0.5, 0.25 and 0 (unbonded), tensile stresses for
5 in. unpaved TWT on a 5 in. AC layer and modulus of 250 ksi, were found as 170, 393,
401, 422, and 442 psi, respectively. For frictional coefficients 1 (fully bonded), 0.75, 0.5,
0.25 and 0 (unbonded), tensile stresses for a 5 in. paved TWT on 5 in. AC layer and
modulus of 250 ksi were found as 145, 371, 373, 375, and 385 psi, respectively.

59
0
50
100
150
200
250
300
350
400
450
Bonded 0.75 0.5 0.25 0
Frictional Coefficiant
PC
C S
tress (
psi)
AC Modulus
250 ksiAC Modulus
350 ksi
Figure 4.9 PCC Stress vs. Frictional Coefficient Graph for Unpaved TWT
0
50
100
150
200
250
300
350
400
Bonded 0.75 0.5 0.25 0
Frictional Coefficiant
PC
C S
tre
ss
(p
si)
AC Modulus
250 ksiAC Modulus
350 ksi
Figure 4.10 PCC Stress vs. Frictional Coefficient Graph for Paved TWT

60
4.1.2 Effect of Thin Whitetopping Thickness
Figures 4.11 through 4.14 show the variation of PCC tensile stress with TWT
thickness. Tensile stress significantly decreases with an increase in TWT thickness. For
unpaved and unbonded 5 in., 6 in., and 7.5 in. TWT (Figure 4.12a) on top of an AC layer of
5 in. and modulus of 250 ksi, tensile stresses were found as 442, 359 and 272 psi,
respectively. Changes in stress were found to be from 23% to 32% for unbonded TWT and
14% to 20% for bonded TWT. For unbonded TWT and an unpaved shoulder, the effect of
TWT thickness is more pronounced than other conditions.
0
20
40
60
80
100
120
140
160
180
5 6 7.5
TWT Thickness (in.)
PC
C S
tress (
psi)
5 in.AC
7 in. AC
9 in.AC
0
20
40
60
80
100
120
140
160
180
5 6 7.5
TWT Thickness (in.)
PC
C S
tress (
psi)
5 in.AC
7 in. AC
9 in.AC
(a) (b)
Figure 4.11 PCC Stress vs. TWT Thickness Graph for Bonded Condition and Unpaved
Shoulder (a) AC Modulus 250 ksi and (b) AC Modulus 350 ksi

61
0
50
100
150
200
250
300
350
400
450
5 6 7.5
TWT Thickness (in.)
PC
C S
tress (
psi)
5 in.AC
7 in. AC
9 in.AC
0
50
100
150
200
250
300
350
400
450
5 6 7.5
TWT Thickness (in.)
PC
C S
tress (
psi)
5 in.AC
7 in. AC
9 in.AC
(a) (b)
Figure 4.12 PCC Stress vs. TWT Thickness Graph for Unbonded Condition and Unpaved
Shoulder (a) AC Modulus 250 ksi and (b) AC Modulus 350 ksi
0
20
40
60
80
100
120
140
160
5 6 7.5
TWT Thickness (in.)
PC
C S
tress (
psi)
5 in.AC
7 in. AC
9 in.AC
0
20
40
60
80
100
120
140
160
5 6 7.5
TWT Thickness (in.)
PC
C S
tress (
psi)
5 in.AC
7 in. AC
9 in.AC
(a) (b)
Figure 4.13 PCC Stress vs. TWT Thickness Graph for Bonded Condition and Paved
Shoulder (a) AC Modulus 250 ksi and (b) AC Modulus 350 ksi

62
0
50
100
150
200
250
300
350
400
5 6 7.5
TWT Thickness (in.)
PC
C S
tress (
psi)
5 in.AC
7 in. AC
9 in.AC
0
50
100
150
200
250
300
350
400
5 6 7.5
TWT Thickness (in.)
PC
C S
tress (
psi)
5 in.AC
7 in. AC
9 in.AC
(a) (b)
Figure 4.14 PCC Stress vs. TWT Thickness Graph for Unbonded Condition and Paved
Shoulder (a) AC Modulus 250 ksi and (b) AC Modulus 350 ksi
4.1.3 Effect of Existing AC Thickness
Figures 4.15 through 4.18 show the variation of PCC stress with the existing AC
thickness. PCC stress decreases with the increase of AC thickness, as higher AC thickness
enhances the underlying support to TWT. For 5 in. unbonded TWT and an unpaved
shoulder condition, the tensile stresses for 5 in., 7 in. and 9 in. AC layers with 250 ksi
modulus were observed as 442, 389, and 348 psi, respectively (Figure 4.16a). Tensile
stresses decrease about 12% to 14% for a 2 in. increase in AC thickness. The existing AC
thickness has a more pronounced effect on the stresses for 5 in. TWT than 6 in. and 7.5 in.
TWTs.

63
0
20
40
60
80
100
120
140
160
180
5 7 9
AC Thickness (in.)
PC
C S
tress (
psi)
5 in.TWT
6 in. TWT
7.5 in.TWT
0
20
40
60
80
100
120
140
160
180
5 7 9
AC Thickness (in.)
PC
C S
tress (
psi)
5 in.TWT
6 in. TWT
7.5 in.TWT
(a) (b)
Figure 4.15 PCC Stress vs. Existing AC Thickness Graph for Bonded Condition and
Unpaved Shoulder (a) AC Modulus 250 ksi and (b) AC Modulus 350 ksi
0
50
100
150
200
250
300
350
400
450
5 7 9
AC Thickness (in.)
PC
C S
tress (
psi)
5 in.TWT
6 in. TWT
7.5 in.TWT
0
50
100
150
200
250
300
350
400
450
5 7 9
AC Thickness (in.)
PC
C S
tress (
psi)
5 in.TWT
6 in. TWT
7.5 in.TWT
(a) (b)
Figure 4.16 PCC Stress vs. Existing AC Thickness Graph for Unbonded Condition and
Unpaved Shoulder (a) AC Modulus 250 ksi and (b) AC Modulus 350 ksi

64
0
20
40
60
80
100
120
140
160
5 7 9
AC Thickness (in.)
PC
C S
tress (
psi)
5 in.TWT
6 in. TWT
7.5 in.TWT
0
20
40
60
80
100
120
140
160
5 7 9
AC Thickness (in.)
PC
C S
tress (
psi)
5 in.TWT
6 in. TWT
7.5 in.TWT
(a) (b)
Figure 4.17 PCC Stress vs. Existing AC Thickness Graph for Bonded Condition and Paved
Shoulder (a) AC Modulus 250 ksi and (b) AC Modulus 350 ksi
0
50
100
150
200
250
300
350
400
5 7 9
AC Thickness (in.)
PC
C S
tress (
psi)
5 in.TWT
6 in. TWT
7.5 in.TWT
0
50
100
150
200
250
300
350
400
5 7 9
AC Thickness (in.)
PC
C S
tress (
psi)
5 in.TWT
6 in. TWT
7.5 in.TWT
(a) (b)
Figure 4.18 PCC Stress vs. Existing AC Thickness Graph for Unbonded Condition and
Paved Shoulder (a) AC Modulus 250 ksi and (b) AC Modulus 350 ksi
4.1.4 Effect of AC Modulus
The existing AC modulus is representative of the existing AC pavement condition.
PCC stress versus AC modulus plots for different parameters have been shown in Figures

65
4.19 through 4.24. With the increase in AC modulus, PCC stress decreases. The AC
modulus has less effect on unbonded PCC stress than on the bonded. For 250 ksi and 350
ksi AC moduli, tensile stresses were observed to be 442 psi and 416 psi for 5 in. unbonded
TWT, 5 in. AC layer, and the unpaved shoulder condition (Figure 4.19b). The stress change
due to AC modulus was about 6% for unbonded overlay and 14% for bonded overlay.
0
50
100
150
200
250
300
350
400
450
500
250 350
AC Modulus (ksi)
PC
C S
tress (
psi)
5 in.AC
7 in. AC
9 in.AC
0
50
100
150
200
250
300
350
400
450
500
250 350
AC Modulus (ksi)
PC
C S
tress (
psi)
5 in.AC
7 in. AC
9 in.AC
(a) (b)
Figure 4.19 PCC Stress vs. Existing AC Modulus Graph for 5 in. TWT and Unpaved
Shoulder (a) Bonded and (b) Unbonded
0
50
100
150
200
250
300
350
400
450
250 350
AC Modulus (ksi)
PC
C S
tress (
psi)
5 in.AC
7 in. AC
9 in.AC
0
50
100
150
200
250
300
350
400
450
250 350
AC Modulus (ksi)
PC
C S
tress (
psi)
5 in.AC
7 in. AC
9 in.AC
(a) (b)
Figure 4.20 PCC Stress vs. Existing AC Modulus Graph for 5 in. TWT and Paved Shoulder
(a) Bonded and (b) Unbonded
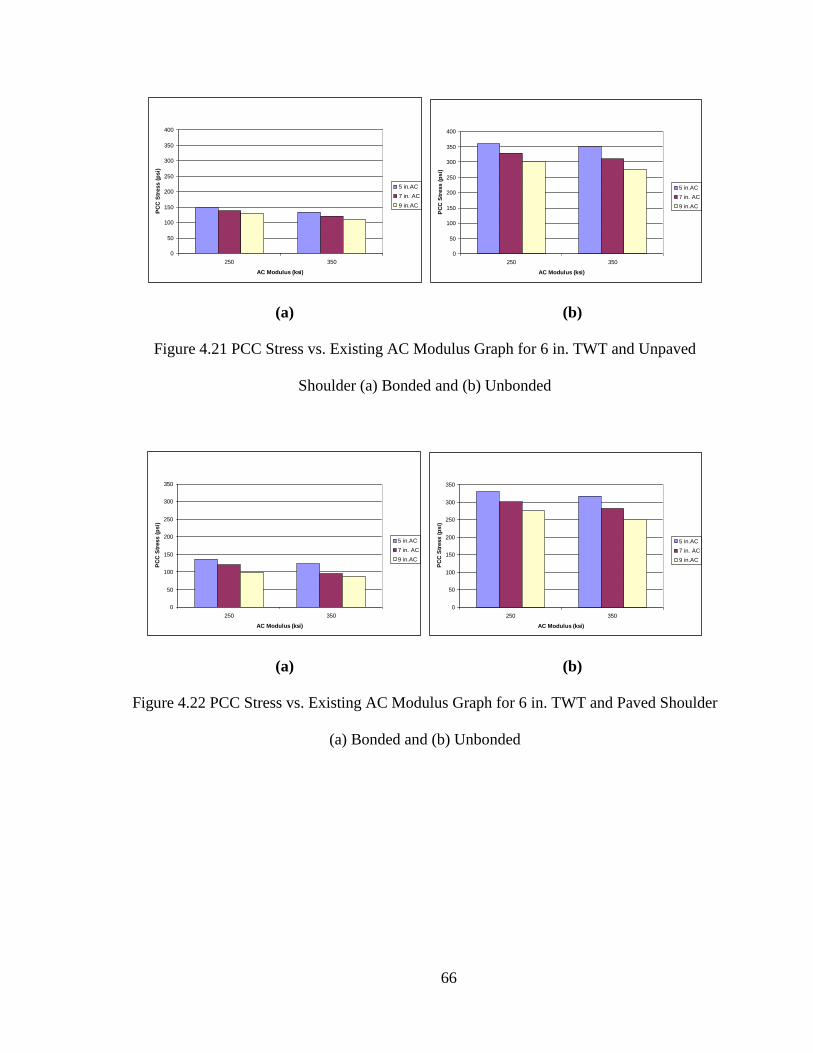
66
0
50
100
150
200
250
300
350
400
250 350
AC Modulus (ksi)
PC
C S
tress (
psi)
5 in.AC
7 in. AC
9 in.AC
0
50
100
150
200
250
300
350
400
250 350
AC Modulus (ksi)
PC
C S
tress (
psi)
5 in.AC
7 in. AC
9 in.AC
(a) (b)
Figure 4.21 PCC Stress vs. Existing AC Modulus Graph for 6 in. TWT and Unpaved
Shoulder (a) Bonded and (b) Unbonded
0
50
100
150
200
250
300
350
250 350
AC Modulus (ksi)
PC
C S
tress (
psi)
5 in.AC
7 in. AC
9 in.AC
0
50
100
150
200
250
300
350
250 350
AC Modulus (ksi)
PC
C S
tress (
psi)
5 in.AC
7 in. AC
9 in.AC
(a) (b)
Figure 4.22 PCC Stress vs. Existing AC Modulus Graph for 6 in. TWT and Paved Shoulder
(a) Bonded and (b) Unbonded

67
0
50
100
150
200
250
300
250 350
AC Modulus (ksi)
PC
C S
tress (
psi)
5 in.AC
7 in. AC
9 in.AC
0
50
100
150
200
250
300
250 350
AC Modulus (ksi)
PC
C S
tress (
psi)
5 in.AC
7 in. AC
9 in.AC
(a) (b)
Figure 4.23 PCC Stress vs. Existing AC Modulus Graph for 7.5 in. TWT and Unpaved
Shoulder (a) Bonded and (b) Unbonded
0
50
100
150
200
250
300
250 350
AC Modulus (ksi)
PC
C S
tress (
psi)
5 in.AC
7 in. AC
9 in.AC
0
50
100
150
200
250
300
250 350
AC Modulus (ksi)
PC
C S
tress (
psi)
5 in.AC
7 in. AC
9 in.AC
(a) (b)
Figure 4.24 PCC Stress vs. Existing AC Modulus Graph for 7.5 in. TWT and Paved
Shoulder (a) Bonded and (b) Unbonded
4.1.5 Effect of Shoulder Condition
A paved shoulder provides lateral support to pavement; thus, the addition of a
paved shoulder decreases the transverse tensile stress of TWT. This phenomenon has been
shown with Figures 4.25 to 4.30. For unbonded 5 in. TWT, the 5 in. AC layer, and an AC

68
modulus of 250 ksi, tensile stresses were found as 442 and 385 psi, respectively, for the
unpaved and paved shoulders (Figure 4.26a). The difference of about 15% was found for
the change in shoulder condition.
0
20
40
60
80
100
120
140
160
180
Unpaved Paved
Shoulder Condition
PC
C S
tress (
psi)
5 in.AC
7 in. AC
9 in.AC
0
20
40
60
80
100
120
140
160
180
Unpaved Paved
Shoulder Condition
PC
C S
tress (
psi)
5 in.AC
7 in. AC
9 in.AC
(a) (b)
Figure 4.25 PCC Stress vs. Shoulder Condition Graph for 5 in. Bonded TWT (a) AC
Modulus 250 ksi and (b) AC Modulus 350 ksi
0
50
100
150
200
250
300
350
400
450
Unpaved Paved
Shoulder Condition
PC
C S
tress (
psi)
5 in.AC
7 in. AC
9 in.AC
0
50
100
150
200
250
300
350
400
450
Unpaved Paved
Shoulder Condition
PC
C S
tress (
psi)
5 in.AC
7 in. AC
9 in.AC
(a) (b)
Figure 4.26 PCC Stress vs. Shoulder Condition Graph for 5 in. Unbonded TWT (a) AC
Modulus 250 ksi and (b) AC Modulus 350 ksi

69
0
20
40
60
80
100
120
140
160
Unpaved Paved
Shoulder Condition
PC
C S
tress (
psi)
5 in.AC
7 in. AC
9 in.AC
0
20
40
60
80
100
120
140
160
Unpaved Paved
Shoulder Condition
PC
C S
tress (
psi)
5 in.AC
7 in. AC
9 in.AC
(a) (b)
Figure 4.27 PCC Stress vs. Shoulder Condition Graph for 6 in. Bonded TWT (a) AC
Modulus 250 ksi and (b) AC Modulus 350 ksi
0
50
100
150
200
250
300
350
400
Unpaved Paved
Shoulder Condition
PC
C S
tress (
psi)
5 in.AC
7 in. AC
9 in.AC
0
50
100
150
200
250
300
350
400
Unpaved Paved
Shoulder Condition
PC
C S
tress (
psi)
5 in.AC
7 in. AC
9 in.AC
(a) (b)
Figure 4.28 PCC Stress vs. Shoulder Condition Graph for 6 in. Unbonded TWT (a) AC
Modulus 250 ksi and (b) AC Modulus 350 ksi

70
0
20
40
60
80
100
120
140
Unpaved Paved
Shoulder Condition
PC
C S
tress (
psi)
5 in.AC
7 in. AC
9 in.AC
0
20
40
60
80
100
120
140
Unpaved Paved
Shoulder Condition
PC
C S
tress (
psi)
5 in.AC
7 in. AC
9 in.AC
(a) (b)
Figure 4.29 PCC Stress vs. Shoulder Condition Graph for 7.5 in. Bonded TWT (a) AC
Modulus 250 ksi and (b) AC Modulus 350 ksi
0
50
100
150
200
250
300
Unpaved Paved
Shoulder Condition
PC
C S
tress (
psi)
5 in.AC
7 in. AC
9 in.AC
0
50
100
150
200
250
300
Unpaved Paved
Shoulder Condition
PC
C S
tress (
psi)
5 in.AC
7 in. AC
9 in.AC
(a) (b)
Figure 4.30 PCC Stress vs. Shoulder Condition Graph for 7.5 in. Unbonded TWT (a) AC
Modulus 250 ksi and (b) AC Modulus 350 ksi
4.2 Curling Effect
The curling effect for temperature differentials of 1.50F/in and 3
0F/in on TWT were
also examined. The contour plot of curling stress has been shown in Figure 4.11. Curling
stresses for different TWT thicknesses have been shown in Figures 4.12 and 4.13. The

71
stresses do not change greatly with the change of existing AC thicknesses. From the
figures, it appears with the increase of TWT thickness, the curling stress increases and the
bonding condition and AC modulus have no effect on curling stress. For 5 in., 6 in. and 7.5
in. TWT, curling stresses for 1.50F/in temperature differential were found to be 83, 94, and
120 psi, respectively. The change in curling stress due to TWT thickness change is about
14% to 30%.
Figure 4.31 Contour Plot of Curling Stress

72
0
50
100
150
200
250
5 6 7.5
TWT Thickness (in)
Cu
rlin
g S
tress (
psi)
Bonded
Unbonded
0
50
100
150
200
250
5 6 7.5
TWT Thickness (in)
Cu
rlin
g S
tress (
psi)
Bonded
Unbonded
(a) (b)
Figure 4.32 PCC Stress vs. TWT Thickness for AC Modulus 250 ksi (a) Temp. Diff. of
1.50F/in and (b) Temp. Diff. 3
0F/in
0
50
100
150
200
250
5 6 7.5
TWT Thickness (in)
Cu
rlin
g S
tress (
psi)
Bonded
Unbonded
0
50
100
150
200
250
5 6 7.5
TWT Thickness (in)
Cu
rlin
g S
tress (
psi)
Bonded
Unbonded
(a) (b)
Figure 4.33 PCC Stress vs. TWT Thickness for AC Modulus 350 ksi (a) Temp. Diff. of
1.50F/in and (b) Temp. Diff. 3
0F/in
4.3 Verification of the FE Model
As this study is based on numerical work, the finite element model needs to be
independently verified. For this purpose, stresses obtained from SolidWorks were
compared with those from ANSYS and KENSLABS. KENSLABS is a two-dimensional
finite element software which permits the analysis of rigid pavement response under static

73
load (Huang 2004). It is a part of a computer package called KENPAVE. The package has
an input program SLABSINP and graphic programs SGRAPH and CONTOUR.
Table 4.4 shows the comparison of stresses obtained from SolidWorks and ANSYS.
For different TWT thicknesses, 14 to 19% differences in stresses were found. The
employed version of ANSYS limits the user’s creation to a mesh with up to 32,000 nodes;
however, in SolidWorks more than 50,000 nodes were used to create mesh. The use of
higher nodes in SolidWorks resulted in differences in calculated PCC stresses from
ANSYS.
Table 4.5 shows the comparison of stresses obtained from SolidWorks and
KENSLABS. The results indicated 20 to 25% differences for different TWT thicknesses.
For the two layers model, KENSLABS ignores the properties of the bottom/foundation
layer. In the current study, KENSLABS cannot take into account the load-carrying capacity
of the existing AC layer; thus, it shows higher PCC stresses than that obtained in
SolidWorks.
Table 4.1 Comparison of Stresses Obtained from SolidWorks and ANSYS
TWT (in.) PCC Stress (psi) % Difference
SolidWorks ANSYS
5 170 147 14
6 149 121 19
Table 4.2 Comparison of Stresses Obtained from SolidWorks and KENSLABS
TWT (in.) PCC Stress (psi) % Difference
SolidWorks KENSLABS
5 170 204 20
6 149 187 25

74
4.4 Service Lives and Design Catalog
According to the PCA fatigue criterion (PCA 1984), allowable load repetitions (N)
were calculated based on the stress ratio of the concrete. The stress ratio (SR) is the ratio of
the PCC tensile stress to the concrete modulus of rupture.
For SR > 0.55
0828.0
97187.0)(log10
SRN
For 0.45 ≤ SR ≤ 0.55
268.3
43248.0
2577.4
SRN
For SR < 0.45
N = Unlimited
Where,
SR = flexural stress to strength (modulus of rapture of concrete) ratio, and
N = the number of allowable load repetitions
From the allowable load repetitions, the design life can be estimated. The maximum
service life of a whitetopping was taken as 10 years, under the consideration of durability.
For different parameters considered in this study, Tables 4.6, 4.7 and 4.8 represent the
design catalogs of TWT for 0, 3% and 6% traffic growth, respectively. The results show
that for fully bonded conditions of all TWT and AC layer thicknesses, TWT is expected to
last through the 10 years assumed in design. But unbonded TWT with unpaved shoulder
results in a catastrophic loss of pavement life. In the design catalogs, design parameter
combinations in the shaded cells are not recommended because their calculated service
lives were less than 10 years.

75
Table 4.3 Design Catalog for Thin Whitetopping for No Traffic Growth
AC
Thickness
(in)
AC
Modulus
(ksi)
Bonding
Condition
Shoulder
Condition
TWT
Thickness*
(in)
Service Life (Years)
Daily Truck Traffic** per Lane
≤200 300 400 500
5 250
350
Unpaved
Paved
5 10 10 10 10
7 Bonded 6 10 10 10 10
9 7.5 10 10 10 10
5 0.06 0.04 0.03 0.02
5 250 Unbonded Unpaved 6 2.13 1.42 1.07 0.85
7.5 10 10 10 10
5 0.19 0.12 0.09 0.07
5 350 Unbonded Unpaved 6 3.34 2.23 1.67 1.34
7.5 10 10 10 10
5 0.7 0.47 0.35 0.28
5 250 Unbonded Paved 6 9.8 6.52 4.89 3.91
7.5 10 10 10 10
5 1.5 1.01 0.76 0.61
5 350 Unbonded Paved 6 10 10 10 10
7.5 10 10 10 10
5 0.6 0.4 0.3 0.2
7 250 Unbonded Unpaved 6 10 7 5.2 4.2
7.5 10 10 10 10
5 2 1.3 1 0.8
7 350 Unbonded Unpaved 6 10 10 10 10
7.5 10 10 10 10
5 4.1 2.7 2 1.6
7 250 Unbonded Paved 6 10 10 10 10
7.5 10 10 10 10
5 10 10 8.1 6.5
7 350 Unbonded Paved 6 10 10 10 10
7.5 10 10 10 10
5 3.5 2.3 1.8 1.4
9 250 Unbonded Unpaved 6 10 10 10 10
7.5 10 10 10 10
5 10 10 10 10
9 350 Unbonded Unpaved 6 10 10 10 10
7.5 10 10 10 10
250
350
5 10 10 10 10
9 Unbonded Paved 6 10 10 10 10
7.5 10 10 10 10
* Concrete Modulus of Rupture = 650 psi ** Truck Factor = 1.5
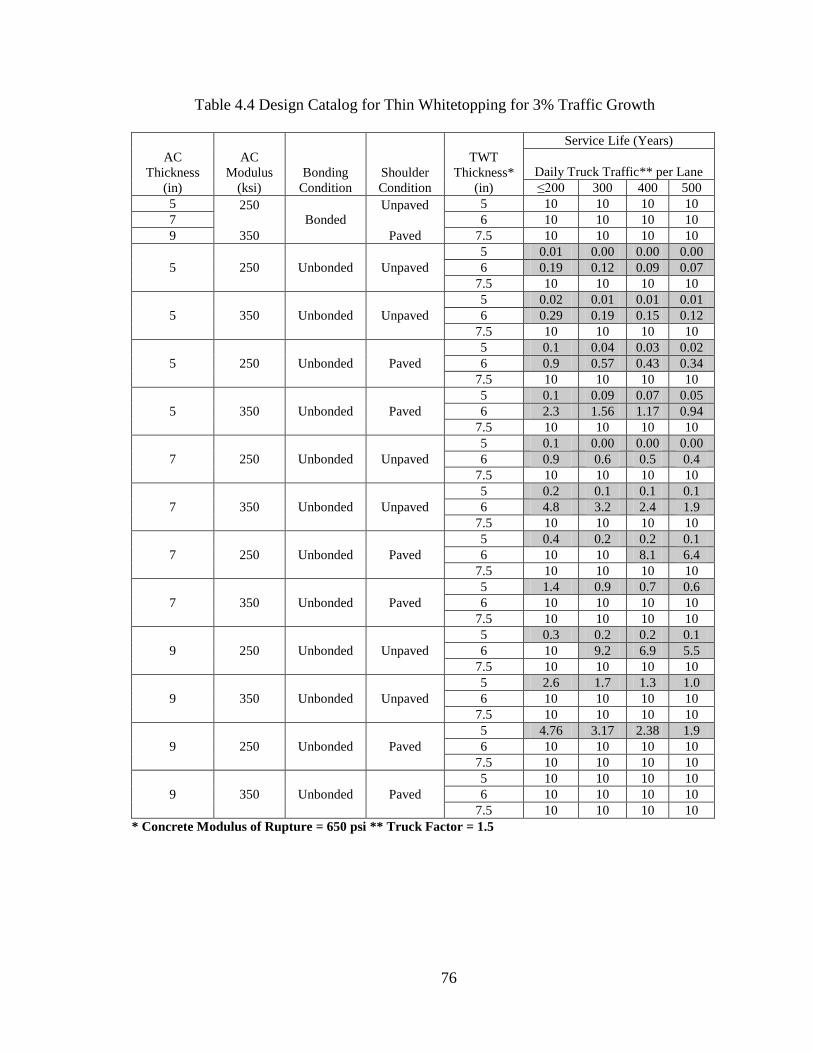
76
Table 4.4 Design Catalog for Thin Whitetopping for 3% Traffic Growth
AC
Thickness
(in)
AC
Modulus
(ksi)
Bonding
Condition
Shoulder
Condition
TWT
Thickness*
(in)
Service Life (Years)
Daily Truck Traffic** per Lane
≤200 300 400 500
5 250
350
Unpaved
Paved
5 10 10 10 10
7 Bonded 6 10 10 10 10
9 7.5 10 10 10 10
5 0.01 0.00 0.00 0.00
5 250 Unbonded Unpaved 6 0.19 0.12 0.09 0.07
7.5 10 10 10 10
5 0.02 0.01 0.01 0.01
5 350 Unbonded Unpaved 6 0.29 0.19 0.15 0.12
7.5 10 10 10 10
5 0.1 0.04 0.03 0.02
5 250 Unbonded Paved 6 0.9 0.57 0.43 0.34
7.5 10 10 10 10
5 0.1 0.09 0.07 0.05
5 350 Unbonded Paved 6 2.3 1.56 1.17 0.94
7.5 10 10 10 10
5 0.1 0.00 0.00 0.00
7 250 Unbonded Unpaved 6 0.9 0.6 0.5 0.4
7.5 10 10 10 10
5 0.2 0.1 0.1 0.1
7 350 Unbonded Unpaved 6 4.8 3.2 2.4 1.9
7.5 10 10 10 10
5 0.4 0.2 0.2 0.1
7 250 Unbonded Paved 6 10 10 8.1 6.4
7.5 10 10 10 10
5 1.4 0.9 0.7 0.6
7 350 Unbonded Paved 6 10 10 10 10
7.5 10 10 10 10
5 0.3 0.2 0.2 0.1
9 250 Unbonded Unpaved 6 10 9.2 6.9 5.5
7.5 10 10 10 10
5 2.6 1.7 1.3 1.0
9 350 Unbonded Unpaved 6 10 10 10 10
7.5 10 10 10 10
5 4.76 3.17 2.38 1.9
9 250 Unbonded Paved 6 10 10 10 10
7.5 10 10 10 10
5 10 10 10 10
9 350 Unbonded Paved 6 10 10 10 10
7.5 10 10 10 10
* Concrete Modulus of Rupture = 650 psi ** Truck Factor = 1.5

77
Table 4.5 Design Catalog for Thin Whitetopping for 6% Traffic Growth
AC
Thickness
(in)
AC
Modulus
(ksi)
Bonding
Condition
Shoulder
Condition
TWT
Thickness*
(in)
Service Life (Years)
Daily Truck Traffic** per Lane
≤200 300 400 500
5 250
350
Unpaved
Paved
5 10 10 10 10
7 Bonded 6 10 10 10 10
9 7.5 10 10 10 10
5 0.00 0.00 0.00 0.00
5 250 Unbonded Unpaved 6 0.16 0.11 0.08 0.06
7.5 10 10 10 10
5 0.01 0.01 0.01 0.01
5 350 Unbonded Unpaved 6 0.25 0.17 0.13 0.10
7.5 10 10 10 10
5 0.1 0.04 0.03 0.02
5 250 Unbonded Paved 6 0.7 0.49 0.37 0.30
7.5 10 10 10 10
5 0.1 0.08 0.06 0.05
5 350 Unbonded Paved 6 2.0 1.36 1.02 0.81
7.5 10 10 10 10
5 0.00 0.00 0.00 0.00
7 250 Unbonded Unpaved 6 0.8 0.5 0.4 0.3
7.5 10 10 10 10
5 0.1 0.1 0.1 0.1
7 350 Unbonded Unpaved 6 4.1 2.8 2.1 1.7
7.5 10 10 10 10
5 0.3 0.2 0.2 0.1
7 250 Unbonded Paved 6 10 9.3 7.0 5.6
7.5 10 10 10 10
5 1.2 0.8 0.6 0.5
7 350 Unbonded Paved 6 10 10 10 10
7.5 10 10 10 10
5 0.3 0.2 0.1 0.1
9 250 Unbonded Unpaved 6 10 8.0 6.0 4.8
7.5 10 10 10 10
5 2.2 1.5 1.1 0.9
9 350 Unbonded Unpaved 6 10 10 10 10
7.5 10 10 10 10
5 4.14 2.76 2.07 1.66
9 250 Unbonded Paved 6 10 10 10 10
7.5 10 10 10 10
5 10 10 10 10
9 350 Unbonded Paved 6 10 10 10 10
7.5 10 10 10 10
* Concrete Modulus of Rupture = 650 psi ** Truck Factor = 1.5

78
CHAPTER 5 Conclusions and Recommendations
5.1 Conclusions
The objective of this study was to assess the behavior of thin whitetoppings on existing
AC pavements for different bonding conditions with the AC layer, AC thicknesses, shoulder
conditions, existing AC modulus and temperature differentials. Based on this study, a design
catalog was developed for thin whitetopping. From this study, the following conclusions can be
drawn:
1) Interface bonding conditions between TWT and the existing AC layer are the most
important factors that affect TWT behavior. Transverse tensile stress increases about
160% for the change in interface condition from bonded to unbonded. TWT thickness has
a more pronounced effect on unbonded interface conditions than on fully bonded
conditions.
2) The addition of a frictional coefficient resulted in a considerable drop in tensile stress for
unpaved shoulder conditions, but did not show any significant effect for paved shoulder
conditions.
3) For different TWT thicknesses, changes in stresses were found to vary from 23% to 32%
for unbonded TWT and 14% to 20% for bonded TWT. The existing AC thickness has a
more pronounced effect on concrete stresses for 5 in. TWT than 6 in. and 7.5 in. TWT.
4) Concrete tensile stresses decrease about 12% to 14% for a 2 in. increase in AC thickness.
The corresponding change due to the AC modulus was about 6% for unbonded overlay
and 14% for bonded overlay. The difference is about 15% for changes of shoulder
conditions. The change of curling stress due to TWT thickness change was about 14% to
30%.

79
5) For fully bonded conditions of all TWT and AC layer thicknesses, TWT is expected to
last through the 10 years assumed in design. Unbonded TWT with unpaved shoulders
results in very early pavement failures.
5.2 Recommendations
The following recommendations are made from this study:
1) Further studies should be conducted with field experiments to determine the actual
behavior of thin whitetopping.
2) The effect of environment, subgrade soil types and different joint spacing may be
investigated.
3) Pavement response under moving loads would give a better approximation of the actual
scenario.
4) In the field, it is very difficult to achieve full bond between the concrete and the AC
layer; therefore, partial bonding at the interface should be investigated in detail.

80
References
AASHTO. ―Guide for the Design of Pavement Structures.‖ American Association of State
Highway and Transportation Officials, Washington, D.C., 1993.
AASHTO. ―Rough Roads Ahead.‖ American Association of State Highway and Transportation
Officials, Washington, D.C., 2010.
ACI Committee 325. ―Concrete Overlays for Pavement Rehabilitation.‖ ACI 325-13R-06. ACI
Standards, American Concrete Institute, 2006.
ACI Committee 212. ―Chemical Admixtures for Concrete.‖ ACI 212-3R-04. ACI Standards,
American Concrete Institute, 2004.
American Concrete Pavement Association (ACPA). ―Guidelines for Bonded Concrete
Overlays.‖ Technical Bulletin TB-007P. Arlington Heights, 1990.
American Concrete Pavement Association (ACPA). ―Guidelines for Concrete Overlays of
Existing Asphalt Pavements.‖ TB-009P. Concrete Pavement Technology, IL, 1991.
American Concrete Pavement Association (ACPA). ―Whitetopping—State of the Practice.‖
ACPA Publication EB210P. Skokie, IL, 1998.
American Concrete Pavement Association (ACPA). ―R&T: Concrete Pavement Research &
Technology.‖ 2002. http://www.acpa.org/Downloads/RT/RT3.05.pdf (accessed May 12,
2010)
Armaghani, J., R. Luster, J. Greene, and C. Holzschuher. ―Thin Whitetopping at Fernandina
Airport.‖ International Conference on Best Practice for Ultrathin and Thin
Whitetoppings, Denver, CO, 2005.
Cable, J. K., F. S. Fanous, H. Ceylan, D. Wood, D. Frentress, T. Tabbert, S. Y. Oh, and K.
Gopalakrishnam. ―Design and Construction Procedures for Concrete Overlay and
Widening of Existing Pavements.‖ Report No. FHWA-DTFH61-01-X-00042 (Project 6),
IHRB Project TR- 511. Center for Portland Cement Concrete Pavement Technology,
Iowa State University, Ames, 2005.
Concrete Pavement Technology Program (CPTP). ―Thin Whitetopping—The Colorado
Experience.‖ FHWA-HF-07-025. 2007.
http://www.fhwa.dot.gov/pavement/concrete/pubs/07025/07025.pdf (accessed June 10,
2010)
Cheung, Y. K., and O. C. Zienkiewicz. ―Plates and Tanks on Elastic Foundations—An
Application of Finite Element Method.‖ International Journal of Solids and Structures 1
(1965).

81
Chul, S., D. Kim, and M. Won. Development of the Thickness Design for Concrete Pavement
Overlays over Existing Asphalt Pavement Structures. Report No. FHWA/TX-09/0-5482-
2. TxDOT/ FHWA, Austin, 2008.
Dumitru, A. C. ―Comparison of Measured and Computed Strains in Experimental Thin PCC
Overlays.‖ MS thesis, Kansas State University, 2006.
Harrington, D. ―Guide to Concrete Overlays—Sustainable Solutions for Resurfacing and
Rehabilitating Existing Pavements.‖ 2nd edition. National Concrete Pavement
Technology Center, 2008.
Huang, Y. H. Pavement Analysis and Design. Englewood Cliffs, NJ: Prentice Hall, 2004.
Hutchinson, R. L. ―NCHRP Synthesis of Highway Practice 99: Resurfacing with Portland
Cement Concrete.‖ Transportation Research Board, National Research Council,
Washington, D.C., 1982.
Lowery, G. ―Life-Cycle Cost Analysis of Thin Whitetopping.‖ International Conference on Best
Practices for Ultrathin and Thin Whitetoppings, Denver, 2005.
McGhee, K. H., Synthesis of Highway Practice 204: Portland Cement Concrete Resurfacing,
Transportation Research Board, National Research Council, Washington, D.C., 1994.
Miner, M. A. ―Cumulative Damage in Fatigue.‖ American Society of Mechanical Engineers
Transactions 67 (1945).
Minnesota Department of Transportation (MnDOT). ―Concrete Overlay Design—Rehabilitation
of Existing Pavement.‖ 2010.
http://www.dot.state.mn.us/materials/pvmtdesign/concreteoverlay.html (accessed June 3,
2010)
Moaveni, S. Finite Element Analysis: Theory and Application with ANSYS. Englewood Cliffs,
NJ: Prentice-Hall Inc., 1999.
Montana Department of Transportation (MtDOT). ―Documentation of Great Falls Experimental
Whitetopping Repair Project.‖ P.O. No. 305626. Helena, 2001.
Montana Department of Transportation (MtDOT). ―Annual Experimental Evaluation Report.‖
Project No. STPP 1-2 (93) 121. Helena, 2008.
Mouris, S. ―Whitetopping Restores Air Traffic at Spirit of St. Louis.‖ Concrete Construction,
1995.
National Highway Institute (NHI). ―PCC Overlays of HMA Pavements (Whitetopping).‖
Reference Manual, Module 3-7.

82
Nenad G. ―Development of a Design Guide for Ultra-thin Whitetopping (UTW).‖ Report No.
FHWA 2001-018. New Jersey Department of Transportation, 1998.
Portland Cement Association (PCA). ―Thickness Design for Concrete Highway and Street
Pavements.‖ Engineering Bulletin No. EB-109.01P. Portland Cement Association,
Skokie, 1984.
Portland Cement Concrete (PCA). ―Design and Control of Concrete Mixtures.‖ 14th
Edition.
Engineering Bulletin EB001.13T. Portland Cement Association, Stokie, 2002.
Rasmussen, R. O., and D. Rozycki. ―Synthesis of Highway Parctice 338: Thin and Ultra-Thin
Whitetopping.‖ Transportation Research Board, National Research Council, Washington,
D.C., 2004.
Riley, R. C., L. Titus-Glover, J. Mallela, S. Waalkes, and M. Darter. ―Incorporation of
Probabilistic Concepts into Fatigue Analysis of Ultra-Thin Whitetopping as Developed
for the American Concrete Pavement Association.‖ Proceedings of the International
Conference on Best Practices for Ultrathin and Thin Whitetoppings, Denver, 2005.
Roesler, J., A. Bordelon, A. Ioannides, M. Beyer, and D. Wang. ―Design and Concrete Material
Requirements for Ultra-Thin Whitetopping.‖ Report No. FHWA-ICT-08-016. Illinois
Center for Transportation, Urbana, 2008.
Sheehan, M. J., S. M. Tarr, and S., Tayabji. ―Instrumentation and Field Testing of Thin
Whitetopping Pavement in Colorado and Revision of the Existing Colorado Thin
Whitetopping Procedure.‖ Report No. CDOT-DTD-R-2004-12. Colorado Department of
Transportation Research Branch, Denver, 2004.
SolidWorks. SolidWorks Manual. SolidWorks Inc., 2009.
Tarr, S. M., M. J. Sheehan, and P. A. Okamoto. ―Guidelines for the Thickness Design of Bonded
Whitetopping in the State of Colorado.‖ Report No. CDOT-DTD-R-98-10. Colorado
Department of Transportation, Denver, 1998.
The Asphalt Institute. ―Thickness Design–Asphalt Pavements for Highways and Streets. Manual
Series No. 1. KY, 1981.
The Road Information Program (TRIP). ―Key Facts about America’s Surface Transportation
System and Federal Funding.‖ Updated May 2010.
http://www.tripnet.org/NationalFactSheetMay2010.pdf (accessed July 5, 2010)
Ting, M., J. Koomey, and M. Pomerantz. ―Preliminary Evaluation of the Lifecycle Cost and
Market Barriers of Reflective Pavements.‖ Publication No. LBNL-45864. Ernest Orlando
Lawrence Berkeley National Laboratory, 2001.

83
Uzarowski, L., and I. Bashir. ―A Rational Approach for Selecting the Optimum Asphalt
Pavement Preventive and Rehabilitation Treatments–Two Practical Examples from
Ontario.‖ Paper prepared for presentation at the Annual Conference of the Transportation
Association of Canada, Saskatoon, 2007.
Vandenbossche, J. M., and D. L. Rettner. ―One-Year Performance Summary of Whitetopping
Test Sections at the Mn/ ROAD Test Facility.‖ International Conference on Accelerated
Pavement Testing, Reno, NV, 1999.
Vandenbossche, J. M., and A. J. Fagerness. ―Performance, Analysis, and Repair of Ultra-Thin
and Thin Whitetopping at Mn/Road.‖ Transportation Research Record 1809.
Transportation Research Board, National Research Council, Washington, D.C., 2002.
Winkelman, T. J. ―Whitetopping Construction and Early Performance in Illinois, Bureau of
Materials and Physical Research.‖ Report No-FHWA/IL/PRR 144. Illinois Department of
Transportation, Springfield, 2002.
Wu, C. L., S. M. Tarr, T. M. Refai, M. A. Nagi, and M. J. Sheehan. ―Development of Ultra-Thin
Whitetopping Design Procedure.‖ Report No. 2124. Portland Cement Association
Research and Development, Stokie, 1998.
Wu, C., and M. Sheehan. ―Instrumentation and Field Testing of Whitetopping Pavements in
Colorado and Revision of the TWT Design Procedure.‖ Report No. CDOT-DTD-R-2002-
3. Interim Report, Colorado Department of Transportation Research Branch, Denver,
2002.