extending a building-scale optimisation model to low
TRANSCRIPT

4th International Conference on Smart Energy Systems and 4th Generation District Heating 2018
#SES4DH2018
Extending a building-scale optimisation model to low-temperature district heating systems McKenna, R.*, Hagedorn, V.#, Mainzer, K.#
#Chair of Energy Economics, Karlsruhe Institute for Technology (KIT), Germany *DTU Engineering Management, Technical University of Denmark, Denmark

Literature overview and objective
4th International Conference on Smart Energy Systems and 4th Generation District Heating 2018 #SES4DH2018
Decentralized building supply • Akbari, Jolai & Ghaderi (2016) • Omu,
Choudhary & Boies (2013) • Wouters, Fraga & James (2015) • (Baetens et al. 2012) • Coninck et al. (2014) • Mehleri et al. (2013); (2012)
Centralized district supply • Yang, Zhang & Xiao (2015) • Orehounig, Evins & Dorer
(2015) • Walker et al. (2017) • Wu et al. (2018)
DH Network optimisation • Möller & Nielsen (2014) • Möller & Lund (2010) • Nielsen (2014) • Delangle et al. (2017) • Unternährer et al. (2017)
Study considers all three aspects
Objective: Comparison of centralized and decentralized energy supply systems in urban areas with different residential areas

General approach to model extension • Existing building-level MILP model extended to include heating grid • Directional graph • Building and heat generation plant shown as nodes • Forward and return flow shown in the model • Grid topology represented in the model by matrices
4th International Conference on Smart Energy Systems and 4th Generation District Heating 2018 #SES4DH2018

Dimensioning options for pipelines
• Each section is allocated a pipe diameter • Available pipe diameters are linked to various properties
4th International Conference on Smart Energy Systems and 4th Generation District Heating 2018 #SES4DH2018
Properties Data origin
Inner radius Exogenous
External radius Exogenous
Thermal conductivity of the insulation Exogenous
Max. heat flow Endogenous
Max. volume flow Endogenous
Max. & average flow velocity Exogenous
Material and installation costs Exogenous
Heat losses Endogenous
Pressure losses Endogenous

𝑈𝑈𝑅𝑅 =1
𝑟𝑟𝑅𝑅𝜆𝜆𝐷𝐷
ln 𝑟𝑟𝐴𝐴𝑟𝑟𝑅𝑅
+ 𝑟𝑟𝑅𝑅𝜆𝜆𝐵𝐵𝐵𝐵
ln� 4(ℎÜ + 𝑟𝑟𝐴𝐴)𝑟𝑟𝐴𝐴
+ 𝑟𝑟𝑅𝑅𝜆𝜆𝐵𝐵𝐵𝐵
ln 2(ℎÜ + 𝑟𝑟𝐴𝐴)𝑎𝑎 + 2𝑟𝑟𝐴𝐴
2+ 1
0,5
�
Calculation of heat losses 𝑙𝑙𝑙𝑙𝑙𝑙𝑙𝑙𝑚𝑚𝑚𝑚𝑚𝑚,𝑅𝑅
𝐻𝐻𝐻𝐻𝑚𝑚𝐻𝐻,𝑙𝑙 = 𝑆𝑆𝑆𝑆𝑟𝑟𝑆𝑆𝑅𝑅,𝑙𝑙 ∗ ∆𝑇𝑇𝐿𝐿 ∗ 𝑈𝑈𝑅𝑅
4th International Conference on Smart Energy Systems and 4th Generation District Heating 2018 #SES4DH2018
𝑙𝑙𝑆𝑆𝑟𝑟𝑆𝑆𝑅𝑅 = 2 ∗ 𝜋𝜋 ∗ 𝑙𝑙𝑅𝑅 ∗ 𝑟𝑟𝑅𝑅
Relevant Surface
• Relative to 1m pipe length
Difference in temperature
• Flow & return constant
• Ground temperature constant
Heat transfer coefficient
• Installation distance & overlap height the same for all pipe diameters
𝛥𝛥𝑇𝑇𝐿𝐿 =𝑇𝑇𝑉𝑉𝐿𝐿 + 𝑇𝑇𝑅𝑅𝐿𝐿
2 − 𝑇𝑇𝐵𝐵𝐵𝐵

Balance Equation
4th International Conference on Smart Energy Systems and 4th Generation District Heating 2018 #SES4DH2018
Pipe diameters are defined on the basis of various restrictions
A
N-1
A-1
N N+1
T
T-1
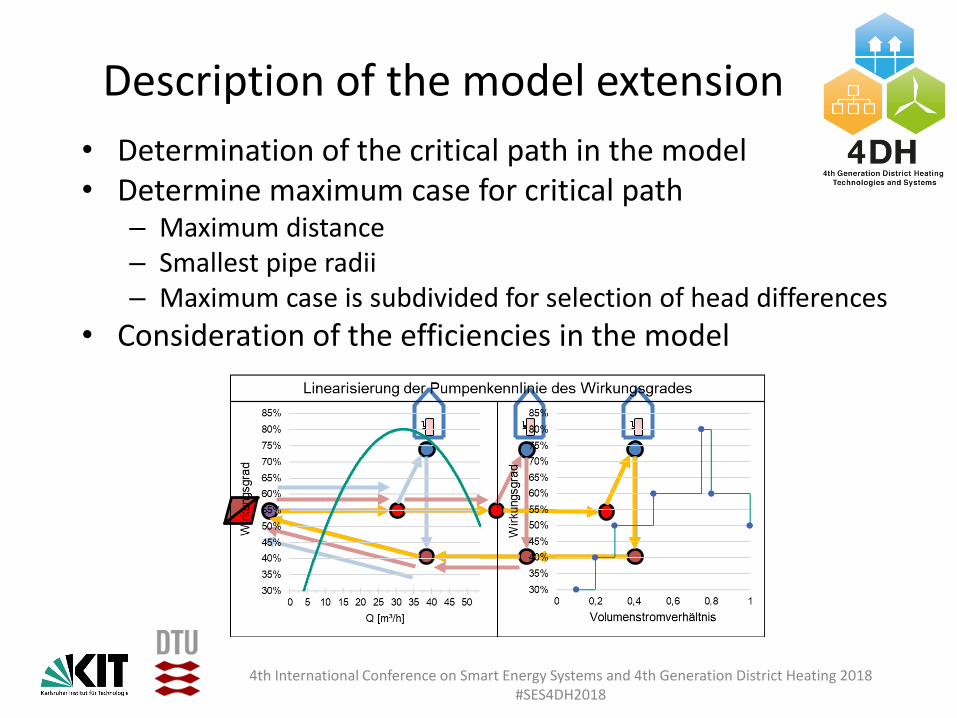
Description of the model extension • Determination of the critical path in the model • Determine maximum case for critical path
– Maximum distance – Smallest pipe radii – Maximum case is subdivided for selection of head differences
• Consideration of the efficiencies in the model
4th International Conference on Smart Energy Systems and 4th Generation District Heating 2018 #SES4DH2018

Validation • Modifications of the model:
– Difference in altitutde – Network course – Load profils
4th International Conference on Smart Energy Systems and 4th Generation District Heating 2018 #SES4DH2018
Properties of the network
Location Böblingen, Germany
Length 2062 m
Connected houses 63
62
63
60
56
39
38
34
35
3637
33
32
31
3029
2826
27
23
25
24
22
19
20
54 53
4755
5748
49
45
46
50
51
52
44
41
40
43
42
17
16
13
15
14
128
9
10
7 65
4
3
2
1
21
11
58
59
31
30
2926
25
16
17
15
1312
10
14
11
9
2420
23
2221
32
18
19
8
7
6
5
33
3
2
1
34
2728
4
61
18
20m

Validation results
4th International Conference on Smart Energy Systems and 4th Generation District Heating 2018 #SES4DH2018
Comparison point Model Existing network
Annual heat losses 7,11% 25%
• Use of smaller pipe diameters in the model • Lower flow temperature in the model • Better insulation in the model
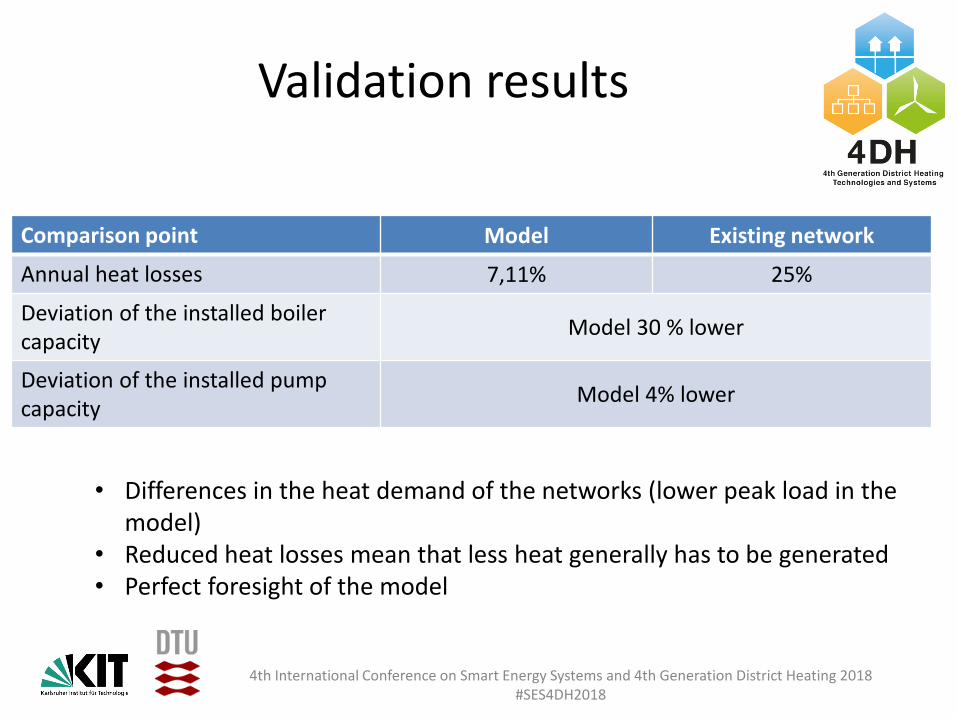
Validation results
4th International Conference on Smart Energy Systems and 4th Generation District Heating 2018 #SES4DH2018
Comparison point Model Existing network
Annual heat losses 7,11% 25%
Deviation of the installed boiler capacity Model 30 % lower
Deviation of the installed pump capacity Model 4% lower
• Differences in the heat demand of the networks (lower peak load in the model)
• Reduced heat losses mean that less heat generally has to be generated • Perfect foresight of the model

Validation results
4th International Conference on Smart Energy Systems and 4th Generation District Heating 2018 #SES4DH2018
Comparison point Model Existing network
Annual heat losses 7,11% 25%
Deviation of the installed boiler capacity Model 30 % lower
Deviation of the installed pump capacity Model 4% lower
Deviation of the annual heat production Model 21 % lower

Validation results: heat flow
4th International Conference on Smart Energy Systems and 4th Generation District Heating 2018 #SES4DH2018
0
50
100
150
200
250
300
350
400
00:0
0:00
01:0
0:00
02:0
0:00
03:0
0:00
04:0
0:00
05:0
0:00
06:0
0:00
07:0
0:00
08:0
0:00
09:0
0:00
10:0
0:00
11:0
0:00
12:0
0:00
13:0
0:00
14:0
0:00
15:0
0:00
16:0
0:00
17:0
0:00
18:0
0:00
19:0
0:00
20:0
0:00
21:0
0:00
22:0
0:00
23:0
0:00
kWh
Zeit [h]
Wärmefluss im Netz für Wintertag mit maximalem Bedarf (Validierungsnetz)
Wärmeverluste Mindestfluss QuartierswärmebedarfSpeicheranteil im Netz Gesamter Wärmefluss Wärmeproduktion des Kessels

Validation results: pump
4th International Conference on Smart Energy Systems and 4th Generation District Heating 2018 #SES4DH2018
0
50
100
150
200
250
300
0
0,5
1
1,5
2
2,5
3
3,500
:00
01:0
0
02:0
0
03:0
0
04:0
0
05:0
0
06:0
0
07:0
0
08:0
0
09:0
0
10:0
0
11:0
0
12:0
0
13:0
0
14:0
0
15:0
0
16:0
0
17:0
0
18:0
0
19:0
0
20:0
0
21:0
0
22:0
0
23:0
0
Qua
rtier
swär
meb
edar
f [kW
h]
Pum
plei
stun
g [k
W]
Zeit [h]
Pumpenbetrieb am maximalen Wintertag
Pumpleistung 2. Pumpe Pumpleistung 1. Pumpe Quartierswärmebedarf

Discussion • Question of over-specification… • Assuming not over-specified:
– Runtime reduction by e.g. decomposition methods – Increase the temporal scope of the model
- currently only 8 days – Consider more technologies – Better pump linearization trough SOS2-Constraints – Consider more realistic plant operating times
– Possibility to allocate individual capacities to the houses
4th International Conference on Smart Energy Systems and 4th Generation District Heating 2018 #SES4DH2018

Summary and Conclusions
• MILP model for DH network layout and operation, given demand sinks and network topology
• Possible to model and compare centralized and decentralized systems (not shown here)
• Validation shows deviations from empirical data are plausible and system operation is realistic
• Further work should improve the pump and plant operation, e.g. part load efficiencies and ramp rates
4th International Conference on Smart Energy Systems and 4th Generation District Heating 2018 #SES4DH2018

Thank you for your attention!
4th International Conference on Smart Energy Systems and 4th Generation District Heating 2018 #SES4DH2018