extended data formatting...
TRANSCRIPT
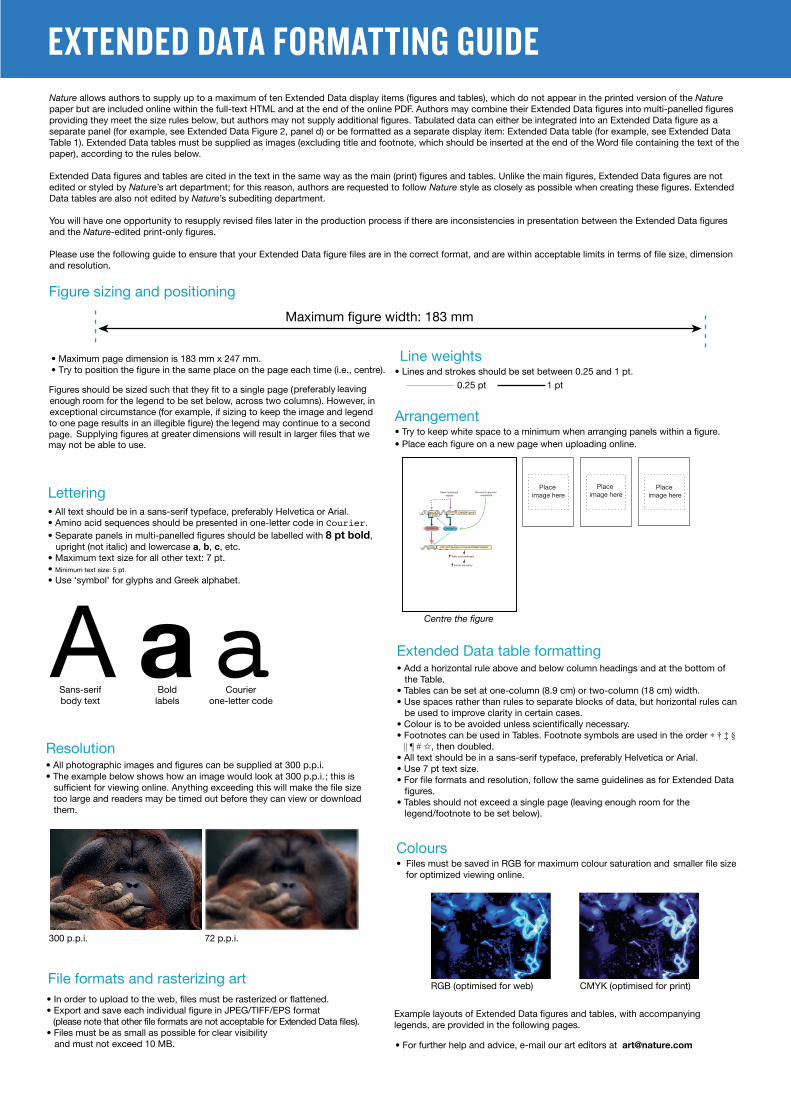
Figure sizing and positioning
• Maximum page dimension is 183 mm x 247 mm.• Try to position the figure in the same place on the page each time (i.e., centre).
Lettering
Line weights• Lines and strokes should be set between 0.25 and 1 pt.
0.25 pt 1 pt
Resolution• All photographic images and figures can be supplied at 300 p.p.i.• The example below shows how an image would look at 300 p.p.i.; this is sufficient for viewing online. Anything exceeding this will make the file size too large and readers may be timed out before they can view or download them.
300 p.p.i.
Arrangement• Try to keep white space to a minimum when arranging panels within a figure.
Colours• Files must be saved in RGB for maximum colour saturation and smaller file size for optimized viewing online.
File formats and rasterizing art
• For further help and advice, e-mail our art editors at [email protected]
Centre the figure
• Place each figure on a new page when uploading online.
Place image here
Place image here
Place image here
CMYK (optimised for print)RGB (optimised for web)
Sans-serifbody text
Boldlabels
Courierone-letter code
Maximum figure width: 183 mm
Nature Nature paper but are included online within the full-text HTML and at the end of the online PDF.
separate panel (for example, see Extended Data Figure 2, panel d) or be formatted as a separate display item: Extended Data table (for example, see Extended Data Table 1). Extended Data tables must be supplied as images (excluding title and footnote, paper), according to the rules below.
edited or styled by Nature’s art department; for this reason, authors are requested to follow NatureData tables are also not edited by Nature’s subediting department.
and the Nature
and resolution.
enough room for the legend to be set below, across two columns). However, inexceptional circumstance (for example, if sizing to keep the image and legend
• All text should be in a sans-serif typeface, preferably Helvetica or Arial.• Amino acid sequences should be presented in one-letter code in Courier.
res should be labelled with 8 pt bold, upright (not italic) and lowercase a, b, c, etc.• Maximum text size for all other text: 7 pt.• Minimum text size: 5 pt.
• Use ‘symbol’ for glyphs and Greek alphabet.
• In order to upload to the web, files must be rasterized or flattened.• Export and save each individual figure in JPEG/TIFF/EPS format
(please note that other file formats are not acceptable for Extended Data files).• Files must be as small as possible for clear visibility and must not exceed 10 MB.
Glucose or glucose metabolite
ChREBP geneExon 1b
Other nutritional signals
ChoRE FAS, ACC (lipogenic enzymes/ChREBP targets)
Fatty acid synthesis
ChREBP-β ChREBP-α
Insulin sensitivty
ChoREExon 1a
• Add a horizontal rule above and below column headings and at the bottom of the Table.• Tables can be set at one-column (8.9 cm) or two-column (18 cm) width. • Use spaces rather than rules to separate blocks of data, but horizontal rules can be used to improve clarity in certain cases.
y.• Footnotes can be used in Tables. Footnote symbols are used in the order ∗ † ‡ § || ¶ # ✩, then doubled. • All text should be in a sans-serif typeface, preferably Helvetica or Arial. • Use 7 pt text size.
resolution, follow the same guidelines as for Extended Data
• Tables should not exceed a single page (leaving enough room for the legend/footnote to be set below).
Extended Data table formatting
legends, are provided in the following pages.
72 p.p.i.
preferably
EXTENDED DATA FORMATTING GUIDE

Glucose or glucose metabolite
ChREBP geneExon 1b
Other nutritional signals
ChoRE FAS, ACC (lipogenic enzymes/ChREBP targets)
Fatty acid synthesis
ChREBP-β ChREBP-α
Insulin sensitivity
ChoREExon 1a
Extended Data Figure 1 | Glucose-mediated activation of ChREBP-α induces expression of ChREBP-β. Glucose or a glucose metabolite stimulates the transcriptional activity of ChREBP-α which binds to ChoREs in its lipogenic targets and in ChREBP-β, resulting in increased gene expression. �e increased ChREBP-β protein further activates expression of ChREBP lipogenic target genes by binding to ChoREs. Whereas glucose
regulates ChREBP-α transcriptional activity, other nutritional signals regulate ChREBP-α expression. Other nutritional signals may also regulate ChREBP-β expression. �e activation of ChREBP-α and induction of ChREBP-β expression increase fatty acid synthesis in adipose tissue, which improves systemic insulin sensitivity.
This is 7pt Helvetica font(sans serif); ourmaximum font size is7pt and minimum is 5pt.
This line is 0.75pt.Our range is between0.25 and 1pt.
LETTERRESEARCH

Extended Data Figure 2 | Summary of 4C-seq data. a, Scatter graph shows that contact probability in the cis-chromosome decreases as a function of distance. Between 100 kb to 10 Mb from the bait, 4C-seq reads show a power law scaling with an exponent of −1.06, R2 = 0.55 (red line depicts its average). �e blue line represents the average contact probability of all baits with trans-chromosomes, from centromere (le�) to telomere (right). �e grey area represents the average maximum and minimum values. b, Scatter plot showing histone acetylation and Igh nuclear contacts as determined by ChIP-seq and 4C-seq,
respectively. �e correlation between the two data sets was calculated by Spearman’s . c, Scatter plot comparing 4C-seq data obtained using Igh as bait in resting (x axis) and activated (y axis) B cells. �e correlation between the two data sets (0.97) was calculated using Pearson’s product correlation coe�cient r. d, Table showing Pearson’s r coe�cient values for the relationship between 4C-seq samples and histone acetylation, PolII, or mRNA. e, Scatter plots showing total 4C-seq reads per chromosome and PolII reads per megabase for c-myc (top, P = 0.0013) or N-myc (bottom, P = 0.14).
N-myc 4C-seq
11
19
17
10
92 57
415
13
8
16618
1
143
Chromosomes
r = 0.36His
tone
ace
tyla
tion
(TP
M)
Igh 4C-seq
r = 0.61
Pol
II (r
ead
s M
b–1
) 10,000
8,000
6,000
4,000
c-myc 4C-seq250 300
11
1917
10
9257
4
12 13
8 166
181
143
Chromosomes
400 450350 500
r = 0.69
c
Histoneactyl. PolII mRNA
10–1
Con
tact
freq
uenc
y
10–2
10–3
10–4
10–5
Distance from bait (nt)
10–6
10–7
Trans
Igh 4C-seq RestB
Igh
4C-s
eq A
ctB
a b
d
e
104 105 106 107 108
T α d–1.06
= 0.93
0.6
0.5
0.4
0.3
0.2
0.1
0.1 0.2 0.3 0.4 0.5 0.6 0.7
Pol
II (r
ead
s M
b–1
) 10,000
8,000
6,000
4,000
200 250 350 400300 450
105
104
103
102
101
100
100 101 102 103
4C-seq
Igh
c-myc
N-myc
Act. BAct. B αHEL
Rest. BAct. BRest. BAct. BRest. B
0.61*0.650.570.520.470.120.16
0.610.630.560.500.440.140.14
0.620.640.590.510.460.160.13
*Pearson’s r values
Add a horizontal rule above and below column headingsand at the bottom of the table. Colour is avoidedunless scienti�cally necessary
Cis
LETTER RESEARCH
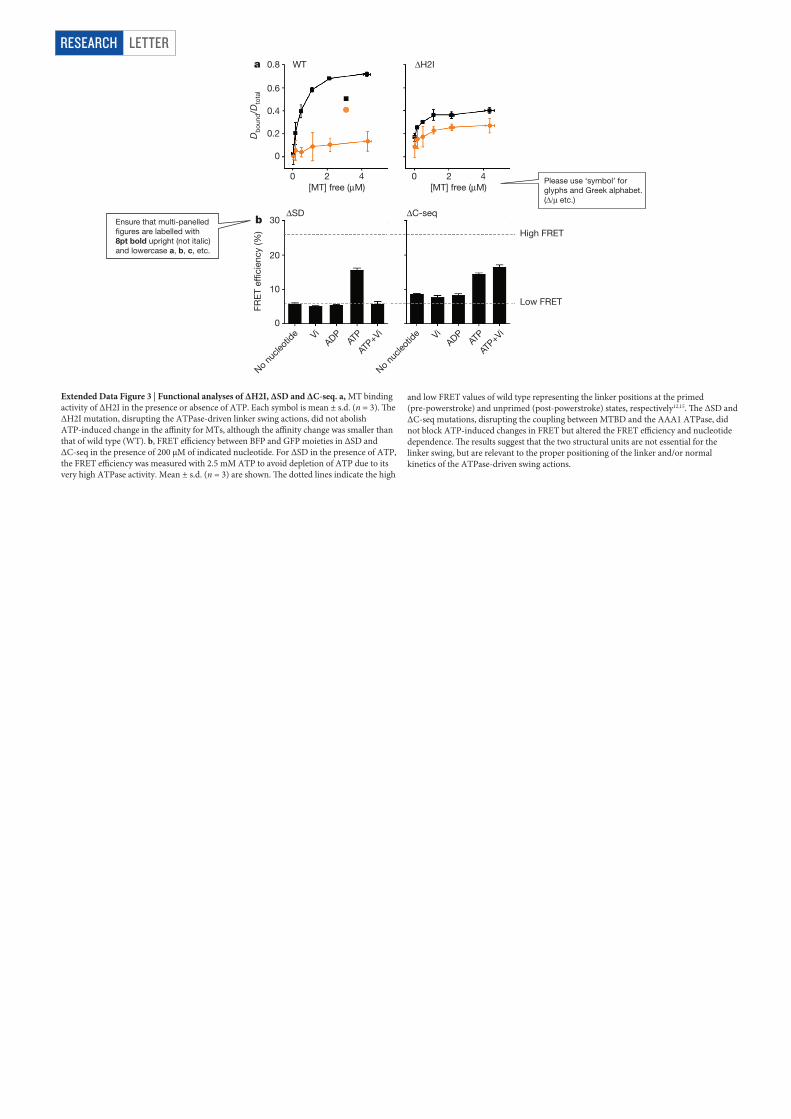
Extended Data Figure 3 | Functional analyses of ΔH2I, ΔSD and ΔC-seq. a, MT binding activity of ΔH2I in the presence or absence of ATP. Each symbol is mean ± s.d. (n = 3). �e ΔH2I mutation, disrupting the ATPase-driven linker swing actions, did not abolish ATP-induced change in the a�nity for MTs, although the a�nity change was smaller than that of wild type (WT). b, FRET e�ciency between BFP and GFP moieties in ΔSD and ΔC-seq in the presence of 200 μM of indicated nucleotide. For ΔSD in the presence of ATP, the FRET e�ciency was measured with 2.5 mM ATP to avoid depletion of ATP due to its very high ATPase activity. Mean ± s.d. (n = 3) are shown. �e dotted lines indicate the high
and low FRET values of wild type representing the linker positions at the primed (pre-powerstroke) and unprimed (post-powerstroke) states, respectively12,15. �e ΔSD and ΔC-seq mutations, disrupting the coupling between MTBD and the AAA1 ATPase, did not block ATP-induced changes in FRET but altered the FRET e�ciency and nucleotide dependence. �e results suggest that the two structural units are not essential for the linker swing, but are relevant to the proper positioning of the linker and/or normal kinetics of the ATPase-driven swing actions.
0.8
0.6
0.4
0.2
0
WT ΔH2I
0 2 4[MT] free (μM)
0 2 4[MT] free (μM)
ΔSD ΔC-seq
High FRET
Low FRET
30
20
10
0
Db
ound
/Dto
tal
FRE
T ef
�cie
ncy
(%)
No nu
cleot
ide ViADP
ATP
ATP+Vi
No nu
cleot
ide ViADP
ATP
ATP+Vi
a
bEnsure that multi-panelled�gures are labelled with8pt bold upright (not italic) and lowercase a, b, c, etc.
Please use ‘symbol’ forglyphs and Greek alphabet.(Δ/μ etc.)
LETTERRESEARCH
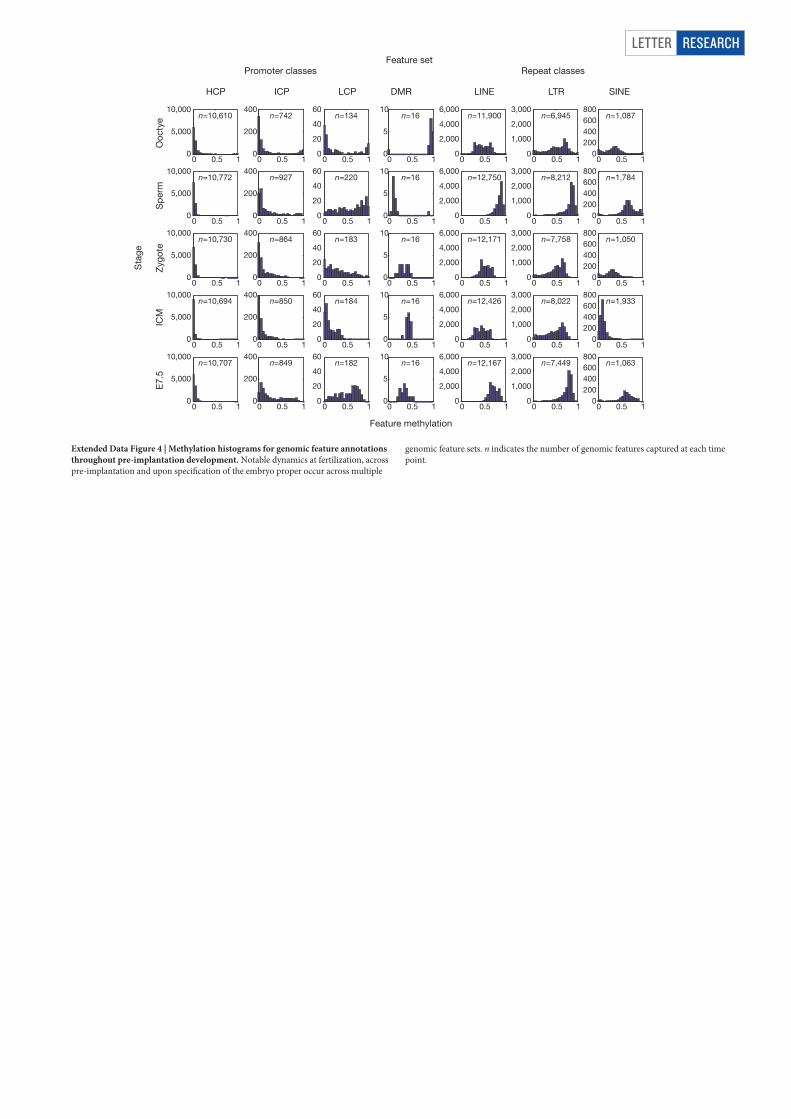
Extended Data Figure 4 | Methylation histograms for genomic feature annotations throughout pre-implantation development. Notable dynamics at fertilization, across pre-implantation and upon speci�cation of the embryo proper occur across multiple
genomic feature sets. n indicates the number of genomic features captured at each time point.
Ooc
tye
Sp
erm
Zyg
ote
ICM
E7.
5
HCP ICP LCP DMR LINE LTR SINE
Feature methylation
Sta
ge
Feature setPromoter classes Repeat classes
0 0.5 10
5
10n=16
0 0.5 10
5
10n=16
0 0.5 10
5
10n=16
0 0.5 10
5
10n=16
0 0.5 10
5
10n=16
0 0.5 10
5,000
10,000n=10,610
0 0.5 10
5,000
10,000n=10,772
0 0.5 10
5,000
10,000n=10,730
0 0.5 10
5,000
10,000n=10,694
0 0.5 10
5,000
10,000n=10,707
0 0.5 10
200
400n=742
0 0.5 10
200
400n=927
0 0.5 10
200
400n=864
0 0.5 10
200
400n=850
0 0.5 10
200
400n=849
0 0.5 10
20
40
60n=134
0 0.5 10
20
40
60n=220
0 0.5 10
20
40
60n=183
0 0.5 10
20
40
60n=184
0 0.5 10
20
40
60n=182
0 0.5 10
200400600800
n=1,087
0 0.5 10
200400600800
n=1,784
0 0.5 10
200400600800
n=1,050
0 0.5 10
200400600800
n=1,933
0 0.5 10
200400600800
n=1,063
0 0.5 10
2,000
4,000
6,000n=11,900
0 0.5 10
2,000
4,000
6,000n=12,750
0 0.5 10
2,000
4,000
6,000n=12,171
0 0.5 10
2,000
4,000
6,000n=12,426
0 0.5 10
2,000
4,000
6,000n=12,167
0 0.5 10
1,000
2,000
3,000n=6,945
0 0.5 10
1,000
2,000
3,000n=8,212
0 0.5 10
1,000
2,000
3,000n=7,758
0 0.5 10
1,000
2,000
3,000n=8,022
0 0.5 10
1,000
2,000
3,000n=7,449
LETTER RESEARCH

Extended Data Table 1 | Phosphate release rates from the wild type and the doubleWalker-B mutants
Dynein
+MT–MT
kobs(burst)
(s–1)
ksteady
(s–1)
kobs(burst)
(s–1)
ksteady
(s–1)
Wild-type HFB380 59.3 ± 4.9
E2027Q/E2745Q/E3075Q nm
E2745Q/E3075Q 6.0 ± 0.8
E2027Q/E3075Q 67.6 ± 8.5
E2027Q/E2745Q 52.5 ± 4.5
nm nm nm
�e apparent phosphate burst rate constants (kobs(burst)) and steady-state rate constants (ksteady) in the presence (+MT) or absence (−MT) of 20 μM MTs are shown as mean ± s.d. of three independent measurements. nm, not measurable.
3.9 ± 0.3 nm 31.6 ± 3.1
1.2 ± 0.1 9.4 ± 1.8 2.8 ± 0.3
0.16 ± 0.02 52.6 ± 2.3 0.20 ± 0.07
0.6 ± 0.2 48.4 ± 6.4 0.77 ± 0.05
For tables please use asans-serif font such as Helvetica or Arial at 7pt.
Add a horizontal rule above and below column headingsand at the bottom of the table. Colour is avoidedunless scienti�cally necessary.
LETTERRESEARCH