expt 1 laboratory instruments - portland state universityweb.cecs.pdx.edu/~jmorris/ece241/ece241...
TRANSCRIPT
ECE 241L Fundamentals of Electrical Engineering _____________________ NAME Experiment 1 Laboratory Instruments _____________________ PARTNER A. Objectives: I. Use the MASTECH M9803R Digital Volt-Ohm Meter (DVM) for resistance measurements,
and observe the distribution of resistor values about nominal. II. Learn the controls of the Tektronix PS2520G Power Supply, and the use of the MASTECH
M9803R Digital Volt-Ohm Meter (DVM) for DC voltage measurements. III. Learn the controls of the Tektronix AFG310/320 Function Generator, and the use of the
MASTECH M9803R Digital Volt-Ohm Meter (DVM) for AC voltage and frequency measurements.
IV. Learn the use of the Tektronix TDS3043 Digital Storage Oscilloscope (DSO) for AC and DC voltage measurements with arbitrary shape waveforms, and for time/frequency measurements.
B. Equipment: Power Supply: Tektronix PS2520G Digital Volt-Ohm Meter (DVM): MASTECH M9803R (or Fluke 189 or Tektronix equivalent) Function Generator: Tektronix AFG310/320 Arbitrary Function Generator Oscilloscope: Tektronix TDS3043 Digital Storage Scope BNC connector lead-set, including BNC “tee-connector” and 50Ω load termination. Package of 20 resistors of the same nominal value. C. Introductory Notes: Measurement of Voltage Measurements on electric circuits usually are concerned with voltage, rather than current or resistance. The primary reason is that a voltmeter can be connected without disturbing the circuit to be measured. There are two important concepts for the student to know: (1) The most important concept is that voltage is measured between two points. (2) Furthermore, the polarity of the voltage must be measured in terms of one point relative to the other. Voltmeter terminals are conventionally marked +/- and color coded red/black. If the red terminal is connected to the positive end of a source while the black terminal is connected to the negative end, the meter reads positive. If the connections are reversed, the meter reads negative. . Measurement of Current In order to measure current the circuit must be broken open and the ammeter inserted at the break. An ideal ammeter has zero internal resistance. For this reason extreme caution must be used in connecting an ammeter in a circuit. If the meter is accidentally or incorrectly connected between the terminals of a voltage source, Ohm's Law results in a theoretically infinite current ("short circuit") through the meter. A real meter would be destroyed by this current. In practice, current is only rarely measured directly with an ammeter. Normally voltage is measured across a known resistance and the current is calculated from Ohm's Law. However, the Power Supply used in this experiment has a built in ammeter that can be used for approximate measurements of current. Measurement of Resistance In order to measure resistance, there are precautions that must be taken. There must not be any voltage in the circuit, and the resistance to be measured must be isolated from the rest of the circuit. An ohmmeter in fact consists of a small voltage source combined with a sensitive ammeter. Therefore, no other source of voltage or current can be allowed to be connected to the resistance to be measured. Before making any resistance measurements on a circuit, first measure voltage to be sure the circuit is dead. Furthermore, if several resistances are connected in a circuit, the resistance to be measured must be electrically isolated

from the others so that they do not contribute to the value being measured. Standard Resistor Values Resistance is a property of a circuit element. A resistor is a circuit element designed to have a known resistance. Commercial resistors are commonly available only in certain standard values. The values are standardized in logarithmic increments such that the ratio of any two adjacent values is a constant. The resistors used in this experiment are based on a series of values, each of which is approximately 50% greater than the next smaller value (or correspondingly 67% of the next larger value). A decade (factor of 10 ratio) of resistance is therefore spanned by 6 resistors of value 1.5n for 0 < n < 6. The standard values are rounded off to two significant figures: 1.0, 1.5, 2.2, 3.3, 4.7, 6.8, 10, 15, 22, etc. Resistors are too small in physical dimensions to print the resistance value on, so a standard color code is used to paint bands on the resistors. The code consists of three bands d-d-m. Bands d-d are the two significant digits, and band -m is the decimal multiplier 10m. The colors consist of the rainbow Red, Orange, Yellow, Green, Blue, Violet for the digits 2 through 7 with Black, Brown for 0,1 and Grey, White for 8,9. Various mnemonics (memory aids) and acronyms have been devised to help the user recall the code. One scheme is to memorize the fact that the "primary colors" Red, Yellow, Blue correspond to 2, 4, 6. Invent your own mnemonic, but be forewarned that you will be expected to remember the color code in an exam. Most resistors you will encounter in these experiments will be in the range of Kilo-Ohms, such as 6.8K which would be marked Blue, Grey, Red. Resistance values on circuit diagrams are always given in units with standard S.I. prefixes such as Kilo and Mega. There is also a 4th band that indicates the "tolerance". Standard tolerances are 5%, 10%, and 20% marked as Gold, Silver, and No Band. A 100 Ω (ohm) resistor with 20% tolerance may actually have resistance any where between 80 and 120 ohms. The tolerance must be taken into account when designing electronic circuits, especially for mass-produced commercial products. Standard resistors can be combined in series or parallel to achieve resistances between the standard values.
0 1 2 3 4 5 6 7 8 9 Black Brown Red Orange Yellow Green Blue Violet Grey White
Electronic Power Supply A typical electrical source is a battery. However, a battery is not an ideal voltage source because if current is drawn from the battery the voltage will become less as more current is drawn. An "ideal voltage source" can be closely approximated by an electronic power supply in which the output voltage is regulated to be constant, regardless of the amount of current that is drawn (up to the current limit). The Power Supply used in this experiment has three sources marked +6V, +20V, -20V. The +20V and -20V sources may be internally coupled and controlled together with a single TRACKING adjustment. There is also a CURRENT LIMIT control that simulates an "ideal current source" (up to the voltage limit). The Current Limit control should normally be set to maximum, unless you are otherwise instructed. The Power Supply has a meter to read voltage and another meter to read current. The scales to be used on the meters are selected by push buttons. The output of only one supply can be read at any given setting. Electronic Volt-Ohm Meter The Volt-Ohm Meter (VOM) has buttons to select [DC/AC], [VOLTS], [AMPS], and [OHMS]. There are also buttons to set the range of values to be measured. It is good experimental practice when measuring an unknown voltage to set the range at the highest value to begin, and then to step down the range until the maximum accuracy is obtained. If the circuit voltage exceeds the range scale of the VOM the meter has a display to alert the user that the selected range has been exceeded. Measuring Current Polarity When considering the current in a circuit, a conventional notation is to draw an arrow beside a "wire" in the region between the elements. The terminals of an ammeter are conventionally marked +/- rather than with an arrow. If the circuit were to be "broken open" and an ammeter inserted between the broken ends to complete the circuit, the meter would be connected with its + terminal at the tail of the arrow. in other words, positive current flows into the + terminal of an ammeter to cause the meter to read positive. In
practice, current is rarely actually measured with an ammeter. Normally current is calculated by measuring the voltage across a known resistance. A small resistance is sometimes built into a circuit, the only purpose for the resistor being to facilitate the measurement of current. The voltage across this monitor resistance should be negligibly small compared to any other voltages of interest in the circuit. Measuring Voltage Polarity A useful interpretation is to think of the +/- voltage marked across an element as the red/black wires from a "voltmeter". If the polarity of the red wire is positive with respect to the black wire, the meter reads positive voltage. If both wires of the meter are connected to the same point, such as the junction between the resistances, it will read zero. Therefore a single point in the circuit cannot be said to be either positive or negative by itself. The voltage must be referred to some other point. It is conventional to designate a common reference point (COM) for voltages. The reference is usually called ground (GND) on circuit diagrams. Short Circuit Current If all resistances are zero, a "short circuit" condition results. The current between the nodes is determined only by the "ideal current source". An ideal current source is relatively rarely encountered in practice, unless artificially generated by a specially designed electronic power supply with a current limit control. Nevertheless ideal current sources can be employed theoretically to great advantage in the analysis of circuits. Open Circuit Voltage. If all resistances in parallel are infinite, an "open circuit" condition results. If the source is an ideal current source, the voltage at the open circuit would be infinite according to Ohm's Law. Therefore theoretically an ideal current source cannot be connected to an open circuit, or a logical inconsistency results. Function Generator The Tek AFG320 function generator (FG) is used to supply time dependent test voltages and currents. Typical waveform shapes used to test circuits are sinusoids, square waves, triangle waves, “sawtooth waves”. Other, more complex waveforms may also be used for special purposes. A sine wave is probably the most common test signal used. Oscilloscope Oscilloscopes are tools that allow engineers to view signals graphically. The oscilloscope, often just called the scope, displays the signals as a plot of magnitude versus time. There are two types of oscilloscopes: analog and digital. Analog oscilloscopes use a cathode ray tube and display the signal much like a television set displays an image. Digital oscilloscopes sample the signals digitally and are more flexible in how they display, manipulate, and store the signals The objective of this experiment is to develop familiarity with the standard laboratory instruments, which will be used routinely and without further instruction in the following experiments. You are strongly recommended to spend some time before beginning the formal procedures of all later experiments to review the following sections on the instruments. Before beginning, make sure you can get the appropriate waveforms from the FG, (setting frequency and amplitude,) and that you can observe them and measure the parameters of interest (voltages and times) on the DSO. Also, read the information provided on Laboratory Safety before beginning the Procedure.
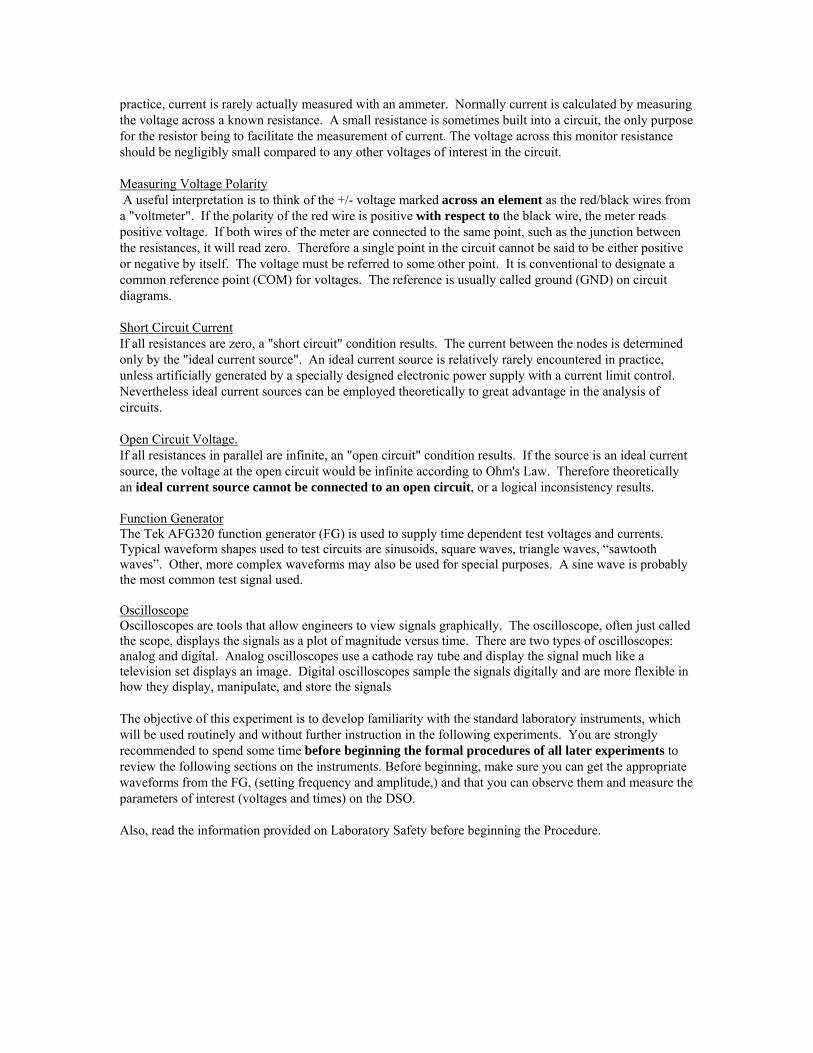
MASTECH M9803R TRUE RMS DIGITAL MULTIMETER
The digital multimeter can be used to measure DC voltage and current, AC voltage and current, resistance and capacitance. The letters DC stand for direct current and generally means the current (or voltage) does not change over time. The letters AC stand for alternating current generally means the current (or voltage) varies sinusoidally over time. You will be introduced to AC circuit analysis later in the term. For now you should recognize that the DMM can be used to measure DC and AC signals.
Digital Multimeter Front Panel
OPERATION BASICS • Allow the meter to stabilize for 30 seconds after power up. • Remove test leads from circuit under test before disconnecting the leads from the meter. • Always disconnect power from circuit under test before measuring resistance, capacitance, or
continuity. • Discharge capacitors before taking capacitance measurements. • When making voltage measurements, place the leads in parallel with (across) the circuit element. A
circuit element may be a resistor, capacitor, inductor, power supply, or any other 2-terminal element in an electric circuit.
• When making current measurements, place the leads in series with the circuit element (so the current flows through both the circuit element and the meter leads.)
• When making resistance or capacitance measurements, or testing diodes for device in a larger circuit, the device should be “isolated” from the circuit by disconnecting one of the leads of the device from the circuit, and making appropriate connections across the device being tested. This insures that the test current applied by the meter flows only through the device under test, and not through other parallel paths through the circuit.
• When measuring a voltage or current when you are unsure about the approximate magnitude, always start measuring on the highest voltage or current range and go to lower ranges if needed.
Blue Function button: Alternates Resistance/Continuity, Frequency/ADP, DC/AC mA or Amp Range: Manually change ranges (Hold >1sec to retrun to autoranging) Yellow button: Backlight
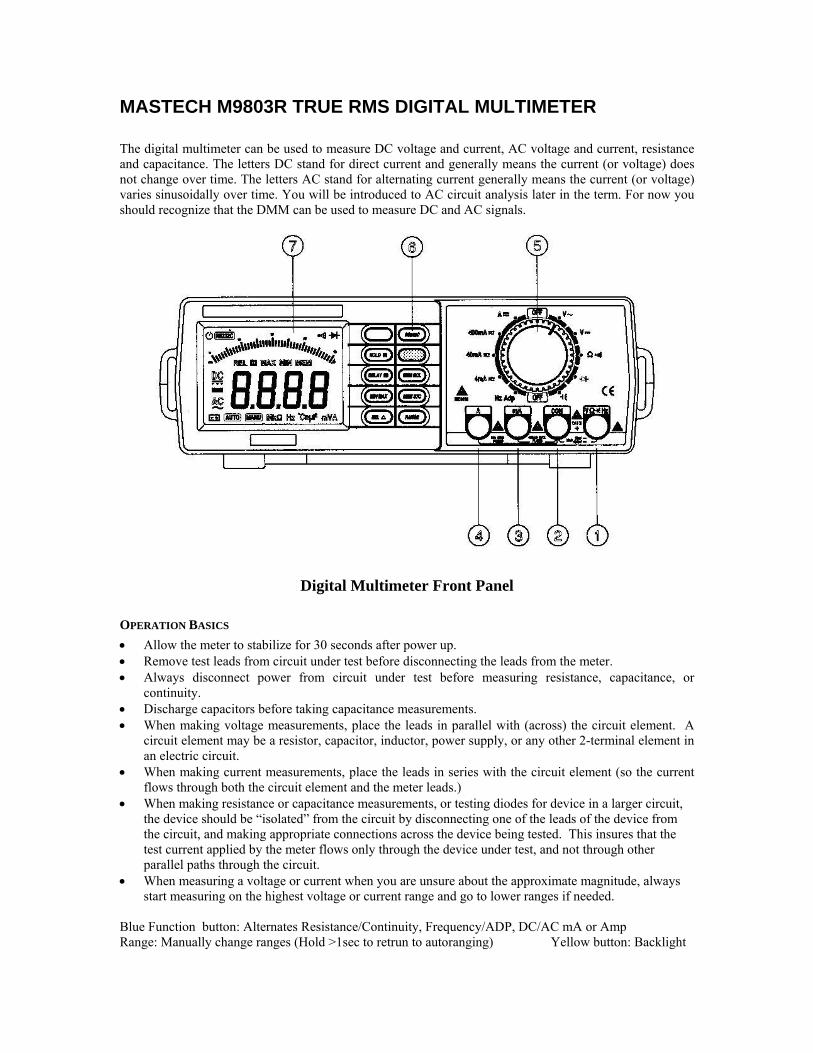
Note: When using the DVM, NEVER just switch through the range or function settings with either the DVM or circuit power on. Each of these has an internal circuit configuration which is switched into the circuit. The most common effect is that the DVM fuse is “blown” by switching through the current ranges, often without the perpetrator realizing that he/she may have damaged the instrument so it cannot be used by the next student group. Misuse of the current ranges can also blow the fuse. We will often deduce current values from voltage measurements. There are also some Flike 189 and Tektronix Tx1 digital multimeters in the lab. Operation of these is similar, except the Fluke does not have a frequency measurement mode. INPUT CONNECTORS There are four input connectors on the digital multimeter. The second from the right connector (2), COM, is the common terminal and is often connected to ground. The voltage read by the meter uses this terminal as a reference, regardless of the type of measurement being taken. The connectors on the left, labeled 10A (4) and mA (3) are for amps, they are used to measure current. The connector on the right, labeled V (1) at the start is for volts, is used to measure voltage, resistance, diodes and capacitance. MAKING MEASUREMENTS
Connect probes with positive lead in input connector V Turn measurement function knob to V DC (1) (2 o’clock on meter). Apply power to circuit under test Place one lead at each end of the circuit element to measure the voltage drop across the circuit element

AC and DC current measurements: (a) over 400mA (above↑) & (b) under 400mA (below↓)
Steps to measure DC or AC mA current (400mA max): Connect probes with positive lead in input connector mA. Turn measurement function knob to 400mA (1) (10 o’clock on meter). Apply power to circuit under test. Place leads in series with circuit element to measure the amount of current that is passing through the circuit element.
Caution: Measurements of DC and AC Current over 400 mA should be made with the Red lead inserted into the 10A jack. The mA jack is protected by a smaller value fuse. Note also switch positions.
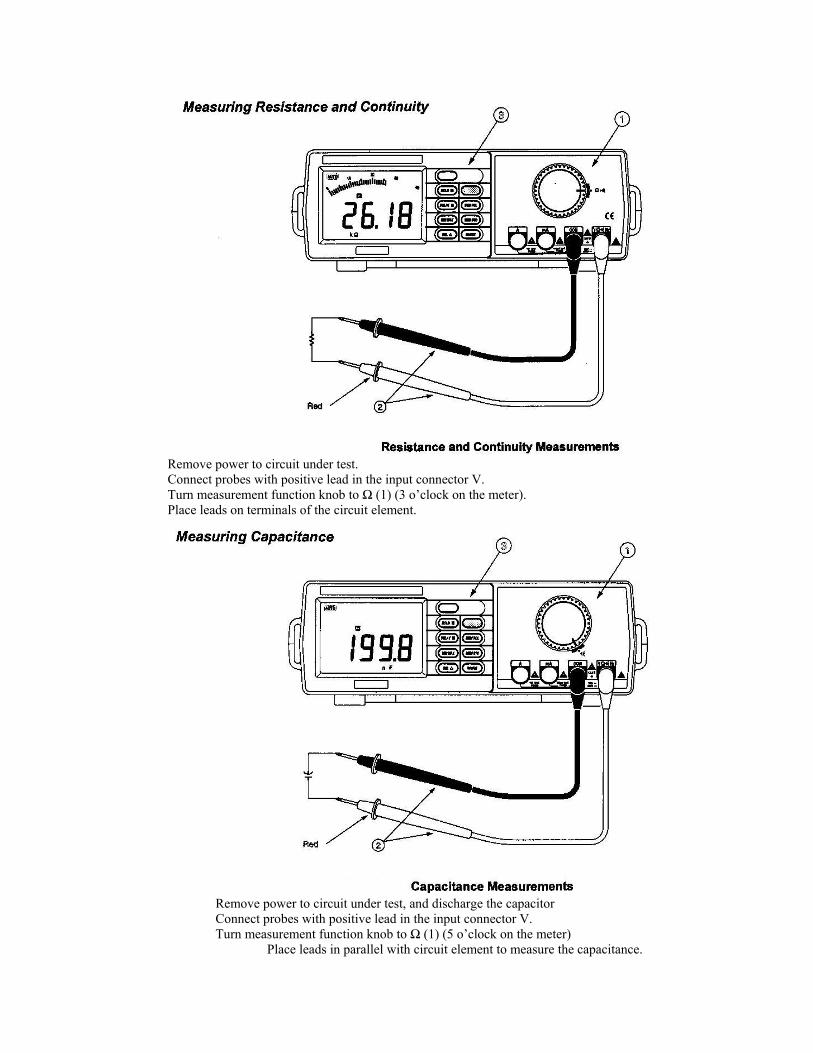
Remove power to circuit under test.
Connect probes with positive lead in the input connector V. Turn measurement function knob to Ω (1) (3 o’clock on the meter). Place leads on terminals of the circuit element.
Remove power to circuit under test, and discharge the capacitor
Connect probes with positive lead in the input connector V. Turn measurement function knob to Ω (1) (5 o’clock on the meter)
Place leads in parallel with circuit element to measure the capacitance.
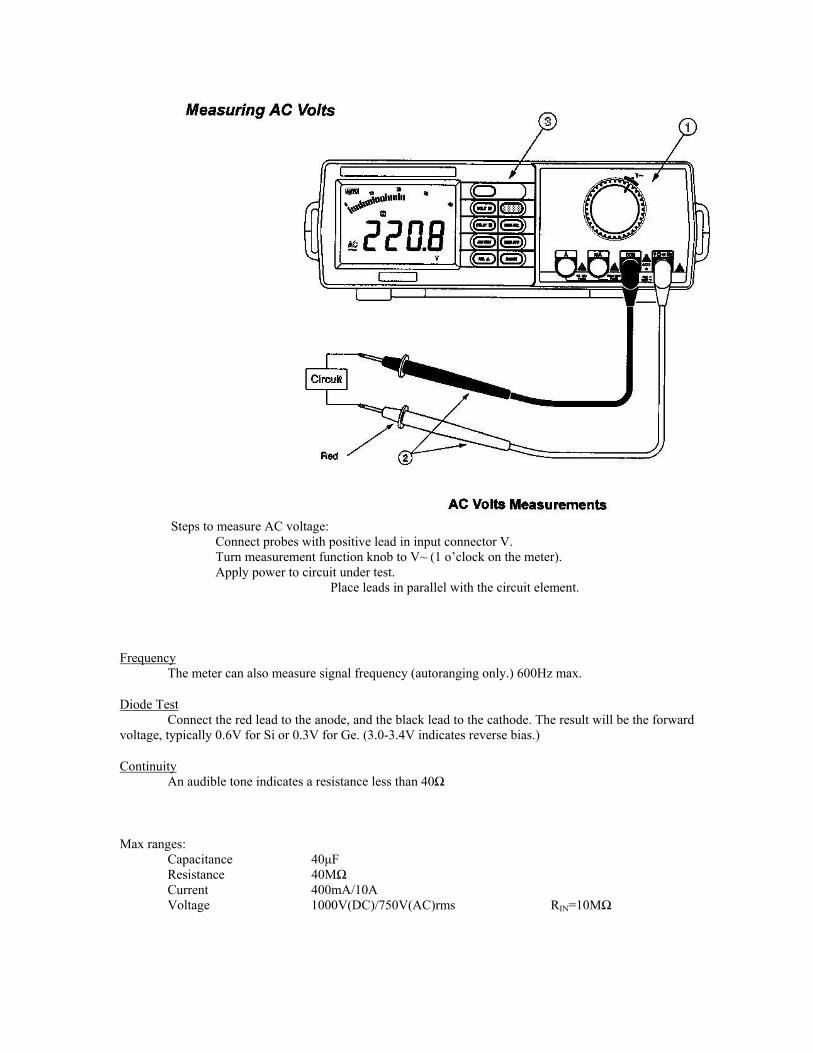
Steps to measure AC voltage: Connect probes with positive lead in input connector V. Turn measurement function knob to V~ (1 o’clock on the meter). Apply power to circuit under test.
Place leads in parallel with the circuit element.
Frequency The meter can also measure signal frequency (autoranging only.) 600Hz max.
Diode Test Connect the red lead to the anode, and the black lead to the cathode. The result will be the forward voltage, typically 0.6V for Si or 0.3V for Ge. (3.0-3.4V indicates reverse bias.)
Continuity An audible tone indicates a resistance less than 40Ω
Max ranges: Capacitance 40μF Resistance 40MΩ Current 400mA/10A Voltage 1000V(DC)/750V(AC)rms RIN=10MΩ

TEK PS2520G PROGRAMMABLE POWER SUPPLY
The Tek PS2520G programmable power supply is used to supply DC voltage and current. The controls of the power supply are shown in the figure below. The PS2520G power supply has 3 different outputs: output 1, output 2, and output 3. When referring to a specific output, we will use OUT1, OUT2 and OUT3. When referring to any one of the three outputs, we will simply use OUT. OUT1 and OUT2 are often used in “tracking mode,” (described below,) for example as equal positive and negative op-amp supply voltages. OUT3 is often used for +5volt digital logic supplies.
SETTING UP THE POWER SUPPLY
The following steps are used to setup the power supply for general operation:
1. Turn power supply on. 2. Select output to configure by pressing SHIFT ⇒ OUT, (e.g. OUT1 for the left-hand terminals.) (SHIFT selects the “blue” functions) 3. Set voltage limit (described below). 4. Set current limit (described below). 5. Connect lead from selected output to circuit under test.
Enable outputs by pressing OUTPUT. (If no circuit is connected, the current reading goes to 0.00.)
PS2520G Power Supply
Setting Voltage and Current Limits
Each of the three outputs can be configured to produce a constant (DC) voltage with a user-specified current limit or a constant (DC) current with a user-specified voltage limit. The following steps describe how to set these limits.
1. Select output to configure by pressing SHIFT ⇒ OUT. 2. Using the keypad, press VOLTS SET ⇒ <value> ⇒ ↵. 3. Select output to configure by pressing SHIFT ⇒ OUT. 4. Using the keypad, press CURRENT SET ⇒ <value> ⇒ ↵.
Whether the power supply acts like a voltage source or current source depends on the voltage-current relationship of the load. If the load resistance is greater than the voltage limit divided by the current limit, then the power supply acts as a voltage source, and supplies only the current needed to maintain the specified voltage. Otherwise, it acts as a current source, and will supply a voltage below the specified value.
For example, suppose you configure the power supply to have a voltage limit of 4.2 V and a current limit of 0.03 A. If the load resistance is 200 Ω, then the power supply acts like a voltage source since 200 Ω is greater than 4.2/0.03 = 140 Ω. The current drawn by the load will be 21 mA, which is below the specified current limit of 30 mA. If the load were 100 Ω, the power supply would operate in current limited mode, supplying 30 mA, at 3.0 V.
Alternate Method to Adjust Voltage and Current
The voltage and current limits can also be adjusted by pressing the step up (↑) and step down (↓) keys on the output control panel. The amount that the voltage or current limiting values change is determined by the STEP SET function. The change in voltage and current limits are set independently of each other.
The voltage step is changed by pressing STEP SET ⇒ VOLTS SET ⇒ <value> ⇒ ↵. Likewise, the current step is changed by pressing STEP SET ⇒ CURRENT SET ⇒ <value> ⇒ ↵.
TRACKING
There may be times when you will need to connect 2 of the outputs together in series or parallel. This can be done internally with OUT1 and OUT2. OUT2 (the master output) sets the OUT1 (the slave output) settings to match those of OUT2, hence the term tracking.
WARNING: NEVER EXTERNALLY CONNECT ANY OUTPUT IN SERIES OR PARALLEL WITH ANOTHER.
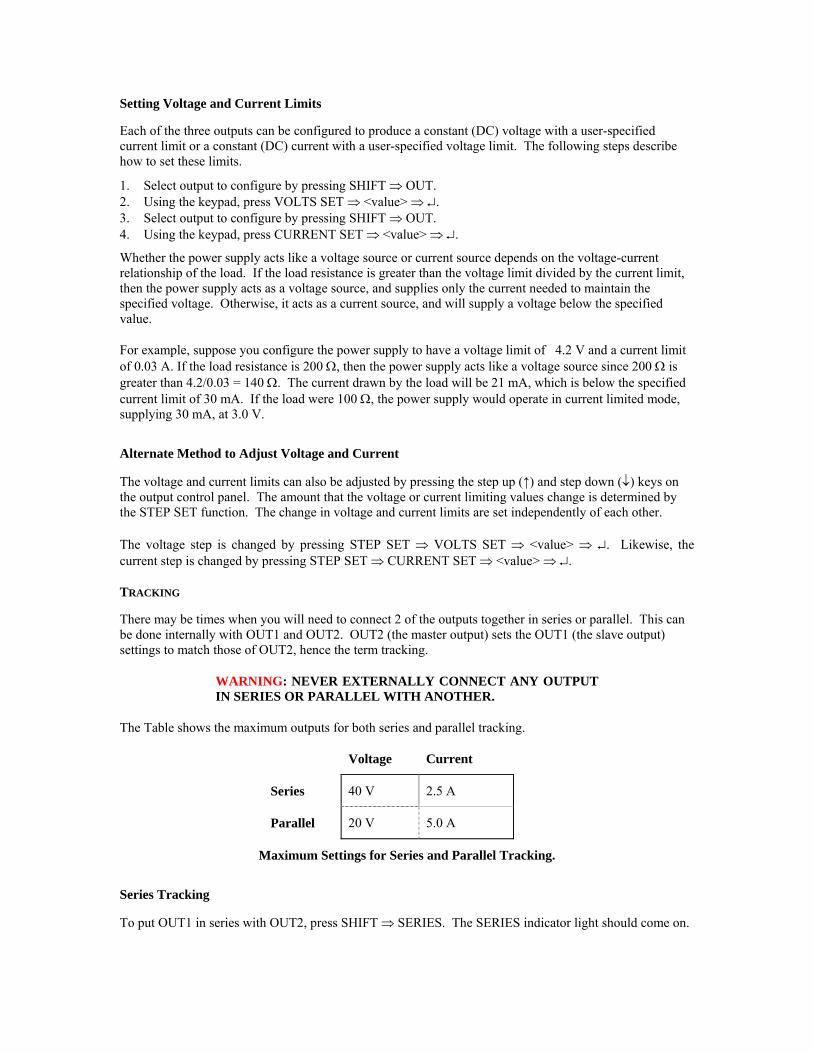
The Table shows the maximum outputs for both series and parallel tracking.
Voltage Current
Series 40 V 2.5 A
Parallel 20 V 5.0 A
Maximum Settings for Series and Parallel Tracking.
Series Tracking
To put OUT1 in series with OUT2, press SHIFT ⇒ SERIES. The SERIES indicator light should come on.

When in series tracking mode, use the OUT2 settings to control the power to the circuit under test. Since OUT1 and OUT2 are in series, the OUT2 voltage should be set to half of the total output desired. The current setting for OUT2 controls the maximum current available to the load.
Parallel Tracking
To put OUT1 in parallel with OUT2, press SHIFT ⇒ PARA. The PARA indicator light should come on.
When in parallel tracking mode, use the OUT2 setting to control the power to the circuit under test. Since OUT1 and OUT2 are in parallel, the current setting for OUT2 should be half of the total current desired. The voltages across each output are the same and are controlled by the OUT2 settings.
Circuit Connections in Tracking Mode While in series or parallel tracking mode, the circuit under test is connected using the negative lead of OUT1 and the positive lead of OUT2.
SHIFT ⇒ INDEP takes the PS out of tracking mode.

TEK AFG320Arbitrary Function Generator The controls of the function generator are shown below and on the next page. The function generator has 2 different outputs: Out 1 and Out 2. (The AFG310 has only one output.)
The AFG320 Arbitrary Function Generator

The AFG320 Arbitrary Function Generator

TYPICAL WAVEFORMS
Along with the familiar sine waveform, you will be working with other types of waveforms. The most common are the square, triangle, and ramp (sawtooth) waves, as are seen below. The function generator can also simulate noise.
Various Waveforms Generated with Function Generator.
When the function generator powers up, both channels default to a sine wave with amplitude of 1VP-P and a frequency of 100kHz.
ADJUSTING THE FUNCTION GENERATOR SETTINGS
It is very rare that you will want to use the initial values of the function generator. All of the default settings can be manually set to any value within the limits of the equipment. You do not need to concern yourself with the limitations because all lab settings (after this lab) will be within the operating limits of all the lab equipment. All adjustments are made with the buttons on the control panel.
Adjusting Frequency
The following steps outline the procedure for adjusting the frequency:
1. Press CH to toggle between channels. 2. Press FREQ. 3. Use the keypad to enter desired value. 4. Press appropriate unit key or press ENTER (pressing ENTER uses the default units of kHz).

Adjusting Amplitude
The follow steps outline how to adjust the amplitude:
1. Press CH to toggle between channels. 2. Press AMPL. 3. Use the keypad to enter desired value. 4. Press appropriate unit key or press ENTER (pressing ENTER uses the default units of volts).
Adding a DC Offset
A DC offset is a DC voltage that is added to a zero mean AC wave. This has the same effect as adding a constant value to the AC source.
The following steps outline how to add a DC offset to a waveform:
1. Press CH to toggle between channels. 2. Press OFFSET. 3. Use the keypad to enter desired value. 4. Press appropriate unit key or press ENTER (pressing ENTER uses the default unit of volts).
Oscilloscope The oscilloscope is generally the most useful instrument for electronic measurements. It displays voltage as a function of time so that the waveform can be observed and measured. The display is presented to the user on the face of a special vacuum device called a "cathode ray tube", developed from the original experiments done by English physicist Joseph John Thomson in 1897. At that time the electron had not yet been discovered and glowing streams of light emanating from a negatively charged electrode in an evacuated glass tube were referred to as "cathode rays". The light was caused by streams of accelerated electrons colliding with molecules of residual gas in the imperfectly evacuated tube. In its modern form the electron beam itself is invisible because the vacuum is much better. The inside surface of the flat end of the tube is coated with a phosphorescent material that glows when struck by the electron beam. The beam makes a bright spot that moves across the display when the beam is deflected by electrodes in the "neck" region of the tube. Two sets of electrodes are provided, one for horizontal deflection and one for vertical. In a conventional "analog" scope the horizontal deflection sweeps the beam at constant speed across the screen from left to right. The voltage to be measured is connected to the vertical deflection electrodes, normally upward deflection for positive voltage and downward for negative voltage. The sweep is synchronized with the wave so that the same pattern repeats rapidly, and due to the persistence of vision of the human eye appears as a stationary trace on the screen. Therefore an a-c sine wave generates the typical "lazy S" pattern. Both the horizontal and vertical deflections are calibrated so that the period of the sinusoidal wave and the peak-to-peak voltage can be measured from the screen. Most modern scopes are also "dual trace" so that two time-varying voltages can be displayed at the same time and compared.
The latest form of scope is the Digital Storage Scope. The display is in the form of a "raster" (a rectangular area on the screen created with hundreds of closely spaced parallel lines of "pixels", as in a TV). The voltage data is sampled many times per second, digitized and stored in a memory. The stored data is then plotted on the screen from sample to sample as a graph of voltage vs. time. A digital storage scope has an advantage over an analog scope for slowly varying voltages, where an analog trace appears as a single slowly moving spot rather than a continuous curve. Digital storage is also very effective in capturing single events that do not repeat. However the sampling of the data in a digital storage scope causes a stroboscopic effect for rapidly varying voltages called "aliasing", equivalent to automobile wheels appearing to rotate backward on a TV. Digital scopes have an automatic analysis capability to assist the user in avoiding the aliasing condition. Digital scopes also provide mathematical operations such as converting period into frequency.
Tektronix TDS3043 Oscilloscope
To turn on the oscilloscope, press the power on button on the lower left-hand side of the oscilloscope. Shortly afterwards, you will see a boot screen, and then a start up screen. Press the MENU OFF button to proceed.

OSCILLOSCOPE SCREEN
1
2
34
5
6
7
8
Typical Oscilloscope Screen
The elements of the screen are as follows:
1. Waveform baseline icon. Shows the zero volt level of the waveform.
2. Channel indicator. 3. Channel scale factor. 4. Time per division.
5. Trigger slope. 6. Date and time. 7. Trigger level icon. 8. Visual representation of waveform.
OSCILLOSCOPE SETTINGS
Like the power supply and the function generator, the default settings of the oscilloscope can be manually changed. However, unlike the function generator, any changes made to the oscilloscope settings are retained when the oscilloscope is turned off.
Fortunately, the oscilloscope settings can be restored to the factory settings. It is a good practice to reset the oscilloscope to factory settings after it is turned on and before any measurements are taken. This way you can always begin working with the scope from the same initial setting.
To restore the oscilloscope to factory settings, press the SAVE/RECALL button at the top of the oscilloscope. Two menus will be displayed: one on the bottom of the screen and one on the right hand side
E05 18
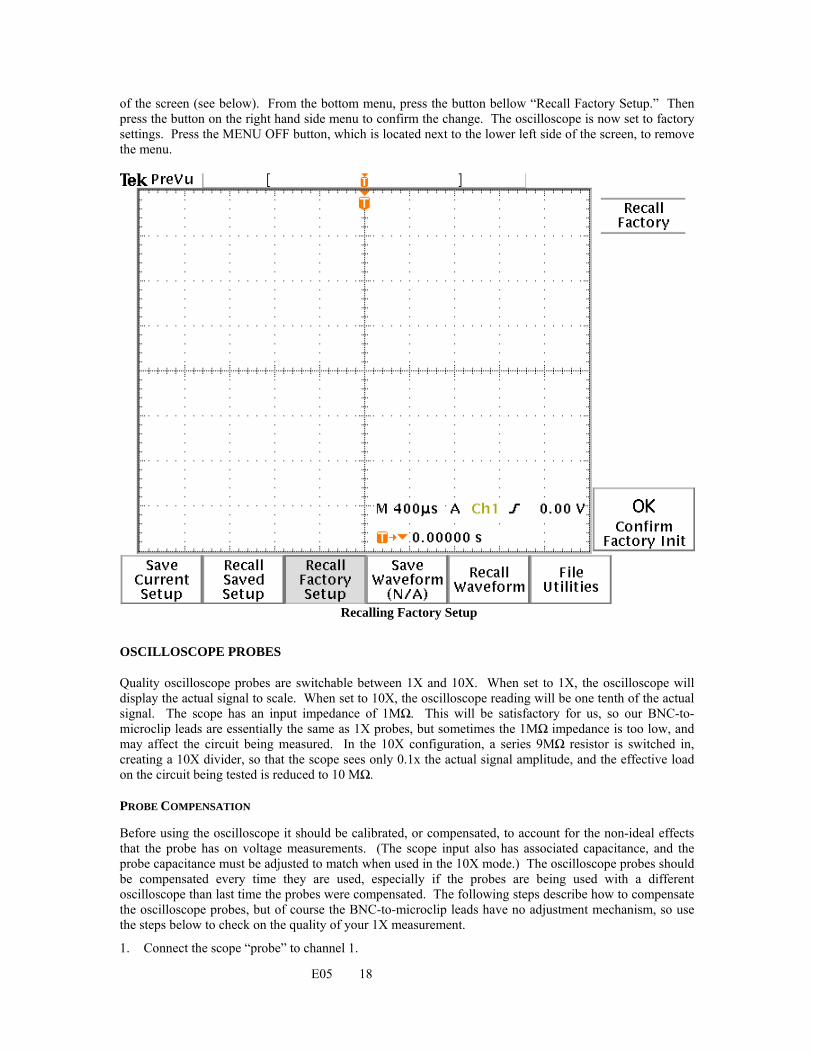
of the screen (see below). From the bottom menu, press the button bellow “Recall Factory Setup.” Then press the button on the right hand side menu to confirm the change. The oscilloscope is now set to factory settings. Press the MENU OFF button, which is located next to the lower left side of the screen, to remove the menu.
Recalling Factory Setup
OSCILLOSCOPE PROBES
Quality oscilloscope probes are switchable between 1X and 10X. When set to 1X, the oscilloscope will display the actual signal to scale. When set to 10X, the oscilloscope reading will be one tenth of the actual signal. The scope has an input impedance of 1MΩ. This will be satisfactory for us, so our BNC-to-microclip leads are essentially the same as 1X probes, but sometimes the 1MΩ impedance is too low, and may affect the circuit being measured. In the 10X configuration, a series 9MΩ resistor is switched in, creating a 10X divider, so that the scope sees only 0.1x the actual signal amplitude, and the effective load on the circuit being tested is reduced to 10 MΩ.
PROBE COMPENSATION
Before using the oscilloscope it should be calibrated, or compensated, to account for the non-ideal effects that the probe has on voltage measurements. (The scope input also has associated capacitance, and the probe capacitance must be adjusted to match when used in the 10X mode.) The oscilloscope probes should be compensated every time they are used, especially if the probes are being used with a different oscilloscope than last time the probes were compensated. The following steps describe how to compensate the oscilloscope probes, but of course the BNC-to-microclip leads have no adjustment mechanism, so use the steps below to check on the quality of your 1X measurement.
1. Connect the scope “probe” to channel 1.

E05 19
2. Attach probe tip and reference lead (ground) to the PROBE COMP connectors located between the channel 2 and channel 3 terminals.
3. Switch the oscilloscope probe to 10X. 4. Press the AUTOSET button. You should see a square wave similar to the one in the figure below. 5. Adjust the oscilloscope probe until you see a square wave with a flat top.
Under, Over and Correct Probe Compensation
SCREEN MEASUREMENTS
The oscilloscope can be used to measure the different properties of signals, including the amplitude, frequency and period of a signal.
MEASURING AMPLITUDE
Remember that the function generator expects a 50 Ω terminal load. With a load significantly larger than 50Ω, the function generator will supply double the voltage it is set to. That is why the oscilloscope may display a sine wave with amplitude of 1 V, or a peak to peak voltage of 2 V, when only half that is indicated on the FG setting. There are two ways to fix this:
1. With a BNC T connector, connect a 50 Ω terminal load to the function generator output channel. Set the oscilloscope to internal impedance of 50Ω.
On the oscilloscope, between the channel 1 and 2 terminals, and slightly above, press the MENU button. This menu button brings up the menu for channel settings. On the bottom of the right hand menu you will see the omega symbol (Ω). Pressing this button toggles the input impedance between 1 MΩ and 50Ω.
CURSOR MEASUREMENTS
For more accurate readings, the oscilloscope has cursors that you can activate and move on screen to measure the amplitude, frequency and period of a signal. To activate the cursors, press the CURSOR button at the top of the oscilloscope panel. The menu shown below will appear on the oscilloscope.
E05 20
MEASURING AMPLITUDE
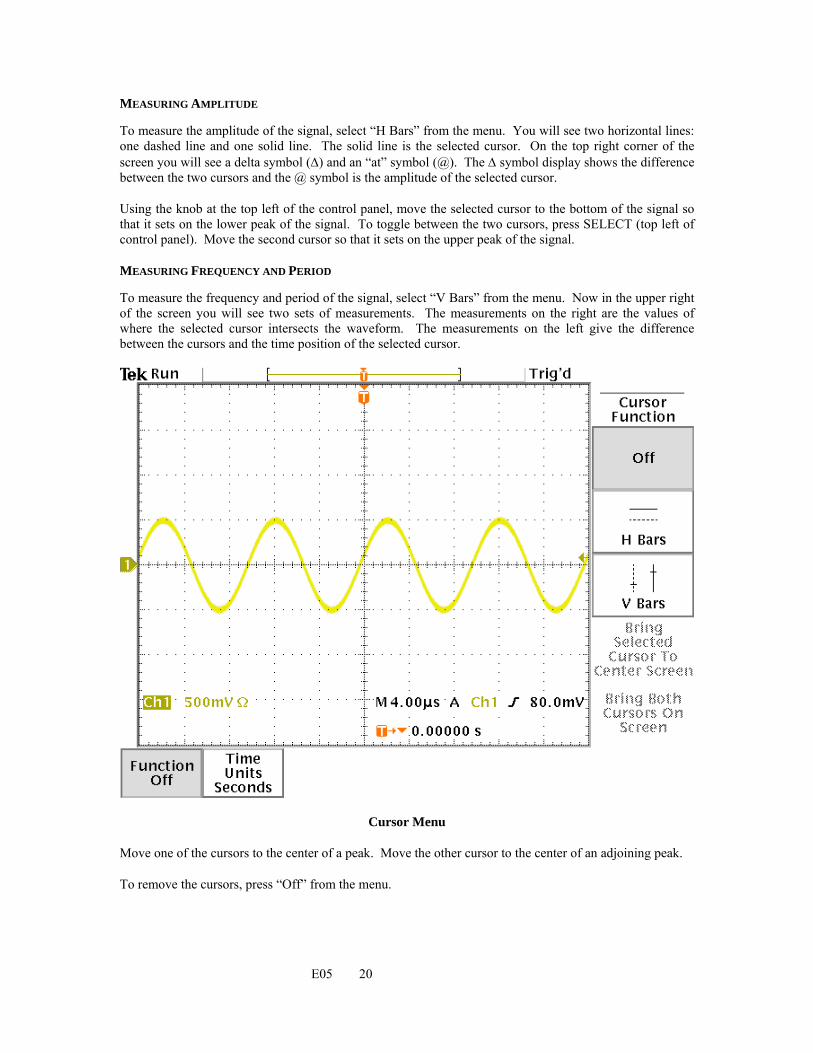
To measure the amplitude of the signal, select “H Bars” from the menu. You will see two horizontal lines: one dashed line and one solid line. The solid line is the selected cursor. On the top right corner of the screen you will see a delta symbol (Δ) and an “at” symbol (@). The Δ symbol display shows the difference between the two cursors and the @ symbol is the amplitude of the selected cursor.
Using the knob at the top left of the control panel, move the selected cursor to the bottom of the signal so that it sets on the lower peak of the signal. To toggle between the two cursors, press SELECT (top left of control panel). Move the second cursor so that it sets on the upper peak of the signal.
MEASURING FREQUENCY AND PERIOD
To measure the frequency and period of the signal, select “V Bars” from the menu. Now in the upper right of the screen you will see two sets of measurements. The measurements on the right are the values of where the selected cursor intersects the waveform. The measurements on the left give the difference between the cursors and the time position of the selected cursor.
Cursor Menu
Move one of the cursors to the center of a peak. Move the other cursor to the center of an adjoining peak.
To remove the cursors, press “Off” from the menu.
E05 21
AUTOMATIC MEASUREMENTS
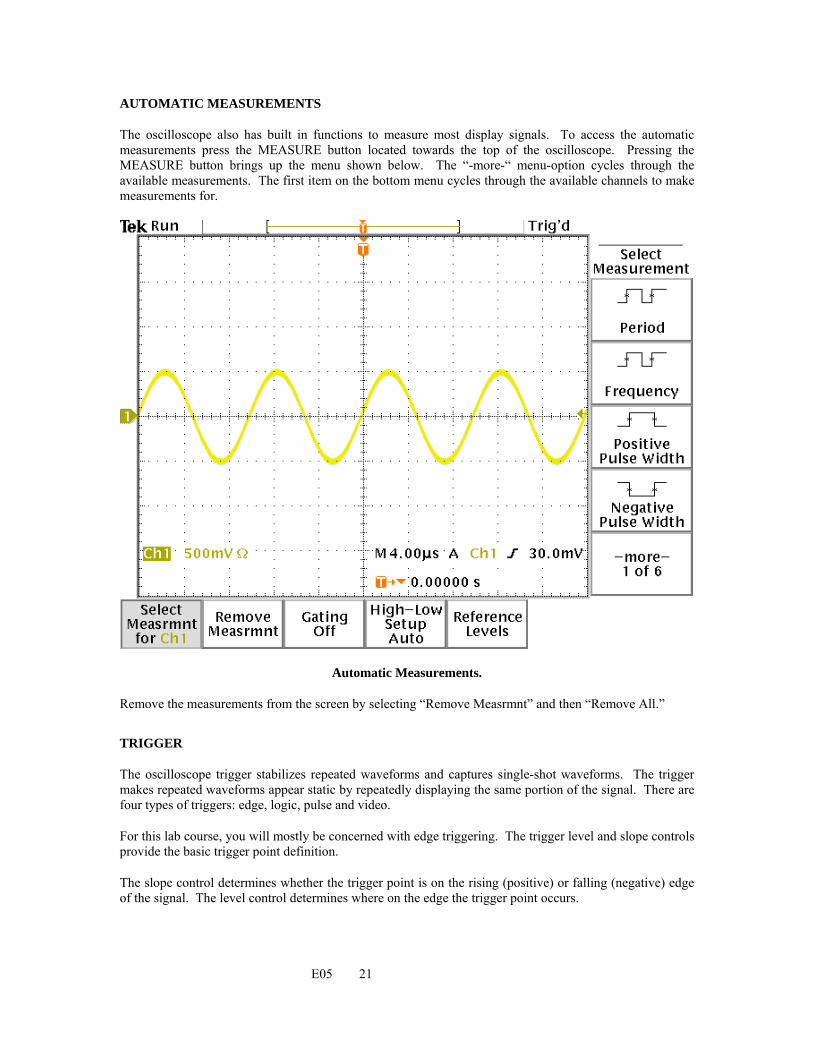
The oscilloscope also has built in functions to measure most display signals. To access the automatic measurements press the MEASURE button located towards the top of the oscilloscope. Pressing the MEASURE button brings up the menu shown below. The “-more-“ menu-option cycles through the available measurements. The first item on the bottom menu cycles through the available channels to make measurements for.
Automatic Measurements.
Remove the measurements from the screen by selecting “Remove Measrmnt” and then “Remove All.”
TRIGGER
The oscilloscope trigger stabilizes repeated waveforms and captures single-shot waveforms. The trigger makes repeated waveforms appear static by repeatedly displaying the same portion of the signal. There are four types of triggers: edge, logic, pulse and video.
For this lab course, you will mostly be concerned with edge triggering. The trigger level and slope controls provide the basic trigger point definition.
The slope control determines whether the trigger point is on the rising (positive) or falling (negative) edge of the signal. The level control determines where on the edge the trigger point occurs.

E05 22
INTENSITY: THE Z AXIS
The oscilloscope has a third z-axis, which is the intensity of the signal displayed. The more intense (brighter) the signal appears the greater is the value z. These are the parts of the signal that occur more often. For example, the natural response of a signal will appear to be dimmer than the forced response of the signal.
At maximum intensity, all waveform points are displayed at full brightness. As the intensity is decreased, the brightness of parts of the signal displayed also decrease. This is called intensity grading. The brightest parts are the points most frequently acquired; dimmer parts are less frequently acquired.
CAPTURING DATA
There will be times when you will want to save the information from the oscilloscope. The signals displayed on the screen can be saved as a graphic images, which can be imported into word processors or presentation software, or data files, which can be read by spreadsheet programs or math processors.
DEFAULT FILE NAMES
By default, the oscilloscope saves the image or data file in the following format:
TEK?????.EXT
where
? represents a numeric place holder
EXT is the file extension for the specified file type.
For example, the first file will be named TEK00000.EXT, the second will be TEK00001.EXT and so on.
SAVING AS A GRAPHIC FILE
When saving the signal as a graphic file, what is really being saved is the current screen of the oscilloscope, much the same way that screen capture utilities work in Windows. Whatever is displayed on the screen, including all signals and menus, is saved in the graphic file. The following steps outline how to capture the screen of the oscilloscope (they can also be used to send the screen image to a printer without saving):
1. Insert 3-½ inch floppy diskette into the floppy drive of the oscilloscope. 2. Press the UTILITY button on the control panel 3. Select "Config" from the lower menu and cycle through the options until "Hardcopy" is highlighted. 4. Use the menu on the right side of the screen to select the hardcopy type. This will probably be a
graphic format, but it may also be a printer type. 5. From the bottom menu, select "Layout" to choose from "Portrait" or "Landscape". If you are saving
the image as a file, you will want to select "Portrait". Choosing "Landscape" will cause the saved image to be rotated 90° counter clockwise.
6. From the bottom menu, select "Ink Saver" to toggle this option on or off. When the option is on, the background of the image will be white, when off, the background will be black.
7. When done making changes turn the menu off by pressing the MENU OFF button.
After the appropriate settings have been made, the screen may be saved or printed by pressing the "Hard Copy" button (the button with a picture of a printer on it) in the lower left-hand corner of the oscilloscope.
SAVING AS A DATA FiLE
When the oscilloscope saves the signal in a data file, it is saving the coordinates of the displayed signal. Each file contains 10,000 data points. There are two data file formats to choose from: a comma-delimited file (spreadsheet) and a data file (Mathcad).

E05 23
The following steps outline how to save the waveform in a data file to be imported in to spreadsheets, such as Excel, and math processing programs, such as MATLAB:
1. Insert 3-½ inch floppy diskette into the floppy drive of the oscilloscope. 2. Press the SAVE/RECALL button on the control panel. 3. Select the waveform you want to save by pressing the colored channel buttons. For example, to save
the waveform on channel 2, press the blue CH 2 button on the control panel. 4. Select “Save Waveform ChX” from the lower menu. 5. Select “To File” from the menu on the right side of the screen. 6. Select either “Spreadsheet File Format” to save the data in a comma delimited file, or “Mathcad File
Format” to save the data in a data file. 7. Finally, select “Save ChX To Selected File.”
Comma Delimited File
The spreadsheet file is actually an ASCII comma delimited file with the extension CSV. The signal is saved as XY coordinates separated by a comma. The follow data values where taken from a sample file:
0.002,-1 -0.0019996,1.01 -0.0019992,0.98 -0.0019988,0.99 -0.0019984,0.99
The file will consist of 10,000 rows and two columns (a 10,000 X 2 matrix). The first column contains the X coordinate and the second column contains the Y coordinate. The MATLAB DLMREAD command can be used to read a comma delimited file.
Data File
The data file is an ASCII text file. Each value is saved on a separate line within the file. The first four lines are parameters, followed by the values for the amplitude of the signal (the Y coordinate).
The four parameters are:
1. The number of data points. 2. Time per point or unit sample. 3. Trigger position. 4. Fractional trigger position.
We will not be concerned with the third and fourth parameters since they are not needed when importing and plotting the data in MATLAB. The following was taken from a sample data file:
10000 4e-07 50 0 0.1 0.08 0.1 0.08
In this example, the number of data values is 10,000 and the time interval between data samples is 400 ns. The trigger position and fractional trigger position are 50 and 0 respectively. The first data value is 0.1 (with a unit of volts) and starts on the fifth line. The MATLAB LOAD command can be used to read this file.

E05 24
FLOATING OUTPUTS
Like the function generator, the oscilloscope is earth grounded. This means that both pieces of equipment share a common reference point. Close attention to detail needs to be used when taking measurements of waveforms from the function generator with the oscilloscope. If one connects the probe grounds (or the FG ground) without due care, one can create untended circuit connections, and such unintended circuit changes can lead to burnt-out components! In Experiment 4 (Transients), for example, the FG grounds the “bottom” of the circuit(s), and the VC scope probe ground goes to the same point. If one now connects the VR probe across the resistor, with the black lead to the junction of the resistor and capacitor, as one might do intuitively, the ground connections short out the capacitor entirely! The instructions will indicate that VR is found by subtracting VC from the input signal VO.
E05 25
LABORATORY SAFETY
The first and most important skill to learn in an electrical laboratory is how to conduct experiments in a relatively safe manner. Your and your neighbors’ health and comfort depend on you learning to handle electrical energy and electrical equipment in a safe, respectful, and cautious manner. Lab equpment and the circuits exercised by them can cause death, permanent injury, electrical shock, burns, fires, unhealthy fumes, and unpleasent odors if not used in a proper manner. Equipment and devices under test can be damaged by careless use. Some level of risk is inherent in the types of activities normally done in electrical labs, but proper procedure can minimize this risk.
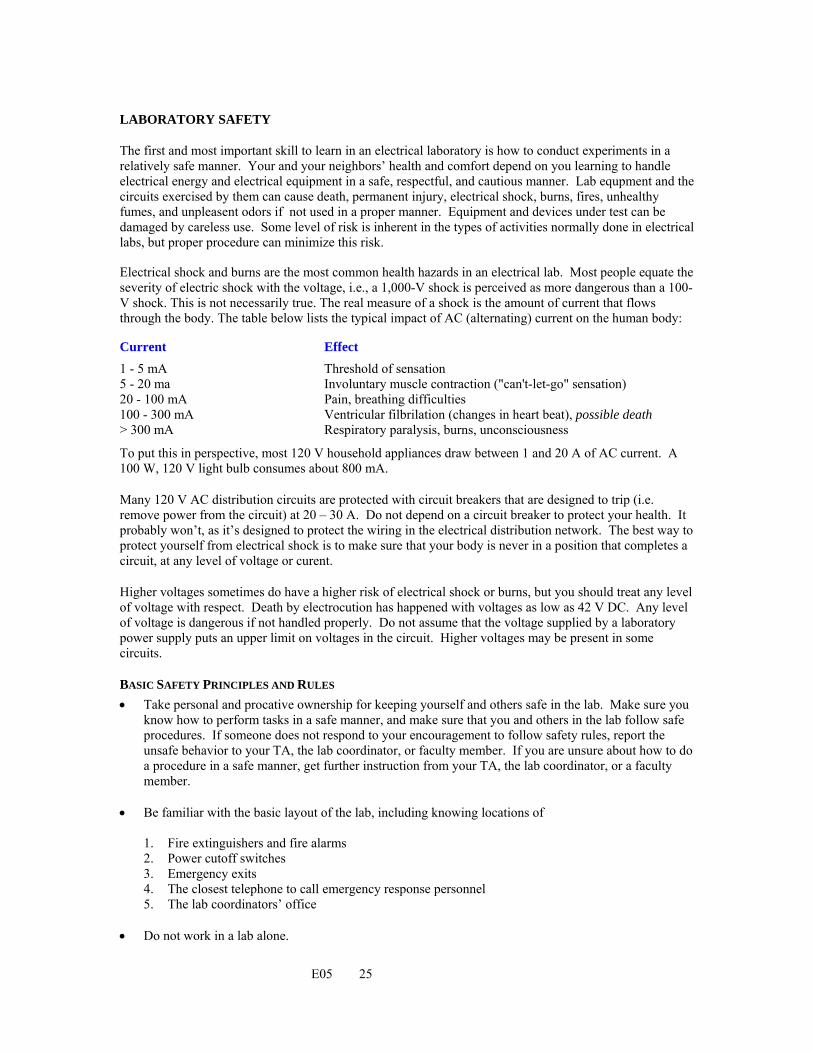
Electrical shock and burns are the most common health hazards in an electrical lab. Most people equate the severity of electric shock with the voltage, i.e., a 1,000-V shock is perceived as more dangerous than a 100-V shock. This is not necessarily true. The real measure of a shock is the amount of current that flows through the body. The table below lists the typical impact of AC (alternating) current on the human body:
Current Effect 1 - 5 mA Threshold of sensation 5 - 20 ma Involuntary muscle contraction ("can't-let-go" sensation) 20 - 100 mA Pain, breathing difficulties 100 - 300 mA Ventricular filbrilation (changes in heart beat), possible death > 300 mA Respiratory paralysis, burns, unconsciousness
To put this in perspective, most 120 V household appliances draw between 1 and 20 A of AC current. A 100 W, 120 V light bulb consumes about 800 mA.
Many 120 V AC distribution circuits are protected with circuit breakers that are designed to trip (i.e. remove power from the circuit) at 20 – 30 A. Do not depend on a circuit breaker to protect your health. It probably won’t, as it’s designed to protect the wiring in the electrical distribution network. The best way to protect yourself from electrical shock is to make sure that your body is never in a position that completes a circuit, at any level of voltage or curent.
Higher voltages sometimes do have a higher risk of electrical shock or burns, but you should treat any level of voltage with respect. Death by electrocution has happened with voltages as low as 42 V DC. Any level of voltage is dangerous if not handled properly. Do not assume that the voltage supplied by a laboratory power supply puts an upper limit on voltages in the circuit. Higher voltages may be present in some circuits.
BASIC SAFETY PRINCIPLES AND RULES • Take personal and procative ownership for keeping yourself and others safe in the lab. Make sure you
know how to perform tasks in a safe manner, and make sure that you and others in the lab follow safe procedures. If someone does not respond to your encouragement to follow safety rules, report the unsafe behavior to your TA, the lab coordinator, or faculty member. If you are unsure about how to do a procedure in a safe manner, get further instruction from your TA, the lab coordinator, or a faculty member.
• Be familiar with the basic layout of the lab, including knowing locations of 1. Fire extinguishers and fire alarms 2. Power cutoff switches 3. Emergency exits 4. The closest telephone to call emergency response personnel 5. The lab coordinators’ office
• Do not work in a lab alone.

E05 26
• Always power down the electrical equipment, disconnect the power supply connections, and wait for a few seconds before touching exposed conductors. If circuits contain capacitors, short between the capacitor leads with an insulated wire before touching exposed conductors.
• Do not wear rings, watches, necklaces, chains, or any other loose metallic objects. Rings and watches are particularily dangerous as the skin beneath them is wet by sweat, making the resistance of skin much lower. Any conducting material may “weld” to the power source when they come into contact, making it impossible for you to remove your body from the electrical power. Please do not be sentimental about removing wedding rings, engagement rings, etc. Your loved ones would rather have you healthy with all your fingers. Keep long hair pulled back where it will not come into contact with the circuit or equipment.
• Make sure that your hands, clothing, and shoes are dry. Wet skin or garments make it more likely for electrical discharge through your body.
• Do not lean on metallic objects (like legs of the bench tables) as you are providing a very large contact area for the current to flow out of your body to electrical ground.
• Do not use test leads with worn insulation or exposed conductors. • When connecting a meter in series with circuit elements to measure current, turn off the circuit power
before making conections to the meter.
• If someone near you suffers a continued electric shock, cut the power and/or remove the victim as quickly as possible without endangering yourself. (Do not directly touch the victim, or the mechanism she is in contact with, or the lab bench she is working at until the source of the electrical enegy is disconnected.) If the power switch cannot quickly be opened, use an insulting material such as dry wood, rope, a belt, etc. to pull the victim away from the power source. Send someone to call for help immediately. If the victim is unconscious and has stopped breathing, and someone around her knows CPR, start artificial respiration at once. Do not stop until a medical authority has arrived and taken over. Do not stop even if the victim does not have a pulse.
• Keep a neat and organized working area, and do not be distracted while any circuits or equipment is powered up. If you must leave your lab station for any length of time, power down all equipment and circuitry.
• If you see sparks, smoke, flame, or smell a burning odor, remove power immediately from your circuit and determine and correct the cause before reapplying power. If you cannot determine the cause, seek assistance from your TA or the lab coordinator.
• Know the power dissipation limits of the devices under test, and make sure the experiment you are running does not exceed these limits. Thermally overstressed devices can explode, throwing out hot fragments. Some electrical devices get quite hot under normal operation, so do not touch the devices under test with your fingers until you have removed all power from the circuit and are sure the circuit has had time to cool.
• Always know how to operate the equipment you are using. If an experiment does not go as expected, don’t “fiddle around with” the controls of the equipment in a random fashion to try to get expected behavior. Diagnose the problem and correct the improper settings. Reread the appropriate sectins of the equipment user documentation. If you cannot determine the proper settings or suspect an equipment malfunction, notify your TA or the lab coordinator. Do not continue to use a suspect piece of equipment. Report any known damage or malfunction of the equipment to your TA.
• Soldering irons should be disconnected when unattended and not in use. Keep them in metal holders when in use. Remove power from a soldering iron that is not in immediate use, even if you plan to use it again “… in a few minutes.” Avoid the use of soldering irons when possible.
E05 27
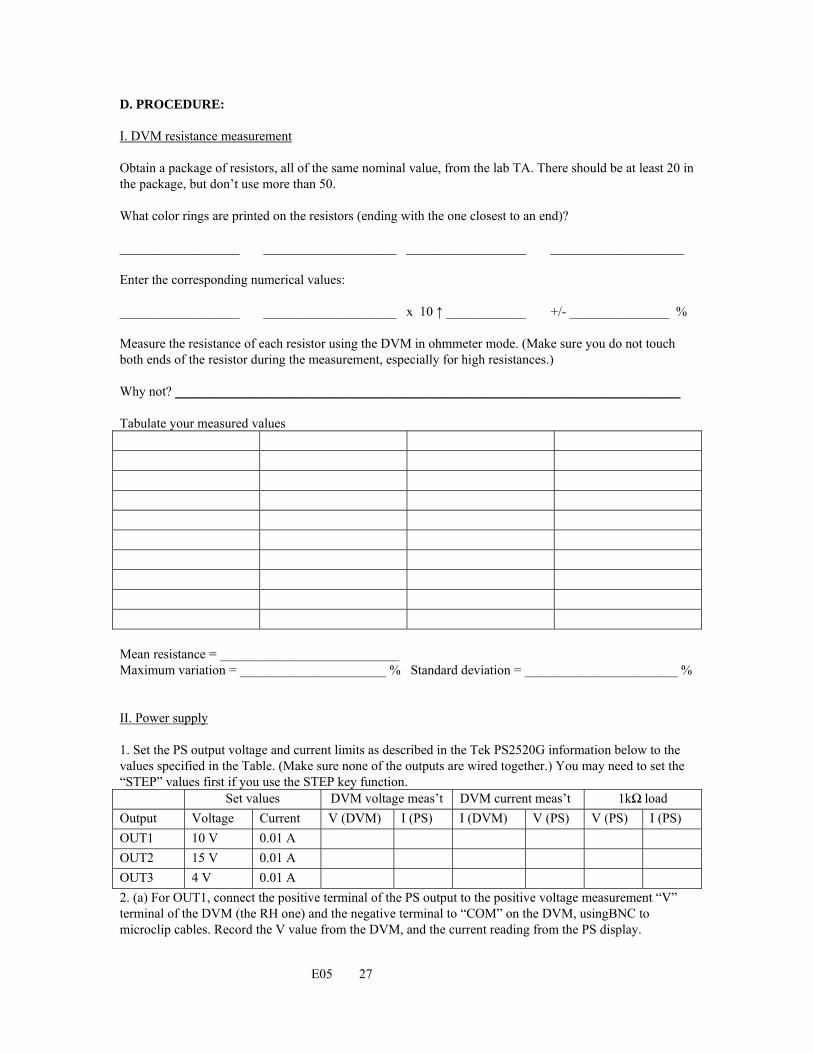
D. PROCEDURE: I. DVM resistance measurement Obtain a package of resistors, all of the same nominal value, from the lab TA. There should be at least 20 in the package, but don’t use more than 50. What color rings are printed on the resistors (ending with the one closest to an end)? __________________ ____________________ __________________ ____________________ Enter the corresponding numerical values: __________________ ____________________ x 10 ↑ ____________ +/- _______________ % Measure the resistance of each resistor using the DVM in ohmmeter mode. (Make sure you do not touch both ends of the resistor during the measurement, especially for high resistances.) Why not? ____________________________________________________________________________ Tabulate your measured values Mean resistance = ___________________________ Maximum variation = ______________________ % Standard deviation = _______________________ % II. Power supply 1. Set the PS output voltage and current limits as described in the Tek PS2520G information below to the values specified in the Table. (Make sure none of the outputs are wired together.) You may need to set the “STEP” values first if you use the STEP key function. Set values DVM voltage meas’t DVM current meas’t 1kΩ load Output Voltage Current V (DVM) I (PS) I (DVM) V (PS) V (PS) I (PS) OUT1 10 V 0.01 A OUT2 15 V 0.01 A OUT3 4 V 0.01 A 2. (a) For OUT1, connect the positive terminal of the PS output to the positive voltage measurement “V” terminal of the DVM (the RH one) and the negative terminal to “COM” on the DVM, usingBNC to microclip cables. Record the V value from the DVM, and the current reading from the PS display.

E05 28
(b) What happens if you interchange the DVM connections? _____________________________________ (c) Repeat 2(a) for OUT2 and OUT3. (d) For each output in turn, connect the positive output PS terminal to the positive current input terminal on the DVM (A) and the negative PS terminal to the DVM COM terminal, with the PS output disabled. Enable the PS output, and record the DVM current readings, and the corresponding PS voltage display readings. Explain these results _____________________________________________________________________ ______________________________________________________________________________________ (e) Obtain a 1kΩ resistor from the TA, and connect it between each pair of OUT terminals in turn, recording the PS display readings for each case. Explain these results _____________________________________________________________________ ______________________________________________________________________________________ 3. Set the PS to Series Tracking mode, with OUT1 and OUT2 still set as above. Measure the series output. Series output voltage = ___________________________ (OUT2 +ve wrt OUT2 –ve) Explain ______________________________________________________________________________ III. Function Generator, Oscilloscope, and DVM (Voltage measurement) This section of the experiment will provide experience in the use of the FG and DSO, and further use of the DVM. The scope will be connected in parallel with the DVM as voltmeter so they can be used to measure the same voltage two different ways. Use a coaxial TEE connector and 50Ω terminator at the FG output. Connect the FG, scope, and DVM micro-clip/alligator leads, red-to-red and black-to-black. (This is essential for the FG and scope grounds, and COM on the voltmeter to the shield of the coaxial cable. Now a positive voltage will correspond to an upward deflection on the scope. Check that the scope Trigger Mode is set to AUTO. The key to effective operation of both the FG and DSO is understanding of the MENU “trees,” and you may find it useful for the future to map these in a form you can follow.
(a) Use the multimeter to measure the output voltage of the function generator.
1. Connect a BNC T connector to output 1 of the function generator. 2. Connect a 50 Ω load to one end of the BNC T connector. The amplitude value displayed is the value of
the signal when the output is terminated with a 50 Ω load. Without the load, the output would be twice the value displayed, because the internal Thevenin impedance of the generator is 50Ω and the calibration assumes it will be operating into a matched load. (So we have a reasonable approximation, as long as the circuits we investigate have effective load resistances of much greater than 50Ω. Nevertheless, it is always safest to measure the generator output directly with the oscilloscope.)
3. Connect a BNC to micro-clip cable to the other end of the BNC T connector. 4. Set the DVM multimeter to measure AC voltage. 5. Connect the BNC-to-microclip connector to the multimeter probes. 6. Press the Channel 1 output button.
Since the function generator supplies 1 V peak-to-peak AC in default mode at start-up, you would expect the multimeter to read approximately 353 mV. However, you should have gotten a reading of

E05 29
approximately 0 V. This is because the start-up default frequency of 100 kHz provided by the function generator is above the 20 kHz limit of the DMM.
7. Adjust the FG output to 1 V amplitude and 1 kHz, and add 1 V DC offset. Check the DVM readings for AC and DC voltages (and frequency if you have a Tek DVM.) Note the AC + DC function on the meter.
DVM AC volts = _____________________ DVM DC volts = _____________________
[DVM frequency reading, if available = _____________________________ ]
(b) Use the oscilloscope to measure the output voltage of the function generator.
1. Turn the oscilloscope on, and recall the DSO Factory Settings, as described in the DSO information. (Note: We will not use the adjustable oscilloscope probes which are necessary for accurate high frequency work. Instead, with the following experiments limited to low frequencies, simple 1X connectors will be used throughout. Actually, the prototyping boards used in the lab are not suitable for high frequencies anyway!)
2. With the function generator still on, and connected as above you should see a yellow “fuzz” on the DSO screen. Press the AUTOSET button on the oscilloscope. After a second or two you should see a sine wave.
Record the peak-to-peak value of the sine wave _______________________________________________
Compare with the DVM reading, and explain ________________________________________________
_____________________________________________________________________________________
3. Remember that the function generator expects a 50 Ω terminal load. With a load significantly larger than 50Ω, the function generator will supply double the voltage it is set to. Remove the 50Ω termination from the “T” and note the increase in the DSO waveform. Set the oscilloscope to internal impedance of 50Ω, and note the reading. Reset the DSO to 1MΩ and replace the termination. What happened when you removed the termination? ___________________________________________ What happened when you set the DSO to 50Ω? _______________________________________________
4. Press the CURSOR button at the top of the oscilloscope panel, to get the Cursor menu appear on-screen. Measure the amplitude and frequency of the signal with the horizontal and vertical cursors, as per the cursor instructions.
DC voltage = ____________________________ AC voltage = _____________________________
Signal period = _____________________________ Hence frequency = _________________________
5. Investigate the automatic measurements with the MEASURE button, and cycle through the “-more-“ menu-option.
Did you observe the same DC and AC voltage measurements, and frequency? _______________________
6. Investigate the trigger options, and select the most stable.
What trigger settings did you select? ________________________________________________________
8. Investigate DC and AC coupling
E05 30
Explain the differences in the waveforms ____________________________________________________
_____________________________________________________________________________________
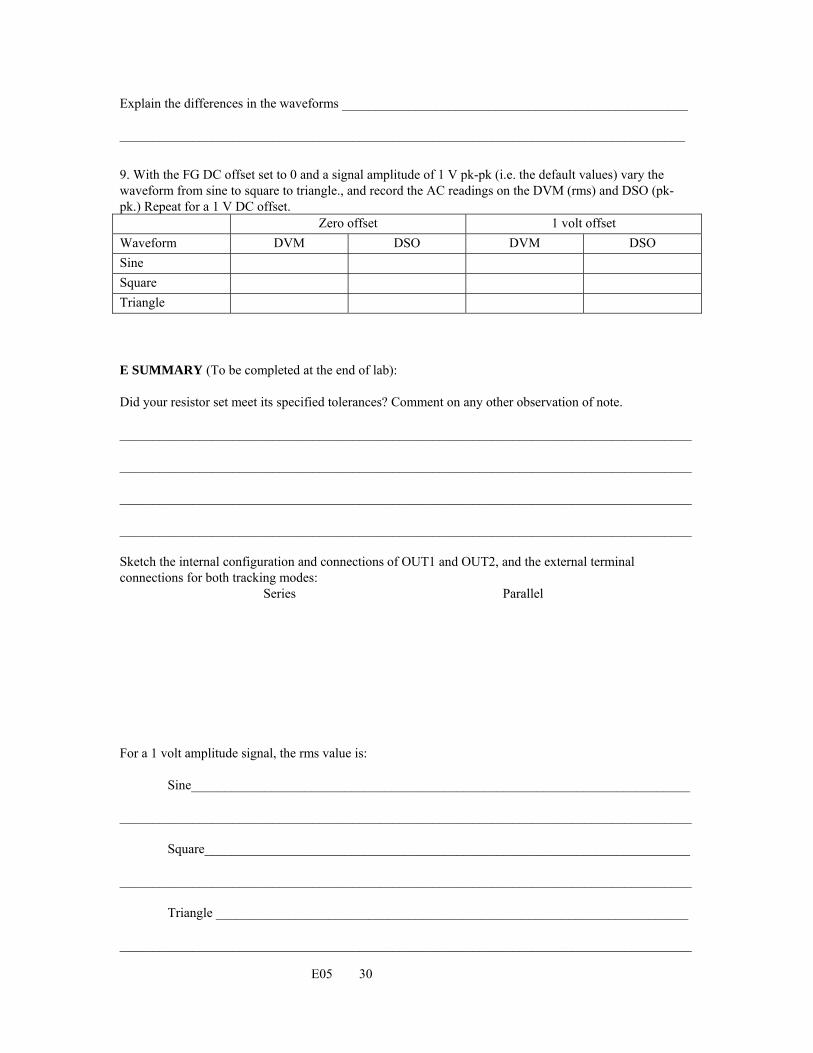
9. With the FG DC offset set to 0 and a signal amplitude of 1 V pk-pk (i.e. the default values) vary the waveform from sine to square to triangle., and record the AC readings on the DVM (rms) and DSO (pk-pk.) Repeat for a 1 V DC offset. Zero offset 1 volt offset Waveform DVM DSO DVM DSO Sine Square Triangle E SUMMARY (To be completed at the end of lab): Did your resistor set meet its specified tolerances? Comment on any other observation of note. ______________________________________________________________________________________ ______________________________________________________________________________________ ______________________________________________________________________________________ ______________________________________________________________________________________ Sketch the internal configuration and connections of OUT1 and OUT2, and the external terminal connections for both tracking modes: Series Parallel For a 1 volt amplitude signal, the rms value is: Sine___________________________________________________________________________ ______________________________________________________________________________________ Square_________________________________________________________________________ ______________________________________________________________________________________ Triangle _______________________________________________________________________ ______________________________________________________________________________________