expression of glypican-3 (gpc3) in malignant and non ... · expression of glypican-3 (gpc3) in...
TRANSCRIPT

Send Orders for Reprints to [email protected]
12 The Open Cancer Journal, 2015, 8, 12-23
1874-0790/15 2015 Bentham Open
Open Access
Expression of Glypican-3 (GPC3) in Malignant and Non-malignant Human Breast Tissues
Lilian Castillo1,º
, María Amparo Lago Huvelle1,º
, André Fujita2, Aline Ramos Maia Lobba
3, Rocío
Tascón1,º
, Tatiene Romera Garcia3, Eduardo Armanasco
4, Fabio Bagnoli
5, Vilmar Marques de
Oliveira5, Maria Antonieta Longo Galvão
6, Wagner Ricardo Montor
7, Maria Cleide Sogayar
3,8, Elisa
Bal de Kier Joffé1,º
, Lydia Puricelli1,º
, Leticia Labriola8 and María Giselle Peters
1,*,º
1Research Area, Institute of Oncology "Angel H. Roffo", University of Buenos Aires. Buenos Aires, Argentina
2Department of Computer Science, Institute of Mathematics and Statistics, University of São Paulo. São Paulo, Brazil
3NUCEL/NETCEM, School of Medicine, University of São Paulo. São Paulo, Brazil
4Surgery Department,
Institute of Oncology "Angel H. Roffo", University of Buenos Aires. Buenos Aires, Argentina
5Mastology Clinics, Santa Casa de São Paulo Medical School. São Paulo, Brazil
6Pathology Department, Santa Casa de São Paulo Medical School. São Paulo, Brazil
7Department of Physiological Sciences, Santa Casa de São Paulo Medical School. São Paulo, Brazil
8Biochemistry Department-Chemistry Institute, University of São Paulo. São Paulo, Brazil
ºMember of the National Council of Scientific and Technical Research (CONICET)
Abstract: Specific reports have linked GPC3 with cancer. Its usefulness as a marker has been proved for
hepatocarcinoma, melanoma and ovary carcinoma. However, there are no studies analyzing GPC3 usefulness as a
biomarker in mammary tumors. The aim of this work was to analyze GPC3 expression in breast tissues and to determine
whether it might be useful as a biomarker in breast cancer patients. Expression level of GPC3 mRNA in Brazilian and
Argentine human breast tumor (n=121) and peritumoral “normal” tissue (n=77) samples was analyzed using qRT-PCR.
GPC3 protein expression was analyzed from 69 breast cancer and 10 peritumoral samples using IHC. Statistical analyses
were done to evaluate the clinical-pathological significance of GPC3 expression. We found that Brazilian and Argentine
populations are statistically different regarding GPC3 mRNA expression. In Argentine patients a lower GPC3 mRNA
expression was found in tumors as compared to peritumoral tissues. No association was found between GPC3 mRNA and
protein expression and the clinical-pathological parameters. The Kaplan-Meier curves suggested that elevated levels of
GPC3 mRNA are associated with relapse. Our results indicate differential expression of GPC3 in mammary tumors in
comparasion to normal breast tissues. They also suggest the potential role of GPC3 as a biomarker and the importance of
deepening the study.
Keywords: Biomarker, breast cancer, Glypican-3, metastasis, primary tumor, prognosis.
INTRODUCTION
Breast cancer is the disease with a major impact on global health [1], with metastasis remaining the main cause of death. Currently, prognostic indicators such as tumor size, lymph node involvement and hormone receptor status, are used to identify patients at high-risk of developing metastasis. However, these parameters are not always accurate. To detect and monitor cancer and determine the most likely prognosis, it is necessary to identify specific molecular markers.
*Address correspondence to this author at the Research Area, Institute of
Oncology “Angel H. Roffo”. Av. San Martin 5481 (C1417DTB). Buenos
Aires, Argentina; Tel: +541145047884; Fax: +541145802811;
E-mails: [email protected]; [email protected]
Glypican-3 (GPC3), a heparan sulphate proteoglycan [2],
is expressed in human embryonic tissues [3] but it disappears
from most adult tissues except for mammary gland among
others. Several reports have linked GPC3 with cancer [2].
GPC3 overexpression has been shown in Wilms’ tumor [4],
hepatocellular carcinoma (HCC) [5], and in yolk sac tumor
and clear cell ovarian carcinoma [6]. Regarding mammary
gland, we have reported that ectopic GPC3 expression in
LM3 (a breast mammary murine GPC3 negative metastatic
cell line) was able to inhibit invasion and metastasis [7]. We
have determined that GPC3 plays a role in almost all steps of
the metastasis cascade by inducing mesenchymal-epithelial-
transition (MET), suggesting its role as a metastasis
suppressor [8]. Although the GPC3 signaling mechanism is
unclear, we found that murine GPC3-reexpressing cells
GPC3 Expression in Human Breast Cancer The Open Cancer Journal, 2015, Volume 8 13
display an inhibition of the canonical Wnt signaling as well
as an activation of the non-canonical PCP pathway [9]. We
also demonstrated that GPC3 inhibits the PI3K/Akt pathway
and stimulates the p38MAPK cascade [10].
We hypothesize that GPC3 would be valuable as a marker of breast disease progression. The usefulness of GPC3 as a marker has been proved for HCCs [5], melanoma [11] and ovary carcinoma [6]. Herein, we have undertaken a novel study aiming at identifying breast cancer patients at high risk of relapse by employing the GPC3 expression pattern in primary tumors. We examined GPC3 expression, at mRNA and protein levels, in breast tumor and peritumoral “normal” tissue samples from Argentine and Brazilian patients. We compared GPC3 expression between both populations and between peritumoral and tumor samples. We also investigated whether GPC3 expression was associated with clinical-pathological, as well as with Ki67, estrogen receptor (ER), progesterone receptor (PR) and HER-2 status, based on immunohistochemistry studies. More importantly, we assessed the value of GPC3 as a possible marker to predict relapse.
MATERIALS AND METHODS
1. Study Population
For the prospective analysis at mRNA level, we collected breast cancer and peritumoral “normal” tissues from patients who had undergone surgical treatment (49 patients from Argentina and 72 patients from Brazil), following the Common Minimum Technical Standards and Protocols from
the IARC. Tissue samples were pre-cooled and maintained at 80°C. In addition, pieces of samples were fixed and
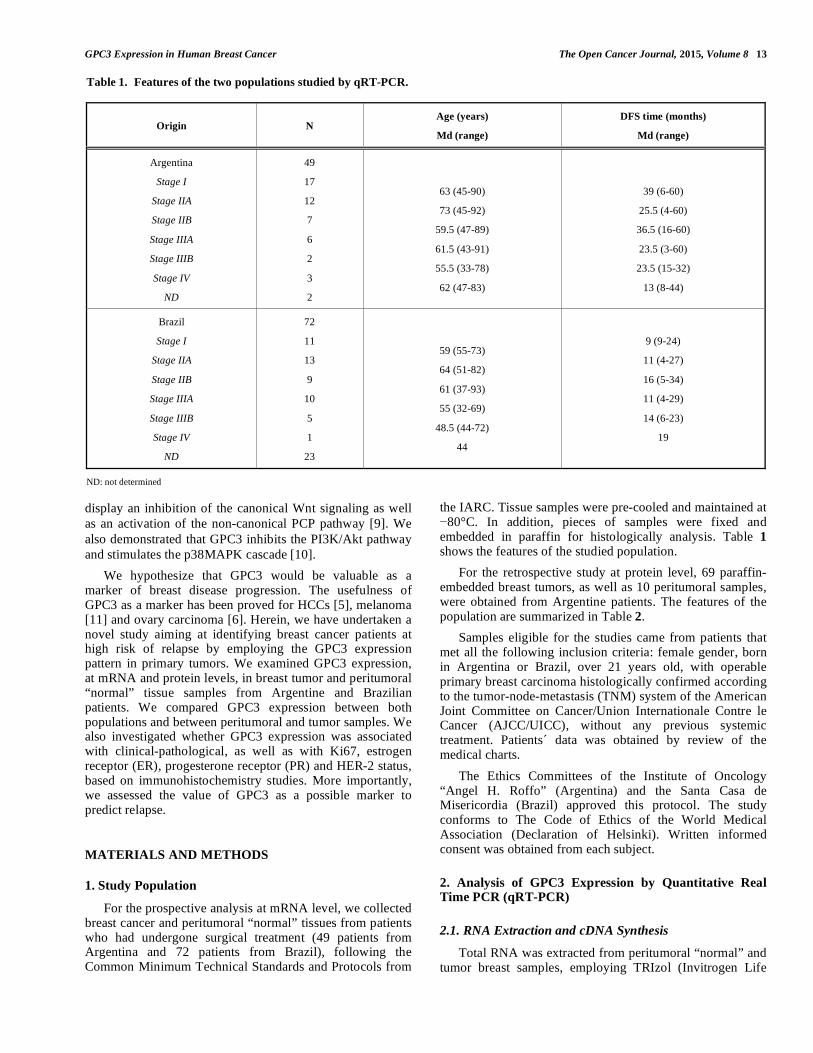
embedded in paraffin for histologically analysis. Table 1 shows the features of the studied population.
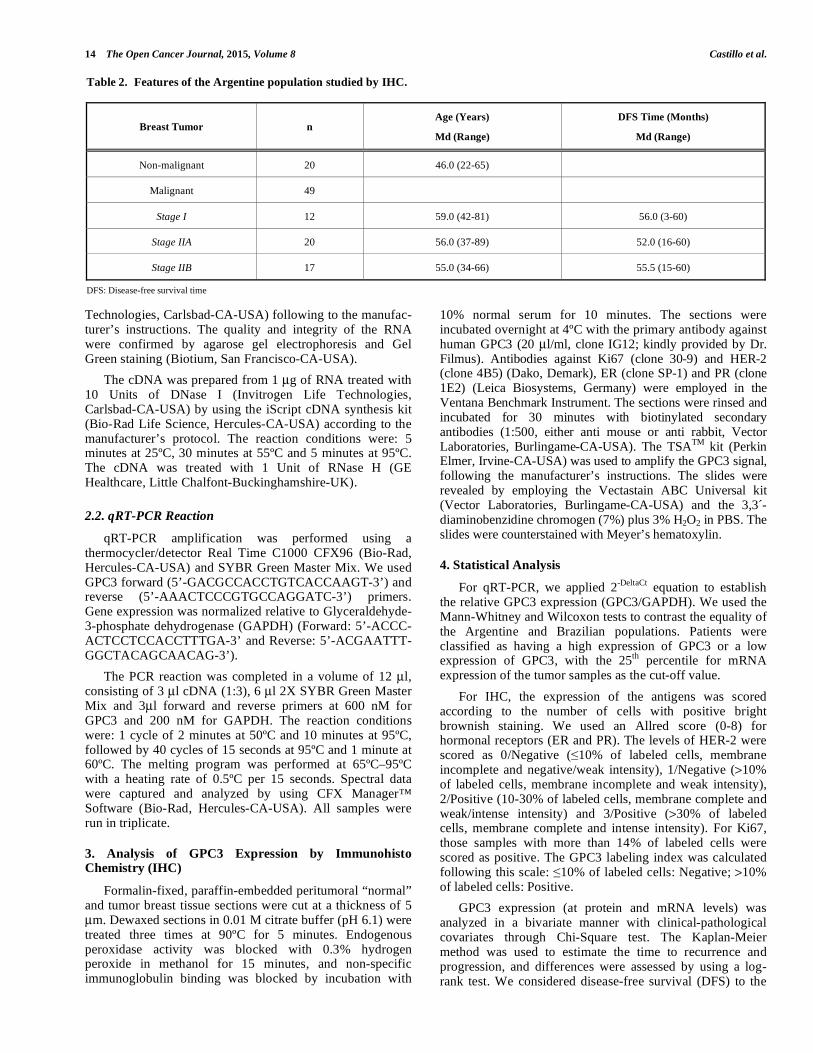
For the retrospective study at protein level, 69 paraffin-embedded breast tumors, as well as 10 peritumoral samples, were obtained from Argentine patients. The features of the population are summarized in Table 2.
Samples eligible for the studies came from patients that met all the following inclusion criteria: female gender, born in Argentina or Brazil, over 21 years old, with operable primary breast carcinoma histologically confirmed according to the tumor-node-metastasis (TNM) system of the American Joint Committee on Cancer/Union Internationale Contre le Cancer (AJCC/UICC), without any previous systemic treatment. Patients´ data was obtained by review of the medical charts.
The Ethics Committees of the Institute of Oncology “Angel H. Roffo” (Argentina) and the Santa Casa de Misericordia (Brazil) approved this protocol. The study conforms to The Code of Ethics of the World Medical Association (Declaration of Helsinki). Written informed consent was obtained from each subject.
2. Analysis of GPC3 Expression by Quantitative Real Time PCR (qRT-PCR)
2.1. RNA Extraction and cDNA Synthesis
Total RNA was extracted from peritumoral “normal” and tumor breast samples, employing TRIzol (Invitrogen Life
Table 1. Features of the two populations studied by qRT-PCR.
Origin N Age (years)
Md (range)
DFS time (months)
Md (range)
Argentina
Stage I
Stage IIA
Stage IIB
Stage IIIA
Stage IIIB
Stage IV
ND
49
17
12
7
6
2
3
2
63 (45-90)
73 (45-92)
59.5 (47-89)
61.5 (43-91)
55.5 (33-78)
62 (47-83)
39 (6-60)
25.5 (4-60)
36.5 (16-60)
23.5 (3-60)
23.5 (15-32)
13 (8-44)
Brazil
Stage I
Stage IIA
Stage IIB
Stage IIIA
Stage IIIB
Stage IV
ND
72
11
13
9
10
5
1
23
59 (55-73)
64 (51-82)
61 (37-93)
55 (32-69)
48.5 (44-72)
44
9 (9-24)
11 (4-27)
16 (5-34)
11 (4-29)
14 (6-23)
19
ND: not determined
14 The Open Cancer Journal, 2015, Volume 8 Castillo et al.
Technologies, Carlsbad-CA-USA) following to the manufac-turer’s instructions. The quality and integrity of the RNA were confirmed by agarose gel electrophoresis and Gel Green staining (Biotium, San Francisco-CA-USA).
The cDNA was prepared from 1 μg of RNA treated with 10 Units of DNase I (Invitrogen Life Technologies, Carlsbad-CA-USA) by using the iScript cDNA synthesis kit (Bio-Rad Life Science, Hercules-CA-USA) according to the manufacturer’s protocol. The reaction conditions were: 5 minutes at 25ºC, 30 minutes at 55ºC and 5 minutes at 95ºC. The cDNA was treated with 1 Unit of RNase H (GE Healthcare, Little Chalfont-Buckinghamshire-UK).
2.2. qRT-PCR Reaction
qRT-PCR amplification was performed using a thermocycler/detector Real Time C1000 CFX96 (Bio-Rad, Hercules-CA-USA) and SYBR Green Master Mix. We used GPC3 forward (5’-GACGCCACCTGTCACCAAGT-3’) and reverse (5’-AAACTCCCGTGCCAGGATC-3’) primers. Gene expression was normalized relative to Glyceraldehyde-3-phosphate dehydrogenase (GAPDH) (Forward: 5’-ACCC-ACTCCTCCACCTTTGA-3’ and Reverse: 5’-ACGAATTT-GGCTACAGCAACAG-3’).
The PCR reaction was completed in a volume of 12 μl, consisting of 3 μl cDNA (1:3), 6 μl 2X SYBR Green Master Mix and 3μl forward and reverse primers at 600 nM for GPC3 and 200 nM for GAPDH. The reaction conditions were: 1 cycle of 2 minutes at 50ºC and 10 minutes at 95ºC, followed by 40 cycles of 15 seconds at 95ºC and 1 minute at 60ºC. The melting program was performed at 65ºC–95ºC with a heating rate of 0.5ºC per 15 seconds. Spectral data were captured and analyzed by using CFX Manager™ Software (Bio-Rad, Hercules-CA-USA). All samples were run in triplicate.
3. Analysis of GPC3 Expression by Immunohisto Chemistry (IHC)
Formalin-fixed, paraffin-embedded peritumoral “normal” and tumor breast tissue sections were cut at a thickness of 5 μm. Dewaxed sections in 0.01 M citrate buffer (pH 6.1) were treated three times at 90ºC for 5 minutes. Endogenous peroxidase activity was blocked with 0.3% hydrogen peroxide in methanol for 15 minutes, and non-specific immunoglobulin binding was blocked by incubation with
10% normal serum for 10 minutes. The sections were incubated overnight at 4ºC with the primary antibody against human GPC3 (20 μl/ml, clone IG12; kindly provided by Dr. Filmus). Antibodies against Ki67 (clone 30-9) and HER-2 (clone 4B5) (Dako, Demark), ER (clone SP-1) and PR (clone 1E2) (Leica Biosystems, Germany) were employed in the Ventana Benchmark Instrument. The sections were rinsed and incubated for 30 minutes with biotinylated secondary antibodies (1:500, either anti mouse or anti rabbit, Vector Laboratories, Burlingame-CA-USA). The TSA
TM kit (Perkin
Elmer, Irvine-CA-USA) was used to amplify the GPC3 signal, following the manufacturer’s instructions. The slides were revealed by employing the Vectastain ABC Universal kit (Vector Laboratories, Burlingame-CA-USA) and the 3,3´-diaminobenzidine chromogen (7%) plus 3% H2O2 in PBS. The slides were counterstained with Meyer’s hematoxylin.
4. Statistical Analysis
For qRT-PCR, we applied 2-DeltaCt
equation to establish the relative GPC3 expression (GPC3/GAPDH). We used the Mann-Whitney and Wilcoxon tests to contrast the equality of the Argentine and Brazilian populations. Patients were classified as having a high expression of GPC3 or a low expression of GPC3, with the 25
th percentile for mRNA
expression of the tumor samples as the cut-off value.
For IHC, the expression of the antigens was scored according to the number of cells with positive bright brownish staining. We used an Allred score (0-8) for hormonal receptors (ER and PR). The levels of HER-2 were scored as 0/Negative ( 10% of labeled cells, membrane incomplete and negative/weak intensity), 1/Negative (>10% of labeled cells, membrane incomplete and weak intensity), 2/Positive (10-30% of labeled cells, membrane complete and weak/intense intensity) and 3/Positive (>30% of labeled cells, membrane complete and intense intensity). For Ki67, those samples with more than 14% of labeled cells were scored as positive. The GPC3 labeling index was calculated following this scale: 10% of labeled cells: Negative; >10% of labeled cells: Positive.
GPC3 expression (at protein and mRNA levels) was analyzed in a bivariate manner with clinical-pathological covariates through Chi-Square test. The Kaplan-Meier method was used to estimate the time to recurrence and progression, and differences were assessed by using a log-rank test. We considered disease-free survival (DFS) to the
Table 2. Features of the Argentine population studied by IHC.
Breast Tumor n Age (Years)
Md (Range)
DFS Time (Months)
Md (Range)
Non-malignant 20 46.0 (22-65)
Malignant 49
Stage I 12 59.0 (42-81) 56.0 (3-60)
Stage IIA 20 56.0 (37-89) 52.0 (16-60)
Stage IIB 17 55.0 (34-66) 55.5 (15-60)
DFS: Disease-free survival time

GPC3 Expression in Human Breast Cancer The Open Cancer Journal, 2015, Volume 8 15
time elapsed between surgery and relapse or between surgery and the last visit to hospital for patients who did not relapse.
Statistical analysis was performed by using SPSS 16.0 (IBM Co., Armonk-NY-USA), and a p-value<0.05 was considered statistically significant.
RESULTS
1- Expression of GPC3 by qRT-PCR: Association with
Clinical-Pathological Data and DFS Time
We analyzed the expression of GPC3 at mRNA level in both breast cancer (n=121) and peritumoral “normal” (n=77) samples from Argentine and Brazilian patients. We found that the GPC3 relative expression in tumor samples from Brazil and Argentina is statistically different (U Mann-Whitney= 1364.500; W Wilcoxon= 2571.500; Z= -2.208; p-value= 0.027). Therefore, they were treated as two independent populations.
As shown in Fig. (1A), for Argentine population we analyzed GPC3 expression in 49 tumor and 24 peritumoral “normal” samples, determining that the expression of GPC3 in tumor samples was lower than that in the peritumoral “normal” ones (p-value<0.0001, Mann-Whitney and Wilcoxon tests). On the other hand, the same trend was obtained from 72 tumor and 53 peritumoral “normal” samples from Brazilian population (Fig. 1B).
We also studied paired samples, namely tumor and normal tissues from the same patient. We defined dissimilar those samples where GPC3/GAPDH levels differed by at least 20% between tumor and peritumoral tissues. In Argentine population, we found that 18/22 (86.4%) patients presented a lower GPC3 relative level in tumor than in the corresponding peritumoral sample, while one patient presented the same expression in both tissues (Fig. 2A). Meanwhile, in Brazilian population we found a lower GPC3 relative level in tumor tissue in 21/50 (42%) patients, while no differences were found in 9/50 (18%) (Fig. 2B).
The optimal reference value to differentiate patients from
controls was the 25th
percentile of GPC3 tumor expression.
Therefore, we established that those samples with GPC3
expression higher than the 25th
percentile (0.0100 for the
Argentine population and 0.0225 for the Brazilian one)
would be considered as GPC3 positive. We determined that
72% of tumor tissues from Argentina and 69% of tumor
samples from Brazil express GPC3 mRNA. Meanwhile,
100% of Argentine peritumoral samples and 91% of
Brazilian ones were GPC3 positive.
No association was found between GPC3 relative levels
in tumor tissues and the different clinical-pathological
parameters (Chi-square test), either for the Argentine
population (Table 3) or the Brazilian one (Table 4).
Moreover, GPC3 expression was not associated with triple
negative tumors in either population (data not shown). These
data suggest the independence of GPC3 expression.
Evaluation of the DFS time was carried out in a group of
44 breast cancer Argentine patients with a 3 to 60 months
follow-up period. The Kaplan-Meier survival curves showed
a borderline significant association between GPC3
expression and DFS (Log rank test, p-value= 0.06) (Fig. 3).
Surprisingly, positive GPC3 expression was associated with
earlier relapse. It is important to highlight that no negative
GPC3 tumor-harboring patient relapsed during the 5-years
follow-up period.
2- Expression of GPC3 by IHC: Association with Clinical-Pathological Data and DFS Time
We studied GPC3 protein expression in the Argentine breast tumor patients’ samples by immunostaining. As Fig. (4) shows, GPC3 expression was low and mainly restricted to the membrane. Among the 69 breast tumor samples examined, GPC3 was detected in 12 cases (17.4%). As shown in Table 5, only 10% of non-malignant tumors showed positive staining for GPC3, while the 20.4%
Fig. (1). GPC3 relative expression as measured by qRT-PCR, in tumor and peritumoral “normal” tissues. GPC3 mRNA expression was
evaluated in 49 tumor and 24 peritumoral samples from Argentina (A) and in 72 tumor and 53 peritumoral samples from Brazil (B) by qRT-
PCR. Expression levels were normalized against GAPDH. The boxes represent Md [Rg], and error bars show the standard deviation (SD). a-
U Mann-Whitney= 203.00; W Wilcoxon= 1428.00; Z= -4.525; p-value= 0.000; b- U Mann-Whitney= 1704.00; W Wilcoxon= 4332.00; Z= -1.02; p-value= 0.308.

16 The Open Cancer Journal, 2015, Volume 8 Castillo et al.
Fig. (2). GPC3 relative expression as measured by qRT-PCR, in tumor versus peritumoral “normal” tissues from de same patient. GPC3
mRNA expression was evaluated in tumor and peritumoral “normal” tissues from the same patient (22 patients from Argentina (A) and in 50
patients from Brazil (B)) by qPCR and normalized against GAPDH. The bars represent average Tumor/Normal ratios of GPC3 mRNA
expression in paired breast cancer. Error bars represent the standard deviation of the mean (SD).
Table 3. Clinical-pathological characteristics of Argentine patients and their association with GPC3 expression at mRNA level.
Features Positive/Negative Positive/Total (%) Chi-square value p
Age (years)
50
51-70
>70
6/3
16/6
12/4
66.7
72.7
75.0
0.828
0.843
Status
Premenopausic
Perimenopausic
Postmenopausic
6/2
5/1
21/10
75.0
83.3
67.7
0.666
0.717
1.510
20
30
40
Patient
Tu
mora
l/P
erit
um
ora
l
GP
C3 R
ealt
ive
Exp
ress
ion
Tu
mor
/per
itu
mor
al
0.0
1.0
GP
C3
Rel
ativ
e E
xpre
ssio
n0.5
1 2 3 4 5 6 7 8 9 10111213141516 1718 19202122
A.
1 2 3 4 5 6 7 8 9 10 11 12 13 14 15 16 17 18 19 20 21 22 23 24 25 26 27 28 29 30 31 32 33 34 35 36 37 38 3940 41 42 43 44 45 460.0
0.5
1.0
1.510
20
30
40
Patient
Tu
mo
ral/P
eri
tum
ora
lG
PC
3 R
ealt
ive E
xp
ressio
n
Tu
mor
/per
itu
mor
al
GP
C3
Rel
ativ
e E
xpre
ssio
n
B.
504748 49

GPC3 Expression in Human Breast Cancer The Open Cancer Journal, 2015, Volume 8 17
Table 3. contd….
Features Positive/Negative Positive/Total (%) Chi-square value p
Stage
IA
IIA
IIB
IIIA
IIIB
IV
13/4
7/4
5/3
5/1
2/0
2/1
76.5
63.6
62.5
83.3
100.0
66.7
2.124
0.832
Tumor Size (cm)
2.0
2.1-5.0
>5.0
11/9
16/3
5/1
55.0
84.2
83.3
4.550
0.103
Lymph Nodes
Non-metastatic
Metastatic
24/9
10/4
72.7
71.4
0.08
0.927
Histologic Grade
I
II
III-IV
1/0
9/4
20/8
100.0
69.2
71.4
0.431
0.806
Nuclear Grade
I
II
III
4/0
14/3
15/9
100.0
82.4
62.5
3.602
0.165
Histological Type
Lobular
Ductal
Others
7/1
25/11
2/1
87.5
69.4
66.7
1.118
0.572
Mitotic Index
5
6-10
11-20
>20
8/2
10/4
9/6
3/0
80.0
71.4
60.0
100.0
2.520
0.472
Estrogen Receptor
Negative
Positive
5/0
29/11
100.0
72.5
1.820
0.177
Progesterone Receptor
Negative
Positive
9/1
25/10
90.0
71.4
1.452
0.228

18 The Open Cancer Journal, 2015, Volume 8 Castillo et al.
Table 3. contd….
Features Positive/Negative Positive/Total (%) Chi-square value p
HER-2
Negative
Positive
30/10
4/1
75.0
80.0
0.06
0.806
Ki67
Negative
Positive
10/1
7/0
90.9
100.0
0.674
0.412
NS, Chi-square test.
Table 4. Clinical-pathological characteristics of Brazilian patients and their association with GPC3 expression at mRNA level.
Features Positive/Negative Positive/Total (%) Chi-square value p
Age (years)
50
51-70
>70
6/1
17/4
6/0
85.7
81.0
100.0
1.351
0.509
Status
Premenopausic
Perimenopausic
Postmenopausic
7/3
2/1
19/1
70.0
66.7
95.0
4.090
0.129
Stage
IA
IIA
IIB
IIIA
IIIB
IV
5/2
7/2
7/2
7/1
1/3
1/0
71.42
77.78
77.78
87.50
25.0
100.0
6.208
0.287
Tumor Size (cm)
2.0
2.1-5.0
>5.0
9/4
14/6
5/0
69.2
70.0
100.0
2.059
0.357
Lymph Nodes
Non-metastatic
Metastatic
17/6
11/3
73.9
78.6
0.103
0.749
Histologic Grade
I
II
III-IV
0/1
15/2
13/2
0.0
88.2
86.7
5.790
0.055

GPC3 Expression in Human Breast Cancer The Open Cancer Journal, 2015, Volume 8 19
Table 4. contd….
Features Positive/Negative Positive/Total (%) Chi-square value p
Nuclear Grade
I
II
III
0/0
1/1
1/1
0.0
50.0
50.0
0
1
Histological Type
Lobular
Ductal
Others
1/1
25/4
2/0
50
86.2
100.0
2.288
0.319
Estrogen Receptor
Negative
Positive
5/1
23/6
83.3
79.3
0.05
0.823
Progesterone Receptor
Negative
Positive
10/1
18/6
90.9
75.0
1.193
0.275
HER-2
Negative
Positive
30/10
9/0
75.0
100.0
2.319
0.314
Ki67
Negative
Positive
10/2
16/3
88.3
84.2
0.004
0.948
NS, Chi-square test.
Fig. (3). Kaplan-Meier disease-free survival (DFS) curve according to qRT-PCR GPC3 expression. Cases were stratified into negative GPC3
mRNA expression and positive GPC3 mRNA expression. The graph shows the Kaplan–Meier curve of DFS stratified by GPC3 mRNA
expression. Log rank test= 2.89, p-value=0.06
GPC3 -
GPC3 +
Cu
mu
lati
ve S
urv
ival
0.2
0.6
0.4
1.0
0.8
0.1
300
Time (month)
40 502010 60

20 The Open Cancer Journal, 2015, Volume 8 Castillo et al.
Fig. (4). Immunohistochemical staining pattern for GPC3 in breast cancer. GPC3 expression was evaluating at protein level by IHQ, in 69
tumor samples from Argentine. Representative images of GPC3-positive and GPC3-negative tumors are shown. Invasive ductal tumor, stage
II, GPC3-negative (a); Invasive ductal tumor, stage II, GPC3-positive (b) Placenta GPC3-Positive Control.
Table 5. Immunohistochemical GPC3 expression in Argentine breast tumor samples.
Non-malignant Tumor
n (%)
Malignant
Tumor
n (%)
Total
n (%) Chi-square value p
GPC3
Positive
Negative
2 (10.0)
18 (90.0)
10 (20.4)
39 (79.6)
12 (17.4)
57 (82.6)
1.01
0.25
NS, Chi-square test
Table 6. Clinical-pathological characteristics of Argentine patients and their association with GPC3 expression at protein level.
Features Positive/Negative Positive/Total (%) Chi-square Value p
Age (years)
50
51-60
>60
5/14
2/10
3/15
26.3
16.7
16.7
0.67
0.72
Status
Premenopausic
Perimenopausic
Postmenopausic
4/9
1/2
5/28
30.8
33.3
15.2
1.73
0.42

GPC3 Expression in Human Breast Cancer The Open Cancer Journal, 2015, Volume 8 21
Table 6. contd….
Features Positive/Negative Positive/Total (%) Chi-square value p
Stage
IA
IIA
IIB
4/8
2/17
4/14
33.3
10.5
22.2
6.208
0.287
Tumor Size (cm)
1.0
1.1-2.0
>2.1
0/4
4/15
6/20
0.0
21.1
30.0
1.35
0.72
Lymph Nodes +
0
1-3
>4
6/14
2/18
2/7
30.0
10.0
22.2
2.48
0.29
Histologic Grade
I
II
III-IV
0/2
2/14
6/15
0.0
12.5
33.3
2.02
0.57
Nuclear Grade
I
II
III
1/4
3/21
6/13
20.0
12.5
31.6
2.34
0.31
Histological Type
Lobular
Ductal
Others
2/7
7/30
1/2
22.2
18.9
33.3
0.38
0.83
Estrogen Receptor
Negative
Positive
3/8
6/31
27.3
16.2
0.68
0.33
NS, Chi-square test
of malignant tumors did it. Unexpectedly, the peritumoral "normal" tissue did not show positive staining (data not shown).
GPC3 immunoreactivity, when categorized into negative versus positive expression, was not associated with the tested clinical-pathological parameters (Table 6). Furthermore, no association was found between GPC3 and the expression of Ki67 or HER-2 (data not shown).
The evaluation of the DFS time was carried out in a group of 27 breast cancer patients. No association was found between GPC3 expression at protein level and relapse (Fig. 5).
DISCUSSION
Here we demonstrated GPC3 expression in human breast cancer both at mRNA and protein levels. To our knowledge, no previous studies were performed at both levels of expression, in a large cohort of patients with this disease. It has been shown that while normal breast tissues are GPC3 positive, the expression of GPC3 is silenced in human breast cancer [12]. This analysis was conducted over a decade ago by in situ hybridization, employing 12 breast cancer samples. It is noteworthy that although the authors concluded that GPC3 was silenced by hypermethylation of its promoter in breast tumors, 5 of the 12 samples analyzed had detectable

22 The Open Cancer Journal, 2015, Volume 8 Castillo et al.
expression of GPC3. In contrast, using microarray technology comprising 4,387 tissue samples from 139 tumor categories and 36 non-neoplastic and pre-neoplastic tissue types, another group concluded that normal breast tissues are negative for GPC3 [13]. The immunohistochemical expre-ssion of GPC3 was detected in 3/27 (11%) of tubular breast carcinomas, 4/48 (8%) of invasive ductal breast carcinomas, and 9/46 (19.5%) of invasive lobular breast carcinomas.
Here, we analyzed GPC3 expression at mRNA level in
biopsies from Argentine and Brazilian breast cancer patients.
We found that 72% of tumor tissues from Argentina and
69% of tumor samples from Brazil express GPC3 mRNA.
Meanwhile, 100% of Argentine peritumoral “normal”
samples and 91% of Brazilian ones were GPC3 mRNA
positive. Paired breast cancer lesions and adjacent non-
cancerous tissues were found to have different expression of
GPC3 mRNA levels in Argentine patients, with cancer
lesions displaying relatively lower expression of this
glypican.
We also analyzed GPC3 expression at protein level by
IHC, in 69 breast tumors, as well as in 10 peritumoral
“normal” samples from Argentine patients. The number of
samples with positive labeling was low (10% for non-
malignant tumors and 20% for carcinomas). In opposition to
Xiang et al. [12] and in agreement with Baumhoer et al.
[13], we did not find positive labeling for GPC3 in “normal”
adjacent mammary tissues.
We hypothesize that the discrepancy between our IHC and qRT-PCR analyzes may be due to differences in the sensitivity of the procedure employed. Inconsistencies between IHC and qRT-PCR have been previously reported [14]. There are limitations inherent to the reliability and reproducibility of IHC techniques. We suggest that qRT-PCR would be a most appropriate method to assess GPC3 levels in breast tissues. This indication is even more applicable when we take into account that glypicans may be secreted into the medium [15]. In addition, it is established that GPC3 is composed of two subunits that are linked by disulfide bonds [16]. If GPC3 protein analysis is run under reducing conditions, the two GPC3 subunits will be separated, and an antibody directed against the NH2 terminus would not yield any positive staining (since the COOH-terminal fragment is the one which remains anchored to the membrane). Finally, it is not possible to rule out the existence of a differential translational control, characterized by the differential utilization of pre-existing mRNAs, in normal and tumor breast tissues. Changes either in the pool size or the phosphorylation state of translation initiation factors (eIFs) leads to general variations in translation. Other mechanisms include alterations in translation elongation or poly(A) tail-length modulation [17]. Recently, it has been proposed that GPC3 overexpression in HCCs is linked to the down-regulation of an specific microRNAs [18]. Therefore, we hypothesize that normal breast tissue may express detectable levels of GPC3 messenger, although it is not subsequently translated into protein.
Fig. (5). Kaplan-Meier disease-free survival (DFS) curve according to IHC GPC3 expression. Cases were stratified into negative GPC3
protein immunostaining and positive GPC3 protein immunostaining. The graph shows the Kaplan–Meier curve of DFS stratified by GPC3 protein expression. Log rank test= 1.64, p-value=0.2.
Cu
mu
lati
ve S
urv
ival
GPC3 -
GPC3 +0.6
0.7
0.8
0.9
1.0
1.1
0.5
605040302010
Time (month)
70

GPC3 Expression in Human Breast Cancer The Open Cancer Journal, 2015, Volume 8 23
In summary, although GPC3 would be silenced in breast cancer due to promoter hypermethylation [12], our study showed GPC3 expression at both protein and mRNA levels in breast biopsies. Therefore, silencing of GPC3 could be a characteristic event in certain subgroups of breast cancers.
We also analyzed whether GPC3 is associated with any of the known clinical-pathological parameters, as well as with cell proliferation (Ki67), with the expression of HER-2 and hormonal receptors (ER and PR), and with triple negative tumor phenotype. We found that neither GPC3 mRNA nor protein expression in Argentine and Brazilian samples is associated with any of the established prognosis parameters. This suggests that GPC3 might be an independent biomarker. In order to determine whether GPC3 expression has impact on DFS, we plotted the Kaplan-Meier curves. Surprisingly, we found evidence that GPC3 would be indicative of poor prognosis in breast cancer patients. These findings encourage evaluating GPC3 expression in a larger cohort of breast cancer patient in order to determine its actual value as predictor for prognosis and survival.
It is known that animal models have provided a breakthrough in cancer research, but the results obtained in animals can not always be directly extrapolated to human. Since we have previously shown in a murine model that GPC3 acts as a metastasis suppressor [7-10], a comprehe-nsive analysis of the molecular mechanism of GPC3 role in the development and progression of human breast cancer is eagerly awaited. We do believe that the progress in GPC3 signaling research will provide new insights to attack targets involved in metastasis, offering unique opportunities for the development of "intelligent" therapeutics, which will lead to novel alternatives to treat breast cancer patients.
In conclusion, our results indicate differential expression of GPC3 in mammary tumors in compare to normal breast tissues. They also point GPC3 as a possible prognostic indicator in breast cancer patients, and suggest the importance of deepen the study.
CONFLICT OF INTEREST
All authors would like to confirm the inexistence of any financial and personal relationships with other people or organizations that could inappropriately influence our work.
ACKNOWLEDGEMENTS
We would like to give our thanks to Dr. Stella Maris Ranuncolo for her invaluable assistance in preparing this manuscript. The work was supported by grant from FONCyT (PICT 2008-1387-Préstamo BID 1728/OC-AR), Ministry of Science and Technical Argentina.
REFERENCES
[1] Smith AW, Alfano CM, Reeve BB, et al. Race/ethnicity, physical
activity, and quality of life in breast cancer survivors. Cancer Epidemiol Biomarkers Prev 2009; 18: 656-63.
[2] Filmus J. Glypicans in growth control and cancer. Glycobiology 2001; 11: 19R-23R.
[3] Iglesias BV, Centeno G, Pascuccelli H, et al. Expression pattern of glypican-3 (GPC3) during human embryonic and fetal
development. Histol Histopathol 2008; 23: 1333-40. [4] Toretsky JA, Zitomersky NL, Eskenazi AE, et al. Glypican-3
expression in Wilms tumor and hepatoblastoma. J Pediatr Hematol Oncol 2001; 23: 496-9.
[5] Capurro M, Wanless IR, Sherman M, et al. Glypican-3: a novel serum and histochemical marker for hepatocellular carcinoma.
Gastroenterology 2003; 125: 89-97. [6] Maeda D, Ota S, Takazawa Y, et al. Glypican-3 expression in clear
cell adenocarcinoma of the ovary. Mod Pathol 2009; 22: 824-32. [7] Peters MG, Farias E, Colombo L, Filmus J, Puricelli L, Bal de Kier
Joffe E. Inhibition of invasion and metastasis by glypican-3 in a syngeneic breast cancer model. Breast Cancer Res Treat 2003; 80:
221-32. [8] Buchanan C, Lago MAH, Peters MG. Metastasis suppressors: basic
and translational advances. Curr Pharm Biotechnol 2011; 12: 1948-60.
[9] Stigliano I, Puricelli L, Filmus J, Sogayar MC, Bal de Kier Joffe E, Peters MG. Glypican-3 regulates migration, adhesion and actin
cytoskeleton organization in mammary tumor cells through Wnt signaling modulation. Breast Cancer Res Treat 2009; 114: 251-62.
[10] Buchanan C, Stigliano I, Garay-Malpartida HM, et al. Glypican-3 reexpression regulates apoptosis in murine adenocarcinoma
mammary cells modulating PI3K/Akt and p38MAPK signaling pathways. Breast Cancer Res Treat 2010; 119: 559-74.
[11] Nakatsura T, Kageshita T, Ito S, et al. Identification of glypican-3 as a novel tumor marker for melanoma. Clin Cancer Res 2004; 10:
6612-21. [12] Xiang YY, Ladeda V, Filmus J. Glypican-3 expression is silenced
in human breast cancer. Oncogene 2001; 20: 7408-12. [13] Baumhoer D, Tornillo L, Stadlmann S, Roncalli M, Diamantis EK,
Terracciano LM. Glypican 3 expression in human nonneoplastic, preneoplastic, and neoplastic tissues: a tissue microarray analysis
of 4,387 tissue samples. Am J Clin Pathol 2008; 129: 899-906. [14] Oda M, Arihiro K, Kataoka T, Osaki A, Asahara T, Ohdan H.
Comparison of immunohistochemistry assays and real-time reverse transcription-polymerase chain reaction for analyzing hormone
receptor status in human breast carcinoma. Pathol Int 2010; 60(4): 305-15.
[15] Watanabe K, Yamada H, Yamaguchi Y. K-glypican: a novel GPI-anchored heparan sulfate proteoglycan that is highly expressed in
developing brain and kidney. J Cell Biol 1995; 130: 1207-18. [16] De Cat B, Muyldermans SY, Coomans C, et al. Processing by
proprotein convertases is required for glypican-3 modulation of cell survival, Wnt signaling, and gastrulation movements. J Cell Biol
2003; 163: 625-35. [17] Garcia-Sanz JA, Mikulits W, Livingstone A, Lefkovits I, Mullner
EW. Translational control: a general mechanism for gene regulation during T cell activation. FASEB J 1998; 12: 299-306.
[18] Maurel M, Jalvy S, Ladeiro Y, et al. A functional screening identifies five microRNAs controlling glypican-3: role of miR-
1271 down-regulation in hepatocellular carcinoma. Hepatology 2013; 57(1): 195-204.
Received: December 06, 2014 Revised: February 15, 2015 Accepted: February 19, 2015
© Castillo et al.; Licensee Bentham Open.
This is an open access article licensed under the terms of the Creative Commons Attribution Non-Commercial License (http://creativecommons.org/licenses/by-
nc/3.0/), which permits unrestricted, non-commercial use, distribution and reproduction in any medium, provided the work is properly cited.