exporter guide annual is increasing competition in the scope and range of product offerings,...
TRANSCRIPT

1
THIS REPORT CONTAINS ASSESSMENTS OF COMMODITY AND TRADE ISSUES MADE BY
USDA STAFF AND NOT NECESSARILY STATEMENTS OF OFFICIAL U.S. GOVERNMENT
POLICY
Approved By:
Prepared By:
Report Highlights:
In 2010, Portugal’s agriculture, fish and forest product imports from the United States were valued at $264
million, up 53 percent from the previous year, but still far from the $375 million achieved in 2008. Fish and
seafood, tree nuts and other consumer-oriented products continue to offer the best U.S. export opportunities in
Portugal. This report provides guidance to U.S. companies interested in exporting consumer-oriented food
products to Portugal and includes an overview of the country's economic situation, market structure, and export
requirements.
Date:
GAIN Report Number:
Post: Madrid
PT1101
3/17/2011
Diogo Machado Mendes
Agricultural Specialist
Robert Hanson
Agricultural Attaché
EXPORTER GUIDE ANNUAL
Portugal
Required Report - public distribution

2
SECTION I. MARKET OVERVIEW
Portugal Economic Trends
Portugal’s population is approximately 10.6 million. Due to a deficit in the trade balance of
agricultural and food goods Portugal relies heavily on imports to supply its population. In 2010
imports of consumer oriented products fell by 3.8% from the previous year to 5.2 billion USD as a
result of declines in both intra-EU trade and extra-EU trade. Portugal was affected by the
international financial crisis in 2008 and is still struggling to recover. Unemployment is currently
above 11%, the budget deficit is 9.3%, and the country has one of the highest levels of private and
public debt in the EU. According to European Union forecasts, labor market conditions are
expected to improve only towards the end of 2012 following the recovery in private investment
activity.
Portugal is a very good gateway into third markets as it keeps close business ties with countries
and territories including Brazil, Macau, Angola, Mozambique, and other African countries, where
Portuguese is spoken by over 250 million people. Portugal is also an excellent entry point into the
EU market. English is widely spoken, the population is friendly toward Americans, and the
country has one of the lower commercial cost business environments in Western Europe.
Table 1: Selected Indicators
2009 2010 2011 2012
GDP growth (%, year-on-year) -2.6 1.3 -1.0 0.8
Inflation (%, year-on-year) -0.9 1.4 2.3 1.3
Unemployment (%) 9.6 10.5 11.1 11.2
Public budget balance (% of GDP) -9.3 -7.3 -4.9 -5.1
Current account balance (% of GDP) -10.4 -10.7 -8.0 -6.7
Source: European Commission – European Economic Forecast autumn 2010
http://ec.europa.eu/economy_finance/eu/forecasts/2010_autumn_forecast_en.htm
3
Table 2: Advantages and Challenges of U.S. Agricultural Products in Portugal
Advantages Challenges Portugal is a net importer of food and
agricultural products. U.S. food and agricultural
products have a good reputation for quality. Competition from neighboring EU countries is fierce.
Good gateway to the Iberian Peninsula, Europe,
and Portuguese speaking countries. U.S. exports face higher transportation costs and
difficulties in shipping mixed or smaller container loads.
Domestic distribution systems are efficient. Supermarkets and hypermarkets shelf space is expensive.
Access the Portuguese market through
multinational chains like SONAE, Jeronimo
Martins, Auchan and El Corte Ingles.
High marketing costs (advertising, discounts, etc.) are
necessary. U.S. suppliers, determined to maintain market
share, may need to conduct annual promotion activities.
Consumers are more health conscious and
demand has been growing for value-added
products, convenience foods and functional
foods.
Importers prefer to take delivery on short notice to avoid
storage charges.
Favorable dollar exchange rate – U.S. exports
are very competitive. Household disposable income is getting lower as the
economic crisis unfolds in the country.
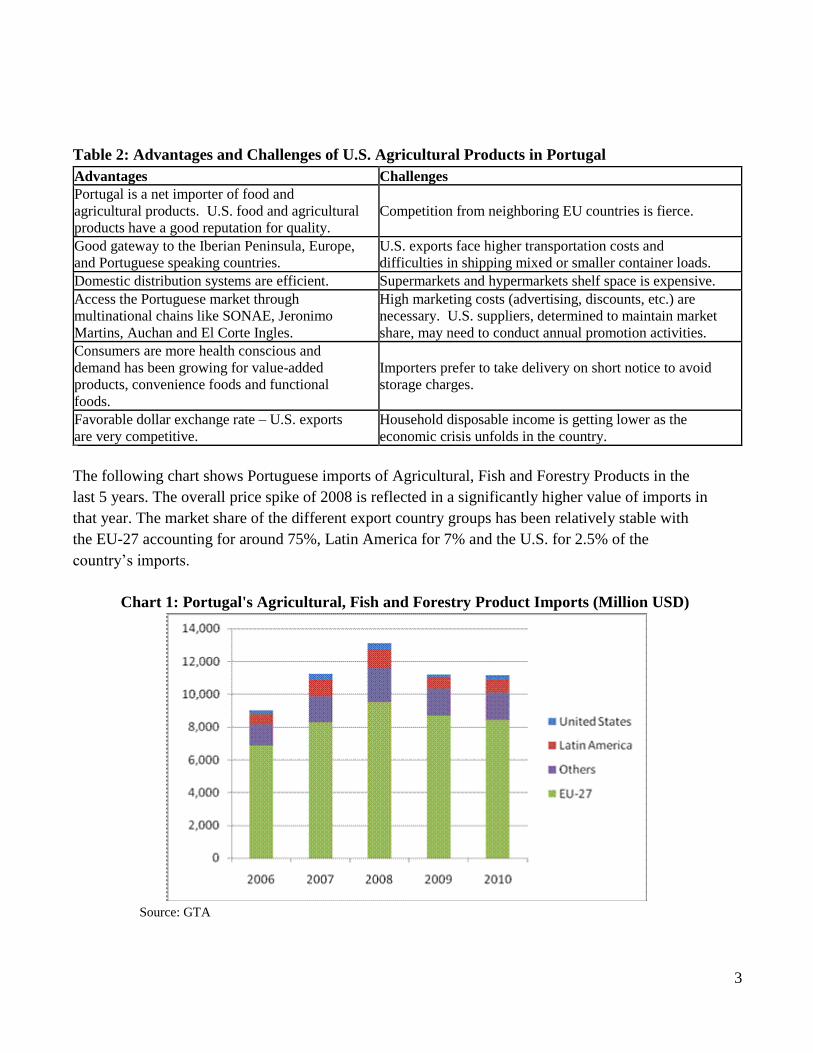
The following chart shows Portuguese imports of Agricultural, Fish and Forestry Products in the
last 5 years. The overall price spike of 2008 is reflected in a significantly higher value of imports in
that year. The market share of the different export country groups has been relatively stable with
the EU-27 accounting for around 75%, Latin America for 7% and the U.S. for 2.5% of the
country’s imports.
Chart 1: Portugal's Agricultural, Fish and Forestry Product Imports (Million USD)
Source: GTA

4
In 2010 there was an overall 53% increase in the value of U.S. exports of agricultural, fish and
forest products to Portugal (see chart below), which follows largely from the evolution of world
prices. The Bulk group of products continues to be the most important with sales worth 135 million
USD (51% of the total), followed by fish products worth 51.5 million USD (19%), forest products
worth 43 million USD (16%), intermediate goods worth 21.5 million USD (8%) and consumer
ready products worth 12.8 million USD (8%).
Chart 2: U.S. Exports to Portugal of Agricultural, Fish and Forest Products (Million USD)
Source: GTA
SECTION II. EXPORTER BUSINESS TIPS
Local Business Practices
Success in introducing your product in the Portugal market depends on acquiring local representation
and making personal contact. The advantages of local representation include market knowledge, up-to-
date information and guidance on business practices and trade laws, sales contacts, and market
development expertise. Good contacts are important for the exporter to be aware of future contracts and
participate in tenders. Having a distributor that is appointed on an exclusive basis is ideal.
While modern sales techniques are becoming more prevalent, many business people still prefer
personal contact as a way of doing business rather than just via email, fax or phone. English is a
widely spoken second language in Portugal, and U.S. exporters can expect to conduct their
meetings with contacts in English.
Large importers and wholesalers have branch sales offices and/or sub-agents or dealers in the principal
cities and towns, with main offices concentrated in Porto and Lisbon. Typically, food products are

5
imported by an importer, broker and/or a distributor.
General Consumer Tastes and Preferences
The traditional Portugal diet is the co-called ―Mediterranean Diet‖, which is based on seafood,
meat, vegetables, salads, fresh fruits, olive oil and wine, is being challenged. As consumers have
less time for food preparation, the Portugal market is increasingly characterized by a trend towards
more novelties and specialties, less basic foodstuffs, more ―natural‖ and delicatessen foods, more
prepared and ready to eat products favoring convenience. Consumers are also increasingly
responding to high quality and attractive packaging.
Influenced by constant advertising in the daily and weekly press and TV, consumers tend to follow
fashionable trends, use new products and adopt new consumption habits. Increasing travel abroad
by Portuguese, as well as a growing influx of foreign tourists into Portugal is also increasing
demand for new products and an interest in ethnic foods, in particular. In addition, Portugal
consumers are health conscious about food. Problems or potential problems concerning food
safety are widely publicized and usually receive immediate attention from government agencies.
Food Standards and Regulations
For more information on food standards and regulations, please consult the Food and Agricultural
Import Regulations and Standards Report (FAIRS) and the FAIRS Export Certificate Report for the EU
at: http://www.fas.usda.gov/scriptsw/AttacheRep/default.asp. Also, please check the U.S. Mission to
the European Union web page at http://www.useu.be/agri/expguide.html for helpful information on
exporting U.S. food and agricultural products into the EU.
Import and Inspection Procedures
Portugal uses the Harmonized Nomenclature and Classification System (HS) and applies import
duties according to a maximum and minimum rate schedule. The minimum tariff rate is applied to
goods originating in countries entitled to the benefits of most-favored nation treatment (that is,
members of the World Trade Organization (WTO) and countries with which the EU has signed
trade agreements) including the United States. However, the EU has negotiated free-trade
agreements, providing in many cases tariff-free access to the European market, which can leave
the U.S. exporter at a disadvantage.
The local importer is the first responsible to the Portuguese Government of imported food products
when they enter Portuguese territories. Therefore, the Portuguese agent/importer should guide you
through the whole process to market your product in Portugal.
The following documents are required for ocean or air cargo shipments of food products to

6
Portugal:
Bill of Lading and/or Airway Bill
Commercial Invoice
Phytosanitary Certificate and/or Health Certificate when applicable
Import Certificate
Most food products require an Import Certificate issued by the competent Portuguese authority.
However, the Import Certificate is obtained by the Portuguese importer and/or the agent involved
in the business and is intended for tariff classification purposes.
Please keep in mind that if the product you are exporting into Portugal does not comply with EU
harmonized regulations, Portuguese customs or health authorities may not allow entry of the product.
SECTION III. MARKET SECTOR STRUCTURE AND TRENDS
Food Retail Sector
The Portugal retail food market is diversified. Hypermarkets/supermarkets, convenience stores,
major discount stores and specialized stores coexist with the traditional corner grocery stores and
open-air markets, even though the total number of retail outlets has decreased significantly in the
last decade:
In Portugal, hyper and supermarkets account for 60 percent of total food sales. There has been
consolidation in the sector with the five larger distribution companies having now an aggregated
market share of 64%, which is about the EU average.
There is increasing competition in the scope and range of product offerings, including ready-to-
eat and/or ready-to-cook foods, take away meals, and home delivery and the prices and services
retailers offer consumers.
An increasing supply of imported products has intensified competition among suppliers and
retailers.
EU Member States are the first suppliers of imported consumer-ready products, including
seafood.

7
Diagram 1: Retail Market Structure:
For more information on the Portugal Retail Food Sector, please consult
http://www.fas.usda.gov/scriptsw/AttacheRep/default.asp for the latest retail sector reports for Portugal.
HRI Sector
The HRI sector expanded significantly during the mid 80’s and 90’s and into the 2000’s, as a result
of the profound social and economic changes unleashed upon Portugal’s accession to the European
Union (EU) in 1986. The expansion is not yet complete, nor has it slowed much over the years, so
we expect that the sector will be of growing interest to some U.S. exporters.
Synopsis of the HRI sector:
Portugal is becoming one of the top tourism destinations in Europe with the number of
tourists increasing every year, boosting demand for meals in the HRI sector;
Restaurant chains, including ethnic and fast food, are gaining market share and are expected
to continue growing; and,
Consumption of ready-to-eat/take away food continues to grow as consumers substitute
home-cooked for convenience and timesaving. Most hyper and supermarket chains now
offer ready-to-eat/take away food, and there is an increasing number of food outlets
specializing in take-away food, ranging from barbecue to more traditional meals.

8
Diagram 2: HRI Market Structure:
For more information on the Portugal HRI Sector, please consult the HRI sector report for Portugal at
http://www.fas.usda.gov/scriptsw/AttacheRep/default.asp
Food Processing Sector
The Portugal food-processing sector has modernized and expanded significantly during the last
couple of decades. With integration into the European Union in 1986, the Portugal food-
processing sector began a profound modernization in order to adapt to new EU requirements.
Portugal now has some of the most competitive food processing industries in Europe, which makes
this sector an important target for U.S. food-ingredient exporters.
The Portugal food-processing sector in summary:
Modern, with special attention to the quality, safety, and traceability of the food products it
produces.
Generates about 16 percent of Portugal’s total industrial production, accounting for about
7.6 percent of the national gross domestic product.

9
Comprises around 11,000 companies that employ an estimated 111,000 people;
Is dominated by medium and small companies—only 2.8 percent of the companies employ
more than 50 people and 80 percent employ less than 10 people.
Diagram 3: Food Processing Market Structure:
For more information on the Portugal food processing sector, please consult the food processing sector report for
Portugal at http://www.fas.usda.gov/scriptsw/AttacheRep/default.asp
10
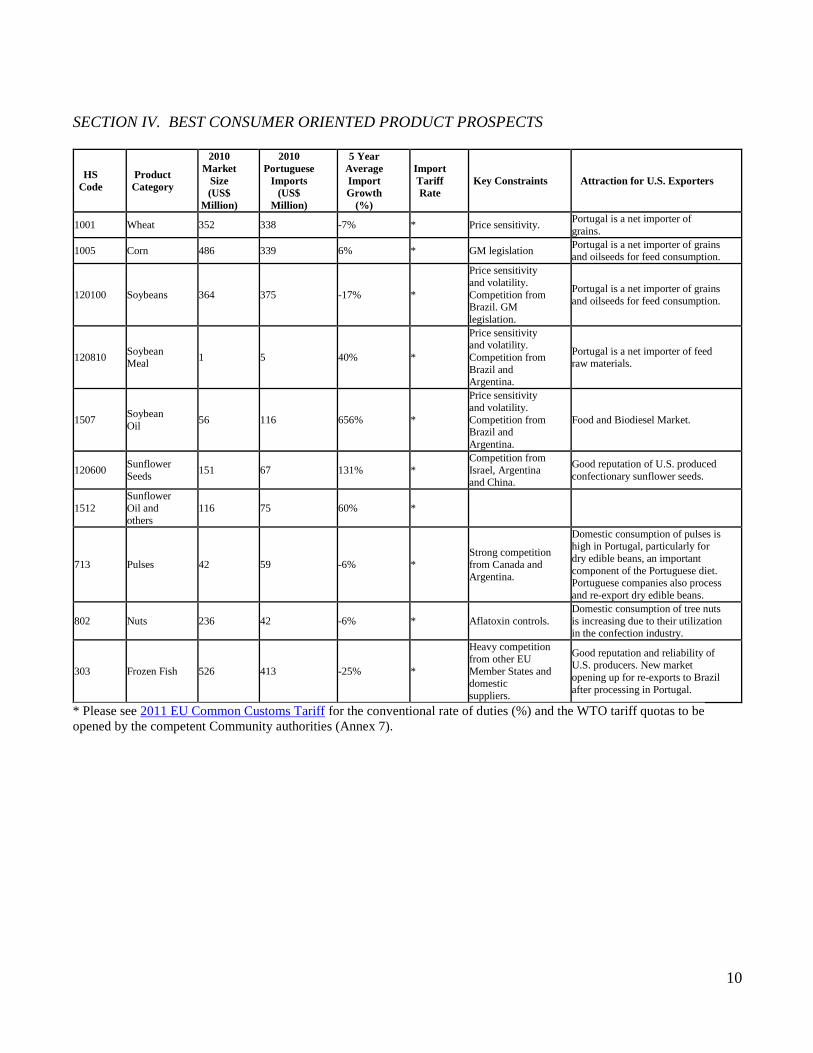
SECTION IV. BEST CONSUMER ORIENTED PRODUCT PROSPECTS
HS
Code Product
Category
2010
Market
Size
(US$
Million)
2010
Portuguese
Imports
(US$
Million)
5 Year
Average
Import
Growth
(%)
Import
Tariff
Rate Key Constraints Attraction for U.S. Exporters
1001 Wheat 352 338 -7% * Price sensitivity. Portugal is a net importer of
grains.
1005 Corn 486 339 6% * GM legislation Portugal is a net importer of grains and oilseeds for feed consumption.
120100 Soybeans 364 375 -17% *
Price sensitivity
and volatility.
Competition from Brazil. GM
legislation.
Portugal is a net importer of grains
and oilseeds for feed consumption.
120810 Soybean Meal 1 5 40% *
Price sensitivity and volatility.
Competition from
Brazil and Argentina.
Portugal is a net importer of feed raw materials.
1507 Soybean
Oil 56 116 656% *
Price sensitivity
and volatility.
Competition from Brazil and
Argentina.
Food and Biodiesel Market.
120600 Sunflower
Seeds 151 67 131% * Competition from
Israel, Argentina and China.
Good reputation of U.S. produced
confectionary sunflower seeds.
1512 Sunflower
Oil and
others 116 75 60% *
713 Pulses 42 59 -6% * Strong competition
from Canada and
Argentina.
Domestic consumption of pulses is high in Portugal, particularly for
dry edible beans, an important
component of the Portuguese diet. Portuguese companies also process
and re-export dry edible beans.
802 Nuts 236 42 -6% * Aflatoxin controls. Domestic consumption of tree nuts
is increasing due to their utilization in the confection industry.
303 Frozen Fish 526 413 -25% *
Heavy competition
from other EU
Member States and domestic
suppliers.
Good reputation and reliability of U.S. producers. New market
opening up for re-exports to Brazil
after processing in Portugal.
* Please see 2011 EU Common Customs Tariff for the conventional rate of duties (%) and the WTO tariff quotas to be
opened by the competent Community authorities (Annex 7).
11
SECTION V. KEY CONTACTS AND FURTHER INFORMATION
If you have any questions or comments regarding this report or need assistance exporting to Portugal,
please contact the Office of Agricultural Affairs in Madrid at the following address:
Foreign Agricultural Service
American Embassy, Madrid American Embassy, Madrid
PSC 61, Box 20 C/ Serrano, 75
APO AE 09642 28006 Madrid
Tel. 34-91 587 2555 Spain
Fax: 34-91 587 2556
Email: [email protected]
http://spanish.madrid.usembassy.gov/
Please consult our home page for more information on exporting U.S. food products to
Portugal. Importer lists are also available from our office to exporters of U.S. food products.
A list of trade associations and useful government agencies is provided below:
PORTUGAL
Trade Associations
APED-Associação Portuguesa de Empresas de Distribuição
(Portuguese Association of Distribution Companies)
Campo Grande, 285-5º
1700-096 Lisboa
Tel: 351-21-751-0920
Fax: 351-21-757-1952
www.aped.pt
ARESP-Associação da Restauração e Similares de Portugal
(Portuguese Associations for HRIs Sector)
Av. Duque d’Avila, 75
1000 Lisboa
Tel. 351-21-352-7060
Fax: 351-21-354-9428
Email: [email protected]
www.aresp.pt
FIPA-Federação das Indústrias Portuguesas Agro-Alimentares
(Federation of the Agro-Food Portuguese Industries)
Av. António José de Almeida, 7-2º
1000-042 Lisboa
Tel: 351-21-793-8679

12
Fax: 351-21-793-8537
Email: [email protected]
www.fipa.pt
Government Agencies
ASAE - Autoridade da Segurança Alimentar e Económica
(Food Safety and Economic Authority)
Av. Conde de Valbom, 98
1069-185 Lisboa
Tel. 217 983 600
Fax: 217 983 654
Email: [email protected]
www.asae.pt
Direcção Geral da Alfandega e Dos Impostos Especiais sobre o Consumo
(General Directorate for Customs and Special Taxation on Consumption)
Rua da Alfandega, No. 5 r/c
1149-006 Lisboa
Tel. 351-218813700
Fax: 351-218813990
Email: [email protected]
www.dgaiec.min-financas.pt
Direcção Geral da Alfandega e Dos Impostos Especiais sobre o Consumo
(General Directorate for Customs and Special Taxation on Consumption)
Direcção de Serviços do Licenciamentos (Import Certificates)
R. Terreiro do Trigo
Edif. Alfândega
1149-060 Lisboa
Tel. 351-218814262
Fax 351-218814261
Email: [email protected]
www.dgaiec.min-financas.pt
For more information on exporting U.S. agricultural products to other countries, please visit the Foreign
Agricultural Service home page at www.fas.usda.gov

13
APPENDIX - STATISTICS
A. KEY TRADE & DEMOGRAPHIC INFORMATION
Agricultural Imports From All Countries ($Mil) / U.S. Market Share (%) (1) - 2010 $8,634/1.96% Consumer Food Imports From All Countries($Mil)/U.S. Market Share (%)(1) 2010 $5,183/0.25% Edible Fishery Imports From All Countries ($Mil) / U.S. Market Share (%)(1) - 2010 $1,749/2.95% Total Population (Millions) / Annual Growth Rate (%) - 2010 10.7/0.3% Urban Population (Millions) / Annual Growth Rate (%) – 2010 5.8/0.4% Number of Major Metropolitan Areas (2) 2 Per Capita Gross Domestic Product (PPP) - 2010 $21,700 Unemployment Rate (%) - 2010 10.50% Per Capita Food Expenditures (Euros) - 2010 1300 Percent of Female Population Employed - 2010 48% Exchange Rate (US$1 = 1 Euro) - March 2011 0.72
(1) GTA (2) Population in excess of 1,000,000

14
B. CONSUMER FOOD & EDIBLE FISHERY PRODUCT IMPORTS
Portugal Imports Imports from the World Imports from the U.S. U.S Market Share %
(In Millions of Dollars) 2008 2009 2010 2008 2009 2010 2008 2009 2010
CONSUMER-ORIENTED AGRICULTURAL
TOTAL 5,709 5,390 5,183 12.7 14.5 12.8 0.22 0.27 0.25
Snack Foods (Excl. Nuts) 419 397 375 0.5 0.6 0.6 0.13 0.16 0.16
Breakfast Cereals & Pancake Mix 101 93 81 0.0 0.0 0.0 0.04 0.03 0.05
Red Meats Fresh/Chilled/Frozen 927 928 864 0.0 0.0 0.0 0.00 0.00 0.00
Red Meats Prepared/Preserved 198 194 184 0.0 0.0 0.0 0.00 0.00 0.00
Poultry Meat 105 108 109 0.0 0.0 0.0 0.00 0.00 0.00
Dairy Products (Excl. Cheese) 652 571 514 0.0 0.1 0.0 0.00 0.01 0.01
Cheese 219 192 187 0.0 0.0 0.0 0.00 0.00 0.00
Eggs & Products 35 44 34 0.0 0.1 0.0 0.00 0.21 0.00
Fresh Fruit 662 569 602 0.0 0.0 0.0 0.00 0.00 0.00
Fresh Vegetables 268 232 251 0.0 0.0 0.0 0.00 0.00 0.02
Processed Fruit & Vegetables 379 364 349 0.5 0.8 0.7 0.14 0.23 0.20
Fruit & Vegetable Juices 91 74 91 0.1 0.1 0.2 0.08 0.09 0.21
Tree Nuts 53 51 49 5.5 4.7 4.9 10.46 9.25 10.07
Wine & Beer 196 187 159 0.0 0.4 0.0 0.00 0.19 0.03
Nursery Products & Cut Flowers 166 111 110 0.1 0.1 0.0 0.04 0.12 0.01
Pet Foods (Dog & Cat Food) 150 156 141 1.3 0.6 0.5 0.87 0.36 0.35
Other Consumer-Oriented Products 1,090 1,120 1,084 4.5 7.0 5.7 0.42 0.62 0.53
FISH & SEAFOOD PRODUCTS 2,020 1,725 1,749 111.9 29.5 51.5 5.54 1.71 2.95
Salmon 38 45 61 0.6 1.5 1.7 1.49 3.28 2.83
Surimi 0 0 0 0.0 0.0 0.0 0.00 0.00 0.00
Crustaceans 262 246 243 0.4 0.2 0.0 0.16 0.08 0.02
Groundfish & Flatfish 552 366 368 17.8 3.0 2.5 3.23 0.83 0.67
Molluscs 215 220 237 0.2 0.1 0.5 0.10 0.05 0.19
Other Fishery Products 952 848 839 92.9 24.7 46.8 9.76 2.91 5.58
AGRICULTURAL PRODUCTS TOTAL 10,072 8,792 8,634 200.5 104.4 169.7 1.99 1.19 1.96 AGRICULTURAL, FISH & FORESTRY
TOTAL 13,092 11,210 11,156 374.6 172.9 264.2 2.86 1.54 2.37
Source: GTA
15
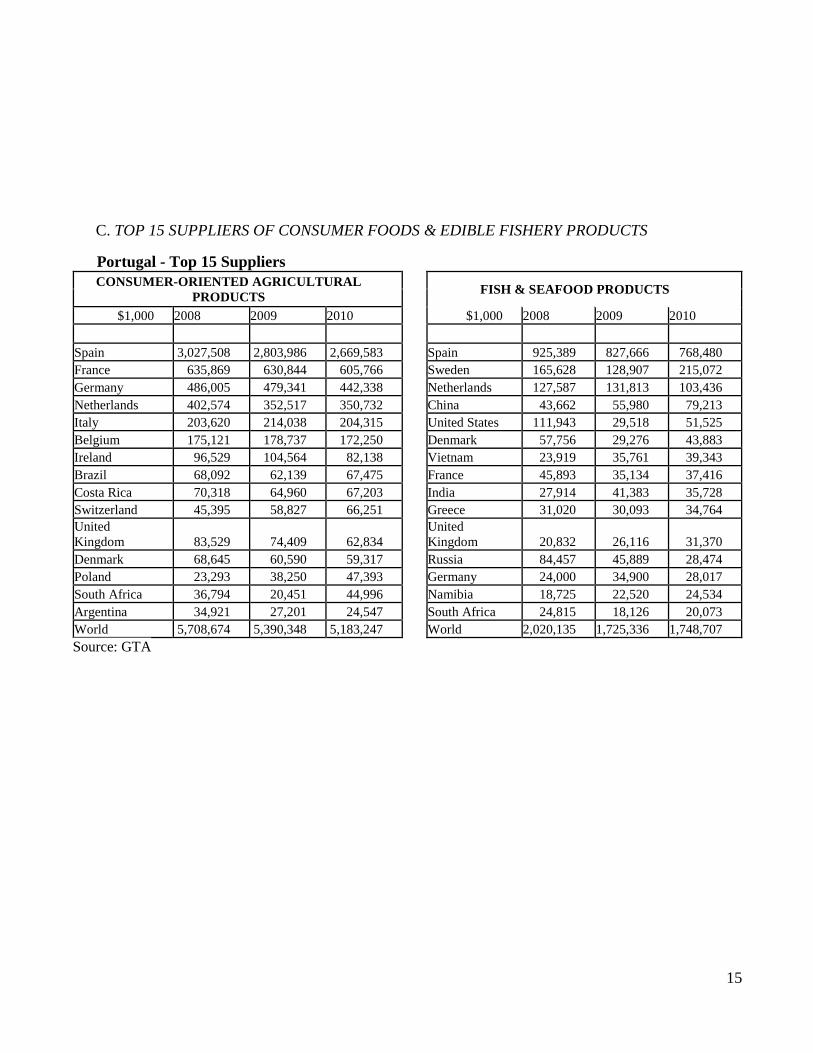
C. TOP 15 SUPPLIERS OF CONSUMER FOODS & EDIBLE FISHERY PRODUCTS
Portugal - Top 15 Suppliers
CONSUMER-ORIENTED AGRICULTURAL
PRODUCTS
FISH & SEAFOOD PRODUCTS
$1,000 2008 2009 2010 $1,000 2008 2009 2010
Spain 3,027,508 2,803,986 2,669,583 Spain 925,389 827,666 768,480 France 635,869 630,844 605,766 Sweden 165,628 128,907 215,072 Germany 486,005 479,341 442,338 Netherlands 127,587 131,813 103,436 Netherlands 402,574 352,517 350,732 China 43,662 55,980 79,213 Italy 203,620 214,038 204,315 United States 111,943 29,518 51,525 Belgium 175,121 178,737 172,250 Denmark 57,756 29,276 43,883 Ireland 96,529 104,564 82,138 Vietnam 23,919 35,761 39,343 Brazil 68,092 62,139 67,475 France 45,893 35,134 37,416 Costa Rica 70,318 64,960 67,203 India 27,914 41,383 35,728 Switzerland 45,395 58,827 66,251 Greece 31,020 30,093 34,764 United
Kingdom 83,529 74,409 62,834 United
Kingdom 20,832 26,116 31,370 Denmark 68,645 60,590 59,317 Russia 84,457 45,889 28,474 Poland 23,293 38,250 47,393 Germany 24,000 34,900 28,017 South Africa 36,794 20,451 44,996 Namibia 18,725 22,520 24,534 Argentina 34,921 27,201 24,547 South Africa 24,815 18,126 20,073 World 5,708,674 5,390,348 5,183,247 World 2,020,135 1,725,336 1,748,707
Source: GTA