export strategy manufacture of pulp, paper,...
TRANSCRIPT

This project is co-financed by the European fund for Regional Development through Operational programme “Development of the competitiveness of the Bulgarian economy” 2007 - 2013
Export Strategy
for sector
“MANUFACTURE OF
PULP, PAPER, BOARD,
AND ARTICLES”
Bulgarian Small and Medium Enterprises
Promotion Agency
2012
Operational programme “Development of the
Competitiveness of the Bulgarian Economy” 2007-2013, Priority
axis 4.2. “Strengtening the International market positions of
Bulgarian economy” Project № BG161РО003 – 4.2.01-0001
“Promotion of the Internationalization of the Bulgarian
Enterprises”

Page 2 of 130
This document was developed under project № BG161РО003 – 4.2.01-0001
“PROMOTION OF THE INTERNATIONALIZATION OF THE BULGARIAN
ENTERPRISES”.
Beneficiary: Executive agency for promotion of small and medium
enterprises.
This document was developed with the financial support of Operational
programme “ Development of the competitiveness of the Bulgarian economy”
2007 - 2013 co-financed by the European fund for Regional Development. The
overall responsibility of the document’s content lies with the Executive agency
for promotion of small and medium enterprises and under no circumstances it
can be accepted that this document reflects the official statement of the European
Union and the Contracting authority.
Page 3 of 130
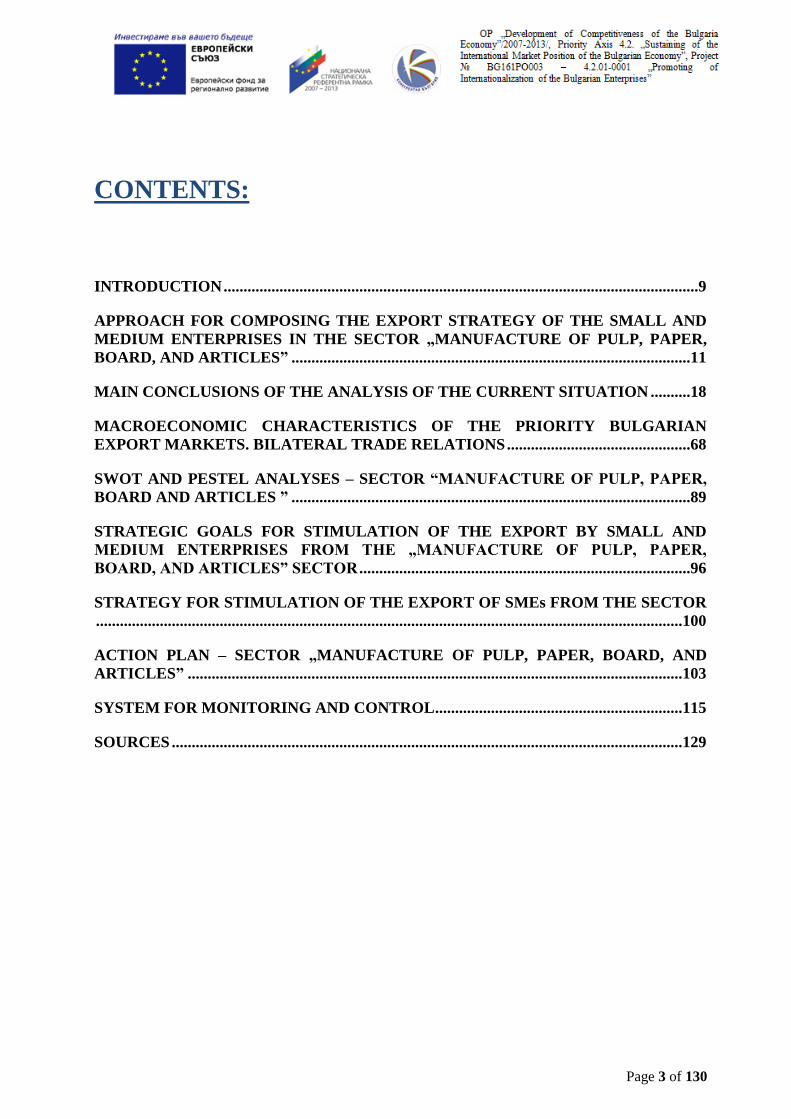
CONTENTS:
INTRODUCTION .......................................................................................................................9
APPROACH FOR COMPOSING THE EXPORT STRATEGY OF THE SMALL AND
MEDIUM ENTERPRISES IN THE SECTOR „MANUFACTURE OF PULP, PAPER,
BOARD, AND ARTICLES” ....................................................................................................11
MAIN CONCLUSIONS OF THE ANALYSIS OF THE CURRENT SITUATION ..........18
MACROECONOMIC CHARACTERISTICS OF THE PRIORITY BULGARIAN
EXPORT MARKETS. BILATERAL TRADE RELATIONS ..............................................68
SWOT AND PESTEL ANALYSES – SECTOR “MANUFACTURE OF PULP, PAPER,
BOARD AND ARTICLES ” ....................................................................................................89
STRATEGIC GOALS FOR STIMULATION OF THE EXPORT BY SMALL AND
MEDIUM ENTERPRISES FROM THE „MANUFACTURE OF PULP, PAPER,
BOARD, AND ARTICLES” SECTOR ...................................................................................96
STRATEGY FOR STIMULATION OF THE EXPORT OF SMEs FROM THE SECTOR
...................................................................................................................................................100
ACTION PLAN – SECTOR „MANUFACTURE OF PULP, PAPER, BOARD, AND
ARTICLES” ............................................................................................................................103
SYSTEM FOR MONITORING AND CONTROL ..............................................................115
SOURCES ................................................................................................................................129
Page 4 of 130
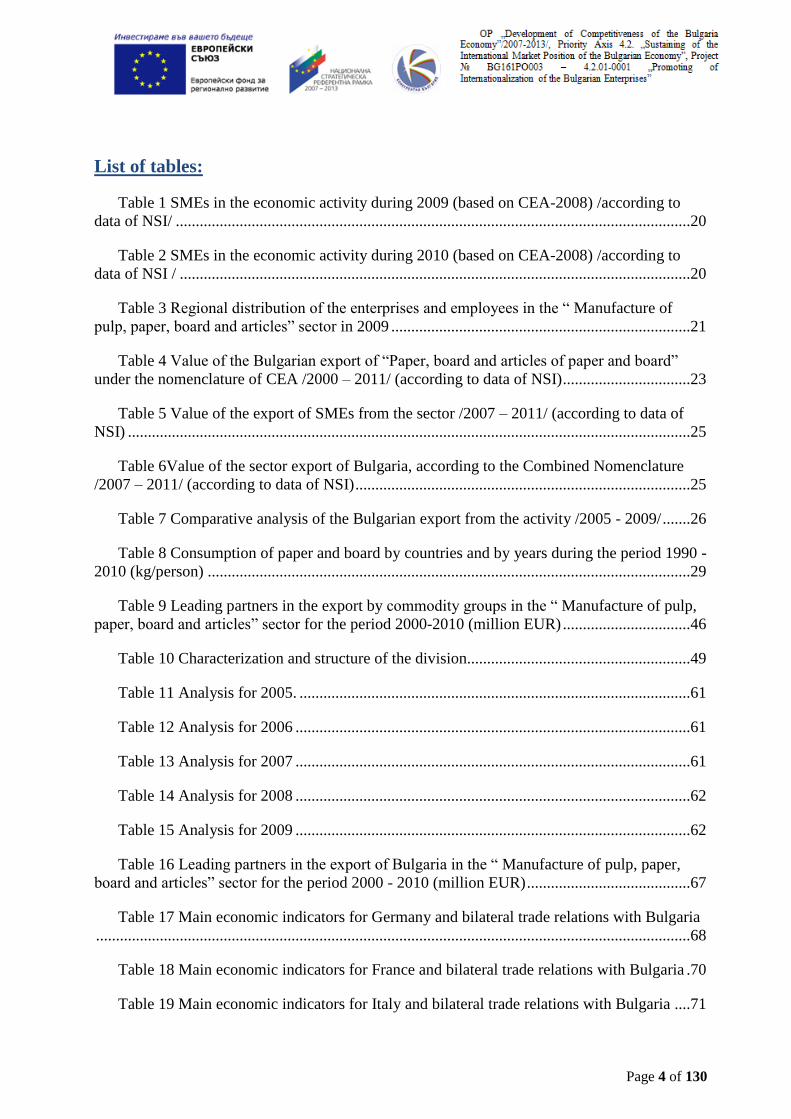
List of tables:
Table 1 SMEs in the economic activity during 2009 (based on CEA-2008) /according to
data of NSI/ .................................................................................................................................20
Table 2 SMEs in the economic activity during 2010 (based on CEA-2008) /according to
data of NSI / ................................................................................................................................20
Table 3 Regional distribution of the enterprises and employees in the “ Manufacture of
pulp, paper, board and articles” sector in 2009 ...........................................................................21
Table 4 Value of the Bulgarian export of “Paper, board and articles of paper and board”
under the nomenclature of CEA /2000 – 2011/ (according to data of NSI) ................................23
Table 5 Value of the export of SMEs from the sector /2007 – 2011/ (according to data of
NSI) .............................................................................................................................................25
Table 6Value of the sector export of Bulgaria, according to the Combined Nomenclature
/2007 – 2011/ (according to data of NSI) ....................................................................................25
Table 7 Comparative analysis of the Bulgarian export from the activity /2005 - 2009/ .......26
Table 8 Consumption of paper and board by countries and by years during the period 1990 -
2010 (kg/person) .........................................................................................................................29
Table 9 Leading partners in the export by commodity groups in the “ Manufacture of pulp,
paper, board and articles” sector for the period 2000-2010 (million EUR) ................................46
Table 10 Characterization and structure of the division........................................................49
Table 11 Analysis for 2005. ..................................................................................................61
Table 12 Analysis for 2006 ...................................................................................................61
Table 13 Analysis for 2007 ...................................................................................................61
Table 14 Analysis for 2008 ...................................................................................................62
Table 15 Analysis for 2009 ...................................................................................................62
Table 16 Leading partners in the export of Bulgaria in the “ Manufacture of pulp, paper,
board and articles” sector for the period 2000 - 2010 (million EUR) .........................................67
Table 17 Main economic indicators for Germany and bilateral trade relations with Bulgaria
.....................................................................................................................................................68
Table 18 Main economic indicators for France and bilateral trade relations with Bulgaria .70
Table 19 Main economic indicators for Italy and bilateral trade relations with Bulgaria ....71

Page 5 of 130
Table 20 Main economic indicators for Romania and bilateral trade relations with Bulgaria
.....................................................................................................................................................74
Table 21 Main economic indicators for Greece and bilateral trade relations with Bulgaria.76
Table 22 Main economic indicators for Turkey and bilateral trade relations with Bulgaria 79
Table 23 Main economic indicators for Serbia and bilateral trade relations with Bulgaria ..79
Table 24 Main economic indicators for Macedonia and bilateral trade relations with
Bulgaria .......................................................................................................................................81
Table 25 Main economic indicators for Russia and bilateral trade relations with Bulgaria .82
Table 26 SWOT and LOED analyses .................................................................................90
Table 27 PESTEL-analysis ...................................................................................................92
Table 28 Action Plan for Implementation of the Export Strategy of the Sector .................106
Table 29 Manufacture, import, export and consumption of paper, board and fibrous
materials of Bulgaria – 2001 /measure – ton/ ...........................................................................119
Table 30 Manufacture, import, export and consumption of paper, board and fibrous
materials of Bulgaria – 2002 /measure – ton/ ...........................................................................120
Table 31 Manufacture, import, export and consumption of paper, board and fibrous
materials of Bulgaria – 2003 /measure – ton/ ...........................................................................121
Table 32 Manufacture, import, export and consumption of paper, board and fibrous
materials of Bulgaria – 2004 /measure – ton/ ...........................................................................122
Table 33 Manufacture, import, export and consumption of paper, board and fibrous
materials of Bulgaria – 2005 /measure – ton/ ...........................................................................123
Table 34 Manufacture, import, export and consumption of paper, board and fibrous
materials of Bulgaria – 2006 /measure – ton/ ...........................................................................124
Table 35 Manufacture, import, export and consumption of paper, board and fibrous
materials of Bulgaria – 2007 /measure – ton/ ...........................................................................125
Table 36 Manufacture, import, export and consumption of paper, board and fibrous
materials of Bulgaria – 2008 /measure – ton/ ...........................................................................126
Table 37 Manufacture, import, export and consumption of paper, board and fibrous
materials of Bulgaria – 2009 /measure – ton / ..........................................................................127
Table 38 Manufacture, import, export and consumption of paper, board and fibrous
materials of Bulgaria – 2010 /measure – ton/ ...........................................................................128
Page 6 of 130
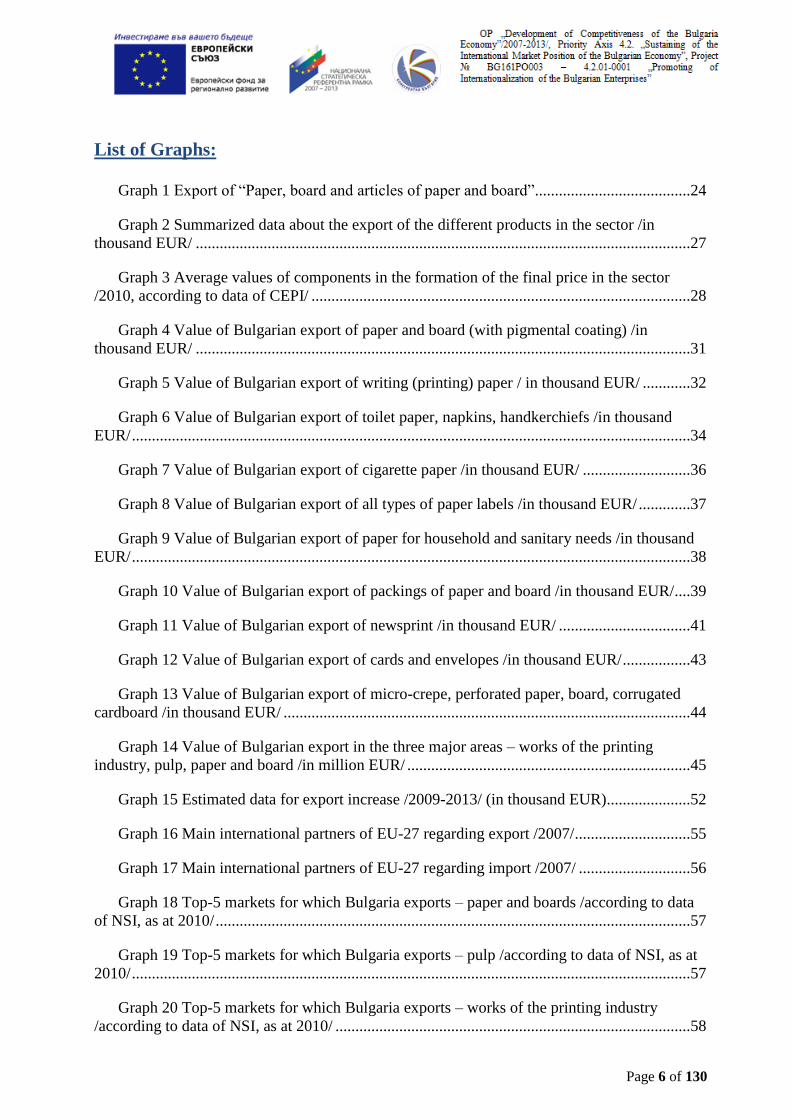
List of Graphs:
Graph 1 Export of “Paper, board and articles of paper and board”.......................................24
Graph 2 Summarized data about the export of the different products in the sector /in
thousand EUR/ ............................................................................................................................27
Graph 3 Average values of components in the formation of the final price in the sector
/2010, according to data of CEPI/ ...............................................................................................28
Graph 4 Value of Bulgarian export of paper and board (with pigmental coating) /in
thousand EUR/ ............................................................................................................................31
Graph 5 Value of Bulgarian export of writing (printing) paper / in thousand EUR/ ............32
Graph 6 Value of Bulgarian export of toilet paper, napkins, handkerchiefs /in thousand
EUR/ ............................................................................................................................................34
Graph 7 Value of Bulgarian export of cigarette paper /in thousand EUR/ ...........................36
Graph 8 Value of Bulgarian export of all types of paper labels /in thousand EUR/ .............37
Graph 9 Value of Bulgarian export of paper for household and sanitary needs /in thousand
EUR/ ............................................................................................................................................38
Graph 10 Value of Bulgarian export of packings of paper and board /in thousand EUR/ ....39
Graph 11 Value of Bulgarian export of newsprint /in thousand EUR/ .................................41
Graph 12 Value of Bulgarian export of cards and envelopes /in thousand EUR/ .................43
Graph 13 Value of Bulgarian export of micro-crepe, perforated paper, board, corrugated
cardboard /in thousand EUR/ ......................................................................................................44
Graph 14 Value of Bulgarian export in the three major areas – works of the printing
industry, pulp, paper and board /in million EUR/ .......................................................................45
Graph 15 Estimated data for export increase /2009-2013/ (in thousand EUR) .....................52
Graph 16 Main international partners of EU-27 regarding export /2007/ .............................55
Graph 17 Main international partners of EU-27 regarding import /2007/ ............................56
Graph 18 Top-5 markets for which Bulgaria exports – paper and boards /according to data
of NSI, as at 2010/ .......................................................................................................................57
Graph 19 Top-5 markets for which Bulgaria exports – pulp /according to data of NSI, as at
2010/ ............................................................................................................................................57
Graph 20 Top-5 markets for which Bulgaria exports – works of the printing industry
/according to data of NSI, as at 2010/ .........................................................................................58

Page 7 of 130
Graph 21 Export markets of the enterprises surveyed (in %) ...............................................59
Graph 22 Percentage distribution of the export by the number of the export markets .........59
Graph 23 Development of the export of Bulgaria and Romania /2005 - 2009/ (in thousand
EUR) ............................................................................................................................................63
Page 8 of 130
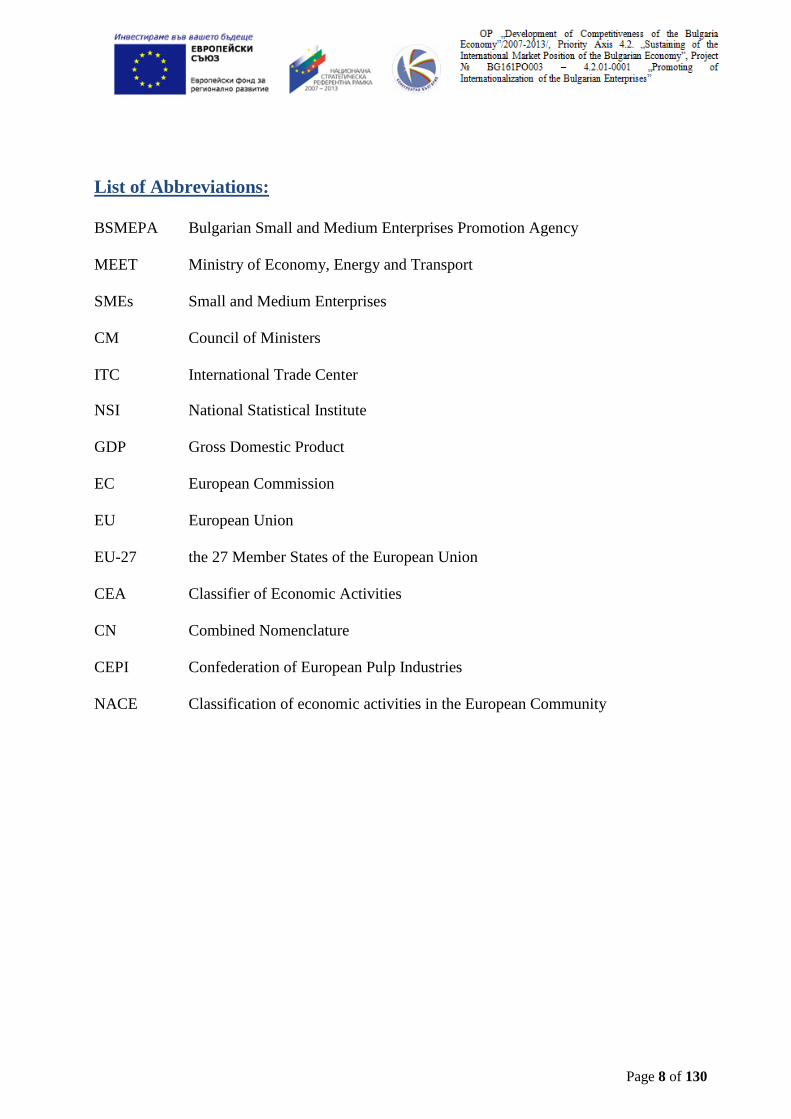
List of Abbreviations:
BSMEPA Bulgarian Small and Medium Enterprises Promotion Agency
MEET Ministry of Economy, Energy and Transport
SMEs Small and Medium Enterprises
CM Council of Ministers
ITC International Trade Center
NSI National Statistical Institute
GDP Gross Domestic Product
EC European Commission
EU European Union
EU-27 the 27 Member States of the European Union
CEA Classifier of Economic Activities
CN Combined Nomenclature
CEPI Confederation of European Pulp Industries
NACE Classification of economic activities in the European Community
Page 9 of 130
INTRODUCTION
The Export Strategy for the “Manufacture of pulp, paper, board and articles” sector was
developed under Project № BG161РО003 – 4.2.01-0001 № BG161РО003 – 4.2.01-0001
“Promotion of the internationalization of the Bulgarian enterprises”, under priority axis 4
„Strenghtening the international market positions of Bulgarian economy”, under Operational
Programme “Development of the Competitiveness of the Bulgarian Economy”, in pursuance of
Contract BG-161PO003-4.2.01-001-C00001 for direct provision of gratuitous financial help,
under which the Bulgarian Small and Medium Enterprises Promotion Agency (BSMEPA) is
an institutional beneficiary.
The purpose of the Export Strategy for the “Manufacture of pulp, paper, board and articles”
sector is to support the Bulgarian micro-, small and medium enterprises from the sector to
enhance their competitiveness, the degree of their internationalization and entering or
expanding the market positions of Bulgarian products and in particular those with higher added
value.
Bulgarian state, in the person of BSMEPA, MEET and other state institutions, has recognized
the sector of SMEs as particularly sensitive one and at the same time crucial for the economic
life, which should be given special attention. Diversity in the development of individual sectors
in the economy, in whose development SMEs have their place, and national priorities related to
the promotion of the export of the country, necessitate the development of export strategies for
different sectors, one of which is “Manufacture of pulp, paper, board and articles”. Focusing on
the support and giving precise references for state intervention through its institutions and
providing options for development for the other participants in the process will reinforce in a
positive aspect the planning principle in the activities of the State and will ultimately improve
Page 10 of 130
the work in the sector. As a result of the successful implementation of the Export Strategy is
expected an improvement when enetering international markets and actively expanding and
strengthening the market positions of Bulgarian small and medium enterprises realizing their
main economic activities in the “Manufacture of pulp, paper, board and articles” sector.
In the preparation of this strategy, in particular consideration was taken the document
“Methodology for strategic planning”, which has been prepared by the Council for
Administrative Reform to the Council of Ministers /CM/ of Republic of Bulgaria.

Page 11 of 130
APPROACH FOR COMPOSING THE EXPORT STRATEGY OF THE
SMALL AND MEDIUM ENTERPRISES IN THE SECTOR
„MANUFACTURE OF PULP, PAPER, BOARD, AND ARTICLES”
The Export Strategy is a strategic document that defines medium-term objectives and priorities
in export development of SMEs from the “Manufacture of pulp, paper, board and articles”
sector. It was developed on the grounds of the strategic planning approach, which has the
following advantages when skilfully used:
Creates an understanding among interested parties on trends and what the future may
bring;
Establishes a common vision and consensus among interested parties by coordinating
particular initiatives in selected targets;
Identifies undertaken or planned projects and activities;
Strengthens partnership between government, business and other parties for solving
complex problems.
When developing such strategic document it is crucial to give exact formulation of the ‘owner’
of the strategy, i.e. institution or institutions that shall be responsible for overall implementation
of the strategic document, as well as the ones for the particular steps of strategic planning.
In general steps for preparation strategic documents are as follows:
Assigning;
Preparing;
Development;
Coordination;
Adoption;
Implementation;
Valuation;
Update.
Each of these steps includes certain activities and some of them, such as assigning, preparing,
development, coordination, adoption and update later on shall be a part of the project executed
under the contract referred in the beginning. Therefore the main ‘owner’ of the Export Strategy
is the Bulgarian Small and Medium Enterprises Promotion Agency. For this reason, the goals,
measures and specific actions set in the strategic document should first assist BSMEPA to

Page 12 of 130
improve the planning and implementation of the activities related to the support of the export of
SMEs in the sector “Manufacture of pulp, paper, board and articles”. This formal logic does
not contradict to the fact that a significant number of institutions, businesses and even the
population of the country, which can be impacted through different mechanism, for example
government departments – through the forms of coordination of strategic documents of such
rank, branch organizations and business – through the provision of incentives to increase their
export potential, are recognizeded as interested parties. Crucial for SMEs from the the sector
“Manufacture of pulp, paper, board and articles” is the abilty to see a clear and predictable
policy by the state which supports export and which in a medium term will allow them to
decide whether they will take advantage of the opportunities given to them or not.
Strategic Planning Technology
The process of strategic planning includes the following steps:
Identification of interested parties;
Analysis of the environment;
SWOT analysis;
Vision;
Defining goals;
Choosing an alternative – development strategy;
Action plan;
Monitoring system.
Each of these steps is characterized by its particularities, namely:
Identification of interested parties. Interested party is any person or group that requires
attention, is able to affect a certain decision, can contribute with resources or to be affected by a
certain decision. Involving interested parties at an early stage from the preparing of the
strategic document may lead to a more expressed consensus on goals and bigger willingness for
endorsing taken decisions. Interested parties in the Export Strategy may include different
people and organizations: companies, state administration, associations of producers, individual
businesses, users of respective products, non-governmental organizations and experts.
A specificity in the preparation of strategies designed to support business is the rule that the
prepared documents should not support some businesses and discriminate against others
Therefore, as in attracting business organizations and individual branch associations has
Page 13 of 130
manifested desire for equality, in the analyses is sought an opportunity that a maximum number
of business benefit from them.
Analysis of the environment. The analysis of the environment (the SWOT analysis is
composed on the grounds of the conclusions of this analysis) enables laying down of objectives
and priorities that have to align efforts and not to be separated by time and environment.
The analyses focus on:
The current state of development of the sector in Bulgaria, trends, dynamics and
growth;
Characteristics of export-oriented SMEs, including regional distribution;
Status of the export of goods and services;
Analysis of goods and services, for which the sector has export advantages or
export potential;
Assessment of these industries that have the greatest potential for increasing the
added value in the export of goods and services in which Bulgaria has a global market
share;
Size of the international market;
Competitiveness of the export of goods and services for the existing and potential
foreign market;
Share of products originating in Bulgaria;
Share of the Bulgarian export for the product group in the total import volume on
the world market;
Leading importing countries in the relative sector;
Values and volumes of the import on specific foreign markets for a specific product
group;
Major suppliers on the relative market;
Identification of barriers to the internalization of the sector.
Based on the prepared analyses, the problems and achievements of the sector at present should
be clearly defined, but also some forecasts, opportunities and perspective for development
should be justified, such as:
Achieving significant growth of Bulgarian goods in total, as well as of those with
higher added value.
Page 14 of 130
Identification and prioritization of target markets by commodity groups.
Forecast for the development of the export and import of goods and of the trade
balance for the next five and more years.
The prepared analysis are based on existing analytical and program documents, available
statistics and information from sociological serveys conducted – interviews and focus groups.
The analysis of the environment describes existing condition of SMEs in the “Manufacture of
pulp, paper, board and articles” sector and the export process, determines reasons that cause
problems in development and outlines directions for future development.
SWOT analysis. The SWOT analysis enables identification of major internal factors
differentiated as ‘strengths and weaknesses’ and of external factors – ‘opportunities and
threats’, helps formulation of strategic goals, priorities and measures. Using SWOT keeps us
from setting unachievable tasks and priorities for export development of small and medium
enterprises in Sector “Manufacture of pulp, paper, board and articles” during the period of the
Strategy.
Using SWOT analysis to develop an Export Strategy has its own specificity, because the
‘owner’ of the strategy is BSMEPA, but the analysis is focused on the export process of SMEs
from this sector, and not on the institution itself.
PESTEL analysis. There are many factors and “variables” that affect directly or indirectly on
business environment in the country, and the overall state of the manufacturing industry. Tax
rates, changes in laws, trade barriers and administrative requirements, political and social
trends are of the type of macro factors that have noticeable effects on the operation of the
enterprises.
PESTEL analysis is focused on analyzing the factors and trends at the macro level, influencing
the development of the Bulgarian manufacturing industry, SMEs and in particular Sector
“Manufacture of pulp, paper, board and articles”.
Using this analysis will provide key conclusions for the positioning and planning the
development of SMEs in the sector.
Defining goals. Strategic planning is focused on issues of critical importance, opportunities and
problems faced by the export of small and medium enterprises in Sector ‘Manufacture of pulp,
paper, board and articles’. It helps to outline the solutions that are actually important from the
ones with temporary impact.

Page 15 of 130
Defining goals by building an hierarchical tree of goals is an operating tool that allows working
out the details from the most common general goals to the specific ones.
Defining the general strategic goal is particularly important for the future development of the
export of SMEs in Sector “Manufacture of pulp, paper, board and articles”, as it shows the
vision of institutions and business to the future. The general strategic goal seeks to answer one
fundamental question – “How do main institutions and interested parties in the process want
the export of SMEs in the sector to look in the long run?”.
Approaching the level of specific targets enables to reach the answers to the questions ‘who’,
‘what’ and ‘when’, in order to guarantee achievement of the goals identified higher in the
hierarchy.
Choosing an alternative – development strategy. Ways for goals achievement are searched for
after they are determined. Experience shows that this may be done by different ways that
represent particular alternatives for development and reaching identified goals. At this stage of
strategic planning particular alternatives shall be evaluated from different points of view and
criteria and as a result of this one alternative shall be selected and it shall become the
development strategy.
Action plan. Chosen strategy should be dressed in certain actions and measures that are
bounded by terms, persons in charge, executors and financials. The action plan and the
measures foreseen in it are turning this strategic instrument into everyday work and
implementation of policy for assisting the export of SMEs in Sector “Manufacture of pulp,
paper, board and articles”.
Monitoring system. The last phase of the strategic planning process is monitoring and
evaluation of the progress for implementation of general and specific goals set in the Export
Strategy and in the action plan. Monitoring is important, because it enables undertaking
correction actions, if the progress is unsatisfactory or if the conditions change. It is important to
make reports on the progress in achievement of general goals and before the public and
business so that they are able to evaluate the work of the respective institutions and interested
parties when realizing the strategy. We have to note that often influences may not be visible or
evident and this makes their measurability more difficult. Furthermore, impact often is an effect
with accumulation and this may complicate the analysis. This gives special weight of
monitoring that is tightly connected to all implementation steps of the Export Strategy –
preliminary (ex ante), current (parallel to the realization) and subsequent (ex post) evaluation.
Page 16 of 130
In order to exercise monitoring of the Export Strategy implementation and to evaluate
achieved results in accordance with the identified goals, it is necessary to use a few
indicators that have to be set in advance or at least early enough with respect to
implementation of the strategic document, in order data received from them to be used. In
most cases those shall be aimed values that in aggregated mode shall correspond to the goals
of the strategic document.
Monitoring provides feedback that helps to identify success or failure of planned document.
For the realization of the monitoring process, it is necessary to determine the following:
Monitoring indicators (what shall be monitored);
Frequency of monitoring and evaluation (when the respective reports shall be
prepared);
Responsibilities regarding implementation of monitoring and evaluation (who is
responsible and what for) and competencies for reaching decision for change (update
of the strategic document).
PROVISION OF INFORMATION
The following main information sources have been used when preparing the Export
Strategy:
National Statistical Institute;
Information submitted by BSMEPA;
Information from MEET;
Eurostat;
International Trade Centre;
Information published in relation with held international forums and meetings;
Official electronic information sources;
Information published by branch organizations in the sector;
Information from the Bulgarian Industrial Association and the Bulgarian
Chamber of Commerce and Industry, as well as from their regional sections;
Information from held sociological study carried out from October 31 to
November 28, 2011 within the senior management of 5 micro, 10 small and 7

Page 17 of 130
medium enterprises (total - 22 enterprises), working in the sector; and from
the focus group held.
When processing the information, it was manifested willingness for maximum objectivity of
the conclusions. In many cases the information is analyzed for the sector totally, i.e.
information that includes not only SMEs but also the large ones, based on the assumption
that where a Bulgarian enterprise has achieved success it could be expected that this will be
possible for another one as well which is from the groupof SMEs. This specificity is
expressly emphasized in the analyses.
Structure of the Export Strategy for the “Manufacture of pulp, paper, board and articles”
sector.
In determining the structure of the Export Strategy for Sector “ Manufacture of pulp, paper,
board and articles”, it was taken into account the use of the approach of strategic planning
that sets the general parameters of the strategic document. At the same time, the structure of
other institutional strategic documents was examined and the following criteria were used
for evaluation:
is there opportunity for relatively easy familiarization with the document
through understandable and logical structuring of the individual parts;
is the content presented in an attractive and easy to understand manner
accessible to non-specialists;
is thematic provision of the information possible, that is structuring the
material in a way that allows deep penetration in the problems and analyses only if desired
by the reader.
To the so chosen criteria corresponded several of the strategies examined, in
which there were two separate distinct parts, namely:
The main document where, according to the above described logic of the
technology of strategic planning, are also identified the different sections.
Appendices that contain the complete text of the prepared analyses, including
the conclusions transferred to the main material.
This approach was also chosen when structuring the Export Strategy for Sector
“Manufacture of pulp, paper, board and articles”.

Page 18 of 130
MAIN CONCLUSIONS OF THE ANALYSIS OF THE CURRENT
SITUATION
This section presents the conclusions from various analyses included in “Analysis of the
environment” which is a major step in the technology of strategic planning. An appendix to
this strategic document presents the complete text of the facts and analyses based on which
the conclusions are formulated. The conclusions and the analyses themselves are structured
in 5 parts, as follows:
STATE AND DEVELOPMENT OF THE SECTOR IN BULGARIA
EXPORT ORIENTATION OF THE SECTOR
GOOS WITH EXPORT ADVANTAGES AND POTENTIAL
COMPETITIVENESS OF THE EXPORT OF GOODS ON
INTERNATIONAL MARKETS
BARIERS TO THE INTERNATIONALIZATION OF SMALL AND
MEDIUM ENTERPRISES, AS WELL AS MEASURES AND
PERSPECTIVES FOR STIMULATION AND DEVELOPMENT OF
EXPORT
STATE AND DEVELOPMENT OF THE SECTOR IN BULGARIA
At this stage (2011) of the economic activity – manufacture of pulp, paper, board and
articles – at EU level exist 200,000 companies which hire approximately 1,9 million people
and the summary activity turnover is around 75 billion EUR. From the viewpoint of this
consolidated statistics on the present condition of the sector at EU-27 level, it is necessary to
Page 19 of 130
outline the place and profile of Bulgarian small and medium enterprises and their abilities to
compete on the large European market. An important aspect in the manufacture of pulp,
paper, board and articles is environment. Its conservation and preservation is the most basic
and fundamental task of any strategic plan. The environmental protection is a reinvestment.
It should primarily be pursued efficiency and effectiveness in the application of new
technologies in the sector.
The structure of operational costs in EU-27 related to the manufacture of pulp, paper, board
and articles, is to a large extent similar to that of the industrial sector.
The investments in this production have an average value of 1.4% of the industrial sector for
EU-27 and these values are highest in Finland (6.3%), Estonia (4.2%) and Latvia (4.2%).
Labor productivity in the sector, related to the production of timber and paper material is
estimated to 39.4 thousand EUR per person in 2007. This value makes it by about 10%
lower than the average for the economic sector.
The manufacture of pulp, paper, board and articles and the SMEs involved in them have a
great importance to the economy of the country, as these products are related to the way of
living and their availability, demand and the ensuring of their specificity of their purpose.
The country has a rich resource base for the manufacture of pulp, paper, board and articles.
The “Manufacture of paper, board and articles of paper and board” sector covers around
1.4% of the industrial production in the country and also creates 1.4% of the added value in
industry. The revival of the production in the sector reflected on the dynamics of the export,
which in 2010 was 1% of the total export and 2.6% of the total import of the country.
The “Manufacture of pulp, paper, board and articles” sector includes the manufacture of
paper, paper mass and recycled paper products. The grouping of these products is
characterized and grounded by the similar and common vertical production processes at the
stage of formation and generation.
For SMEs in the economic activity “Manufacture of pulp, paper, board and articles”, the
structure is significantly more simple, which allows an easier analysis. Based on
Classification of Economic Activities /CEA/ of 2008, NSI managed to collect data for 2009
and 2010 under the new methodology, which are presented in the next two tables.

Page 20 of 130
Table 1 SMEs in the economic activity during 2009 (based on CEA-2008) /according to
data of NSI/
Enterprises Turnover Added value at
factor prices
Employees
Code: Number in thousand BGN Number
17. 553 406 424 102 205 7465
17.1. 18 ** ** 443
17.2. 535 ** ** 7022 Legend:
Division-17 – Manufacture of paper, board and articles of paper and board
17.1. - Manufacture of fibrous semi-manufactured goods, paper and board
17.2. - Manufacture of articles of paper and board
** - confidential data
Table 2 SMEs in the economic activity during 2010 (based on CEA-2008) /according to
data of NSI /
Enterprises Turnover Added value at
factor prices
Employees
Code: Number in thousand BGN Number
17. 517 372 203 102 205 6 385
17.1. 15 4 122 -1 438 187
17.2. 502 368 081 77 009 6198 Legend:
Division-17 - Manufacture of paper, board and articles of paper and board
17.1. - Manufacture of fibrous semi-manufactured goods, paper and board
17.2. - Manufacture of articles of paper and board
As can be determined from the adduced tables prepared under the methodology of NSI,
some of the data for 2009 regarding the turnover and added value on factor prices are
confidential. From the disclosed data, however, it is seen that the turnover of all 553 SMEs
in this economic activity amounted to a little more than 400 million BGN and the total
number of people employed in these SMEs was 7,465. In 2010 the picture gets worse, as the
actual number of SMEs in the economic activity also decreases and the turnover of the
activity seriously decreases – to approximately 370 million BGN and the number of the
people employed also decreases – from 7,465 to 6,385.
The prospects on the data for 2011 and the next one to two years are also negative, which
means that the branch literally “collapses” and the business activity is reduced to some form
of survival. Due to the said reasons, several specific goals at different levels should be taken
into account.

Page 21 of 130
The purpose of the strategy is to create a connection, to build a bridge for the transmission of
the local company interests and their coordination with consumer countries. This is an
expression of the main and basic function of the system of the European Union, namely,
overcoming any territorial economic border and aggregation of a single market.
The positive aspect is that SMEs are more strongly represented in the manufacturing
industry than the large enterprises. The strengths of small and medium business regarding
the export of paper, board and other articles is the creation of added value. Among the
regional centers in Bulgaria with the richest timber resources are the cities: Blagoevgrad,
Burgas, Vidin, Vratsa, Gabrovo, Kyustendil, Lovech, Montana, Pazardzhik, Smolyan,
Shumen, and others. The geographical location of these cities suggests a possibility for
export both to the eastern market (Russia, China), and to the western market (Europe, USA,
Brasil).
Table 3 Regional distribution of the enterprises and employees in the “ Manufacture of
pulp, paper, board and articles” sector in 2009
Employed
in the
sector
(number)
% of those
employed in the
manufacturing
industry
% of those
employed
in the
sector
Companies
in the
sector
(number)
% of the
compa-
nies in
the sector
Northwest region 550 0,9% 5,4% 40 7,3%
North Central region 1920 2,3% 19,0% 80 14,7%
Northeast region 787 1,4% 7,8% 48 8,8%
Southeast region 466 0,6% 4,6% 44 8,1%
South Central region 3484 2,6% 34,4% 151 27,7%
Southwest region 2909 1,8% 28,8% 182 33,4%
Source: Evrostat
The level of salaries in the sector is one of the lowest. The average monthly salary is estimated
at about 460 BGN and provides employment of 9.6 thousand people (1.9% of those employed
in the manufacturing industry).
The production consists of articles of paper and board, wallpapers, stationery, etc. It is realized
by about 350 companies, more than half of which are located within the territory of the South
Central and Southwest planning regions. Among the companies engaged in the manufacture of
paper, board and articles can be distinguished: "MondiPeking Stamboliyski" EAD, "Svilosel"
EAD, "Kostenets HII" AD, "Koch and Nur Nemusmark" AD, "Vivatel" AD and others.
Unlike the production of timber, its processing into interstitial and end product is related to a
certain level of machinery and equipment. The equipment necessary for the processing of
Page 22 of 130
the raw material is not available for a big part of the small and medium enterprises and this
puts them into the position of non-competitiveness..
Main conclusions from the analysis of the situation and development of the sector:
The number of SMEs in the “Manufacture of pulp, paper, board and articles” sector
marked a decrease in 2010 by 6,51% compared to the previous 2009. In 2010 the number of
the employees in the sector also declined by 14,5% compared to 2009. A decrease was also
observed with respect to the turnover realized by SMEs from the sector as it decresed from
406 424 thousand BGN in 2009 to 372 203 thousand BGN in 2010.
From the economic activity – the manufacture of pulp, paper, board and articles, at
the EU-27 level, are formed around 75 billion EUR, while in Bulgaria, for the last fiscal year
(2010), only around 135 million EUR. The scale of market forces of Bulgarian SMEs
compared to EU-27 is only 0,19% of all competing market participants and it shows the
extremely insignificant market force of the Bulgarian small and medium enterprises in the
context of EU-27.
The regional distribution of the companies from the sector shows a significant
concentration of companies in the Southwest region and in particular in the region of Sofia.
The product assortment with which the majority of the surveyed enterprises have
proved themselves successful on the market is not very wide. Only 1/3 of the companies
have staked on the production of a richer range of goods.
A little more than half of the companies from the branch invest in development
activity (innovations) – 59,1%.
The main part of the investments is in expansion of the activity of the existing
enterprise (76,9%), followed by diversification of the production of the existing enterprise
by adding new additional products (53,8).
50,0% of the enterprises from the sector have their own trademark. Exactly the same
is the percentage of holders of international certificates.

Page 23 of 130
EXPORT ORIENTATION OF THE SECTOR
The value of Bulgarian export in the economic activity “Manufacture of pulp, paper, board
and articles” according to the latest data of the National Statistical Institute from January
2012.
Table 4 Value of the Bulgarian export of “Paper, board and articles of paper and board”
under the nomenclature of CEA /2000 – 2011/ (according to data of NSI)
Value of the exort (in BGN) Share (in %)
Year Total for products
under the Classifier
of Economic
Activities /CEA/
Value of the exort
of "Paper, board
and articles of
paper and board"
Share of "Paper, board
and articles of paper
and board" of the total
export of all products
under CEA
2000 10 274 106 727 371 715 523 3,62%
2001 11 176 068 993 456 217 411 4,08%
2002 11 857 905 747 571 303 578 4,82%
2003 13 041 906 435 670 772 499 5,14%
2004 15 617 051 924 774 824 853 4,96%
2005 18 514 553 261 805 345 179 4,35%
2006 23 493 153 075 943 278 207 4,02%
2007 26 426 895 408 1 047 300 000 3,96%
2008 29 736 375 433 267 994 380 0,90%
2009 22 881 652 090 140 826 313 0,62%
2010 30 435 009 876 314 612 346 1,03%
2011 33 952 544 356 348 948 883 1,03%
It is obvious from the table that the share of the export of paper, board and articles of paper
and board, under the nomenclature of the Classifier of Economic Activities /CEA/, adopted in
the country between 2000 and 2007, fluctuates in the range 3,5% to 5% for the different years
and the highest peak in this time series of data was 2003. The highest peak of this share for the
whole series of data from 2000 to 2011 inclusive, also turns out to be 2003. Since then until
now (2011) the share of the value of the export of paper, board and articles of paper and board
has been continuously decreasing, which is also obvious from fig. 1.

Page 24 of 130
Graph 1 Export of “Paper, board and articles of paper and board”
After the accession of the country to the EU, this share varies about 1% of the total export by
all export positions under CEA. As an absolute value, however, these are different amounts
between 270 million BGN (2008) and nearly 350 million BGN (2011).
The data show that in absolute values, the peak year for the market participants engaged in the
activity “Manufacture of pulp, paper, board and articles” was 2007, when the export amounted
to over 1 billion BGN. Subsequently, the lowest level recorded was in 2009 – around 140
million BGN, and then the growth in the following 2010 and 2011 doubled. Therefore, in the
interpretation of the export data, it is very important that both the absolute indicators and the
relative indicators of the value of the export in this direction should be studied.
In addition, it can also be enclosed updated information about what the value of the export of
SMEs form the sector is compared to all the enterprises within the sector.

Page 25 of 130
Table 5 Value of the export of SMEs from the sector /2007 – 2011/ (according to data of
NSI)
Value of the export of "Paper, board and articles of paper
and board" (in BGN)
Share (in %)
Year All Bulgarian
enterprises in the
sector
SMEs in the
sector
Share of the export of
SMEs from all
Bulgariand enterprises
in the sector
2007 1 047 300 000 not available n/a
2008 267 994 380 n/a n/a
2009 140 826 313 61 824 000 43,90%
2010 314 612 346 39 800 000 12,65%
2011 348 948 883 n/a n/a
The share of the export of SMEs from all Bulgarian enterprises in the sector amounted to
around 44% in 2009 and almost 13% in 2010.
The export of various articles: paper, board, fibrous cellulose materials and the like, is
constantly increasing and for the period 2000-2011 this export has increased almost 3 times for
the paper and board and a little over two times for the wood mass or the mass of other fibrous
cellulose materials.
Table 6Value of the sector export of Bulgaria, according to the Combined Nomenclature
/2007 – 2011/ (according to data of NSI)
Export from Bulgaria under the Combied Nomenclature (in BGN)
Year Wood mass or mass of other fibrous
cellulose materials; paper or board
for recycling (waste and left-overs)
Paper and board; articles of pulp,
paper or board
2000 44 776 517 75 176 639
2001 35 627 856 83 609 489
2002 42 165 671 83 741 257
2003 37 079 969 130 552 885
2004 41 126 224 152 601 886
2005 33 432 076 163 695 336
2006 40 846 062 145 307 997
2007 41 372 242 191 951 493
2008 64 996 003 198 623 073
2009 11 339 917 121 542 822
2010 113 302 945 192 033 659
2011 103 752 172 239 994 284
Page 26 of 130
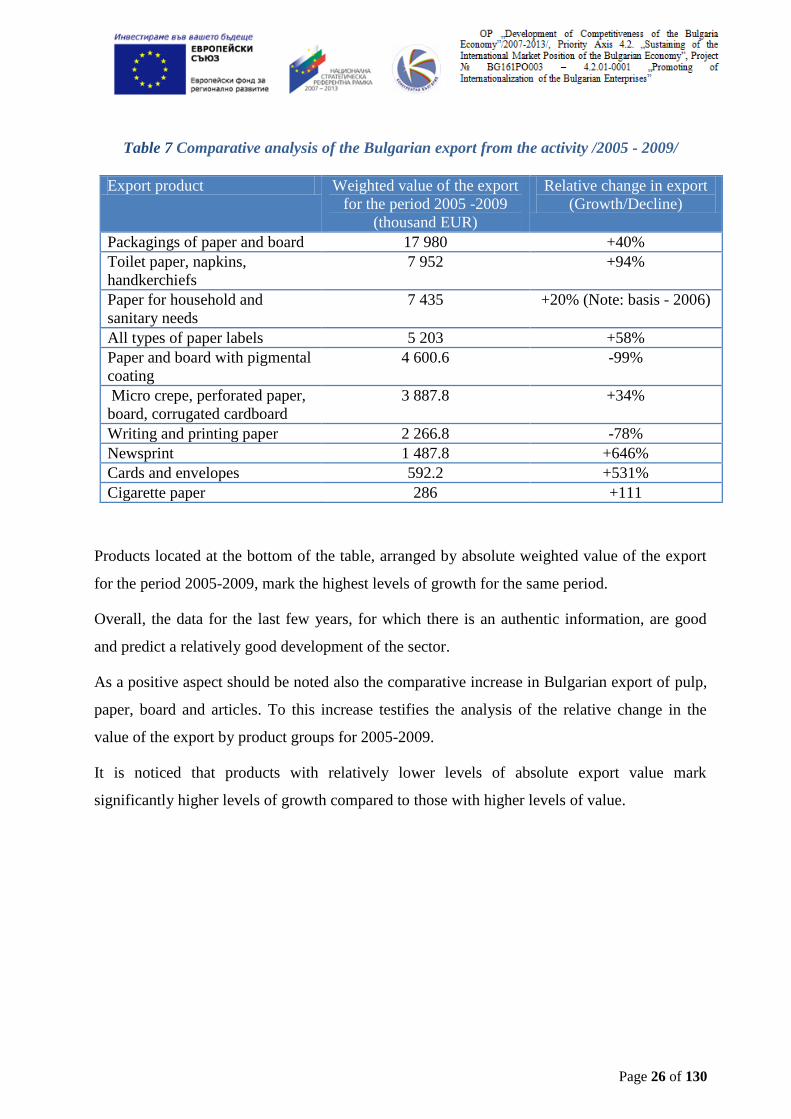
Table 7 Comparative analysis of the Bulgarian export from the activity /2005 - 2009/
Export product Weighted value of the export
for the period 2005 -2009
(thousand EUR)
Relative change in export
(Growth/Decline)
Packagings of paper and board 17 980 +40%
Toilet paper, napkins,
handkerchiefs
7 952 +94%
Paper for household and
sanitary needs
7 435 +20% (Note: basis - 2006)
All types of paper labels 5 203 +58%
Paper and board with pigmental
coating
4 600.6 -99%
Micro crepe, perforated paper,
board, corrugated cardboard
3 887.8 +34%
Writing and printing paper 2 266.8 -78%
Newsprint 1 487.8 +646%
Cards and envelopes 592.2 +531%
Cigarette paper 286 +111
Products located at the bottom of the table, arranged by absolute weighted value of the export
for the period 2005-2009, mark the highest levels of growth for the same period.
Overall, the data for the last few years, for which there is an authentic information, are good
and predict a relatively good development of the sector.
As a positive aspect should be noted also the comparative increase in Bulgarian export of pulp,
paper, board and articles. To this increase testifies the analysis of the relative change in the
value of the export by product groups for 2005-2009.
It is noticed that products with relatively lower levels of absolute export value mark
significantly higher levels of growth compared to those with higher levels of value.

Page 27 of 130
Graph 2 Summarized data about the export of the different products in the sector /in
thousand EUR/
Source: NSI
Here it should also be taken into account the chain for formation of value addition in the sector.
The formation of the final value as at 2010, according to data of CEPI is as follows– Graph 3.
Page 28 of 130
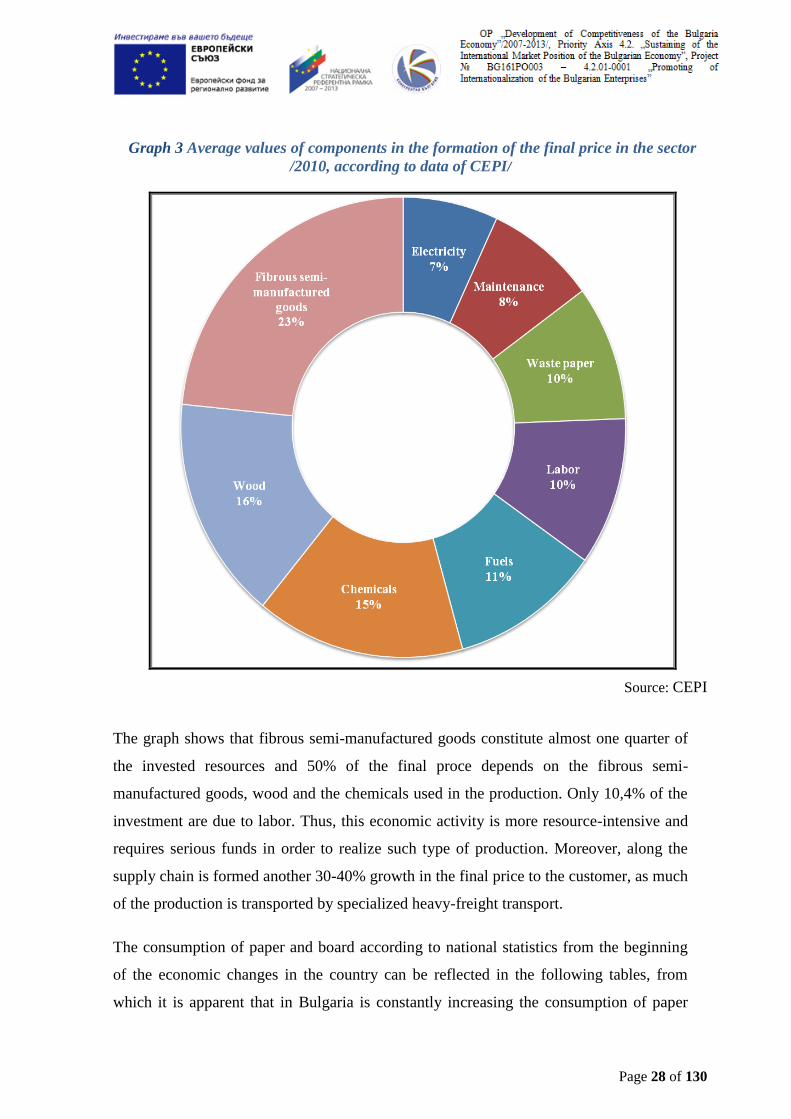
Graph 3 Average values of components in the formation of the final price in the sector
/2010, according to data of CEPI/
Source: CEPI
The graph shows that fibrous semi-manufactured goods constitute almost one quarter of
the invested resources and 50% of the final proce depends on the fibrous semi-
manufactured goods, wood and the chemicals used in the production. Only 10,4% of the
investment are due to labor. Thus, this economic activity is more resource-intensive and
requires serious funds in order to realize such type of production. Moreover, along the
supply chain is formed another 30-40% growth in the final price to the customer, as much
of the production is transported by specialized heavy-freight transport.
The consumption of paper and board according to national statistics from the beginning
of the economic changes in the country can be reflected in the following tables, from
which it is apparent that in Bulgaria is constantly increasing the consumption of paper

Page 29 of 130
and board, the lowest levels being in 2000 and 2001 and the highest level of consumption
for Bulgaria being in 2007.
Table 8 Consumption of paper and board by countries and by years during the period
1990 - 2010 (kg/person)
Country 1990 1995 2000 2001 2002 2003 2004 2005 2006 2007 2008 2009 2010
Bulgaria 28 28 17 17 27 39 41 43 45 59 52 45 49
Germany 225 194 233 225 228 225 236 233 253 256 247 221 243
Greece 61 82 114 83 111 115 104 105 109 108 112 99 93
China 13 22 28 29 33 36 42 45 50 55 59 64 69
Poland 22 40 60 64 67 73 88 89 98 109 109 108 118
Romania 22 15 19 21 23 27 27 29 32 35 31 29 31
Russia 34 13 22 38 26 31 34 36 42 47 46 42 47
USA 311 332 332 324 314 301 312 301 301 288 266 231 240
Hungary 55 50 80 70 77 88 82 88 95 97 97 85 88
Finland 279 304 211 194 333 308 285 324 330 369 342 282 281
Czech
Republic
78 67 90 96 103 114 130 133 141 159 155 133 143
Japan 228 239 250 242 241 242 247 247 247 246 242 215 220
As can be seen from the enclosed tables, ones of the world consumers of paper are Finland,
the USA, Germany and Japan with an annual consumption in 2010 of over 200 kg/perosn.
After them come the Czech Republic and Poland, closely followed by Greece and Hungary.
Bulgaria is on one of the last places according to the latest statistical data.
Anex 1 presents data on production, import, export, consumption, covering a 10-year period
of tracking the data under the nomenclature, followed by the National Statistical Institute.
From the data presented it is obvious that the sector is highly dynamic, which is also due to
the strong competition and the commitment of the sector to key participants on the
international markets. The lasting economic crisis in the country has also reflected on the
continuing stagnation in the sector, which, like almost all other sectors in the economy of the
country, was at that time forced to reduce jobs and make forced dismissals. In practice, the
unfavorable business climate in the country exacerbated seriously the inter-company
competition in the sector, as the latter is very sensitive to reduced circulations and orders.
This sector also suffers from a particular threat of the high-tech electronic media, which
create more and more users offering alternative resources of information through the
electronic media and carriers. This creates an additional reflux of customers from the sector,

Page 30 of 130
which often manifests itself as unfair competition at the national level. Moreover, due to the
specificity of the activity in this sector, companies work with relatively larger orders and the
scales of leverage between the companies are constantly growing, which creates significant
obstacles to the normal communication between the companies, institutions and end
customers.
Some of the areas performing well in the sector are the producers of packing paper,
including bag paper and machine-smooth packing papers, which are most frequently used in
stores.
Another area is the production of bleached sulphate pulp (kraft) and, to a certain extent, the
production of sanitary paper.
The long series of data for the development of the sector show that until the accession of the
country to the EU and one to two years after that the sector has developed very rapidly, but
in the last two to three years many small and medium enterprises from the sector, in practice,
are facing technical bankruptcy or irreversibility to regain the market positions of before the
crises.
The sector analysis clearly shows that the economic diagnosis of the sector indicates very
unpleasant conclusions for small and medium eneterprises, as the market here is very
parcelled out and even destroyed in certain industries, as are the cases of the production of
multilayer boards or other type of boards.
GOODS AND SERVICES WITH EXPORT POTENTIAL AND ADVANTAGES
Products with the highest potential for export in the sector:
paper for household and sanitary needs;
packings of paper and board;
newsprint;
toilet paper, napkins and handkerchiefs;

Page 31 of 130
all types of paper labels.
These goods are determined based on an analysis of two indicators – export volume and
export dynamics.
In the manufacture of paper and board coated with kaolin or other inorganic
compounds is observed a sudden decline in the export after 2005, the lowest values being in
2007. It is difficult to answer the question what are the exact reasons for the sudden decline
in the export of paper and board coated with kaolin or other inorganic compounds. They
may be related to loss of market or partners, to shrinkage of the production or ejection by the
competition.
Graph 4 Value of Bulgarian export of paper and board (with pigmental coating) /in
thousand EUR/
Source: ITC
Weighted value of the export for the period 2005-2009: 4600.6
Relative change for the period (Growth/Decline) : - 99%
Given the lowest value of 112 thousand EUR in 2007, we can assume that the export of the
product is also influenced by the global financial crisis and the values after that year mark
sustainable development. The export data for one year in themselves should not be taken as an
indicator of deterioration in the manufacture and export of a given commodity, but as a matter
of marketeering characteristics related to both internal and external environment.
Page 32 of 130
Despite the drastic decline over the period analyzed, an increase of fifteen times was observed
between 2007 and 2009, which is a clear sign that the export mechanism has started working
again.
Strategic objectives associated with this type of production, seeking to promote and stimulate
export, should focus on achieving rhythmicity and stability on the market. SMEs must have a
very good and accurate system for planning their production, as well as a detailed vision and
information about the outlet realization. The aim is winning positions and establishment of a
developed export market with a specific demand, given the characteristics of the product.
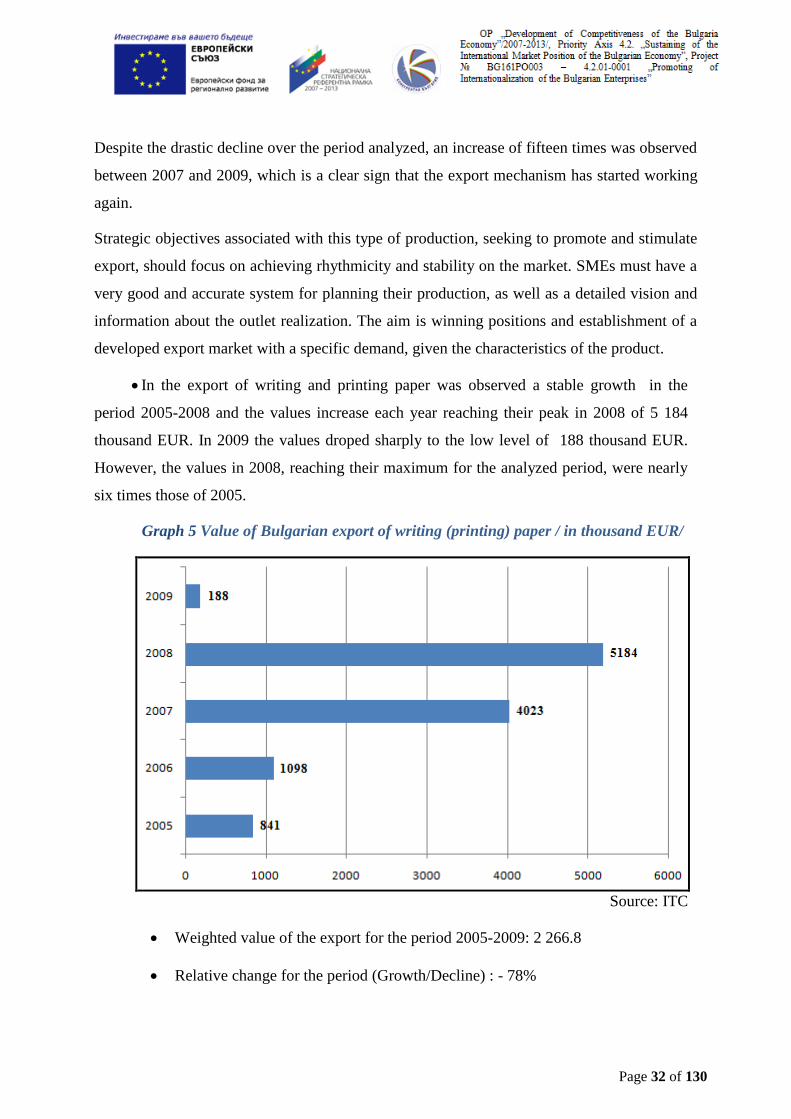
In the export of writing and printing paper was observed a stable growth in the
period 2005-2008 and the values increase each year reaching their peak in 2008 of 5 184
thousand EUR. In 2009 the values droped sharply to the low level of 188 thousand EUR.
However, the values in 2008, reaching their maximum for the analyzed period, were nearly
six times those of 2005.
Graph 5 Value of Bulgarian export of writing (printing) paper / in thousand EUR/
Source: ITC
Weighted value of the export for the period 2005-2009: 2 266.8
Relative change for the period (Growth/Decline) : - 78%

Page 33 of 130
The highest annual increase was observed between 2006 and 2007, when the export increased
almost four times. This significant growth is due to the skillful combination of numerous
factors, guaranteeing development of market positions on the international market. The quality
characterization and the level of necessity of the product make it a commodity with a low
demand flexibility, as tangible alternatives almost do not exist.
The sharp decline in 2009 can be attributed to both financial and economic instability of the
international trade markets, and the ecological trends of reducing levels of use of office paper.
In front of SMEs stands a large market with continuous and relatively constant demand. The
strategic objectives of promoting the export of this product should be based on the optimization
of the quality of both the goods itself and the service.
There is need of establishing export channels for quick access and processing the practices, as
well as a network reflecting the necessary cash. The aim is optimization and achievement of
minimum levels of information noise regarding logistics and implementation deadlines. Pricing
and value formation includes not only the product itself and its cost price, but also the ability of
the exporting company to supply as needed. To achieve this goal is necessary elasticity and
flexibility. SMEs should focus their efforts on achieving a good balance between the price level
and the superiority of the quality, since due to its specificity, the product requires a huge market
and high levels of competition. This is struggle which is won by the one who supplies
regularly, on time, the necessary quantity and offers the best conditions.
Writing and printing paper is among the most important resources for the operation of a
business and it is the necessary basis for the preparation of projects, contracts and any type of
office documentation. The Bulgarian SMEs are facing the task to develop the necessary
competitive advantages by which they could build up the necessary added value of the product
so that it can be preferred to the local alternatives. Given the similar qualitative characterization
of the product concerned, innovations regarding the structure, vision, or composition are less
likely or they hide a risk of incompatibility with the market principles. That is why SMEs
should focus on the quality of export implementation and act as local suppliers, even better.
There is need of opening and development of an optimal transport network, with the possibility
of flexibility of supplies and minimum delays. Building up this basis and the extent of its
effective realization would allow the exporting company to use the instruments of pricing as
competitive advantages.
Page 34 of 130
But to reach this stage, it is necessary to achieve scale effect or lower relative production costs
per unit of article. This model, however, is at variance with the structure of SMEs and poses
one of the major problems for the export as a whole, namely the gap between the capabilities of
the small and medium business and the strategic objectives for export development. This
strategy is yet to consider exactly the alternatives and possible solutions to this problem.
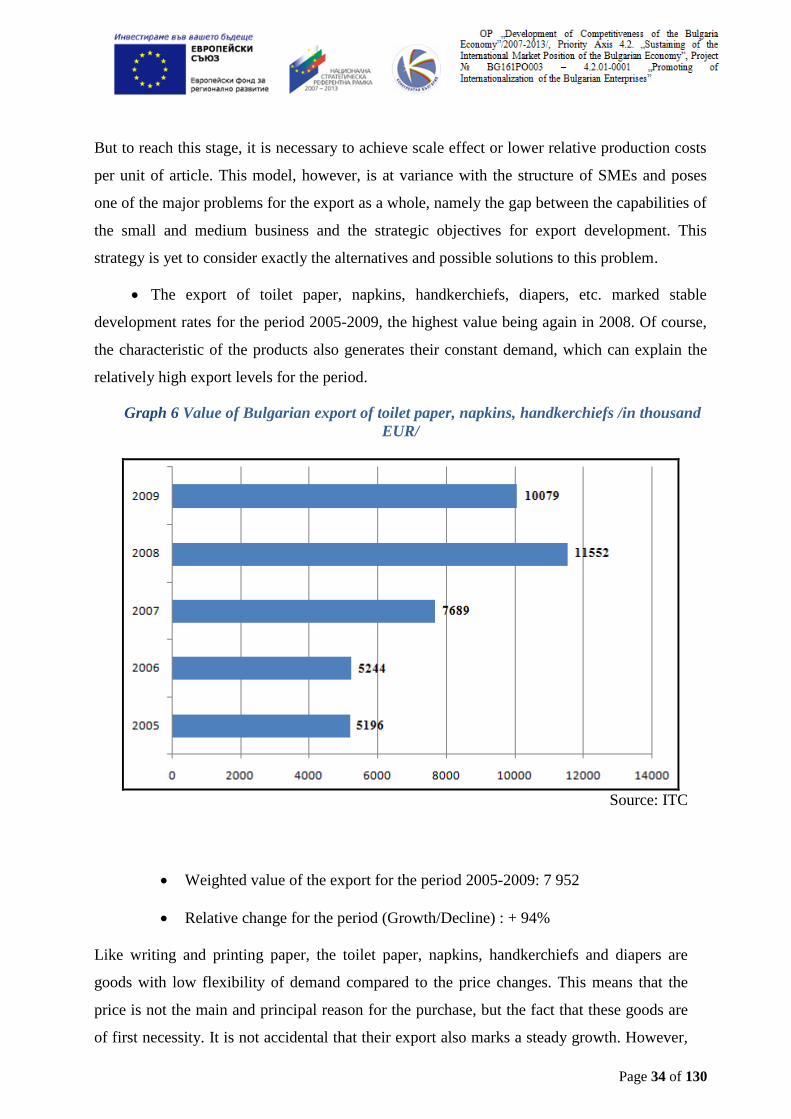
The export of toilet paper, napkins, handkerchiefs, diapers, etc. marked stable
development rates for the period 2005-2009, the highest value being again in 2008. Of course,
the characteristic of the products also generates their constant demand, which can explain the
relatively high export levels for the period.
Graph 6 Value of Bulgarian export of toilet paper, napkins, handkerchiefs /in thousand
EUR/
Source: ITC
Weighted value of the export for the period 2005-2009: 7 952
Relative change for the period (Growth/Decline) : + 94%
Like writing and printing paper, the toilet paper, napkins, handkerchiefs and diapers are
goods with low flexibility of demand compared to the price changes. This means that the
price is not the main and principal reason for the purchase, but the fact that these goods are
of first necessity. It is not accidental that their export also marks a steady growth. However,

Page 35 of 130
the goal here should be to preserve and maintain the market positions with a vision for
growth.
It is important to take into account that the market is an extremely dynamic and unstable
mechanism and good data should not be accepted as a certainty or guarantor for future
development. Efforts are needed, aimed at the continuous development of the product, the
conditions of its sale through export and development of the competitive advantages of the
company as a whole.
Toilet paper, napkins, handkerchiefs, diapers and similar products are among the most
widely known and used in everyday life products. This fact also determines high levels of
supply. The data in Graph 6 show some stable and relatively constant levels of growth in the
export of these goods, which means that the companies which produce them are well placed
and established on the foreign markets. In ordet that this realization is present, it is necessary
that be taken into consideration that the material expression of export is in money, but its
more important dimension is the client’s assessment or that moral value, which puts it as a
leader among the other alternatives offered by the local market.
The more specific a product is, the easier it can be disposed, of course, provided that the
market appropriate for it has been found. While the goods for mass consumption are an
objective-oriented marketing target for a wide range of companies, and this is a fact
increasingly heightens the competitive battle between them. Bearing that in mind, we can
conclude that the Bulgarian companies realizing export of toilet paper, napkins,
handkerchiefs, diapers and the like, are worthy of being an example for the rest of the
business and a model in which SMEs can develop their export policy.
The export of cigarette paper marked a steady growth for the period, despite its
relatively low absolute values. The specificity of this export, like the previous two, is
connected with almost zero elasticity of demand. Cigarettes and cigarette products are very
specific goods the demand of which is highly irrelevant to the level of prices. This makes
these goods and their components products with guaranteed demand and provides the small
and medium business with a good niche for development of its production potential. It
should be borne in mind that establishing onself on the market is particularly difficult and
the marketing barriers for entering are extremely high. This is related to the popularity of the
end product and its ability to generate constant demand at rising price level. In Bulgarian

Page 36 of 130
export of cigarette paper was noted a stable and gradual growth and the relative export
values decreased only in 2008, this being a single phenomenon and not a tendency.
Graph 7 Value of Bulgarian export of cigarette paper /in thousand EUR/
Source: ITC
Weighted quantity of the export for the period 2005-2009: 286
Relative change for the period (Growth/Decline) : + 111%
It is also important to note that for the considered period between 2005 and 2009, the total
volume of the export increased by double, like the export of toilet paper, handkerchiefs,
napkins and diapers. This relative index ranks the export of cigarette paper among the
leaders in the export of Bulgaria. Despite the low absolute value of the export, the growth
trend is clearly noticeable. This means that companies representing the production of
cigarette paper know how to organize their export and how to manage it. This is an
important and priceless know-how for the achievement of the strategic objectives on the
development of the export policy for the small and medium business.
The export of all types of paper and board labels marked a steady growth, despite the
relatively poor indices for 2006. They can be attributed to multiple factors, but it is more

Page 37 of 130
important not to focus on the low effectiveness in 2006, but to consider the marketeering
framework of the export for the given period more globally and generally. In the analyzed
period there was an increase of more than 50% and despite the low level in 2006, in 2007
the export increased by 10 times.
Graph 8 Value of Bulgarian export of all types of paper labels /in thousand EUR/
Source: ITC
Weighted value of the export for the period 2005-2009: 5 203
Relative change for the period (Growth/Decline) :+ 58%
These indices guarantee for a good and balanced export policy by the exporting companies
and testify to their good practices in the field of corporate planning, forecasting and goal
setting.
The export of all types of paper labels is another good example of not only how to lead an
useful and effective export policy, but also how business can cope with situations of decline
and low reporting indicators. All companies in the most general sense have, if not equal,
then at least similar tools for interaction and impact on the internal and external
environment. However, far from all have the potential to use it to make rational and
effective management decisions concerning the planning and organization of future events
and periods.

Page 38 of 130
The export of paper for household and sanitary needs marked relatively high levels
of export and only the data 2005 are almost zero compared with the other analyzed periods
from the interval 2005-2009. However, this export group marked high average levels of
value. The export of paper for household and sanitary needs marked its higher value in 2008,
following a growth of nearly 40% compared to the previous year. This tendency did not
established itself and in 2009 there was a decline also by about 40%.
Graph 9 Value of Bulgarian export of paper for household and sanitary needs /in
thousand EUR/
Source: ITC
Weighted value of the export for the period 2005-2009: 7 435
Relative change for the period (Note: Due to the extremely low value for 2005,
for a basis have been taken the data from 2006) (Growth/Decline): + 20%
Nevertheless, the absolute dimention of the export is significant and is among the exports
with highest value among the considered export product categories. This is explained both
by the practical and and everyday application of the goods, and by the effective export
policy of the companies. Among them those producing toilet paper, handkerchiefs, napkins
and diapers are most frequently specialized in the production of paper for household and
sanitary needs, too. A proof of this are the good indicators of growth and absolute value of

Page 39 of 130
the export. They are the basis for the further development and utilization of this export
channel.
Even if they do not have the necessary equipment for the production and processing of raw
materials for this type of production, the small and medium can act as jobbers, suppliers or
dealers. In this way they deprive themselves of the risk related to the manufacture of the
production, to the high costs of obtaining and processing the materials and thanks to their
not numerous staff they can also be competitive to the bigger enterprises which have
significantly higher cost burden. The formation of sush international mediations is among
the main export strategies available for the development of the export by SMEs.
The export of packings of paper and board is among the leaders in the export of
products of pulp, paper, board and articles, with an absolute measurement of the export
much higher than the other prouct groups.
Graph 10 Value of Bulgarian export of packings of paper and board /in thousand EUR/
Source: ITC
Weighted value of the export for the period 2005-2009:: 17 980
Relative change for the period (Growth/Decline): +40%

Page 40 of 130
Here are observed annual values, each of which exceeds significantly the limit of 10 million
EUR. It makes impression that the value of the export for each year individually exceeds
almost all of the highest levels of export of the rest of the products analyzed. With a
weighted value of the export of approximately 18 million EUR, the export of packings of
paper and board exceeds more than two times the export ranked second. These high values
can be explained by the necessity of packing of most of the products.
In today’s realities and with a pursuit of achieving a more ecological environment, nylon is
being displaced by paper globally. This global trend, no doubt, gives its impact on the
Bulgarian export, too. In large numbers nylon bags and packagings are being replaced and
displaced by ones made of paper or board, due to their properties of degradation. The idea of
environmental protection and achievement of sustainable development is among the current
issues of today and is a starting point for this strategy. This is an example of the influence of
a trend on the market development or how non-economic factors can acquire economic
impact.
Exactly because of that reason, it is necessary to build a more massive and global vision
regarding the promotion of the export of SMEs. Not the detail is important, but the final
result; the vision is important which is necessary to be built in order to create the link
between SMEs and international market.
The production of paper and board packings is yet to develop both in innovative and in
environmental aspect. SMEs and the specialists representing them should focus their
attention on the ways of achieving symbiosis between three main production factors:
effectiveness, efficiency and environmental friendliness.
This means to find a way to use a minimum amount of resource, which should be
processesed with a relatively minimum share of the costs in order to create a product leaving
a minimum mark on the environment.
The optimization of these factors is the way to achieve a better product and since the idea
should precede technology, SMEs need to develop their conceptions for the production of
ecological packings, as well as to create a system for their reproduction and recycling. In
other words, the specificity of this product requires unlimited responsibility of the producer.
This concept is the basis for building a new and better export line, in the center of which
stands the product and not the export itself. Reconsideration of this formulation will enable

Page 41 of 130
the Bulgarian small and medium business to fit in the global trading environment with
regard to the production of pulp, paper, board and articles.
When determining the amount and quantity of the export, it should also be considered the
unit value of the articles, since the price forms the value and does not give a real idea of the
scale of the export. In the export of newsprint, a standstill was observed from 2005 to 2007,
then the values increased approximately five times and continued their growth. The absolute
growth between 2005 and 2009 was almost ten times, which is a sign of conducting an
active export policy. It in itself is a mechanism which does not have sudden impact on the
marker processes. If we assume that in 2005 the companies adopted a number of measures to
increase and stimulate the export, the data for 2006 cannot give a clear idea of the degree of
fulfillment of the set criteria, as market and foreign trade processes include numerous
factors.
Graph 11 Value of Bulgarian export of newsprint /in thousand EUR/
Source: ITC
Weighted value of the export for the period 2005-2009: 1 487.8
Relative change for the period (Growth/Decline) : + 646 %
In 2007 were observed values exceeding by about 50% those of 2005 and more than twice
those of the previous 2006. This testifies to expansion of the export and we can assume that
Page 42 of 130
it the result of the anti-crisis measures of the companies. Between 2007 and 2008 the export
marked an increase by nearly five times.
The export of newsprint is largely related to finding the appropriate export partner. It is
important to take into consideration that, like for the writing and printing paper, of great
importance here is regularity of supply, as well as compliance with the agreed quantity and
quality.
The production of newspapers, like the composition of written documents, is a process of
creating additional value, in the form of information. The framework and scaffolding for this
information is the paper, which makes it an extremely important and valuable material.
To stimulate the Bulgarian export of newsprint, it is necessary to analyze the actions of the
companies in the branch in 2005, 2006 and 2007, as they give effect to the increase of the
export value in the following periods.
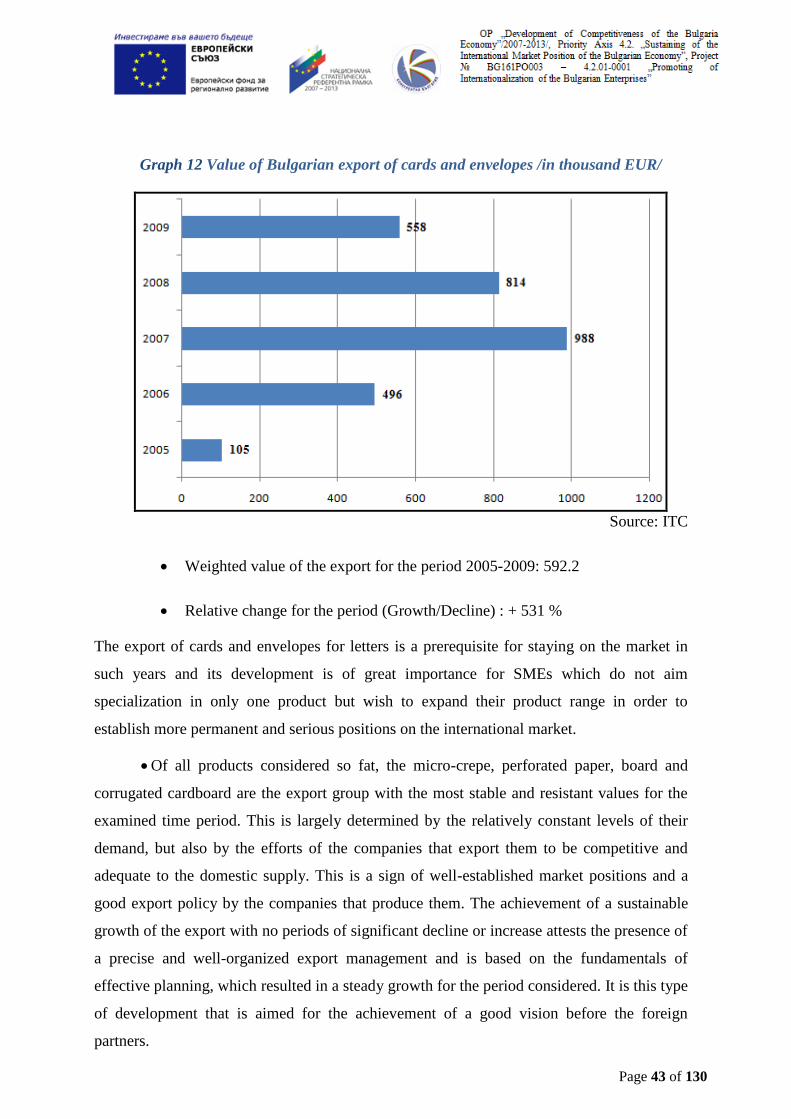
The export of cards and envelopes for letters marked an increase in a period 2005-
2007, when it reached its maximum of 988 thousand EUR and gradually declined in the
period 2007-2009. The export of cards and envelopes for letters is definitely not among the
supporting pillars of the export of pulp, paper, board and articles, but its importance
determines the width of the range of products which our country is able to offer on the
international market. This production, despite its relatively low values of export, can serve
as a counterweight to ensure profitability in case of realization of a poor annual export of
another product, as often happens according to the graphs analyzed so far.
Page 43 of 130
Graph 12 Value of Bulgarian export of cards and envelopes /in thousand EUR/
Source: ITC
Weighted value of the export for the period 2005-2009: 592.2
Relative change for the period (Growth/Decline) : + 531 %
The export of cards and envelopes for letters is a prerequisite for staying on the market in
such years and its development is of great importance for SMEs which do not aim
specialization in only one product but wish to expand their product range in order to
establish more permanent and serious positions on the international market.
Of all products considered so fat, the micro-crepe, perforated paper, board and
corrugated cardboard are the export group with the most stable and resistant values for the
examined time period. This is largely determined by the relatively constant levels of their
demand, but also by the efforts of the companies that export them to be competitive and
adequate to the domestic supply. This is a sign of well-established market positions and a
good export policy by the companies that produce them. The achievement of a sustainable
growth of the export with no periods of significant decline or increase attests the presence of
a precise and well-organized export management and is based on the fundamentals of
effective planning, which resulted in a steady growth for the period considered. It is this type
of development that is aimed for the achievement of a good vision before the foreign
partners.
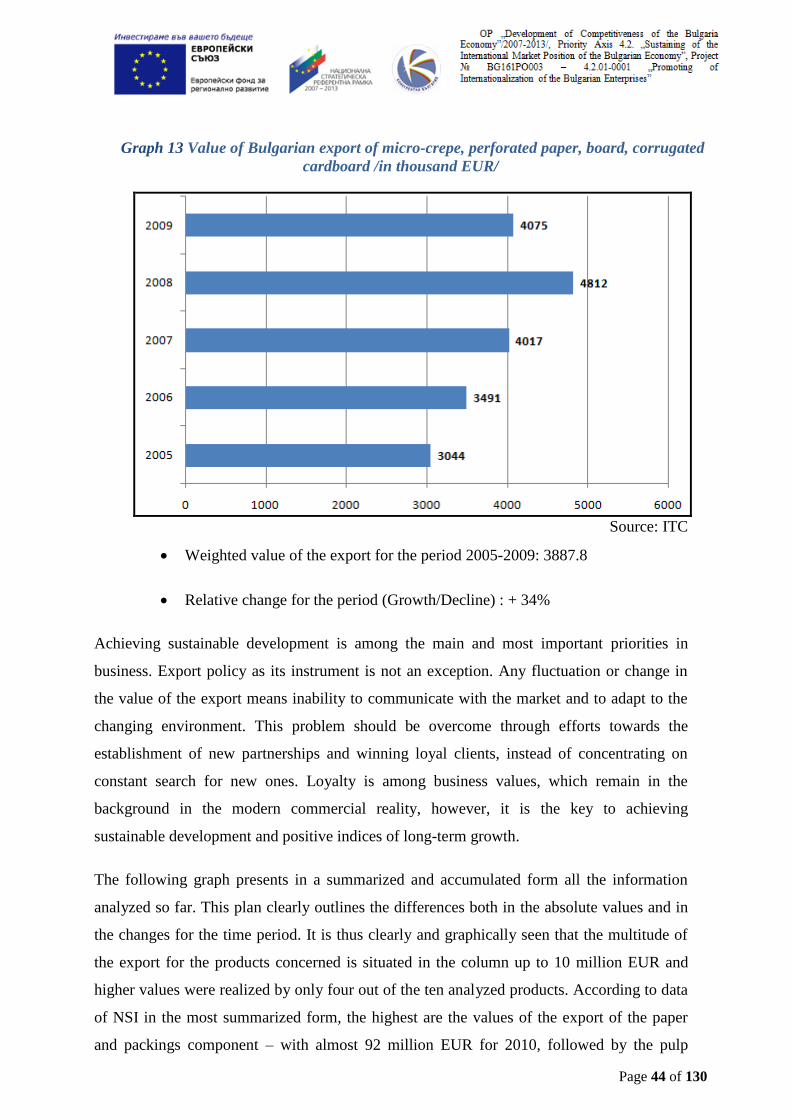
Page 44 of 130
Graph 13 Value of Bulgarian export of micro-crepe, perforated paper, board, corrugated
cardboard /in thousand EUR/
Source: ITC
Weighted value of the export for the period 2005-2009: 3887.8
Relative change for the period (Growth/Decline) : + 34%
Achieving sustainable development is among the main and most important priorities in
business. Export policy as its instrument is not an exception. Any fluctuation or change in
the value of the export means inability to communicate with the market and to adapt to the
changing environment. This problem should be overcome through efforts towards the
establishment of new partnerships and winning loyal clients, instead of concentrating on
constant search for new ones. Loyalty is among business values, which remain in the
background in the modern commercial reality, however, it is the key to achieving
sustainable development and positive indices of long-term growth.
The following graph presents in a summarized and accumulated form all the information
analyzed so far. This plan clearly outlines the differences both in the absolute values and in
the changes for the time period. It is thus clearly and graphically seen that the multitude of
the export for the products concerned is situated in the column up to 10 million EUR and
higher values were realized by only four out of the ten analyzed products. According to data
of NSI in the most summarized form, the highest are the values of the export of the paper
and packings component – with almost 92 million EUR for 2010, followed by the pulp
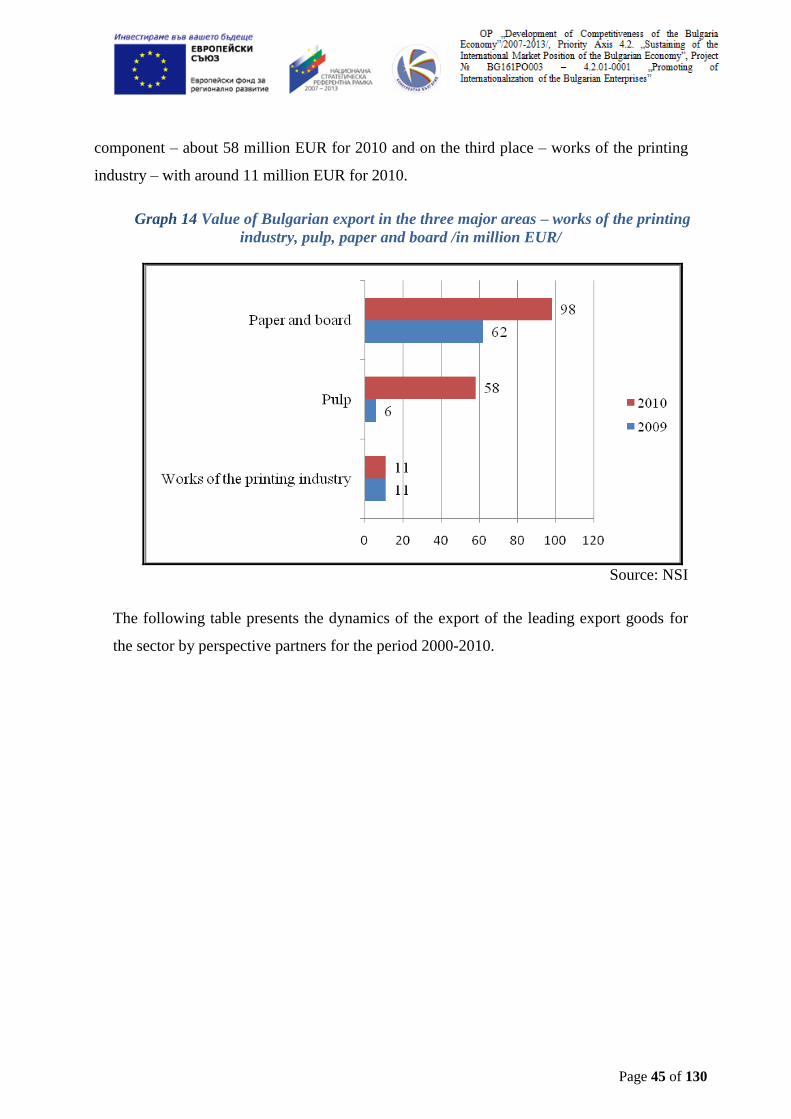
Page 45 of 130
component – about 58 million EUR for 2010 and on the third place – works of the printing
industry – with around 11 million EUR for 2010.
Graph 14 Value of Bulgarian export in the three major areas – works of the printing
industry, pulp, paper and board /in million EUR/
Source: NSI
The following table presents the dynamics of the export of the leading export goods for
the sector by perspective partners for the period 2000-2010.
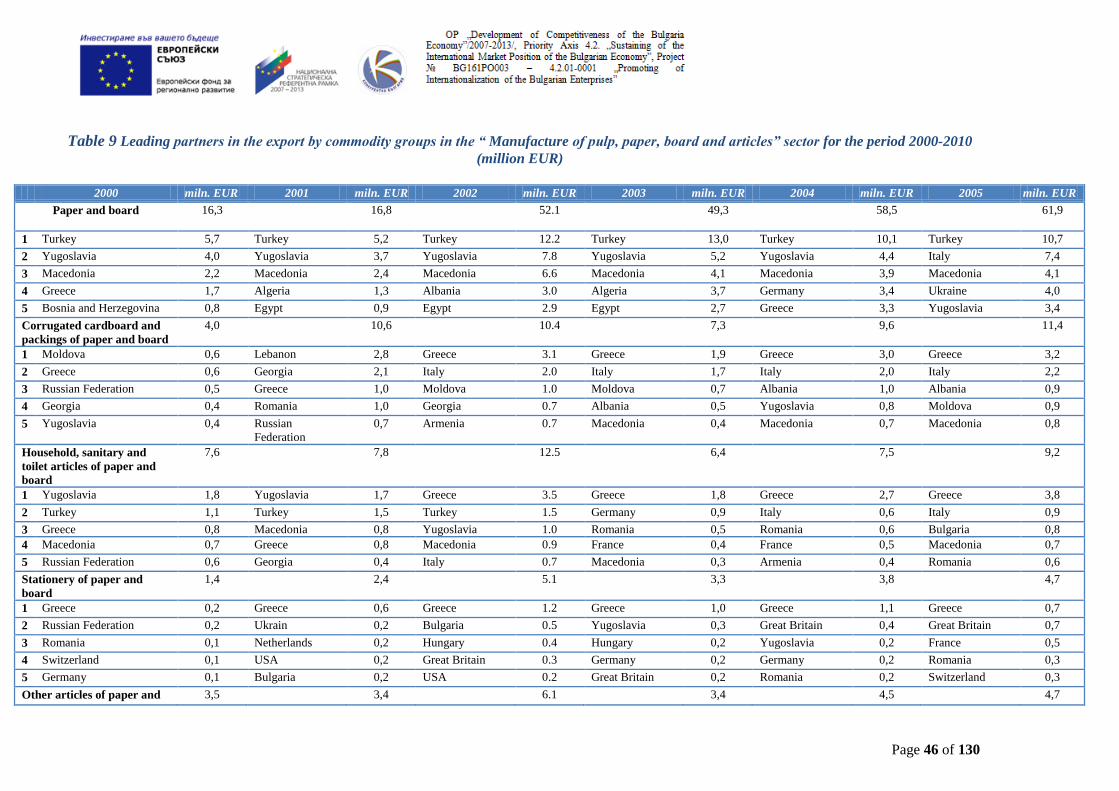
Page 46 of 130
Table 9 Leading partners in the export by commodity groups in the “ Manufacture of pulp, paper, board and articles” sector for the period 2000-2010
(million EUR)
2000 miln. EUR 2001 miln. EUR 2002 miln. EUR 2003 miln. EUR 2004 miln. EUR 2005 miln. EUR
Paper and board
16,3 16,8 52.1 49,3 58,5 61,9
1 Turkey 5,7 Turkey 5,2 Turkey 12.2 Turkey 13,0 Turkey 10,1 Turkey 10,7
2 Yugoslavia 4,0 Yugoslavia 3,7 Yugoslavia 7.8 Yugoslavia 5,2 Yugoslavia 4,4 Italy 7,4
3 Macedonia 2,2 Macedonia 2,4 Macedonia 6.6 Macedonia 4,1 Macedonia 3,9 Macedonia 4,1
4 Greece 1,7 Algeria 1,3 Albania 3.0 Algeria 3,7 Germany 3,4 Ukraine 4,0
5 Bosnia and Herzegovina 0,8 Egypt 0,9 Egypt 2.9 Egypt 2,7 Greece 3,3 Yugoslavia 3,4
Corrugated cardboard and
packings of paper and board
4,0 10,6 10.4 7,3 9,6 11,4
1 Moldova 0,6 Lebanon 2,8 Greece 3.1 Greece 1,9 Greece 3,0 Greece 3,2
2 Greece 0,6 Georgia 2,1 Italy 2.0 Italy 1,7 Italy 2,0 Italy 2,2
3 Russian Federation 0,5 Greece 1,0 Moldova 1.0 Moldova 0,7 Albania 1,0 Albania 0,9
4 Georgia 0,4 Romania 1,0 Georgia 0.7 Albania 0,5 Yugoslavia 0,8 Moldova 0,9
5 Yugoslavia 0,4 Russian
Federation
0,7 Armenia 0.7 Macedonia 0,4 Macedonia 0,7 Macedonia 0,8
Household, sanitary and
toilet articles of paper and
board
7,6 7,8 12.5 6,4 7,5 9,2
1 Yugoslavia 1,8 Yugoslavia 1,7 Greece 3.5 Greece 1,8 Greece 2,7 Greece 3,8
2 Turkey 1,1 Turkey 1,5 Turkey 1.5 Germany 0,9 Italy 0,6 Italy 0,9
3 Greece 0,8 Macedonia 0,8 Yugoslavia 1.0 Romania 0,5 Romania 0,6 Bulgaria 0,8
4 Macedonia 0,7 Greece 0,8 Macedonia 0.9 France 0,4 France 0,5 Macedonia 0,7
5 Russian Federation 0,6 Georgia 0,4 Italy 0.7 Macedonia 0,3 Armenia 0,4 Romania 0,6
Stationery of paper and
board
1,4 2,4 5.1 3,3 3,8 4,7
1 Greece 0,2 Greece 0,6 Greece 1.2 Greece 1,0 Greece 1,1 Greece 0,7
2 Russian Federation 0,2 Ukrain 0,2 Bulgaria 0.5 Yugoslavia 0,3 Great Britain 0,4 Great Britain 0,7
3 Romania 0,1 Netherlands 0,2 Hungary 0.4 Hungary 0,2 Yugoslavia 0,2 France 0,5
4 Switzerland 0,1 USA 0,2 Great Britain 0.3 Germany 0,2 Germany 0,2 Romania 0,3
5 Germany 0,1 Bulgaria 0,2 USA 0.2 Great Britain 0,2 Romania 0,2 Switzerland 0,3
Other articles of paper and 3,5 3,4 6.1 3,4 4,5 4,7

Page 47 of 130
board
1 Russian Federation 1,1 Moldova 1,4 Moldova 2.3 Moldova 1,4 Moldova 1,8 Moldova 1,7
2 Moldova 0,7 Georgia 0,4 Hungary 0.8 Hungary 0,6 Hungary 1,0 Romania 0,6
3 Greece 0,4 Hungary 0,3 Georgia 0.7 Romania 0,2 Romania 0,3 United Arab
Emirates
0,4
4 Georgia 0,3 Russian
Federation
0,3 Romania 0.3 Greece 0,2 Georgia 0,2 USA 0,3
5 Hungary 0,3 Eire (Ireland) 0,3 Lithuania 0.2 Georgia 0,2 United Arab
Emirates
0,2 Georgia 0,3
2006 miln. EUR 2007 miln. EUR 2008 miln. EUR 2009 miln. EUR 2010 miln. EUR
Paper and board 48,3 68,3 68,7 31,1 56,3
1 Italy 9,0 Turkey 17,4 Turkey 21,7 Turkey 11,6 Turkey 14,0
2 Turkey 7,4 Italy 9,7 Greece 8,7 Greece 4,0 Greece 6,4
3 Macedonia 4,4 Romania 6,4 Italy 5,7 Romania 3,3 Romania 5,0
4 India 2,6 Greece 6,1 Macedonia 4,8 Serbia 2,5 Serbia 4,2
5 Greece 2,2 Macedonia 5,2 Ukraine 3,7 Macedonia 2,1 Jordan 4,0
Corrugated cardboard and
packings of paper and board
15,4 18,5 18,3 16,4 19,6
1 Greece 4,2 Greece 5,3 Greece 4,9 Italy 4,1 Greece 4,8
2 Italy 2,7 Italy 2,7 Italy 2,0 Greece 3,6 Macedonia 3,1
3 Turkey 1,2 Turkey 1,4 Macedonia 2,0 Romania 2,8 Italy 2,7
4 Albania 1,1 Albania 1,4 Albania 1,4 Macedonia 2,4 Armenia 1,3
5 Moldova 1,0 Macedonia 1,2 Armenia 1,1 Albania 0,7 Germany 0,8
Household, sanitary and
toilet articles of paper and
board
10,4 14,8 17,5 18,6 26,3
1 Greece 3,8 Greece 3,5 Greece 4,0 Greece 5,7 Greece 5,0
2 Italy 0,8 France 2,6 Romania 3,4 Romania 2,3 Romania 4,3
3 Macedonia 0,8 Romania 1,6 France 2,4 italy 1,3 Germany 2,7
4 Romania 0,8 Italy 1,1 Italy 1,0 France 1,3 Ukraine 1,8
5 Germany 0,8 Macedonia 0,7 Serbia 0,9 Germany 1,0 France 1,8
Stationery of paper and
board
4,7 5,7 6,3 4,7 5,6
1 Greece 1,2 Greece 1,4 Romania 2,1 Greece 2,0 Greece 1,3
2 Romania 0,6 Romania 1,2 Greece 1,2 France 0,4 Romania 0,6

Page 48 of 130
3 France 0,5 France 0,4 Russian
Federation
0,4 Romania 0,4 Netherlands 0,6
4 Germany 0,4 Russian
Federation
0,4 Netherlands 0,3 Russian
Federation
0,4 France 0,6
5 Russian Federation 0,3 Austria 0,3 France 0,3 Serbia 0,2 Serbia 0,4
Other articles of paper and
board
4,2 3,8 5,6 6,0 7,6
1 Romania 0,9 Romania 0,7 Romania 1,5 Albania 0,1 Greece 1,6
2 USA 0,6 Germany 0,5 Greece 1,1 Bangladesh 0,1 Romania 1,3
3 Moldova 0,4 Moldova 0,4 Italy 0,7 Bosnia and
Herzegovina
0,1 Turkey 0,8
4 Cameroon 0,4 Italy 0,4 Moldova 0,6 Belgium 0,1 Lithuania 0,7
5 Macedonia 0,3 Greece 0,4 Macedonia 0,3 Austria 0,0 Moldova 0,6
Source: ITC

Page 49 of 130
Another hallmark with regard to the small and medium enterprises engaged in the production
of pulp, paper, board and articles in 2010 in EU-27 is that in this activity were engaged
around 216 000 eneterprises. In this activity participated nearly 2 million people or 1.5%
relative share of the amount of the economic business workforce of EU-27. These enterprises
generate added value amounting to 78 billion EUR, contributing 1.4% to the amount of the
economic sector.
Analyzing the development of this activity in geographical terms, it makes impression that the
countries located in North and Central Europe have better established positions in the
production. This was judged by the relatively higher share of employees in the production of
pulp, paper, board and articles.
Table 10 Characterization and structure of the division
Enterprises Turnover Added value Staff
thousands % million
EUR
% million
EUR
% thousand %
Timber and
products
196.8 91 133 766 44.6 37 155 47.5 1 268.7 64
Pulp, paper and
products
19.4 9 166 000 55.4 41 100 52.5 715.0 36
Total 216.2 100 299 766 100 78 255 100 1 983.7 100
Source: NSI
The table presented makes impression with the relatively small and limited number of
enterprises engaged in the production of paper, paper pulp and products. Nevertheless, with its
only 9% of the relative share of all manufacturing agents in this market, the manufacturers of
paper, paper pulp and products generate over half of the total turnover and more than half of the
added value. This high efficiency and undisputed effectiveness of this production is also
confirmed in the analysis of the employment. A little more than one third of all people engaged
in the sphere of production of timber and products, paper, paper pulp and products generate
more than half of the income. This is a clear sign of the expedience of building a strategy for
production and export.
The more widely included number of worforce in the field of timber is explained by the
need for presence of more real human resource for extraction, which does not allow
complete mechanization and automation of processes.

Page 50 of 130
Situation analysis
Analysis of the Bulgarian export of products of pulp, paper, board and articles reporting the
highest values for the period under review.
Among all reviewed products there are such which are absolute leaders by indicators both of
absolute values, and of increase for the period. Among them are products with relatively
constant levels of demand, as well as such a with more specific demand.
To assess the possibilities of this strategy develop them even more, by undertaking identical
indicators for monitoring and evaluation of the planned measures, as different development
scenarios are possible and currently the market situation is unfavorable. From the time horizon,
presented in the graph, it is seen what the main task and purpose of this strategy is – to
introduce harmonized strategic planning in the sector. This is primarily related to the
overcoming of the declines in the export and the achievement of a sustainable growth, since
any sudden drop in the export value may be fatal for a small or medium Bulgarian enterprise.
An assessment of the effectiveness of this strategy can be given by a more comprehensive and
profound analysis of the received results for the export values. Without taking into account the
absolute values, it is important to detect the development of the trend and to analyze the
development direction of the export. The implementation of the strategy must encourage the
export, but also to bring it to a sustainable growth, subordinate to stable development rates.
What is noticed in the export of packings of paper and board and that of toilet paper, napkins
and handkerchiefs is that the introduction of strategic planning will lead to smoothing of the
values and achievement of a stable growth without allowing big amplitudes in the values of the
export. The other key tool is establishing systematic monitoring and carrying out analysis on
various product segments.
Analysis of the Bulgarian export of products of pulp, paper, board and articles reporting the
lowest values for the period under review.
Although a significant growth is noted, which is much higher than that of the rest, these two
products – cards and envelopes also have levels many times lower as value.
If for products with well-established export positions that realize high values of export it is
aimed the achievement of a sustainable development, for products with relatively low values of
export priority should be the pushing out towards higher export levels. This can be achieved
through an aggressive policy by the exporting country regarding the level of prices or

Page 51 of 130
preferential conditions. The value of export determines to a large extent whether a commercial
policy is effective or not. In this case, the aim is establishing or selling on the foreign market
through all the tools available from marketing. This includes discounts for bigger orders,
preferential prices for regular and loyal customers and other bonuses.
Export of cards and letter envelopes is extremely delicate and pricing is of great importance, as
demand is highly flexible due to the nature of the goods. Another rapidly developing segment
from the economic activity is the production of cigarette paper. This is because the cigarette
industry enjoys a vast and extensive demand almost worldwide. The provision of resources for
this industry is extremely significant for its normal functioning.
The export of cigarette paper is with the lowest degree of value for the country in the field of
the production of pulp, paper, board and articles. This niche should be further studied, analyzed
and realized by SMEs engaged in the sector, which enterprises, of course, would like to
establish their positions on the foreign market. The achievement of this purpose is connected
with the discovery of ways of production of cigarette paper and export channels. One of the
opportunities for the small and medium business is renting or leasing of equipment and creating
a cluster specialized in the production of cigarette paper. The outlined strategic goals, measures
and the following of a particular action plan for the promotion of the export of production of
the economic activity production of pulp, paper, board and articles, can be performed mainly if
regular market surveys are made, as well as publication in specialized bulletins, both
information from NSI for the development of the sector, and alternative market surveys
conducted by economic and non-profit organizations. Otherwise, the determined indicators will
not have representative role and could easily be refuted by various interested market
participants.
The presented graph shows the estimated values for the development of various segments of the
market for the period 2009 – 2013.

Page 52 of 130
Graph 15 Estimated data for export increase /2009-2013/ (in thousand EUR)
As can be seen from the enclosed graph, the articles “paper for household and sanitary needs”
pass through the most dynamic development and have the widest potential for exportation; on
the second place are the “packings of paper and board”; on the third place is the “newsprint”;
on the fourth place is “toilet paper, napkins and handkerchiefs”; on the fifth place – but far
from the opportunities for a strong export development come “all types of paper labels”.
In other words, the companies from the sector should have a clear and accurate vision in terms
of to what extent they can implement the strategic goals of this document and with what levels
of spending they can realize export. Therefore, it should be added that here could be applied

Page 53 of 130
multiple methods for the optimization of the financial structure of a given company for the
purpose of reducing the coasts and increasing the relative share of revenue.
In the case of the enterprises form this economic activity - production of fibrous semi-
manufactured goods, paper, board and articles, it is necessary to operate in both direction, or
rather to reduce the costs for one activity and to redirect them to investment in development of
the export activity. This restructuring is associated with costs for making predictions, strategic
plans, projects and especially a vision for the selling of the goods on the foreign market.
The consideration of goods with export potential from the sector leads to the following main
inferences and conclusions:
As of today, SMEs from the economic activity production of pulp, paper, board and articles are
very limited and embarrassed with the planning of the export organization. Among the
considered and studied companies is established a majority of respondents, which are
experiencing serious financial difficulties and which suffer from impaired liquidity.
The main factors that represent obstacles to the export by the SMEs from the sector are:
Deteriorated policy of lending credits;
Insufficient financial resources;
Highly limited and insufficient choice of funding source;
Cartel export organizations of large companies dominate the export policy of the
country;
Risk of falling into insolvency due to the specifics of the structure of SMEs;
Inability to adapt to the sphere of high-tech export.
Products with highest potential for export:
- paper for household and sanitary needs;
- packings of paper and board;
- newsprint;
- toilet paper, napkins and handkerchiefs;
- all types of paper labels.
The products with highest values of of export are – packings of paper and board, toilet
paper, napkins and handkerchiefs;

Page 54 of 130
In the export of packings of paper and board and that of toilet paper, napkins and
handkerchiefs, the introduction of strategic planning will lead to smoothing of the values and
achievement of a stable growth without allowing big amplitudes in the values of the export;
Articles from the sector that report the lowest values of export for the period under
review – cards and letter envelopes as well as cigarette paper;
The articles “paper for household and sanitary needs” pass through the most dynamic
development and have the widest potential for exportation; on the second place are the
“packings of paper and board”; on the third place is the “newsprint”; on the fourth place is
“toilet paper, napkins and handkerchiefs”; on the fifth place – but far from the opportunities for
a strong export development come “all types of paper labels”.
COMPETITIVENESS OF THE EXPORT OF GOODS AND ON INTERNATIONAL
MARKETS
The export of pulp, paper, board and articles represents a significant part of the overall
export of not many Member States. Among them are Finland and Latvia where this export
formed one fifth of the total export of the countries in 2007, while in Estonia and Sweden
this proportion barely reached 10 %. The analysis of these data indicates that the
development of the market of pulp, paper, board and articles is yet to come. This is a
product that not only will always keep its value, but will even increase it over time.
According to the statistical data in 2007 the total amount of the EU-27 export of timber and
wood products amounted to 9 965 million EUR and the import for the same period was 12
083 million EUR. This resulted in a negative trade balance amounting to - 2 117 million
BGN. In other words, this is the unrealized export. For the same period the total value of the
export of paper, paper mass and products amounts to 20 438 million EUR, with total amount
of the export – 12 114 million EUR. The result of this simple calculation is a 8 324 million
EUR positive trade balance.
The following graph shows the main trading partners of EU-27 with respect to both export and
import.

Page 55 of 130
Graph 16 Main international partners of EU-27 regarding export /2007/
Source: Eurostat
It makes impression that despite the geographical advantage of China, the European export
to the USA is almost twice as large as that to China. Nevertheless, the country has vast
production capabilities and, as the import graph clearly shows, is among the countries with
the strongest positions in the import in the EU. China is an international trading partner of
Europe and it is important that we point out that the relative share of its import is almost
three times bigger than that of the export.
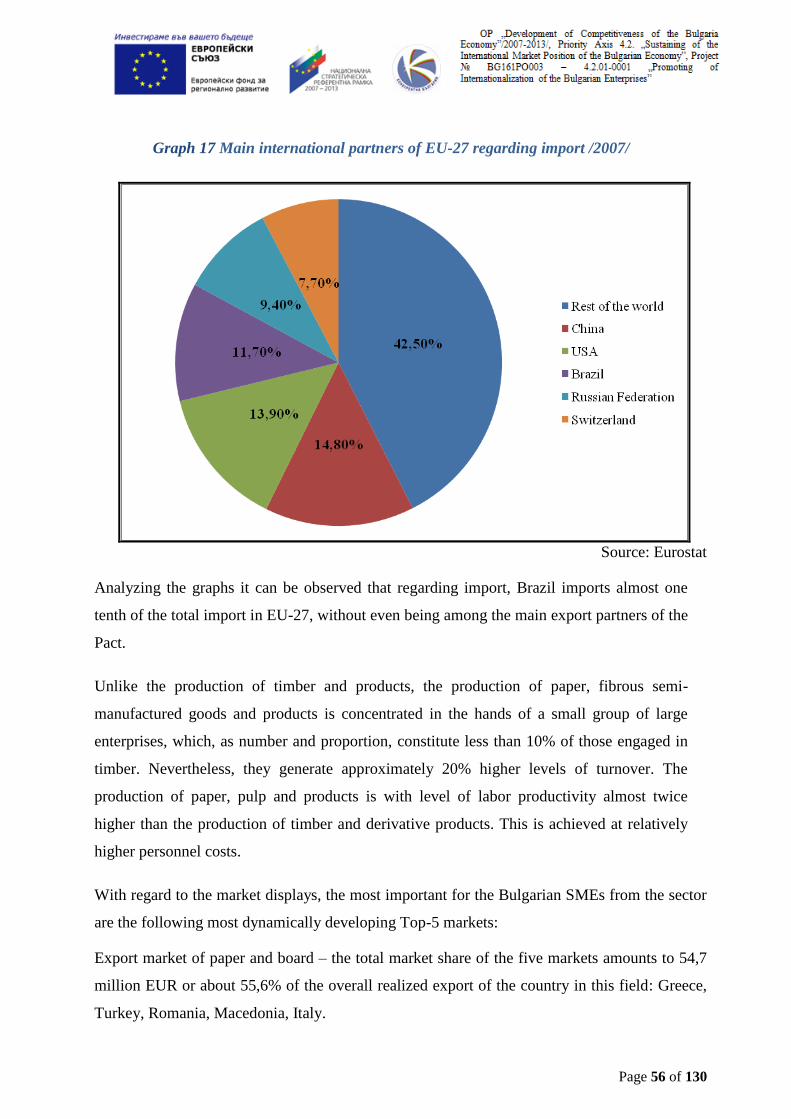
Page 56 of 130
Graph 17 Main international partners of EU-27 regarding import /2007/
Source: Eurostat
Analyzing the graphs it can be observed that regarding import, Brazil imports almost one
tenth of the total import in EU-27, without even being among the main export partners of the
Pact.
Unlike the production of timber and products, the production of paper, fibrous semi-
manufactured goods and products is concentrated in the hands of a small group of large
enterprises, which, as number and proportion, constitute less than 10% of those engaged in
timber. Nevertheless, they generate approximately 20% higher levels of turnover. The
production of paper, pulp and products is with level of labor productivity almost twice
higher than the production of timber and derivative products. This is achieved at relatively
higher personnel costs.
With regard to the market displays, the most important for the Bulgarian SMEs from the sector
are the following most dynamically developing Top-5 markets:
Export market of paper and board – the total market share of the five markets amounts to 54,7
million EUR or about 55,6% of the overall realized export of the country in this field: Greece,
Turkey, Romania, Macedonia, Italy.

Page 57 of 130
Graph 18 Top-5 markets for which Bulgaria exports – paper and boards /according to data of
NSI, as at 2010/
Source: NSI
Export market of wood-pulp – the total market share of the five markets amounts to 44,7
million EUR or about 77% of the overall realized export of the country in this field: Turkey,
Greece, Italy, Romania, Saudi Arabia.
Graph 19 Top-5 markets for which Bulgaria exports – pulp /according to data of NSI, as at
2010/
Source: NSI
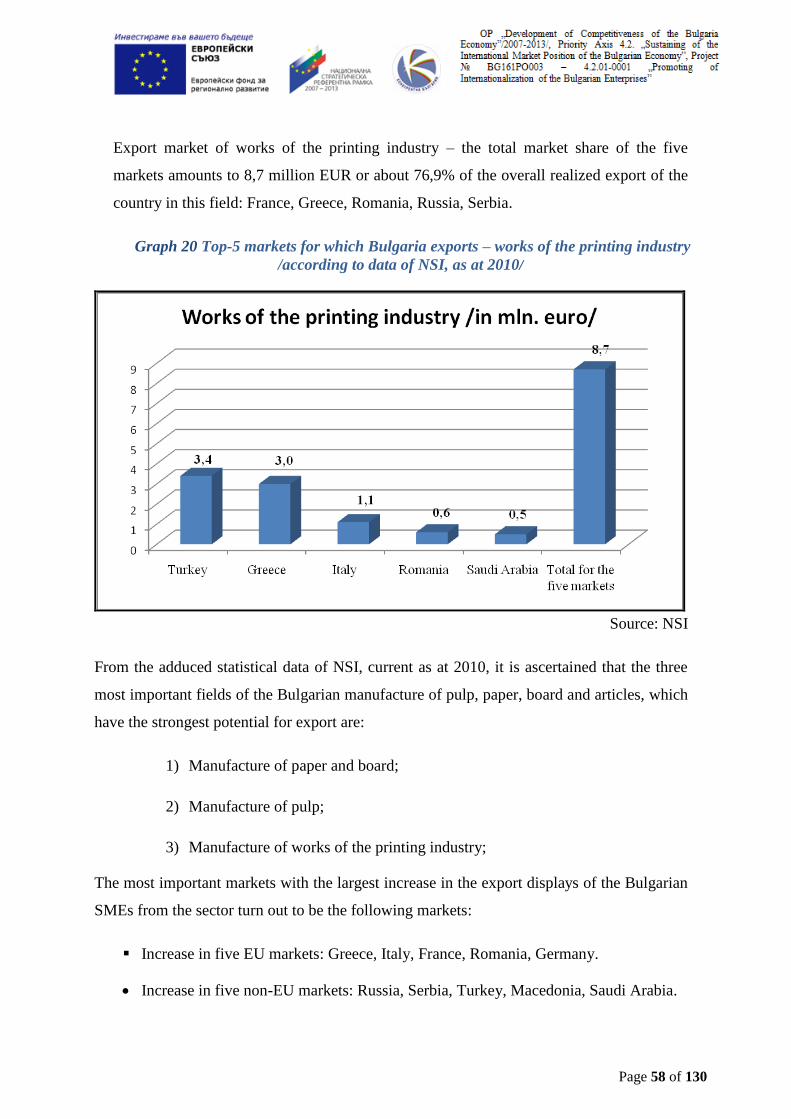
Page 58 of 130
Export market of works of the printing industry – the total market share of the five
markets amounts to 8,7 million EUR or about 76,9% of the overall realized export of the
country in this field: France, Greece, Romania, Russia, Serbia.
Graph 20 Top-5 markets for which Bulgaria exports – works of the printing industry
/according to data of NSI, as at 2010/
Source: NSI
From the adduced statistical data of NSI, current as at 2010, it is ascertained that the three
most important fields of the Bulgarian manufacture of pulp, paper, board and articles, which
have the strongest potential for export are:
1) Manufacture of paper and board;
2) Manufacture of pulp;
3) Manufacture of works of the printing industry;
The most important markets with the largest increase in the export displays of the Bulgarian
SMEs from the sector turn out to be the following markets:
Increase in five EU markets: Greece, Italy, France, Romania, Germany.
Increase in five non-EU markets: Russia, Serbia, Turkey, Macedonia, Saudi Arabia.

Page 59 of 130
The results of the conducted questionnaire survey indicate the following main export
markets of SMEs that participated in it.
Graph 21 Export markets of the enterprises surveyed (in %)
Source: Sociological survey
What makes impression from the presented graph and the answers given is the shrinkage of
markets of the sector and their relegation to Europe only.
Graph 22 Percentage distribution of the export by the number of the export markets
Source: Sociological survey

Page 60 of 130
Most numerous are the markets on which the export is up to 30%. The only export destination
for which the export is 100,0% is the EU, without specifying the countries.
The main competitors on the world markets for the surveyed enterprises are both the countries
from the EU and those outside it.
Of the states of the EU, the respondents have indicated 12 countries that compete with each
other. EU competitors are mostly Greece, Romania, Italy, Germany and less Poland and
France.
Among the five countries outside the EU the main competitor is Turkey. Smaller is the share
of China. Far weaker is the competition of Serbia, Russia and Israel.
The main advantages of the competitors are related to the lower prices of goods. To a large
extent they are related to the other advantage of the competitors – the higher technological level
providing higher productivity, lower cost price and hence competitive prices. It is also
mentioned their greater experience in the field of foreign trade, more qualified staff, the
production quality, better market knowledge and the state support.
We can conclude that the prospects of the European markets is mostly related to the fact that
this is a very serious large market with high demand. For experts the European markets are also
attractive with the better market conditions they offer, the security, honesty and accuracy of the
partners. For the markets on the Balkans the main factor is their proximity, which reduces the
transport expenses.
Among the competitive advantages of SMEs in the country are also the access to production
resources, the favorable geographical location of Bulgaria, making it a crossroad of multiple
international trade routes, as well as the established network of partner countries.
Bulgaria’s full membership in the community of European states is the international passport of
the country, guaranteeing quality, honest deals and partnerships.
Against the background of the fact that from the economic activity – production of pulp, paper,
board and articles, at the EU-27 level, are formed around 75 billion EUR, while in Bulgaria,
for the last fiscal year (2010), only around 135 million EUR, it can be seen that the scale of our
market forces is only 0,19% of all competing market participant at the EU level.

Page 61 of 130
This tabular analysis aims to present the leader in the export ranking (Germany) and the
proportion of the country compared to its indicators (total value of the export and number of
partner countries), as well as to a rival Member State (Romania).
Table 11 Analysis for 2005.
Country Total value of export in thousand EUR Partner countries
Germany 19 501 875 203
Bulgaria 103 785 96
Romania 126 995 85
Source: ITC
In 2005 the total value of export of wood-pulp, paper, board and articles of Germany, which
is the leader in this ranking, is approximately 20 times higher than that of Bulgaria and
Romania, but only 2 times more trading partners
In comparison with the Romanian, the Bulgarian export is lower by nearly one fifth, but at
the expense of more export partners of the country. Comparison with Romania is
appropriate given the equal positions of the countries from the perspective of their
membership in EU-27 and their simultaneous accession to the pact in 2007.
Table 12 Analysis for 2006
Country Total value of export in thousand EUR Partner countries
Germany 21 295 049 197
Bulgaria 93 339 95
Romania 139 295 87
Source: ITC
In 2006 the total value of export of pulp, paper, board and articles of Germany and Romania
increased by approximately 10%, while that of Bulgaria decreased by the same proportion. It
is apparent that Romania won new export partners while Germany and Bulgaria lost some.
Table 13 Analysis for 2007
Country Total value of export in thousand EUR Partner countries
Germany 24 021 882 197
Bulgaria 134 720 90
Romania 195 764 75
Source: ITC
Page 62 of 130
In 2007 the total value of export of pulp, paper, board and articles of Germany continued to
grow with a stable rate. Growth is also noticed for Bulgaria, which almost reached the
values of Romania from 2005 and achieved export growth of nearly 50%. Bulgaria
overcame the decrease from 2006 and reached values of about one third higher than those
before 2005. With regard to trading partners, Romania stands out with a loss of twelve, at
the expense of 40% growth in the value of the total export.
Table 14 Analysis for 2008
Country Total value of export in thousand EUR Partner countries
Germany 25 495 211 198
Bulgaria 147 726 92
Romania 181 656 73
Source: ITC
2008 was good for Bulgaria regarding the development of its export and its growth was 10%.
The country continued the rhythmic positive development of this indicator, while Romania lost
by almost the same proportion from its export during the last reporting period.
Table 15 Analysis for 2009
Country Total value of export in thousand EUR Partner countries
Germany 21 460 737 211
Bulgaria 85 484 85
Romania 173 366 79
Source: ITC
In 2009 a decline of the export of all examined countries is observed. Germany lost around 15
% of its export and reached the levels of 2006. Most significant is the reduction of the total
value of the Bulgarian export. For one year it has melt almost in half and its value was
approximately equal to half that of Romania.

Page 63 of 130
Graph 23 Development of the export of Bulgaria and Romania /2005 - 2009/ (in
thousand EUR)
Source: ITC
When the two countries – Bulgaria and Romania are compared, it must be taken into account
that the territorial advantage of Romania is significant, the latter’s territory being twice bigger
than that of Bulgaria and 29 % of it is forested.
Based on the available data, it is found out that in 2005 the Romanian export value in this
direction was about 22% more than the Bulgarian one.
In 2006 and 2007 Romania managed to double its export compared to Bulgaria and exported by
respectively 49% and 45% more for the respective years. This mainly related to the abilities of
the Romanian economy to react quickly to the demand of such type of production, while the
processes in Bulgaria developed by slower rates; especially in 2006 the Bulgarian sector
reduced its export to the international markets. In 2008 the situation turned round – Romania
again exported significantly more production than Bulgaria, but the rate was decreasing, while
for Bulgaria it increased sharply.
Nevertheless, in 2008 the value of the export of Romania in this sector was about 23% more
than that of Bulgaria. The trends for entering of the crisis in the sector started emerging
more and more clearly, the decline in Romania being by about 8 million EUR, and in
Bulgaria there was a collapse of the export values – by about 63 million EUR for 2009

Page 64 of 130
compared to 2008. This difference allowed Romania again to qualify before Bulgaria and
the difference here already exceeds twice the value of export of Bulgaria – 105 %.
Main conclusions from the analysis of the competitiveness of the sector:
The export of pulp, paper, board and articles represents a significant part of the overall
export of not many Member States. Among them are Finland and Latvia where this export
forms one fifth of the total export of the countries in 2007, while in Estonia and Sweden this
proportion barely reached 10 %
According to the statistical data in 2007 the total amount of the EU-27 export of timber
and wood products amounted to 9 965 million EUR and the import for the same period was 12
083 million EUR. This resulted in a negative trade balance amounting to - 2 117 million BGN.
For the same period the total value of the export of paper, paper mass and products
amounts to 20 438 million EUR, with total amount of the export - 12 114 million EUR. The
result of this simple calculation is a 8 324 million EUR positive trade balance.
Despite the geographical advantage of China, the European export to the USA is almost
twice as large as that to China.
Regarding import, Brazil imports almost one tenth of the total import in EU-27, without
even being among the main export partners of the Pact.
Bulgarian top-5 export markets of paper and boar – Greece, Turkey, Romania,
Macedonia, Italy – the total market share of the five markets amounts to 54,7 million EUR or
about 55,6% of the overall realized export of the country in this field.
Bulgarian top-5 export markets of wood-pulp – the total market share of the five
markets amounts to 44,7 million. EUR or about 77% of the overall realized export of the
country in this field: Turkey, Greece, Italy, Romania, Saudi Arabia.
Bulgarian top-5 export markets of works of the printing industry – the total market
share of the five markets amounts to 8,7 million EUR or about 76,9% of the overall realized
export of the country in this field: France, Greece, Romania, Russia, Serbia.
The three most important fields of the Bulgarian manufacture of pulp, paper, board and
articles, which have the strongest potential for export are:
Manufacture of paper and board;

Page 65 of 130
Manufacture of pulp;
Manufacture of works of the printing industry;
The most important markets with the largest increase in the export displays of the
Bulgarian SMEs from the sector turn out to be the following markets:
EU markets - Greece, Italy, France, Romania, Germany.
Non-EU markets - Russia, Serbia, Turkey, Macedonia, Saudi Arabia.
Against the background of the fact that from the economic activity – Manufacture of
pulp, paper, board and articles, at the EU-27 level, are formed around 75 billion EUR, while in
Bulgaria, for the last fiscal year (2010), only around 135 million EUR, it can be seen that the
scale of our market forces is only 0,19% of all competing market participant at the EU level.
According to data of NSI in the most summarized form, the highest are the values of the
export of the paper and packings component,– with almost 92 million. EUR for 2010, followed
by the pulp component – about 58 million EUR for 2010 and on the third place – works of the
printing industry – with around 11 million EUR for 2010.
Ones of the world consumers of paper are Finland, the USA, Germany and Japan with
an annual consumption in 2010 of over 200 kg/perosn. After them come the Czech Republic
and Poland, closely followed by Greece and Hungary. Bulgaria is on one of the last places
according to the latest statistical data.
The results of the conducted sociological survey indicate that the export markets of the
sector are axtremely shrank and are relegated to Europe only.
Most numerous are the markets on which the export is up to 30%. The only export
destination for which the export is 100,0% is the EU, without specifying the countries.
Of the states of the EU, the respondents have indicated 12 countries that compete with
each other. EU competitors are mostly Greece, Romania, Italy, Germany and less Poland and
France.
Among the five countries outside the EU the main competitor is Turkey. Smaller is the
share of China. Far weaker is the competition of Serbia, Russia and Israel.
The main advantages of the competitors are related to the lower prices of goods. To a
large extent they are related to the other advantage of the competitors – the higher

Page 66 of 130
technological level providing higher productivity, lower cost price and hence competitive
prices. It is also mentioned their greater experience in the field of foreign trade, more qualified
staff, the production quality, better market knowledge and the state support.
The following table presents the top 10 trading partners of Bulgaria in the “Manufacture of
pulp, paper, board and articles” sector,according to NSI data, for a 10-year period.

Page 67 of 130
Table 16 Leading partners in the export of Bulgaria in the “ Manufacture of pulp, paper, board and articles” sector for the period 2000 - 2010 (million
EUR)
2000 2001 2002 2003 2004 2005
TOTAL FOR THE
SECTOR
incl. 58.2 61.6 69.9 89.3 104.9 108.9
1 Italy 10.6 Turkey 8.1 Turkey 11.7 Turkey 20.3 Turkey 18.4 Turkey 17.5
2 Turkey 9.9 Italy 7.8 Greece 10.8 Greece 10.5 Greece 13.9 Greece 15.0
3 Yugoslavia 6.3 Yugoslavia 6.2 Yugoslavia 4.8 Yugoslavia 6.0 Germany 7.1 Italy 10.7
4 Greece 5.4 Greece 4.4 Italy 4.3 Macedonia 5.0 Italy 7.0 Germany 6.1
5 Hungary 3.7 Macedonia 3.9 Macedonia 4.3 Romania 5.0 Macedonia 5.7 Macedonia 5.9
6 Macedonia 3.5 Germany 3.3 Romania 4.2 Germany 4.1 Yugoslavia 5.3 Romania 5.7
7 Russian Federation 2.6 Georgia 2.9 France 3.9 Algeria 3.7 Romania 4.3 Yugoslavia 4.6
8 Slovenia 2.3 Lebanon 2.8 Germany 3.8 Moldova 3.5 Moldova 3.4 Ukraine 4.0
9 Netherlands 1.9 Romania 2.4 Moldova 3.0 Italy 3.0 Poland 3.1 Moldova 3.5
10 Moldova 1.6 Moldova 2.2 Albania 1.9 Egypt 2.7 Albania 2.8 Poland 2.6
2006 2007 2008 2009 2010
TOTAL FOR THE
SECTOR
103.6 131.0 146.7 80.1 169.0
incl.
1 Turkey 16.9 Turkey 26.7 Turkey 29.2 Greece 20.1 Turkey 30.1
2 Greece 15.7 Greece 22.7 Greece 28.8 Turkey 12.1 Greece 29.3
3 Italy 13.6 Italy 14.8 Italy 18.7 Romania 9.7 Romania 16.7
4 Macedonia 6.5 Romania 12.9 Romania 14.0 Macedonia 5.7 Italy 15.6
5 Romania 5.2 Macedonia 8.6 Macedonia 8.0 Italy 4.9 Serbia 7.9
6 Germany 4.7 Serbia 5.3 Serbia 5.1 Serbia 4.4 Macedonia 7.3
7 Albania 2.8 France 3.8 Ukraine 4.3 Germany 3.1 Germany 7.1
8 India 2.6 Germany 3.7 Albania 3.9 France 2.4 Saudi Arabia 4.2
9 Bosnia and
Herzegovina
2.0 Albania 3.5 France 3.8 Albania 1.5 Jordan 4.0
10 France 1.9 India 2.9 Lebanon 2.8 Hungary 1.3 France 3.4
Page 68 of 130
MACROECONOMIC CHARACTERISTICS OF THE PRIORITY
BULGARIAN EXPORT MARKETS. BILATERAL TRADE RELATIONS
In order to get clearer vision of the overall condition and peculiarities of the defined as
main Bulgarian export markets for the production of the analyzed by us sector, we are offering
a general view of the leading five countries of this ranking that are part of the European Union,
as well as of the leading five outside its borders.
For sector “Manufacture of pulp, paper, board and articles” the most important markets,
with the largest increase in the export positions of the Bulgarian SMEs are:
EU markets: Greece, Italy, France, Romania, Germany.
Non-EU markets: Russia, Serbia, Turkey, Macedonia, Saudi Arabia.
Actual data and characteristics for big part of the developed markets could be found
also on the National export web portal, supported by BSMEPA.
Germany is a leading foreign trade partner of Bulgaria, a major supplier of investment
goods, high-tech equipment and vehicles.
On November 5, 1992 the Treaty on friendly cooperation and partnership in Europe between
Bulgaria and Germany enters into force as the legal basis of the relations between the two
countries. Until January 1, 2007 an EU member Germany applied in its economic relations
with Bulgaria the Association Agreement of Bulgaria to the EU, effective as of February 1,
1993. Trade and a significant proportion of the other forms of economic relations are governed
by the Convention on trade, commercial and economic cooperation between Bulgari and the
European Community, signed on May 8, 1990.
Table 17 Main economic indicators for Germany and bilateral trade relations with Bulgaria
GDP (per capita, 2010) $ 35 700
Growth of GDP (%, 2010) 3,5%
Inflation (%, 2010) 1.1%
Export volume (2010) $ 1,337 trillion
Position as world exporter (2010) 3
Main trading partners in export
(2009)
France 10,1%, USA 6,7%, Great Britain 6,6%, the
Netherlands - 6,6%, Italy 6.3%, Austria 5.7%,
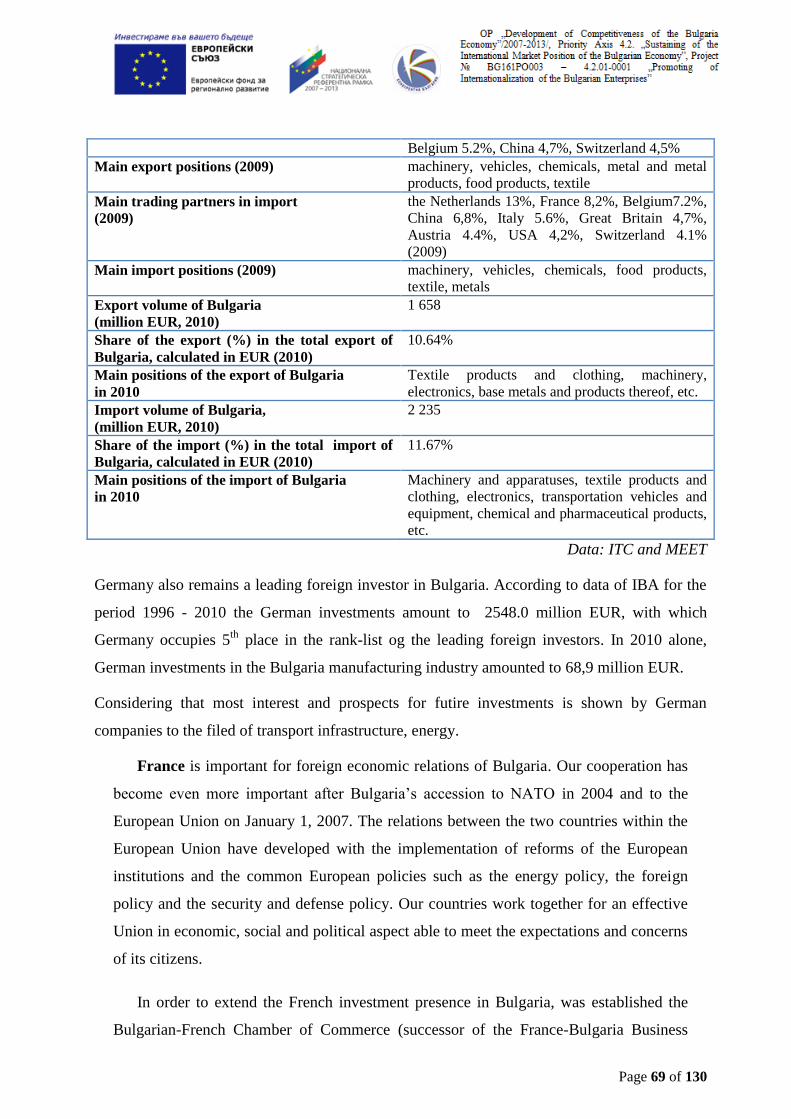
Page 69 of 130
Belgium 5.2%, China 4,7%, Switzerland 4,5%
Main export positions (2009) machinery, vehicles, chemicals, metal and metal
products, food products, textile
Main trading partners in import
(2009)
the Netherlands 13%, France 8,2%, Belgium7.2%,
China 6,8%, Italy 5.6%, Great Britain 4,7%,
Austria 4.4%, USA 4,2%, Switzerland 4.1%
(2009)
Main import positions (2009) machinery, vehicles, chemicals, food products,
textile, metals
Export volume of Bulgaria
(million EUR, 2010)
1 658
Share of the export (%) in the total export of
Bulgaria, calculated in EUR (2010)
10.64%
Main positions of the export of Bulgaria
in 2010
Textile products and clothing, machinery,
electronics, base metals and products thereof, etc.
Import volume of Bulgaria,
(million EUR, 2010)
2 235
Share of the import (%) in the total import of
Bulgaria, calculated in EUR (2010)
11.67%
Main positions of the import of Bulgaria
in 2010
Machinery and apparatuses, textile products and
clothing, electronics, transportation vehicles and
equipment, chemical and pharmaceutical products,
etc.
Data: ITC and MEET
Germany also remains a leading foreign investor in Bulgaria. According to data of IBA for the
period 1996 - 2010 the German investments amount to 2548.0 million EUR, with which
Germany occupies 5th
place in the rank-list og the leading foreign investors. In 2010 alone,
German investments in the Bulgaria manufacturing industry amounted to 68,9 million EUR.
Considering that most interest and prospects for futire investments is shown by German
companies to the filed of transport infrastructure, energy.
France is important for foreign economic relations of Bulgaria. Our cooperation has
become even more important after Bulgaria’s accession to NATO in 2004 and to the
European Union on January 1, 2007. The relations between the two countries within the
European Union have developed with the implementation of reforms of the European
institutions and the common European policies such as the energy policy, the foreign
policy and the security and defense policy. Our countries work together for an effective
Union in economic, social and political aspect able to meet the expectations and concerns
of its citizens.
In order to extend the French investment presence in Bulgaria, was established the
Bulgarian-French Chamber of Commerce (successor of the France-Bulgaria Business

Page 70 of 130
Club), which facilitates direct business contacts between Bulgarian and French
companies.
Table 18 Main economic indicators for France and bilateral trade relations with Bulgaria
GDP (per capita, 2010) $ 33.1 thousand
Growth of GDP (%, 2010) 1.1 %
Inflation (%, 2010) 1,5%
Export volume (2010) $ 508,7 billion
Position as world exporter (2010) 6
Main trading partners in export
(2009)
Germany 15,9%, Italy 8.2%, Spain 7.8%,
Belgium 7.4%, Great Britain 7%, USA 5.7%
(2009)
Main export positions (2009) Machinery and transport equipment, aircraft,
plastics, chemicals, pharmaceuticals, iron and
steel, beverages
Main trading partners in import
(2009)
Germany 19,4%, Belgium 11,6%, Italy - 8%,
the Netherlands - 7,1%, Spain 6,7%, Great
Britain 4,9%, USA 4,7%, China 4.4% (2009)
Main import positions (2009) machinery and equipment, vehicles, crude oil,
aircraft, plastics, chemicals
Export volume of Bulgaria
(million EUR, 2010)
628,4
Share of the export (%) in the total export
of Bulgaria, calculated in EUR (2010)
4,03 %
Main positions of the export of Bulgaria
in 2010
Suits, ensambles; Fresh chilled or frozen meat;
Wires, cables and other electrical
conductors; Plates, flushing cisterns, kitchen
sinks; Other engines, apparatuses for
switching; Spare reinforcing articles
Import volume of Bulgaria,
(million EUR, 2010)
629,4
Share of the import (%) in the total import
of Bulgaria, calculated in EUR (2010)
3,28 %
Main positions of the import of Bulgaria
in 2010
Passanger cars and other vehicles; Complete
industrial plants; Motor vehicles for
transportation of goods; Medications;
Apparatuses for switching, turning on of
electrical chains;
Electrical apparatuses for line telephony /incl.
videophones/.
Data source: ITC and MEET
There is potential for investments in Bulgaria by French companies in areas such as: energy,
water and waste management, construction of infrastructure, industrial subcontracts in
Page 71 of 130
mechanical engineering, food industry, wine industry, pharmaceutics, informatics. The
largest share of French investments is in industry – 58%.
The French Agency for International Development of Enterprises /Ubifrance/ represented in
Sofia aims to support the French companies to find Bulgarian partners in areas of mutual
interest.
Italy. Trade and economic relations between the Republic of Bulgaria and the Republic
of Italy are based on formal treaties and agreements of more than five decades, the more
recent ones including Cooperation Agreement between BIA and the Italian Confederation of
Industrialists (CONFINDUSTRIA) of 1998; Cooperation Agreements between BCCI and
the Italian Institute for Foreign Trade (IСЕ) Rome, and the chambers of commerce in
Vicenza, Trieste, Udine, Gorizia and the Association of Young Entrepreneurs (АССО-44);
Memorandum of Cooperation between BSMEPA and the Italian Institute for Foreign Trade
of 2007 and a similar document between the Bulgarian Investment Agency and the Italian
Institute for Foreign Trade.
Italy remains one of the leading foreign trade partners of Bulgaria, a main destination of the
Bulgarian consumer goods on the EU market. In 2010 after Russia and Germany, Italy ranked
third among the foreign trade partners of Bulgaria and the data show: an increase of 38,2% in
the export to Italy compared 2009, an increase of 8,9% in the import and an increase of 18,4%
in the trade.
Table 19 Main economic indicators for Italy and bilateral trade relations with
Bulgaria
GDP (per capita, 2009) $ 30,500
Growth of GDP (%, 2010) 1,3 %
Inflation (%, 2009) 1,4%
Export volume (2010) $ 458,4 billion
Position as world exporter (2010) 8
Main trading partners in export
(2009)
Germany 12,6%, France 11,6%, USA 5,9%,
Spain with 5.7%, Great Britain 5,1%,
Switzerland 4,7% (2009)
Main export positions (2009) Engineering products, textile and clothing,
production of machinery, of motor vehicles,
transport equipment, chemicals, food
products, beverages and tobacco products;
minerals and non-ferrous metals
Main trading partners in import
(2009)
Germany 16,7%, France 8,9%, China 6,5%,
the Netherlands 5.7%, Spain with 4.4%,
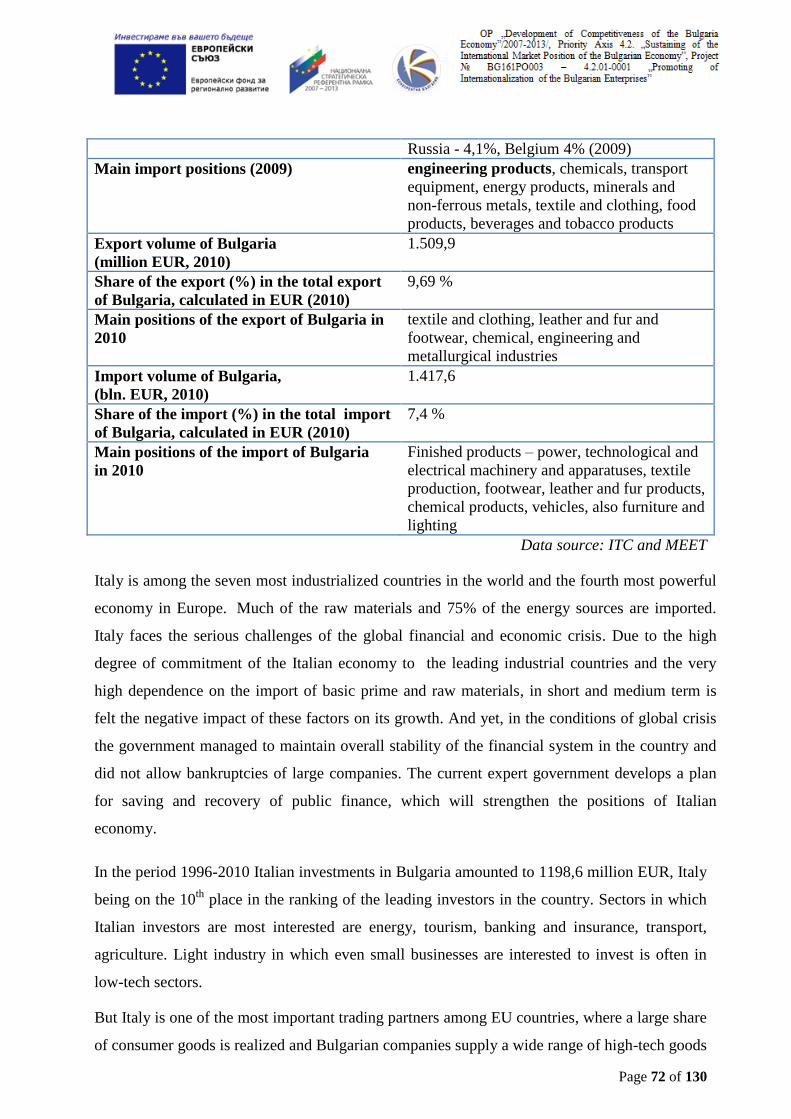
Page 72 of 130
Russia - 4,1%, Belgium 4% (2009)
Main import positions (2009) engineering products, chemicals, transport
equipment, energy products, minerals and
non-ferrous metals, textile and clothing, food
products, beverages and tobacco products
Export volume of Bulgaria
(million EUR, 2010)
1.509,9
Share of the export (%) in the total export
of Bulgaria, calculated in EUR (2010)
9,69 %
Main positions of the export of Bulgaria in
2010
textile and clothing, leather and fur and
footwear, chemical, engineering and
metallurgical industries
Import volume of Bulgaria,
(bln. EUR, 2010)
1.417,6
Share of the import (%) in the total import
of Bulgaria, calculated in EUR (2010)
7,4 %
Main positions of the import of Bulgaria
in 2010
Finished products – power, technological and
electrical machinery and apparatuses, textile
production, footwear, leather and fur products,
chemical products, vehicles, also furniture and
lighting
Data source: ITC and MEET
Italy is among the seven most industrialized countries in the world and the fourth most powerful
economy in Europe. Much of the raw materials and 75% of the energy sources are imported.
Italy faces the serious challenges of the global financial and economic crisis. Due to the high
degree of commitment of the Italian economy to the leading industrial countries and the very
high dependence on the import of basic prime and raw materials, in short and medium term is
felt the negative impact of these factors on its growth. And yet, in the conditions of global crisis
the government managed to maintain overall stability of the financial system in the country and
did not allow bankruptcies of large companies. The current expert government develops a plan
for saving and recovery of public finance, which will strengthen the positions of Italian
economy.
In the period 1996-2010 Italian investments in Bulgaria amounted to 1198,6 million EUR, Italy
being on the 10th
place in the ranking of the leading investors in the country. Sectors in which
Italian investors are most interested are energy, tourism, banking and insurance, transport,
agriculture. Light industry in which even small businesses are interested to invest is often in
low-tech sectors.
But Italy is one of the most important trading partners among EU countries, where a large share
of consumer goods is realized and Bulgarian companies supply a wide range of high-tech goods

Page 73 of 130
and vehicles. The Bulgarian export to Italy also includes a number of products with a higher
degree of processing, and there are opportunities for increasing Bulgarian export of goods in
this direction, including electrical equipment and spare parts.
Romania. The contractual legal basis between the two countries in the field of the trade and
economic relations has been established and continues to develop. Among the signed
agreements and contracts are the following:
Protocols for liberalisation of trade for industrial and agricultural products in the frame of
the Accession Agreement of Bulgaria to the CEFTA, effective since 1999; Agreement on
cooperation and mutual assistance in customs matters since 1999; Convention on bilateral
recognition of diplomas and academic degrees; programmes for cooperation in the field of
science and education; multiple agreement on border cooperation.
A new stage in the development of the bilateral economic relations begins after signing the
protocols for liberalisation of trade for industrial and agricultural products in the frame of the
Accession Agreement of Bulgaria to the CEFTA (in force as of 01.01.1999), being Romania
party to it. The removal of the barriers to bilateral trade is reflecting positively on the trade and
has positive effect on the trade and economic relations in bilateral and regional plan.
The accession of Bulgaria and Romania to the European Union in 2007 put the development of
the bilateral relations in the trade and economic field into new environment, transforming it into
intercommunity ones. Romania is an important economic partner of Bulgaria. The markets of
both countries have similar characteristics, keeping some peculiarities, relatively foreseeable
economic environment, decreased in the last year internal consumption due to the economic
crisis.
In the last 3 – 4 years the trade turnover between Bulgaria and Romania has been marked by
significant growth, where only in 2009 is marked a slight fall in the export of Bulgaria and
higher in the import. In 2010 the turnover between the two countries was growing and is about
2,5 bln. EUR. Both the import and the export have marked increase of one third in their volume
for 2010 relative to the previous year.
The joint European projects, both countries taking part in, the building of Danube bridge 2, the
cross-border projects, the European funds for infrastructure modernisation, the agriculture, AGRI
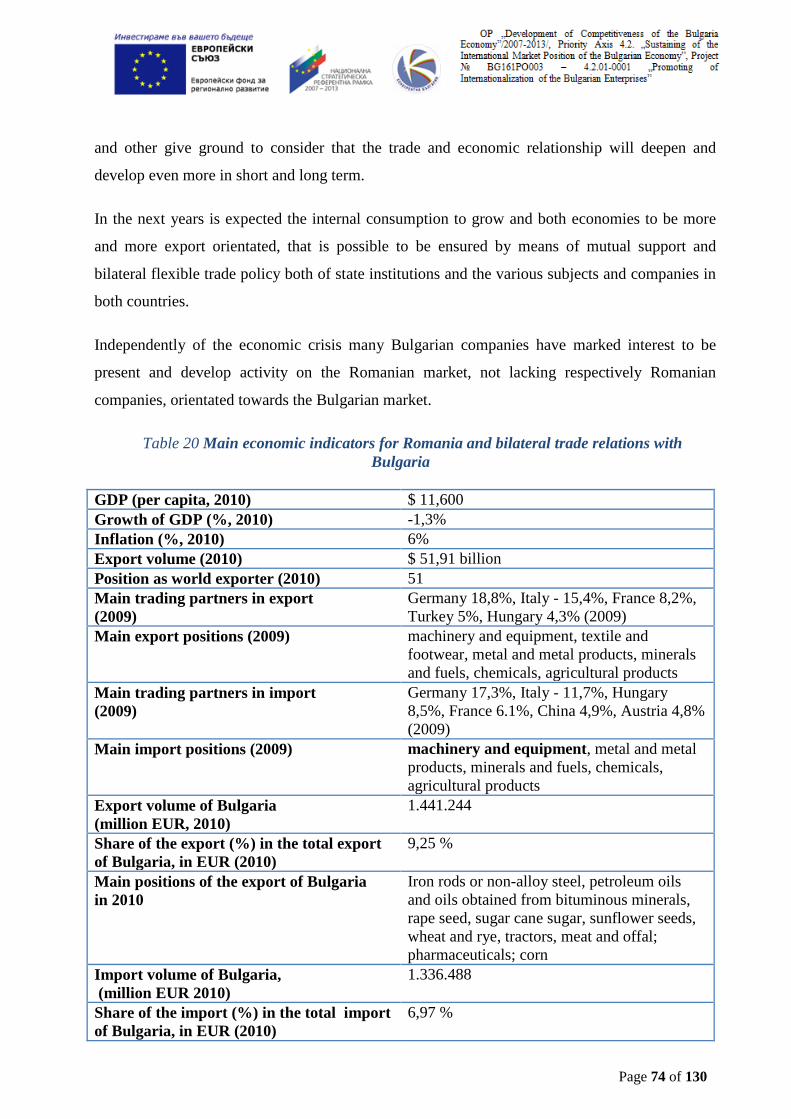
Page 74 of 130
and other give ground to consider that the trade and economic relationship will deepen and
develop even more in short and long term.
In the next years is expected the internal consumption to grow and both economies to be more
and more export orientated, that is possible to be ensured by means of mutual support and
bilateral flexible trade policy both of state institutions and the various subjects and companies in
both countries.
Independently of the economic crisis many Bulgarian companies have marked interest to be
present and develop activity on the Romanian market, not lacking respectively Romanian
companies, orientated towards the Bulgarian market.
Table 20 Main economic indicators for Romania and bilateral trade relations with
Bulgaria
GDP (per capita, 2010) $ 11,600
Growth of GDP (%, 2010) -1,3%
Inflation (%, 2010) 6%
Export volume (2010) $ 51,91 billion
Position as world exporter (2010) 51
Main trading partners in export
(2009)
Germany 18,8%, Italy - 15,4%, France 8,2%,
Turkey 5%, Hungary 4,3% (2009)
Main export positions (2009) machinery and equipment, textile and
footwear, metal and metal products, minerals
and fuels, chemicals, agricultural products
Main trading partners in import
(2009)
Germany 17,3%, Italy - 11,7%, Hungary
8,5%, France 6.1%, China 4,9%, Austria 4,8%
(2009)
Main import positions (2009) machinery and equipment, metal and metal
products, minerals and fuels, chemicals,
agricultural products
Export volume of Bulgaria
(million EUR, 2010)
1.441.244
Share of the export (%) in the total export
of Bulgaria, in EUR (2010)
9,25 %
Main positions of the export of Bulgaria
in 2010
Iron rods or non-alloy steel, petroleum oils
and oils obtained from bituminous minerals,
rape seed, sugar cane sugar, sunflower seeds,
wheat and rye, tractors, meat and offal;
pharmaceuticals; corn
Import volume of Bulgaria,
(million EUR 2010)
1.336.488
Share of the import (%) in the total import
of Bulgaria, in EUR (2010)
6,97 %

Page 75 of 130
Main positions of the import of Bulgaria
in 2010
petroleum oils and oils obtained from
bituminous minerals, petroleum gas and other
gaseous hydrocarbons; copper waste and
debris; waste and debris of cast-iron, iron and
steel; meet and offal; pneumatic rubber tires,
new; oil-cakes; pharmaceuticals, passenger
cars and other motor vehicles; sugar cane
sugar.
Data source: ITC and MEET
For 2009 the amount of the Romanian investments in Bulgaria is 152.5 million EUR and it sets
them on 26th place among the countries investors here. Again for same year but according to
data of the Ministry of foreign affairs of Romania, a total of 36 companies and representatives
with Romanian participation have been registered in Bulgaria, out of which 9 are constituted
with 100% Romanian capital.
In Romania, according to data of the Romanian Ministry of trade, as small and medium-sized
enterprises and the business environment have been registered 1014 companies with Bulgarian
participation, with capital 18 529,7 million EUR, ranking Bulgaria at 41th place among the
investors in the country. The Bulgarian investment in Romania, according to BNB until the end
of 2009 are 41,2 million EUR, where the Bulgarian investment flow there for 2009 is 4,1
million EUR and for the first 6 months of 2010 is 1,6 million EUR with 40,2 million EUR total
flow, i.e. falling of Bulgarian investment abroad for the same period.
The trade and economic relations between Bulgaria and Greece are developed on the basis of
bilateral agreements and that with the EU, directly related to the Republic of Greece as EU
member state. Greece is traditionally entering in the first five of our trade partners from the EU
and takes the leading place among the SEE countries. BCCI is maintaining constant business
contacts with the commerce chambers of the Republic of Greece, the Greek unions and
associations. A number of agreements for cooperation have been signed between the BCCI and
the chambers of commerce of Athens, Seres, Drama, Thessalonica, Kavala, the Greek
Association for Promoting the Export, the Federation of the Greek Industrials, the Small-size
Business Trade Chamber. Regional chambers of the Republic of Bulgaria on their turn are
concluding cooperation agreements for the realization of joint projects, organization of business
visits and meetings.

Page 76 of 130
Legal framework:
Agreement for five-year programme for cooperation in the field of
development /2002-2006/, signed on 28th
August 2002. Treaty for cooperation
in the field of tourism /14th
May 1999/. Double Taxation Avoidance
Agreement with additional protocol /15th
February 1999, protocol on 18th
June
2000, in force since 1st January 2002/;
Agreement for cooperation and mutual assistance between the custom
administration /19th
January 1999, in force since 2nd
March 2000/;
Agreement for the construction of new road border bridge between both
countries in the region of the Kulata-Promahon border crossing point /2nd
July
1997, in force since 1st March 1998/;
Agreement for seasonal employment of workforce, with Annexes 1 and 2 /15th
December 1995, in force since 21st July 1997/;
Agreement for the inauguration of three new border crossing points and road
connections between both countries /22nd
December 1995, in force since 19th
November 1996/;
Agreement for the use of the waters of the Mesta river /22nd
December 1995, in
force since 19th
November 1996/;
Agreement for promotion and mutual protection of investments /12th
March
1993, in force since 29th
April 1995/;
Table 21 Main economic indicators for Greece and bilateral trade relations with
Bulgaria
GDP (per capita, USD, 2010) $ 29 600
Growth of GDP (%, 2010) -4,5%
Inflation (%, 2010) 4,5%
Export volume (billion USD, 2010) $ 21,14 billion
Position as world exporter (2010) 67
Main trading partners in export
(2009)
Germany 11,1%, Italy - 11%, Cyprus 7,3%,
Bulgaria 6,7%, USA 4,9%, UK 4,4%, Turkey 4,2%

Page 77 of 130
(2009)
Main export positions (2009) food and beverages, manufactured products,
petroleum products, chemicals, textile
Main trading partners in import
(2009)
Germany 13,7%, Italy - 12,7%, China 7,1%, France
6,1%, The Netherlands 6%, South Korea 5,7%,
Belgium 4,3%, Spain 4,1% (2009)
Main import positions (2009) machinery, transport equipment, fuels, chemicals
Export volume of Bulgaria to Greece
(million EUR, 2010)
1 236,711
Share of the export to Greece (%) in the
total export of Bulgaria, calculated in
EUR (2010)
7,9 %
Main positions of the export of Bulgaria
to Greece in 2010
textile products and materials, base metals and
electricity
Import volume of Bulgaria to Greece
(million EUR, 2010)
1 141,925
Share of the import from Greece (%) in
the total import of Bulgaria, calculated in
USD (2010)
5,9%
Main positions of the import of Bulgaria
from Greece in 2010
textile products and materials, mineral and chemical
products, machinery and equipment and base metal
Data source: ITC and MEET
For the period 1996-2010 investments from Greece amount to 3.53 bln. EUR, representing
around 9% of the total amount of the investments for the period (39,5 bln. EUR), and the
country ranks 3rd place of total of 182 countries. In 2010 have been attracted 112,5 million
EUR from Greece, amounting to approximately 1.3% of the total sum (3212 million EUR).
According to preliminary data of BNB for 2010 we are reporting PFI in the amount of 1.36 bln.
EUR (two-fold decrease relative to 2009). In 2008 the foreign investment are 3.28 bln. EUR.
In Bulgaria are registered 4139 companies with from 5 to 100% Greek participation until the
end of 2007. In term of this indicator Greece ranks third after Turkey with 6290 companies and
Russia with 4920 companies and before UK with 3902, Macedonia - 2724, Syria - 2606,
Germany - 2330, Italy - 2161 and China - 1842. Greece is the biggest foreign investor in
Albania and Macedonia and the third one in Romania.
Promoting the investment activity in the Balkan regions is a priority of the economic policy of
Greece.
Turkey is a natural regional trading partner; a country with large population and growing
economy, a trade factor in the region.

Page 78 of 130
In the compassable economic background in the contractual legal plan stand out the Agreement
for cooperation in trade and economy, industry and technologies, Agreement for mutual
protection and promotion of investments, Agreement for cooperation and mutual assistance in
customs activity, Agreements on cooperation in energy, infrastructure and tourism. The Treaty
of friendship, good neighbourliness, security and cooperation of 1992 is one of the most
important components of the contemporary contractual and legal basis of our bilateral relations.
The Declaration on the Black Sea economic cooperation of the same year and the Yalta
Declaration of 1998 outline the ambitions for the development of trade relations of the two
countries. In the last 2 years were signed memorandums and agreements on principle in the
field of energy.
Trade and economic relations between the Republic of Bulgaria and the Republic of Turkey
mark a steady upward trend of development in recent years despite the economic crisis and the
registered certain decrease. Turkey ranks sixth in trade of Bulgaria (after Germany, Russia,
Italy, Greece and Romania) and in 2010 our export to Turkey amounted to 1,32 billion EUR
and the import was equal to 1,03 billion EUR. The growth of our export to the Republic of
Turkey amounts to 53% on an annual basis, which is mainly due to the improving condition of
the Turkish economy.
The trade between the two countries is balanced, with a positive trade balance for Bulgaria,
with the exception of 2008 and 2009. The central place of the Bulgarian export is occupied by
products and raw materials of the ferrous and non-ferrous metallurgy, chemical products and
raw materials, products of the oil industry, grain, products of the woodworking industry, etc.
The Turkish import for Bulgaria is dominated by agricultural products, building materials and
cement, ferrous and non-ferrous metals, vehicles for transportation of passangers and goods,
white and brown goods, products of the textile industry, etc.
According to data of BNB, the accumulated total volume of Turkish investments in Bulgaria
for the period 1992 – 2008 amounted to 476,1 million USD, which puts Turkey in 18th
place
among foreign investors in the country. The biggest Turkish investment in Bulgaria is the
“Trakya Glass Bulgaria” glass factory in Targovishte of the “Sisecam” company”, and the first
Bulgarian investor that stepped on the Turkish market is the company “Prista Oil” – Ruse that
built a engine oil factory in the city of Izmir amounting to 6 million USD. Opportunities for
further bilateral cooperation are offered by the tourism sector, energy sector, the participation

Page 79 of 130
of Turkish companies in major infrastructure and construction projects and the prospect for
building joint ventures in various sectors.
Turkey is among the main foreign trade partners of our country occupying 5th
place among
export destinations and 6th
place among importers. Among Balkan region countries Turkey is
the second most important trading partner after Romania.
Table 22 Main economic indicators for Turkey and bilateral trade relations with
Bulgaria
GDP (per capita, 2010) $ 12,300
Growth of GDP (%, 2010) 8,2 %
Inflation (%, 2010) 8,7%
Import volume (2010) $ 185 billion
Export volume (2010) $ 114 billion
Main trading partners in export Germany, France, Italy, Great Britain, Iraq
Export from Bulgaria (2010) $ 1,75 billion
Share of the export (%) in the total export
of Bulgaria
5,83%
Main export positions Copper and copper products, iron and steel, mineral
fuels and distillation products, tobacco products,
timber, electrical and electronic equipment
Import to Bulgaria (2010) $ 1,37 billion
Share of the import (%) in the total
import of Bulgaria
5,41%
Main positions of the import Ores and prime earthly materials, plastics and
plastic products, electrical nad electronic
equipment, aluminium products, machinery, food
Source: ITC and MEET
In the export of Bulgaria for 2010, Serbia holds 8th
place, with a share of 3.5%, regarding the
import it holds 21st place, with share of 1%. The data given determine the importance of the
Republic of Serbia as a foreign trade partner of the Republic of Bulgaria.
Table 23 Main economic indicators for Serbia and bilateral trade relations with Bulgaria
GDP (per capita, 2010) $ 10 661
Growth of GDP (%, 2010) 1 %
Inflation (%, 2010) 10,3%
Export volume (2010) $ 9,794 billion
Position as world exporter (2010) 82
Main trading partners in export
(2009)
Bosnia and Herzegovina 12,2%, Germany -
10,4%, Montenegro 10%, Italy 9,8%
Main export positions (2009) metals, electric machinery and equipment,
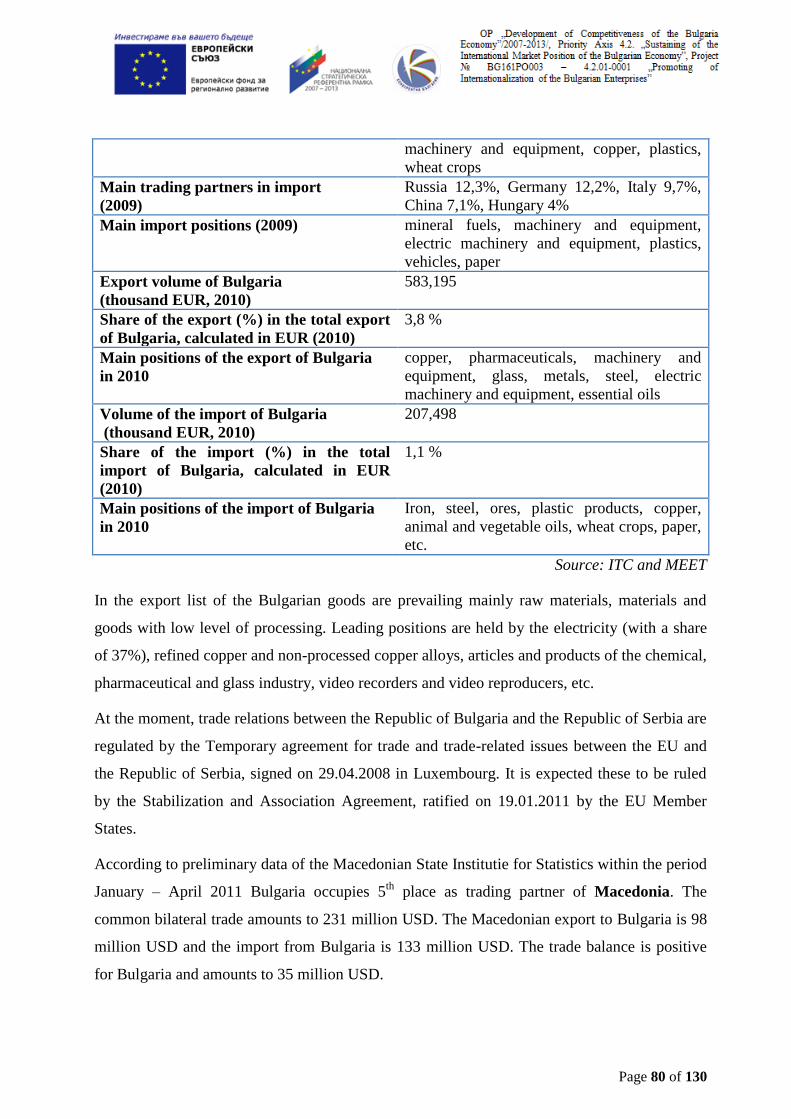
Page 80 of 130
machinery and equipment, copper, plastics,
wheat crops
Main trading partners in import
(2009)
Russia 12,3%, Germany 12,2%, Italy 9,7%,
China 7,1%, Hungary 4%
Main import positions (2009) mineral fuels, machinery and equipment,
electric machinery and equipment, plastics,
vehicles, paper
Export volume of Bulgaria
(thousand EUR, 2010)
583,195
Share of the export (%) in the total export
of Bulgaria, calculated in EUR (2010)
3,8 %
Main positions of the export of Bulgaria
in 2010
copper, pharmaceuticals, machinery and
equipment, glass, metals, steel, electric
machinery and equipment, essential oils
Volume of the import of Bulgaria
(thousand EUR, 2010)
207,498
Share of the import (%) in the total
import of Bulgaria, calculated in EUR
(2010)
1,1 %
Main positions of the import of Bulgaria
in 2010
Iron, steel, ores, plastic products, copper,
animal and vegetable oils, wheat crops, paper,
etc.
Source: ITC and MEET
In the export list of the Bulgarian goods are prevailing mainly raw materials, materials and
goods with low level of processing. Leading positions are held by the electricity (with a share
of 37%), refined copper and non-processed copper alloys, articles and products of the chemical,
pharmaceutical and glass industry, video recorders and video reproducers, etc.
At the moment, trade relations between the Republic of Bulgaria and the Republic of Serbia are
regulated by the Temporary agreement for trade and trade-related issues between the EU and
the Republic of Serbia, signed on 29.04.2008 in Luxembourg. It is expected these to be ruled
by the Stabilization and Association Agreement, ratified on 19.01.2011 by the EU Member
States.
According to preliminary data of the Macedonian State Institutie for Statistics within the period
January – April 2011 Bulgaria occupies 5th
place as trading partner of Macedonia. The
common bilateral trade amounts to 231 million USD. The Macedonian export to Bulgaria is 98
million USD and the import from Bulgaria is 133 million USD. The trade balance is positive
for Bulgaria and amounts to 35 million USD.

Page 81 of 130
Table 24 Main economic indicators for Macedonia and bilateral trade relations with
Bulgaria
GDP (per capita, 2010) $ 9 728
Growth of GDP (%, 2010) 0.7%
Inflation (%, 2010) 1.6%
Export volume (2010) $ 3,332 billion
Position as world exporter (2010) 117
Main trading partners in export (2010) Germany - 20,2%, Italy - 7,1%, Bulgaria -
7,1%, Greece - 6.4%
Main export positions (2010) food, beverages, tobacco products, textile,
iron and steel
Main trade partners in import (2010)
(2010)
Germany - 11,5%, Russia - 11,1%, Greece -
8,3%, Bulgaria - 8,2%, Great Britain - 7%,
Turkey - 5.1%, Italy - 5.1%
Main import positions (2010) machinery and equipment, vehicles,
chemicals, fuels, food products
Volume of the export of Bulgaria
(thousand EUR, 2010)
329,744
Share of the export (%) in the total export
of Bulgaria, calculated in EUR (2010)
2.1 %
Main positions in the export of Bulgaria
in 2010
Electricity, petroleum oils and oils of
bituminous minerals, waste and debris of cast
iron, iron or steel, sunflower oil, rods of iron
or plain steel, passenger cars and other
vehicles, etc.
Volume of the import of Bulgaria
(thousand EUR 2010 )
252,890
Share of the import (%) in the total
import of Bulgaria, calculated in EUR
(2010)
1.3%
Main import position of Bulgaria in 2010 lead, copper and zinc ores, hot-rolled products
of iron or plain steel, raw or non-processed
tobaccos, copper waste, hot-rolled iron pipes,
etc.
Source: ITC and MEET
Ones of the main products forming Bulgaria’s export to Macedonia are: electricity, petroleum
oils and oils of bituminous minerals, crude zink, wheat and mixed wheat and rye, mineral or
chemical nitrogen fertilizers, video recorders or videoreproducers, etc.
The foreign trade relations between two states are assisted by the basis, created upon the signed
on 15.12.2008 in Skopje new Agreement for economic cooperation between the governments
of Bulgaria and Macedonia, a mixed Bulgarian-Macedonian intergovernmental Committee for
economic cooperation. Other treaties, promoting the trade between the two states are:
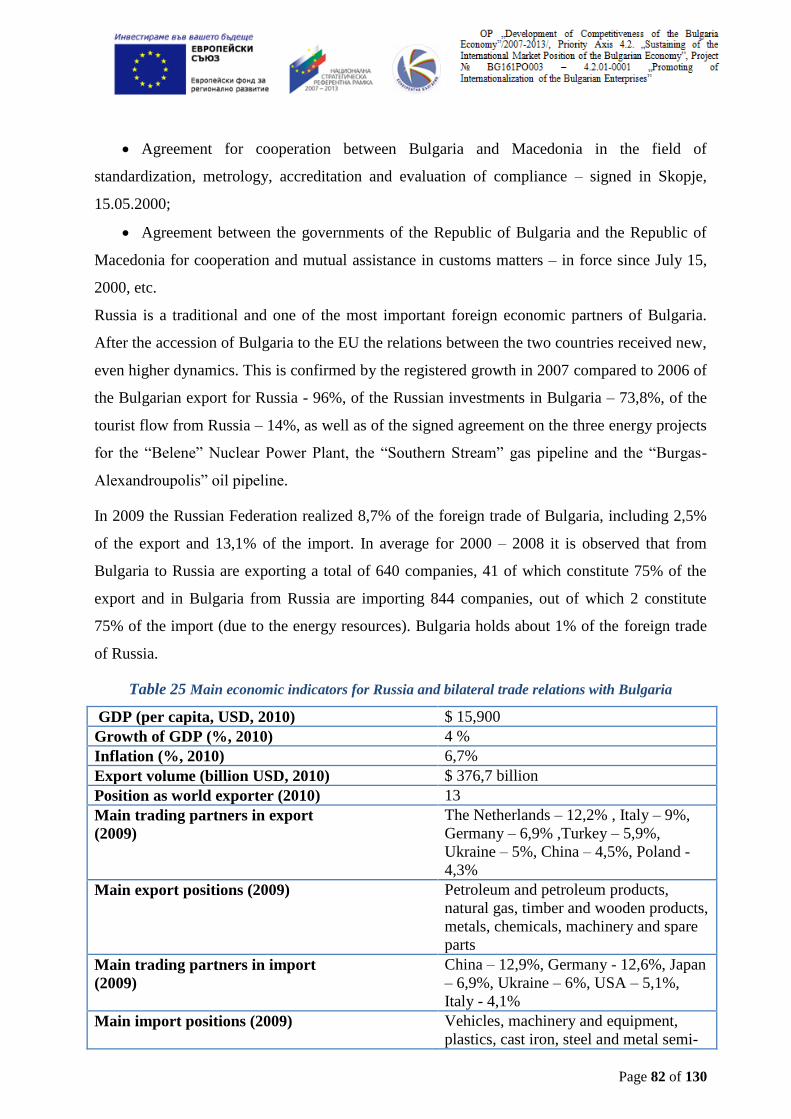
Page 82 of 130
Agreement for cooperation between Bulgaria and Macedonia in the field of
standardization, metrology, accreditation and evaluation of compliance – signed in Skopje,
15.05.2000;
Agreement between the governments of the Republic of Bulgaria and the Republic of
Macedonia for cooperation and mutual assistance in customs matters – in force since July 15,
2000, etc.
Russia is a traditional and one of the most important foreign economic partners of Bulgaria.
After the accession of Bulgaria to the EU the relations between the two countries received new,
even higher dynamics. This is confirmed by the registered growth in 2007 compared to 2006 of
the Bulgarian export for Russia - 96%, of the Russian investments in Bulgaria – 73,8%, of the
tourist flow from Russia – 14%, as well as of the signed agreement on the three energy projects
for the “Belene” Nuclear Power Plant, the “Southern Stream” gas pipeline and the “Burgas-
Alexandroupolis” oil pipeline.
In 2009 the Russian Federation realized 8,7% of the foreign trade of Bulgaria, including 2,5%
of the export and 13,1% of the import. In average for 2000 – 2008 it is observed that from
Bulgaria to Russia are exporting a total of 640 companies, 41 of which constitute 75% of the
export and in Bulgaria from Russia are importing 844 companies, out of which 2 constitute
75% of the import (due to the energy resources). Bulgaria holds about 1% of the foreign trade
of Russia.
Table 25 Main economic indicators for Russia and bilateral trade relations with Bulgaria
GDP (per capita, USD, 2010) $ 15,900
Growth of GDP (%, 2010) 4 %
Inflation (%, 2010) 6,7%
Export volume (billion USD, 2010) $ 376,7 billion
Position as world exporter (2010) 13
Main trading partners in export
(2009)
The Netherlands – 12,2% , Italy – 9%,
Germany – 6,9% ,Turkey – 5,9%,
Ukraine – 5%, China – 4,5%, Poland -
4,3%
Main export positions (2009) Petroleum and petroleum products,
natural gas, timber and wooden products,
metals, chemicals, machinery and spare
parts
Main trading partners in import
(2009)
China – 12,9%, Germany - 12,6%, Japan
– 6,9%, Ukraine – 6%, USA – 5,1%,
Italy - 4,1%
Main import positions (2009) Vehicles, machinery and equipment,
plastics, cast iron, steel and metal semi-

Page 83 of 130
manufactured goods, consumer goods,
food
Export volume of Bulgaria to Russia (million
USD, 2009)
415,8
Share of the export to Russia (%) in the total
export of Bulgaria, calculated in USD (2009)
2,5 %
Main positions in the export of Bulgaria for
Russia in 2009
Medications, wine, aircraft, fittings,
spare parts, refrigerators, freezers,
cables, beverages, cosmetics
Import volume of Bulgaria to Russia (bln. USD,
2009)
3,03
Share of the import (%) from Russia in the total
import of Bulgaria, calculated in USD (2009)
13,2 %
Main positions in the import of Bulgaria from
Russia in 2009
Crude oil, natural gas, hard coal, refined
copper and alloys, paper, calcium
phosphates, motor carriages, machinery
and equipment, spare parts
Source: ITC and MEET
Bulgarian export for Russia is diversified to a high extent, the share of medications, fitting
articles, car and truck parts, cooling equipment, batteries, aircraft, fittings, cosmetics constitutes
around half of the Bulgarian export. The increase in supply volumes of these and other
positions will allow reducing the large negative balance in the bilateral trade, caused by the
import of energy and fuels.
Trade and economic relations between Bulgaria and Saudi Arabia have traditionally good
character. Bulgaria attaches importance to the opportunities for their development, which at this
point are mainly in the field of trade.
Since 2007 it is observed an intensification of the bilateral relations in trade and economic
field, resulting in the realization of meetings and visits in the two countries and a relative
growth of trade.
For the period 1996-2009 the Saudi investments in Bulgaria totaled 20.7 million USD.
Opportunities for attracting direct investments in energy, tourism and agriculture are practically
limitless.
On April 14, 2007, in Riyadh was signed General Agreement on cooperation between the
government of the Republic of Bulgaria and the government of the Kingdom of Saudi Arabia,
approved by Resolution of the Council of Ministers № 516/31.07.2007, promulgated in issue
53/11.07.2009 of SG, effective as of June 11, 2009. On the Bulgarian part the document was

Page 84 of 130
signed by the Deputy Prime Minister and Minister of Foreign Affairs Ivaylo Kalfin, and on the
Saudi part – by the Minister of Foreign Affairs N. Kr. V. Saud al-Faisal.
BARRIERS TO THE INTERNATIONALIZATION OF SMALL AND MEDIUM
ENTERPRISES AS WELL AS MEASURES AND PERSPECTIVES FOR
STIMULATION AND DEVELOPMENT OF EXPORT
Among the main barriers to the internationalization of SMEs are:
1) Existence of preferential financial conditions for foreign participants;
2) Overdetailed and complicated customs service;
3) Lack of information network for export partners and destinations;
4) Lack of tax and credit concessions in connection with the volume of the exported
production;
5) Lack of export statistics for SMEs from the sector and development of the
international markets;
6) Low barriers for entry on the market of the foreign market participants;
7) Lack of administrative optimization and synchronization.
Barriers to the internationalization of SMEs from the sector indeed represent a difficulty,
because their overcoming requires fresh financial resources, which the companies do not have.
In practice, the companies, in order to operate on foreign markets, need funds for advertising,
establishment of trade relations, maintenance of close trade contacts and partnerships; more
distant destinations for delivery require bigger amounts for logistics and all these parameters
assembled within the financial capabilities of the company exceed many times the available
budgets for the implementation of the activities on the manufacture itself and the creation of the
production. Currently, SMEs from the sector are in a very serious financial difficulty, since the
deterriorating market picture deforms the market connections and relations and sets new
specific modes of operation in a situation of unpredictable environment. The main problem
comes from the fact that almost every month the gas prices in the country increase and this
raises the cost of the final production of the enterprises. Another burden for the companies from
the sector is the fact that when requests for gas supply are made and when this raw material is
not put to use due to some marketeering or seasonal lack of orders, the companies owe a

Page 85 of 130
penalty for the requested but unused gas. Therefore, very often in the sector “is exercised” re-
invoicing of various costs and the commitment of the country to the international market prices
makes SMEs highly dependent, and, in practice, puts them “on their knees” before the
international market instead of “launching” them to better market positions. In this sense, the
market situation in the sector is highly delicate because the sector itself may any time implode,
that is to “explode inwards”, or collapse due to the lack of funds, due to the existence of a grey
sector, due to the inability to respond to the monopoly set prices of the energy resources and
due to permanent bilateral pressure by external competitors, on one hand, and the low labor
productivity of the peopled employed in the sector, on the other hand. The market participants
cannot, due to the lack of fresh capital, even declare participation in traditional specialized
exhibitions for the sector such as “PRINTCOM”, organized by International Fair – Plovdiv and
other marketing events organized specially for the companies in the sector, despite the
introduced low prices of exhibition area in view of the financial and economic crisis.
The development of the necessary capacity of SMEs from the sector can be promoted by
creating a specialized communication channel which would be maintained by the interested
participants on the market.
Secondly, the development of “networking” /work in networks/ should also be highly
encouraged and various working formats in various regions of the country should be conducted
regularly and on different initiatives.
Thirdly, it is very important that Bulgaria join the CEPI confederation in order to have access
to the information arrays and the specialized reports, accounts and statistical data of the other
producers from the EU-27 Member States. Moreover, this network of market participants is
also involved in other formats such as “Council of Association of Forests and Paper” and
“Alliance of competitive industries in Europe”, etc.
It is also very important for market participants that they work in close cooperation with
suppliers and organize direct surveys (market research) to the end customers for the nature of
their consumer needs and the trends, which are formed in the sector. Moreover, the technical
cooperation between suppliers and producers could be very useful when new technologies for
handling and processing of the primary raw materials are implemented. Such cooperation could
be particularly useful when it comes to the introduction of new chemicals and chemical
products for the treatment of the different intermediate and end products.

Page 86 of 130
With a view to the set out possible directions of development and promotion of the export, it
should also be considered the environmentally consistent norms and standards which have been
introduced in this sector and which the Bulgarian SMEs must comply with.
In this respect, the international cooperation may play a key role in the introduction of new
high technologies in the production sphere and the reaching of higher standards and application
of leading practices which serve as a specific guarantee for the subsequent admission on the
demanding European markets.
The gravest barrirs identified as a result of a sociological survey conducted among
export-oriented SMEs from the sector are: 1) the high risk on the various foreign markets; 2)
lack of support by the Bulgarian state for the export; 3) the unfavorable business environment
in Bulgaria 4) the high production costs of goods and services.
The most significant obstacles to the internationalization of Bulgarian SMEs from the
sector are related to external factors and mostly to the unfavorable business environment in
Bulgaria and the lack of support by the State.
This is the reason why most measures for overcoming the barriers to the export are
expected to be taken by the State. In summary, the expectations of the branch are that the State,
represented by its institutions, should developed a purposeful and relevant policy to promote
and support the export of the companies from the sector.
The technological level, qualification of personnel and low labor costs in SMEs from
the sector are assessed as critical factors related to success in export, which is consistent with
the high priority of measures to support SMEs from the sector for technological modernization
of the production.
Assessments of the importance of almost all priority measures to support SMEs from
the sector identified in the survey of the companies increase their importance in the next
programming period 2014-2020. This means that it will be necessary to allocate more resources
to implement these measures for the development of the enterprises from the sector.
Companies rely most heavily on the Internet and on the realization of their own
surveys for the purpose of obtaining the information they need about the export, and on the
next place are the colleagues from the sector. To very small extent are used the services of the
institutions and branch organizations.

Page 87 of 130
ANTICORRUPTION COMPONENTS
The profile of the corruption risk in this environment is predetermined to a large extend by the
traditional development of exports, the lack of funds for investments in technologies and
development of new products, as well as the relatively small number of enterprises specialised
in this type of production.
The expert assessments outline the following profile of potential corruption risk:
Insufficient technical and resource provision, including absence of investments in
innovations.
Absence of mechanisms for control and penalising of unfair competition.
Incomplete or partial definition of the scope of competency of the different authorities
and institutions.
Limited access to market research.
Incommensurability between the standards supported by the EU member states and the
local rules and the existing economic situation in foreign markets.
Access to internal orders determines higher levels of corruption risk.
Absence of administrative capacity.
Absence of competent staff for conducting the operations.
High threshold of public tolerance to the existing corruption practices; general level of
passiveness and the awareness of the absence of guarantees for defending the interests of the
enterprise.
Three well recognised cross-national surveys of the international anticorruption organisation
Transparency International can be used as tools for estimation of the corruption risk and
planning of export strategies: Corruption Perception Index (CPI), Global Corruption Barometer
(GCB), Bribe Payers Index (BPI). They provide comparative information regarding the level of
spread of corruption on global scale and the extent to which key national institutions and
sectors have been affected.
А) Markets in EU Member States: Greece, Italy, Romania, France, Poland
In terms of the CPI, the above countries are ranked as follows: France (7), Italy (3.9), Poland
(5.5), Italy (3.9), Romania (3.6), Greece (3.4).
According to GCB the institutions and sectors most affected by corruption are: in Romania –
political parties and Parliament; Greece – political parties and media; Italy – judiciary, customs,
agricultural services and medical services.
Page 88 of 130
Institutions and sectors less affected by corruption are: in Greece – tax institutions, police and
judiciary.
The most significant pressure for payment of bribes (expressed in percentage of citizens who
has been wanted bribes in the last year) is in the following sectors: Greece – customs
(16.9%), agricultural services (4.9%) and registration authorities (4.4%); Romania - police
(16.2%), judiciary (13.0%) and registration authorities (10.8%); Poland – police (11.6%),
judiciary (8.8%), registration authorities (8.5%), agricultural agencies (6.7%); Italy –
judiciary (28.8%), customs (13.9%), agricultural services (12.9%) and medical services
(10%); France – agricultural services (8.1%), customs (5.4%) and medical services (5.1%).
B) Markets outside the EU Member States: Russia, Serbia, Macedonia, Turkey, Saudi Arabia
In terms of CPI, the above countries index values are: Russia (2.4), Serbia (3.3), Macedonia
(3.9), Saudi Arabia (4.4), Turkey (4.2).
According to GCB the institutions and sectors most affected by corruption are: Russia –
judiciary, public administration and Parliament (the risk of administrative corruption is leading
compared to the risk of political patronizing corruption); Macedonia – judiciary, political
system; Serbia – political parties, public administration, judiciary and police.
Institutions and sectors less affected by corruption are: Macedonia – tax administration,
media, Serbia – registration authorities.
The most significant pressure for payment of bribes (expressed in percentage of citizens who
has been wanted bribes in the last year) is in the following sectors: Macedonia – customs
(25%), judiciary (20.6%); Serbia – police (14.5%), judiciary (13.0%) and customs (10.9%);
Russia – police (27.7%), agricultural agencies (20.2%), judiciary (17.7%), customs (10.9%)
and registration authorities (8.6%); Turkey – customs (32.4%), agricultural agencies (32.2%),
tax services (34,5%), registration authorities (31.2%), police (28.9%), judiciary (26.2%).

Page 89 of 130
SWOT AND PESTEL ANALYSES – SECTOR “MANUFACTURE OF
PULP, PAPER, BOARD AND ARTICLES ”
The SWOT analysis is an instrument by which it is possible to identify the strengths,
weaknesses, opportunities and threats with regard to a certain policy or activity. This is an
acronym from the first letters of the respective words in English /Strengths, Weaknesses,
Opportunities, Threats/.
The LOED analysis is an instrument by which we can identify in what way the positive effect
of the analyzed policy can be increased and in what way the negative effects can be countered.
The word is an acronym from letters of the words in English – lever, overcome, exploit, defend.

Page 90 of 130
Table 26 SWOT and LOED analyses
S.W.O.T L.O.E.D
Strengths:
1. Benefits resulting from Bulgaria’s membership in the EU and
NATO
2. Access to funds enabling the development of investment and
entrepreneurial activity
3. Favorable atmosphere for the development of international
contacts.
4. In Bulgaria there is political stability that guarantees the
security of both foreign and local investments.
5. Rich tradition in scientific and technical research.
6. Legislation is amended and adapted to European standards in
this sphere
7. Relatively low levels of work remuneration, stimulating
entrepreneurship and export.
8. Favorable geographical location.
9. A long tradition in international trade.
10. Developed system of international transport.
11. Resource base of timber, situated all over the country.
12. Bulgaria’s membership in the World Trade Organization
(WTO).
Lever:
1. Popularization of the geographical location and image of the
country.
2. Implementation of structural projects and strategies.
3. Increasing the qualification for the priority industries.
4. Building up specialists.
5. Imprving the necessary equipment in schools and universities
related to the priority strategy.
6. Control of the production and reduction of emissions
polluting the environment.
7. Preparation of preferential entrepreneurial credit terms.
8. Policy of integration between domestic and foreign market.
9. Creating international partnerships.
10. Policy to promote the export-oriented companies.
Weaknesses:
1. Limited and scarce financial resources.
Overcome:
1. Implementation of plans and programs to improve and
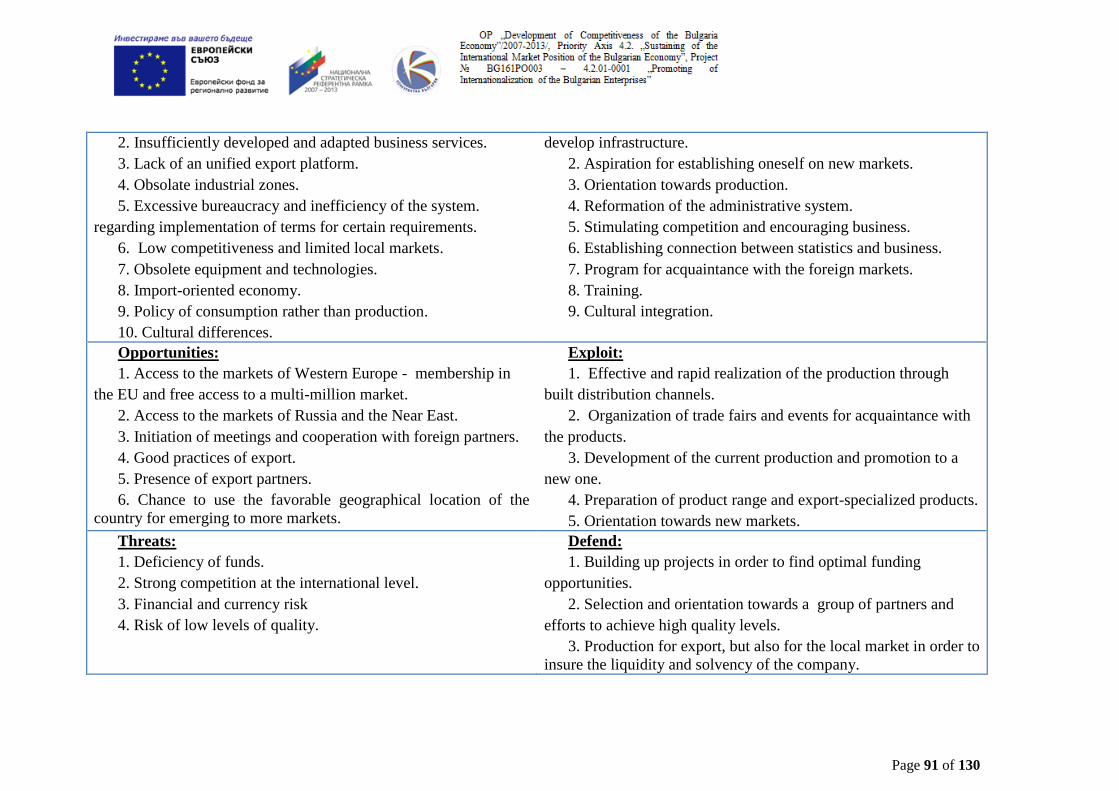
Page 91 of 130
2. Insufficiently developed and adapted business services.
3. Lack of an unified export platform.
4. Obsolate industrial zones.
5. Excessive bureaucracy and inefficiency of the system.
regarding implementation of terms for certain requirements.
6. Low competitiveness and limited local markets.
7. Obsolete equipment and technologies.
8. Import-oriented economy.
9. Policy of consumption rather than production.
10. Cultural differences.
develop infrastructure.
2. Aspiration for establishing oneself on new markets.
3. Orientation towards production.
4. Reformation of the administrative system.
5. Stimulating competition and encouraging business.
6. Establishing connection between statistics and business.
7. Program for acquaintance with the foreign markets.
8. Training.
9. Cultural integration.
Opportunities:
1. Access to the markets of Western Europe - membership in
the EU and free access to a multi-million market.
2. Access to the markets of Russia and the Near East.
3. Initiation of meetings and cooperation with foreign partners.
4. Good practices of export.
5. Presence of export partners.
6. Chance to use the favorable geographical location of the
country for emerging to more markets.
Exploit:
1. Effective and rapid realization of the production through
built distribution channels.
2. Organization of trade fairs and events for acquaintance with
the products.
3. Development of the current production and promotion to a
new one.
4. Preparation of product range and export-specialized products.
5. Orientation towards new markets.
Threats:
1. Deficiency of funds.
2. Strong competition at the international level.
3. Financial and currency risk
4. Risk of low levels of quality.
Defend:
1. Building up projects in order to find optimal funding
opportunities.
2. Selection and orientation towards a group of partners and
efforts to achieve high quality levels.
3. Production for export, but also for the local market in order to
insure the liquidity and solvency of the company.
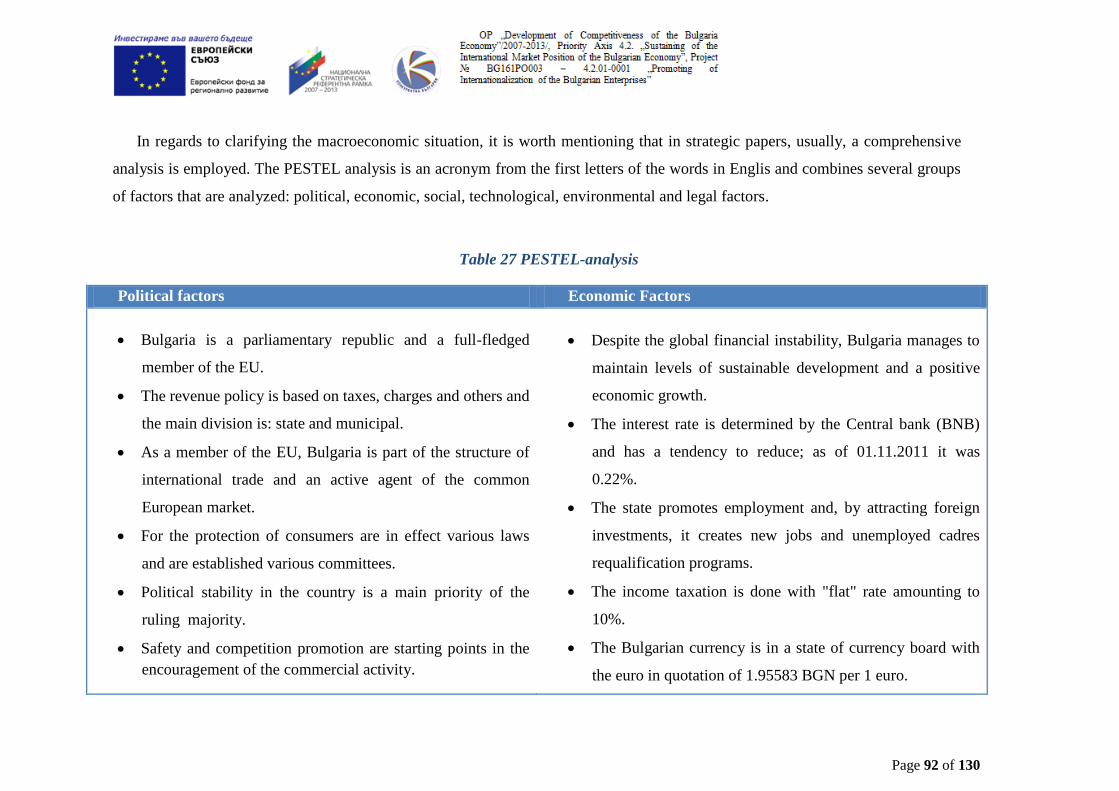
Page 92 of 130
In regards to clarifying the macroeconomic situation, it is worth mentioning that in strategic papers, usually, a comprehensive
analysis is employed. The PESTEL analysis is an acronym from the first letters of the words in Englis and combines several groups
of factors that are analyzed: political, economic, social, technological, environmental and legal factors.
Table 27 PESTEL-analysis
Political factors Economic Factors
Bulgaria is a parliamentary republic and a full-fledged
member of the EU.
The revenue policy is based on taxes, charges and others and
the main division is: state and municipal.
As a member of the EU, Bulgaria is part of the structure of
international trade and an active agent of the common
European market.
For the protection of consumers are in effect various laws
and are established various committees.
Political stability in the country is a main priority of the
ruling majority.
Safety and competition promotion are starting points in the
encouragement of the commercial activity.
Despite the global financial instability, Bulgaria manages to
maintain levels of sustainable development and a positive
economic growth.
The interest rate is determined by the Central bank (BNB)
and has a tendency to reduce; as of 01.11.2011 it was
0.22%.
The state promotes employment and, by attracting foreign
investments, it creates new jobs and unemployed cadres
requalification programs.
The income taxation is done with "flat" rate amounting to
10%.
The Bulgarian currency is in a state of currency board with
the euro in quotation of 1.95583 BGN per 1 euro.

Page 93 of 130
The financial policy implemented by the state manages to
keep the inflation in the range of its normal values.
The trust of the consumers is facing a serious test, as the
regulation and quality management system needs a higher
effectiveness.
Social factors Technological factors
The cultural and demographic detachment of Bulgaria
involves a variety of daily and cultural differences between
the broad representation of ethnicities. Nevertheless, the
integration of these ethnicities is successful.
Relatively aging of the population and a negative growth (-
0.6% for 2010). A positive growth was reported in the
period between 1960 and 1990 which then became negative
and reached its lowest levels in 1990 and 2001 almost
reaching -2.0%.
Statistics like this one clearly reproduce the influence of
the political factors on the social and demographic structure
of society.
At national level it is observed an expressed labor mobility
and a certain part of the specialists find professional
realization abroad and in particular – within the EU. This
Scientific research in Bulgaria has a rich tradition and
experience.
Industry operates and is organized by technological
activities, which determines the need for knowing and
examinating them.
Bulgaria is among the world leaders with regard to its
researchers, who have given the world numerous
discoveries, inventions and innovative technologies. Few of
them reach the community due to the fact that they cannot
find investors in the country.
The exchange of technology with the rest of the world has
marked its beginning since the early years of the last
century. With the construction of the modern state, these
technologies play a significant role in the construction of
each unit.

Page 94 of 130
shows how the mechanisms of the community work and
how the labor market creates demand and supply outside the
borders of a country.
The living standard in Bulgaria is a social category subject
to a thorough examination and multifactorial analysis. The
level of net income is relatively low, unlike that of
ownership of real estate.
Entrepreneurship in Bulgaria is the reason for the
implementation of many projects, including the absorption
of funds from European fund paths.
The issue of education in Bulgaria is a topic of utmost
priority. The state provides free elementary, primary and
secondary education; higher education also being financially
supported for the most part.
Healthcare in Bulgaria is in a phase of transformation and
readaptation to the new realities after 1989. Nevertheless,
the state is committed to the preservation of the major
medical centers and encourages their functioning in the
interest of public good.
The life cycle of the products, as well as their going out of
use, becomes shorter and shorter with the opening of
markets and the invasion of newer and more energy-
efficient products.
Both in political and in purely technical aspect, the global
energy saving policy is also applied in Bulgaria. It includes
the construction of alternative energy sources that should
reduce the levels of harmful emissions and generate lower
levels of cost for the end user.
With respect to the information technologies and the
Internet, the country is among the European leaders in the
field of their introduction, use and development.
Environmental factors Legal environment factors
Bulgaria is among the countries with the most widely
developed and included eco-tourism in Europe.
Bulgaria is a statutory Republic and the fundamental law is
the Constitution.

Page 95 of 130
It is being worked on strategies for wastewater treatment
and construction of incinerators for waste incineration.
Planned urbanization and cultivation of gardens, parks and
ponds.
Care for the environment and the wildlife is secured by
legal regulations.
More than 1/3 of the territory of Bulgaria is forested area.
The varied relief involves diversification of climatic
characteristics in the country.
Bulgaria’s judicial system is a direct expression of the
judiciary branch and it is devided into different levels and
instances for the purpose of being more accessible to
people.
Of all the rights, the one of priate property is the starting
point for most of the changes after the transition to a market
economy.
Bulgaria is a country with an established legal system that
allows its citizens position and protection and that guarantee
them the full functioning of democracy.

Page 96 of 130
STRATEGIC GOALS FOR STIMULATION OF THE EXPORT BY
SMALL AND MEDIUM ENTERPRISES FROM THE „MANUFACTURE
OF PULP, PAPER, BOARD, AND ARTICLES” SECTOR
GOALS
To achieve the so set objectives, it is necessary to identify measures to support the
export by SMEs from the “Manufacture of pulp, paper, board and articles” sector, which
should be focused on the problem areas identified by the analyses. The selected measures
should also be clearly linked with the possible mechanisms by which state institutions can
influence the processes. Under these constraints were identified areas in which state
institutions, through commitments, and other stakeholders, through promotion and
incentives, could implement actions to achieve the set objectives. For each of the selected
areas has been set a clear and measurable specific objective, namely:
Specific objective 1
To build and proceed to the successful functioning of information and normative base
for the promotion of the export of SMEs from the sector of production of fibrous semi-
manufactured goods, paper, board and articles. This specific objective is divided in the
following sub-objectives:
1.1. Preparation and update of the sector development strategy.
1.2. Updating the strategy for promotion of the export by SMEs from the sector.
1.3. Creating a profile of an export-oriented enterprise.
1.4. Creating an adequate database for SMEs that assists management decision
making for the sector.
Specific objective 2
To increase the qualification in SMEs from the sector of production of fibrous semi-
manufactured goods, paper, board and articles, focusing on trade cadres and units
engaged in foreign trade at the company level.

Page 97 of 130
Creation and implementation of programs for improvemnt of the qualification of
export specialists in SMEs.
Creation and implementation of a training program for participation in international
fairs.
Specific objective 3
To support the activities of the enterprises and their access to foreign markets and
partners.
Financial support for enterprise certification of quality management, environmental
management, and introduction of a modern system for safe and healthy working
conditions.
Increase of the influence of the assessment for the export orientation of the enterprises
in the overall assessment for receiving of financial support.
Support for the creation/further development of organizations/clusters for promotion
of the export from SMEs.
Exportation of the services for the organization of the Bulgarian participation in fairs,
exhibitions and other advertising events to the respective branch organizations, under
established clear rules for equality in the selection of the participants.
Creation of a mechanism for financial support for the participation of foreign partners
in local fairs and exhibitions.
Several specific goals at different levels should be taken into account:
Specific goals at macro level:
1. To popularize the programme OP “Competitiveness” for the small and
medium enterprises engaged in this economic activity.

Page 98 of 130
2. Bulgarian authorities should insist that in the next program cycle of the EU
2014-2020 be established mechanisms for a faster attainment of EU funds to
the Bulgarian SMEs from the sector.
3. To develop and organize a common format for the promotion of Bulgarian
production produced by these SMEs on foreign markets.
4. To focus on the role of the vocational training and specialization through the
form – on-the-job training under the line of MLSP МТСП.
5. Introduction of financial and economic incentives for the enterprises from the
sector when they are trying to apply the international export standards with
regard to packaging, labeling, faultlessness and opportuneness of deliveries,
etc.
6. Establishment of an institution or association to carry out annual reports,
forecasts and analyses for the enterprises from the sector.
Specific goals at meso level:
1. In 2012 to 2014 at the latest to be structured a working mechanism for
processing and analysis of feedback from companies operating in the sector
with a view to a better positioning of the participants on external markets.
2. Creation of a pool of enterprises which provide, on a voluntary basis,
information for the sector development in the country and abroad with a view
to build a synchronized development and favorable export lay-outs.
3. Transition to a regular information exchange format through conferences,
round tables, forums, etc.
4. Inclusion of political lobbying outside the country through the commercial
attaches and other authorities with a view to the implementation of the sector
strategy for the promotion of export.
5. Preparation of generalized and detailed reports by NSI for the development of
the economic activity.

Page 99 of 130
6. Transition to a system of national representative market condition research
every two or three years with a view to update the priorities in the sector and
of the state.
Specific goals at micro level:
1. Overcoming the problem of retrenchment of jobs and dismissal of workforce.
2. At the company level, to allocate funds for marketing research at least once a
year, which would be processed and stored as part of the common program
documents for the development of the company.
3. To make an attempt to retain the salary levels of employees and not to be
reduced, by preparing organizational changes in the employment method,
consistent with the production cycle of the company.
4. To promote the obtaining of a higher educational degree for the currenly
employed persons in the company.

Page 100 of 130
STRATEGY FOR STIMULATION OF THE EXPORT OF SMEs FROM
THE SECTOR
Different alternatives of development are possible for achieving the set goals; two main
scenarios were assessed in the case, namely:
Maintaining the current structure of state institutions providing business support,
including the existing relationship between them and with export-oriented SMEs from
Sector “Manufacture of pulp, paper, board and articles”.
Changing the structure and transferring the functions to support SMEs to units and forms
related to financing projects by EU funds and state budget on the model of Operational
Programmes or the Rural Development Programme.
The criteria under which these scenarios were assessed are:
1. Possibility that the scenario chosen be carried out within 5 years;
2. Way of resolving the issues of supporting export-oriented SMEs in other EU
countries;
3. Evaluating the effectiveness of activities related to business support and carried out
by structures created for that purpose or existing programmes supporting a project
basis.
The analysis made showed that:
transition from from a currently existing system to a new one, implemented
on a project basis, will require a period longer than 5 years. At the same
time, under the currently existing rules, in the period until 2013 this is
practically imposible, as the priorities and mainactivities in the operational
programmes are clearly defined. In the next programming period 2014-2020
such an approach, if possible, should underlie in the negotiations, but in

Page 101 of 130
practice it will again take several years for its actual launching, like the
launch of OP in all EU countries for the period 2007-2013.
the scheme selected in Bulgaria through BSMEPA is preferred by the
majority of the EU countries, their success rate being different in different
countries, but there is no trend for occurrence of changes in the near future.
√ the difficulties reported in the realization of business projects in operational
programmes, such as “Competitiveness”, show that the effectiveness of
support for the export-oriented SMEs, however criticized currently due to
lack of resources and better focus, is at a relatively much better level than the
achieved results by business through project-oriented measures.
In the so made conclusions was preferred the first alternative, namely the preparation of
the Export Strategy for SMEs in Sector “Manufacture of pulp, paper, board and articles” to
rest on the assumption that all measures taken will be within the currently existing structures
within their current capabilities.
In the strategic perspective the selected alternative will require both measures that are
common to the entire SMEs support system, such as increasing the capacity of institutions,
introducing clear and measurable indicators and criteria for the evaluation of the
effectiveness of their work and support given to business, etc., and specific changes relating
specifically to the “Manufacture of pulp, paper, board and articles” sector, such as sector-
oriented approach of work. Although this was not subject of analysis and study of this
strategic document, it will probably be part of the preparation of institutional strategy of the
relative state administrations.
In this Export Strategy for SMEs in Sector “Manufacture of pulp, paper, board and
articles” have been provided for the following basic steps to improve the support for the
export-oriented SMEs:
1. Creating the basis for an adequate and professional management of the processes,
which support export-oriented SMEs, by identifying their possible scope – number
and characteristics of the export-oriented SMEs, use of information of the profile,
and information of the business for the precise formulation of the business needs of

Page 102 of 130
support both by the institutions created for this purpose and through other forms, for
example, on a project basis, creating a model for successful communication with
businesses that can be supported.
2. Preparation of the necessary programs, policies and measures to assist SMEs to
export to foreign markets through measures aimed at markets where the existing
positions should be maintained or expanded, collaboration with units having direct
opportunities to support the export (for example, foreign trade representatives and
MEET), as well as measures having a routine nature (for example, participation in
fairs, missions, visits, etc.);
3. Measures targeting specific deficits in export-oriented SMEs, which constitute
barriers to their development in export terms, such as: promoting technological
modernization of SMEs in connection with the improvement of their export
positions, supporting the creating of export companies which shall support the export
by SMEs; creating state guarantees for export insurance of SMEs which shall
complement and develop the currently existing forms; advertertising campaigns to
improve the image of Bulgarian business, etc.
4. Measures aimed at enhancing the capacity of SMEs, mainly through various training
programs.
Given the deadlines of the Export Strategy for SMEs in Sector “Manufacture of pulp,
paper, board and articles”, the steps provided for are realistic and would lead to tangible
results in promoting the export.
Another important prerequisite for the implementation of the strategy is the political will
to provide the necessary means for its realization.
Page 103 of 130
ACTION PLAN – SECTOR „MANUFACTURE OF PULP, PAPER,
BOARD, AND ARTICLES”
Due to the medium-term 5-year horizon of the Strategy, measures have been
specifically formulated in the Action Plan.
The provided financial resources are consistent with the realistic opportunities to
increase the budget of BSMEPA. Estimates of the funds from the operational
programmes in the next period are too conditional, as yet there are no rules finally
accepted by the EU. At the same time, it is crucial that BSMEPA and MEET defend fair
request for funds precisely for this leading export sector for the country and for the
development of SMEs that are tha backbone of any economy.
For each of the provided measures have also been identified actions to be taken at
micro- (enterprises), meso- (branch organizations) and macro (state) level.
Based on the performed analyses of the export of commodity groups, have been
defined markets that are important and priority for the sector. For them have been
prepared indicative promotional measures, which, given the period of crisis, are aimed
not at conquering new markets, but at preserving the already existing market positions of
SMEs in the export.
Short-term objectives /2012 – 2013/
1. Updating the introduced technological norms, standards and requirements.
2. Creating a “Road map” for convergence of the interests of SMEs form the
sector.
3. Introducing organizational changes for taking hold of the processes of
retrenchment of jobs and dismissal of workforce.
4. Facilitating the functioning regimes of bank guarantees and bank lending to
the sector.

Page 104 of 130
5. Mastering the appreciation processes of the energy prices, including the price
of gas.
Medium-term objectives /2012 – 2014/
1. Building and updating a system for decision making for promoting Bulgarian
production abroad.
2. Creating an association for commercial foreign representation in potentially
the most attractive markets for enterprises of the segment.
3. Creating analytical examinations on a regular basis for the development of the
sector in the EU-27 as a whole and for other current and potential markets
outside the EU, such as the CIS countries, the Arab countries and others.
4. Creating economic clusters based on a certain market, commercial, production
or other sign.
5. Creating foreign language brochures for the development of the enterprises
from the cluster.
6. Reorganizing the individual data arrays and competing documentation for
applying for EU projects of the next budget cycle.
7. Increasing the level of computerization, automation and use of information
technologies.
Long-term objectives /2014 – 2020/
1. Promoting the improvement of the industrialization level in the sector by
promoting technological innovations in SMEs from the sector and a
communication policy.
2. Promoting investment in the human capital.
3. Introduction of alleviating financial conditions in the implementation of high-
tech solutions and trainings.
4. Creating an innovation fund for cluster participation of enterprises from the
sector.
5. Creating and branding of industrial cluster brands.

Page 105 of 130
The Action plan should be implemented consistently and in good faith, in
synchronization between state institutions, interested producers and parties from the
economic activity.
Controlling on the plan implementation may be coordinated at the branch level or at
the level of state authority in case of majority consent of the market participants.
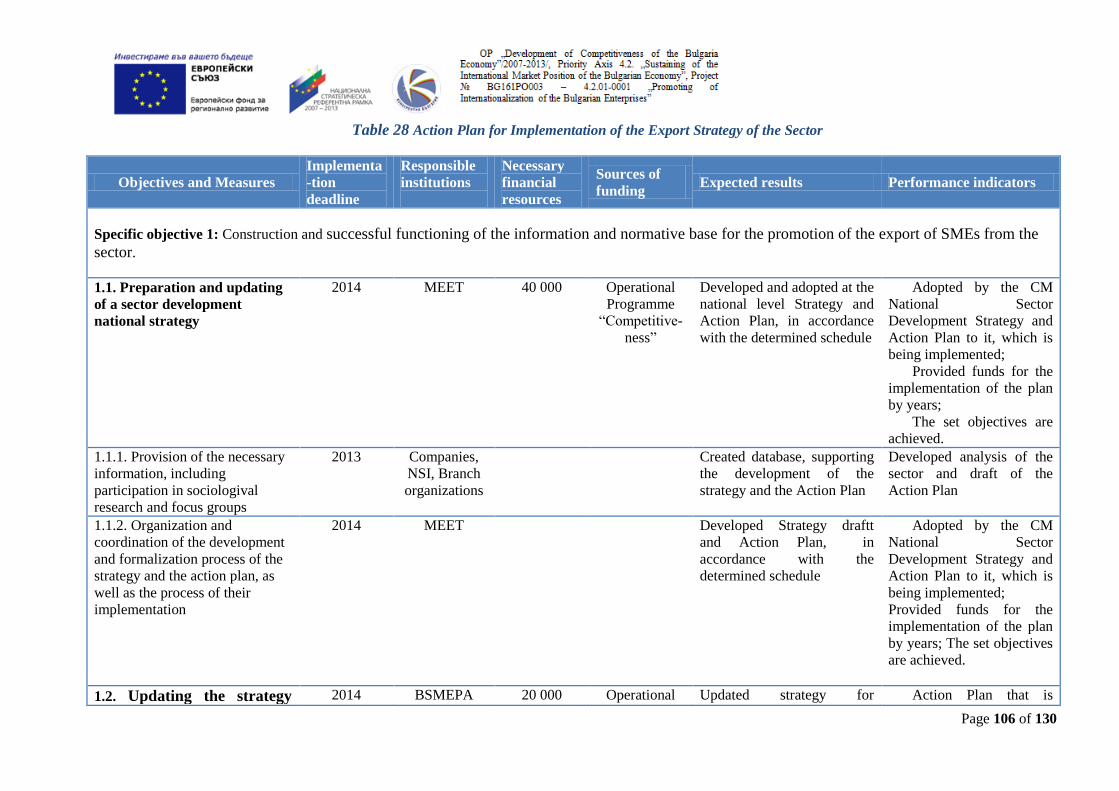
Page 106 of 130
Table 28 Action Plan for Implementation of the Export Strategy of the Sector
Objectives and Measures
Implementa
-tion
deadline
Responsible
institutions
Necessary
financial
resources
Sources of
funding Expected results Performance indicators
Specific objective 1: Construction and successful functioning of the information and normative base for the promotion of the export of SMEs from the
sector.
1.1. Preparation and updating
of a sector development
national strategy
2014 MEET 40 000 Operational
Programme
“Competitive-
ness”
Developed and adopted at the
national level Strategy and
Action Plan, in accordance
with the determined schedule
Adopted by the CM
National Sector
Development Strategy and
Action Plan to it, which is
being implemented;
Provided funds for the
implementation of the plan
by years;
The set objectives are
achieved.
1.1.1. Provision of the necessary
information, including
participation in sociologival
research and focus groups
2013 Companies,
NSI, Branch
organizations
Created database, supporting
the development of the
strategy and the Action Plan
Developed analysis of the
sector and draft of the
Action Plan
1.1.2. Organization and
coordination of the development
and formalization process of the
strategy and the action plan, as
well as the process of their
implementation
2014 MEET Developed Strategy draftt
and Action Plan, in
accordance with the
determined schedule
Adopted by the CM
National Sector
Development Strategy and
Action Plan to it, which is
being implemented;
Provided funds for the
implementation of the plan
by years; The set objectives
are achieved.
1.2. Updating the strategy 2014 BSMEPA 20 000 Operational Updated strategy for Action Plan that is
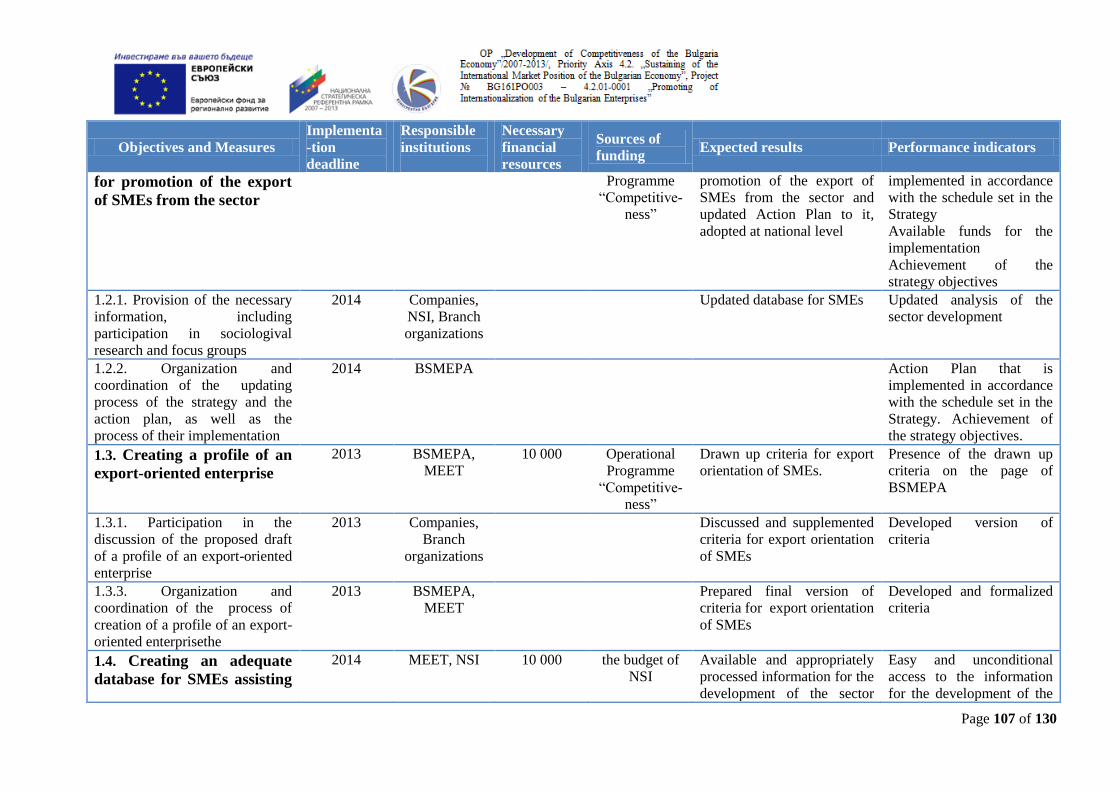
Page 107 of 130
Objectives and Measures
Implementa
-tion
deadline
Responsible
institutions
Necessary
financial
resources
Sources of
funding Expected results Performance indicators
for promotion of the export
of SMEs from the sector
Programme
“Competitive-
ness”
promotion of the export of
SMEs from the sector and
updated Action Plan to it,
adopted at national level
implemented in accordance
with the schedule set in the
Strategy
Available funds for the
implementation
Achievement of the
strategy objectives
1.2.1. Provision of the necessary
information, including
participation in sociologival
research and focus groups
2014 Companies,
NSI, Branch
organizations
Updated database for SMEs Updated analysis of the
sector development
1.2.2. Organization and
coordination of the updating
process of the strategy and the
action plan, as well as the
process of their implementation
2014 BSMEPA Action Plan that is
implemented in accordance
with the schedule set in the
Strategy. Achievement of
the strategy objectives.
1.3. Creating a profile of an
export-oriented enterprise
2013 BSMEPA,
MEET
10 000 Operational
Programme
“Competitive-
ness”
Drawn up criteria for export
orientation of SMEs.
Presence of the drawn up
criteria on the page of
BSMEPA
1.3.1. Participation in the
discussion of the proposed draft
of a profile of an export-oriented
enterprise
2013 Companies,
Branch
organizations
Discussed and supplemented
criteria for export orientation
of SMEs
Developed version of
criteria
1.3.3. Organization and
coordination of the process of
creation of a profile of an export-
oriented enterprisethe
2013 BSMEPA,
MEET
Prepared final version of
criteria for export orientation
of SMEs
Developed and formalized
criteria
1.4. Creating an adequate
database for SMEs assisting
2014 MEET, NSI 10 000 the budget of
NSI
Available and appropriately
processed information for the
development of the sector
Easy and unconditional
access to the information
for the development of the

Page 108 of 130
Objectives and Measures
Implementa
-tion
deadline
Responsible
institutions
Necessary
financial
resources
Sources of
funding Expected results Performance indicators
management decision
making for the sector
and SMEs within it sector and SMEs within it
1.4.1. Creation of an information
database system for foreign
markets, potential foreign
partners, international fairs,
exhibitions and other advertising
events
2014 BSMEPA,
MEET
30 000 OPC Created and operating
information system
Number of enterprises
using the information
system
1.4.2. Provision of data for the
information system
2014 Companies Created database for the
information system
Database serving the export
activity of the companies
1.4.3. Provision of data and
analyses for the information
system
2014 Branch
organizations
Created database for the
information system
Database serving the export
activity of the companies
1.4.4. Coordination and
organization of the process of
creation of an information
database system for foreign
markets, potential foreign
partners, international fairs,
exhibitions and other advertising
events
2014 BSMEPA,
MEET
Created and operating
information system
Number of enterprises
using the information
system
1.4.5. Maintenance of the
information database system for
foreign markets, potential foreign
partners, international fairs,
exhibitions and other advertising
events
Permanent BSMEPA,
MEET,
Companies,
Branch
organizations
10 000 per
year
The budgets of
the
departments
Permanently operating and
updated information system
Number of enterprises
satisfied with the quality of
the information available
1.4.6. Coordination of the
process of maintenance of the
information database system for
foreign markets, potential foreign
Permanent BSMEPA/
MEET
Permanently operating and
updated information system
Number of enterprises
satisfied with the quality of
the information available
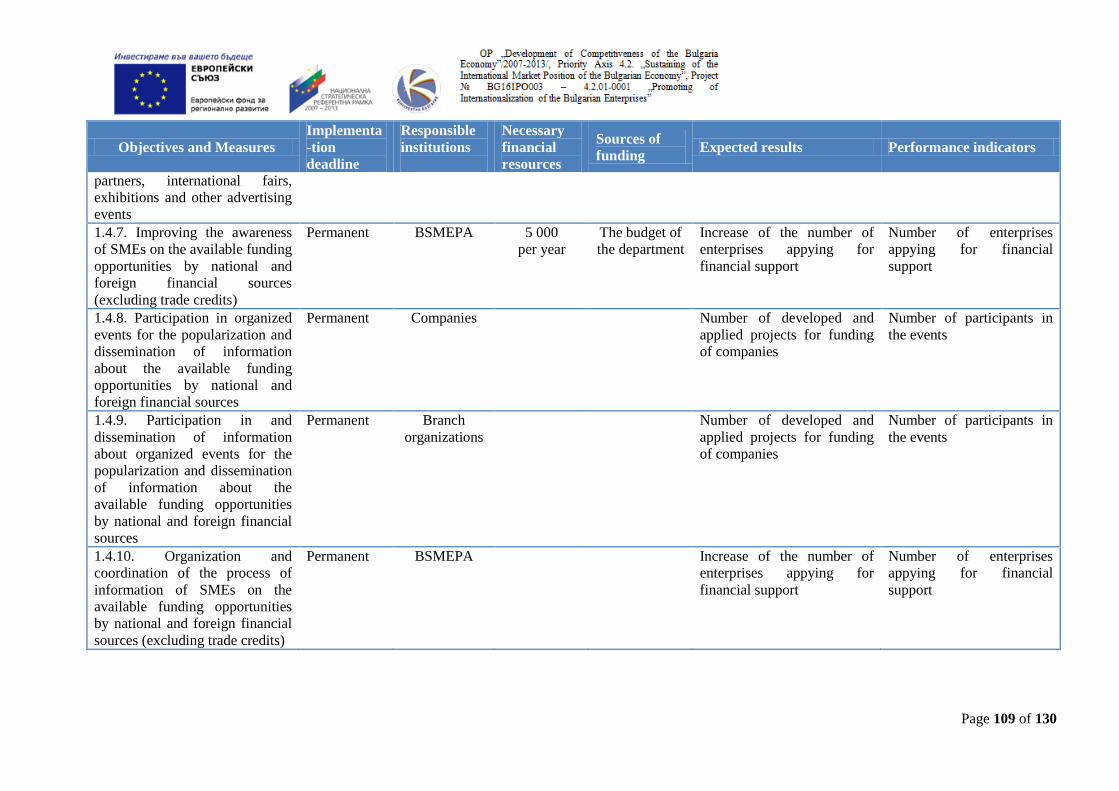
Page 109 of 130
Objectives and Measures
Implementa
-tion
deadline
Responsible
institutions
Necessary
financial
resources
Sources of
funding Expected results Performance indicators
partners, international fairs,
exhibitions and other advertising
events
1.4.7. Improving the awareness
of SMEs on the available funding
opportunities by national and
foreign financial sources
(excluding trade credits)
Permanent BSMEPA 5 000
per year
The budget of
the department
Increase of the number of
enterprises appying for
financial support
Number of enterprises
appying for financial
support
1.4.8. Participation in organized
events for the popularization and
dissemination of information
about the available funding
opportunities by national and
foreign financial sources
Permanent Companies
Number of developed and
applied projects for funding
of companies
Number of participants in
the events
1.4.9. Participation in and
dissemination of information
about organized events for the
popularization and dissemination
of information about the
available funding opportunities
by national and foreign financial
sources
Permanent Branch
organizations
Number of developed and
applied projects for funding
of companies
Number of participants in
the events
1.4.10. Organization and
coordination of the process of
information of SMEs on the
available funding opportunities
by national and foreign financial
sources (excluding trade credits)
Permanent BSMEPA Increase of the number of
enterprises appying for
financial support
Number of enterprises
appying for financial
support
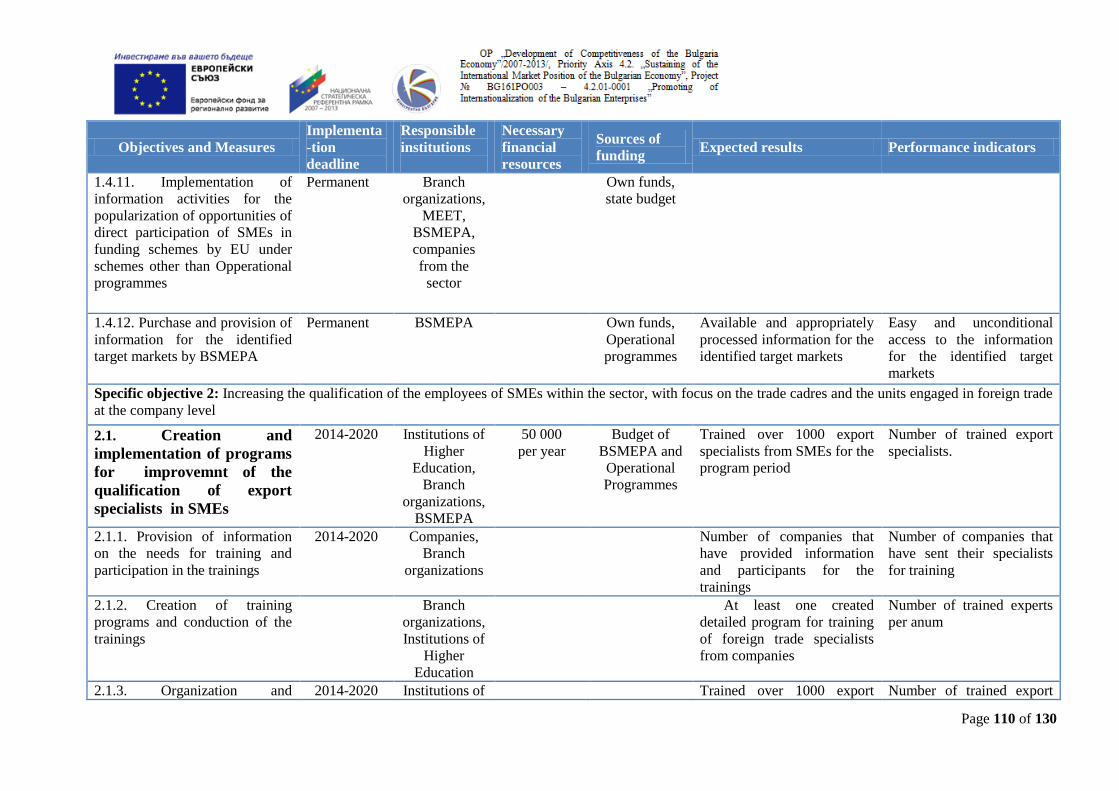
Page 110 of 130
Objectives and Measures
Implementa
-tion
deadline
Responsible
institutions
Necessary
financial
resources
Sources of
funding Expected results Performance indicators
1.4.11. Implementation of
information activities for the
popularization of opportunities of
direct participation of SMEs in
funding schemes by EU under
schemes other than Opperational
programmes
Permanent Branch
organizations,
MEET,
BSMEPA,
companies
from the
sector
Own funds,
state budget
1.4.12. Purchase and provision of
information for the identified
target markets by BSMEPA
Permanent BSMEPA Own funds,
Operational
programmes
Available and appropriately
processed information for the
identified target markets
Easy and unconditional
access to the information
for the identified target
markets
Specific objective 2: Increasing the qualification of the employees of SMEs within the sector, with focus on the trade cadres and the units engaged in foreign trade
at the company level
2.1. Creation and
implementation of programs
for improvemnt of the
qualification of export
specialists in SMEs
2014-2020 Institutions of
Higher
Education,
Branch
organizations,
BSMEPA
50 000
per year
Budget of
BSMEPA and
Operational
Programmes
Trained over 1000 export
specialists from SMEs for the
program period
Number of trained export
specialists.
2.1.1. Provision of information
on the needs for training and
participation in the trainings
2014-2020 Companies,
Branch
organizations
Number of companies that
have provided information
and participants for the
trainings
Number of companies that
have sent their specialists
for training
2.1.2. Creation of training
programs and conduction of the
trainings
Branch
organizations,
Institutions of
Higher
Education
At least one created
detailed program for training
of foreign trade specialists
from companies
Number of trained experts
per anum
2.1.3. Organization and 2014-2020 Institutions of Trained over 1000 export Number of trained export

Page 111 of 130
Objectives and Measures
Implementa
-tion
deadline
Responsible
institutions
Necessary
financial
resources
Sources of
funding Expected results Performance indicators
coordination of the process of
creation and implementation of
programs for the increase of the
qualification of export specialists
in SMEs
Higher
Education,
MEYS,
BSMEPA
specialists from SMEs for the
program period.
specialists.
2.2. Creation and
implementation of a training
program for participation in
international fairs
2017 Institutions of
Higher
Education,
MEYS,
BSMEPA
20 000
per year
Budget of
BSMEPA
Trained experts from a
minimum of 400 SMEs.
Number of companies that
have sent their specialists
for training.
2.2.1. Provision of information
on the needs for training and
participation in the trainings
2017 Companies Number of companies that
have provided information
and participants for the
trainings
Number of companies that
have sent their specialists
for training
2.2.2 Participation in the
establishment of training
programs and assistance in the
conduction of the trainings
2017 Branch
organizations
At least one created detailed
program for training
Number of trained experts
per anum
2.2.3. Organization and
coordination of the process of
creation and implementation of
programs
2017 Institutions of
Higher
Education,
MEYS,
BSMEPA
Trained over 400 export
specialists from SMEs .
Number of companies that
have sent their specialists
for training
Specific objective -3: Support to the activities of the enterprises and their access to foreign markets and partners
3.1. Financial support for
enterprise certification of
quality management,
environmental management,
and introduction of a
permanenet MEET 500 000 OPC Increased number of the
enterprises that have received
certificates
Number of enterprises that
have received certificates

Page 112 of 130
Objectives and Measures
Implementa
-tion
deadline
Responsible
institutions
Necessary
financial
resources
Sources of
funding Expected results Performance indicators
modern system for safe and
healthy working conditions
3.1.1. Development of proposals
for funding activities on the
establishment of quality
management systems and putting
the systems into operation
permanenet Compa-
nies
Increased number of funding
proposals
Number of proposals
received
3.1.2. Assisting the assessment of
the proposals
According to
the schedule
of MEET
Intermediete
unit or other
structure in
the EU funds
management
system
Increased number of funding
proposals
Number of proposals
received
3.1.3. Management of the overall
process of financial support and
monitoring of the results
According to
the schedule
of MEET
MEET Increased number of the
enterprises that have received
certificates
Number of enterprises that
have received certificates
3.2. Increase of the influence
of the assessment for the
export orientation of the
enterprises in the overall
assessment for receiving of
financial support
2014 MEET, CM OP for business support are
oriented towards support to
SMEs, which have export
potential
In the criteria for
assessment of the project
proposals is expressly
specified the export
potential
3.2.1. Active participation in the
development of the proposals for
increasing the influence of the
assessment of the export
orientation of enterprises in the
overall assessment of receiving
financial support
2014 Companies,
Branch
organizations
Accepted proposals for
change/ newly developed
program documents and rules
for their implementation
Published draft documents
3.2.2. Development of the 2014 MEET OP for business support are In the criteria for
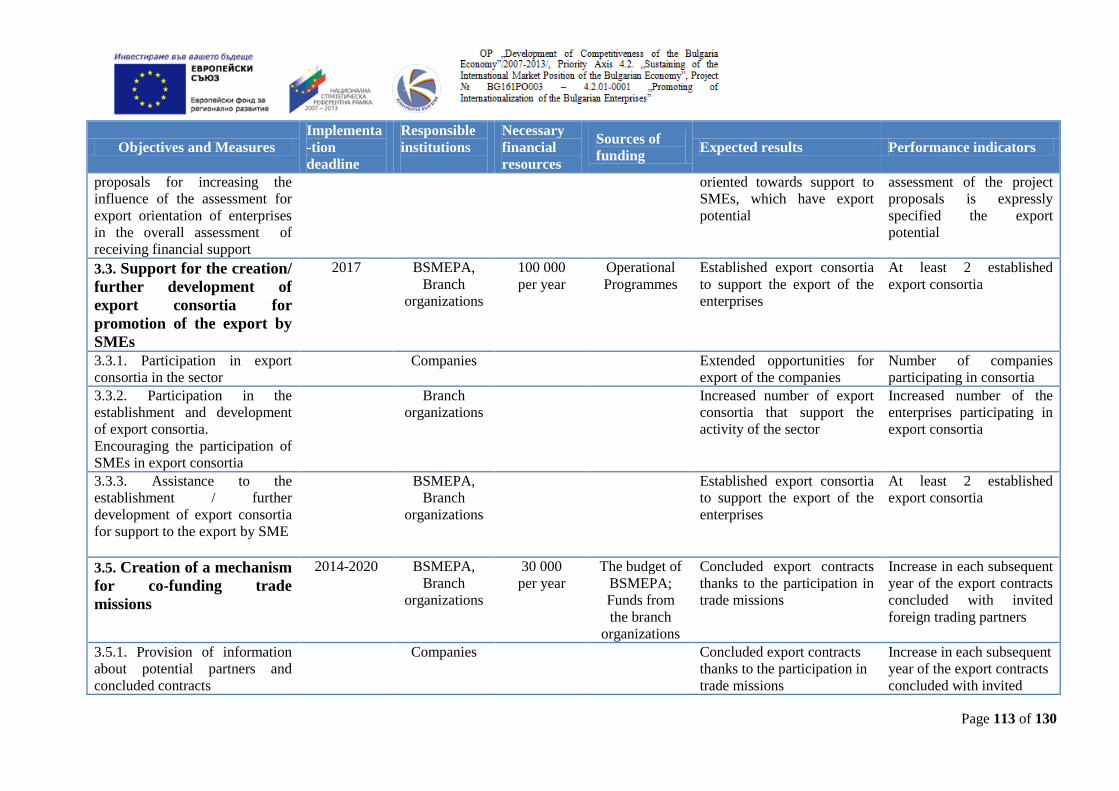
Page 113 of 130
Objectives and Measures
Implementa
-tion
deadline
Responsible
institutions
Necessary
financial
resources
Sources of
funding Expected results Performance indicators
proposals for increasing the
influence of the assessment for
export orientation of enterprises
in the overall assessment of
receiving financial support
oriented towards support to
SMEs, which have export
potential
assessment of the project
proposals is expressly
specified the export
potential
3.3. Support for the creation/
further development of
export consortia for
promotion of the export by
SMEs
2017 BSMEPA,
Branch
organizations
100 000
per year
Operational
Programmes
Established export consortia
to support the export of the
enterprises
At least 2 established
export consortia
3.3.1. Participation in export
consortia in the sector
Companies Extended opportunities for
export of the companies
Number of companies
participating in consortia
3.3.2. Participation in the
establishment and development
of export consortia.
Encouraging the participation of
SMEs in export consortia
Branch
organizations
Increased number of export
consortia that support the
activity of the sector
Increased number of the
enterprises participating in
export consortia
3.3.3. Assistance to the
establishment / further
development of export consortia
for support to the export by SME
BSMEPA,
Branch
organizations
Established export consortia
to support the export of the
enterprises
At least 2 established
export consortia
3.5. Creation of a mechanism
for co-funding trade
missions
2014-2020 BSMEPA,
Branch
organizations
30 000
per year
The budget of
BSMEPA;
Funds from
the branch
organizations
Concluded export contracts
thanks to the participation in
trade missions
Increase in each subsequent
year of the export contracts
concluded with invited
foreign trading partners
3.5.1. Provision of information
about potential partners and
concluded contracts
Companies Concluded export contracts
thanks to the participation in
trade missions
Increase in each subsequent
year of the export contracts
concluded with invited

Page 114 of 130
Objectives and Measures
Implementa
-tion
deadline
Responsible
institutions
Necessary
financial
resources
Sources of
funding Expected results Performance indicators
foreign trading partners 3.5.2. Development of a project
for mechanism and support for
its implementation
Branch
organizations
Concluded export contracts
thanks to the participation in
trade missions
Increase in each subsequent
year of the export contracts
concluded with invited
foreign trading partners 3.5.3. Coordination of the
process and support for its
implementation
BSMEPA Concluded export contracts
thanks to the participation in
trade missions
Increase in each subsequent
year of the export contracts
concluded with invited
foreign trading partners 3.5.4. Development of a program
for work with the Bulgarian trade
representatives abroad in favour
of SMEs from the sector
2014-2020 BSMEPA,
MEET,
CM
Decision adopted at the CM
level and created and
operating program for work
of the trade representatives
Increase of the concluded
contracts for export of
products from the sector,
produced by SMEs, as a
result of the program
implementation
3.5.5. Improving the mechanism
for ensuring a functioning
insurance of the export of SMEs
2014 BAEZ 30 000 The budget of
the
Department,
Operational
programmes in
the next
programming
period
Increase of the number of
SMEs and the export volume
of the sector thanks to the
improved mechanisms for
insuring the export
Number of insured export
transactions of SMEs

Page 115 of 130
SYSTEM FOR MONITORING AND CONTROL
For each strategic document it is of great importance: firstly, to be implemented in accordance
with predetermined goals, deadlines and resources, secondly, to be sustainable over time and to
develop the activities and effects determined in it. For this purpose, it is advisable to monitor
(fulfill monitoring) and evaluate the implementation of the document and to identify
appropriate actions - for correction and improvement of its inherent activities.
Monitoring can be defined as: (a) an integral part of the ongoing project management
(attributed to exports and implementation of strategy for the sector “Manufacture of pulp,
paper, board and articles”, aimed at achieving a change - in this case, improving the export
performance of SMEs in sector), (b) an instrument to control and manage the process of
decision-making, (c) a description of events and conditions within a specified period of time,
(d) systematic collection of reliable, timely and relevant information on progress change and
the consequences of actions taken during the implementation of the program. These essential
features of monitoring make it one of the most important components of the strategic
management of documents, programs, projects, etc.
The assessment is a systematic review of specific management activities aiming to provide
information about the full range of short and long-term effects on the consumers. Program
evaluation may include assessment of the workload, operating procedures, or personnel, but its
main purpose remains the effect and impact of program implementation (strategy document).
Monitoring should therefore be established to monitor the status and progress in implementing
the various components and sub-components and with only that - the Strategy as a whole.
Monitoring should also identify emerging issues, factors that determine them and suggest
possible measures and solutions to these problems. The information obtained is expected to be
promptly available to the responsible authority (primarily BSMEPA and MEET). The meaning
of this is to enable these authorities and other relevant government agencies, provided they
consider this a necessity, to take timely "corrective action" to support achieving the objectives
of the Strategy.
It should be noted that if monitoring focuses on the monitoring of: (a) actions taken and
resources expended, (b) the results achieved, (c) carrying out the process in time, (d) the effects
received, then the assessment is aimed at determination of the extent to which the general and

Page 116 of 130
specific objectives of the document are achieved and also includes a systematic review of
specific management operations to provide information about the full range of short and long-
term effects.
The main items that should be observed in relation with the implementation of this strategy
include:
- Compliance with the schedule of activities;
- Volume, speed and degree of resource use;
- Results achieved;
- Achievement of objectives and impact of the strategy document.
When to monitor? - The goal of ongoing monitoring is to record the effects and deviations from
plan early enough, to allow their correction before their consequences become so serious, that
they cannot be overcome. What should not be forgotten is the need for monitoring to be
performed frequently enough to allow adjustment of deviations from the plan followed.
Based on this methodology, monitoring and evaluating the implementation of this strategy
involves the following sequence of actions:
1. Selection of criteria and indicators for monitoring and evaluation;
2. Performance monitoring;
3. Comparison of achievements and targets;
4. Proposing and taking of corrective action.
Under the adopted objectives and measures of the Strategy, the following key indicators for
monitoring and evaluation are proposed:
Availability on the web-site of BSMEPA of the criteria and a list of companies which
are export-oriented.
The inclusion of a company in the list of “companies with export potential” becoming
an evaluation criteria for the company when granting financial support for export and
competitiveness.
Number of entries in the specialized sections of BSMEPA’s web-site and received
feedback.

Page 117 of 130
Number of organized participations in specialized exhibitions.
Number of distributed product samples in the exhibition/ distribution network.
Number of conferences.
Number of participations of SMEs from the sector in the organized exhibitions.
Percentage of companies which have expressed a positive attitude to organized events.
Number of export contracts concluded during the exhibitions.
Number of concluded export certificates, one of the reasons for which are invited
foreign trading partners.
Prepared program of work of the Bulgarian commercial representations in favor of
SMEs in the sector.
Export potential is explicitly specified in the evaluation criteria of the project
proposals.
Number of the established export consortia in the sector.
Amount of funds received from the export of products for which an advertising
campaign has been organized.
Number of SMEs which obtained international certificates.
Number of SMEs that have received support for technological modernization.
Export by companies that have obtained certificates.
Number of exporting enterprises that have benefited from guarantees of export
insurance.
Volume of exported goods, secured by state guarantees for export insurance.
Number of trained export specialists.
Number of companies sent their experts for training.
Surveillance and monitoring of progress will be carried out by BSMEPA, which "owns" the
strategy. For this purpose the Agency will nominate an official of its administration who will be

Page 118 of 130
officially responsible for collecting information for monitoring the implementation of the
measures. This official will prepare annual reports to the Executive Director of the Agency.
The annual reports will serve as interim evaluations of the implementation of the Strategy. At
the end of the period, a final report will be prepared for the entire period of the Strategy and the
latter will be prepared for the next five-year period.
The reports are public and the results will be disclosed to the public.

Page 119 of 130
Annex 1:
Table 29 Manufacture, import, export and consumption of paper, board and fibrous materials of
Bulgaria – 2001 /measure – ton/
PAPER AND BOARD Manuf. Exp. Imp. Cons.
1 Newsprint X 29 000 X 29 000
2 Writing and printing paper, including 1 000 10 000 X 11 000
3 *Uncoated not containing DM 1 000 5 000 X 6 000
4 * Coated not containing DM X 5 000 X 5 000
5 * Uncoated containing DM X X X X
6 *Coated containing DM X X X X
7 Corrugated cardboard materials,
including
65 000 7 600 7 615 64 985
8 *Liner of primary fibres X 600 X 600
9 * Liner of waste paper 39 000 2 000 4 615 36 385
10 *Fluting of primary fibres X X X X
11 *Fluting of waste paper 26 000 5 000 3 000 28 000
12 Other packing paper: paper for bags and
envelopes, machine-smooth packing
paper, etc.
27 000 5 200 3 000 29 200
13 Tissue and sanitary paper 34 000 3 000 31 000
14 Other paper X 2 000 X 2 000
15 Board, including 6 000 2 000 4 000 4 000
16 *Verbose board 6 000 2 000 4 000 4 000
17 *Other boards X X X X
18 TOTAL PAPER AND BOARD 133 000 55 800 17 615 171 185
PULP Manuf. Exp. Imp. Cons.
19 Total pulp of wood, including 77 000 7 000 53 000 31 000
20 *Bleached sulphate (kraft) 53 000 2 000 53 000 2 000
21 *Unbleached sulphate (kraft) 21 000 2 000 X 23 000
22 * Bleached sulphite X 1 000 X 1 000
23 * Unbleached sulphite X 2 000 X 2 000
24 *Semi-pulp 3 000 X X 3 000
25 *Wood-pulp X X X X
26 *Pulp for chemical processing X X X X
27 Total fibrous materials excluding those of wood X X X X
28 TOTAL PULP 77 000 7 000 53 000 31 000
29 Commodity pulp 53 000 7 000 53 000 7 000
Corrugated cardboard/micro corrug. cardboard 68 300 26 290 68 036
Packings of corrugated cardboard/
micro corrugugated cardboard
48200 4 245 2 324 50 121
WASTE PAPER Invested Exp. Imp. Cons.
30 Waste paper 115 000 5 000 5 000 115 000
WASTE PAPER Collected Exp. Imp. Cons.
Waste paper 110 000 5 000 5 000 110 000
Source: NSI

Page 120 of 130
Table 30 Manufacture, import, export and consumption of paper, board and fibrous materials of
Bulgaria – 2002 /measure – ton/
PAPER AND BOARD Manuf. Exp. Imp. Cons.
1 Newsprint X 39 884 1 479 38 405
2 Writing and printing paper, including X 31 603 1 432 30 171
3 *Uncoated not containing DM X 23 171 1 432 21 739
4 * Coated not containing DM X 8 432 X 8 432
5 * Uncoated containing DM X X X X
6 *Coated containing DM X X X X
7 Corrugated cardboard materials, including 68 589 12 317 6 844 74 062
8 *Liner of primary fibres X 700 X 700
9 * Liner of waste paper 55 800 6 617 4 344 58 073
10 *Fluting of primary fibres X X X X
11 *Fluting of waste paper 12 789 5 000 2 500 15 289
12 Other packing paper: paper for bags and
envelopes, machine-smooth packing paper, etc. 29 542 5 441 19 000 15 983
13 Tissue and sanitary paper 31 605 3 362 10 791 24 176
14 Other paper X 7 319 X 7 319
15 Board, including 7 043 24 459 X 31 502
16 *Verbose board 7 043 14 000 X 21 043
17 *Other boards X 10 459 X 10 459
18 TOTAL PAPER AND BOARD 136 779 124 385 39 546 221 618
PULP Manuf. Exp. Imp. Cons.
19 Total pulp of wood, including 86 300 13 120 57 000 42 420
20 *Bleached sulphate (kraft) 57 000 2 362 57 000 2 362
21 *Unbleached sulphate (kraft) 26 500 2 217 X 28 717
22 * Bleached sulphite X 8 541 X 8 541
23 * Unbleached sulphite X X X X
24 *Semi-pulp 2 800 X X 2 800
25 *Wood-pulp X X X X
26 *Pulp for chemical processing X X X X
27 Total fibrous materials excluding those of wood X X X X
28 TOTAL PULP 86 300 13 120 57 000 42 420
29 Commodity pulp 57 000 13 120 57 000 13 120
Corrugated cardboard/micro corrug. cardboard 76 060 66 487 75 639
Packings of corrugated cardboard/ micro
corrugugated cardboard 36 300 4 107 1 708 38 699
WASTE PAPER Invested Exp. Imp. Cons.
30 Waste paper 132 000 19 616 3 513 148 103
WASTE PAPER Collected Exp. Imp. Cons.
Waste paper 112 384 19 616 3 513 128 487
Source: NSI
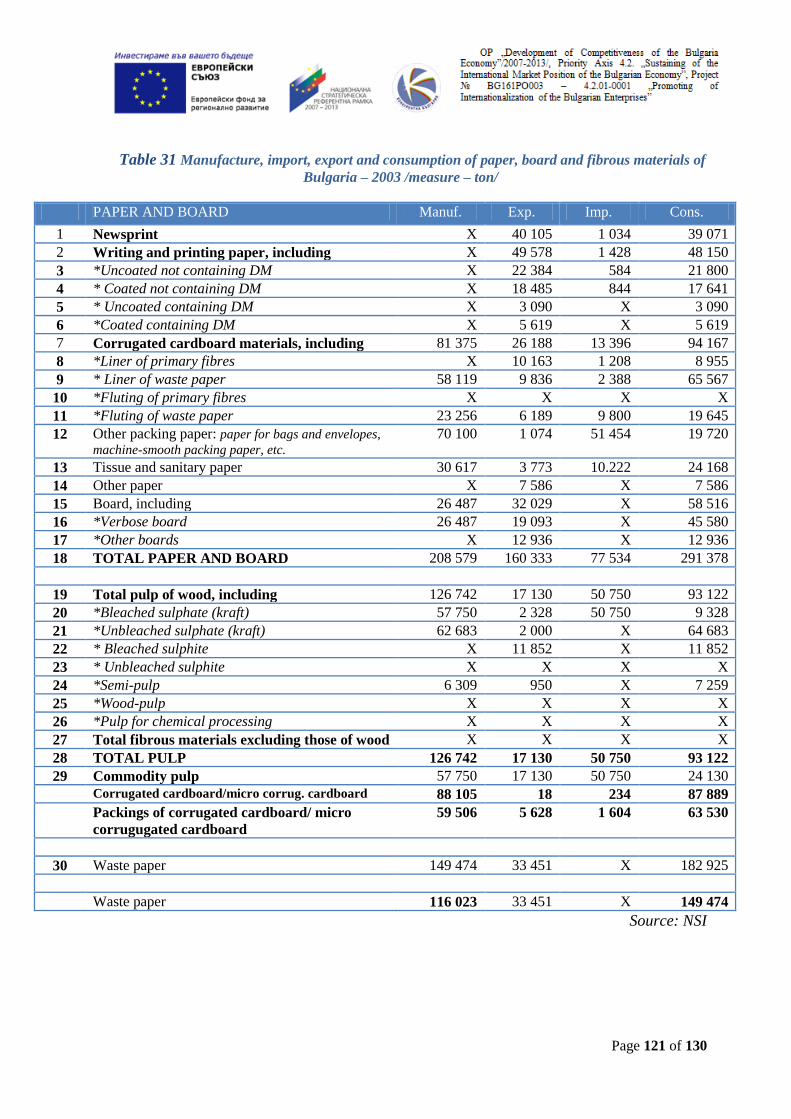
Page 121 of 130
Table 31 Manufacture, import, export and consumption of paper, board and fibrous materials of
Bulgaria – 2003 /measure – ton/
PAPER AND BOARD Manuf. Exp. Imp. Cons.
1 Newsprint X 40 105 1 034 39 071
2 Writing and printing paper, including X 49 578 1 428 48 150
3 *Uncoated not containing DM X 22 384 584 21 800
4 * Coated not containing DM X 18 485 844 17 641
5 * Uncoated containing DM X 3 090 X 3 090
6 *Coated containing DM X 5 619 X 5 619
7 Corrugated cardboard materials, including 81 375 26 188 13 396 94 167
8 *Liner of primary fibres X 10 163 1 208 8 955
9 * Liner of waste paper 58 119 9 836 2 388 65 567
10 *Fluting of primary fibres X X X X
11 *Fluting of waste paper 23 256 6 189 9 800 19 645
12 Other packing paper: paper for bags and envelopes,
machine-smooth packing paper, etc. 70 100 1 074 51 454 19 720
13 Tissue and sanitary paper 30 617 3 773 10.222 24 168
14 Other paper X 7 586 X 7 586
15 Board, including 26 487 32 029 X 58 516
16 *Verbose board 26 487 19 093 X 45 580
17 *Other boards X 12 936 X 12 936
18 TOTAL PAPER AND BOARD 208 579 160 333 77 534 291 378
PULP Manuf. Exp. Imp. Cons.
19 Total pulp of wood, including 126 742 17 130 50 750 93 122
20 *Bleached sulphate (kraft) 57 750 2 328 50 750 9 328
21 *Unbleached sulphate (kraft) 62 683 2 000 X 64 683
22 * Bleached sulphite X 11 852 X 11 852
23 * Unbleached sulphite X X X X
24 *Semi-pulp 6 309 950 X 7 259
25 *Wood-pulp X X X X
26 *Pulp for chemical processing X X X X
27 Total fibrous materials excluding those of wood X X X X
28 TOTAL PULP 126 742 17 130 50 750 93 122
29 Commodity pulp 57 750 17 130 50 750 24 130
Corrugated cardboard/micro corrug. cardboard 88 105 18 234 87 889
Packings of corrugated cardboard/ micro
corrugugated cardboard
59 506 5 628 1 604 63 530
WASTE PAPER Invested Exp. Imp. Cons.
30 Waste paper 149 474 33 451 X 182 925
WASTE PAPER Collected Exp. Imp. Cons.
Waste paper 116 023 33 451 X 149 474
Source: NSI

Page 122 of 130
Table 32 Manufacture, import, export and consumption of paper, board and fibrous materials of
Bulgaria – 2004 /measure – ton/
PAPER AND BOARD Manuf. Exp. Imp. Cons.
1 Newsprint Х 39 631 1 024 38 607
2 Writing and printing paper, including Х 53 355 1 182 52 173
3 *Uncoated not containing DM Х 25 389 466 24 923
4 * Coated not containing DM Х 18 956 716 18 240
5 * Uncoated containing DM Х Х Х Х
6 *Coated containing DM Х 9 010 Х 9 010
7 Corrugated cardboard materials, including 78 336 28 538 13 668 93 206
8 *Liner of primary fibres Х 12 733 1 068 11 665
9 * Liner of waste paper 53 209 13 814 3 600 63 423
10 *Fluting of primary fibres Х Х Х Х
11 *Fluting of waste paper 25 127 1 991 9 000 18 118
12 Other packing paper: paper for bags and
envelopes, machine-smooth packing paper, etc. 77 535 1 029 70 791 7 773
13 Tissue and sanitary paper 31 886 2 769 9 393 25 262
14 Other paper Х 8 900 Х 8 900
15 Board, including 44 875 34 046 Х 78 921
16 *Verbose board
17 *Other boards Х 13 693 Х 13 693
18 TOTAL PAPER AND BOARD 232 632 168 268 96 058 304 842
PULP Manuf. Exp. Imp. Cons.
19 Total pulp of wood, including 132 701 17 255 50 000 99 956
20 *Bleached sulphate (kraft) 57 585 1 700 50 000 9 285
21 *Unbleached sulphate (kraft) 68 807 3 025 Х 71 832
22 * Bleached sulphite Х 12 530 Х 12 530
23 * Unbleached sulphite Х Х Х Х
24 *Semi-pulp 6 309 Х Х 6 309
25 *Wood-pulp Х Х Х Х
26 *Pulp for chemical processing Х Х Х Х
27 Total fibrous materials excluding those of wood Х Х Х Х
28 TOTAL PULP 132 701 17 255 50 000 99 956
29 Commodity pulp 57 585 17 255 50 000 24 840
Corrugated cardboard/micro corrug. cardboard 96 499 75 2 048 94 526
Packings of corrugated cardboard/ micro
corrugugated cardboard
93 168 6 704 1 659 98 213
WASTE PAPER Invested Exp. Imp. Cons.
30 Waste paper 163 346 51 684 Х 215 030
WASTE PAPER Collected Exp. Imp. Cons.
Waste paper 111 662 51 684 Х 163 346
Source: NSI
Page 123 of 130
Table 33 Manufacture, import, export and consumption of paper, board and fibrous materials of
Bulgaria – 2005 /measure – ton/
PAPER AND BOARD Manuf. Exp. Imp. Cons.
1 Newsprint 0 38 622 864 37 758
2 Writing and printing paper, including 0 60 573 219 60 354
3 *Uncoated not containing DM 0 27 213 219 26 994
4 * Coated not containing DM 0 21 807 0 21 807
5 * Uncoated containing DM 0 0 0 0
6 *Coated containing DM 0 11 553 0 11 553
7 Corrugated cardboard materials, including 82 120 40 081 3 193 119 008
8 *Liner of primary fibres 0 11 257 0 11 257
9 * Liner of waste paper 34 700 21 659 0 56 359
10 *Fluting of primary fibres 0 0 0 0
11 *Fluting of waste paper 47 420 7 165 3 193 51 392
12 Other packing paper: paper for bags and envelopes,
machine-smooth packing paper, etc. 83 341 3 050 68 044 18 347
13 Tissue and sanitary paper 32 547 3 296 8 251 27 592
14 Other paper 0 8 900 0 8 900
15 Board, including 64 320 37 843 53 474 48 689
16 *Verbose board 64 320 20 383 53 474 31 229
17 *Other boards 0 17 460 0 17 460
18 TOTAL PAPER AND BOARD 262 328 192 365 134 045 320 648
PULP Manuf. Exp. Imp. Cons.
19 Total pulp of wood, including 124 761 18 622 42 310 101 073
20 *Bleached sulphate (kraft) 45 632 3 074 42 310 6 396
21 *Unbleached sulphate (kraft) 72 682 2 050 0 74 732
22 * Bleached sulphite 0 13 498 0 13 498
23 * Unbleached sulphite 0 0 0 0
24 *Semi-pulp 6 447 0 0 6 447
25 *Wood-pulp 0 0 0 0
26 *Pulp for chemical processing
27 Total fibrous materials excluding those of wood 0
28 TOTAL PULP 124 761 18 622 42 310 101 073
29 Commodity pulp 45 632 18 622 42 310 21 944
Corrugated cardboard/micro corrug. cardboard 112 689 52 н.д. 112 741
Packings of corrugated cardboard/ micro
corrugugated cardboard
110 757 6 964 439 117 282
WASTE PAPER Invested Exp. Imp. Cons.
30 Waste paper 185 537 52 712 68 238 181
WASTE PAPER Collected Exp. Imp. Cons.
Source: NSI

Page 124 of 130
Table 34 Manufacture, import, export and consumption of paper, board and fibrous
materials of Bulgaria – 2006 /measure – ton/
PAPER AND BOARD Manuf. Exp. Imp. Cons.
1 Newsprint 0 38 019 451 37 568
2 Writing and printing paper, including 0 67 178 1 853 65 324
3 *Uncoated not containing DM 0 30 162 420 29 742
4 * Coated not containing DM 0 21 625 1 365 20 260
5 * Uncoated containing DM 0 0 0 0
6 *Coated containing DM 0 15 391 69 15 322
7 Corrugated cardboard materials, including 84 391 41 924 4 943 121 372
8 *Liner of primary fibres 8 240 4 016 0 12 256
9 * Liner of waste paper 26 953 17 624 0 44 577
10 *Fluting of primary fibres 15 318 7 954 1 064 22 208
11 *Fluting of waste paper 33 880 12 330 3 879 42 331
12 Other packing paper: paper for bags and envelopes,
machine-smooth packing paper, etc. 80 138 4 212 63 914 20 437
13 Tissue and sanitary paper 34 029 5 130 7 623 31 536
14 Other paper 0 2 692 163 2 529
15 Board, including 2 859 47 124 2 669 47 314
16 *Verbose board 2 859 26 195 2 395 26 660
17 *Other boards 0 20 928 274 20 654
18 TOTAL PAPER AND BOARD 201 417 206 279 81 617 326 080
PULP Manuf. Exp. Imp. Cons.
19 Total pulp of wood, including 128 131 14 851 46 630 96 352
20 *Bleached sulphate (kraft) 51 532 2 321 46 630 7 223
21 *Unbleached sulphate (kraft) 69 595 1 547 0 71 142
22 * Bleached sulphite 10 983 0 10 983
23 * Unbleached sulphite 0 0 0
24 *Semi-pulp 7 005 0 0 7 005
25 *Wood-pulp 0 0 0 0
26 *Pulp for chemical processing 0 0 0 0
27 Total fibrous materials excluding those of wood 0 0 0 0
28 TOTAL PULP 128 131 14 851 46 630 96 352
29 Commodity pulp 51 532 14 851 46 630 19 753
30 Corrugated cardboard/micro corrug. cardboard 119 581 236 6 372 113 445
31 Packings of corrugated cardboard/ micro
corrugugated cardboard
104 311 7 734 1 887 110 158
32 Paper bags /*thousand pcs./ *41057 30 155
33 Articles of tissue (toilet paper) 9 510 1 984 379 11 116
WASTE PAPER Collected Exp. Imp. Cons.
Waste paper 116 965 6 829 2 916 120 878
Source: NSI

Page 125 of 130
Table 35 Manufacture, import, export and consumption of paper, board and fibrous materials of
Bulgaria – 2007 /measure – ton/
PAPER AND BOARD Manuf. Exp. Imp. Cons.
1 Newsprint 0 47 333 811 46 521
2 Writing and printing paper, including 0 145 871 5 244 140 627
3 *Uncoated not containing DM 0 51 000 997 50 003
4 * Coated not containing DM 0 24 306 316 23 990
5 * Uncoated containing DM 0 51 414 3 800 47 614
6 *Coated containing DM 0 19 150 130 19 020
7 Corrugated cardboard materials, including 101 770 62 883 19 263 145 390
8 *Liner of primary fibres 0 6 026 66 5 961
8a - Liner of primary fibres and waste paper 9 666 3 970 0 13 636
9 * Liner of waste paper 39 448 21 590 5 700 55 338
10 *Fluting of primary fibres 0 10 007 6 120 3 888
11 *Fluting of waste paper 52 656 21 289 7 378 66 567
12 Other packing paper: paper for bags and envelopes, machine-smooth 79 619 7 649 64 452 22 817
13 Tissue and sanitary paper 31 504 6 432 7 792 30 143
14 Other paper 0 29 621 13 511 16 109
15 Board, including 30 949 45 187 24 761 51 375
16 *Verbose board 10 117 29 470 4 370 35 217
17 *Other boards 20 832 15 717 20 391 16 158
18 TOTAL PAPER AND BOARD 243 842 344 975 135 834 452 983
PULP Manuf. Exp. Imp. Cons.
19 Total pulp of wood, including 125 609 14 894 45 199 95 304
20 *Bleached sulphate (kraft) 48 830 7 222 45 195 10 857
21 *Unbleached sulphate (kraft) 69 232 4 815 0 74 047
22 * Bleached sulphite 0 2 045 0 2 045
23 * Unbleached sulphite 0 800 0 800
24 *Semi-pulp 7 547 11 4 7 554
25 *Wood-pulp 0 0 0 0
26 *Pulp for chemical processing 0 0 0 0
27 Total fibrous materials excluding those of wood 0
28 TOTAL PULP 125 609 14 894 45 199 95 304
29 Commodity pulp 48 830 14 896 45 199 18 527
30 Corrugated cardboard/micro corrug. cardboard 139 298 1 087 6 030 134 354
31 Packings of corrugated cardboard/ micro corrugugated cardboard 118 511 7 702 1 679 124 534
32 Packings of verbose board 6 125 8 793 2 422 12 496
33 Paper bags /*thousand pcs./ 35028* 3 713 22587*
34 Articles of tissue (toilet paper) 11 307 2 717 462 13 562
Source: NSI
Page 126 of 130
Table 36 Manufacture, import, export and consumption of paper, board and fibrous materials of
Bulgaria – 2008 /measure – ton/
PAPER AND BOARD Manuf. Exp. Imp. Cons.
1 Newsprint 0 44 179 4 154 40 025
2 Writing and printing paper, including 0 91 485 1 845 89 640
3 *Uncoated not containing DM 0 40 678 1 148 39 530
4 * Coated not containing DM 0 24 618 287 24 331
5 * Uncoated containing DM 0 8 421 307 8 114
6 *Coated containing DM 0 17 768 103 17 665
7 Corrugated cardboard materials,
including
78 819 74 856 19 257 134 418
8 *Liner of primary fibres 0 8 835 25 8 810
9 * Liner of waste paper 32 960 27 040 4 809 55 191
10 *Fluting of primary fibres 0 12 334 6 880 5 454
11 *Fluting of waste paper 45 859 26 647 7 543 64 963
12 Other packing paper: paper for bags and envelopes, m-s packing machines.
64037 8674 52666 20045
13 Tissue and sanitary paper 31 006 11 245 9 165 33 086
14 Other paper 0 13 701 2 341 11 360
15 Board, including 11 366 51 972 10 570 52 768
16 *Verbose board 3 029 30 461 2 181 31 309
17 *Other boards 8 337 21 511 8 389 21 459
18 TOTAL PAPER AND BOARD 185 228 296 112 99 998 381 342
FIBROUS MATERIALS Manuf. Exp. Imp. Cons.
19 Total fibr. mater. of wood, including 132 904 11 180 65 920 78 164
20 *Bleached sulphate (kraft) 72 957 5 454 65 854 12 557
21 *Unbleached sulphate (kraft) 55 443 3 636 0 59 079
22 * Bleached sulphite 0 2 083 64 2 019
23 * Unbleached sulphite 0 0 0 0
24 *Semi-pulp 4 504 7 2 4 509
25 *Wood-pulp 0 0 0 0
26 *Pulp for chemical processing 0 0 0 0
27 Total fibrous materials excluding those of wood 0 0 0 0
28 TOTAL FIBROUS MATERIALS 132 904 11 180 65 920 78 164
29 Commodity pulp 72 957 11 180 65 920 18 217
30 Corrugated cardboard/micro corrug. cardboard 133 323 333 5 742 127 914
31 Packings of corrugated cardboard/ micro
corrugugated cardboard
123 359 8 900 1 937 130 322
32 Paper bags /*thousand pcs./ *25137 4 395 *14671
33 Articles of tissue (toilet paper) 11 798 2 986 3 210 11 574
34 WASTE PAPER Collected Exp. Imp. Cons.
Waste paper 137 025 30 316 29 352 137 989
Source: NSI

Page 127 of 130
Table 37 Manufacture, import, export and consumption of paper, board and fibrous materials of
Bulgaria – 2009 /measure – ton /
PAPER AND BOARD Manuf. Exp. Imp. Cons.
1 Newsprint 0 45 550 4 834 40 716
2 Writing and printing paper, including 0 73 885 2 741 71 144
3 *Uncoated not containing DM 0 38 592 995 37 597
4 * Coated not containing DM 0 16 914 993 15 921
5 * Uncoated containing DM 0 6 041 734 5 307
6 *Coated containing DM 0 12 338 19 12 319
7 Corrugated cardboard materials, including 68 175 64 157 5 628 126 704
8 *Liner of primary fibres 0 7 884 5 7 879
9 * Liner of waste paper 30 715 21 731 763 51 683
10 *Fluting of primary fibres 0 3 718 3 712 6
11 *Fluting of waste paper 37 460 30 824 1 148 67 136
12 Other packing paper: paper for bags and envelopes,
machine-smooth packing paper, etc. 28 131 9 258 24 727 12 662
13 Tissue and sanitary paper 24 737 14 611 7 349 31 999
14 Other paper 0 8 062 152 7 910
15 Board, including 32 47 880 994 46 918
16 *Verbose board 0 29 130 672 28 458
17 *Other boards 32 18 750 322 18 460
18 TOTAL PAPER AND BOARD 121 075 263 403 46 425 338 053
FIBROUS MATERIALS Manuf. Exp. Imp. Cons.
19 Total fibr. mater. of wood, including 34 350 11 693 8 801 37 242
20 *Bleached sulphate (kraft) 10 706 5 668 8 801 7 573
21 *Unbleached sulphate (kraft) 23 180 3 778 0 26 958
22 * Bleached sulphite 0 2 247 0 2 247
23 * Unbleached sulphite 0 0 0 0
24 *Semi-pulp 464 0 0 464
25 *Wood-pulp 0 0 0 0
26 *Pulp for chemical processing 0 0 0 0
27 Total fibrous materials excluding those of wood 0 0 0 0
28 TOTAL FIBROUS MATERIALS 34 350 11 693 8 801 37 242
29 Commodity pulp 10 706 11 693 8 801 13 598
30 Corrugated cardboard/micro corrug. cardboard 114 336 4 128 5 160 113 304
31 Packings of corrugated cardboard/ micro corrugugated
cardboard 101 105 7 650 1 671 107 084
32 Paper bags /*thousand pcs./ 4359* 3 403 135*
33 Articles of tissue (toilet paper) 10 559 2 798 1 415 11 942
34 WASTE PAPER Collected Exp. Imp. Cons.
Waste paper 135 114 2 712 30 358 107 468
Source: NSI

Page 128 of 130
Table 38 Manufacture, import, export and consumption of paper, board and fibrous materials of
Bulgaria – 2010 /measure – ton/
PAPER AND BOARD Manuf. Imp. Exp. Cons.
1 Newsprint 0 47 248 7 901 39 348
2 Writing and printing paper, including 0 75 040 3 596 71 445
3 *Uncoated not containing DM 0 39 387 2 377 37 011
4 * Coated not containing DM 0 14 565 229 14 336
5 * Uncoated containing DM 0 6 226 622 5 604
6 *Coated containing DM 0 14 861 367 14 494
7 Corrugated cardboard materials, including 74 994 54 131 6 443 122 682
8 *Liner of primary fibres 0 8 384 21 8 363
9 * Liner of waste paper 39 382 18 130 2 735 54 776
10 *Fluting of primary fibres 0 1 315 1 072 243
11 *Fluting of waste paper 35 612 26 302 2 615 59 299
12 Other packing paper: paper for bags and envelopes,
machine-smooth packing paper, etc. 52 158 2 240 46 427 7 971
13 Tissue and sanitary paper 30 586 12 370 6 487 36 469
14 Other paper 0 21 847 2 291 19 555
15 Board, including 30 60 181 1 215 58 996
16 *Verbose board 0 31 619 523 31 096
17 *Other boards 30 28 562 692 27 900
18 TOTAL PAPER AND BOARD 157 768 273 058 74 360 356 466
FIBROUS MATERIALS Manuf. Imp. Exp. Cons.
19 Total fibr. mater. of wood, including 150 858 8 564 95 843 63 579
20 *Bleached sulphate (kraft) 104 866 3 849 95 759 12 957
21 *Unbleached sulphate (kraft) 45 992 2 000 0 47 992
22 * Bleached sulphite 0 2 715 84 2 631
23 * Unbleached sulphite 0 0 0 0
24 *Semi-pulp 0 0 0 0
25 *Wood-pulp 0 0 0 0
26 *Pulp for chemical processing 0 0 0 0
27 Total fibrous materials excluding those of wood 0 0 0 0
28 TOTAL FIBROUS MATERIALS 150 858 8 564 95 843 63 579
29 Commodity pulp 104866 8564 95843 17 587
30 Corrugated cardboard/micro corrug. cardboard 117 848 4 961 3 896 118 913
31 Packings of corrugated cardboard/ micro corrugugated
cardboard 107 111 7 785 2 299 112 597
32 Paper bags /*thousand pcs./ 4850* 4 109 278
33 Articles of tissue (toilet paper) 14 608 3 275 2 594 15 289
34 WASTE PAPER Collected Imp. Exp. Cons.
Waste paper 146 020 4 740 40 022 110 738
Source: NSI
Page 129 of 130
SOURCES
1. Council for Administrative Reform to the CM of the Republic of Bulgaria, 2010,
Methodology for Strategic Planning
2. Report BSMEPA 2011 “Analysis of the state and factors for the development of SMEs –
Bulgarian SMEs in the times of crisis”, Bulgarian Small and Medium Enterprises
Promotion Agency, the information was extacted and processed by Google – Public
Data Explorer on 05-10.11.2011
3. On field survey of Bulgarian SMEs from the sector: 31.10 – 28.11.2011
4. Council Resolution of 15 December 1998 on a Forestry Strategy for the European
Union, the information was extacted and processed on 05-07.12.2011
5. Communication from the Commission to the Council and the European Parliament on a
Forestry Strategy for the European Union, the information was extacted and processed
on 05-07.12.2011
6. Communication from the Commission to the Council and the European Parliament
reporting on the implementation of the EU Forestry Strategy, the information was
extacted and processed on 05-07.12.2011
7. Commission Staff Working Document, Annex to the: Communication on the
implementation of the EU Forestry Strategy, the information was extacted and
processed on 05-07.12.2011
8. Brochure „Sustainable Forestry and the European Union: Initiatives of the European
Commission”, the information was extacted and processed on 05-07.12.2011
9. Classification of economic activities, 2008, the information was extacted and processed
on 08.11.2011
10. Report: The BREF in the Pulp and Paper Industry, Michael Suhr, 2000, the information
was extacted and processed on in November-December 2011
11. World Bank data – Indicators for the development of the world, current as at
02.11.2011; the information was extacted and processed by Google – Public Data
Explorer on 16.11.2011

Page 130 of 130
12. Eurostat data, Sectoral analyses, the information was extacted and processed in
November-December 2011
13. Data and reports of the National Statistical Institute, provided information for the
purposes of the document: November-December 2011
14. Classification of economic activities of the European Community /NACE/; the
information was extacted and processed on 11.11.2011
15. Eurostat report: Forestry in the EU and the World: A Statistical Portrait, 2011, the
information was extacted and processed in November-December 2011
16. Eurostat data: Statistics on Pulp and Paper 2005-2007, the information was extacted
and processed in November-December 2011
17. Key Statistics of Confederation of European Paper Industries (CEPI) – Key Statistics –
European Pulp and Paper Industry, 2009 the information was extacted and processed in
November-December 2011
18. Report of Confederation of European Paper Industries (CEPI) – Sustainability Report,
2011 the information was extacted and processed in November-December 2011
19. Report of the European Commission: Integrated Pollution Prevention and Control –
Reference Document on Best Available Techniques in the Pulp and Paper Industry,
Dec., 2001, the information was extacted and processed in November-December2011
20. Report of the European Commission: The Forest Fibre Industry – 2050 Roadmap to a
Low-Carbon Bio-Economy, 2011, the information was extacted and processed in
November-December 2011.