export pivot table to r using rexcel · export pivot table to r using rexcel halbert, heiberger,...
TRANSCRIPT

Export PivotTable to R
Using RExcel
Halbert,Heiberger,Neuwirth
About RExcel
About PivotTables
Why Transferto R?
How it Works
Example
Conclusion
Appendix
Export Pivot Table to R Using RExcel
Keith Halbert1 Richard Heiberger1 Erich Neuwirth2
1Department of Statistics, Fox School of BusinessTemple University
2Didactic Center for Computer Science and Institute for Scientific ComputingUniversity of Vienna
useR! 2010Gaithersburg, MD

Export PivotTable to R
Using RExcel
Halbert,Heiberger,Neuwirth
About RExcel
About PivotTables
Why Transferto R?
How it Works
Example
Conclusion
Appendix
Contents
1 About RExcel
2 About Pivot Tables
3 Why Transfer to R?
4 How it Works
5 Example
6 Conclusion
7 Appendix
Export PivotTable to R
Using RExcel
Halbert,Heiberger,Neuwirth
About RExcel
About PivotTables
Why Transferto R?
How it Works
Example
Conclusion
Appendix
RExcel
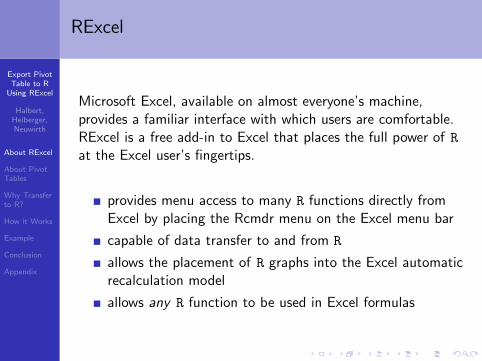
Microsoft Excel, available on almost everyone’s machine,provides a familiar interface with which users are comfortable.RExcel is a free add-in to Excel that places the full power of Rat the Excel user’s fingertips.
provides menu access to many R functions directly fromExcel by placing the Rcmdr menu on the Excel menu bar
capable of data transfer to and from R
allows the placement of R graphs into the Excel automaticrecalculation model
allows any R function to be used in Excel formulas
Export PivotTable to R
Using RExcel
Halbert,Heiberger,Neuwirth
About RExcel
About PivotTables
Why Transferto R?
How it Works
Example
Conclusion
Appendix
RExcel
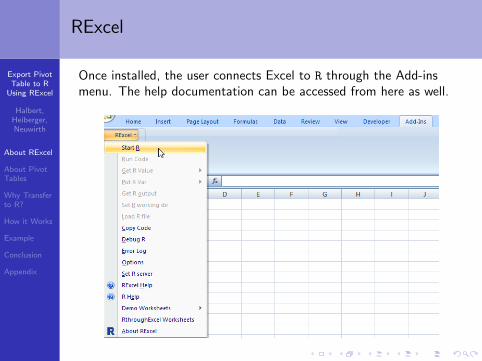
Once installed, the user connects Excel to R through the Add-insmenu. The help documentation can be accessed from here as well.

Export PivotTable to R
Using RExcel
Halbert,Heiberger,Neuwirth
About RExcel
About PivotTables
Why Transferto R?
How it Works
Example
Conclusion
Appendix
Pivot Tables
Pivot tables are datasummarization tools common tospreadsheet software (such asMicrosoft Excel). They provide ameans for quick and intuitivetabulation of data.
The simple data set and pivottable on the right demonstratesthis capability. Here, the averageof Height is shown with Sex as arow variable.

Export PivotTable to R
Using RExcel
Halbert,Heiberger,Neuwirth
About RExcel
About PivotTables
Why Transferto R?
How it Works
Example
Conclusion
Appendix
Pivot Tables
The variable selection ismade through use of theField List shown on theright.
Here, Sex has been placedon the rows and we haveselected the average ofHeight to be oursummary function.
Excel allows for fields tobe dragged, dropped, andfiltered in this list.
Export PivotTable to R
Using RExcel
Halbert,Heiberger,Neuwirth
About RExcel
About PivotTables
Why Transferto R?
How it Works
Example
Conclusion
Appendix
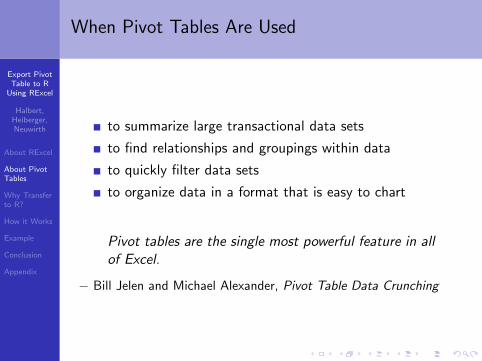
When Pivot Tables Are Used
to summarize large transactional data sets
to find relationships and groupings within data
to quickly filter data sets
to organize data in a format that is easy to chart
Pivot tables are the single most powerful feature in allof Excel.
− Bill Jelen and Michael Alexander, Pivot Table Data Crunching

Export PivotTable to R
Using RExcel
Halbert,Heiberger,Neuwirth
About RExcel
About PivotTables
Why Transferto R?
How it Works
Example
Conclusion
Appendix
Why Transfer a Pivot Table to R?
R graphics are fantastic
R has many powerful tools for manipulating and analyzingmultidimensional tables
re-creation in R of an existing Excel pivot table couldintroduce error; automatic transfer is safer

Export PivotTable to R
Using RExcel
Halbert,Heiberger,Neuwirth
About RExcel
About PivotTables
Why Transferto R?
How it Works
Example
Conclusion
Appendix
How it Works
PutPivottable has been included in RExcel since February 2010.
The table created in R is of class structable, a flatcontingency table provided in the excellent vcd package(Visualizing Categorical Data).
Options for transfer:
right-click on a pivot table
use VBA macro RInterface.PutPivottable
(not discussed in these slides)

Export PivotTable to R
Using RExcel
Halbert,Heiberger,Neuwirth
About RExcel
About PivotTables
Why Transferto R?
How it Works
Example
Conclusion
Appendix
The Right-Clicking Option
With RExcel activated, the user right-clicks anywhere in a pivottable and selects Put Pivottable.
Export PivotTable to R
Using RExcel
Halbert,Heiberger,Neuwirth
About RExcel
About PivotTables
Why Transferto R?
How it Works
Example
Conclusion
Appendix
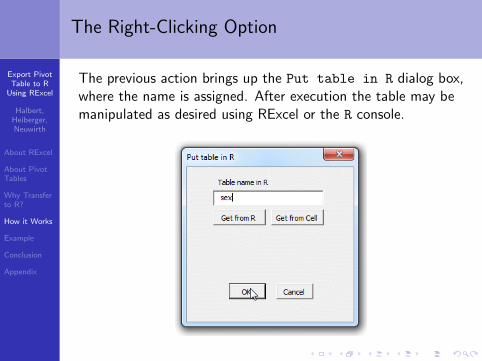
The Right-Clicking Option
The previous action brings up the Put table in R dialog box,where the name is assigned. After execution the table may bemanipulated as desired using RExcel or the R console.

Export PivotTable to R
Using RExcel
Halbert,Heiberger,Neuwirth
About RExcel
About PivotTables
Why Transferto R?
How it Works
Example
Conclusion
Appendix
A Classic Example
The titanic data consist of the following variables regardingthe passengers of the ill-fated maiden voyage of the Titanic:
Class: levels first, second, third and crew
Age: levels child and adult
Sex: levels M and F
Survive: levels die and live
These are recoded from the original. See the Reference sectionfor more information. Two of the 2201 records follow.
Class Age Sex Survive
third child F die
crew adult M live

Export PivotTable to R
Using RExcel
Halbert,Heiberger,Neuwirth
About RExcel
About PivotTables
Why Transferto R?
How it Works
Example
Conclusion
Appendix
Titanic Example
We begin with a simple statistical question: Does the class of thepassenger help to explain survival?
We place Class on the rows and Survive on the Columns.

Export PivotTable to R
Using RExcel
Halbert,Heiberger,Neuwirth
About RExcel
About PivotTables
Why Transferto R?
How it Works
Example
Conclusion
Appendix
Titanic Example
To perform a chi-square test of independence, Excel requires us to
manually create a table of expected cell counts. These are the
numbers we would expect if Class and Survive were independent.
CHITEST() calculates a p-value (which indicates dependence).

Export PivotTable to R
Using RExcel
Halbert,Heiberger,Neuwirth
About RExcel
About PivotTables
Why Transferto R?
How it Works
Example
Conclusion
Appendix
Titanic Example
The chi-square test is an approximation. For some count data wemay require Fisher’s exact test, which Excel does not provide. Toperform either of these tests in R, first we transfer the table and giveit a sensible name.

Export PivotTable to R
Using RExcel
Halbert,Heiberger,Neuwirth
About RExcel
About PivotTables
Why Transferto R?
How it Works
Example
Conclusion
Appendix
Titanic Example
The RExcel function REval() evaluates R code and brings the resultto Excel. The chi-square approximation is fine for these data. Thep-values are similarly tiny.
In chisq.test() R calculates the table of expected values directlyfrom the pivot table. The manual calculation is not necessary.
Even in this simple example, Excel cannot compete with R
when it comes to statistical analysis. We now turn ourattention to graphics.

Export PivotTable to R
Using RExcel
Halbert,Heiberger,Neuwirth
About RExcel
About PivotTables
Why Transferto R?
How it Works
Example
Conclusion
Appendix
Titanic Example
Below is a standard Excel plot of our pivot table.
This is a simple table and Excel’s plot is OK. Next we examine a
mosaic plot from package vcd. These are great for comparing count
data, but are not available in Excel.

Export PivotTable to R
Using RExcel
Halbert,Heiberger,Neuwirth
About RExcel
About PivotTables
Why Transferto R?
How it Works
Example
Conclusion
Appendix
Mosaic Plot
Export PivotTable to R
Using RExcel
Halbert,Heiberger,Neuwirth
About RExcel
About PivotTables
Why Transferto R?
How it Works
Example
Conclusion
Appendix
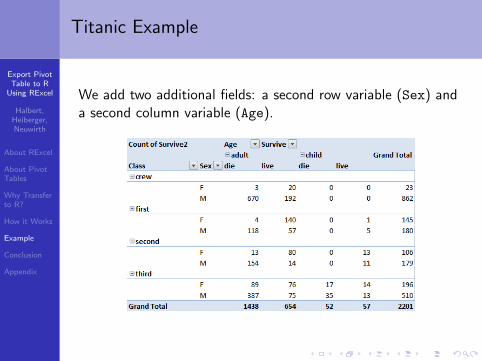
Titanic Example
We add two additional fields: a second row variable (Sex) anda second column variable (Age).

Export PivotTable to R
Using RExcel
Halbert,Heiberger,Neuwirth
About RExcel
About PivotTables
Why Transferto R?
How it Works
Example
Conclusion
Appendix
Titanic Example
Below is the best we can do in Excel. The mosaic plot on thenext slide is superior. Excel pivot table users should haveaccess to these plots.

Export PivotTable to R
Using RExcel
Halbert,Heiberger,Neuwirth
About RExcel
About PivotTables
Why Transferto R?
How it Works
Example
Conclusion
Appendix
The Mosaic Plot is Superior

Export PivotTable to R
Using RExcel
Halbert,Heiberger,Neuwirth
About RExcel
About PivotTables
Why Transferto R?
How it Works
Example
Conclusion
Appendix
Conclusion
RExcel allows for instantaneous transfer of pivot tablesfrom Excel to R
once the table is transferred the user has the full power ofR to do statistical analysis
R packages such as vcd provide useful graphics that arenot available in Excel

Export PivotTable to R
Using RExcel
Halbert,Heiberger,Neuwirth
About RExcel
About PivotTables
Why Transferto R?
How it Works
Example
Conclusion
Appendix
References and Links
Baier, T. and Neuwirth, E. (2007), Excel :: COM :: R.Computational Statistics 22/1 91-108
Dawson, Robert J. MacG. (1995) The ”Unusual Episode” Data Revisited.Journal of Statistics Education v.3, n.3
Heiberger, R. and Neuwirth, E. (2009), R Through Excel. Springer VerlagHornik, K. The Strucplot Framework: Visualizing Multi-way Contingency Tables
with vcd. Journal of Statistical Software, American Statistical Associationvol. 17(i03).
Jelen B. and Alexander, M. (2005), Pivot Table Data Crunching. Que PublishingReport on the Loss of the ’Titanic’ (S.S.) (1990),British Board of Trade Inquiry Report (reprint). Allan Sutton Publishing
RExcelInstaller at CRANhttp://cran.r-project.org/web/packages/RExcelInstaller/index.html
RExcel Homepagehttp://rcom.univie.ac.at/
Titanic Datasethttp://www.amstat.org/publications/jse/v3n3/datasets.dawson.html

Export PivotTable to R
Using RExcel
Halbert,Heiberger,Neuwirth
About RExcel
About PivotTables
Why Transferto R?
How it Works
Example
Conclusion
Appendix
R Code for Creating Mosaic Plots
mosaic(˜ Class + Survive,
direction = c("v", "h"),
data = test,
highlighting = "Survive",
highlighting fill = c("salmon", "skyblue")
)
mosaic(˜ Class + Survive + Sex + Age,
direction = c("v", "h"),
data = test,
highlighting = "Survive",
highlighting fill = c("salmon", "skyblue")
)