export opportunities for south africa in - idc...intermediate goods (from a 53.3% share in 2001 down...
TRANSCRIPT

Trade report
Export opportunities for South Africa in other BRICS economies
May 2014 Department of Research and Information

Export opportunities for South Africa in other BRICS economies
Table of contents
Introduction ....................................................................................................................................................... 1
BRICS’ share of the world trade ..................................................................................................................... 3
Export performance ...................................................................................................................................... 3
Import performance ...................................................................................................................................... 4
Key global markets for BRICS exports and sources of imports ................................................................. 4
Key destinations for BRICS exports ............................................................................................................ 4
Key sources of BRICS imports .................................................................................................................... 5
Intra-BRICS trade and BRICS trade with the rest of the world ................................................................... 6
Balance of trade ........................................................................................................................................... 6
Intra-BRICS trade trends and comparisons with select world regions ........................................................ 6
South Africa’s trade with other BRICS .......................................................................................................... 9
Balance of trade with other BRICS .............................................................................................................. 9
Leading products in South Africa’s export trade with the BRICS .............................................................. 10
Relative importance of South Africa’s export trade with the BRICS ........................................................ 12
Opportunities for further development of South Africa’s export trade with other BRICS ..................... 14
Methodology utilised in identifying opportunities for South African exports .............................................. 14
South Africa’s revealed comparative advantage in the identified export opportunities ............................. 14
Concluding remarks ....................................................................................................................................... 16
Appendix 1: Opportunities for the expansion of South Africa’s exports to other BRICS, or for the introduction of new export products ........................................................................................................... 18
Appendix 2: Market penetration potential for export categories in which South Africa has a higher RCA than other leading import sources, with respect to other BRICS economies ................................ 22

1
Export opportunities for South Africa in other BRICS economies
Introduction
The BRICS forum was formed in 2011 with the aim of encouraging commercial, political and cultural cooperation
amongst its member countries, namely Brazil, Russia, India, China and South Africa. These countries are
amongst the world’s most influential from a geopolitical perspective and can be regarded as economic powers in
their own right, whether globally or regionally.
The BRICS grouping of countries is estimated to have accounted for about 28% of the world’s gross domestic
product (GDP) at purchasing power parity (PPP) in 2013, and is home to almost 3 billion people, or about 42%
of the global population, affording them a substantial market for goods and services. Their external trade
(exports plus imports) has surged to USD 6 trillion, or around 17% of the world total. Through greater
cooperation, the BRICS seek to influence and/or reform global governance and economic relations.
According to the United Nations Conference on Trade and Development (UNCTAD), foreign direct investment
(FDI) flows to the BRICS in 2013 have been estimated at USD 322 billion, or more than double the annual
average of USD 158 billion recorded over the pre-crisis period 2005 to 2007. Furthermore, this figure was 21%
higher than in 2012 and represented approximately 22% of the world’s FDI inflows in 2013, which totalled an
estimated USD 1 461 billion. This is almost double the average annual share of 11% of global FDI inflows
claimed by the BRICS over 2005-2007.
Although China was the leading recipient of FDI inflows amongst the BRICS (estimated at USD 127 billion) in
2013, followed by the Russian Federation (USD 94 billion), Brazil (USD 63 billion) and India (USD 28 billion),
South Africa (USD 10 billion) outperformed its BRICS counterparts by recording the highest growth rate at
126%, whilst Brazil’s was the lowest (-4%).
The BRICS have also become major investors worldwide, with their outward FDI rising from USD 7 billion in
2000 to USD 126 billion by 2012, representing 9% of the global flows.
South Africa not only represents the resource-rich African continent in the BRICS, but potentially has much to
gain from its membership of the grouping in years to come.
Although South Africa has been trading with the European Union (EU), China, the rest of the African continent,
the United States (US) and Japan for many years, China has become South Africa’s key export destination at
the individual country level and is the principal market for South Africa within the BRICS. In 2012, China was
the destination for almost 84% of South Africa’s exports to other BRICS economies (or USD 44.7 billion out of
USD 54.3 billion), followed by India (close to 15% share, or USD 8 billion), while the shares claimed by Brazil
and Russia were very small or negligible.
South Africa should progressively reap the benefits of its economic and political relationships with fellow BRICS
countries if the latter increasingly open up and/or liberalise their economies, while domestically it simultaneously
addresses the structural problems that are constraining competitiveness, including improvements in productivity,
infrastructure and logistics, as well as skills development.

2
Export opportunities for South Africa in other BRICS economies
Figure 1: BRICS comparative indicators
Source: IDC, compiled from IMF, World Bank, UNCTAD and CIA World Factbook data

3
Export opportunities for South Africa in other BRICS economies
BRICS share of the world trade
Export performance
The external trade (i.e. imports + exports) of the BRICS with the world at large amounted to USD 6.07 trillion in
2012, making up nearly 17% of total global trade, up from 13.4% in 2008. Exports to the rest of the world
increased almost 6.5 times to USD 3.2 trillion over the period 2001 to 2012.
Despite sluggish global economic growth in recent years, the BRICS recorded moderate export growth. Exports
to the rest of the world surged by 30.6% in 2010 and by 17.7% in 2012, mainly due to an increasing focus on
exports to a number of other emerging markets / developing economies in an effort to offset weak import
demand in advanced economies. With the exception of Russia, other BRICS members saw their share of
exports destined for emerging markets / developing economies increase over the course of the past decade. In
2012, more than half of all exports from China, India and Brazil, and 48% from South Africa, were destined for
emerging markets / developing economies.
About 64.2% of BRICS total exports to the rest of world in 2012 emanated from China, which in turn accounted
for almost 56% of overall BRICS GDP. Furthermore, China, with an 11.3% share of world exports in 2012, has
overtaken the United States (8.3%) as the world’s largest source of exports. These were followed by Germany
(7.8%), Japan (4.4%) and France (3.1%).
Figure 2: World’s leading exporters
Source: IDC, compiled from International Trade Centre data
The composition of the BRICS export basket has changed significantly over time, with the contribution made by
capital goods exports rising from 13.4% of the total in 2001 to 23.6% by 2012. Consumption goods, in turn, saw
their share of overall BRICS exports decline from 33.2% to 26.7%, while that of raw materials also declined from
15.3% to 13.6% during the same period. A gradual shift has taken place in the manufacturing sector in the
BRICS economies, from labour-intensive to progressively capital-intensive manufacturing. Manufacturing
exports witnessed the most drastic changes in China and India.
World exports in 2008: USD 16 trillion World exports in 2012: USD 18.1 trillion
BRICS 14%
Germany 9%
USA 8%
Japan 5%
France 4%
Netherlands 3%
Italy 3% Belgium
3%
UK 3%
Africa (excl.SA) 3%
Canada 3%
Others 42%
BRICS 17%
USA 9%
Germany 8%
Japan 4%
Africa (excl.SA) 3%
France 3%
Netherlands 3%
Korea, Republic of 3%
Italy 3% Hong Kong,
China 3%
UK 3%
Others 41%

4
Export opportunities for South Africa in other BRICS economies
The structure of exports in both countries has shifted from labour-intensive and low-tech products such as food
and beverages and textiles to more capital-intensive and high-tech products such as metal products, machinery
and electrical equipment in China and chemicals in India. Similar changes in the structure of manufacturing
exports have taken place in Brazil and South Africa, with transport equipment, machinery, and electrical
equipment making up the bulk of exports. In the Russian Federation, by contrast, the composition of
manufactured exports has not changed much, with a high concentration of capital-intensive goods.
Import performance
The BRICS import basket from the rest of the world expanded rapidly in value terms over the twelve-year period
to 2012. Imports grew on average by 20.5% per annum, with the grouping’s share of world imports rising from
6.6% to 16.1% over the period.
The composition of the BRICS import basket from the world at large has also changed over the period, with
more emphasis on imported raw materials (from a 15.2% share in 2001 to 26.3% in 2012) and less on
intermediate goods (from a 53.3% share in 2001 down to 41.7% in 2012). The shares claimed by capital goods,
(17.2% of the total import basket in 2012) and consumption goods (11.8%) remained almost unchanged.
Figure 3: World’s leading importers
Source: IDC, compiled from International Trade Centre data
Key global markets for BRICS exports and sources of imports
Key destinations for BRICS exports
Although the United States has remained the largest individual market for BRICS exports, its share declined
from 17.2% of the total in 2001 to 13.8% in 2008, and marginally further to 13.7% in 2012. Other than Hong
Kong, which is a Special Administrative Region of the People’s Republic of China and a major transit route for
the latter’s exports to the rest of the world (more than 95% of exports to Hong Kong originate from China),
Japan, the Netherlands and the Republic of Korea (South Korea) are also leading destinations for BRICS
exports.
World imports in 2008: USD 16.3 trillion World imports in 2012: USD 18.3 trillion
USA 13%
BRICS 11%
Germany 7%
Japan 5%
France 4%
UK 4%
Italy 3% Netherlands
3%
Belgium 3% Korea, Republic
of 3%
Spain 3%
Others 41%
BRICS 15%
USA 13%
Germany 6%
Japan 5%
UK 4% France
4%
Hong Kong, China
3%
Korea, Republic of 3%
Netherlands 3%
Italy 3%
Africa (excl.SA) 2%
Others 39%

5
Export opportunities for South Africa in other BRICS economies
The input requirements associated with Africa’s infrastructure development, as well as its large consumer
markets with a rising purchasing power underpin the continent’s (excluding South Africa) 4% share of the
BRICS’s exports in 2012, up from the 3.5% ratio recorded in 2008 and 2.9% in 2001.
Figure 4: Leading global markets for BRICS exports
2001 2008 2012
Source: IDC, compiled from International Trade Centre data
Key sources of BRICS imports
The USA and Japan have been the leading sources of imports for the BRICS, although South Korea was a very
close third in 2012. Resource-rich Africa is also gaining prominence as a key source of imports for the BRICS.
The continent (excluding South Africa) was the source of 4.4% of BRICS overall imports in 2012, or USD 128.5
billion out of USD 3 trillion. Leading imported products from Africa were crude oil, petroleum and gases,
sourced principally from Angola, Nigeria, Libya, Algeria and Egypt; refined and unrefined copper coming mainly
from Zambia and the Democratic Republic of the Congo; and iron ore and concentrates imported mainly from
Mauritania, Sierra Leone and Liberia.
Figure 5: Leading global sources of BRICS imports
2001 2008 2012
Source: IDC, compiled from International Trade Centre data
57.7%
0% 10% 20%
USA
Hong Kong
Japan
Netherlands
Germany
South Korea
Others 57.2%
0% 10% 20%
USA
Hong Kong
Japan
Netherlands
Africa (excl.SA)
Germany
Others49.7%
0% 15% 30%
USA
Japan
Hong Kong
Germany
UK
Netherlands
Others
52.9%
0% 5% 10% 15% 20%
Japan
USA
Germany
Taiwan
South Korea
Hong Kong
Others 59.2%
0% 5% 10%
Japan
USA
South Korea
Germany
Taiwan
Africa (excl.SA)
Others 63.5%
0% 5% 10%
Japan
USA
South Korea
Germany
Taiwan
Africa (excl.SA)
Others

6
Export opportunities for South Africa in other BRICS economies
Intra-BRICS trade and BRICS trade with the rest of the world
Balance of trade
The trade balance of the BRICS with the rest of the world remained in surplus over the period 2001 to 2012, with
intra-BRICS trade (i.e. trade amongst the member states) increasing from 6% in 2001 to almost 13% in 2012.
After a gradually rising positive trend starting in 2002 and peaking at USD 376.3 billion by 2008, the surplus
collectively recorded by the BRICS moderated thereafter, amounting to USD 244.3 billion in 2012. This was
largely as a result of the global economic crisis and subsequently fragile recovery. BRICS exports totalled just
under USD 3.2 trillion in 2012, compared to the lower value of imports at approximately USD 2.9 trillion.
The BRICS economies are increasingly trading with Africa (excl. South Africa), with total BRICS-Africa trade
reaching USD 256.5 billion in 2012, or more than eleven times the value recorded in 2001 (USD 22.9 billion).
BRICS-Africa trade has increased by approximately 47% since 2008, a period characterised by relatively slow
economic growth globally.
Figure 6: BRICS trade with the world by member states
Source: IDC, compiled from ITC data
Intra-BRICS trade trends and comparisons with select world regions
Trade amongst the BRICS has increased substantially over the years, recording an annual average growth rate
of 8.2% over the period 2001 and 2007, which accelerated to 11.9% between 2008 and 2012. Intra-BRICS
exports totalled USD 498 billion in 2012, up more than fourteen-fold from the USD 34 billion recorded in 2001.
This represented around 16.7% of BRICS total trade in 2012, from a 15.3% share in 2008.
-4
-3
-2
-1
0
1
2
3
4
2001 2002 2003 2004 2005 2006 2007 2008 2009 2010 2011 2012
US
D (
trillio
n)
South Africa Brazil
India Russia
China Trade balance BRICS
exports
to the
world
BRICS
imports
from the
world
7
Export opportunities for South Africa in other BRICS economies
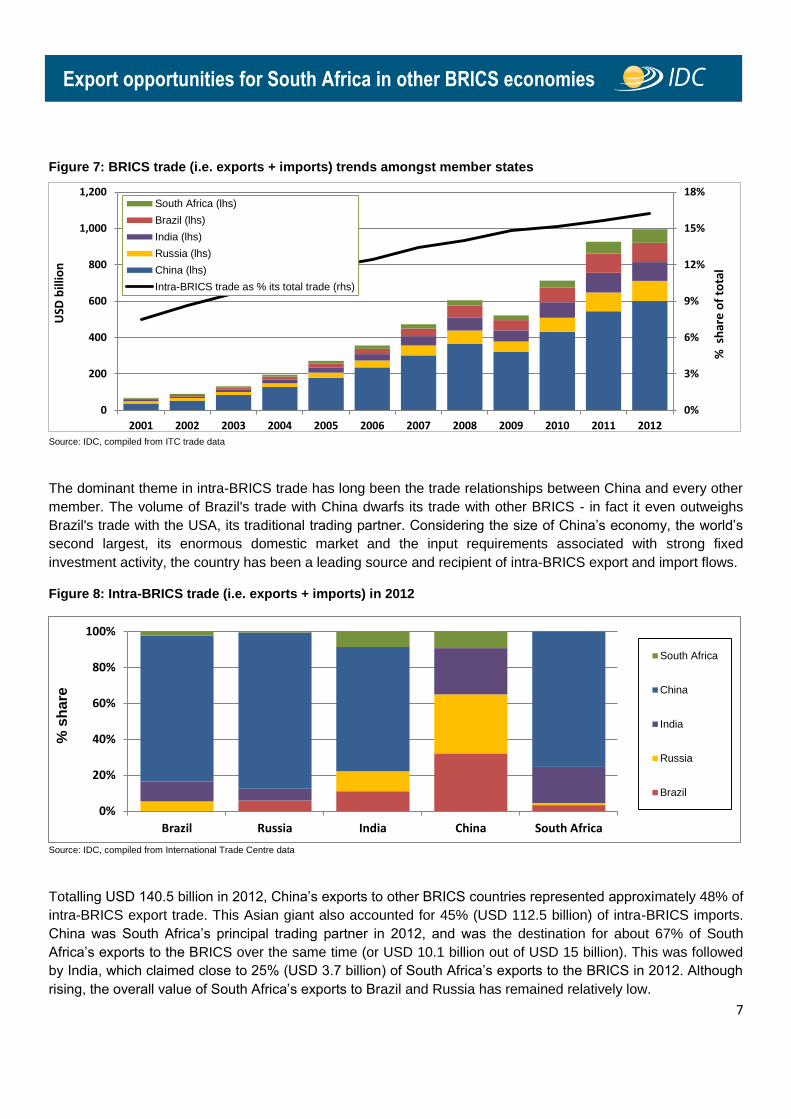
Figure 7: BRICS trade (i.e. exports + imports) trends amongst member states
Source: IDC, compiled from ITC trade data
The dominant theme in intra-BRICS trade has long been the trade relationships between China and every other
member. The volume of Brazil's trade with China dwarfs its trade with other BRICS - in fact it even outweighs
Brazil's trade with the USA, its traditional trading partner. Considering the size of China’s economy, the world’s
second largest, its enormous domestic market and the input requirements associated with strong fixed
investment activity, the country has been a leading source and recipient of intra-BRICS export and import flows.
Figure 8: Intra-BRICS trade (i.e. exports + imports) in 2012
Source: IDC, compiled from International Trade Centre data
Totalling USD 140.5 billion in 2012, China’s exports to other BRICS countries represented approximately 48% of
intra-BRICS export trade. This Asian giant also accounted for 45% (USD 112.5 billion) of intra-BRICS imports.
China was South Africa’s principal trading partner in 2012, and was the destination for about 67% of South
Africa’s exports to the BRICS over the same time (or USD 10.1 billion out of USD 15 billion). This was followed
by India, which claimed close to 25% (USD 3.7 billion) of South Africa’s exports to the BRICS in 2012. Although
rising, the overall value of South Africa’s exports to Brazil and Russia has remained relatively low.
0%
3%
6%
9%
12%
15%
18%
0
200
400
600
800
1,000
1,200
2001 2002 2003 2004 2005 2006 2007 2008 2009 2010 2011 2012
% s
har
e o
f to
tal
USD
bill
ion
South Africa (lhs)
Brazil (lhs)
India (lhs)
Russia (lhs)
China (lhs)
Intra-BRICS trade as % its total trade (rhs)
0%
20%
40%
60%
80%
100%
Brazil Russia India China South Africa
South Africa
China
India
Russia
Brazil
% s
ha
re

8
Export opportunities for South Africa in other BRICS economies
0%
20%
40%
60%
80%
100%
2000 2007 2012Extra exports Intra exports
0%
20%
40%
60%
80%
100%
2000 2007 2012Extra exports Intra exports
0%
20%
40%
60%
80%
100%
2000 2007 2012Extra exports Intra exports
0%
20%
40%
60%
80%
100%
2001 2007 2012Extra exports Intra exports
Table 1: Intra-BRICS export trade and world exports to the BRICS in 2012
Source of exports
USD billion Brazil Russia India China SA BRICS World
De
stin
atio
n o
f e
xpo
rts
Brazil 2.3 6.2 33.4 0.8 42.7 223.1
Russia 3.1 2.1 44.1 0.4 49.7 316.2
India 5.6 7.8 47.7 3.7 64.8 489.0
China 51.8 35.8 14.8 10.1 112.5 1 818.2
South Africa 1.8 0.3 8.0 15.3 25.4 101.6
BRICS 62.3 46.2 31.1 140.5 15.0 295.1 2 948.1
World 242.6 524.8 289.6 2 048.7 86.7 3 192.4 18 058.0
Source: IDC, compiled from International Trade Centre data
China consumed about 83% of Brazil’s exports in 2012. Similarly, China was also the destination for 6.5% of
India’s exports, 6.8% of Russia’s exports, and 51.6% of South Africa’s exports. In contrast, the other BRICS
members have made little inroad in selling consumer goods to China, with the group meeting just 4.6% of
Chinese demand for consumer products in 2012.
Figure 9: Intra-regional export trade comparisons
BRICS Developing economies: Americas
Developing economies: Asia Eurozone
Source: IDC, compiled from UNCTAD and ITC trade data

9
Export opportunities for South Africa in other BRICS economies
South Africa’s trade with other BRICS
Balance of trade with other BRICS
South Africa’s trade with other BRICS countries has expanded substantially since the beginning of the 21st
century, with the expansion having been particularly impressive in the case of China and, to a lesser extent,
India.
Figure 10: South Africa’s trade with the BRICS
Source: IDC, compiled from International Trade Centre data
As illustrated in Figure 11 below, South Africa’s trade deficit with Brazil widened from USD 636 million in 2010 to
USD 881 million in 2012, with exports totalling USD 790 million compared to an import basket from Brazil valued
at almost USD 1.7 billion.
A trade surplus was recorded with Russia from 2010 to 2012, rising from USD 178.7 million to USD 208.8
million. South Africa’s exports to Russia amounted to USD 412.3 million in 2012, compared to imports valued at
approximately USD 204 million.
After recording trade surpluses with India over the period 2008 to 2010, a deficit emerged in 2011, which
widened further in 2012 to almost USD 923 million.
Although South Africa’s exports to India rose to USD 3.7 billion in 2012, these fell short of the higher import
demand from India amounting to USD 4.6 billion.
SA exports
to other
BRICS
SA imports
from other
BRICS
-25
-20
-15
-10
-5
0
5
10
15
20
2001 2002 2003 2004 2005 2006 2007 2008 2009 2010 2011 2012
U
SD
billio
ns
Brazil
India
Russia
China
Trade balance

10
Export opportunities for South Africa in other BRICS economies
After narrowing considerably over the period 2009-2011, South Africa’s trade deficit with China widened in 2012
to almost USD 4.5 billion. Exports to China amounted to USD 10.1 billion in 2012, whilst import demand totalled
USD 14.6 billion.
Figure 11: South Africa’s trade balance with the BRICS
SA trade with Brazil SA trade with Russia
SA trade with India SA trade with China
Source: IDC, compiled from International Trade Centre data
Leading products in South Africa’s export trade with the BRICS
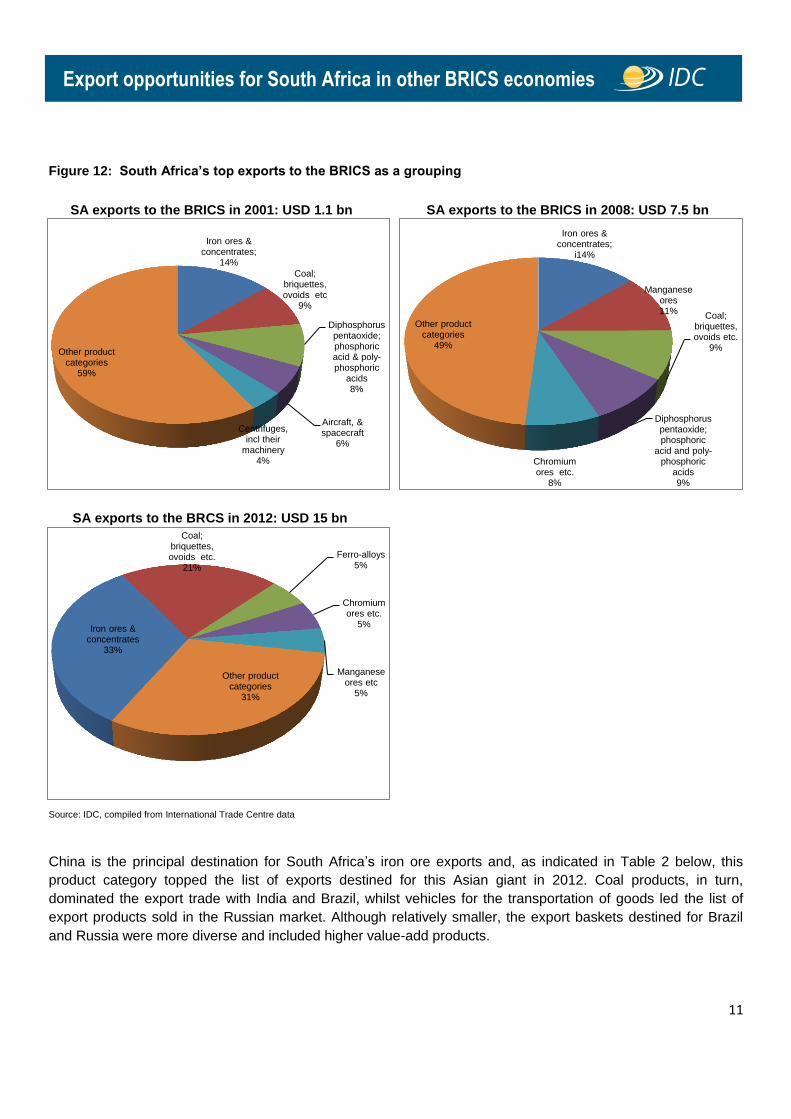
South Africa’s exports to the BRICS collectively have been largely dominated by minerals and beneficiated
products, with iron ore exports representing almost one-third of the export basket in 2012, from a 14% share in
2001 or 2008, as illustrated in Figure 12 below. Centrifuges, which claimed 4% of the export basket in 2001,
represented a mere 1.7% share by 2012.
-2
-1.5
-1
-0.5
0
0.5
1
2007 2008 2009 2010 2011 2012
USD
bill
ion
s
Exports Imports Trade balance
-0.8
-0.6
-0.4
-0.2
0
0.2
0.4
0.6
2007 2008 2009 2010 2011 2012
USD
bill
ion
s
Exports Imports Trade balance
-6
-4
-2
0
2
4
6
2007 2008 2009 2010 2011 2012
USD
bill
ion
s
Exports Imports Trade balance
-20
-15
-10
-5
0
5
10
15
2007 2008 2009 2010 2011 2012
USD
bill
ion
s
Exports Imports Trade balance
11
Export opportunities for South Africa in other BRICS economies
Figure 12: South Africa’s top exports to the BRICS as a grouping
SA exports to the BRICS in 2001: USD 1.1 bn SA exports to the BRICS in 2008: USD 7.5 bn
SA exports to the BRCS in 2012: USD 15 bn
Source: IDC, compiled from International Trade Centre data
China is the principal destination for South Africa’s iron ore exports and, as indicated in Table 2 below, this
product category topped the list of exports destined for this Asian giant in 2012. Coal products, in turn,
dominated the export trade with India and Brazil, whilst vehicles for the transportation of goods led the list of
export products sold in the Russian market. Although relatively smaller, the export baskets destined for Brazil
and Russia were more diverse and included higher value-add products.
Iron ores & concentrates
33%
Coal; briquettes, ovoids etc.
21%
Ferro-alloys 5%
Chromium ores etc.
5%
Manganese ores etc
5%
Other product categories
31%
Iron ores & concentrates;
14%
Coal; briquettes, ovoids etc
9%
Diphosphorus pentaoxide; phosphoric acid & poly- phosphoric
acids 8%
Aircraft, & spacecraft
6%
Centrifuges, incl their
machinery 4%
Other product categories
59%
Iron ores & concentrates;
i14%
Manganese ores 11%
Coal; briquettes, ovoids etc.
9%
Diphosphorus pentaoxide; phosphoric
acid and poly-phosphoric
acids 9%
Chromium ores etc.
8%
Other product categories
49%

12
Export opportunities for South Africa in other BRICS economies
Table 2: South Africa’s leading export categories to other BRICS countries in 2012 (in order of importance)
Brazil Russia India China
Coal; briquettes, ovoids and similar solid fuels manufactured
from coal
Trucks, motor vehicles for the transport of goods
Coal; briquettes, ovoids and similar solid fuels manufactured
from coal
Iron ores and concentrates, including roasted iron pyrites
Insecticides, fungicides, herbicides packaged for retail sale
Citrus fruit, fresh or dried Ferrous waste and scrap; re-melting scrap ingots or iron or
steel
Coal; briquettes, ovoids and similar solid fuels manufactured from coal
Polymers of propylene or of other olefins, in primary forms
Manganese ores and concentrates etc.
Iron ores & concentrates; including roasted iron pyrites
Chromium ores and concentrates
Aluminium plates, sheets and strip, of a thickness exceeding 0.2mm
Apples, pears and quinces, fresh Manganese ores and concentrates
etc. Ferro-alloys
Flat-rolled products of stainless steel (width >/= 600mm)
Wine of fresh grapes Diphosphorus pentaoxide;
phosphoric acid and polyphosphoric acids
Manganese ores and concentrates etc.
Ferro-alloys Grapes, fresh or dried Unwrought aluminium Petroleum oils
Flat-rolled iron and steel products (width>/=600mm),
clad, plated or coated
Radar apparatus, radio navigational apparatus and radio
remote control apparatus Ferro-alloys
Niobium, tantalum, vanadium or zirconium ores and concentrates
Engines, spark-ignition reciprocating or rotary internal
combustion; pistons
Machinery for sorting/screening/washing;
agglomerating/shaping mineral products
Chemical wood pulp, dissolving grades
Platinum, unwrought or in semi-manufactured forms
Acyclic hydrocarbons Flat-rolled products of stainless
steel (width>/=600mm) Diamonds, not mounted or set Copper waste and scrap
Unsaturated acyclic and cyclic monocarboxylic acid and
anhydrides, halides Chromium ores and concentrates Aluminium waste and scrap Wool, not carded or combed
Source: IDC, compiled from International Trade Centre data
Relative importance of South Africa’s export trade with other BRICS
China has become the leading market for South Africa’s exports, claiming almost 12% of overall merchandise
exports in 2012 (refer to Figure 13 below). The importance of India as an export destination has also become
increasingly evident in recent years, although it eased to 1.6% in 2012, from 2% in 2011. The same cannot be
said with respect to Brazil and, even more so, where Russia is concerned, since both countries still claim very
small shares of South Africa’s export basket, at 0.4% and under 0.5% respectively.
Although South Africa is a minor source of imports from the BRICS perspective, its penetration of individual
BRICS markets increased in 2012 (refer to Figure 14 below).

13
Export opportunities for South Africa in other BRICS economies
Figure 13: Relative importance of South Africa’s exports to other BRICS, from SA’s perspective
SA exports to Brazil as a % of
SA’s total merchandise exports
SA exports to Russia as a % of
SA’s total merchandise exports
Figure 14: Relative importance of South Africa’s exports to other BRICS, from their perspective
Brazil’s imports from SA as a % of Brazil’s total merchandise imports
Russia’s imports from SA as a % of Russia’s total merchandise imports
India’s imports from SA as a % of India’s total merchandise imports
China’s imports from SA as a % of China’s total merchandise imports
Source: IDC, compiled from International Trade Centre data
SA exports to India as a % of SA’s total merchandise exports
SA exports to China as a % of
SA’s total merchandise exports
0.0%
0.5%
1.0%
1.5%
2.0%
2.5%
2007 2008 2009 2010 2011 2012
0.0%
4.0%
8.0%
12.0%
16.0%
2007 2008 2009 2010 2011 2012
0.0%
0.1%
0.2%
0.3%
0.4%
0.5%
2007 2008 2009 2010 2011 2012
0.0%
0.2%
0.4%
0.6%
0.8%
1.0%
1.2%
2007 2008 2009 2010 2011 2012
0.0%
0.1%
0.2%
0.3%
0.4%
0.5%
2007 2008 2009 2010 2011 2012
0.0%
0.1%
0.1%
0.2%
0.2%
0.3%
2007 2008 2009 2010 2011 2012
0%
2%
4%
6%
2007 2008 2009 2010 2011 20120.0%
1.0%
2.0%
3.0%
2007 2008 2009 2010 2011 2012
14
Export opportunities for South Africa in other BRICS economies
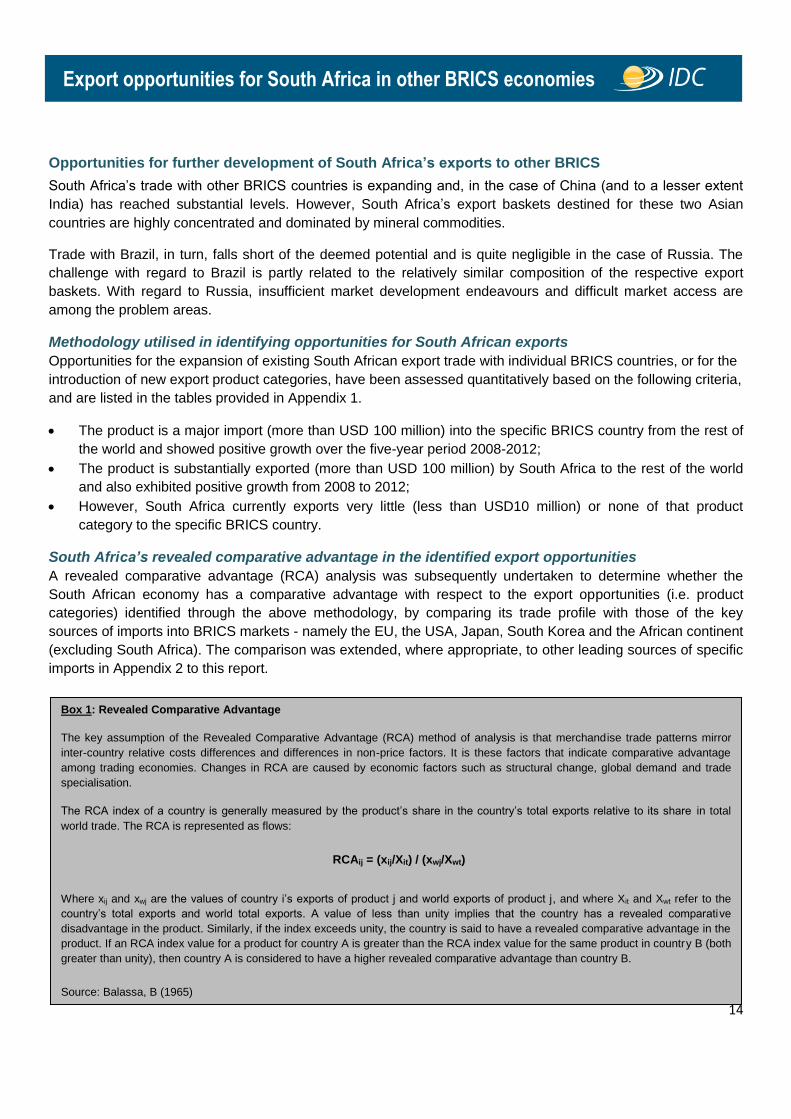
Box 1: Revealed Comparative Advantage
The key assumption of the Revealed Comparative Advantage (RCA) method of analysis is that merchandise trade patterns mirror
inter-country relative costs differences and differences in non-price factors. It is these factors that indicate comparative advantage
among trading economies. Changes in RCA are caused by economic factors such as structural change, global demand and trade
specialisation.
The RCA index of a country is generally measured by the product’s share in the country’s total exports relative to its share in total
world trade. The RCA is represented as flows:
RCAij = (xij/Xit) / (xwj/Xwt)
Where xij and xwj are the values of country i’s exports of product j and world exports of product j, and where Xit and Xwt refer to the
country’s total exports and world total exports. A value of less than unity implies that the country has a revealed comparative
disadvantage in the product. Similarly, if the index exceeds unity, the country is said to have a revealed comparative advantage in the
product. If an RCA index value for a product for country A is greater than the RCA index value for the same product in country B (both
greater than unity), then country A is considered to have a higher revealed comparative advantage than country B.
Source: Balassa, B (1965)
Opportunities for further development of South Africa’s exports to other BRICS
South Africa’s trade with other BRICS countries is expanding and, in the case of China (and to a lesser extent
India) has reached substantial levels. However, South Africa’s export baskets destined for these two Asian
countries are highly concentrated and dominated by mineral commodities.
Trade with Brazil, in turn, falls short of the deemed potential and is quite negligible in the case of Russia. The
challenge with regard to Brazil is partly related to the relatively similar composition of the respective export
baskets. With regard to Russia, insufficient market development endeavours and difficult market access are
among the problem areas.
Methodology utilised in identifying opportunities for South African exports
Opportunities for the expansion of existing South African export trade with individual BRICS countries, or for the
introduction of new export product categories, have been assessed quantitatively based on the following criteria,
and are listed in the tables provided in Appendix 1.
The product is a major import (more than USD 100 million) into the specific BRICS country from the rest of
the world and showed positive growth over the five-year period 2008-2012;
The product is substantially exported (more than USD 100 million) by South Africa to the rest of the world
and also exhibited positive growth from 2008 to 2012;
However, South Africa currently exports very little (less than USD10 million) or none of that product
category to the specific BRICS country.
South Africa’s revealed comparative advantage in the identified export opportunities
A revealed comparative advantage (RCA) analysis was subsequently undertaken to determine whether the
South African economy has a comparative advantage with respect to the export opportunities (i.e. product
categories) identified through the above methodology, by comparing its trade profile with those of the key
sources of imports into BRICS markets - namely the EU, the USA, Japan, South Korea and the African continent
(excluding South Africa). The comparison was extended, where appropriate, to other leading sources of specific
imports in Appendix 2 to this report.
15
Export opportunities for South Africa in other BRICS economies
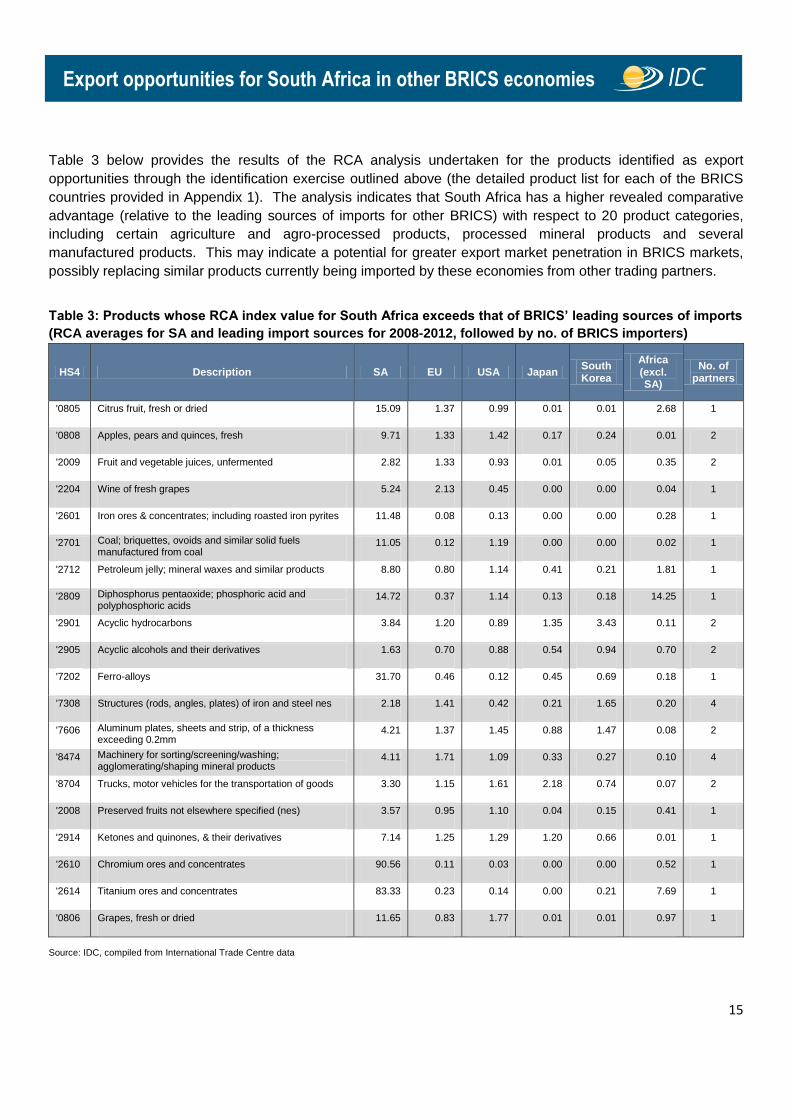
Table 3 below provides the results of the RCA analysis undertaken for the products identified as export
opportunities through the identification exercise outlined above (the detailed product list for each of the BRICS
countries provided in Appendix 1). The analysis indicates that South Africa has a higher revealed comparative
advantage (relative to the leading sources of imports for other BRICS) with respect to 20 product categories,
including certain agriculture and agro-processed products, processed mineral products and several
manufactured products. This may indicate a potential for greater export market penetration in BRICS markets,
possibly replacing similar products currently being imported by these economies from other trading partners.
Table 3: Products whose RCA index value for South Africa exceeds that of BRICS’ leading sources of imports
(RCA averages for SA and leading import sources for 2008-2012, followed by no. of BRICS importers)
HS4 Description SA EU USA Japan South Korea
Africa (excl. SA)
No. of partners
'0805 Citrus fruit, fresh or dried 15.09 1.37 0.99 0.01 0.01 2.68 1
'0808 Apples, pears and quinces, fresh 9.71 1.33 1.42 0.17 0.24 0.01 2
'2009 Fruit and vegetable juices, unfermented 2.82 1.33 0.93 0.01 0.05 0.35 2
'2204 Wine of fresh grapes 5.24 2.13 0.45 0.00 0.00 0.04 1
'2601 Iron ores & concentrates; including roasted iron pyrites 11.48 0.08 0.13 0.00 0.00 0.28 1
'2701 Coal; briquettes, ovoids and similar solid fuels manufactured from coal
11.05 0.12 1.19 0.00 0.00 0.02 1
'2712 Petroleum jelly; mineral waxes and similar products 8.80 0.80 1.14 0.41 0.21 1.81 1
'2809 Diphosphorus pentaoxide; phosphoric acid and polyphosphoric acids
14.72 0.37 1.14 0.13 0.18 14.25 1
'2901 Acyclic hydrocarbons 3.84 1.20 0.89 1.35 3.43 0.11 2
'2905 Acyclic alcohols and their derivatives 1.63 0.70 0.88 0.54 0.94 0.70 2
'7202 Ferro-alloys 31.70 0.46 0.12 0.45 0.69 0.18 1
'7308 Structures (rods, angles, plates) of iron and steel nes 2.18 1.41 0.42 0.21 1.65 0.20 4
'7606 Aluminum plates, sheets and strip, of a thickness exceeding 0.2mm
4.21 1.37 1.45 0.88 1.47 0.08 2
'8474 Machinery for sorting/screening/washing; agglomerating/shaping mineral products
4.11 1.71 1.09 0.33 0.27 0.10 4
'8704 Trucks, motor vehicles for the transportation of goods 3.30 1.15 1.61 2.18 0.74 0.07 2
'2008 Preserved fruits not elsewhere specified (nes) 3.57 0.95 1.10 0.04 0.15 0.41 1
'2914 Ketones and quinones, & their derivatives 7.14 1.25 1.29 1.20 0.66 0.01 1
'2610 Chromium ores and concentrates 90.56 0.11 0.03 0.00 0.00 0.52 1
'2614 Titanium ores and concentrates 83.33 0.23 0.14 0.00 0.21 7.69 1
'0806 Grapes, fresh or dried 11.65 0.83 1.77 0.01 0.01 0.97 1
Source: IDC, compiled from International Trade Centre data

16
Export opportunities for South Africa in other BRICS economies
The tables indicating the lists of potential opportunities for further development of South Africa’s exports to other
BRICS as per the methodology utilised are provided in Appendix 1 to this report.
The market penetration potential for the 20 export categories where South Africa has a higher revealed
comparative advantage than other leading import sources (as previously listed), with respect to the BRICS
economies, is illustrated in Appendix 2. The listing under each of the 20 product categories at the 4-digit
harmonized system (HS) level is taken further to the 6-digit level so as to possibly identify more specific
products. In addition, the top 5 (where applicable) current sources of imports for each of the 20 product
categories in the BRICS markets are listed in conjunction with their respective shares of the countries’ overall
imports of that product category.
Concluding remarks
The analysis undertaken for this report suggests that there is significant potential for the further development of
South Africa’s export trade with other BRICS countries. To date, however, this potential has been limited by a
number of factors such as their historical links with particular trading partners.
The analysis indicates that, out of the 37 product categories that South Africa could potentially export in greater
quantities, or for the first time, to other BRICS markets, the country has a revealed comparative advantage in 20
instances compared to the leading sources of imports into BRICS economies.
However, the realisation of these opportunities remains highly dependent on efforts or initiatives by BRICS
governments to effectively address certain market access challenges that are unnecessarily constraining trade
flows between the member states, such as:
excessively bureaucratic procedures in most BRICS;
certain protectionist regulations and standards (e.g. phytosanitary regulations, restrictive public sector
procurement criteria);
import protection;
inadequate promotion of intra-BRICS trade and investment flows; and
alleged difficulties in accessing business visas, among other factors.
With stronger and more effective interaction at the governmental level and greater private sector participation,
intra-BRICS trade could increase significantly and result in considerable economic gains for the South African
economy.
Figure 15 below summarises South Africa’s export opportunities to other BRICS, specifically with respect to
product categories where South Africa has a revealed comparative advantage and for which the respective RCA
indices exceed those of key sources of imports into BRICS markets.
It is recommended, however, that the complete lists of export opportunities provided in Appendix 1 be taken into
consideration when pursuing export market development opportunities in each of the BRICS markets.

17
Export opportunities for South Africa in other BRICS economies
Figure 15: Export opportunities for SA in other BRICS, specifically in categories where SA has a revealed comparative advantage vis-à-vis leading import sources
-Apples, pears and quinces, fresh
-Wine of fresh grapes
-Diphosphorus pentaoxide; phosphoric acid and polyphosphoric acids
-Acyclic alcohols and their derivatives
-Ketones and quinones, and their derivatives
-Structures (rods, angles, plates) of iron and steel not elsewhere specified
-Machinery for sorting/screening/washing; agglomerating/shaping mineral products
-Trucks, motor vehicles for the transportation of goods
-Apples, pears and quinces, fresh
-Petroleum jelly; mineral waxes & similar products
-Acyclic hydrocarbons
-Structures (rods,angle, plates) of iron and steel not elsewhere specified
-Aluminum plates, sheets and strip, of a thickness exceeding 0.2mm
-Machinery for sorting/screening/washing; agglomerating/shaping mineral products
-Citrus fruit, fresh or dried
-Grapes, fresh or dried
-Preserved fruits not elsewhere specified (nes)
-Fruit and vegetable juices, unfermented
-Titanium ores and concentrates
-Acyclic hydrocarbons
-Structures (rods, angles, plates) of iron and steel nes
-Machinery for sorting/screening/washing; agglomerating/shaping mineral products
-Trucks, motor vehicles for the transportation of goods
China
India
Russia
Brazil
-Fruit and vegetable juices, unfermented
-Iron ores and concentrates; including roasted iron pyrites
-Chromium ores and concentrates
-Coal; briquettes, ovoids & similar solid fuels manufactured from coal
-Acyclic alcohols and their derivatives
-Ferro-alloys
-Structures (rods, angles, plates) of iron and steel not elsewhere specified (nes)
-Aluminum plates, sheets and strip, of a thickness exceeding 0.2mm
-Machinery for sorting/screening/washg;agglomeratg/shapg mineral products

18
Export opportunities for South Africa in other BRICS economies
APPENDIX 1: OPPORTUNITIES FOR THE EXPANSION OF SOUTH AFRICAN EXPORTS TO OTHER
BRICS, OR FOR THE INTRODUCTION OF NEW EXPORT PRODUCTS
Table A1: SA top export opportunities to Brazil
Note: Green shading indicates a product in which SA has a higher revealed comparative advantage relative to the BRICS’ top trading partners
Source: IDC, compiled from International Trade Centre data
SA's top 20 export opportunities to Brazil
Product HS code
Product label
5 year average SA exports to
the World
(USD m)
5 year average SA exports to
Brazil
(USD m)
5 year average Brazil imports
from the World
(USD m)
Opportunity
'8703 Cars (incl. station wagons) 3918 0.1 8114 Expansion
'8704 Trucks, motor vehicles for the transportation of goods 1608 0.1 1994 Expansion
'2710 Petroleum oils, not crude 1446 5.6 11725 Expansion
'8708 Parts and accessories of motor vehicles 827 3.8 5330 Expansion
'2204 Wine of fresh grapes 747 2.6 246 Expansion
'7208 Flat-rolled products of iron/steel (width>/=600mm), hot-rolled, not clad 536 3.3 646 Expansion
'1005 Maize (corn) 499 0 140 Expansion
'7308 Structures (rods, angles, plates) of iron and steel not elsewhere specified (n.e.s) 442 0.9 216 Expansion
'0808 Apples, pears and quinces, fresh 413 0 229 Expansion
'8474 Machinery for sorting/screening/washing; agglomerating/shaping mineral products
361 1.7 330 Expansion
'2809 Diphosphorus pentaoxide; phosphoric acid and polyphosphoric acids 354 0 156 New
'8431 Machinery parts (headings 84.25 to 84.30) 254 1.3 764 Expansion
'2905 Acyclic alcohols and their derivatives 230 5.1 547 Expansion
'8413 Pumps for liquids; liquid elevators 228 1.3 893 Expansion
'8408 Diesel or semi-diesel engines 197 0 760 Expansion
'2914 Ketones and quinones, as well as their derivatives 195 7.1 122 Expansion
'8802 Aircraft, (helicopters, aeroplanes) and spacecraft (satellites) 189 0 1180 Expansion
'8429 Self-propelled bulldozers, angledozers, graders, excavators, etc. 187 0.1 910 Expansion
'8517 Electric apparatus for line telephony, including line systems 149 0.4 3862 Expansion

19
Export opportunities for South Africa in other BRICS economies
Table A2: SA top export opportunities to Russia
SA's top 20 export opportunities to Russia
Product HS code
Product label
5 year average SA exports to
the World
(USD m)
5 year average SA exports to
Russia
(USD m)
5 year average Russia imports
from the World
(USD m)
Opportunity
'2701 Coal; briquettes, ovoids and similar solid fuels manufactured from coal 5792 0 555 New
'2601 Iron ores and concentrates; including roasted iron pyrites 5490 0 332 Expansion
'7202 Ferro-alloys 4239 6.6 529 Expansion
'8703 Cars (incl. station wagons) 3918 1.9 13745 Expansion
'2710 Petroleum oils, not crude 1446 0 1996 Expansion
'2610 Chromium ores and concentrates 1082 2.1 179 Expansion
'8708 Parts and accessories of motor vehicles 827 0.1 4476 Expansion
'7208 Flat-rolled products of iron/steel (width>/=600mm), hot-rolled, not clad 536 0.6 755 Expansion
'7606 Aluminium plates, sheets and strips, of a thickness exceeding 0.2mm 532 5.6 196 Expansion
'1005 Maize (corn) 499 0 103 New
'7308 Structures (rods, angles, plates) of iron and steel not elsewhere specified (n.e.s.) 442 0.4 997 Expansion
'3902 Polymers of propylene or of other olefins, in primary forms 418 0 339 New
'8474 Machinery for sorting/screening/washing; agglomerating/shaping mineral products
361 9.4 1435 Expansion
'8409 Parts for use solely/principally with motor engines 256 0 363 Expansion
'8431 Machinery parts (headings 84.25 to 84.30) 254 0.9 758 Expansion
'4011 New pneumatic tires, of rubber 236 0.2 1633 Expansion
'2905 Acyclic alcohols and their derivatives 230 0 166 New
'8413 Pumps for liquids; liquid elevators 228 0.3 1580 Expansion
'2009 Fruit and vegetable juices, unfermented 201 1.4 414 Expansion
'8408 Diesel or semi-diesel engines 197 0 643 New
Note: Green shading indicates a product in which SA has a higher revealed comparative advantage relative to the BRICS’ top trading partners.
Source: IDC, compiled from International Trade Centre data

20
Export opportunities for South Africa in other BRICS economies
Table A3: SA top export opportunities to India
SA's top 20 export opportunities to India
Product HS code
Product label
5 year average SA exports to
the World
(USD m)
5 year average SA exports to
India
(USD m)
5 year average India imports from
the World
(USD m)
Opportunity
'8703 Cars (including station wagons) 3918 0.1 491 Expansion
'2710 Petroleum oils, not crude 1446 8 7001 Expansion
'8708 Parts and accessories of motor vehicles 827 3.5 2850 Expansion
'7606 Aluminium plates, sheets and strips, of a thickness exceeding 0.2mm 532 4.3 230 Expansion
'7308 Structures (rods, angles, plates) of iron and steel not elsewhere specified (n.e.s.) 442 0.9 546 Expansion
'2901 Acyclic hydrocarbons 430 0 265 New
'3902 Polymers of propylene or of other olefins, in primary forms 418 1.1 580 Expansion
'0808 Apples, pears and quinces, fresh 413 2.4 141 Expansion
'8474 Machinery for sorting/screening/washing; agglomerating/shaping mineral products
361 3.7 529 Expansion
'8409 Parts for use solely/principally with motor engines 256 2.6 727 Expansion
'8431 Machinery parts (headings 84.25 to 84.30) 254 2 1045 Expansion
'4011 New pneumatic tires, of rubber 236 0.9 392 Expansion
'8413 Pumps for liquids; liquid elevators 228 0.4 795 Expansion
'8802 Aircraft, (helicopters, aeroplanes) and spacecraft (satellites) 189 1.1 3894 Expansion
'8429 Self-propelled bulldozers, angledozers, graders, excavators, etc. 187 0.2 389 Expansion
'2712 Petroleum jelly; mineral waxes and similar products 174 9.8 138 Expansion
'3808 Insecticides, fungicides, herbicides packaged for retail sale 172 0.6 573 Expansion
'8517 Electric apparatus for line telephony, including line systems 149 0.3 8272 Expansion
Note: Green shading indicates a product in which SA has a higher revealed comparative advantage relative to the BRICS’ top trading partners.
Source: IDC, compiled from International Trade Centre data

21
Export opportunities for South Africa in other BRICS economies
Table A4: SA top export opportunities to China
SA's top 20 export opportunities to China
Product HS code
Product label
5 year average SA exports to
the World
(USD m)
5 year average SA exports to
China
(USD m)
5 year average China imports
from the World
(USD m)
Opportunity
'8704 Trucks, motor vehicles for the transportation of goods 1608 4.4 1225 Expansion
'2710 Petroleum oils, not crude 1446 3.6 27041 Expansion
'0805 Citrus fruit, fresh or dried 807 6.1 109 Expansion
'7208 Flat-rolled products of iron/steel (width>/=600mm),hot-rolled, not clad 536 1.9 2266 Expansion
'2614 Titanium ores and concentrates 518 6.1 430 Expansion
'1005 Maize (corn) 499 0.1 533 Expansion
'0806 Grapes, fresh or dried 448 0.4 260 Expansion
'7308 Structures (rods, angles, plates) of iron and steel not elsewhere specified (n.e.s.) 442 0.6 540 Expansion
'2901 Acyclic hydrocarbons 430 1.1 3773 Expansion
'8474 Machinery for sorting/screening/washing; agglomerating/shaping mineral products
361 5.8 937 Expansion
'8409 Parts for use solely/principally with motor engines 256 2.6 3152 Expansion
'8431 Machinery parts (headings 84.25 to 84.30) 254 2.1 2926 Expansion
'4011 New pneumatic tires, of rubber 236 0.1 603 Expansion
'8413 Pumps for liquids; liquid elevators 228 0.4 3961 Expansion
'2009 Fruit and vegetable juices, unfermented 201 0.9 176 Expansion
'8802 Aircraft, (helicopters, aeroplanes) and spacecraft (satellites) 189 0.1 11260 Expansion
'8429 Self-propelled bulldozers, angledozers, graders, excavators, etc. 187 1.4 2435 Expansion
'2008 Preserved fruits n.e.s 185 1.6 162 Expansion
'3808 Insecticides, fungicides, herbicides packaged for retail sale 172 1.1 427 Expansion
Note: Green shading indicates a product in which SA has a higher revealed comparative advantage relative to the BRICS’ top trading partners.
Source: IDC, compiled from International Trade Centre data
22
Export opportunities for South Africa in other BRICS economies
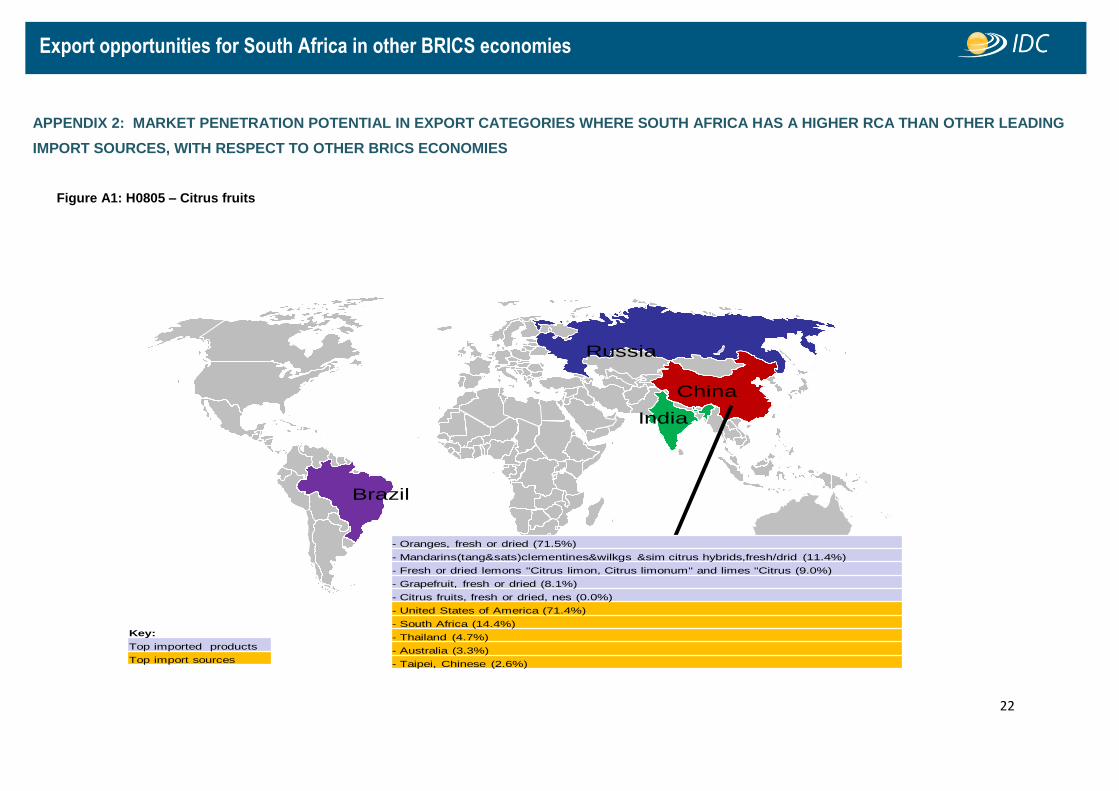
APPENDIX 2: MARKET PENETRATION POTENTIAL IN EXPORT CATEGORIES WHERE SOUTH AFRICA HAS A HIGHER RCA THAN OTHER LEADING
IMPORT SOURCES, WITH RESPECT TO OTHER BRICS ECONOMIES
Figure A1: H0805 – Citrus fruits
Key:
Top imported products
Top import sources
- Oranges, fresh or dried (71.5%)
- Mandarins(tang&sats)clementines&wilkgs &sim citrus hybrids,fresh/drid (11.4%)
- Fresh or dried lemons "Citrus limon, Citrus limonum" and limes "Citrus (9.0%)
- Grapefruit, fresh or dried (8.1%)
- Citrus fruits, fresh or dried, nes (0.0%)
- United States of America (71.4%)
- South Africa (14.4%)
- Thailand (4.7%)
- Australia (3.3%)
- Taipei, Chinese (2.6%)
India
Russia
Brazil
China

23
Export opportunities for South Africa in other BRICS economies
Figure A2: H0806 – Grapes
Key:
Top imported products
Top import sources
- Grapes, fresh (90.2%)
- Grapes, dried (9.8%)
- Chile (47.5%)
- United States of America (34.1%)
- Peru (11.5%)
- South Africa (3.1%)
- Mexico (1.2%)
India
Russia
Brazil
China

24
Export opportunities for South Africa in other BRICS economies
Figure A3: H0808 – Fresh apples, pears and quinces
Key:
Top imported products
Top import sources
- Pears and quinces, fresh (54.3%)
- Apples, fresh (26.2%)
- Pears (19.5%)
- Quinces (0.0%)
- Argentina (72.4%)
- Portugal (11.3%)
- Chile (5.2%)
- United States of America (4.6%)
- Spain (4.1%)
- Apples, fresh (92.0%)
- Pears and quinces, fresh (8.0%)
- China (36.4%)
- United States of America (35.8%)
- Chile (13.7%); RCA=15.8 (SA
RCA=9.7)
- New Zealand (7.2%)
- South Africa (1.8%)
India
Russia
Brazil
China

25
Export opportunities for South Africa in other BRICS economies
Figure A4: H2008 – Preserved fruits not elsewhere specified
Key:
Top imported products
Top import sources
India
Russia
Brazil
China
- Citrus fruits nes,o/w prep or presvd,sugared,sweetened,spirited or not (54.5%)
- Fruits&oth edible pts of plants nes,prep/presvd,sug,sweet/spir/not (14.0%)
- Nuts&seeds nes incl mx,o/w prep o presvd,sugard,sweetend,spiritd o not (11.7%)
- Peaches nes,o/w prep o presvd whether o not sugard,sweetend o spiritd (5.5%)
- Pineapples nes,o/w prep or presvd,sugared,sweetened,spirited or not (5.2%)
- United States of America (41.7%)
- Brazil (12.8%)
- Philippines (7.6%)
- Korea, Republic of (7.3%)
- Thailand (5.9%)

26
Export opportunities for South Africa in other BRICS economies
Figure A5: H2009 - Fruit and vegetable juices
Key:
Top imported products
Top import sources
- Apple juice, unfermented, Brix value > 20 at 20°C, whether or not cont (29.6%)
- Orange juice,unfermentd¬ spiritd,whether not sugard sweet,frozen (17.2%)
- Mixtures of juices unfermentd¬ spiritd whether o not sugard o sweet (14.5%)
- Orange juice&nes,unfermentd not spiritd,whether or not sugard or sweet (7.8%)
- Fruit&veg juice nes (exc mx) unferment unspiritd,whether/not sug/sweet (7.3%)
- China (18.3%)
- Brazil (16.9%)
- Netherlands (13.0%)
- Ukraine (11.3%)
- Israel (9.8%)
India
Russia
Brazil
China

27
Export opportunities for South Africa in other BRICS economies
Figure A6: H2204 - Wine of fresh grapes
Key:
Top imported products
Top import sources
- Grape wines nes,incl fort&grape must,unfermntd by add alc in ctnr</=2l (88.5%)
- Grape wines, sparkling (11.2%)
- Grape wines nes,incl fort&grape must,unfermntd by add alc,in ctnr > 2l (0.3%)
- Grape must nes, unfermented, other than that of heading No 20.09 (0.0%)
- Chile (29.7%); RCA=31.8 (SA RCA=5.24)
- Argentina (21.1%)
- France (14.6%)
- Italy (13.4%)
- Portugal (12.2%)
India
Russia
Brazil
China

28
Export opportunities for South Africa in other BRICS economies
Figure A7: H2601 - Iron ores and concentrates, including roasted iron pyrites
Key:
Top imported products
Top import sources
- Iron ores&concentrates,oth than roasted iron pyrites,non-agglomerated (51.8%)
- Iron ores & concentrates,other than roasted iron pyrites,agglomerated (48.2%)
- Roasted iron pyrites (0.0%)
- Kazakhstan (97.0%); RCA=34.7 (SA RCA=11.5)
- Ukraine (2.9%)
- Sweden (0.1%)
- Iran (Islamic Republic of) (0.0%)
- Brazil (0.0%)
India
Russia
Brazil
China

29
Export opportunities for South Africa in other BRICS economies
Figure A8: H2610 - Chromium ores and concentrates
Key:
Top imported products
Top import sources
- Chromium ores and concentrates (100.0%)
- Kazakhstan (59.4%); RCA=6.0 (SA RCA=11.5)
- Turkey (28.8%)
- South Africa (6.0%)
- Albania (1.8%)
- Germany (1.1%)
India
Russia
Brazil
China
30
Export opportunities for South Africa in other BRICS economies
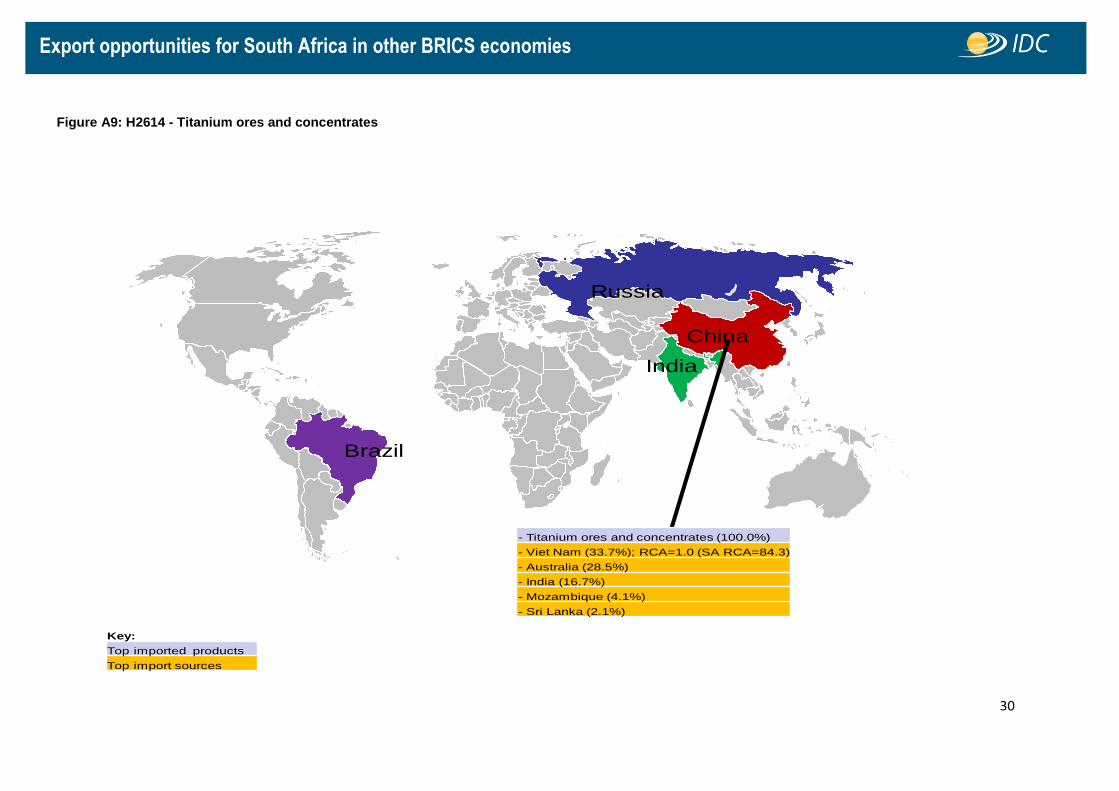
Figure A9: H2614 - Titanium ores and concentrates
Key:
Top imported products
Top import sources
India
Russia
Brazil
China
- Titanium ores and concentrates (100.0%)
- Viet Nam (33.7%); RCA=1.0 (SA RCA=84.3)
- Australia (28.5%)
- India (16.7%)
- Mozambique (4.1%)
- Sri Lanka (2.1%)

31
Export opportunities for South Africa in other BRICS economies
Figure A10: H2701 - Coal; briquettes, ovoids and similar solid fuels manufactured from coal
Key:
Top imported products
Top import sources
India
Russia
Brazil
China
- Coal nes, whether or not pulverised but not agglomerated (52.2%)
- Bituminous coal, whether or not pulverised but not agglomerated (44.3%)
- Anthracite, whether or not pulverised but not agglomerated (3.5%)
- Coal briquettes, ovoids and similar manufactured solid fuels (0.0%)
- Kazakhstan (60.1%); RCA=18.9 (SA RCA=11.1)
- United States of America (34.7%)
- Ukraine (3.5%)
- Colombia (1.4%)
- Mongolia (0.1%)

32
Export opportunities for South Africa in other BRICS economies
Figure A11: H2712 - Petroleum jelly; mineral waxes and similar products
Key:
Top imported products
Top import sources
India
Russia
Brazil
China
- Paraffin wax containing by weight less than 0.75% of oil (60.8%)
- Mineral waxes nes and similar products obtained by synthesis etc (38.0%)
- Petroleum jelly (1.2%)
- China (25.0%)
- Iran (Islamic Republic of) (24.7%)
- United Arab Emirates (11.5%)
- United States of America (6.8%)
- Germany (5.2%)

33
Export opportunities for South Africa in other BRICS economies
Figure A12: H2809 - Diphosphorus pentaoxide; phosphoric acid and polyphosphoric acids
Key:
Top imported products
Top import sources
India
Russia
Brazil
China
- Phosphoric acid and polyphosphoric acids (99.6%)
- Diphosphorus pentaoxide (0.4%)
- Morocco (70.3%); RCA=140.6 (SA RCA=14.7)
- United States of America (21.9%)
- China (3.4%)
- Korea, Republic of (1.6%)
- Belgium (1.0%)

34
Export opportunities for South Africa in other BRICS economies
Figure A13: H2901 - Acyclic hydrocarbons
Key:
Top imported products
Top import sources
India
Russia
Brazil
China
- Propene (propylene) (52.4%)
- Ethylene (30.6%)
- Buta-1, 3-diene and isoprene (11.6%)
- Saturated acyclic hydrocarbons (2.3%)
- Unsaturated acyclic hydrocarbons nes (2.1%)
- Korea, Republic of (45.7%); RCA=7.2 (SA
RCA=3.8)
- Japan (20.8%)
- Taipei, Chinese (17.2%)
- Iran (Islamic Republic of) (2.4%)
- United States of America (1.8%)
- Unsaturated acyclic hydrocarbons nes (39.1%)
- Saturated acyclic hydrocarbons (22.6%)
- Butene (butylene) and isomers thereof (19.6%)
- Ethylene (15.7%)
- Buta-1, 3-diene and isoprene (2.5%)
- United States of America (16.8%)
- Saudi Arabia (10.9%)
- Singapore (10.7%)
- Qatar (9.6%)
- Korea, Republic of (7.3%)

35
Export opportunities for South Africa in other BRICS economies
Figure A14: H2905 - Acyclic alcohols and their derivatives
Key:
Top imported products
Top import sources
India
Russia
Brazil
China
- Methanol (methyl alcohol) (34.5%)
- Ethylene glycol (ethanediol) (19.2%)
- Saturated monohydric acyclic alcohols nes (9.4%)
- Butan-1-ol (N-butyl alcohol) (8.5%)
- Diols nes (5.8%)
- United States of America (26.9%)
- Chile (25.9%)
- Argentina (8.7%)
- Germany (8.5%)
- Venezuela (7.6%)
- Glycerol (26.9%)
- D-glucitol (sorbitol) (21.2%)
- Propylene glycol (propane-1,2-diol) (15.0%)
- Ethylene glycol (ethanediol) (14.4%)
- Propan-1-ol(propyl alcohol)and propan-2ol(isopropyl alcohol) (6.7%)
- Germany (25.5%)
- France (19.6%)
- Saudi Arabia (10.9%)
- China (8.2%)
- Netherlands (5.1%)
36
Export opportunities for South Africa in other BRICS economies
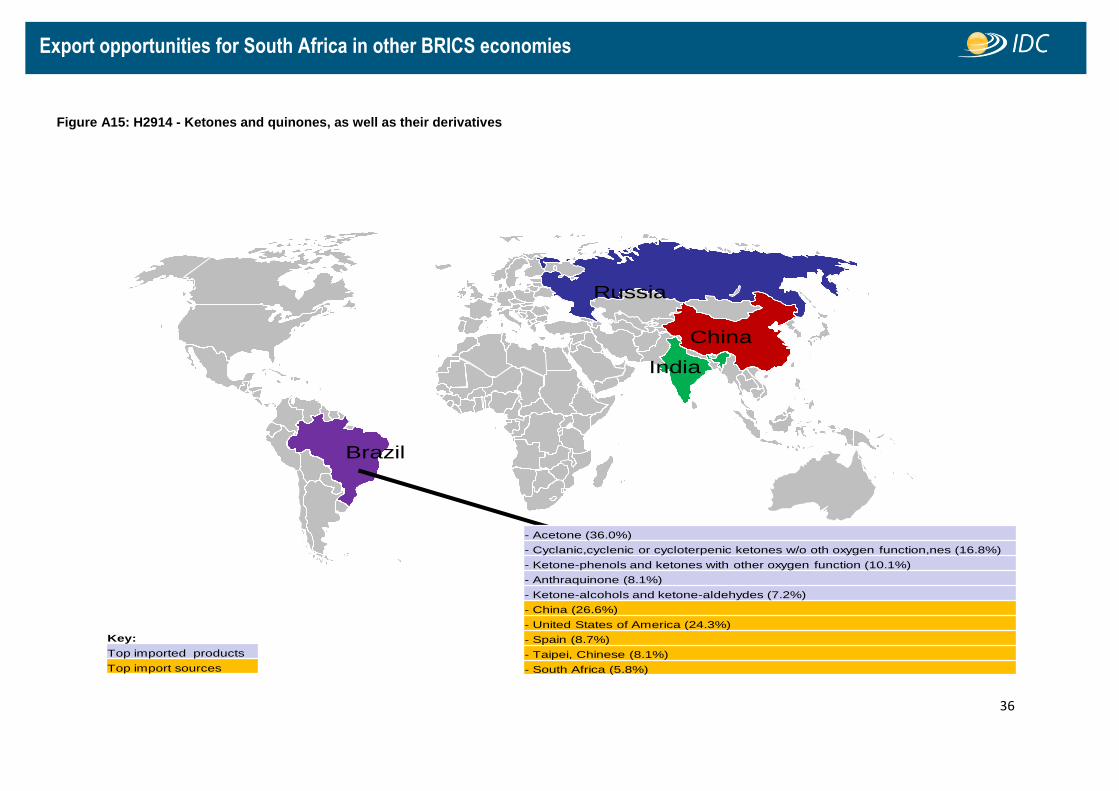
Figure A15: H2914 - Ketones and quinones, as well as their derivatives
Key:
Top imported products
Top import sources
India
Russia
Brazil
China
- Acetone (36.0%)
- Cyclanic,cyclenic or cycloterpenic ketones w/o oth oxygen function,nes (16.8%)
- Ketone-phenols and ketones with other oxygen function (10.1%)
- Anthraquinone (8.1%)
- Ketone-alcohols and ketone-aldehydes (7.2%)
- China (26.6%)
- United States of America (24.3%)
- Spain (8.7%)
- Taipei, Chinese (8.1%)
- South Africa (5.8%)

37
Export opportunities for South Africa in other BRICS economies
Figure A16: H7202 - Ferro-alloys
Key:
Top imported products
Top import sources
India
Russia
Brazil
China
- Ferro-silico-manganese (62.3%)
- Ferro-manganese, containing by weight more than 2% of carbon (10.0%)
- Ferro-niobium (8.4%)
- Ferro-silicon, containing by weight more than 55% of silicon (5.8%)
- Ferro-alloys, nes (4.0%)
- Ukraine (38.1%); RCA=26.8 (SA RCA=31.7)
- China (13.0%)
- Germany (7.2%)
- Kazakhstan (6.6%)
- Korea, Republic of (4.1%)

38
Export opportunities for South Africa in other BRICS economies
Figure A17: H7308 - Structures (rods, angles, plates) of iron and steel not elsewhere specified
Key:
Top imported products
Top import sources
India
Russia
Brazil
China
- Structures&parts of structures,i/s (ex prefab bldgs of headg no.9406) (54.7%)
- Props&similar equipment for scaffolding,shutterg/pit-propping,i/s (21.8%)
- Towers and lattice masts, iron or steel (18.7%)
- Doors,windows & their frames & thresholds for doors of iron or steel (3.9%)
- Bridges and bridge sections, iron or steel (0.9%)
- China (25.2%)
- Spain (14.1%)
- Germany (13.0%)
- Korea, Republic of (6.3%)
- France (4.7%)
- Structures&parts of structures,i/s (ex prefab bldgs of headg no.9406) (87.4%)
- Doors,windows & their frames & thresholds for doors of iron or steel (8.8%)
- Props&similar equipment for scaffolding,shutterg/pit-propping,i/s (2.3%)
- Bridges and bridge sections, iron or steel (1.2%)
- Towers and lattice masts, iron or steel (0.4%)
- Korea, Republic of (23.7%)
- Japan (18.3%)
- Germany (14.8%)
- United States of America (9.2%)
- France (7.2%)
- Structures&parts of structures,i/s (ex prefab bldgs of headg no.9406) (76.4%)
- Towers and lattice masts, iron or steel (15.3%)
- Doors,windows & their frames & thresholds for doors of iron or steel (4.1%)
- Props&similar equipment for scaffolding,shutterg/pit-propping,i/s (3.1%)
- Bridges and bridge sections, iron or steel (1.2%)
- China (38.2%)
- Malaysia (15.2%)
- Korea, Republic of (8.9%)
- Indonesia (7.1%)
- United Arab Emirates (4.8%)
- Structures&parts of structures,i/s (ex prefab bldgs of headg no.9406) (58.8%)
- Doors,windows & their frames & thresholds for doors of iron or steel (26.2%)
- Props&similar equipment for scaffolding,shutterg/pit-propping,i/s (7.8%)
- Towers and lattice masts, iron or steel (6.1%)
- Bridges and bridge sections, iron or steel (1.0%)
- China (25.6%)
- Germany (16.8%)
- Ukraine (12.1%)
- Poland (5.4%)
- Turkey (3.8%)

39
Export opportunities for South Africa in other BRICS economies
Figure A18: H7606 - Aluminium plates, sheets and strip, of a thickness exceeding 0.2 mm
Key:
Top imported products
Top import sources
India
Russia
Brazil
China
- Plate, sheet or strip, aluminium alloy, exceeding 0.2mm thick, nes (36.0%)
- Plate,sheet or strip,aluminium alloy,rect or sq,exceeding 0.2mm thick (32.7%)
- Plate,sheet or strip,aluminium,not alloyd,rect or sq,exceedg 0.2mm thk (23.4%)
- Plate,sheet or strip,aluminium,not alloyed,exceeding 0.2mm thick,nes (7.8%)
- China (35.0%)
- Germany (15.6%)
- Bahrain (9.4%)
- Korea, Republic of (7.4%)
- United Kingdom (5.3%)
- Plate,sheet or strip,aluminium alloy,rect or sq,exceeding 0.2mm thick (79.5%)
- Plate,sheet or strip,aluminium,not alloyd,rect or sq,exceedg 0.2mm thk (18.3%)
- Plate,sheet or strip,aluminium,not alloyed,exceeding 0.2mm thick,nes (1.2%)
- Plate, sheet or strip, aluminium alloy, exceeding 0.2mm thick, nes (1.0%)
- Germany (37.7%)
- China (27.6%)
- Italy (9.1%)
- Serbia (5.2%)
- Spain (3.4%)

40
Export opportunities for South Africa in other BRICS economies
Figure A19: H8474 - Machinery for sorting/screening/washing; agglomerating/shaping mineral products
Key:
Top imported products
Top import sources
India
Russia
Brazil
China
- Crushing/grindg machines for earth/ stone/ores o oth minerals subs etc (40.8%)
- Pts of sortg/screeng/mixg/crushg/grinding/washing/agglomeratg mach etc (26.3%)
- Mach f agglomeratg mineral fuels,mach f foundry moulds of sand etc nes (14.9%)
- Sorting/screening/separatg or washg mach for stone/ores or oth min etc (9.7%)
- Mixg or kneadg machines nes for earth or other mineral substances etc (5.3%)
- Germany (18.0%)
- China (17.1%)
- United States of America (16.5%)
- Italy (10.8%)
- United Kingdom (5.7%)
- Crushing/grindg machines for earth/ stone/ores o oth minerals subs etc (30.8%)
- Mach f agglomeratg mineral fuels,mach f foundry moulds of sand etc nes (26.0%)
- Pts of sortg/screeng/mixg/crushg/grinding/washing/agglomeratg mach etc (17.0%)
- Sorting/screening/separatg or washg mach for stone/ores or oth min etc (14.6%)
- Mixg or kneadg machines nes for earth or other mineral substances etc (9.0%)
- Germany (28.4%)
- United States of America (13.4%)
- Japan (12.5%)
- United Kingdom (5.8%)
- France (5.4%)
- Pts of sortg/screeng/mixg/crushg/grinding/washing/agglomeratg mach etc (30.4%)
- Crushing/grindg machines for earth/ stone/ores o oth minerals subs etc (25.8%)
- Mach f agglomeratg mineral fuels,mach f foundry moulds of sand etc nes (20.2%)
- Sorting/screening/separatg or washg mach for stone/ores or oth min etc (12.5%)
- Mixg or kneadg machines nes for earth or other mineral substances etc (5.8%)
- China (26.1%)
- Germany (20.8%)
- United Kingdom (8.2%)
- United States of America (6.6%)
- Italy (5.3%)
- Crushing/grindg machines for earth/ stone/ores o oth minerals subs etc (35.8%)
- Mach f agglomeratg mineral fuels,mach f foundry moulds of sand etc nes (23.6%)
- Concrete or mortar mixers (10.7%)
- Sorting/screening/separatg or washg mach for stone/ores or oth min etc (9.4%)
- Machines for mixing mineral substances with bitumen (8.1%)
- Germany (30.8%)
- China (13.3%)
- Italy (7.8%)
- Ukraine (6.0%)
- Finland (5.9%)
41
Export opportunities for South Africa in other BRICS economies
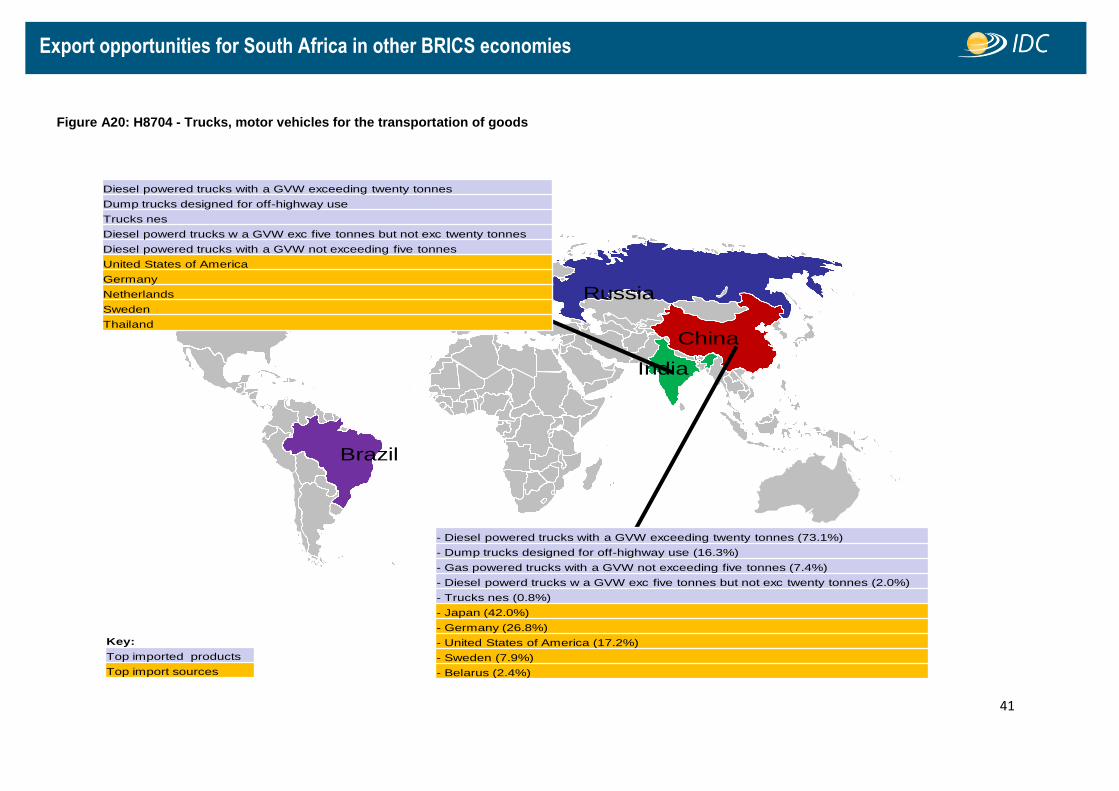
Figure A20: H8704 - Trucks, motor vehicles for the transportation of goods
Key:
Top imported products
Top import sources
Diesel powered trucks with a GVW exceeding twenty tonnes
Dump trucks designed for off-highway use
Trucks nes
Diesel powerd trucks w a GVW exc five tonnes but not exc twenty tonnes
Diesel powered trucks with a GVW not exceeding five tonnes
United States of America
Germany
Netherlands
Sweden
Thailand
India
Russia
Brazil
China
- Diesel powered trucks with a GVW exceeding twenty tonnes (73.1%)
- Dump trucks designed for off-highway use (16.3%)
- Gas powered trucks with a GVW not exceeding five tonnes (7.4%)
- Diesel powerd trucks w a GVW exc five tonnes but not exc twenty tonnes (2.0%)
- Trucks nes (0.8%)
- Japan (42.0%)
- Germany (26.8%)
- United States of America (17.2%)
- Sweden (7.9%)
- Belarus (2.4%)

Compiled by:
Department of Research and Information
Industrial Development Corporation of South Africa Limited
PO Box 784055, Sandton, 2146, Gauteng, South Africa
For further assistance or information contact:
Department of Research and Information
Tel: +27 11 269 3454 (Dianne Rymer)
Email: [email protected]
IDC Head Office:
19 Fredman Drive, Sandown, 2196
PO Box 784055, Sandton, 2146, South Africa
Tel: +27 11 269 3000
Fax: +27 11 269 3116
Call Centre: 0860 693 888
Email: [email protected]
Website: www.idc.co.za
Although every care is taken to ensure the accuracy of this publication, supplements, updates and replacement material, the authors, editors, publishers and printers do not accept responsibility for any act, omission, loss or damage or the consequences thereof, occasioned by a reliance
by any person upon the contents hereof.