export operations & compliance benchmark report: a … · ex e cutiv e summary eport operations...
TRANSCRIPT

In partnership with:
Sponsored by:
Published September 2013
Written By:
Julie Gibbs
Director
BPE Global
Eric Johnson
Research Director
American Shipper
Export Operations & Compliance Benchmark Report: A Place at the Strategic Table
Ex
Ec
ut
ivE
Su
mm
ar
y
Export Operations & Compliances | Benchmark Report: 2013
ii
Executive Summary
Regulatory agencies are bearing down on exporters, both at origin and destination, while there’s a growing need to align compliance and logistics operations functions in the export process. All this means export teams need to be involved early and significantly in discussions about new products, new markets, or new acquisitions.
These issues are explained in American Shipper’s fourth annual bench-mark study covering U.S. export operations and compliance, which is produced in partnership with BPE Global and the International Compliance Professionals Association (ICPA). The theme this year is gauging the extent to which export teams have a place at a strategic table. The report also sheds light on the broader regulatory issues exporters are wrestling with and the value of technology solutions designed to support them.
Of the 262 respondents to participate in this year’s study, many find themselves excluded from key strategic considerations, despite the ramifications that presents to an export program. Not involving both compliance and operations resources in early discussions about new markets or new product development can leave those exporters vulner-able to unseen costs or worse, like export violations. While this report gauges perspective on some the key ongoing issues facing exporters, it’s the findings revolving around strategic input from exporters that is particularly compelling.
Looking back over four years of data, export compliance and operations teams don’t seem to be making inroads towards involving themselves in key strategic discussions. It appears those companies that consider it important to involve export staff continue to do so, and those that don’t, don’t. What’s clear, though, is that when export teams are not included in strategic discussions, it can create unneeded cost and risk in the exporting process due to unknown requirements regarding classification, licensing, controlled technologies, sanctions, and government reporting.

Ex
Ec
ut
ivE
Su
mm
ar
y
Export Operations & Compliances | Benchmark Report: 2013
iii
More than 40 percent of respondents, meanwhile, say they are never or rarely included in discussions about new markets. Not including export teams in these discussions opens up areas of risk for shippers. The export of certain products could be prohibited in those identified markets, they could require licenses, or there could be unforeseen import restrictions or requirements in the destination countries.
A continuing trend tracked across American Shipper’s benchmark research is the level of Integration between global trade management and transportation management systems. This study finds that integra-tion remains a low priority for most respondents. Of those who have not already integrated the two platforms, the preponderance say they have no plans to do so. Hardly any, whether EAR or ITAR shippers, plan to do it in the next year. Indeed, this seemingly crucial integration seems to permanently reside in many companies’ mid-term plans. That said, it is more important in general to ITAR respondents to integrate their TMS and GTM platforms. The sensitive nature of ITAR products makes shipment tracking in conjunction with tracking compliance activities more necessary.
There was an expectation that ITAR shippers would link their training programs to job functions (a clear best practice) more often than EAR shippers. But that is not the case. In fact, respondents with no ITAR requirements report employing this best practice nearly 40 percent more than those with some ITAR component. What’s more, it’s some-what shocking that 15 percent of companies with some ITAR burden have no training program. This clearly leaves them open to risk for violations.
This year’s report also includes an expanded list of suggested best practices for exporters, with more depth about how exporters can communicate better and be more responsive.
training
technology
Best Practices

ta
Bl
E o
f c
on
tE
nt
S
Export Operations & Compliances | Benchmark Report: 2013
2
Table of Contents
Executive Summary .............................................................................................................................................................. ii
> Training ........................................................................................................................................................................ iii
> Best practices.............................................................................................................................................................. iii
Section I: Introduction ...........................................................................................................................................................6
> Background, Methodology, and Timeframe .................................................................................................................6
> Terminology ..................................................................................................................................................................7
> Regulatory Agencies, Regulations and their Acronyms: ..............................................................................................7
> Hypotheses ..................................................................................................................................................................9
Section II: Demographics ....................................................................................................................................................10
Section III: Export Operations & Compliance Management ...............................................................................................12
Section IV: Export Strategic Considerations .............................................................................................................................16
Section V: Regulatory Impacts on Exporters ......................................................................................................................21
Section VI: Export Operations & Compliance Technology ..................................................................................................23
Section VII: Best Practices ...................................................................................................................................................31
Appendix A: About Our Sponsors .......................................................................................................................................32
> Amber Road ...............................................................................................................................................................32
Appendix B: About Our Partners .........................................................................................................................................33
> BPE GLobal ................................................................................................................................................................33
> International Compliance Professionals Association .................................................................................................33
Appendix C: About American Shipper Research ................................................................................................................34

ta
Bl
E o
f c
on
tE
nt
S
Export Operations & Compliances | Benchmark Report: 2013
3
Figures
f i G u r E 1 : Industry Segments Represented ..............................................................................................................10
f i G u r E 2 : Company Size ...........................................................................................................................................10
f i G u r E 3 : Job Title ....................................................................................................................................................11
f i G u r E 4 : Percentage of Revenue From Exports ......................................................................................................11
f i G u r E 5 : Exporter’s Productivity Table ....................................................................................................................12
f i G u r E 6 : Scope of Export Manager’s Responsibilities ............................................................................................13
f i G u r E 7 : Top Export Concerns—Company Size .....................................................................................................14
f i G u r E 8 : Export Operations and Compliance Reports To .......................................................................................15
f i G u r E 9 : Is Product Classification Considered in R&D or Planning Stages? ..........................................................16
f i G u r E 1 0 : Is an Export Management System a Strategic investment? ..................................................................17
f i G u r E 1 1 : Export Related Training—EAR vs. ITAR ................................................................................................18
f i G u r E 1 2 : Inclusion in Strategic Discussions—2010-2013 ....................................................................................19
f i G u r E 1 3 : Inclusion in New Market Discussions ....................................................................................................20
f i G u r E 1 4 : Exporter’s Productivity Table: EAR vs. ITAR .........................................................................................21
f i G u r E 1 5 : Effectiveness of Licensing Agencies .....................................................................................................21
f i G u r E 1 6 : Perceived Areas of Highest Risk ...........................................................................................................22
f i G u r E 1 7 : GTM Platform —EAR vs. ITAR................................................................................................................23
f i G u r E 1 8 : GTM Platform—2010-2013....................................................................................................................24
f i G u r E 1 9 : Export System Delivery Model...............................................................................................................25
f i G u r E 2 0 : Plans to Integrate GTM and TMS—EAR vs. ITAR .................................................................................26
f i G u r E 2 1 : Current Functionality—EAR vs. ITAR.....................................................................................................27
f i G u r E 2 2 : Current Functionality—Company Size...................................................................................................28
f i G u r E 2 3 : Planned Functionality—All Shippers ......................................................................................................29
f i G u r E 2 4 : Inhibitors to Investment in Systems .......................................................................................................30
f i G u r E 2 5 : Plans to Buy a System ...........................................................................................................................30
SE
ct
ion
i:
int
ro
du
ct
ion
Export Operations & Compliances | Benchmark Report: 2013
4
Section I: Introduction
B a c K G r o u n d , m E t H o d o l o G y, a n d t i m E f r a m E
Welcome to the fourth annual benchmark study covering U.S. export operations and compliance produced by American Shipper in partner-ship with BPE Global and the International Compliance Professionals Association (ICPA). The study includes input from 262 U.S.-based exporters, with responses gathered between July 24 and Aug. 27, 2013. The 30-question survey covered export regulatory reform, operations management practices, organizational structure, compliance policies and strategic considerations, and export management technology.
The theme of this year’s study centers on bringing export functions into the strategic decision-making process of shippers. With regulatory agencies bearing down on exporters, both at origin and destination, and with a growing need to align compliance and logistics operations functions, export teams need to be involved early and significantly in discussions about new products, new markets, or new acquisitions. This report seeks to shed some light on the issues exporters are wrestling with and the value of technology solutions designed to support them.
Survey distribution channels included American Shipper’s subscriber database, BPE Global’s e-mail database, and the ICPA membership. Qualified respondents are limited to those companies exporting goods, services or technology (so-called “deemed” exports) from the United States. This includes freight forwarders, third-party logistics providers, non-vessel-operating common carriers, and other intermediaries, in addition to shippers from all segments. Carriers and other non-qualified responses are not included in the aggregate data sourced for this report.
SE
ct
ion
i:
int
ro
du
ct
ion
Export Operations & Compliances | Benchmark Report: 2013
5
t E r m i n o l o G y
In the interest of being succinct and direct this study uses several terms or acronyms you may not be familiar with. The following explanations and definitions should be kept in mind when reviewing the study results.
• Automated vs. Manual Exporters—For the purposes of this report the term “automated” does not mean a task is managed without human input. Instead, automated export management means a company is employing a substantial amount of technology to support its export operation, allowing staff to interact where necessary to solve problems and optimize the process. Similarly, the term “manual” does not mean the process is managed without the use of computers, Internet access, or other fundamental business tools. It’s assumed that companies managing exports manually employ spreadsheets and other support tools.
• Full Time Equivalent (FTE)—The number of working hours that represents a single full-time employee during a fixed period of time, such as one month or a year.
• Global Trade Management (GTM)—Global Trade Management is the practice of streamlining the entire lifecycle of global trade across order, logistics, compliance, and settlement activities to significantly improve operating efficiencies and cash flow while reducing risk. GTM includes, but is not limited to, trade compli-ance, visibility to shipments, total landed cost, trade security, and trade finance.
r E G u l at o ry a G E n c i E S , r E G u l at i o n S a n d
t H E i r a c r o n y m S :
• Automated Export System (AES)—System used by U.S. exporters or their freight forwarders to file documentation electronically with U.S. Customs and Border Protection.
• Bureau of Industry and Security (BIS)—The Bureau of Industry and Security (BIS) is an agency of the U.S. Department of Commerce and its mission is to advance U.S. national security, foreign policy, and economic objectives by ensuring an effective export control and treaty compliance system and promoting continued U.S. strategic technology leadership. BIS is led by the department’s undersecretary for industry and security.

SE
ct
ion
i:
int
ro
du
ct
ion
Export Operations & Compliances | Benchmark Report: 2013
6
• Census Bureau Foreign Trade Division—The Census Bureau’s Foreign Trade Division, which is an agency of the U.S. Commerce Department, compiles the nation’s export and import statistics and is responsible for issuing regulations governing the reporting of all export shipments from the United States.
• Commodity Classification Automated Tracking System (CCATS)—Code assigned by the Bureau of Industry and Security to products governed by the Export Administration Regulations.
• Directorate of Defense Trade Controls (DDTC)—Under the U.S. State Department, the Directorate of Defense Trade Controls is charged with controlling the export and temporary import of defense articles and defense services covered by the U.S. Munitions List (USML).
• Export Administration Regulations (EAR)—The EAR is issued by the U.S. Commerce Department’s Bureau of Industry and Security under laws relating to the control of certain exports, re-exports, and activities, known as dual-use commodities (Title 15 of the Code of Federal Regulations Parts 730 through 774). Dual-use commodities can be used for both commercial and military applications.
• Export Control Classification Number (ECCN)—A code issued by the Bureau of Industry and Security that defines the level of export control for items exported from the United States and other member states of the Wassenaar Arrangement.
• International Traffic In Arms Regulations (ITAR)—These are the U.S. State Department’s export control regulations for defense-related articles and services.
• Office of Foreign Assets Control (OFAC)—The Office of Foreign Assets Control (OFAC) of the U.S. Treasury Department administers and enforces economic and trade sanctions based on U.S. foreign policy and national security goals against targeted foreign countries and regimes, terrorists, international narcotics traffickers, those engaged in activities related to the proliferation of weapons of mass destruction, and other threats to the national security, foreign policy or economy of the United States.

SE
ct
ion
i:
int
ro
du
ct
ion
Export Operations & Compliances | Benchmark Report: 2013
7
H y P o t H E S E S
American Shipper approaches each benchmarking exercise with a set of assumptions to prove or disprove. In the case of this study these include:
1. Training: There was an expectation that shippers with an ITAR requirements would link their training programs to job functions (a clear best practice) more often than EAR-only shippers. But that is not the case. As Fig. 11 shows, respondents with no ITAR requirements report employing this best practice nearly 40 percent more than those with some ITAR component.
2. New markets: There was an expectation that not all shippers would include their export teams in the strategic discussion of new markets, and this was borne out in Fig. 13, where more than 40 percent of respondents said they are infrequently or never consulted in such discussions.
3. GTM-TMS integration: Given the sensitive nature of ITAR products, it was expected that ITAR shippers would be far more eager to integrate their GTM and TMS platforms so that shipment tracking is handled in conjunction with tracking compliance activities. While a larger number of ITAR respondents did indicate they have already integrated versus all EAR shippers, those that haven’t are only marginally more inclined to do so, as Fig. 20 shows.
SE
ct
ion
ii:
dE
mo
Gr
aP
Hic
S
Export Operations & Compliances | Benchmark Report: 2013
8
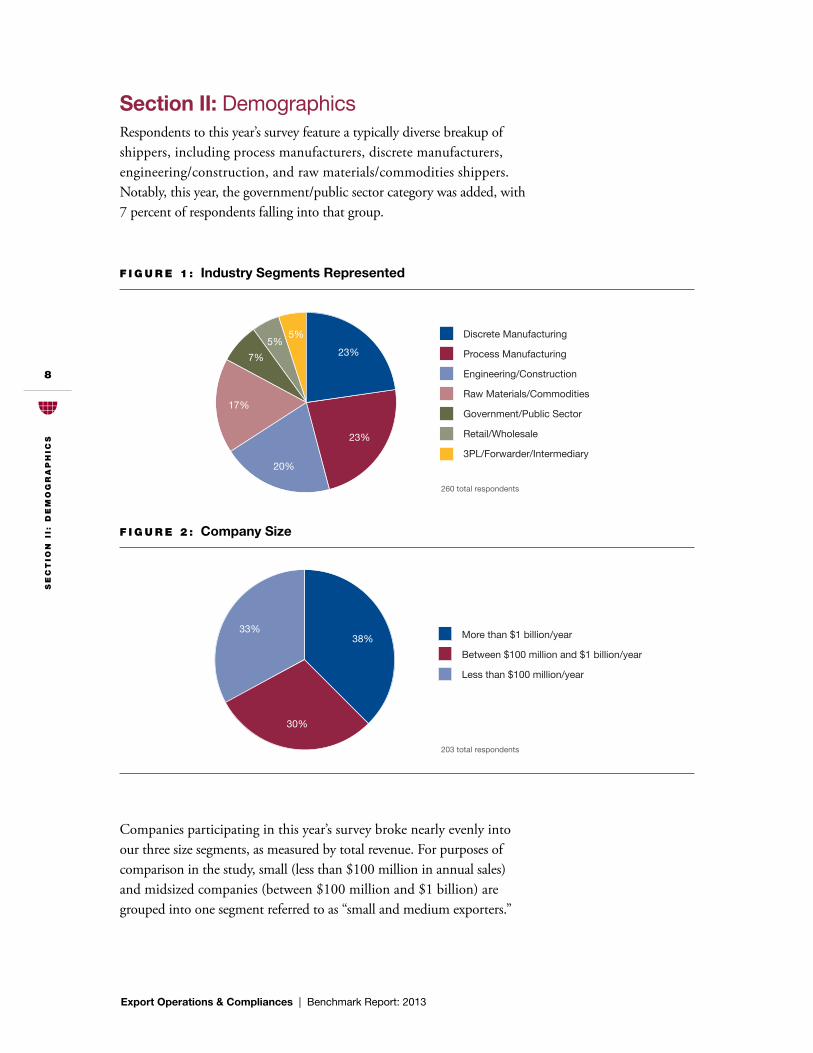
Section II: DemographicsRespondents to this year’s survey feature a typically diverse breakup of shippers, including process manufacturers, discrete manufacturers, engineering/construction, and raw materials/commodities shippers. Notably, this year, the government/public sector category was added, with 7 percent of respondents falling into that group.
Discrete Manufacturing
Process Manufacturing
Engineering/Construction
Raw Materials/Commodities
Government/Public Sector
Retail/Wholesale
3PL/Forwarder/Intermediary
5%
7%5%
17%
23%
23%
20%
More than $1 billion/year
Between $100 million and $1 billion/year
Less than $100 million/year
33%38%
30%
f i G u r E 1 : Industry Segments Represented
260 total respondents
203 total respondents
f i G u r E 2 : Company Size
Companies participating in this year’s survey broke nearly evenly into our three size segments, as measured by total revenue. For purposes of comparison in the study, small (less than $100 million in annual sales) and midsized companies (between $100 million and $1 billion) are grouped into one segment referred to as “small and medium exporters.”

SE
ct
ion
ii:
dE
mo
Gr
aP
Hic
S
Export Operations & Compliances | Benchmark Report: 2013
9
As is typical in this study, the majority of respondents this year are at the manager level. On the whole, trade compliance continues to be perceived as the responsibility of those below the executive level or C-level.
Manager
Director
Staff/Analyst
Executive (MD, VP, EVP, SVP)
C-Level (CEO, CFO, CIO, etc)
4%
18%
7%
52%
19%
0-25%
25-50%
50-75%
75-100%
19%
8%
45%
29%
f i G u r E 3 : Job Title
165 total respondents
201 total respondents
f i G u r E 4 : Percentage of Revenue From Exports
Exports as a percentage of respondents’ revenue changed little from last year. There was a marginal increase in those shippers for whom exports now account for 25 to 50 percent of revenue, and a corresponding drop in those for whom exports account for less than 25 percent.

SE
ct
ion
iii
: E
xP
or
t o
PE
ra
tio
nS
& c
om
Pl
ian
cE
ma
na
GE
mE
nt
Export Operations & Compliances | Benchmark Report: 2013
10
Section III: Export Operations & Compliance ManagementRespondents to this year’s survey report increased headcount compared to a year ago, while they also are processing fewer licenses than last year. That jives with BIS data, which shows the agency received 7 percent fewer licensing requests in 2012 than in 2011. A possible explanation for the increase in headcount is that respondents report their roles now include wider global responsibilities (as seen in greater detail in Fig. 6). Greater global responsibility can be precipitated by a shipper entering new markets, causing complexity in license determination or other regulatory requirements.
Export practitioners at small and medium shippers surveyed tend to have responsibility for more countries per FTE than do large shippers. It’s likely the country mix for small and medium shippers is less onerous, requiring less headcount. The same goes for discrete manufacturers versus process manufacturers. Discrete manufacturers tend to have more complex supply chains, coordinating semi-finished components from multiple countries, as compared to process manufacturers.
165 total respondents
f i G u r E 5 : Exporter’s Productivity Table
Countries FTEBIS-Snap- R/Year DDTC/Year OFAC/Year
Large Shippers 41.1 11.4 6.1 4 0.8
Small/Medium Shippers 27.9 3.6 1.4 1.9 0.3
Discrete Manufacturers 32.5 5.5 4.9 4.2 0.4
Process Manufactuters 41.8 9.4 3.9 1.7 0.3
Retail/Wholesale 31.6 6.6 1.6 1.1 0.2

SE
ct
ion
iii
: E
xP
or
t o
PE
ra
tio
nS
& c
om
Pl
ian
cE
ma
na
GE
mE
nt
Export Operations & Compliances | Benchmark Report: 2013
11
As mentioned earlier, respondents this year report greater global responsi-bility than in last year’s study. Larger shippers have a greater tendency to entrust their export operations and compliance staff with global roles than their small/medium counterparts, in part because they tend to export to more countries and have greater licensing burdens.
f i G u r E 6 : Scope of Export Manager’s Responsibilities
206 total respondents
Global
Exports from US
Exports from Americas
Exports from N. America
Other
0%
10%
20%
30%
40%
50%
60%
70%
80%
90%
100%
Small/Medium ShippersLarge Shippers4%
6%7%
23%
61%
24%
10%
7%
54%
3%

SE
ct
ion
iii
: E
xP
or
t o
PE
ra
tio
nS
& c
om
Pl
ian
cE
ma
na
GE
mE
nt
Export Operations & Compliances | Benchmark Report: 2013
12
Fig. 7 highlights the varying priorities for large shippers respondents versus their small and medium counterparts. Small and medium shippers said they are most concerned with direct costs, such as service levels and shipping fees, and indirect costs, such as delays at customs. Large shippers, on the other hands, said they are most concerned with the overall cost of compliance and the increase in enforcement, both in the United States and at destination.
Both remain concerned with the economic climate. Perhaps the increase in headcount among respondents is intended to handle an increase in manual or spreadsheet-based workload. In lieu of investing in the compliance automation, respondents may very well find they can justify increased headcount. It’s often simpler to grow and downsize staff than invest in a system.
f i G u r E 7 : Top Export Concerns—Company Size
0% 10% 20% 30% 40% 50%
Port labordisruption impacts
Chassis management/ownership
Carrier consolidation
Impact of rapidly changingvessel schedules
Carrier capacity withdrawal
Political unrest
Extended transit times
Lack of optimizationtechnology
Increasing rates
Changing sourcingorigins/trade lanes
Potential increase inexport enforcement
Delays at Customs
Increased importenforcement at destination
Economic climate
Low staffing levelsrelative to volume
Increasing cost of compliance 46% 28% 29% 25% 27% 27% 27% 19% 26% 33% 24% 19% 21% 16% 18% 27% 17% 10% 12% 15% 9% 7% 8% 9% 8% 6% 5%2% 5%2% 3% 8%
Large Shippers
Small & Medium Shippers
89 total respondents
SE
ct
ion
iii
: E
xP
or
t o
PE
ra
tio
nS
& c
om
Pl
ian
cE
ma
na
GE
mE
nt
Export Operations & Compliances | Benchmark Report: 2013
13
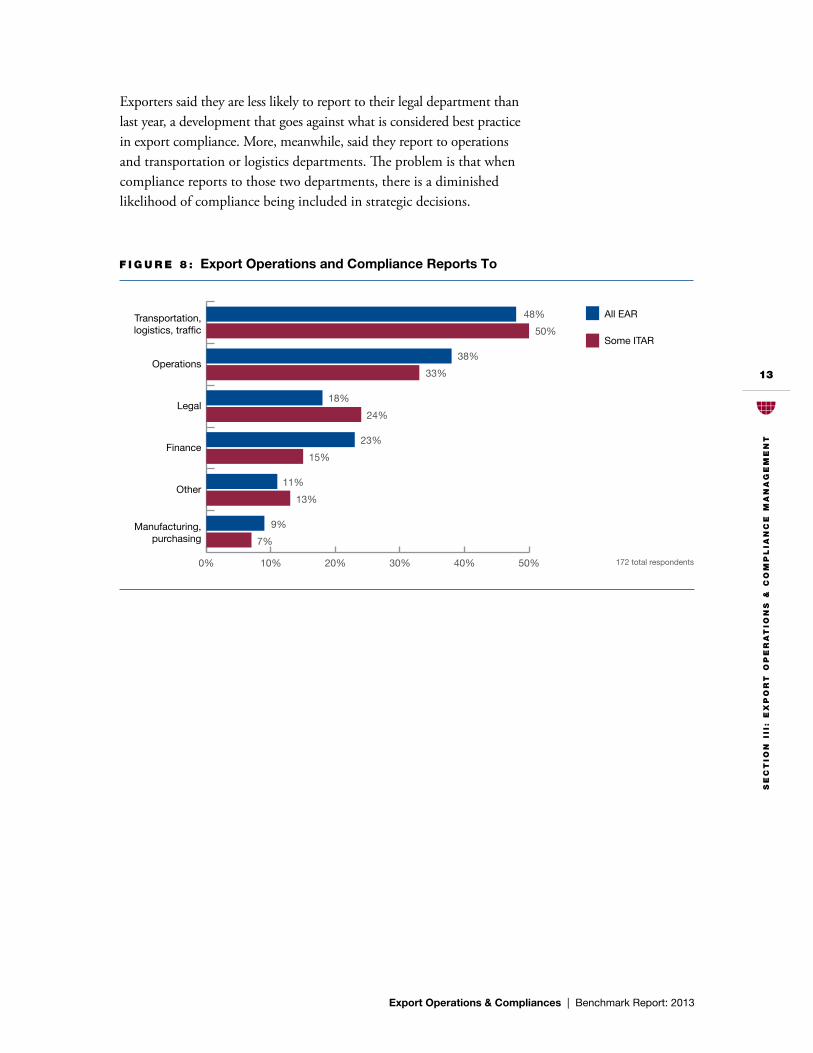
Exporters said they are less likely to report to their legal department than last year, a development that goes against what is considered best practice in export compliance. More, meanwhile, said they report to operations and transportation or logistics departments. The problem is that when compliance reports to those two departments, there is a diminished likelihood of compliance being included in strategic decisions.
f i G u r E 8 : Export Operations and Compliance Reports To
0% 10% 20% 30% 40% 50%
Manufacturing,purchasing
Other
Finance
Legal
Operations
Transportation,logistics, traffic
All EAR
Some ITAR
48% 50%
38% 33%
18% 24%
23% 15%
11% 13%
9%7%
172 total respondents

SE
ct
ion
iv
: E
xP
or
t S
tr
at
EG
ic c
on
Sid
Er
at
ion
S
Export Operations & Compliances | Benchmark Report: 2013
14
Section IV: Export Strategic ConsiderationsThis section attempts to gauge the extent to which export compliance and operations practitioners are involved at a strategic level in decisions made by their companies.
Fig. 9 shows a clear problem, however, as the vast majority of respondents, both EAR and ITAR shippers, say product classification is not considered in the early planning or R&D stages. This lack of involvement has some implications, notably unanticipated requirements stemming from the introduction of a new product. Those include added cost, delay to market, difficulty in obtaining a CCATS, or licenses to certain destinations, end users, or obtaining a commodity jurisdiction.
Failure to involve compliance at this early stage also can create vulner-ability to unanticipated risks and costs related to deemed exports, deemed export licensing and managing controlled technologies.
f i G u r E 9 : Is Product Classification Considered in R&D or Planning Stages?
0% 10% 20% 30% 40% 50%
Uncertain
Strongly disagree
Strongly agree
Disagree
AgreeAll EAR
Some ITAR
11% 10%
28% 23%
5% 9%
40% 43%
17% 16%
166 total respondents

SE
ct
ion
iv
: E
xP
or
t S
tr
at
EG
ic c
on
Sid
Er
at
ion
S
Export Operations & Compliances | Benchmark Report: 2013
15
Nearly two-thirds of respondents say investing in a systemized approach to exporting is a strategic priority, though that number is down from previous years in this study. Perhaps more disagree this year because of the previously stated economic worries? As noted, increasing headcount instead of investing in automation might be more strategic for companies that are worried about immediate costs.
f i G u r E 1 0 : Is an Export Management System a Strategic investment?
166 total respondents
16%
21%
42%
13%
8%
0%
5%
10%
15%
20%
25%
30%
35%
40%
45%
Strongly DisagreeDisagreeUncertainAgreeStrongly Agree

SE
ct
ion
iv
: E
xP
or
t S
tr
at
EG
ic c
on
Sid
Er
at
ion
S
Export Operations & Compliances | Benchmark Report: 2013
16
This years’ study incorporated a question asked of importers in American Shippers’ Import Operations and Compliance Benchmark Study—how training is targeted for exporters.
That said, there was an expectation that ITAR shippers would link their training programs to job functions (a clear best practice) more often than EAR shippers. But that is not the case. In fact, respondents with no ITAR requirements report employing this best practice nearly 40 percent more than those with some ITAR component. What’s more, it’s somewhat shocking that 15 percent of companies with some ITAR burden have no training program. This clearly leaves them open to risk for violations. The expectation is that ITAR companies would have a rigorous training program for all employees.
f i G u r E 1 1 : Export Related Training—EAR vs. ITAR
171 total respondents0% 10% 20% 30% 40% 50% 60%
All employees take traderelated training upon beginning
employment with the company, soadditional training is not required
N/A—We do not offerexport–related training
Training is offered only uponrequest by the compliance
team to any function
All employees are encouragedto take trade-related
training but it’s not mandatory
All employees must takean annual refresher
about trade related topics
Training is targeted by jobfunction and each job function is
reminded at regular intervals
All EAR
Some ITAR
51% 37%
20% 9%
15% 16%
7% 17%
5% 15%
2% 6%

SE
ct
ion
iv
: E
xP
or
t S
tr
at
EG
ic c
on
Sid
Er
at
ion
S
Export Operations & Compliances | Benchmark Report: 2013
17
Fig. 12 indicates some consistency with last year in terms of export teams being involved in strategic discussions or merger and acquisition consider-ations. But looking back over four years of data, export compliance and operations teams don’t seem to be making inroads towards involving themselves in these key strategic endeavors. It appears those companies that consider it important to involve export staff continue to do so, and those that don’t, don’t.
What’s clear, though, is that when export teams are not included in strategic discussions, it can create unneeded cost and risk in the exporting process due to unknown requirements regarding classification, licensing, controlled technologies, sanctions, and government reporting.
f i G u r E 1 2 : Inclusion in Strategic Discussions—2010-2013
170 total respondents
No
Yes—after the merger, acquisition or divestiture
Yes—prior to the merger, acquisition or divestiture
0%
10%
20%
30%
40%
50%
60%
70%
80%
90%
100%
2013201220112010
31%
12%
57%
28%
17%
55%
31%
20%
48%
30%
21%
49%

SE
ct
ion
iv
: E
xP
or
t S
tr
at
EG
ic c
on
Sid
Er
at
ion
S
Export Operations & Compliances | Benchmark Report: 2013
18
The vast majority of respondents said they are included, to some extent, in discussion of new markets, including half of which say they are always or frequently included in these discussions. On the other hand, more than 40 percent say they are never or rarely included in this process. Not including export teams in new market discussions opens up areas of risk for shippers. The export of certain products could be prohibited in those identified markets, they could require licenses, or there could be unfore-seen import restrictions or requirements in the destination countries.
Included, but infrequently
Included frequently
Always included
Never included
N/A
Uncertain
23%
12%
2% 1%
31%
30%
165 total respondents
f i G u r E 1 3 : Inclusion in New Market Discussions
SE
ct
ion
v:
rE
Gu
la
to
ry
im
Pa
ct
S o
n E
xP
or
tE
rS
Export Operations & Compliances | Benchmark Report: 2013
19
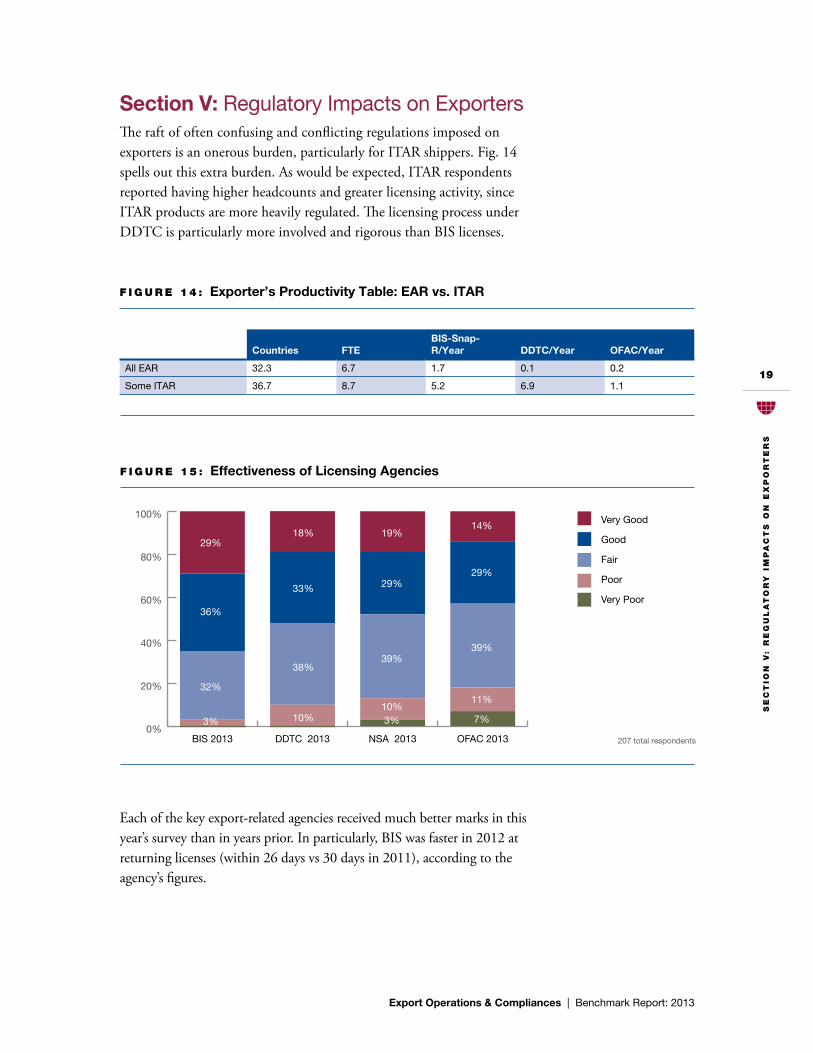
Section V: Regulatory Impacts on ExportersThe raft of often confusing and conflicting regulations imposed on exporters is an onerous burden, particularly for ITAR shippers. Fig. 14 spells out this extra burden. As would be expected, ITAR respondents reported having higher headcounts and greater licensing activity, since ITAR products are more heavily regulated. The licensing process under DDTC is particularly more involved and rigorous than BIS licenses.
f i G u r E 1 4 : Exporter’s Productivity Table: EAR vs. ITAR
Countries FTEBIS-Snap- R/Year DDTC/Year OFAC/Year
All EAR 32.3 6.7 1.7 0.1 0.2
Some ITAR 36.7 8.7 5.2 6.9 1.1
f i G u r E 1 5 : Effectiveness of Licensing Agencies
207 total respondents
1%
0%
20%
40%
60%
80%
100%
OFAC 2013NSA 2013DDTC 2013BIS 2013
Very Good
Good
Fair
Poor
Very Poor
29%18%
33%
38%
10% 3%10%
39%
29%
19%14%
29%
39%
11%
7%
36%
32%
3%
Each of the key export-related agencies received much better marks in this year’s survey than in years prior. In particularly, BIS was faster in 2012 at returning licenses (within 26 days vs 30 days in 2011), according to the agency’s figures.

SE
ct
ion
v:
rE
Gu
la
to
ry
im
Pa
ct
S o
n E
xP
or
tE
rS
Export Operations & Compliances | Benchmark Report: 2013
20
In 2012, BIS processed 23,229 export license applications (down from 25,093 in FY 2011) for transactions valued at approximately $204.1 billion. BIS approved 19,817 license applications (85 percent), returned 3,197 without action (14 percent) and denied 143 (less than 1 percent). Those figures are not too dissimilar from prior years, but does not necessarily explain the large increase in satisfaction with this government agency.
Both BIS and the DDTC take into consideration a company’s compliance program when assessing violations and issuing penalties. If areas of compliance such as training, screening, policies and procedures seem strong, then the government will tend to reduce penalties since there are mitigating circumstances. In other words, they expect a company to have these areas of compliance in place, and if they don’t then they will be penalized to the fullest extent. Unfortunately, these areas of compliance are often overlooked by companies because they require a lot of effort and do not necessarily produce immediate results to the bottom line.
Screening, which was number the No. 1 concern last year, moved down the list this year. Perhaps companies were able to automate and reduce their risk. Training, written policies, and procedures and classification are difficult to automate and remain to a large extent a manual process.
f i G u r E 1 6 : Perceived Areas of Highest Risk
166 total respondents
Low Risk Medium Risk High Risk
Anti-boycott
License Determination/Management
Restricted Party Screening
Internal Audit
Deemed Exports/Technology Transfer
AES Declarations
Export Classification
Written Procedures
Training

SE
ct
ion
vi:
Ex
Po
rt
oP
Er
at
ion
S &
co
mP
lia
nc
E t
Ec
Hn
ol
oG
y
Export Operations & Compliances | Benchmark Report: 2013
21
Section VI: Export Operations & Compliance TechnologyThe adoption of technology in the sphere of export compliance and operations is a key metric for this study. In practice, the majority of companies use some sort of systems-based approach to their export process, especially those with ITAR requirements. Our study has shown that the most popular approach is a hybrid of GTM, internal customized, or 3PL-provided solutions. That did not change this year.
And yet, there remains a smaller swathe of respondents that use no system at all, preferring a manual or spreadsheet-based approach. That group is primarily composed of EAR shippers, who because of their lower regulatory burdens, tend to be slower or more reluctant to automate their compliance program. For those shippers that only export EAR99 items, there may not be much need for automation other than restricted party screening.
f i G u r E 1 7 : GTM Platform —EAR vs. ITAR
167 total respondents0% 10% 20% 30% 40% 50% 60%
None of these
Automated using a system provided by a 3PL
Outsourced managed service
Manual or spreadsheet based
Automated using a customized internal system
Automated using a global trade management system
A mix or hybrid of the aboveAll EAR
Some ITAR
5%
3%
3%
4%
1%
4%
33%
10%
8%
14%
34%
49%
17%
16%

SE
ct
ion
vi:
Ex
Po
rt
oP
Er
at
ion
S &
co
mP
lia
nc
E t
Ec
Hn
ol
oG
y
Export Operations & Compliances | Benchmark Report: 2013
22
The minimal change in export platform over the years is clear in Fig. 18. There’s been little movement in terms of the number of respondents using a hybrid approach, as well as those who use no system at all. One gradual trend, however, is that companies using GTM solutions to a greater extent, and internal solutions a correspondingly lesser extent.
0% 10% 20% 30% 40% 50%
Outsourced managed service
Automated using a system provided by a 3PL
None of these
Automated using a customized internal system
Automated using a global trade management system
Manual or spreadsheet based
A mix or hybrid of the above2010
2011
2012
2013
1%1%1% 2%
4%4% 6%4%
5% 5% 6%4%
14% 16% 13%11%
23% 22%18% 23%
11% 12% 14% 16%
41%40% 43% 41%
f i G u r E 1 8 : GTM Platform—2010-2013
167 total respondents

SE
ct
ion
vi:
Ex
Po
rt
oP
Er
at
ion
S &
co
mP
lia
nc
E t
Ec
Hn
ol
oG
y
Export Operations & Compliances | Benchmark Report: 2013
23
Fig. 19 highlights this further. Respondents favor a hybrid or licensed model over internally developed systems, and even software-as-a-service (SaaS) deployments. Given the rise in prominence of SaaS in other areas of global trade and transportation, it can only be surmised that shippers don’t yet see the cost benefits of moving to this type of platform for processes other than restricted party screening. As for the diminished interest in custom-built solutions, with the plethora of vendors available in the export space, designing and maintaining a homegrown solution might prove to be too costly going forward.
A mix or hybrid of these
Licensed installed software
None of these
Custom build or proprietary software
Software-as-a-service/On-demand
Software available on a project basis
3%
46%14%
8%
20%
10%
f i G u r E 1 9 : Export System Delivery Model
120 total respondents

SE
ct
ion
vi:
Ex
Po
rt
oP
Er
at
ion
S &
co
mP
lia
nc
E t
Ec
Hn
ol
oG
y
Export Operations & Compliances | Benchmark Report: 2013
24
The integration of once disparate systems within an organization is a key development in global trade, and nowhere more so than in the linkage between GTM and TMS platforms. Yet, as with last year, this remains a low priority for most respondents.
Of those who have not already integrated the two platforms, the preponderance say they have no plans to do so. Hardly any, whether EAR or ITAR, plan to do it in the next year. Indeed, this seemingly crucial integration seems to permanently reside in many companies’ mid-term plans.
That said, it is more important in general to ITAR respondents to integrate their TMS and GTM platforms. The sensitive nature of ITAR products makes shipment tracking in conjunction with tracking compliance activities more necessary, while licensable shipments must be tracked to the end user specified on the license. Little surprise that more ITAR respondents than say they are already integrated, or that EAR respondents are more than 60 percent more likely to say they have no plans to integrate.
0%
5%
10%
15%
20%
25%
30%
35%
40%
45%
50%
UncertainNo we do nothave any plans
to integrate
Yes this ison our
5 year plan
Yes inthe next
12-24 months
Yes inthe next
12 months
Yes we’realready
integrated
30%
4%2%
24%
11%14%
4%
14%
All EAR
Some ITAR
14%15%
27%
44%
f i G u r E 2 0 : Plans to Integrate GTM and TMS—EAR vs. ITAR
121 total respondents

SE
ct
ion
vi:
Ex
Po
rt
oP
Er
at
ion
S &
co
mP
lia
nc
E t
Ec
Hn
ol
oG
y
Export Operations & Compliances | Benchmark Report: 2013
25
In terms of functionality variances between EAR and ITAR shippers, the key one is AES filings. AES filings are required for licensable shipments and about 95 percent of ITAR shipments require licenses. Therefore, it’s not a surprise that ITAR companies would report having greater AES functionality.
0% 10% 20% 30% 40% 50% 60% 70% 80% 90%
Other, please specify
License management
Global trade content
License determination
Automated Export Systems (AES) filings
Documentation generation/management
Record keeping
Classification/Product management/Item master maintenance
Denied party screeningAll EAR
Some ITAR
7%5%
30% 37%
33%24%
44% 39%
39% 59%
69%68%
69%68%
74%62%
80%70%
f i G u r E 2 1 : Current Functionality—EAR vs. ITAR
117 total respondents

SE
ct
ion
vi:
Ex
Po
rt
oP
Er
at
ion
S &
co
mP
lia
nc
E t
Ec
Hn
ol
oG
y
Export Operations & Compliances | Benchmark Report: 2013
26
Addressing existing functionality by size of shippers, it makes sense that denied party screening, documentation generation and management, classification, and record keeping d have largely been automated across all shippers types. They are required for all sizes of exporters with any kind of product mix —EAR or ITAR. Meanwhile, not all exporters need a license determination/management module, especially if they have EAR99 products only.
0% 10% 20% 30% 40% 50% 60% 70% 80% 90%
Other, please specify
License management
Automated Export Systems (AES) filings
Global trade content
License determination
Record keeping
Classification/Product management/Item master maintenance
Documentation generation/management
Denied party screeningLarge Shippers
Small/MediumShippers
8%4%
35%33%
38%24%
38%37%
53%37%
73%65%
75%61%
75%69%
85%76%
f i G u r E 2 2 : Current Functionality—Company Size
117 total respondents
SE
ct
ion
vi:
Ex
Po
rt
oP
Er
at
ion
S &
co
mP
lia
nc
E t
Ec
Hn
ol
oG
y
Export Operations & Compliances | Benchmark Report: 2013
27
0% 5% 10% 15% 20% 25% 30% 35%
License management
License determination
Denied party screening
Global trade content
Classification/Product management/Item master maintenance
Documentation generation/management
Other, please specify
Record keeping
Automated Export Systems (AES) filings 33%
27%
25%
24%
23%
23%
17%
13%
12%
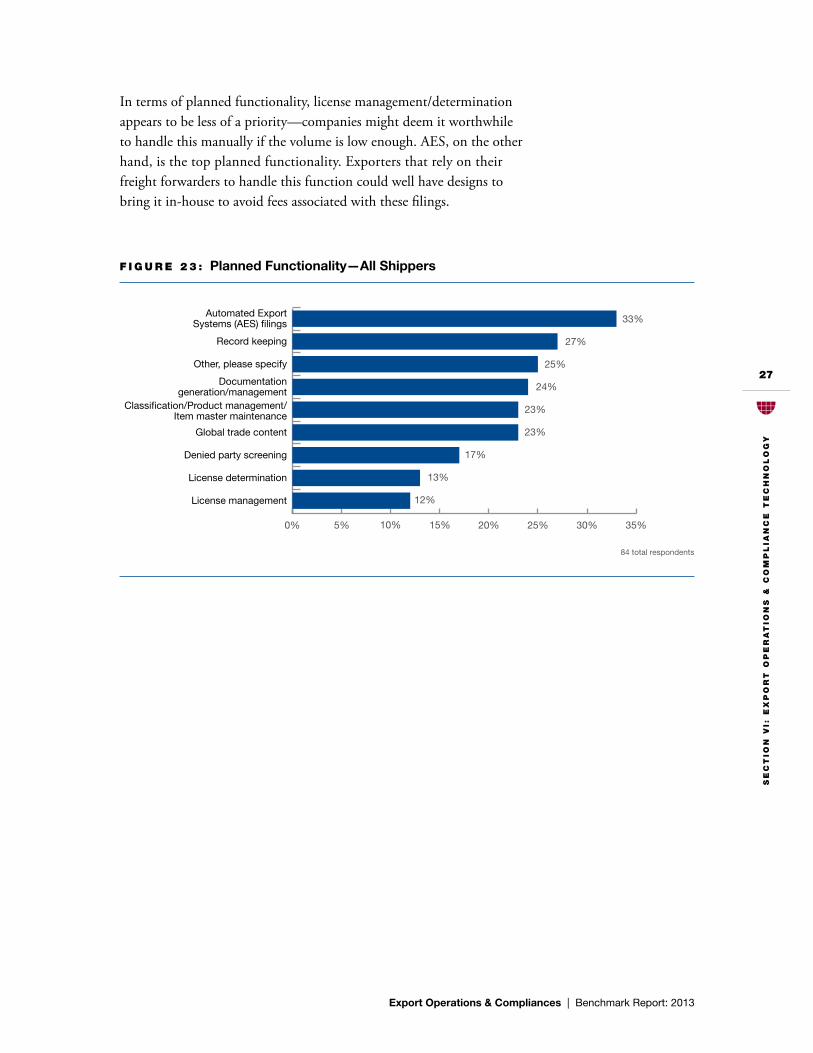
f i G u r E 2 3 : Planned Functionality—All Shippers
84 total respondents
In terms of planned functionality, license management/determination appears to be less of a priority—companies might deem it worthwhile to handle this manually if the volume is low enough. AES, on the other hand, is the top planned functionality. Exporters that rely on their freight forwarders to handle this function could well have designs to bring it in-house to avoid fees associated with these filings.

SE
ct
ion
vi:
Ex
Po
rt
oP
Er
at
ion
S &
co
mP
lia
nc
E t
Ec
Hn
ol
oG
y
Export Operations & Compliances | Benchmark Report: 2013
28
For those respondents that use no system at all, the barriers to invest-ment in a system are diverse, ranging from a lack of budget, lack of expertise, lack of perceived ROI, or lack of company backing.
Only a quarter say they intend to invest in the next year, with most indicating there are no plans to do so.
Lacks a tangible return on investment
Lack of management support
Lack of resources
Lack of technical expertise
No budget
Other, please specify
23%
34%
21%
34%
7%
32%
f i G u r E 2 4 : Inhibitors to Investment in Systems
44 total respondents
In the next 12 months
In the next 12-24 months
In the next 5 years
No plans at this time61%
18%
7%
14%
f i G u r E 2 5 : Plans to Buy a System
44 total respondents

SE
ct
ion
vii
: B
ES
t P
ra
ct
icE
S
Export Operations & Compliances | Benchmark Report: 2013
29
Section VII: Best PracticesBased on the survey results and subsequent analysis, American Shipper and BPE Global suggest companies take the following steps to align their export practices with best-in-class operations:
• Be informed—Actively monitor export compliance trends and export control reform announcements from BIS, DDTC, and other federal agencies, as well as non-governmental publications.
• Be prepared—Understand the implications of reform activities, such as enforcement coordination. Audit your operations to identify gaps in your compliance program.
• Communicate—Share your strategic plan for the year with senior management and show how your decisions improve efficiency, mitigate risk, or increase revenue/decrease expenses. Also, detail the compliance risks faced by the company and how they can be remedied through automation or new procedures.
• Be responsive—When the U.S. government issues a proposed rule or seeks industry feedback, make sure to respond. Otherwise, be prepared to live with regulatory changes which may not be condu-cive to your operation. Participate in your trade associations’ export committees and prepare comments on the reform activity to date. Plan on joining industry working groups convened by government agencies chartered with reform, as well as those formed by your trade associations.
• Be accountable—Measure compliance results for internal opera-tions and service providers each quarter and year to show progress and commitment to your strategic plan.
• Strategize—Establish a global trade strategy with operations, finance, legal and business development and ensure you are prepared to change with the economy and markets in which you operate.
• Automate—All exporters should consider a systems-based trade management platform as a tool to manage complexity, and improve efficiency, as well as mitigate risk.

aP
PE
nd
ix a
: a
Bo
ut
ou
r S
Po
nS
or
S
Export Operations & Compliances | Benchmark Report: 2013
30
Appendix A: About Our Sponsors
a m B E r r o a d
Amber Road is the world’s leading provider of on-demand Global Trade Management (GTM) solutions. By helping organizations to comply with country-specific trade regulations, as well as plan, execute and track global shipments, Amber Road enables goods to flow unimpeded across international borders in the most efficient, compliant and profitable way.
Our solutions automate import and export processes, provide order and shipment-level visibility, calculate duties, taxes and fees, administer preferential trade programs, ensure regulatory compliance and simplify the financing, sourcing and transporting of goods across international borders. For more information, please visit www.AmberRoad.com or email us at [email protected].

aP
PE
nd
ix B
: a
Bo
ut
ou
r P
ar
tn
Er
S
Export Operations & Compliances | Benchmark Report: 2013
31
Appendix B: About Our Partners
B P E G l o B a l
Decrease risk and optimize efficiency with BPE Global. Since 2004, companies have achieved results through BPE’s global trade consulting and training services. BPE’s team of seasoned regulatory and operational experts has the ability to navigate the complexities of global trade compliance, supply chain management, and logistics operations. As a recognized leader in trade compliance and logistics management, BPE Global provides solutions that are customized to your company’s needs.
The BPE team is made up of knowledgeable, energetic and pragmatic licensed customs brokers, each with over ten years of experience. BPE gives back to the trade community by sharing knowledge and skills through webinars, publications, trade events, and as a recognized Trade Ambassador to U.S. Customs and Border Protection.
Enabling companies to succeed in global business is our mission. Helping you achieve efficiencies and best practices in compliance is our passion. To learn more about BPE, visit www.bpeglobal.com.
intErnational comPliancE ProfESSionalS aSSociation
ICPA was established by Ann Lister and Lynda Westerfield to serve the needs of international trade compliance professionals. It has grown from an informal e-mail list into an organization of more than 1,000 members.
By joining ICPA you can have access to and take part in the most vital discussions surrounding international trade today. You can ensure that your views are known to government and industry partners whose policies affect your bottom line.
ICPA’s mission is to:
• Disseminate information relevant to import/export and other international trade related matters.
• Facilitate networking opportunities among the membership body.
• Facilitate career opportunities and development.
• Monitor and participate in international trade issues and trends with a goal to potentially affect change and influence policy development in the global trade arena, either directly or in conjunction with other international trade organizations.
• Provide education and training, which may include wholly sponsored programs or programs in conjunction with other appropriate organizations.

aP
PE
nd
ix c
: a
Bo
ut
am
Er
ica
n S
HiP
PE
r r
ES
Ea
rc
H
Export Operations & Compliances | Benchmark Report: 2013
32
BacKGround
Since our first edition in May 1974, American Shipper has provided U.S.-based logistics practitioners with accurate, timely and actionable news and analysis. The company is widely recognized as the voice of the international transportation community.
In 2008 American Shipper launched its first formal, independent research initiative focused on the state of transportation management systems in the logistics service provider market. Since that time the company has published more than a dozen reports on subjects ranging from regulatory compliance to sustainability.
ScoPE
American Shipper research initiatives typically address international or global supply chain issues from a U.S.-centric point of view. The research will be most relevant to those readers managing large volumes of airfreight, containerized ocean and domestic intermodal freight. American Shipper readers are tasked with managing large volumes of freight moving into and out of the country so the research scope reflects those interests.
mEtHodoloGy
American Shipper benchmark studies are based upon responses from a pool of approximately 40,000 readers accessible by e-mail invitation. Generally each benchmarking project is based on 200-500 qualified responses to a 25-35 question survey depending on the nature and complexity of the topic.
American Shipper reports compare readers from key market segments defined by industry vertical, company size, and other variables, in an effort to call out trends and ultimate best practices. Segments created for comparisons always consist of 30 or more responses.
liBrary
American Shipper’s complete library of research is available on our Website: AmericanShipper.com/Research.
Annual studies include:• Global Trade Management Report
• Global Transportation Planning & Procurement Benchmark
• Global Transportation Management Benchmark
• Global Transportation Settlement & Measurement Benchmark
• Import Operations & Compliance Benchmark
• Export Operations & Compliance Benchmark
contact
Jim Blaeser Publisher American Shipper [email protected]
Appendix C: About American Shipper Research

Export Operations & Compliances | Benchmark Report: 2013
Copyright© 2013 by Howard Publications, Inc. All rights reserved.
No part of the contents of this document may be reproduced or transmitted
in any form or by any means without the permission of the publisher.