exploring the nature of management - ilf: ilf-website · 2012-06-05 · jack carlsen & david...
TRANSCRIPT

The Third International Conference onMonitoring and Management of Visitor Flows in
Recreational and Protected Areas
Proceedings
Rapperswil, Switzerland 13 - 17 September 2006
Exploring the Nature of Management

Exploring the Nature of Management
Proceedings of the Third International Conference onMonitoring and Management of Visitor Flows in
Recreational and Protected Areas
Rapperswil, Switzerland 13-17 September 2006
Edited by:
Dominik Siegrist, Christophe Clivaz, Marcel Hunziker & Sophia Iten
Editors Dominik Siegrist, University of Applied Sciences Rapperswil (Chair)Christophe Clivaz, University of Applied Sciences Western Switzerland (Co-Chair)Marcel Hunziker, Swiss Institute of Forest, Snow and Landscape Research (Co-Chair)Sophia Iten, University of Applied Sciences Rapperswil (Coordinator)
CitationSiegrist, D., Clivaz, C., Hunziker, M. & Iten, S. (eds.) (2006). Exploring the Nature of Management. Proceedings of the Third International Conference on Monitoring and Management of Visitor Flows in Recreational and Protected Areas. University of Applied Sciences Rapperswil, Switzerland, 13-17 September 2006. Rapperswil.
CopyeditingOliver DeCaro, Sophia Iten, Dominik Siegrist
LayoutSonja Gerdes
Cover picturesUniversity of Applied Sciences Wädenswil
Published byResearch Centre for Leisure, Tourism and Landscape,Institute for Landscape and Open Space, University of Applied Sciences Rapperswil, www.ftl.hsr.ch
To order a copyFTL-HSR, P.O. Box, CH-8640 Rapperswil,Phone: +41 (0)55 222 47 97, Email: [email protected]
Printed byMails & More®, A-Baumgarten
ISBN 3-033-00935-2
3
Contents
Introduction .............................................................................................................................................13
Keynote Addresses ...................................................................................................................................15
North American Idols: Personal Observations on Visitor Management Frameworks and Recreation ResearchWolfgang Haider....................................................................................................................................................................16
Trends in Alpine Tourism: The Mountaineers’ Perspective and Consequences for Tourism StrategiesAndreas Muhar, Thomas Schauppenlehner & Christiane Brandenburg ...............................................................................23
People, Pixels and Parks: Forest Conservation in the TropicsHarini Nagendra ...................................................................................................................................................................28
The New Paradigm for Protected Areas: Implications for Managing Visitors in Protected AreasDavid Sheppard .....................................................................................................................................................................33
New Parks of National Importance in SwitzerlandBruno Stephan Walder ...........................................................................................................................................................46
The Significance of Visitor Monitoring Data for Management, Planning and PolicyArne Arnberger, Joel Erkkonnen, Tuija Sievänen& Odd Inge Vistad ................................................49
Monitoring Public Reactions to the U.S. Forest Service Recreation Fee ProgramJames D. Absher, Alan R. Graefe & Robert C. Burns ............................................................................................................50
Outdoor Recreationists in Oregon and Washington: A Comparison of Recreationists’ Perceptions of Experience Satisfaction across Two US Pacific Northwest StatesRobert C. Burns & Alan R. Graefe ........................................................................................................................................52
Monitoring the Value of Visitors to Protected Areas: The Australian ApproachJack Carlsen & David Wood .................................................................................................................................................54
Monitoring Sustainable Nature Tourism in Practice – Experiences From Pyhä-Luosto National Park, FinlandJoel Erkkonen & Pertti J. Itkonen .........................................................................................................................................56
Using Visitor Monitoring to Reduce Ecological Impacts Due to Picnicking and Grilling in Urban Forests in the Vicinity of Basle, SwitzerlandTessa K. Hegetschweiler, Hans-Peter Rusterholz & Bruno Baur ...........................................................................................58
The Influence of Motorized Access on Hiker’s Route Selection at Mt. TsukubaTaiichi Ito & Mariko Ryugo ...................................................................................................................................................60
Visitor and Environmental Impact Monitoring as Basis for Sustainable Nature Tourism in Estonian Recreational AreasMarge Rammo, Kaidi Maran, Anu Almik & Kalle Karoles ....................................................................................................62
Visitor Satisfaction Surveys and the Development of Access Standards for National Nature Reserves in EnglandSimon J. Melville ...................................................................................................................................................................64
Visitor Counting with Acoustic Slab Sensors in the Swiss National ParkReto Rupf-Haller, Michael Wernli & Flurin Filli ...................................................................................................................72
National Park Characteristics, Regional Setting and Visitor FlowsJenni Puustinen, Eija Pouta, Marjo Neuvonen & Tuija Sievänen..........................................................................................78
Visitor Monitoring in Norwegian National Parks? If so: How Will it Find a Position in the Present Situation with Low Funding, Biological Hegemony, Expanding User Interests and Indistinct Management Priorities?Odd Inge Vistad .....................................................................................................................................................................80
Recreation Ecology and Visitor Impact Research: Past, Present and FutureYu-Fai Leung (Chair) ..............................................................................................................................83
Recent Recreation Ecology Research in AustraliaRalf Buckley, Catherine Pickering, Guy Castley & Andrew Growcock .................................................................................84

4
Recreation Ecology: Learning from the PastDavid N. Cole ........................................................................................................................................................................89
Recreation Ecology in East Asia: Redefining Impacts?Yu-Fai Leung ........................................................................................................................................................................91
Recreation Ecology Research in the AmericasJeffrey L. Marion ...................................................................................................................................................................93
Recreation Ecology and Visitor Impact Research: Past, Present and FutureChristopher Monz ..................................................................................................................................................................98
Recreational Impacts on Park EcosystemsDavid Co.le (Chair) ...............................................................................................................................101
Visitors to the Highlands of Itatiaia National Park, Brazil, and their Perceptions of Visitor ImpactsMaria Isabel A. Barros & Teresa C. Magro .........................................................................................................................102
Trampling after Landscape Level Disturbance: Impacts on Subalpine Vegetation and Soils in the Australian AlpsAndrew J. Growcock, Catherine M. Pickering & Stuart W. Johnston ..................................................................................107
A Prediction of a Human Action on Seashell-Digging at a Seaside Park Based on a Multi-Agent Simulation ModelMotohiko Murai, Takashi Hirobayashi, Ryoichi Yamanaka & Yoshiyuki Inoue ...................................................................109
Environmental Impacts of Recreational Horse Riding in Protected AreasPirkko Siikamäki, Anne Törn & Anne Tolvanen ...................................................................................................................112
Genesis of Trails in Nature: Monitoring of Visitors’ Effect on NatureHans Skov-Petersen .............................................................................................................................................................115
Trampling Impacts on Coastal Sand Dune Vegetation in Southeastern BrazilDaniela C. Talora, Teresa C. Magro & Ana C. Schilling .....................................................................................................117
Protected Areas and New Paradigms of Regional DevelopmentIngo Mose (Chair) ..................................................................................................................................123
Integrated Conservation Processes – A Tool for Reducing Conflicts in Area Conservation ProcessesIngrid Bay-Larsen, Ronald Bjøru, Svein Morten Eilertsen & Gunn Elin Fedreheim ...........................................................124
Visitor Management and Destination Management as Tools for Sustainable Regional DevelopmentNiek M.A. Beunders ............................................................................................................................................................129
Socio-Cultural Benefits of Pan Parks: Case Study at Bieszscady National Park, PolandStuart P. Cottrell & Jana Raadik .........................................................................................................................................135
Fostering Sustainable Regional Development with Indicator Based Certification ProceduresVicente Carabias-Hütter, David Kümin & Dominik Siegrist ................................................................................................137
Large Scale Protected Areas + Tourism = Regional Development?Hubert Job, Daniel Metzler & Manuel Woltering ................................................................................................................140
Key Success Factors for Nature-Based Tourism in Protected Areas of the AlpsFlorian Lintzmeyer, Dominik Siegrist & Stefanie Hass .......................................................................................................145
Walking towards Concerted Management of Hiking-Path Networks: A Well Engaged but Tricky Challenge for French Alpine Protected AreasAlexandre Mignotte .............................................................................................................................................................147
Protected Areas as a Tool for Regional Development?Ingo Mose & Norbert Weixlbaumer .....................................................................................................................................149
Overcoming National Park Conflicts by Regional Development: Experiences from the Doñana Area in Southern SpainAndreas Voth ........................................................................................................................................................................155

5
Relevance and a Sense of Connection in Canada’s National ParksSteve Whittingham (Chair) ...................................................................................................................162
Parks Canada’s Framework for Recreational ActivitiesFrances Gertsch & Ed Jager ..............................................................................................................................................163
Healthy Parks for PeopleDavid Lipton ........................................................................................................................................................................165
Memorable Visitor Experiences Lead to Relevance and SustainibilityCarol Sheedy .......................................................................................................................................................................167
Integration – Resource Protection and Memorable Visitor Experiences in the Lake Louise Community of Banff National ParkSteve Whittingham ..............................................................................................................................................................170
Sustainability and Carrying Capacity Studies in Recreational SettingsRobert Manning (Chair) .......................................................................................................................172
Sustainable Trail Management, Definitions and a Management ModelSinead H. O’Connor Gotra & Ken E. Boyle ........................................................................................................................173
The Adoption of Social Carrying Capacity for the Management of Theme Park SettingsHsin-You Chuo .....................................................................................................................................................................179
Recreation Carrying Capacity Analysis at Khao Leam Ya – Mu Ko Samed National Park, ThailandDachanee Emphandhu, Thamasak Yemin, Sura Pattanakiat, Chatchai Tantasirin, Ranuka Ruschano,Surachet Chettamart & Mayuree Nasa ................................................................................................................................183
Beyond Carrying Capacity in Recreation Management: In Search of AlternativesYves Hausser, Tony Travis & Andrea Finger-Stich ..............................................................................................................191
Level of Sustainable Activity: Moving Visitor Simulation from Description to ManagementRobert M. Itami ...................................................................................................................................................................193
A Study on Procedures to Establish Standards Concerning Trail Management in Sub-Alpine Zones of Protected AreasAkihiro Kobayashi, Tetsuya Aikoh & Kazushige Yamaki .....................................................................................................196
Understanding and Managing Soundscapes in National Parks:Part 1- Indicators of QualityPeter Newman, Robert E. Manning, Ericka Pilcher, Karen Trevino & Michael Savidge .....................................................198
Understanding and Managing Soundscapes in National Parks: Part 2 - Standards of QualityRobert E. Manning, Peter Newman, Ericka Pilcher, Jeffrey Hallo, William Valliere, Michael Savidge & Daniel Dugan ...201
Understanding and Managing Soundscapes in National Parks: Part 3 – Computer SimulationSteven R. Lawson & Kenneth Plotkin ..................................................................................................................................203
Managing Sustainable Eco-Tourism in Van Vihar National ParkRavi Shanker Kanoje ..........................................................................................................................................................205
Recreational Carrying Capacity Assessment in a Turkish National ParkSelçuk Sayan & Veli Ortaçe me ...........................................................................................................................................211
Nature Tourism: Concepts and Experiencesin Recreational and Protected AreasYves Hausser & Dominik Siegrist (Chairs) ..........................................................................................218
Comparison of Forest Recreation and Nature Tourism in Hungary, Italy and Slovakia Based on the First Outputs of the COST E33 ActionDóra Drexler, Mária Bihu ová & Barbara Mariotti ...........................................................................................................219
Birdwatching and Protected Areas of GeorgiaRamaz Gokhelashvili & Lela Azniashvili .............................................................................................................................223

6
Nature-Based Activities on Urban – Green Requirements of Nature-Based Activities in an Urban EnvironmentHolger Kretschmer ..............................................................................................................................................................226
The Pan Parks Sustainable Tourism Strategy as a Tool for Nature-Based Tourism Development in and around Protected AreasZoltán Kun & Mylène van der Donk ....................................................................................................................................228
Management of Ecotourism in National Chambal Sanctuary, IndiaR.J. Rao ...............................................................................................................................................................................230
Analysis of Nature-Based Tourism in the Sumava National Park, Czech Republic: 1997-2004Viktor Trebicky & Martin Cihar ..........................................................................................................................................233
Requirements for Recreation and their Integration into Landscape PlanningMatthias Buchecker (Chair) .................................................................................................................238
Local Residents’ Relationship towards their Nearby Outdoor Recreation AreasMatthias Buchecker & Jacqueline Frick .............................................................................................................................239
Landscape Planning for Nearby Outdoor Recreation – Implications from an Exploratory Interview StudyBarbara Degenhardt & Matthias Buchecker .......................................................................................................................241
Development of a Zoning Instrument for Visitor Management in Protected AreasRené J.H.G. Henkens, Rene Jochem, Rogier Pouwels & Peter A.M. Visschedijk ................................................................243
Cederberg Environs Spatial Planning in the Western Cape, South AfricaUlrike Mast-Attlmayr ...........................................................................................................................................................246
Local Recreational Areas: Accounting for Peoples’ Needs in the Development and Selection of Planning InstrumentsHarry Spiess, Margit Mönnecke, Karin Wasem & David Kümin .........................................................................................253
Participation Processes in Recreational and Protected AreasUlrike Pröbstl (Chair) ...........................................................................................................................260
Participatory Processes and Participatory Research – A Tool for Conflict Identification and Development of Management DecisionsWolfgang Lexer, Christiane Brandenburg, Felix Heckl, Andreas Muhar, Friedrich Reimoser & Richard Zink ...................261
Tourism Development and Local Actors’ Engagement for Sustaining Alpine ForestsAndrea S. Finger-Stich & Alicia C. Tanner .........................................................................................................................264
Recreation Interests and Participation in River Restoration ProjectsBerit Junker & Matthias Buchecker ....................................................................................................................................266
How Social ‘Demand’ Overlaps in Forest Management – A Sociological Analysis of the Relation between Forest and Society in France (1960-2005)Nathalie Lewis .....................................................................................................................................................................269
Local Participation in the Development of Tourist Centres in the Peripheral Regions of Finnish LaplandSeija Tuulentie & Ilona Mettiäinen ......................................................................................................................................271
The Tourists’ View on Protected AreasVeronika Wirth, Petra Sterl & Ulrike Pröbstl ......................................................................................................................273
Landscape and its ImagesMarcel Hunziker (Chair) ......................................................................................................................276
What Does Sustainable Development Look Like? Visions of Two Swiss Unesco RegionsNorman Backhaus & Urs Müller .........................................................................................................................................277
Experiencing Nature – The Recognition of the Symbolic Landscape within Research and Management of Visitor FlowsRamona van Marwijk & Jaap Lengkeek ..............................................................................................................................280

7
Historic Landscapes in Urban Regions: Recreation and Use Conflicts in Mikhalkovo, MoscowElena Petrova ......................................................................................................................................................................282
Mapping the Attractiveness of the Dutch Landscape: A GIS-Based Landscape Appreciation Model (Glam-2)Sjerp de Vries, Janneke Roos-Klein Lankhorst & Arjen E. Buijs .........................................................................................284
The Landscape Method of Analysis and Assessment of Ecotourism Destinations in the Republic of KazakhstanDilya B. Woodward & Galina V. Geldyeva ..........................................................................................................................286
Good Solutions between Sports, Nature and LandscapeMargit Mönnecke (Chair) .....................................................................................................................292
Snowshoeing in Protected Areas: Bridging the Gap between Attitude and BehaviourBenjamin Freuler, Marcel Hunziker & Heinz Gutscher .......................................................................................................293
Outdoor Leisure Activities: Motivation, Attitudes and Strategies Promoting Responsible Behaviour towards Natureand LandscapeMarcel Hunziker & Christina Zeidenitz ...............................................................................................................................295
An Improved Methodological Approach to Recreation Conflict Analysis in the Black ForestCarsten Mann & James D. Absher ......................................................................................................................................298
Outdoor Activities in Nature and Landscape – Practice-Oriented SolutionsKarin Wasem & Margit Mönnecke.......................................................................................................................................300
Simulating Recreational Behaviour – on Agents and EnvironmentAndreas Muhar, Hans Skov-Petersen & Randy Gimblett (Chairs) ...................................................304
Applying an Agent-Based Modelling Approach to Simulating Spring Black Bear Hunting Activities in Prince William Sound, AlaskaRandy H. Gimblett, Aaron Poe & Spencer G. Lace .............................................................................................................305
Developing Agent-Based Models of Recreational Behaviours at a Landscape Scale: The Case of Recreational Fishing in Northern OntarioLen M. Hunt, Rob Kushneriuk & Nigel Lester .....................................................................................................................307
Using Computer Simulation Modeling to Monitor the Multiple Dimensions of Wilderness Solitude in Great Smoky Mountains National ParkBrett C. Kiser, Steven R. Lawson & Robert M. Itami ...........................................................................................................309
Evaluating Spatiotemporal Interactions between Winter Recreation and Wildlife Using Agent-Based Simulation Modelingon the Kenai Peninsula, AlaskaAaron Poe, Randy H. Gimblett, Michael I. Goldstein & Phil Guertin .................................................................................311
Exploring Spatial Behaviour of Individual Visitors as Background for Agent-Based SimulationKarolina Taczanowska, Andreas Muhar & Arne Arnberger ................................................................................................313
Visitor Monitoring Methods, Modeling and Data ManagementAndreas Bernasconi & Michael J. Campbell (Chairs) ........................................................................316
Monitoring Trail Use with Digital Still Cameras: Strengths, Limitations and Proposed ResolutionsMichael J. Campbell ............................................................................................................................................................317
Going Ahead: From Visitor Monitoring to Recreational Use Monitoring – The Example of the EU Regional Recreation Area Berchtesgaden National Park / Salzburger KalkhochalpenSabine Hennig .....................................................................................................................................................................322
Application of a Remote Controlled Ultralight Air Vehicle (UAV) for Park Management and Visitor MonitoringAlexander Krämer & Hans-Peter Thamm ...........................................................................................................................329
Segmentation of Visitors’ Cross-Cultural Values in Forest RecreationChieh-Lu Li, Harry C. Zinn, Garry E. Chick, James D. Absher& Alan R. Graefe...............................................................331

8
Estimating Visitor Use with a Photoelectric Counting System:A Calibration StudyChi-Chuan Lue ....................................................................................................................................................................336
The Road to a Strategic Typology of Visit ItinerariesDavid J. McVetty ..................................................................................................................................................................338
Assessing Trail Use Conditions Using Still Renderings and 3D Computer AnimationThomas Reichhart, Arne Arnberger & Andreas Muhar .......................................................................................................340
Exploring Recreation Diversity in Thailand: A Nation-Wide Study of Nature-Based Recreation Resources and BehaviorNoppawan Tanakanjana ......................................................................................................................................................342
MASOOR: The Power to Know – A Story About the Development of an Intelligent and Flexible Monitoring InstrumentRene Jochem, Rogier Pouwels & Peter A.M. Visschedijk ....................................................................................................347
Monitoring Commercial Operators’ Movements in Terrestrial and Marine Protected Areas in Australia: A Review of Challenges for Emerging TechnologiesJan Warnken ........................................................................................................................................................................351
Spatio-Temporal Variations of Visitors of Recreational Shellfish-Gathering at an Artificial Beach in Tokyo BayRyoichi Yamanaka, Motohiko Murai, Yoshiyuki Inoue & Susumu Fujiwara ........................................................................356
Visitor / User Conflicts and other Behavior StudiesNorman Backhaus (Chair) ....................................................................................................................360
Assessing User Conflicts in an Urban Forest by Long-Term Video MonitoringArne Arnberger & Renate Eder ...........................................................................................................................................361
Sequence Effect on Satisfaction Regarding Perceived Crowding: Whitewater Rafters in TaiwanChih-Peng Fang & Yi-Chung Hsu .......................................................................................................................................363
Encounter and Behavioral Norms of Hikers: A Study of the Taroko Gorge National Park, TaiwanYi-Chung Hsu & Chih-Peng Fang .......................................................................................................................................365
Monitoring of Mountain Bikers in a Sensitive Bird Area around the Tanzboden, SwitzerlandSophia Iten & Dominik Siegrist ...........................................................................................................................................367
Perceived Crowding and Satisfaction among Overnight and Day Visitors on Hallig Hooge – A Visitor Survey in the Wadden Sea National Park, Schleswig-Holstein, GermanyDennis Kalisch & Axel Klaphake ........................................................................................................................................370
Measuring Public Interest and the New Environmental Paradigm in the Transformation of a Public Park into a Protected Area “Los Colomos” Forest, Guadalajara, MexicoAna-I. Ramírez-Quintana-Carr & Hermila Brito-Palacios .................................................................................................372
Shaping Culture in Nature: Human Use Management in Canada’s Mountain National ParksKathy Rettie .........................................................................................................................................................................374
Coping With Recreation Conflict: How User Group and Value Conflicts Predict Recreation Coping and SatisfactionSue Schroeder & David Fulton ............................................................................................................................................376
Crowding in Danish Forests – a Nonexistent Problem?Frank S. Jensen ...................................................................................................................................................................378
Economic and Social Effects of Recreation and Nature TourismChristophe Clivaz & Andréa Finger-Stich (Chairs) ............................................................................380
Sample Selection Bias in Visitor Surveys: Comparative Results of an On-Site and an Off-Site Survey Assessing Recreational Benefits of ForestsKatrin Bernath & Anna Roschewitz .....................................................................................................................................381
Economic and Social Effects of the Development of Recreation and Environmentally Sound Tourism through the Example of a Hungarian National ParkRéka Bodnár ........................................................................................................................................................................383

9
The Pfyn-Finges Park (Valais/Switzerland): What Repercussions on the Regional Economy?Christophe Clivaz ................................................................................................................................................................385
Economic Analysis of Recreation by Tourists on Protected Coastal Zones: A French CaseJeoffrey Dehez & Mbolatiana Rambonilaza ........................................................................................................................387
Estimating Recreation Market Share for National ForestsDonald B.K. English, Susan M. Kocis, H. Ken Cordell & Gary Green ...............................................................................389
Modelling Visitor Expenditures at Fulufjället National Park, SwedenPeter Fredman .....................................................................................................................................................................391
Assessment of Local Economic Impacts of Recreation: The Case of Pallas-Ounastunturi National ParkMaija T. Huhtala .................................................................................................................................................................393
Are Admission Fees for Large Urban Historic Parks Feasible and Fair? Empirical Results from a Survey in the Prussian Palace Gardens in Berlin and PotsdamAxel Klaphake......................................................................................................................................................................395
How Involvement and Economical Benefits can Change Local Residents’ Attitudes of Nature Conservation and Tourism:Karula National Park, EstoniaMart Reimann & Mari-Liis Lamp ........................................................................................................................................397
Winter Sport Tourism – Victim under Conditions of Climate Change?!?Wiebke Unbehaun, Ulrike Pröbstl & Wolfgang Haider .......................................................................................................399
Exploring the Foundation of Human-Wildlife Conflict in Parks and Protected AreasFrank Jensen Sondergaard & Jerry Vaske (Chairs) ...........................................................................402
Conflict Strategies as a Task for the Management of Protected Areas – Shown at the National Park Donau-AuenChristiane Brandenburg & Karen Ziener ............................................................................................................................403
Reported Conflict between Pastoralists and Wildlife around the Ruaha National Park, Tanzania
Amy J. Dickman ..................................................................................................................................................................405
Images of Nature as Sources of ConflictMaarten H. Jacobs ..............................................................................................................................................................407
Visitor and Resident Acceptability Norms towards Wolf Management Actions
Jerry J. Vaske & Jonathan G. Taylor ...................................................................................................................................409
Human Responses to Wildlife: Stakeholder Acceptance Capacity and Human LearningHarry C. Zinn & Sharon X. Shen .........................................................................................................................................411
Bridging the Ecological and Social Science Divide in Visitor Impact Monitoring and ManagementWolfgang Haider ....................................................................................................................................414
The Ecological and Human Benefits of the Nature-Based Recreational AreaChun-Yen Chang ..................................................................................................................................................................415
Developing Spatially-Balanced Sampling Protocols for Visitor Impact Monitoring in Protected AreasDavid Pettebone, Peter Newman, David Theobald & Yu-Fai Leung ...................................................................................417
Managing Visitor Impacts along Australia’s Remote Kimberley Coast – The Forgotten Dimension of Balancing CountryPascal Scherrer, Amanda J. Smith & Ross K. Dowling .......................................................................................................419
Visitor Information and Visitor ManagementReto Rupf (Chair) ..................................................................................................................................422
Visitor Conflicts and their Resolution for Forest and Park Management in Jozankei National Forest, JapanMasayoshi Takahashi & Kazushige Yamaki .........................................................................................................................423
10
MASOOR in the Alpine Areas: Agent-Based Modelling as a Tool for the Management Planning in Natura 2000 SitesPeter Visschedijk, Ulrike Pröbstl & René Henkens .............................................................................................................425
Comparison of the Use of Communication Channels between Amateur and Serious Hikers in Fulfilling Information NeedsYu-Lan Yuan & Chi-Chuan Lue ...........................................................................................................................................427
Poster Session .........................................................................................................................................434
Monitoring Trampling Impacts in the Disposal of Human Waste at Campsites and Visitors’ Attitudes to a Carry-out SystemTetsuya Aikoh .......................................................................................................................................................................435
Tourism in Biosphere Reserves: Genesis of a Territorial Issue – Case of Ida-ou-tanane, in the High Atlas Mountain (South-West of Morocco)Lahoucine Amzil & Mohamed Berriane ..............................................................................................................................437
Recreational Impacts on Nature-Based Recreational AreasChun-Yen Chang & Hsing-Fen Tang ...................................................................................................................................439
Alternative Index of Carrying Capacity in Nature Tourism: The Relationships between Stakeholders’ Emotional Labor and Carrying Capacity of Community-Based Nature Tourism in Atayal Smangus Tribe, TaiwanChih-Liang Chao, Hsin-Hang Wang ....................................................................................................................................441
“La Semaine du Goût”, The Beginning for a Sustainable Tourism?Laetitia Estève, Christophe Le Nédic & Catherine Strehler Perrin ....................................................................................443
Participatory Planning of Recreational Areas – Landscape Development Concepts in Switzerland Corina Höppner ..................................................................................................................................................................445
Researches on the Visitor’s Activities and the Barrier Status around Kairakuen ParkTeppei Ishiuchi, Takekazu Koyanagi & Yuji Kuwahara .......................................................................................................447
Visitor Monitoring of Eight Recreational and Protected AreasTomm Jensen .......................................................................................................................................................................455
Are There Too Many Visitors in National Parks? A Campsite Analysis in Two Finnish National ParksKatja Kangas, Pirkko Siikamäki, Pilvi Koivuniemi, Pekka Sulkava, Anne Tolvanen & Yrjö Norokorpi ..............................457
Linking Forestry and People in an Urban Landscape, a Participatory Approach - Case Studies from West LondonRekha Kharel-Sharma .........................................................................................................................................................459
Visitor Management in a Floodplain Area near ZurichTobias J. Liechti, Thomas R. Burger & Stefan A. Zantop ....................................................................................................460
Prognosis on the Expected Landscape Changes in Mueritz National Park (Germany) and Landscape Perception of both Residents and TouristsGerd Lupp ............................................................................................................................................................................462
Does Survey Mode Affect Study Results? A Comparison of Internet-Based and Onsite Surveys of Visitors to Prince William Forest Park, USAAurora Moldovanyi, Brett C. Kiser & Steven R. Lawson .....................................................................................................464
3D Computer Visualizations to Incorporate Recreational Use and Values into Forest Management Planning for Ontario Crown LandsJeff Moore, Norm McIntyre, Mark Robson, R. Harvey Lemelin & Len M. Hunt..................................................................466
Biathalon Centre and Larchwood in Lenz, Graubünden, SwitzerlandFelix Naef ............................................................................................................................................................................468
Visitor Use and Impact Monitoring: An Adaptive Design ModelJessica A. Robinson & Yu-Fai Leung ...................................................................................................................................471
How to Achieve Nature Protection Involving Local PeopleEngelbert Ruoss & Catherine Strehler Perrin .....................................................................................................................473

11
Conflict between Local Villagers and Elephants (Elephas maximus) at Kuiburi National Park, ThailandSaowanee Saranet & Noppawan Tanakanjana ....................................................................................................................475
The Current Problems with the Historical Existence of Chalets in the Core Zone of the Krkonose Mts. National Park, Czech RepublicPetra Stastna .......................................................................................................................................................................477
“Naturschutzdienst BL”: Experiences from a New Project in the Canton of Basel-Landschaft, SwitzerlandYvonne Steiner Ly & Matthias Plattner ...............................................................................................................................480
Quantitative and Qualitative Monitoring of Public Attendance in Natural Preserves on the Southern Shore of Lake Neuchâtel (CH): A Necessary Tool to Manage Public Information and Prevent InfractionsCatherine Strehler Perrin, Philippe Gmür, Marius Achermann & Pierre Alfter .................................................................482
Visitor Monitoring in Tatra National ParkJuraj Svajda.........................................................................................................................................................................484
Decision Support System for Sustainable Management Planning of Nature-Based Recreation Areas in ThailandNoppawan Tanakanjana, Wanchai Arunpraparut, Nantachai Pongpattananurak, Ratikorn Nuampukdee & Theerapong Chumsangsri ........................................................................................................................................................................486
Is Maritime Antarctic Ready for the Impacts of Commercial Tourism?Pablo Tejedo & Javier Benayas ...........................................................................................................................................491
Types of Typologies - From Recreationists & Tourists to Artificial AgentsRamona van Marwijk1 & Karolina Taczanowska ................................................................................................................498
Estimating Anchor Site Usage and Potential Pollution Loads for Recreational Vessels in Moreton Bay Marine Park Using Aerial SurveysJan Warnken & Matthew Leon ............................................................................................................................................501
Nature Park Project “Toggenburg-Werdenberg” in Eastern Switzerland – Common Chance for a Regional Sustainable DevelopmentUlf Zimmermann ..................................................................................................................................................................503

12

13
Introduction
Dominik Siegrist, Christophe Clivaz, Marcel Hunziker & Sophia Iten
Management and monitoring of visitor flows in recreational and protected areas are topics of growing importance worldwide. Today more than 100,000 protected areas exist globally, and the trend shows that their number is increasing, as the IUCN statistics demonstrate. To these, we must add numerous smaller areas that also have special natural or cultural heritage values, but do not have a special protected status. Many of these areas do not only serve the protection of natural and cultural values or biodiversity, they are also important points of attraction for tourism and recreation. These areas must be professionally maintained and managed if they are to conserve their natural and landscape values in the future.
After Vienna, Austria (2002) and Rovaniemi, Finland (2004), the third international conference “Monitoring and Management of Visitor Flows in Recreational and Protected Areas” (2006) takes place in Rapperswil, Switzerland. Both of the previous host countries have pursued large scale park management strategies and established numerous new protected areas. Accompanying this, research is evolving, in which visitor flow management is finding an increasingly important place. Switzerland also has a long standing tradition in research on protected areas, although it has until now mainly concentrated on the only large protected area, the Swiss National Park in Engadin.
The creation of new parks in Switzerland has met opposition for a long time. Only lately two large protected areas have been established: the UNESCO Biosphere reserve Entlebuch and the UNESCO World Heritage site Jungfrau-Aletsch-Bietschhorn. At the moment, a modification of the Swiss federal environmental legal framework is in progress in the Swiss parliament, which should facilitate park creation in the near future. Three categories of protected areas are planned: “National Park”, “Nature Experience Park” and “Regional Nature Park”. In the coming years at least one new National Park is to be established.
With the ongoing legal revision, the debate about the protection of nature and landscapes as well as the issue of the future of remote regions enjoy new dynamics. As a result, current strategies promote the defusing of the classical antagonism between “conservation” and “development” through new synergies between protection of nature and tourism. Remote regions will benefit from a new economic functionality due to the creation of protected areas, and it should be expected that natural and cultural heritage will be professionally managed. Since human use is a central issue of the newly created parks, funded monitoring and expert visitor flow management will gain increasing significance.
From this background, these proceedings contain contributions pertaining to four central questions:
1. Which impacts do tourist use and recreational activities have on recreational and protected areas and how can these be presented?
This question addresses the advancement of research in visitor monitoring methods, visitor modelling and data management. What new results have been found in recreation ecology and visitor impact research? What are the latest developments in the study of visitor/user conflicts, behaviour studies, sustainability and carrying capacity studies? How are new methods for simulating recreational behaviour through agents progressing? How can we bridge the ecological and social science divide in visitor impact monitoring and management?
2. Which images of landscape, nature and wildlife are the basis for the use and management of recreational and protected areas?
14
This question aims to investigate society’s perception of landscape as well as the implications for visitor management. How do landscapes act as push and pull factors of leisure motivation? Which images of the landscape are tied to the concept of sustainable development? What is the state of research in exploring the foundations of human-wildlife conflicts in parks and protected areas?
3. What requirements must be met for regional development and nature based tourism to take place in relation to recreational and protected areas?
This question addresses new paradigms of regional development in the context of large protected areas. Which concepts and experiences arise in the domains of nature recreation and nature tourism and what economic and social effects are to be expected? How can one increase the value added of a protected area without diminishing the quality of the landscape and biodiversity?
4. How relevant is research for actual practice and how are research results integrated into planning and management?
This question examines the significance of visitor monitoring data for management, planning and policy and for visitor information. Which requirements exist for recreation and how can they be integrated into landscape planning? What value can be given to participation processes? What do good solutions between sports, nature and landscape look like?
These questions are discussed by scientists and managers from almost 30 countries and we are pleased to welcome so many to this MMV3 conference. This active participation is a positive sign for the network of experts that has developed to such prosperity in few years. The following proceedings contain the contributions which were accepted for presentation at the MMV3 conference. The choice was offered to the contributors to submit a short abstract or a longer extended one. The sessions are listed here in the order they are given at the conference. Within the different sessions, the presentations are sorted alphabetically by the first author’s name. The full speeches made by the invited keynote speakers are also included. An index of authors at the end of the volume will make finding a contribution easier.
To guarantee scientific quality, each submitted presentation was given a blind reviewing by two international experts who read the contributions critically and commented them anonymously. Many were accepted, others were returned for a minor or major revision. As linguistic quality was not a criterion for acceptance, the contributions were edited in the compilation of the proceedings. We would like to give sincere thanks to all the reviewers for their support.
At this point we would like to recognize all those who contributed to the success of the MMV3 conference. Special thanks go to the partner institutions and the members of the National Organizing Committee for their active assistance in making this conference possible. We thank the members of the International Steering Committee for their valuable guidance and suggestions. In particular we thank the University of Applied Sciences Rapperswil, the Swiss Federal Institute for Forest, Snow and Landscape Research, the University of Applied Sciences Western Switzerland, the University of Applied Sciences Wädenswil, the SANU – Training for Sustainable Development, the Swiss National Fund and the Swiss Academy of Sciences for their financial and material support. Last but not least we would like to thank the session and workshop chairs as well as all the contributors, upon whose work the scientific quality of the MMV3 conference depends.

15
Keynote Addresses

Siegrist, D., Clivaz, C., Hunziker, M. & Iten, S. (eds.) (2006). Exploring the Nature of Management. Proceedings of the Third International Conference on Monitoring and Management of Visitor Flows in Recreational and Protected Areas.
University of Applied Sciences Rapperswil, Switzerland, 13-17 September 2006. Rapperswil.
16
North American Idols: Personal Observations on Visitor Management Frameworks and Recreation Research
Wolfgang Haider
Simon Fraser University, Canada
North American visitor management frame-works and the closely associated outdoor recre-ation research paradigm are frequently the envy of recreation researchers and managers in Eu-rope and around the world. In many countries, initiatives have been started to explore the ap-plicability of these frameworks, and an ever in-creasing number of recreation studies follow the theories, concepts and methods originally devel-oped in North America. In Europe their popular-ity spread first to Great Britain and Scandinavia, but lately, other European countries also follow that trend. Inevitably questions arise about the applicability and suitability of these methods in many European settings, where the smaller scale of administrative units, national boundar-ies, and cultural as well as natural landscapes constitute management challenges to the un-conditional roll-out of these frameworks. I will reflect on the relationship between the frame-works and recreation research, attempt to iden-tify future trends, and comment on the Europe-an situation.
Visitor Management Frameworks“Visitor management frameworks provide a sys-tematic process so that managers (or decision pro-cesses) are fully aware of (1) the desired future they wish to attain, (2) the alternative routes to the future, and (3) consequences of those alternatives.” In addition, these frameworks provide the explic-itness and feedback needed in a time of change, complexity and uncertainty (McCool 2005, p4). They provide land managers and agencies with pragmatic guidance, a standardized approach to management, simplified bureaucratic procedures, and guidance for research and monitoring. They also emphasize the need for public participation,
and the dissemination and presentation of future scenarios and research results to decision mak-ers, stakeholders and the public.
In North America the need to manage recre-ation activities on public lands emerged during the 1960s and 1970s when increasing affluence and mobility of the emerging post-industrial so-ciety created more demand for these kinds of land uses. In response, the public land manage-ment objectives changed from sustained yield (with the primary goal to maximize extractive forest uses) to multiple use objectives. At the same time environmental concerns also lead to widespread concerns about the traditional for-est management practices, while concerns over conservation lead to the establishment of pro-tected areas (National Parks, Wilderness areas, etc.). These latter places required visitor man-agement in their own right. In North America the focus of these recreation activities and their management is on huge tracts of public land, administered by large land management agen-cies who are in need of homogenous manage-ment approaches.
Early challenges of recreation management were driven by simply questions of carrying capacity: “How much recreation use can be accommodat-ed without threatening the preservation and con-servation concerns of parks and protected area” (Manning 2004), or other commercial uses on public land? It became apparent quickly, that a simple supply side management approach was insufficient, because carrying capacity is a func-tion of management actions, and in the case of human activity is influenced by the desired ex-periences. This recognition gave rise to the no-tion of a spectrum of recreation opportunities,

Keynote Addresses
17
and lead to more complete frameworks following a rational planning philosophy. At the core of most frameworks are the following stages:
1. Formulation of management objectives that are expressed by quantitative indicators and standards of quality.
2. Monitoring of indicator variables to determine their condition relative to standards of quality.
3. Application of management actions to ensure that standards of quality are maintained.
4. Most frameworks suggest that public participa-tion guides the entire implementation.
Indicators are measures of resource or social con-ditions, which should be measured cost-effectively and accurately; should reflect some relationship to the amount or type of use occurring; social indica-tors should be related to user concerns; and must be responsive to management control. Typical exam-ples of widely used indicators are water quality, soil compaction, or number of encounters.
Standards express the level of the indicator beyond which change is unacceptable. Standards may re-flect existing conditions or future targets. Regard-ing encounters with other users, one may desire to manage a trail for no more than x encounters with other hikers per day. Standards may be homoge-nous throughout one management area, or may dif-fer between zones. Standards are the crucial con-cept for the operationalization of a framework, and in many situations a standard is formulated around the concept of ‘acceptability’.
Finally, monitoring determines when and where management action is needed in order to maintain standards of quality, and also provides means for revision and improvement of standards. The appli-cation of a framework is not an end in itself but an iterative process fitting the spirit of adaptive man-agement (Walters 1986).
These frameworks differ by their specific purposes and/or agency needs, and are strongly influenced by the ability of managers to share power with stake-holders, or vice versa the desire of stakeholders to do so (Newsome et al. 2003). The Limits of Ac-ceptable Change (LAC) framework (Stankey et al. 1985) has been proposed as the fundamental visitor management framework for wilderness areas, and
also includes an ROS component (Clark & Stan-key 1979) for larger scale zoning. It also served as a blueprint for the later frameworks. The Visitor Impact Management (VIM) framework (Graefe et al. 1990), developed for the US Park Service has a stronger emphasis on impacts and a more top-down agency driven management approach. The Visi-tor Experience and Resource Protection (VERP) framework (Manning 2001, US Dept. of the Inte-rior 1997) suggests a focus on parks purpose and management objectives, and advocates a strong public participation strategy. Parks Canada exper-imented with a more activity focused framework, the Visitor Activity Management Process (VAMP) (Nilsen & Tayler 1997), and is currently develop-ing an experience based framework. The only ma-jor adaptation of a visitor management framework outside of North America produced the Tourism Optimization Management Model (TOMM) (New-some et al. 2003) in Australia, which is focused on the complexities of a tourism destination, including private entrepreneurship. No detailed description of the various frameworks will be provided here, as they are readily available in published texts (e.g. Newsome et al. 2003).
Below I will explore the relationship between these frameworks and research. Modern manage-ment principles such as ecosystem management (Grumbine 1994) and adaptive management (Wal-ters 1986) emphasize the importance of research in resource management in general, and visitor man-agement frameworks should function in a similar manner. Many links between these visitor manage-ment frameworks and recreation research are fair-ly obvious, but explicit comments about them are rather scarce.
Recreation Research
Usually outdoor recreation research is associated with a fairly distinct research tradition and body of literature, which has its root in North Ameri-ca and is heavily influenced by social psycholog-ical theory, concepts and methods. During the be-ginnings of recreation research in the 1960’s it became apparent very quickly that a focus on the management of supply (i.e. opportunities) was in-sufficient. Instead, the notion of a triad between

Keynote Addresses
18
opportunities, activities and experiences was con-ceived, which is crucial to the first visitor manage-ment framework, the ROS. Thus, the importance of social sciences was apparent to managers and academics alike, and lead to the pivotal position of social psychology as the arguably most influential discipline of early outdoor recreation research (e.g. Driver 1976). This way of thinking directed ear-ly recreation research to specific recreation relat-ed topics and theories such as research on crowd-ing, recreation conflict, displacement and product shift, recreation specialization, and the application and adaptation of more general social and or psy-chological concepts such as satisfaction, motiva-tion, and norms and standard research. By the time the visitor management frameworks were concep-tualized, a paradigm of outdoor recreation research was well established (see below) and obviously the same group of researchers was highly influential in the development of these frameworks.
In short, within 15 years, a strong recreation re-search ‘paradigm’ had established itself with a sound theoretical base, an important set of ap-plied research questions, continued agency need and support for research, academic based train-ing of students who would grow into these agen-cy jobs, and a peer reviewed literature lead by such journals as Journal of Leisure Research and Lei-sure Sciences. Even though these journals carried surprisingly few publications about frameworks, the recreation research ‘paradigm’ propagated by these journals continuously influenced decisions of framework guided management processes (e.g. norms research on crowding). Before moving into a discussion of outdoor recreation research para-digm and the recent trends and future options, I would like to present Kuhn’s concept of the scien-tific paradigm an its evolutionary processes, and then discuss outdoor recreation research within Kuhn’s framework.
Recreation Research as a Scientific Paradigm
The notion of a research paradigm has been intro-duced by Kuhn in 1970, and he observed four stag-es in the progression of science:
1) Normal science is conducted over a long peri-od of time by a group of scientists forming a dis-tinctive discipline, working within a paradigm, and accepting a self-imposed framework of theo-ry, objectives, and techniques. This acceptance is what Kuhn means by tradition-bound. Scientists are suing theory, not challenging it.
2) Appearance of discrepancies within the para-digm. These are observations of experimental re-sults at odds with the propounded theory rather than expanding or amplifying it. There may be no immediate attempt to change the theory in order to accommodate these discrepancies.
3) A revolutionary period, short compared to the period of normal science, during which discrepan-cies are resolved in a new theory. The new theory is generated from outside the established practi-tioners of the normal science rather than logically developed from within the group.
4) Solidification of the new theory into a new paradigm, which gathers new adherents. The new group of scientists then proceeds to conduct an-other period of normal science. Research under the old paradigm may continue – but at a reduced level of activity – and it eventually ceases. (Kuhn as quoted in Ford 2000, 312)
According to Kuhn’s observations, by the late 70s / early 80s recreation research carries most of the traits of a mature paradigm in a place where none existed 15 years earlier. It represents a clearly de-fined applied academic discipline, offers well es-tablished academic programs, relevant journals, and pursues a wide range of applied research questions that follow the paradigm.
Now, 25 years later the question may be asked if the paradigm is still intact as it was originally, if it has changed gradually, or if indications towards a serious and radical paradigm shift can be ob-served. First, there are definitely a number of in-dications of a healthy paradigm of ‘normal sci-ence’, as described by Kuhn’s Stage 1.
The theoretical basis of outdoor recreation re-search which draws heavily from social psy-chology and some related disciplines has, and still is, making important contributions. The

Keynote Addresses
19
theories which are, in Kuhnian terms, slowly advancing and are repeatedly applied and test-ed, are as relevant today as they were initially.
The fact that the field came together so quick-ly and withstood the test of time reflects a need for this research. The paradigm now represents a fairly standardized field of inquiry, which pro-vides important continuity for agencies as the main users of this applied research.
Certain areas of outdoor recreation research have seriously influenced the design and implementa-tion of visitor management frameworks; for ex-ample the entire area of norms based research, especially in the area of perceived crowding.
The two major journals of outdoor recreation re-search, Leisure Sciences and the Journal of Lei-sure Research have become the main outlets of the academic work, and continue to thrive. They have shown a certain capacity of adaptation by expanding the scope of theoretical cover-age, most notable into the qualitative and post-modern research ‘revolution’ of the 1980s and 1990s.
However, one can also observe a number of dis-crepancies (Stage 2), to say the least. Arguably, these discrepancies do not affect the theory or the-ories per se, but are predominantly methodologi-cal, and also pertain to other aspects of the modus operandi of recreation research.
One main discrepancy appears with the research methods applied. Even today, the majority of research in outdoor recreation relies on meth-ods developed during the 1970s in conjunction with the theoretical aspects of the paradigm, and ignores recent methodological advances. For example, the classical research on attitudes, val-ues and preferences, using single item scaling, is still widely used today. It is fundamental to the academic process of testing and re-testing of many of the theories, and provides great insights into various behavioral antecedents. However, when it comes to predicting human behavior, as is the explicit goal of the theory of reasoned ac-tion (Ajzen and Fishbein, 1980), the link from attitudes to intended behavior an actual behav-ior is rather tenuous. Significant methodologi-cal progress with various multivariate methods
(i.e. revealed and stated preference/choice mod-eling) finds its way into the core recreation lit-erature surprisingly slowly.
The main recreation journals appear to scruti-nize submissions predominantly for their theo-retical contribution, or at least for a sound the-oretical basis of the applied research presented. Inevitably, such a screening mechanism pre-cludes top level peer reviewed debate on impor-tant management questions, on the application of frameworks, and other legitimate issues asso-ciated with applied research.
The heavy emphasis on theory testing within a case study context makes a conceptual debate challenging, because contributions without an empirical component have a much lower chance of acceptance.
The focus on theory also precludes serious methodological debate, especially about emerg-ing methods, as well as their rapid dissemina-tion. This barrier affects methods pertaining to research on theories, and even more so meth-ods and concepts which might be important for practitioners or in the implementation of man-agement frameworks (i.e. monitoring). For ex-ample, Manning (2004) points out that “there is little guidance to be found in the professional and scientific literature on cost-efficient and ef-fective monitoring approaches and techniques.”
The main journals remain largely closed to an expanded set of research questions, approach-es and solutions, which frequently appear in the management context. Besides monitoring and enumeration issues, the ‘classical’ literature rarely covers articles containing GIS or GPS ap-plications, or any state-of-the-art more sophisti-cated modeling approaches. The last few issues of the major journals might indicate the overdue departure from this point of critique, as sever-al papers contain state-of-the-art methods, albeit mostly embedded in traditional theory.
Consequently, it comes of little surprise that many important papers on recreation are pub-lished outside the traditional domain of recre-ation research. For example, a large number of papers on recreational fishing by leading re-source economists can be found in the resource

Keynote Addresses
20
economics literature. Unfortunately, these pa-pers are written for the purpose of developing economic theory and/or modeling, and cater to a very different audience, going largely unnoticed by recreation managers, and even by many of the recreation researchers (for a summary see Hunt 2005).
If one evaluates the visitor management frame-works through a similar lens, a somewhat different picture emerges. Many applications of these frame-works by many jurisdictions across North America as well as occasional applications elsewhere have taken full advantage of state-of-the-art methods and techniques. Public participation processes and information dissemination are further enhanced with web-based technology, GIS based maps sum-marize information, and visualizations of possible future scenarios further debate (see the LAC sites for the Daniel Boone National Forest for an exam-ple (http://www.fs.fed.us/r8/boone/lac/). Occasion-al negative examples of framework applications also exist, in which an agency uses the framework merely as a prescriptive management or inventory-ing tool (e.g. the ROS in British Columbia).
This observation of a dynamic and innovative en-vironment around the visitor management frame-works, contrasts with the rather conservative mode of conduct of ‘normal science’ within classical rec-reation research. Maybe this discrepancy in itself indicates a paradigm shift, and the answer will de-pend on a precise definition of the term paradigm. In my opinion, these observations signal a signif-icant expansion of recreation research, towards much more interdisciplinarity. This shift seems to be driven more by the practitioners than by the es-tablished researchers. In all likelihood, academ-ics will remain in respective niches, but managers ought to embrace these new opportunities and be-come much more interdisciplinary in their outlook. Apparently outdoor recreation research is morph-ing into a much larger endeavor than the classical lens alone would suggest.
Future Research Directions
Manning (2004) lauds the frameworks “for mak-ing the trade-offs inherent to the management is-sues transparent on a conceptual basis.” McCool
(2005) observes “a growing need for frameworks and concepts that assist decision makers in assem-bling a set of informed alternatives and evaluat-ing them.”
To this I would add that conceptual transparency of trade-offs is certainly an important trait of pub-lic processes, but by now social science methods exist which can contribute to this need more ex-plicitly. And McCool’s jargon actually reflects the language of decision analysis, without making any further use of it. Taking advantage of these tech-niques should represent the next logical step in the development of these frameworks. It would bring the social science contributions to the decision making processes on par with the natural science information, and decision makers and stakeholders alike will work with values and trade-off positions of the various interest groups explicitly, instead of relying on anecdotal evidence of round tables.
Decisions support tools can be based on revealed and/or stated choice models which document the trade-off positions of user and stakeholder groups. A more formal framing of a decision problem along a decision analysis concept would provide a tight framework for monitoring, data collection, analy-sis, and a formal track record of decision making. Yet hardly any applications of decision analysis in recreation management in general or visitor man-agement specifically exist (for a first attempt see Rudolphi & Haider 2003).
Closely related is a move towards integrated mod-eling, in which ecological, managerial and recre-ational information are organized in a related man-ner, and subcomponents of the respective models influence each other. It is conceivable that social science information on values and trade-offs be collected in such a manner that it can be applied in spatially explicit GIS models.
Are these North American Visitor Management Frameworks Applicable in Europe?
As I have claimed in the beginning, in Europe these types of frameworks are – with some ex-ceptions- absent. With the exception of some at-tempts in Scandinavia, no visitor management frameworks have been applied in Europe to this day. The most obvious explanation might be that they simply were not known due to language bar-
Keynote Addresses
21
riers, which prevented many practitioners, and to a lesser extent academics, to delve into the relevant North American literature. However, that would be too simplistic. Instead the main causes seem to be of a legal and structural nature, as well as a very different research environment.
The different land ownership structure seems to be crucial. While North America contains huge amounts of public lands, only some regions in Eu-rope, most notably in Scandinavia have a similar dominance of public land ownership. In the re-mainder of Europe land ownership is a much more complex patchwork of private and several layers of public owners, leading to a much more diverse management structure which is much less con-ducive to rolling out generic management frame-works. Instead, one finds a diverse set of locally adapted, and sometimes unique, planning appli-cations. Access to recreation opportunities should also be considered, which seems to be more read-ily available in most European nations compared to North America. In Scandinavia, the ‘everyman’s right’ provides ubiquitous recreation access on all land. And in most continental European coun-tries, various blends of legislation and local cus-toms provide wide recreation access. In tourist ar-eas, such as the Alps, the importance of recreation and scenic services over forestry have long been decided in favor of recreation. The combination of already established broad public recreation access and many private landowners is not very condu-cive to recreation management frameworks.
At the same time, Europe has developed very dif-ferent types and notions of protected areas, which lead to different planning approaches. In North America, significant portions of land (up to 10-12% in many jurisdictions) are protected from most commercial uses in parks. Consequently, they designed their own recreation management ap-proaches. In Europe, on the other hand, strict pro-tected areas are few, while nature parks, landscape protection areas, and Natura 2000 allow many oth-er land uses. Furthermore, throughout Europe, re-gional identity is of utmost importance, especial-ly in the more peripheral areas which serve as the prime recreational and tourism areas. This region-alization requires more specific local planning and management solutions. Many European planning
processes have applied some of the quintessen-tial components of the visitor management frame-works already - sometimes deliberately, sometimes coincidentally, as they simply followed a common sense approach. Many of these applications have grown organically out of the respective process-es, and throughout Europe, public participation and the use of standards have become widespread planning and management tools with or without an explicit framework. For example, the EU-directive governing Natura 2000 areas mandates public par-ticipation for the management planning process. Its implementation varies enormously between various jurisdictions.
The restructuring of academic institutions through-out Europe has introduced a much more competi-tive environment, in which researchers must com-pete internationally for grants and for publications in the peer reviewed literature. Many of these re-searchers, and their students who eventually end up as managers, did not get trained in the classi-cal recreation research paradigm, and might there-fore be much more open to innovation and to state-of-the-art research approaches with focus on the research goals. Hence European research has an opportunity to establish itself on par with North American research.
In summary, given these discrepancies between European and North American approaches to and traditions in recreation management and research, further exchange of ideas between these positions will be beneficial to both parties.
References
Ajzen, I. & Fishbein, M. (1980). Understanding Attitudes and Predicting Social Behavior. Englewood Cliffs.
Clark, R.N. & Stankey, G.H. (1979). The Recreation Op-portunity Spectrum: A Framework for Planning, Man-agement and Research. Gen. Tech. Report PNW-98. Portland.
Driver, B.L. (1976). Towards a Better Understanding of the Social Benefits of Outdoor Recreation Participation. Ashville.
Ford, D.E. (2000). Scientific Method for Ecological Re-search. Cambridge.
Grumbine, R.E. (1994). What is ecosystem management? In: Conservation Biology (8/1), p 27-38.

Keynote Addresses
22
Hunt, L. M. (2005). Recreational fishing site choice mod-els: Insights and future opportunities. In: Human Di-mensions of Wildlife (10), p 153-172.
Manning, R. (2001). “Visitor experience and resource pro-tection: A framework for managing the carrying ca-pacity of national parks.” In: Journal of Park and Rec-reation Administration (19), p 93-108.
Manning, R. (2004). Recreation Planning Frameworks. In: M. J. Manfredo, J.J. Vaske, B.L. Bruyere, D.R. Field, P.J. Brown (eds.). Society and Natural Resources – A Summary of Knowledge. Prepared for the 10th Intl. Symposium on Society and Resource Management. Jefferson.
McCool, S. (2005). Outdoor recreation in the new century: frameworks for working through the challenges. Pre-sentation at the 2005 Society of American Foresters National Convention, October 19-23, Ft. Worth, TX.
Newsome, D., Moore, S.A. & Dowling, R.K. (2002). Nat-ural Area Tourism – Ecology, Impacts and Manage-ment. Clevedon.
Nilsen, P., & Tayler, G. (1997). A comparative analysis of protected area planning and management frameworks. In S.F. McCool and D.N. Cole (eds.) Proceedings of a Workshop on Limits of Acceptable Change and Re-lated Planning Processes: Progress and Future Direc-tions, University of Montana’s Lubrecht Experimen-tal Forest, Missoula, MT, May 20-22, 1997, p 49-57. Odgen.
Rudolphi, W. & Haider, W. (2003). Visitor management and ecological integrity: one example of an integrat-ed management approach using decision analysis. In: Journal for Nature Conservation (11), p 346-354.
Stankey, G.H., Cole, D.N., Luca, R.C., Petersen, M.E., Frissell, S. (1985). The Limits of Acceptable Change (LAC) System for Wilderness Planning (Gen. Tech. Report, INT-176. Odgen.
US Dept. of the Interior, National Park Service (1997). VERP – Visitor Experience and Resource Protection (VERP) Framework – A Handbook for Planners and Managers. Denver.
Walters, C. (1986). Adaptive Management of Renewable Resources. New York.

Siegrist, D., Clivaz, C., Hunziker, M. & Iten, S. (eds.) (2006). Exploring the Nature of Management. Proceedings of the Third International Conference on Monitoring and Management of Visitor Flows in Recreational and Protected Areas.
University of Applied Sciences Rapperswil, Switzerland, 13-17 September 2006. Rapperswil.
23
Trends in Alpine Tourism: The Mountaineers’ Perspective and Consequences for Tourism Strategies
Andreas Muhar, Thomas Schauppenlehner & Christiane Brandenburg
University of Natural Resources and Applied Life Sciences, Austria
[email protected]@[email protected]
Keywords: Alpinism, summer tourism, mountaineering, hiking, climbing, user survey, use trends, demands.
Summary: Mountaineers are a core group in Alpine tourism, their demands and expectations are an es-sential founda-tion for every tourism development strategy. This paper is based the authors’ surveys and other studies from the Alpine region. The image of mountain sports in the media (extreme climbing, paragliding, canyoning etc.) does not reflect the actual use patterns, as hiking is still by far the most important activity. Mountaineers are a very conservative group, usually well educated and of higher income. They perform this activity frequently and are generally satisfied with the current situation, thus sceptical towards any changes and man-agement measures. Mountaineers accept lower comfort levels, e.g. in huts, as compared to their everyday life as part of a back-to-the-roots experience. If tourism development strategies want to attract new user groups, they need to comply with the demands of this core group.
Introduction
The mountain ranges of the Alps offer a wide vari-ety of opportunities for landscape based recreation and tourism. Traditional alpinist activities are hik-ing and climbing in summer and downhill as well as cross-country skiing in winter. These long estab-lished mainstream sports have been complement-ed in the past decades by numerous other activities such as mountain biking, canyoning, paragliding, snowshoeing, waterfall climbing, often referred to as ‘trend sports’. There is extensive media cover-age of these trend sports, thus also shaping the pub-lic image of alpine sports as a whole: for lifestyle and leisure magazines it is much more attrac-tive to report on extreme sports rather than on ‘old-fash-ioned’ activities such as hiking. As most of the trend sports are highly commercialised, the media cover-age is also often financed by tour operators or out-fitters as part of their marketing campaigns. How-ever, is this image consistent with reality? Doesn’t the majority of mountain tourists still perform the traditional activities hiking, climbing and skiing? How do they themselves perceive trends and de-mands for action in mountain tourism?
This article specifically addresses issues of moun-tain tourism in the summer season. Since the mid 1980s there has been a significant change in many Alpine regions regarding to the seasonal distribu-tion of tourism, with winter tourism still boom-ing and summer tourism stagnating or in decline (see also Lüthi & Siegrist 1996). Tourism boards in various regions are concerned about the further development, as a two-seasonal utilisation of the touristic infrastructure (hotels, restaurants etc.) is essential for the economic sustainability of regions depending on tourism income.
Project context
The project “Trends and Needs of Action in Sum-mer Mountain Tourism” was commissioned by the Tourism Section of the Austrian Federal Ministry of Economy and Labour within the framework of the “Plattform Sanfter Bergtourismus” (Platform Soft Mountain Tourism), a cooperation of major players of the Austrian tourism industry. The study was conducted by the Institute of Landscape De-velopment, Recreation and Conservation Planning at BOKU University of Natural Resource and Ap-

Keynote Addresses
24
plied Life Sciences Vienna in the year 2005. The main goal was to identify the current activities and behaviour patterns of the core group of mountain tourists, which is characterised by the activities of hiking and climbing, further to detect significant trends and to provide base information for the for-mulation of touristic strategies.
Target groupThe target group of the study was the current pop-ulation of mountaineers and mountain hikers in the Austrian Alps. They can be seen as the core group of mountain tourism, and any touristic strategy has to consider the needs and expectations of this group. Many different terms are used to describe activities in this context, such as “hill walking”, “mountain hiking”, “mountaineering” and “moun-tain climbing”. There are no universally valid def-initions for these terms, nor is it possible to sepa-rate them from each other without overlaps. In the context of our study we use the term “mountain hiking” (in German: “Bergwandern”) for walk-ing in mountainous terrain on tracks or off track, usually without the need of using the hands or any specific equipment. Opposed to that, “mountain-eering” (German: “Bergsteigen”) often involves the use of the hands to proceed, as well as techni-cal equipment such as ropes, ice axes or crampons (see Munter 1988, Lorch 1995, Brämer 2001). Therefore, mountaineering requires more specific knowledge, skills and training than mountain hik-ing. Both activities have in common a high depen-dency from the environment and actual conditions such as weather and natural hazards.
Study designThe study was conducted via on-site interviews using a structured questionnaire. In order to sepa-rate the target group from other mountain visitors, e.g. tourists accessing summits by cable cars, inter-views were conducted in mountain huts, access to which involves at least two hours of walking from the closest starting point such as roads or lift sta-tions. In total, 1189 interviews were achieved on 44 huts in different ranges of the Austrian Alps, cov-ering both the more easily accessible lower moun-tain ranges of Eastern Austria and the higher and in parts also heavily glaciated ranges of Western Austria, which are usually visited by more ex-peri-
enced and well equipped mountaineers. The inter-views were conducted in afternoons, which is the time when mountaineers return from the tours to the huts and when they are usually open to discus-sions. The rejection rate was relatively low, less than 20% for overnight visitors and less than 30% for day visitors, who needed to descend down to the valleys on the same day and therefore had less time for an interview.
Reference dataThe results from the survey were compared with data from other sources, such as demo-graphic data and other touristic survey studies, in particu-lar the Tourism Monitor Austria 2004 (T-MONA), the most important general tourism survey in Aus-tria with a data base of about 15000 interviews. Comparisons were also made to studies from other Alpine countries, e.g. Switzerland (SAC 2004).
Selected Results
Demography of mountaineersCountry of origin: The largest group of mountain tourists in our study are visitors from Ger-many (43%), followed by domestic tourists (35%) and tourists from the Netherlands (12%), thus reflect-ing the general visitor structure of Austrian tour-ism outside the major cities.
GenderMountaineering has for a long time been a male domain. In our survey we had 60% male and 40% female interviewees, indicating a still unbalanced gender distribution.
Age
The mean age of the sample was 41 years. When comparing the data from the survey with the gen-eral age distribution of the population in the coun-tries of origin, it can be observed that the age group under 24 years is significantly underrepresented. Mountaineering can not really be seen as a typical activity of the younger generations, which it had been traditionally. Whilst rock climbing is a pop-ular sport throughout the Alpine countries, attract-ing large crowds to competitions and show events often staged indoors, it does not seem to promote nature based mountaineering.

Keynote Addresses
25
Education
The survey sample had a surprisingly high per-centage (41%) of persons with completed tertia-ry education, compared to the general mean of about 15% in both Germany and Austria. This re-sult proves findings from other studies which also reported a very high proportion of highly educat-ed persons engaging in hiking and mountaineering (e.g. Brämer 2000).
Income
Questions about the interviewees’ income were not included in the survey, however, as education is often correlated to income, it can be assumed that many mountaineers are also in income levels above the average.
Membership in Alpine Clubs
62% of the persons interviewed are members of Al-pine Clubs, however, only a small group of moun-taineers are actually active members engaging in the club life (group tours, social events etc.). Most mountaineers join Alpine Clubs only to re-ceive discounts on huts and to benefit from the mountain rescue insurance which is usually included in the membership fee.
Character, frequency and organisation of toursDays spent in the mountains: Most mountain hik-ers and mountaineers have a high commitment to alpinism, as they perform their activities frequent-ly, spending in average 17 days per year in the mountains, which covers a considerable part of the individual leisure time budget.
Length of tours
About 70% of the persons in the sample have been interviewed during overnight tours, the average duration of the tours was between three and four days.
Activities
Mountain hiking without climbing is the dominant type of activity, although 40% of the interviewees also occasionally perform rock climbing or gla-cier tours. A specific activity of the Eastern Al-pine mountain ranges is Via Ferrata climbing, i.e.
rock climbing in routes provided with wire ropes, iron handrails, ladders etc. enabling less skilled climbers to experience the atmosphere of exposed climbing terrain. There is a large range of Via Fer-rata tours in Austria, Slovenia and Italy, and about 70% of the persons interviewed climb such routes at least occasionally. This means that Via Ferrata climbing is performed more often than classic rock climbing. Only a very small part (less than 10%) of the persons interviewed have experiences with activities such as canyoning, white water kayaking or paragliding. This is of course in contrast to the image communicated in media and in particular in touristic marketing campaigns.
Organisation mode
Most mountaineers prefer to organise their tours individually, alpine activities are usually per-formed in small groups of three to four persons. Larger groups are usu-ally only found on huts where training courses are held by alpine clubs or by professional mountaineering schools. There is little demand for all-inclusive tour packages. Hir-ing professional mountain guides is much less common in Austria compared to the situation in the Western Alps of Switzerland.
Travel mode
Mountain sports in Austria rely to a great extent on access by car. Less than 15% of the persons inter-viewed travelled to the starting point of their tour by public transport. Therefore car traffic and the related effects can be seen as the major environ-mental impact of mountain sports.
EquipmentInterviewees were asked about safety and emer-gency equipment. Some results were surpris-ing, in particular the relatively low use of GPS technology for navigation as opposed to tradi-tional navigation instruments such as compass and altimeter (figure 1). More than 80% of the persons interviewed indicated that they never used a GPS device.
While most mountaineers carry some first aid kits with them, bivouac sacs, which can be es-sential in sudden weather changes in high al-pine areas, are obviously not seen as part of the standard equipment. With the wide spread use

Keynote Addresses
26
of mobile phones and improved reception con-ditions in many mountain ranges, mountaineers seem to assume that rescue services can easily be alarmed in emergency situations.
Satisfaction levels and conflict potentialsA number of questions referred to specific de-mands concerning facilities and services e.g. on huts, and to conflicts with other touristic user groups such as mountain bikers or other land uses such as farming or forestry. It could be ob-served that the general satisfaction level is very high, and only few conflicts with other uses were reported. In particular, the conflict lev-el concerning nature protection is very low, as conservation regulations usually do not impose restrictions on alpinist activities. This is in con-trast to the situation e.g. in rock climbing ar-eas in Germany, where there is a long history of conflicts between conservation and climbing.
Consequences for touristic strategies and needs for action
As stated before, summer tourism in the Alps is in decline, threatening the economies in many regions depending on tourism income. Touris-tic strategies to stabilise or moderately increase the visitation have of course to consider natu-ral conditions, which limit the development op-tions, but also the needs and demands of the cur-rent visitor population.
Focus on core activitiesIn recent years, “adventure activities” such as can-yoning, paragliding or white water rafting have been in the centre of touristic marketing concepts. The Alps have been advertised as an adventure ground. Our data show that hiking is still by far the most dominant activity, and it can be assumed that this will not change in the future, in particular in the context of an aging society (see Opaschows-ki 2004). Therefore, marketing strategies should rather focus on the core activities than on activi-ties which obviously are attractive only for a very small group of tourists.
Activation of potential visitor groups with similar expectationsMountain huts, where most visitors spend their nights, are a very sensitive social environment, as they accommodate a relatively large number of vis-itors in a small space. Introducing new, fun- or ad-venture- oriented user groups to this environment would most probably cause conflicts with the cur-rent population.
Female mountaineers as welcome visitorsTouristic strategies in Alpine areas rarely target fe-male hikers or mountaineers. The traditional im-age of mountaineering as a male domain might de-ter potential visitors, and male chauvinism can still be found on some huts. A marketing campaign to attract more female visitors would therefore also need to be complemented by awareness training e.g. for hut wardens.
0%
20%
40%
60%
80%
100%
Mobile phone GPS -navigation
Compass Altimeter First aid kit Hiking maps Hiking books Bivouac sac Hiking sticks
Answ
er cl
asse
s in
%
mostly often occasionally never
Figure 1: Safety and emergency equipment carried with by mountain hikers and mountaineers (N=1189).

Keynote Addresses
27
Coordination of information sources on the internetCurrently there is a plethora of websites for moun-taineers offering tour information, discussion fo-rums, GPS tracks etc. Some of the platforms are purely commercial, others managed by region-al tourist boards, alpine clubs or just by amateurs. Even for experienced web users it is often difficult to identify the most relevant websites for a specif-ic region. The major players of Alpine tourism are challenged to improve this chaotic situation e.g. by forming a joint portal.
Reduction of entry barriersMountain hiking and in particular high alpine mountaineering require a certain level of fitness, skills and experience as well as some special equipment. The current visitor population is very much dedicated to this sport, however, the non-mountaineers seem to perceive a high entry barri-er. This needs to be overcome by low-level offers such as guided one-day tours rather than talking candidates into full-week training courses.
Intensification of youth workYouth work in Alpine Clubs is obviously successful in the context of sport climbing, which more and more develops into an indoor sport. However, tra-ditional nature-based activities seem to be less at-tractive for young people. In former times, moun-taineering was one of the few affordable touristic activities for young people in Alpine countries, to-day’s more affluent youth also has much more op-tions. It also appears, that people pursuing outdoor activities on a regular basis in their childhood, tend to continue these activities as adults (Ward Thomp-son et al. 2005). The fact that outdoor activities of children generally decreased in the past decades therefore is a big challenge for designing outdoor programs for young people and children.
Development of comprehensive mobility concepts for alpinismTransport modes vary signifi-cantly throughout the Alpine countries: In Switzerland there is a dense network of railway and bus lines providing access even to remote valleys. The use of public trans-port is actively pro-moted by Alpine Clubs (Matti et al. 2004). Opposed to that, in Austria and Italy
the accessi-bility of alpine regions by public trans-port is minimal. If mountaineering in these coun-tries wants to be recognised as a sustainable form of tourism, integrative mobility concepts need to be developed.
Acknowlegdements
The study “Trends and Needs of Action in Sum-mer Mountain Tourism” was commissioned by the Austrian Federal Ministry of Economy and Labour. Organisational support was provided by various alpinist associations, in particular Österreichischer Alpenverein, Naturfreunde Österreich and Öster-reichischer Touristenklub.
References
Brämer, R. (2001). Trendmarkt Wandern - Argumente für einen radikalen Perspektivwechsel. Marburg. http://www.staff.uni-marburg.de/~braemer/koelln.htm
Lorch, J. (1995). Trendsportarten in den Alpen. Vaduz.
Lüthi, M. & Siegrist, D. (1996). Alpinismus und Umwelt. Zürich.
Matti, D., Haefeli, U. & Wigger, D. (2004). Wirkungsanal-yse der Mobilitätskampagne “Al-pen retour” des Sch-weizer Alpen-Clubs SAC. Luzern.
Munter, W. (1988). Bergsteigen 1 – Bergwandern und Fel-sklettern. Bern
Opaschowski, H.W. (2004). Deutschland 2020 : wie wir morgen leben - Prognosen der Wissenschaft. Wies-baden.
Schweizer Alpen-Club SAC. (2004). Mitgliederumfrage 2004. Ergebnisse und Schlussfolge-rungen. Bern.
Ward Thompson, C., Aspinall, P., Bell, S. & Findlay, C. (2005). It Gets You Away From Eve-ryday Life: Local Woodlands and Community Use—What Makes a Dif-ference? In: Landscape Research (30/1), p 109-146.

Siegrist, D., Clivaz, C., Hunziker, M. & Iten, S. (eds.) (2006). Exploring the Nature of Management. Proceedings of the Third International Conference on Monitoring and Management of Visitor Flows in Recreational and Protected Areas.
University of Applied Sciences Rapperswil, Switzerland, 13-17 September 2006. Rapperswil.
28
People, Pixels and Parks: Forest Conservation in the Tropics
Harini Nagendra
Ashoka Trust for Research in Ecology and the Environment, India
Keywords: Parks, protected areas, community forestry, forest conservation, land cover change, satellite remote sens-ing, South Asia.
Abstract: While protected areas have become a cornerstone of conservation efforts, there is significant debate about whether parks have been effective in enabling conservation. A meta-analysis of information on rates of land cover clearing in protected areas finds that government protected areas are significantly likely to lower rates of habitat clear-ing over time. At the same time, it is essential to ask whether government protection is the only successful approach to conservation. A focused set of studies in Nepal and India indicates that it is not the official designation of a forest as government or community that impacts forest conservation as much as the actual degree of monitoring that takes place on the ground. Communities can be effective forces for conservation, if properly involved. By locating individual pro-tected areas within the context of the biophysical, social and institutional landscape in which they are embedded, we will be able to better devise more effective approaches to conservation.
Protected areas have become a cornerstone of con-servation efforts across the globe. By 2003, over 100,000 parks and other protected areas were in existence on paper, covering an area of over 18,000,000 km2 across the world (UNEP 2004). In response to increasing awareness of the impact of these exclusionary strategies of conservation on local communities, park managers have attempted to establish more inclusive management strategies that involve local communities in conservation, es-pecially in countries where the lives of indigenous communities are closely intertwined with forest habitats. Yet, there is significant debate about the impact of these participatory approaches on con-servation, with arguments that habitat fragmenta-tion and species loss have increased in areas where local communities coexist with protected areas (Brandon et al. 1998, Terborgh 1999).
Given the centrality of this debate in the interna-tional conservation community - and when view-ing the vast effort expended in setting up and man-aging parks - it is surprising to note that there have been very few comparative studies that evaluate park effectiveness across multiple sites, and si-multaneously examine community and govern-ment conservation. The few multi-site assessments
of park effectiveness have been based largely on interviews with park managers (e.g. Bruner 2001, Hockings 2003). Although these are experienced individuals with a great deal of information on their specific areas, there is also the danger of in-troducing biases in the analysis, since these same individuals are in charge of monitoring, and could have a vested interest in declaring the parks as suc-cessfully managed (Vanclay 2001).
Part of the difficulty has been in developing quan-titative surveys by monitoring ecological change in a manner that enables comparison across multi-ple sites located across the globe. Yet, this remains a crucial task, if we are to be able to critically eval-uate the effectiveness of parks as a policy strate-gy for conservation. A major challenge has been to identify a set of criteria applicable to protect-ed areas embedded in different ecological habitats across the world, which can be used to evaluate their functioning in a commonly applicable, ac-ceptable manner. Satellite remote sensing, possibly the most frequently used technique for the map-ping of changes in forest cover, provides a particu-larly effective tool for such an analysis (Nagendra et al. 2004a, 2006). A meta-analysis of quantita-tive data on land cover change in 37 parks from 20

Keynote Addresses
29
countries was conducted by this author, based on published literature on rates of land cover change in officially designated protected areas.
How effective have parks been in limiting land clearing? This can be assessed in two ways. In the first approach, rates of clearing within the park were compared to the surrounding land-scape, which receives less protection. The rate of habitat clearing within the parks were sig-nificantly lower compared to its surroundings (p<0.01), indicating that these areas have been successful in limiting habitat destruction. The second approach tested whether parks were successful in limiting land cover clearing over time, by comparing rates of land cover change in the area before and after establishment of the park. Although there was limited data on this aspect, the numbers indicate that the majori-ty of parks were successful in maintaining or lowering rates of land cover change following their establishment (p<0.10) – an impressive re-cord when one considers how rates of land cov-er clearing have been steadily increasing over time, across the world.
There was no significant variation in rates of habitat clearing parks belonging to different re-gions – Africa, Asia, Latin America and North America-Europe. Rates of land cover clearing also did not differ significantly between low, me-dium and high income countries. Indeed, some protected areas in low income countries are per-forming very well, with positive rates of habi-tat regrowth – such as the Royal Chitwan Na-tional Park Buffer Zone in Nepal (Nagendra et al. 2005). Finally, there were no significant dif-ferences in rates of land cover change between parks managed in higher IUCN categories indi-cating stricter protection, and parks which are subject to a greater degree of human interven-tion for management or sustainable use. This is a particularly interesting finding in light of the intense debate in the conservation community about whether participatory management has negatively impacted park effectiveness. Clear-ly, the variation in park effectiveness can not be accounted for by simple, broad-brush argu-ments that apply consistently across sites.
Drivers and agents of land cover change did how-ever appear to differ across regions. In North America and Europe, timber logging was frequent-ly mentioned as a major cause for land cover clear-ing. Park managers appeared to play a more sig-nificant role in determining the location and extent of forest clearing, and these parks appeared to be managed predominantly for recreational purpos-es and forestry. Thus, the need is for these land-scapes to satisfy the requirements of forest depen-dent communities is less pressing, which can make it easier for official management plans to translate into practice. In Africa, Asia and Latin America the actors were predominantly local communities, in-dicating the pressing need to involve communities with park management in these parts of the world. Managers in these countries presumably have to deal with a doubly difficult situation – working with lower levels of investment into park man-agement and protection, as well as managing lo-cal communities living in conditions of poverty and forest dependence. Yet, these do not appear to be worse off when compared to protected areas in higher income countries.
This analysis finds that officially designated, gov-ernment protected areas are likely to lower rates of habitat clearing. It does not however answer the question of whether government protected areas are the only successful approach to conservation (Dietz et al. 2003). Hayes (2004) and Hayes and Ostrom (2005) examined this question in greater detail, conducting detailed evaluations of whether formal government ownership was related to for-est protection. Drawing on a dataset of 163 for-ests across multiple locations in different coun-tries, their analysis did not find any statistically significant difference between forest density in of-ficially designated protected areas, as compared to other public, private and communally owned for-ests. Thus, while some government protected ar-eas may be effective at forest protection, other protection mechanisms appear to be equally ef-fective. Banana and Gombya-Ssembajjwe (2000) found that the monitoring activities of local com-munities have been remarkably successful in con-serving a government forest in Uganda. Batistel-la, et al. (2003) similarly found that rubber tappers have proved to be very active and effective (even

Keynote Addresses
30
though unofficial) forest monitors in 16 forest re-serves in Brazil. These studies indicate that local forest dwellers can be active and motivated moni-tors under appropriate conditions.
Similar findings emanate from our research in South Asia. Based on a rigorous set of methods developed over the past decade at the Center for the Study of Institutions, Population, and Environ-mental Change (CIPEC, www.cipec.org), we have studied forests managed under a variety of tenure arrangements across the world. Our findings indi-cate that multiple factors impact the effectiveness of forest conservation. Formal ownership – wheth-er private, community or government – is less im-portant than the actual rules and mechanisms used to manage these forests on the ground.
Our studies in South Asia are particularly illustra-tive. Forests in this biodiversity-rich region are a priority for conservation, yet subject to some of the highest population pressures, with forest-de-pendent communities, emerging markets and sub-stantial conflicts over forest resources. A variety of forest institutions co-exist, ranging from tradition-al systems to fenced government parks and recent co-management initiatives - providing an environ-ment that facilitates careful comparative study of which policies, rule systems and institutions ap-pear to assist effective forest conservation.
Through a focused set of studies in Nepal and In-dia, where some of the most thickly populated set-tlements coexist with dense tropical forest cover, we have attempted to address these questions in multiple landscapes (Nagendra et al. 2004 b, 2005, 2006). Time series analyses of remotely sensed images enable us to identify the trajectories of land cover change in different parts of the land-scape. By overlaying management boundaries on these images, we are able to interpret the impact of different government, community or co-man-aged systems on forest conservation. Through in-depth interviews conducted with local inhabitants, we can hope to understand the major factors asso-ciated with successful conservation in these forest-ed landscapes.
The multi-temporal remote sensing studies in In-dia cover landscapes within which government protected national parks and reserve forests. The
Mahananda Wildlife Sanctuary in northern India and the Tadoba Andhari Tiger Reserve (TATR) in central India contain relatively stable forests, while the less protected government protected re-serve forests nearby have witnessed some degra-dation and thinning over time. Yet, small patches of clearing are also visible within the parks, where the density of surrounding habitation is high, and there is sustained pressure for grazing, and extrac-tion of firewood and timber (Ghate 2003, Nagen-dra et al. 2006). Increased conflicts between park guards and local people have amplified the difficul-ties involved with monitoring. Despite the strongly and often expressed opinion that the communities within the park are responsible for most of the neg-ative impacts on the forests, our findings indicate that local communities, if appropriately involved, can act as a powerful force for conservation. The primarily subsistence villages located within the TATR do not have a significant negative impact on forest clearing or fragmentation. Instead, it is the villages located outside the park, well connected to urban markets for timber and forest products, that appear responsible for most of the forest degrada-tion, which is primarily taking place at the outer boundary (Nagendra et al. 2006).
In contrast to the government protected areas we study in India, we examine a range of community protected areas in Nepal. Amongst developing na-tions, Nepal has proved to be a forerunner in im-plementing innovative and effective programs of decentralized forest management. The Nepal anal-yses demonstrate the potential of community pro-tected and co-managed areas to provide effective forest conservation. We find significant regrowth in community managed buffer zone forests adjoin-ing the Royal Chitwan National Park. While these areas experienced increased clearing between the first two dates, this trend was reversed with forest regrowth following establishment of protection. Some areas belonging to the buffer zone program have been able to completely halt all deforestation activities within their boundary. These buffer zone forests are located near the park main gate, earn substantial incomes from tourist visits, and have a much greater financial incentive for conserva-tion (Nagendra et al. 2004 b, 2005). All these for-ests have substantial monitoring by the communi-
Keynote Addresses
31
ties, or by forest guards hired and supervised by the community. Encouragingly, recent field visits in May 2005 indicate that these communities have been able to protect their forests even in the face of some very difficult and insecure situations fol-lowing the intense conflicts within the country, in-dicating the resilience of these efforts.
These in-depth case studies indicate that it is not the official designation of a forest as government, community or co-managed that impacts forest con-servation as much as the actual degree of monitor-ing that takes place on the ground. Whether com-munity forests in Nepal, or government protected reserve forests in India, if these forests are not ade-quately monitored for violations by official guards or by the users themselves, they are not substan-tially protected. If substantial monitoring is pres-ent, whether through government or community inputs or a combination of both, as in the case of the Nepal community forests and Indian national forests, they are able to maintain forest cover and encourage regeneration, even in a landscape that is otherwise surrounded by degrading forests.
The meta-analysis of land cover clearing found that a large proportion of parks in developing countries, where human demands for scare for-est resources are particularly acute, are placed in IUCN categories that indicate they are being man-aged through strict protection - yet, this analysis has demonstrated that these parks appear no likely to provide more protection compared to parks that employ more participatory approaches. Our case studies in South Asia indicate that both community and government protected areas can be successful in halting and reversing habitat clearing, if prop-erly monitored. Given the context of forest pro-tection in many low income regions of the world, limited by manpower and by resources, these stud-ies indicate that it is critical to effectively involve local communities in the management of these parks, and provide them with economic incen-tives for conservation. This will prevent the bur-den of protection from falling solely on often ill-equipped national Governments and can help bring ill-equipped, understaffed and underfunded parks on an even footing with others working in easier conditions – as is being increasingly demonstrated in countries such as Mexico and Nepal (Bray et al.
2003, Nagendra et al. 2005). It is only by moving away from universalized, global “blueprint” man-agement approaches, and locating individual pro-tected areas within the context of the biophysical, social and institutional landscape in which they are embedded, that we will be able to better devise more effective and inclusive approaches to conser-vation (Dietz et al. 2003).
Acknowledgements
This research was supported by the National Sci-ence Foundation (NSF) (SBR-9521918) as part of the ongoing research at the Center for the Study of Institutions, Population, and Environmental Change (CIPEC) at Indiana University, and the Branco Weiss: Society in Science fellowship. The author thanks the Wissenschaftskolleg zu Berlin for generously providing research facilities and use of their excellent bibliographic resources while conducting research for this manuscript.
References
Banana A.Y. & Gombya-Ssembajjwe, W. (2000). Success-ful Forest Management: The Importance of Security of Tenure and Rule Enforcement in Uganda Forests. In: Gibson, C., McKean, M. & Ostrom, E. People and Forests: Communities, Institutions, and Governance, p 87-98. Cambridge.
Batistella, M., Robeson, S. & Moran, E.F. (2003). Settle-ment Design, Forest Fragmentation, and Landscape Change in Rondônia, Amazônia. In: Photogrammetric Engineering and Remote Sensing (69), p 805–812.
Brandon, K., Redford, K.H. & Sanderson, S.E. (eds.) (1998). Parks in Peril: People, Politics, and Protected Areas. Washington, DC.
Bray, D.B., Merino-Pérez, L., Negreros-Castillo, P., Segu-ra-Warnholtz, G., Torres-Rojo, J.M. & Vester, H.F.M. (2003). Mexico’s community-managed forests as a global model for sustainable landscapes. In: Conser-vation Biology (17), p 672-677.
Bruner, A.G., Gullison, R.E., Rice, R.E. & da Fonseca, G.A.B. (2001). Effectiveness of Parks in Protecting Tropical Biodiversity. In: Science (291), p125–128.
Dietz, T., Ostrom, E. & Stern, P. (2003). The struggle to gov-ern the commons. In: Science (302), p 1907-1912.
Ghate, R. (2003). Global Gains at Local Costs: Imposing Protected Areas: Imposing Restricted Areas in India. In: Journal of Sustainable Development and World Ecology (10), p 377-395.

Keynote Addresses
32
Hayes, T. (2004). Parks, People, and Forest Protection: An Institutional Assessment of the Effectiveness of Pro-tected Areas. Bloomington: Indiana University, Cen-ter for the Study of Institutions, Population, and Envi-ronmental Change. Working Paper CWP-04-01.
Hayes, T. & Ostrom, E. (2005). Conserving the World’s Forests: Are Protected Areas the Only Way? In: Indi-ana Law Review (38), p 595-617.
Hockings, M. (2003). Systems for assessing the effective-ness of management in protected areas. In: Bioscience (53), p 823-832.
Nagendra, H., Munroe, D.K. & Southworth, J. (2004). In-troduction to the special issue. From pattern to pro-cess: Landscape fragmentation and the analysis of land use/land cover change. In: Agriculture, Ecosys-tems and Environment (101), p 111-115.
Nagendra, H., Southworth, J., Tucker, C.M., Karmacharya, M., Karna, B. & Carlson, L.A. (2004). Remote sens-ing for policy evaluation: Monitoring parks in Nepal and Honduras. In: Environmental Management (34), p 748-760. (Note: Publisher has listed authors incorrect-ly as Nagendra, Tucker, Carlson, Southworth, Karm-acharya, Karna).
Nagendra, H., Karna, B. & Karmacharya, M. (2005). Cut-ting across space and time: Examining forest co-man-agement in Nepal. in: Ecology and Society (10), p 24. http://www.ecologyandsociety.org/vol10/iss1/art24/.
Nagendra, H., Pareeth, S. & Ghate, R. (2006). People with-in Parks—Forests Villages, Land-Cover Change and Landscape Fragmentation in the Tadoba Andhari Ti-ger Reserve, India. In: Applied Geography (26), p 96-112.
Terborgh, J. (1999). Requiem for Nature. Washington D.C.
UNEP-WCMC (United Nations Environmental Programme World Conservation Monitoring Centre). (2004). De-fining Protected Area Management Categories. Pro-tected Areas and World Heritage Programme. http://www.unep-cmc.org/index.html?http://www.unep-wcmc.org/protected_areas/categories/~main.
Vanclay, J.K. (2001). The effectiveness of parks. In: Sci-ence (293), p 1007.
Siegrist, D., Clivaz, C., Hunziker, M. & Iten, S. (eds.) (2006). Exploring the Nature of Management. Proceedings of the Third International Conference on Monitoring and Management of Visitor Flows in Recreational and Protected Areas.
University of Applied Sciences Rapperswil, Switzerland, 13-17 September 2006. Rapperswil.
33
The New Paradigm for Protected Areas: Implications for Managing Visitors in Protected Areas
David Sheppard
IUCN, Switzerland
Introduction
Systems of protected areas1 are an essential com-ponent of a healthy, functioning landscape. Pro-tected areas deliver environmental goods and services which underpin sustainable develop-ment and human well-being. Such areas are vi-tally important for achieving key global targets such as the United Nations Millennium Develop-ment Goals.
In recent years a number of highly influential events for protected areas have been held. The first of these events was the 2003 Vth IUCN World Parks Congress (2003 WPC) held in Dur-ban, South Africa. This Congress bought togeth-er some 3,000 participants from 160 countries and embraced a rapidly growing and diversifying constituency for protected areas. The Congress reached out to a range of key stakeholders: po-litical leaders; protected areas agencies; NGOs; the development assistance sector; industry; in-digenous groups; and young people. In so doing the 2003 WPC served to focus global attention on protected areas, and generated renewed ener-gy and support for future action. Importantly, the WPC produced a wide array of technical outputs which are shaping protected area global policy and practice.
The second key event was the Convention on Bi-ological Diversity (CBD) Convention of the Par-ties (COP) Meeting, held in Kuala Lumpur, Ma-laysia in February 2004. This meeting adopted a comprehensive and targeted Program of Work on Protected Areas. This Program was strongly influenced by the 2003 WPC outcomes and out-
1 Defined by IUCN as: “An area of land and/or sea especially dedicated to the protection and maintenance of biological diversity, and of natural and associated cultural resources, and managed through legal or other effective means” IUCN (1994).
lines a number of actions for countries to take in relation to the establishment and management of protected area systems.
The outcomes from 2003 WPC, together with the framework provided by the CBD Program of Work on Protected Areas, underpin a “new para-digm” for protected areas. Within the context of the new paradigm, the management of visitors to protected areas and the need to better engage with local communities in and around protected areas takes on particular importance. In partic-ular there must be a shift towards planning for protected areas with and for, rather than against, people, as has been the situation in some cases in the past.
This paper will focus on some of the key mes-sages from the WPC and the CBD Programme of Work on Protected Areas and their implica-tions for the management of visitors within pro-tected areas. The paper will cover: (a) the role of IUCN in protected areas; (b) an introduction to Vth World Parks Congress; (c) the key elements of the CBD Programme of Work on Protected Ar-eas; (d) a new paradigm for protected areas, and priorities highlighted at the 2003 WPC; (d) Im-plications for the management of visitors to pro-tected areas; and (e) conclusion.
IUCN’s role in protected areasIUCN, the World Conservation Union brings to-gether States, government agencies and a di-verse range of non-governmental organizations in a unique world partnership: over 900 members spread across some 140 countries. IUCN’s mis-sion is: “to influence, encourage and assist societ-ies throughout the world to conserve the integrity and diversity of nature and to ensure that any use of natural resources is equitable and ecologically
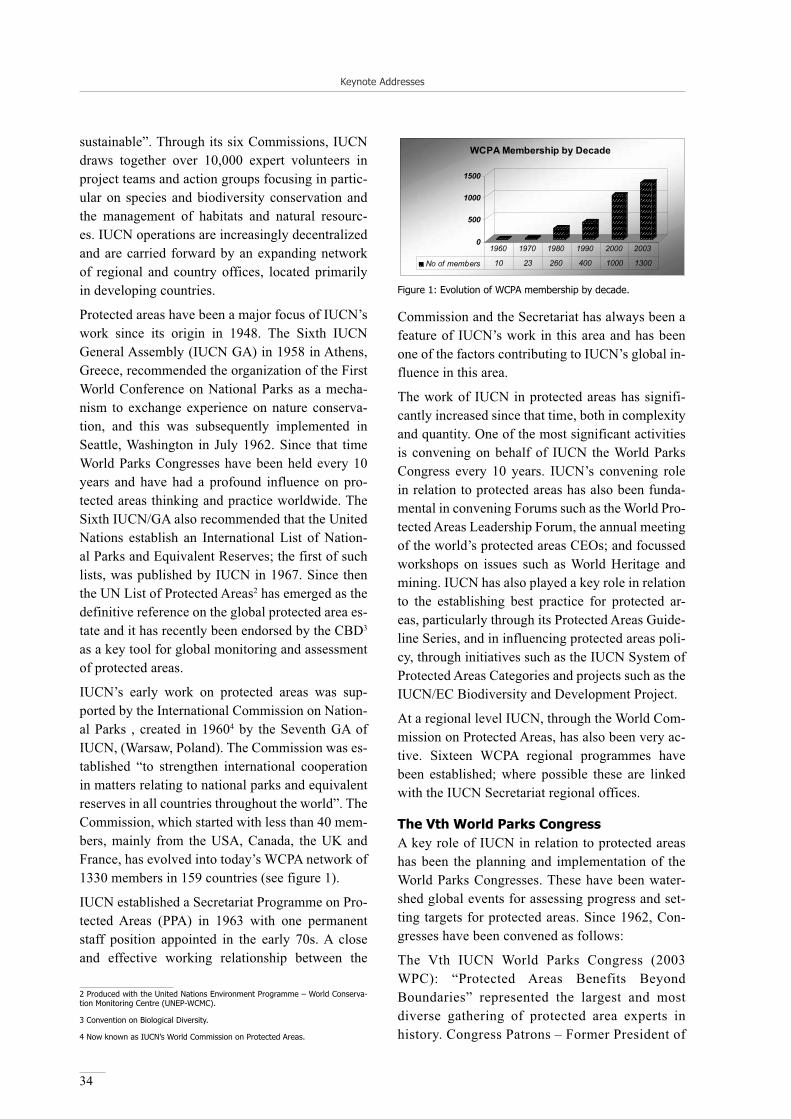
Keynote Addresses
34
sustainable”. Through its six Commissions, IUCN draws together over 10,000 expert volunteers in project teams and action groups focusing in partic-ular on species and biodiversity conservation and the management of habitats and natural resourc-es. IUCN operations are increasingly decentralized and are carried forward by an expanding network of regional and country offices, located primarily in developing countries.
Protected areas have been a major focus of IUCN’s work since its origin in 1948. The Sixth IUCN General Assembly (IUCN GA) in 1958 in Athens, Greece, recommended the organization of the First World Conference on National Parks as a mecha-nism to exchange experience on nature conserva-tion, and this was subsequently implemented in Seattle, Washington in July 1962. Since that time World Parks Congresses have been held every 10 years and have had a profound influence on pro-tected areas thinking and practice worldwide. The Sixth IUCN/GA also recommended that the United Nations establish an International List of Nation-al Parks and Equivalent Reserves; the first of such lists, was published by IUCN in 1967. Since then the UN List of Protected Areas2 has emerged as the definitive reference on the global protected area es-tate and it has recently been endorsed by the CBD3
as a key tool for global monitoring and assessment of protected areas.
IUCN’s early work on protected areas was sup-ported by the International Commission on Nation-al Parks , created in 19604 by the Seventh GA of IUCN, (Warsaw, Poland). The Commission was es-tablished “to strengthen international cooperation in matters relating to national parks and equivalent reserves in all countries throughout the world”. The Commission, which started with less than 40 mem-bers, mainly from the USA, Canada, the UK and France, has evolved into today’s WCPA network of 1330 members in 159 countries (see figure 1).
IUCN established a Secretariat Programme on Pro-tected Areas (PPA) in 1963 with one permanent staff position appointed in the early 70s. A close and effective working relationship between the
2 Produced with the United Nations Environment Programme – World Conserva-tion Monitoring Centre (UNEP-WCMC).
3 Convention on Biological Diversity.
4 Now known as IUCN’s World Commission on Protected Areas.
Commission and the Secretariat has always been a feature of IUCN’s work in this area and has been one of the factors contributing to IUCN’s global in-fluence in this area.
The work of IUCN in protected areas has signifi-cantly increased since that time, both in complexity and quantity. One of the most significant activities is convening on behalf of IUCN the World Parks Congress every 10 years. IUCN’s convening role in relation to protected areas has also been funda-mental in convening Forums such as the World Pro-tected Areas Leadership Forum, the annual meeting of the world’s protected areas CEOs; and focussed workshops on issues such as World Heritage and mining. IUCN has also played a key role in relation to the establishing best practice for protected ar-eas, particularly through its Protected Areas Guide-line Series, and in influencing protected areas poli-cy, through initiatives such as the IUCN System of Protected Areas Categories and projects such as the IUCN/EC Biodiversity and Development Project.
At a regional level IUCN, through the World Com-mission on Protected Areas, has also been very ac-tive. Sixteen WCPA regional programmes have been established; where possible these are linked with the IUCN Secretariat regional offices.
The Vth World Parks CongressA key role of IUCN in relation to protected areas has been the planning and implementation of the World Parks Congresses. These have been water-shed global events for assessing progress and set-ting targets for protected areas. Since 1962, Con-gresses have been convened as follows:
The Vth IUCN World Parks Congress (2003 WPC): “Protected Areas Benefits Beyond Boundaries” represented the largest and most diverse gathering of protected area experts in history. Congress Patrons – Former President of
0
500
1000
1500
WCPA Membership by Decade
No of members 10 23 260 400 1000 1300
1960 1970 1980 1990 2000 2003
Figure 1: Evolution of WCPA membership by decade.
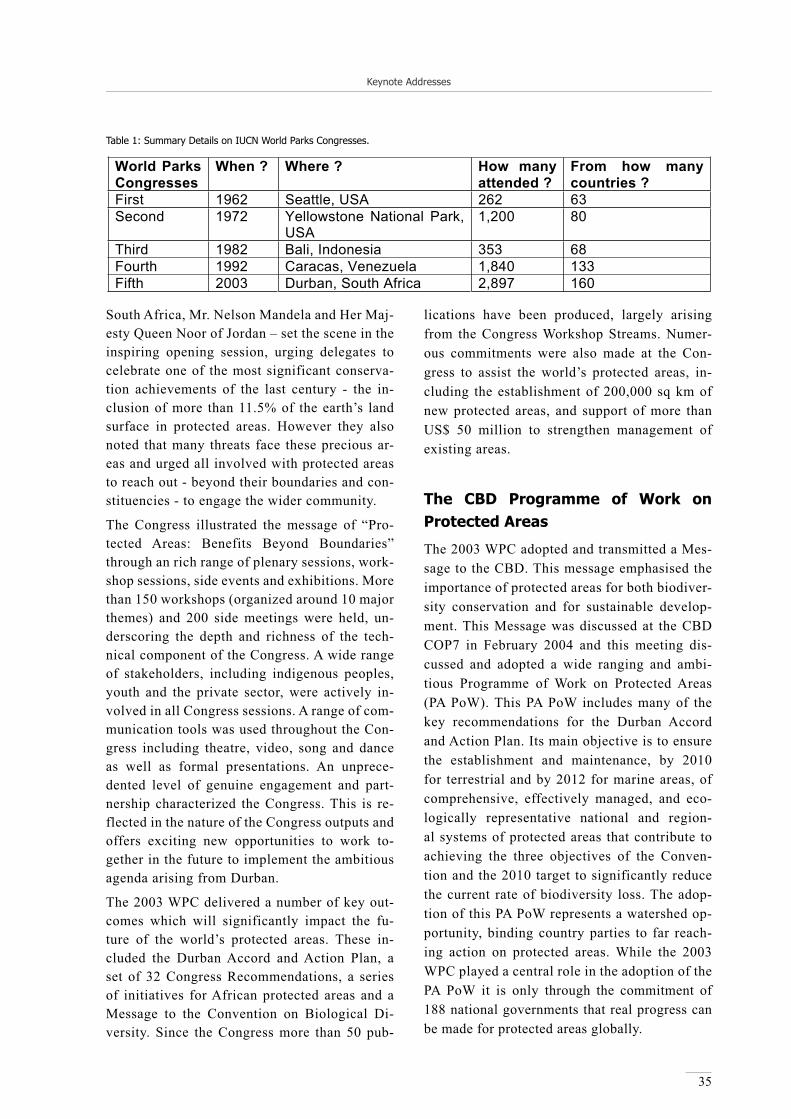
Keynote Addresses
35
South Africa, Mr. Nelson Mandela and Her Maj-esty Queen Noor of Jordan – set the scene in the inspiring opening session, urging delegates to celebrate one of the most significant conserva-tion achievements of the last century - the in-clusion of more than 11.5% of the earth’s land surface in protected areas. However they also noted that many threats face these precious ar-eas and urged all involved with protected areas to reach out - beyond their boundaries and con-stituencies - to engage the wider community.
The Congress illustrated the message of “Pro-tected Areas: Benefits Beyond Boundaries” through an rich range of plenary sessions, work-shop sessions, side events and exhibitions. More than 150 workshops (organized around 10 major themes) and 200 side meetings were held, un-derscoring the depth and richness of the tech-nical component of the Congress. A wide range of stakeholders, including indigenous peoples, youth and the private sector, were actively in-volved in all Congress sessions. A range of com-munication tools was used throughout the Con-gress including theatre, video, song and dance as well as formal presentations. An unprece-dented level of genuine engagement and part-nership characterized the Congress. This is re-flected in the nature of the Congress outputs and offers exciting new opportunities to work to-gether in the future to implement the ambitious agenda arising from Durban.
The 2003 WPC delivered a number of key out-comes which will significantly impact the fu-ture of the world’s protected areas. These in-cluded the Durban Accord and Action Plan, a set of 32 Congress Recommendations, a series of initiatives for African protected areas and a Message to the Convention on Biological Di-versity. Since the Congress more than 50 pub-
lications have been produced, largely arising from the Congress Workshop Streams. Numer-ous commitments were also made at the Con-gress to assist the world’s protected areas, in-cluding the establishment of 200,000 sq km of new protected areas, and support of more than US$ 50 million to strengthen management of existing areas.
The CBD Programme of Work on Protected Areas
The 2003 WPC adopted and transmitted a Mes-sage to the CBD. This message emphasised the importance of protected areas for both biodiver-sity conservation and for sustainable develop-ment. This Message was discussed at the CBD COP7 in February 2004 and this meeting dis-cussed and adopted a wide ranging and ambi-tious Programme of Work on Protected Areas (PA PoW). This PA PoW includes many of the key recommendations for the Durban Accord and Action Plan. Its main objective is to ensure the establishment and maintenance, by 2010 for terrestrial and by 2012 for marine areas, of comprehensive, effectively managed, and eco-logically representative national and region-al systems of protected areas that contribute to achieving the three objectives of the Conven-tion and the 2010 target to significantly reduce the current rate of biodiversity loss. The adop-tion of this PA PoW represents a watershed op-portunity, binding country parties to far reach-ing action on protected areas. While the 2003 WPC played a central role in the adoption of the PA PoW it is only through the commitment of 188 national governments that real progress can be made for protected areas globally.
World Parks Congresses
When ? Where ? How many attended ?
From how many countries ?
First 1962 Seattle, USA 262 63 Second 1972 Yellowstone National Park,
USA1,200 80
Third 1982 Bali, Indonesia 353 68 Fourth 1992 Caracas, Venezuela 1,840 133 Fifth 2003 Durban, South Africa 2,897 160
Table 1: Summary Details on IUCN World Parks Congresses.

Keynote Addresses
36
A New Paradigm for Protected AreasThe 2003 WPC reinforced the need for a new paradigm for protected areas, as first articulated by Adrian Phillips, previously chair of IUCN’s World Commission on Protected Areas (Phillips 2004)
This paradigm reflects changing concepts of protected areas over time. The earlier concepts of protected areas were of large natural areas set aside primarily for conservation and for appro-priate visitor enjoyment, as summarised in the “As it was” column in table 2 below. The trends of protected areas as noted in the “As it is be-coming” Column in table 2 were reinforced at the Durban World Parks Congress.
The 2003 WPC demonstrated how the elements of this paradigm are being practically achieved. In particular a number of key issues relevant to this paradigm were highlighted at the Con-gress.
Targeted future expansion of the protected area estate is essential
World Parks Congresses since 1962 have called on governments to rapidly expand the num-ber and extent of protected areas. In particu-lar the recommendation at the Caracas World Parks Congress (IUCN 1993) called on gov-ernments to: “ensure through international co-operation that protected areas cover at least 10 percent of each biome by the year 2000”. This
Topic As it was: protected areas were …
As it is becoming: protected areas are …
Objectives Set aside for conservation
Established mainly for spectacular wildlife and scenic protection
Managed mainly for visitors and tourists
Valued as wilderness About protection
Run also with social and economic objectives
Often set up for scientific, economic and cultural reasons
Tourism a means to help local economies
Valued for the cultural importance of so-called “wilderness”
Also about restoration and rehabilitation
Governance Run by central government Run by many partners Local people Planned and managed
against people Managed without
regard to local opinions
Run with, for, and in some cases by local people
Managed to meet the needs of local people
Wider context Developed separately Managed as ‘islands’
Planned as part of national, regional and international systems
Developed as ‘networks’ (strictly protected cores, buffered and linked by green corridors)
Perceptions Viewed primarily as a national asset
Viewed only as a national concern
Viewed also as a community asset
Viewed also as an international concern
Managementtechniques
Managed reactively within short timescale
Managed in a technocratic way
Managed adaptively
Managed with political sensitivity
Managementskills
Managed by scientists and natural resource experts
Expert led
Managed by multi-skilled individuals
Drawing on local knowledge
Finance Paid for by taxpayer Paid for from many sources
Table 2: Old and New Paradigms of Protected Areas (Phillips 2004).

Keynote Addresses
37
acted as a rallying cry for many in the protect-ed areas movement and provided a stimulus for countries to expand their protected area estate. The results of this were seen at the World Parks Congress where the 2003 United Nations List of Protected Areas was launched. This noted there are now 102,102 protected areas covering 18.8 million km² in all, and 11.5% of the global land surface – representing a dramatic growth since
1962 when there were only 1,000 protected ar-eas covering 3% of the Earth’s land surface. The rapid growth in the number and area of protect-ed areas is shown in figure 2 below:
The Congress also noted that protected areas are a significant land use in their own right third only to forestry and permanent pasture (see fig-ure 3 below).
Figure 2: Cumulative Growth in Protected Areas by 5 Year Increment: 1872 to 2003.
26.1%
23.4%
11.5%
9.2%
0.9% 0.2%
0
5
10
15
20
25
30
% G
loba
l Lan
d Ar
ea (1
48,4
53,3
04 k
m2 )
Forest (1) PermanentPasture (2)
Protected Areas(3)
Arable Land (4) Permanent Crop(5)
Urban
Figure 3: Protected Areas as a Proportion of Global Land Use.

Keynote Addresses
38
Remarkably, the global estate under protection has gone from an area the size of the United Kingdom to an area the size of South America in just 4 de-cades. The current global coverage of protected areas exceeds the ambitious target set at the last World Parks Congress (Caracas, Venezuela, 1992) of ensuring that protected areas cover at least 10% of each biome by 2000.
While the number of protected areas has tripled over the past 20 years, with the majority of such areas being established in developing countries, there remain serious gaps in coverage. Initial es-tablishment of protected areas often focused on criteria such as outstanding scenic values or wild-life rather than on biological or ecological crite-ria. Consequently, many national PA networks do not adequately reflect the distribution of biodiver-sity within national boundaries. Furthermore, most PAs were originally conceived in a national con-text and took no account of regional biodiversity or of the existence of similar networks in adjacent countries. The major exceptions to this rule are those countries that have adjusted their national networks to take account of biodiversity distribu-tion, or those countries that have created their PA networks in recent times and according to modern ecological principles, such as Equatorial Guinea, Madagascar and Gabon in Africa and Lao PDR in Asia. For most countries therefore, there is a need to better compare PA networks with biodiversity distribution, regionally, in adjacent countries and outside protected area sites. This is essential to en-able prioritization for the establishment of protect-ed areas in the future.
New analyses presented at the World Parks Con-gress highlighted significant gaps in the cover-age of certain ecosystems, particularly marine eco-systems, including the High Seas, freshwater and lake ecosystems, temperate grasslands, deserts and semi-deserts. Gaps in marine coverage are of par-ticular concern given the poor relative level of pro-tection of the marine area5. The most recent IUCN Red List of Threatened Species (IUCN, 2006) not-ed a dramatic growth in the number of species that are threatened with extinction, with now more than 16,000 threatened species worldwide. This dichot-
5 Marine protected areas are estimated to cover 0.8% of the earths surface.
omy shows a clear need for the establishment and implementation of clearer and more effective con-servation priorities; in turn highlighting the need for future protected areas to be more strategic in relation to biodiversity conservation and, specifi-cally, to better target threatened species.
The need for more comprehensive and targeted protected area systems has been recognized. The WSSD6 and CBD have established ambitious tar-gets relating to protected areas; specifically to es-tablish an effectively managed and ecologically representative system of terrestrial protected areas by 2010 and a system of marine protected areas by 2012. Addressing these gaps and challenges re-quires expansion of existing protected areas, and the strategic creation of new ones, while ensuring the connectivity of suitable habitat between them. The Durban Congress emphasized that the estab-lishment of future protected areas is essential, that it must be targeted and that it must be based on ap-plication of the best available scientific data and tools.
The effectiveness of protected areas must be strengthened. The World Parks Congress underlined a key mes-sage from the late 1990’s – the need to improving the effectiveness of existing protected areas and protected areas systems. This reflected the fact the many and growing threats and challenges facing protected areas and also the fact that many protect-ed areas are not achieving their original objectives, such as biodiversity conservation. Thus the mes-sage from the Durban Congress was to improve the effectiveness of what we already have under protected area designation. While the period since the Caracas World Parks Congress was marked by a rapid expansion of the quantity of the protect-ed area estate, the Durban World Parks Congress called for consolidation and for more emphasis to be placed on improving the quality or effectiveness of existing protected areas. The Congress high-lighted the need to develop and apply new tools for assessing management effectiveness. A number of tools and approaches have emerged over the past decade, such as the IUCN Management Effective-ness Framework and the WWF/World Bank Man-
6 World Summit on Sustainable Development, held in Johannesburg in 2002.

Keynote Addresses
39
agement Tracking Tool, and these offer practical ways to assess the effectiveness of protected areas. Many of these tools are now being applied to pro-tected areas around the world and such approaches need to be more widely used and linked to action by a range of actors including donors, protected area agencies and local communities.
The Congress noted that management effective-ness comprises many inter-related elements, of which capacity development and sustainable fi-nancing are particularly important.
Capacity Development
Improving the effectiveness of management of protected areas requires a significant increase in human and financial resources for protected areas and also strengthening the capacity of people and agencies involved. The World Parks Congress not-ed that the managers of protected areas and other primary stakeholders often do not have sufficient knowledge, skills, capabilities and tools to ensure that protected areas can more effectively respond to the challenges posed by global change. Enhanced capacity is essential and is needed at a range of levels, including for protected areas agencies, park managers, and key stakeholders. Protected Area management is a challenging task as noted by vet-eran conservationist, John MacKinnon: “After a lifetime of working in the protected area manage-ment business, I have finally worked out why the job seems so complicated…it simply is very com-plicated” cited in Appleton et al. (2003). Skills and competencies need to be more specialized than in the past requiring a range of innovative and adap-tive approaches to protected area management. Competency requirements reflect the evolving na-ture of protected area management. Traditionally the protected area manager was an expert in the natural sciences, and management was seen as an exercise involving the application of expertise to natural systems. However, the challenges facing the protected area manager in the 21st century are increasing in scale and complexity and must be broadened to include skills in areas such as:
Cultural and social expertise – for example re-lating to negotiation and conflict resolution re-quired for activities such as initiating joint man-
agement arrangements with local communities and negotiating with a wide range of stakehold-ers;
Information Technology – for example in re-lation to the application of GIS and web based tools for protected area management;
Policy expertise – such as understanding and better influencing the broader legal framework and the other sectoral policies within which pro-tected area activities need to be implemented; and
Strategic Planning and Management – such as in relation to strategic planning and financial man-agement.
This will require a change of approach on the part of protected area agencies, both in terms of recruit-ment strategies and also in terms of approaches to training and career development. The need for fo-cused and effective training for protected area man-agers has never been higher and it is critical that it comprehensively address the skills needed for pro-tected areas to adapt to the requirements of the 21st century. Existing training efforts, such as those im-plemented through the Wildlife Institute of India in Asia or through the Mweka Wildlife College in Af-rica, should also be strengthened and expanded.
Capacity development should be based on the as-sessment of skill needs and requirements. Recent work on the development of competency standards in Asia (Appleton et al. 2003) provide a useful model for the assessment of skills and needed com-petencies as a key element of establishing future directions for capacity development for protect-ed areas. Capacity development must also target young people and encourage them to see protected areas as an attractive and viable career option. The World Parks Congress emphasized the importance of reaching out and engaging the support and en-ergy of youth to build a prosperous future for pro-tected areas. The protected areas profession needs to connect better with young people and empower the next generation.

Keynote Addresses
40
Sustainable Financing of Protected Areas
Improving management effectiveness of protect-ed areas requires the development of more reliable and sustainable finance flows for protected areas. The Durban World Parks Congress noted that pro-tected areas require a significant boost in finan-cial investment and noted that existing ffinancial resources are still seriously inadequate. The Sus-tainable Financing Workshop Stream at the Con-gress considered that between $US 20-30 billion per year would be required over the next 30 years to establish and maintain a comprehensive global protected areas system, including adequate cover-age of terrestrial, wetland and marine ecosystems. Only about 20% of this is currently available. Un-der-investment by governments and others in pro-tected areas means that these areas are often failing to meet their conservation and social objectives. Inadequate human and financial resources mean that many protected areas lack effective protection and management, particularly in developing coun-tries. The challenge is to achieve a major boost in investment in protected areas and to develop more sustainable methods of protected area financing.
Protected areas must be better linked to sustainable development The Durban Congress emphasized that protected areas are vital for both nature and for people. Ex-perience highlighted at the Congress demonstrated that protected areas play a vital role in protecting vital ecosystem services, such as clean water and clean air, and thus are critical for supporting the livelihoods of local people. However, in many parts of the world protected areas as viewed as a barrier to the activities and aspirations of local communi-ties. Many poor people also live in and around pro-tected areas, which serve as a vital source of food and fibre. In a number of cases local communities have been excluded from decision making regard-ing protected areas, or worse, forcibly removed. As a result such areas have traditionally not been con-sidered in the context of contributing to develop-ment objectives or to helping the livelihoods of lo-cal communities.
The Durban Congress urged governments and all involved in protected areas to make the link be-tween conservation and livelihoods clearer and
more explicit. This is an important element of in-fluencing decision makers to support the further expansion of protected areas around the world. This is particularly relevant in making the link be-tween protected areas and global agendas such as the Millennium Development Goals relating to en-vironmental sustainability and poverty alleviation and the 2010 targets agreed at the World Summit on Sustainable Development (Johannesburg, South Africa, August 2002) which aim to significantly reduce the loss of biodiversity. However this link has not been clearly articulated and this is one area where more attention is required in the future. The relationship between protected areas and the Mil-lennium Development Goals and WSSD Targets is shown in Annex 1 of this paper. Values of protect-ed areas to key resource and other sectors is also shown in table 3.
Protected area values need to be clearly articulated and communicated. Recent work by IUCN on the economic values of protected areas, (IUCN 1998), reveal that protected areas are often significant revenue-earning entities and can make an impor-tant contribution to local economies. For instance, recent studies indicate that Canada is expected to create $C 6.5 billion dollars in annual Gross Do-mestic Product from the expenditure of participants in wildlife-related activities which sustain 159,000 jobs and creates $C 2.5 billion in tax revenue each year. Australia receives over $A 2 billion in expen-diture from eight national parks – at a direct cost to Governments of some $A 60 million. In Cos-ta Rica, about $US12 million is spent annually to maintain the national parks but foreign exchange generated in 1991, associated with these parks was more than $US 330 million with 500,000 overseas visitors; park-generated tourism is the second larg-est industry in the country.
There is thus a clear message that investment in protected areas can provide significant benefits to national and local economies. Far from being locked up and lost to local users, these areas rep-resent an opportunity for sustainable industries and for the generation of financial returns. How-ever these messages are not being articulated and conveyed to decision makers. Those involved in protected area must communicate the linkages be-tween protected areas and development objectives,

Keynote Addresses
41
particularly through emphasizing the vital role that such areas play in the protection and enhancement of vital ecological services such as the provision of clean water. The role of protected areas in contrib-uting to economic development through appropri-ate nature based tourism should also be better iden-tified and communicated.
New and innovative approaches to pro-tected area governance should be applied.The 2003 WPC underlined one key element of the new paradigm: the shift of governance arrange-ments, from protected areas being run by central government agencies to being run by many differ-ent types of organizations and partners. The rea-sons are varied: in some cases this is a response to specific budget cutbacks or broader financial con-straints. In other cases it reflects general patters of decentralisation, where power and responsibil-ity are being devolved from the centre, and with it power and responsibility for protected areas.
There are now many models of protected area gov-ernance. The 2003 WPC noted the need for a range of approaches to protected areas governance to be applied. One particular trend highlighted at the Congress was the increasing involvement of local communities and indigenous peoples in the man-agement of protected areas. A number of specific examples of such areas, increasingly recognized as “Community Conserved Areas” were highlighted at the Congress.
Non-Governmental Organisations (NGOs) are in-creasingly involved in conservation and protected areas throughout the world. Experience has shown
that NGOs have an important role to play in the establishment and management of protected ar-eas. They often have particular strengths in work-ing with and through local communities for ex-ample. A critical aspect in relation to NGOs is the need to build more effective and long term part-nerships with government agencies involved in protected areas. In many parts of the world the re-lationship between Government and Non Govern-ment organisations has traditionally been marked by suspicion. This needs to be replaced by an atti-tude of co-operation, partnership and mutual ben-efit, and there are many examples from around the world where NGO management of protected areas is working very effectively.
In many parts of the world the private sector is be-coming increasingly involved in protected areas. There are limited successful examples to date of private sector management of protected areas but this appears to be an area with potential, although not without pitfalls. Potential advantages of pri-vate sector involvement in protected areas are the high level of motivation, relative efficiencies in management, and economies of scale available to large companies. On the other side of the coin, is the need for care, to ensure that conservation ob-jectives are not subsumed by the “profit motive” and also the concern that very few private com-panies currently have the expertise necessary for effective conservation management. In South Af-rica, an increasing number of protected areas are being managed by the private sector. In Japan the Keidanren Nature Conservation Fund, also based in Japan, has made a considerable contribution to
p y pBiodiversity conservation: nature conservation, health, agriculture, industry, foreign affairs
Watershed protection: natural resources management, water supply
Storm protection: disaster prevention
Tourism: economic development, transport
Local amenity: local government, recreation, public health
Forest etc. products: forestry, economic development, community affairs
Soil conservation: agriculture, natural resources management
Carbon sequestration: energy policy, foreign affairs
Research and education: research, science, education (all levels)
Cultural values: community affairs, local government
Table 3: Values of protected areas and principal sectoral policy implications.

Keynote Addresses
42
nature conservation, with many programmes fo-cused on protected areas, both in the region and in-ternationally (Matsukawa 1996).
As well as examining alternatives to supplement government management of protected areas, there is a need to improve existing government struc-tures and procedures in relation to protected areas. Options such as amalgamation of conservation ori-ented departments with similar objectives and the development of mechanisms for improving inter-agency coordination are being examined in many countries, such as Australia and Africa. One inter-esting trend in many countries, particularly in Af-rica, is the establishment of Parastatal bodies with responsibility for protected area management. Such agencies, which have been established in countries such as Kenya, Tanzania and Uganda, have a great-er level of independence and autonomy than tra-ditional government agencies, particularly in rela-tion to the ability to generate and retain revenue.
Another issue related to governance is the applica-tion of the IUCN Protected Areas Categories Sys-tem. A number of countries are increasingly ap-plying this system in their legislation and policy frameworks. (Refer to Annex 2 for more detail on the IUCN PA Categories System). A clear message from the 2003 WPC was the need for countries to apply a range of IUCN Category Types, within the context of their national systems plans for protect-ed areas. This does not imply a retreat from the es-tablishment and management of the more strictly protected areas, such as the category I and cate-gory II protected areas but it does imply the need to develop a system which can accommodate a broader range of activities without compromising conservation objectives.
A message from the 2003 WPC was that there is no right answer to the question “What is the ide-al institutional structure for protected areas”. The right approach will depend on the unique circum-stances of each country -- in most cases it will in-volve a mix of the above governance options. It is assumed that this trend will accelerate in the 21st century. While this appears positive, it is important to be clear on the respective roles of these sectors in relation to government. It is critical that there be clearly defined management objectives for each
countries protected area system as a whole, and that this provides the framework for the clarifica-tion of roles of different actors.
Implications for the Management of Visitors to Protected Areas
The new paradigm for protected areas is changing the way in which protected areas are being man-aged and being perceived around the world. There are many elements of the new paradigm highlight-ed at the 12003 WPC which will have significant implications for the management of visitors and the involvement of people in protected areas in the future. These include:
Tourism, focussed on protected areas, will continue to increase in the futureTourism is a major issue for the management of protected areas. This reflects the major influence and impact of this sector, with tourism and relat-ed activities now contribute to over 10% of global GDP and over 8% of global employment. Clearly, this is an industry which can positively or nega-tively impact the world’s economy, environment, and culture, in a very significant way.
The tourism sector is characterised by considerable diversification. Tourism based in and around pro-tected areas is one of the future growth areas over the coming decades, particularly as leisure time, mobility and environmental awareness increase. Protected areas serve as magnets for tourists and also for tourism developers; thus posing signifi-cant challenges and also opportunities.
Tourism was highlighted at the 2003 WPC in a number of ways – through a range of side events, a major plenary session and also in the key out-comes from the Congress – the Durban Accord and Action Plan. Congress delegates underlined that tourism is a critically important issue for protected area managers and stakeholders at many levels and that this importance will only grow in the future.
Global tourism is growing rapidly and is signifi-cantly outpacing the growth of global Gross Do-mestic Product. Tourism focused on protect-ed areas is increasing at a relatively greater rate within this overall global growth. In many coun-
Keynote Addresses
43
tries this growth poses many challenges – on the one hand tourism provides a vital source of rev-enues for park agencies which, in some cases, are seeing their revenues from traditional government sources decreasing. As noted above in the exam-ples from Canada, Australia and Costa Rica, tour-ism related to protected areas makes a major con-tribution to national economic growth.
Tourism also provides a key means for protected area agencies to realize their objectives relating to visitor appreciation and enjoyment. On the other hand poorly planned and unregulated tourism can cause many negative impacts such as environmen-tal degradation on ecosystems within and around protected areas and can also negatively impact on the livelihoods of poor people.
Delegates to the 2003 WPC called for increas-ing recognition on the part of all involved in tour-ism – from the side of the protected area agency and from the side of the tourism industry. There is a need to learn from past experience and, in this light, publications such as this which share the rich experience from around the world in relation to tourism and protected areas - both good and bad - is particularly important. There is also a need for much more effective dialogue between the tourism and protected areas sector and Congress delegates called for forums to be set up to facilitate and en-courage such interaction.
The main implications for the management of pro-tected areas, particularly in relation to visitor man-agement are that:
Increasing tourism growth focussed on protect-ed areas will mean that agencies will have to strengthen their planning and capacity building activities relating to tourism. In many cases this will require protected areas agencies to recruit more specialists in tourism and visitor manage-ment;
Protected area agencies will have to cooperate more effectively with the tourism sector. In some cases this will involve protected area agencies being linked with tourism within the one gov-ernment agency, such as is the case in Tasmania, Australia. In other cases it will involve the de-velopment of joint programmes and initiatives.
The example from Canada, where Parks Canada has developed an Accord with the Tourism In-dustry Association of Canada, provides a useful example in this regard.
There will be an increasing focus on urban protected areasThe World Parks Congress noted that half the world’s population now lives in cities and this proportion is expected to grow to 60% by 2030. These trends are expected to accelerate after 2030. Protected areas provide major benefits for urban dwellers, including education, recreation, and also the protection of vital services for cities such as the provision of clean water. The links between pro-tected areas and health is also becoming increas-ingly clear and has been demonstrated by such innovative programmes as the Parks Victoria (Aus-tralia) Programme: “Healthy Parks, Healthy Peo-ple” which encourages people living in Victorian cities to use and enjoy protected areas.
It is clear that urban residents can gain greater ap-preciation and love for nature through positive ex-periences in natural areas and open spaces. The im-portance of such experiences is only likely to grow with increasing urbanisation. The need for urban protected areas for education is also very impor-tant. Experience highlighted at the 2003 WPC not-ed that the management of protected areas in urban settings poses a set of unique challenges, such as in relation to issues like the management of fire and invasive species.
There is also a strong link between urban popu-lations and political support given that voters are increasingly concentrated in cities. The base of political support for protected areas needs to be mobilised and broadened. Protected area agencies can contribute to this by offering positive and en-ergising opportunities for city dwellers to interact with nature.
The main implications for the management of pro-tected areas, particularly in relation to visitor man-agement are that
Governments and protected areas agencies need to give more priority to the development of pro-tected areas in and around urban areas;

Keynote Addresses
44
More emphasis needs to be given within pro-tected area agencies to the development of pro-grammes which promote the appreciation and enjoyment of nature by urban dwellers;
The management of the interface between ur-ban areas and natural areas will require spe-cial skills and effective outreach and commu-nication strategies on the part of protected areas agencies; and
Innovative programmes such as the “Healthy Parks, Healthy People” Programme in Victoria, Australia need to be more widely applied and the results communicated.
People, at all levels, have to be more in-volved in protected areasOne of the key elements of the new paradigm for protected areas is that protected areas management has to shift from being “against people” to being “with and for people”. A clear and strong message from the 2003 WPC was that local communities and indigenous peoples must be more effectively involved in protected areas at all levels. The Con-gress specifically emphasised that the rights of in-digenous peoples must be fully respected and not-ed that the indigenous involvement in protected area management has increased although there is still a along way to go. This is particularly impor-tant as many indigenous peoples live in areas of high biodiversity and usually have unique knowl-edge of the natural environment which can be ap-plied in protected area management.
Protected areas agencies around the world have de-veloped a range of programmes for better involving local communities in protected area management. These include the development of Advisory Com-mittees for national parks, volunteer programmes and a range of other mechanisms.
The main implications for the management of protected areas, particularly in relation to visitor management are that
Programmes for involving local communities and indigenous peoples in protected areas need to be more widely applied;
Protected areas agencies need to ensure they have staff with skills in community outreach and consultation. This will involve the recruit-ment of new staff with skills in this area as well as retraining of existing staff; and
Innovative examples of community manage-ment of protected areas, such as Community Conserved Areas need to be more widely en-couraged and applied
Better information on visitors to protected areas is requiredThe 2003 WPC Congress noted the importance of better data to underpin decisions relating to pro-tected areas. This is particularly relevant in rela-tion to visitor use of protected areas, where the ab-sence of global data on visitor use of the world’s protected areas is a limiting factor in developing cohesive visitor and tourism related policies and frameworks. Information on visitors is currently not collected consistently within or between coun-tries and there are few agreed definitions and ap-proaches in relation to visitor monitoring. IUCN has recently published guidance on this issue (Hornback & Eagles 1999) and it is hoped that this will encourage the application of more consistent approaches to visitor monitoring within protected areas.
Visitor information also needs to be more effec-tively applied at all levels. At national levels this will require greater use of visitor monitoring data in the development of visitor management poli-cies. At the global level there is a need to integrate visitor data within the UN List of Protected Areas and within the World Data base on protected Ar-eas (WDPA).
The main implications for the management of pro-tected areas, particularly in relation to visitor man-agement are that
More emphasis needs to be placed by protected areas agencies on the collection and application of visitor use information;
Consistent frameworks and standards in this area, such as those set out in (Hornback and Ea-gles 1999) need to be adopted and applied;
Visitor Use data needs to be incorporated with the UN List of Protected Areas.

Keynote Addresses
45
Conclusion
Protected areas are a vital element of attempts by countries to conserve their biodiversity and to sup-port sustainable development. The challenges fac-ing protected areas are significant and the nature of the work of the protected area agency is changing rapidly and very significantly. Many of these chal-lenges are encapsulated within the new paradigm on protected areas. The management of visitors to protected areas will be influenced by the new par-adigm. In particular, protected area agencies will need to be more responsive to the needs of visi-tors and to the needs of local communities in and around protected areas.
References
Appleton, M.R., Texon, G.I. & Uriarte, M.T. (2003). Com-petence standards for Protected Area Jobs in South East Asia. Los Banos.
Borrini-Feyerabend, G., Kothari, A., & Oviedo, G. (2004). Indigenous and Local Communities and protected Areas: Towards Equity and Enhanced Conservation. Gland, Switzerland and Cambridge, UK.
Chape, S., Blyth, S., Fish, L., Fox, P., & Spaulding, M. (2003). 2003 United Nations List of Protected Areas. IUCN, Gland, Switzerland and Cambridge, UK and UNEP-WCMC, Cambridge, UK.
China Man and the Biosphere Programme (1996). China’s Biosphere Reserves. Chinese National Committee for MAB, China.
GBRMPA, World Bank, IUCN (1995). A Global Represen-tative System of Marine Protected Areas. (vol III).
Green, M.J.B. & Paine, J. (1997). State of the World’s Pro-tected Areas at the end of the Twentieth Century. Paper presented to the WCPA Symposium, Albany, Western Australia, 1997.
Hornback, K.E. & Eagles, P.F.J. (1999). Guidelines for Pub-lic Use Measurement and reporting at parks and pro-tected areas. Gland.
Ishwaran, I. (1996). Sub-regional networking for global strategies and conventions. Paper presented to CNP-PA Working session, Indonesia, May 1996.
IUCN (1993). Parks for Life: Report of the IVth World Con-gress on National Parks and Protected Areas. Gland.
IUCN (1994). Guidelines for Protected Area Management Categories. Gland, Switzerland and Cambridge,UK.
IUCN (1996). A Regional Action Plan for Protected Areas in East Asia.
IUCN (1998). Economic Values of Protected Areas: Guide-lines for Protected Area Managers. Gland.
IUCN (2004). Speaking a Common Language: the Uses and Performance of the IUCN System of Management Categories for Protected Areas. Cardiff University.
IUCN (2006). IUCN Red List of Threatened Species.
Matsukura, H. (1996). Keidanren Nature Conservation Fund, Japan. Paper to CNPPA East Asia meeting, Kushiro, Japan, July 1996.
McNeely, J.A. & Wachtel, P.S. (1991). Soul of the Tiger. Doubleday.
McNeely, J.A., Harrison, J. & Dingwall, P. (eds.)(1994). Protecting Nature: Regional Reviews of Protected Ar-eas, IUCN.
McNeely, J.A. (1997). Conservation and the Future: Trends and options towards the year 2025. IUCN.
Munasinghe, M. & McNeely, J. (eds.)(1994). Protect-ed Area Economics and Policy - Linking Conserva-tion and Sustainable Development. World Bank and IUCN.
Phillips, A. (1998). Taking Stock at the End of the Century. Paper to NSW (Australia) New Millennium Review.
Phillips, A. (2004). The New Paradigm for Protected Ar-eas, IUCN
Sheppard, D.A. (1996). Protected Areas in East Asia in the 21st Century – Key challenges. Paper to Second Con-ference on National Parks and Protected Areas of East Asia, Kushiro, Japan, July 1996.
The Economist (1994). A survey of the global economy. Supplement in October, 1994 Issue.
Wong, F.Y. (1996). Community Involvement in the Coun-try Parks Programme in Hong Kong. Paper to CNPPA East Asia meeting Kushiro, Japan, July 1996.
Xue, D. & Tidell, C. (1999). Valuing Ecological Functions of Biodiversity in Changbaishan Mountain Biosphere Reserve in Northeast China. Proceedings of IUCN/WCPA – EA – 3 Seoul Conference. WCPA/East Asia.

Siegrist, D., Clivaz, C., Hunziker, M. & Iten, S. (eds.) (2006). Exploring the Nature of Management. Proceedings of the Third International Conference on Monitoring and Management of Visitor Flows in Recreational and Protected Areas.
University of Applied Sciences Rapperswil, Switzerland, 13-17 September 2006. Rapperswil.
46
New Parks of National Importance in Switzerland
Bruno Stephan Walder
Federal Office for the Environment, Switzerland
Introduction
This year, the MMV3 conference takes place in a special context here in Switzerland. Due to the re-vision of the Law on the protection of Nature and Cultural Heritage, some new parks of different cat-egories are already planned. Therefore we hope to learn from different countries’ experience and know-how in the field of Park and Visitor Man-agement.
Current situation „Parks in Switzer-land“
The Swiss National Park, situated in the Canton of Graubünden, was established in 1914, and was the first in Central Europe and in the area of the Alps. At that time, Switzerland had a pioneering role, but since then various parks have been cre-ated throughout Europe. Up until now, there has been a lack of legislative basis to enable new parks to be created and financed.
Revision of the Law on the Protection of Nature and Cultural Heritage Switzerland should soon have new parks of na-tional importance: national parks, regional na-ture parks and nature experience parks. On 23 February 2005, the Federal Council passed the relevant partial revision of the Law on the Pro-tection of Nature and Cultural Heritage. This had been specifically requested by the parliament af-ter the topic of parks was deleted from the legis-lative plan for a year, on financial grounds. Since then, the parliament has incorporated the results of consultations on the draft legislation. After the referendum, the revised Law on the Protection of Nature and Cultural Heritage and the Ordinance on Parks could come into force in summer 2007, at the earliest.
Parks of national importance help to protect and to increase the value of exceptional natural habi-tats and landscapes of particular beauty. They also encourage the economic development of a region, pro-viding incentives for tourism, creating employ-ment and enabling visitors to experience nature. The creation of parks makes sense economically. This can be seen from many years of experience in other countries, and with the Swiss National Park in the Canton of Graubünden, where the direct net added value of the park through tourism averages 10 million Swiss Francs per year, whereas indirect employment and income provide a further 7 mil-lion Swiss Francs.
Parks for different needs and uses
Based on experience in other countries, in the fu-ture there should be three categories of parks in Switzerland: national parks, regional nature parks and nature experience parks.
National parks: large, protected natural land-scapes
National parks provide undisturbed habitats for the indigenous flora and fauna and for internal devel-op-ment of the natural landscape. They also act as recreational areas and provide possibilities for en-viron-mental education and research. They are di-vided into a central core zone and the surrounding zone. The area of the core zone is to be at least 100 square kilometres in the Pre-alps and the Alps, at least 75 square kilometres in the Jura and at least 50 square kilometres on the Central Plateau. With-in the core zone, nature is protected from all hu-man intervention.
The surrounding zone is normally between three quarters and one and a half times the size of the core zone. It includes existing small villages that have protected their rural character. The landscape of the surrounding zone is not impaired by major

Keynote Addresses
47
technical infrastructure, and its ecosystems have not suffered any important losses. The main objec-tive is to encourage sustainable use of the land and of natural resources. Tourism and recreational use are also oriented towards sustainability.
Regional nature parks: near natural cultural land-scapes
Regional nature parks are larger, partially popu-lated rural areas, which are particularly distinc-tive within Switzerland for the quality of their nat-ural and cultural landscapes and cover at least 100 square kilometres. They contribute to making the most of the natural and culture heritage of the re-gion, to invigorating the network of communities, thereby strengthening the regional identity. There-fore, they contribute to the prerequisites for sus-tainable development in the region and to envi-ronmental education, and they promote innovative and environmentally-friendly technologies. This means that ecologically valuable and particular-ly beautiful landscapes are maintained. Regional nature parks create and ensure employment, with business activities particularly geared to the sus-tainable utilisation of local resources.
Nature experience parks: near natural compen-sation areas in urban regions
Like national parks, nature experience parks con-sist of a core zone and a transition zone. The total area is at least six square kilometres, of which at least four square kilometres are in the core zone. Nature experience parks are near natural compen-sation areas close to densely-populated regions. In the core zone the same rules apply as for national parks. While nature can develop unhindered, in the transition zone the main focus is on experience of nature. Therefore nature experience parks should be easily accessible by public transport.
How does a park come into being in Switzer-land?
About 30 park projects have now been launched, in all parts of Switzerland, and they have reached dif-ferent stages of achievement ranging from the proj-ect idea to measures that have already been car-ried out. The area of a park must have high natural and landscape value. The federal government only acknowledges a park if it is based on voluntary re-gional initiatives, supported by the local population
and linked into a cantonal programme. The cantons have an important role to play in creating parks of na-tional importance, and subsequently managing them, by supporting regional initiatives.
Based on the park projects known today, it can be assumed that about two new national parks, ten re-gional nature parks and three nature experience parks will be created within the next ten years. The number of future parks in Switzerland will depend on the quality of the nature and landscape values of a region, the initiative of the local population, the financial resources available and the distribution of pro-jects throughout Switzerland.
Visitor management begins as soon as a park is planned
During the phase of planning a park, detailed con-sideration must be given to issues such as where visitor flows will come from, how great these are likely to be, how people will reach the park and what bottlenecks or problems might arise.
A new park can only be planned if there is suffi-cient information on expected visitor flows. This enables to design infrastructure of the correct di-mension in the right place, and furthermore this is the essential information needed for good planning to manage visitors within the park.
Conclusion
As new parks of national importance are being created in Switzerland, the management of visitor flows will be an important aspect so “best prac-tice” experience from other countries will be very welcome.
Therefore, Switzerland is happy to host the Third International Conference on Monitoring and Man-agement of Visitor Flows in Recreational and Pro-tected Areas.

48
49
The Significance of Visitor Monitoring Data for Management, Planning and Policy
Arne Arnberger, Joel Erkkonen, Tuija Sievänen& Odd Inge Vistad

Siegrist, D., Clivaz, C., Hunziker, M. & Iten, S. (eds.) (2006). Exploring the Nature of Management. Proceedings of the Third International Conference on Monitoring and Management of Visitor Flows in Recreational and Protected Areas.
University of Applied Sciences Rapperswil, Switzerland, 13-17 September 2006. Rapperswil.
50
Monitoring Public Reactions to the U.S. Forest ServiceRecreation Fee Program
James D. Absher1, Alan R. Graefe2 & Robert C. Burns3
1USDA Forest Service, [email protected]
2Pennsylvania State University, [email protected]
3West Virginia University, [email protected]
Keywords: Forest recreation, fees, public perceptions, monitoring, evaluation.
Introduction
Natural resource managers need to better under-stand the clientele for the recreation areas under their management. This clientele includes exist-ing users and potential or former visitors who may have been displaced from the areas. Recently, sci-entists have debated the impact of recreation fees on visitors and potential visitors, and on social is-sues such as justice or fairness. The recreation fee program that that was authorized by the U.S. Con-gress in 1996 is now permanent (the Federal Lands Recreation Enhancement Act of 2004), in part due to the research that has helped managers develop and implement the program. This paper presents highlights of ongoing research/monitoring for the Forest Service recreation fee program in the Pa-cific Northwest. Statewide surveys of residents in Washington and Oregon were conducted in 1999, 2001, and 2003. This paper integrates findings from these efforts to describe public perceptions about the Forest Service’s fee program in the Pa-cific Northwest over a six year period. The key is-sues are: Which activities should have a fee at-tached, what the balance should be between taxes and fees, and how the revenue should be spent.
Methods
This study built on earlier fee research and pro-vides a means of longitudinal evaluation of the recreation fee program. Accordingly, some survey
questions were replicated in each wave of the sur-vey in order to track changes in the public’s atti-tudes. New questions were added for assessment of the effectiveness of selected aspects or chang-es in the fee program. The data are from three in-dependent telephone surveys, each in the fall and spaced two years apart, of randomly selected adults in the states of Oregon and Washington. The initial survey in 1999 had 1,676 completed inter-views, the second in 2001 had 2,005 respondents, and the third one in 2003 obtained 800 completed interviews. Thus the entire database has 4,481 re-spondents.
Results
In-depth questions about the fee program and reve-nue use were repeated on each survey. When asked about the acceptability of fees for various recre-ation activities, results were generally consistent between the three surveys. Fees were most ac-ceptable for activities like RV camping, camping at campgrounds with facilities, and boat dock or ramp use all activities for which fees have tra-ditionally been charged. Likewise, fees were most unacceptable for stopping at scenic overlooks and picnicking or swimming at areas with no facilities. Respondents in 2001 were slightly less supportive of fees for off-highway vehicle use and collecting forest products, and more supportive of fees for boat dock/ramp use, rafting/canoeing, climbing, and interpretive programs and visitor centers.
The Significance of Visitor Monitoring Data for Management, Planning and Policy
51
Public opinion about the proper balance between taxes and user fees for operating recreation areas is a second major topic. The dominant response in all years was equal support from taxes and user fees, although there was a slight trend in 2001 towards increasing the proportion derived from taxes. Most people felt that charging some fees is acceptable and helps the Forest Service do a better job of pro-tecting the land and providing recreational oppor-tunities. In 2001, they were less likely to believe that charging fees will make it so only the rich can use the best areas of the National Forests. In gen-eral, residents strongly preferred imposing fees to closing sites or allowing them to deteriorate (if in-adequate funds were available). In all three waves, respondents generally supported a variety of imple-mentation options designed to enhance the fairness of the fee program, such as giving free passes to volunteers who have worked at Forest sites, setting aside some areas where no fees are charged, offer-ing an annual pass that is accepted at all recreation areas, and making certain days free of charge.
All surveys asked residents about their priorities for how fee revenue should be spent. Maintain-ing the quality of the natural environment was the top rated priority, followed closely by maintain-ing restrooms and trails. Consistent with the ear-lier growth in acceptability of fees for interpretive programs and visitor centers, respondents in later waves expressed greater support for spending fees to provide recreation information.
Discussion and Implications
Results of the fee monitoring program suggest that people’s support for the recreation fees is related to their awareness of the reasons behind the program, how the money collected is used, and what bene-fits have come from the program. The results were used to fine tune the program during the demon-stration period and influenced the permanent fed-eral fee legislation passed in late 2004. For exam-ple, this legislation specified which types of fees could be used and the types of areas at which fees could be charged, based on the public’s response to the tested fee programs. The repeated waves of sur-veys provided valuable information to gauge pub-lic reactions and make important improvements to
the fee program. Longitudinal surveys can play an important role in generating a positive outcome for agency programs that rely on public interaction, acceptance, and compliance to be successful.

Siegrist, D., Clivaz, C., Hunziker, M. & Iten, S. (eds.) (2006). Exploring the Nature of Management. Proceedings of the Third International Conference on Monitoring and Management of Visitor Flows in Recreational and Protected Areas.
University of Applied Sciences Rapperswil, Switzerland, 13-17 September 2006. Rapperswil.
52
Outdoor Recreationists in Oregon and Washington: A Compari-son of Recreationists’ Perceptions of Experience Satisfaction
Across Two US Pacific Northwest States
Robert C. Burns1 & Alan R. Graefe2
1West Virginia University, [email protected]
2The Pennsylvania State University, [email protected]
Keywords: Recreation satisfaction, visitor monitoring, visitor segmentation.
Introduction
The purpose of this study was to explore the dif-ferences in trip characteristics, levels of satisfac-tion, and economic expenditures of outdoor rec-reationists in two similar US states; Oregon and Washington. The states of Oregon and Washington make up the geographic area known as the US Pa-cific Northwest. The socio-economic makeup of the two states is somewhat different. The popula-tion of Oregon is approximately 3.5 million, while the Washington population is nearly 6 million. The median income for Oregon residents in 2000 was $40,916, while the median income for Wash-ington residents was $45,776. Given a median in-come of US households of $41,994, Oregon resi-dents’ income levels were similar to the national median, while Washington households were some-what higher (US Bureau of the Census, 2002). The mean number of persons per household was 2.59, compared to 2.51 in Oregon, and 2.53 in Wash-ington. According to statistics provided by the US Bureau of Census (2002), the poverty rate for familes with three people is $14,128. A total of 11.6% of Oregon households were under the US poverty level, compared to 10.6% of the Washing-ton households.
The Pacific Northwest (PNW) includes 20 US Na-tional Forest (NF) units, including some urban-oriented forests (forests near Portland, Oregon and Seattle, Washington) and many rural National Forests in both states. The USDA Forest Service (USFS) is the land management agency charged
with providing recreation opportunities and other non-recreation uses on the 20 NF units. The NF units in the PNW are all managed under Region 6 of the USFS.
Methods
The study was conducted as part of the US For-est Service’s National Visitor Use Monitoring (NVUM) initiative. NVUM interviewers conduct face-to-face interviews of recreationists as they exit from a national forest to understand recreation use patterns in every national forest. The NVUM study examined basic visitation patterns, satis-faction indicators, and spending patterns in and around the Forest unit. This study examines three years of data collected in Oregon and Washington (N=12,909). Data were collected through the use of on-site surveys of exiting recreationists from Oregon/Washington National Forests. Analysis was conducted through comparing mean scores, using SPSS (version 11.5).
Results
Significant differences were noted for several of the trip characteristics. Washington users visited National Forests less frequently (WA=13.50 vis-its in past 12 months, OR=18.18), reported fewer days away from their homes on this trip (WA=4.97 nights away from home, OR=7.92), and visited undeveloped day use areas more often (WA=1.24 visits, OR=.48). The respondents reported their

The Significance of Visitor Monitoring Data for Management, Planning and Policy
53
economic expenditures in and around the Nation-al Forest that they were visiting. Although many of the economic expenditure categories showed no significant differences, some interesting disparities were noted between respondents in the two states. Washington respondents reported a significant-ly higher amount of money spent on outdoor rec-reation in an average year (WA=$2392 in typical year, OR=$2088). Washington respondents also reported that they spent over twice the amount of money on recreation fees on this trip than Oregon residents (WA=$23.05 on this trip, OR=$10.31). This study included ratings of importance and sat-isfaction for 14 experiential variables, using a 5-point Likert scale (1 is lowest, 5 is highest). Three of the importance variables and five of the satis-faction variables showed significant differenc-es across the states. Interestingly, Washington re-spondents showed a higher satisfaction level for “value for fee paid” than Oregon respondents, for “condition of natural environment,” and for “help-fulness of employees.” Conversely, Oregon re-spondents reported higher satisfaction scores for “condition of developed facilities” and “condi-tion of forest roads.” Regarding the importance of these same attributes, Oregon respondents rated the importance of “safety” higher, while Washing-ton residents rated the importance of “condition of trails” and “helpfulness of employees” higher than Oregonians.
Conclusion and Discussion
Numerous differences were noted in the responses of Oregonians and Washingtonians with regards to outdoor recreation. Although these two states are in close geographic and relatively close economic proximity, many differences were noted across the trip characteristics, economic variables, and satis-faction indicators. These differences highlight the importance of segmenting populations that may seem to be homogeneous at first glance, and val-idate the effort the US Forest Service is making in this monitoring effort. The Forest Service now uses these results in concert with management de-cisions, such as allocating funds for maintenance of recreation areas and deciding what sites may be too costly to operate, making these data increas-ingly important to managers.

Siegrist, D., Clivaz, C., Hunziker, M. & Iten, S. (eds.) (2006). Exploring the Nature of Management. Proceedings of the Third International Conference on Monitoring and Management of Visitor Flows in Recreational and Protected Areas.
University of Applied Sciences Rapperswil, Switzerland, 13-17 September 2006. Rapperswil.
54
Monitoring the Value of Visitors to Protected Areas: The Australian Approach
Jack Carlsen & David Wood
Curtin University, Australia
[email protected]@curtin.edu.au
Keywords: Visitor expenditure, protected areas, survey toolkit.
Objectives of the Study
The key aim is to develop a ‘toolkit approach’ to assess the direct visitor expenditure attributable to protected areas. The toolkit is based on a criti-cal appraisal of selected evaluation methods and techniques that have been implemented in Austra-lia and abroad. The toolkit enables protected area managers to readily assess the economic bene-fits of visits to localities and regions containing protected areas. Such data has been used to pres-ent cases to better resource the management of these areas, that attract so many domestic and in-ternational visitors. This project builds on work undertaken by Wood and Dowling (2002), Wood (2003) and Carlsen and Wood (2004); to measure the direct economic value of visits to two areas in Western Australia, the Southern Forest Region and the Gascoyne Coast Region.
Methods
The project builds on other Australian (Carlsen 1997, Wood 2003) and international studies to es-tablish methods of assessing the direct economic value of visits to protected areas, to clarify key explanatory variables of visitor expenditure and to develop and proof a simple survey instrument. More specifically, the project includes:
a) Desktop research to identify methods to assess the economic value of protected areas.
b) Statistical analysis of survey data collected at two protected areas in Western Australia, be-tween 1997 and 2004, to identify key explanato-ry variables of direct tourist expenditure;
c) Development, assessment and modification of a survey instrument that addresses the key variables of visitor expenditure based on (b).
Whilst sample sizes for this project were rela-tively large, data was also compared with that collected by Wood (2003) since 1997 with sam-ples varying from around 100 to 400 surveys. This comparison produced remarkably consis-tent results across varying sample sizes with the exception of one survey that was dramatically skewed by a predominance of campers in the survey, suggesting that samples should be mod-erated by knowledge of accommodation types and occupancy rates at the time a survey is con-ducted. Similarly, average length of stay was in-fluenced by responses from long-term campers in the sample (especially in the Gascoyne Coast Region), so these ‘outliers’ had to be removed from the final data set.
Key Findings
The study finds that the most appropriate mea-sure of assessing the contribution of visitors to a local/regional economy is direct expenditure and that the key explanatory variables of direct expenditure are:
1. Visitor origin
2. Visitor accommodation type
3. Visitor activities
4. Visitor household income
5. Visitor age

The Significance of Visitor Monitoring Data for Management, Planning and Policy
55
Consequently, a very useful visitor expenditure survey can be restricted to questions related to expenditure and these five key explanatory vari-ables (Table 1). Additional questions enable the attribution of visitor expenditure to the protected area and a measure of the substitution effect. At-tribution and substitution were key elements in presenting direct expenditure data to the West-ern Australian Treasury (see Carlsen and Wood, 2004) as they provide an indication of the sig-nificance of the protected area in attracting vis-itor expenditure (attribution) and retaining visi-tor expenditure in the state economy (a form of import substitution).
Conclusion
The survey instrument developed by the research-ers can be used to collect direct expenditure data attributable to protected areas.
Sample sizes can be small provided they are rep-resentative of the key explanatory variables. Con-sequently, it is recommended that surveys be con-ducted in all accommodation types in and around protected areas. The results can be used to gener-ate more resources for protected areas, commen-surate with the direct economic value of tourism to those sites. For example, the State Government Department of Conservation and Land Manage-ment [CALM] successfully used these direct ex-penditure estimates to present a business case to the
Western Australian Department of Treasury, to ob-tain substantially increased management resources for protected areas. The protected area evaluation toolkit will be employed in other regions of Aus-tralia and overseas to obtain increased resources for protected areas.
AcknowledgementsThe project was conducted by the Curtin Sustain-able Tourism Centre (CSTC), under the auspices of the Sustainable Tourism Co-operative Research Centre (STCRC).
References
Carlsen, J. (1997). Economic evaluation of recreation and tourism in natural areas: a case study in NSW, Austra-lia. In: Tourism Economics (3/3), p 20-29.
Carlsen, J. & Wood, D. (2004). Assessment of the Econom-ic Value of Recreation and Tourism in National Parks, Marine Parks and Forests. In: Cooperative Research Centre for Sustainable Tourism Technical Report.
Wood, D & Dowling, R. (2002). Tourism surveys in North West Cape region 1989-2002, a summary report pre-pared for the Department for Planning & Infrastruc-ture. Perth.
Wood, D.S. (2003). Tourism on the Carnarvon-Ningaloo Coast between Quobba Station and Exmouth and its Implications for Sustainability of the Coast. In Future Directions: Sustainable Tourism and Land Use Sce-narios for the Carnarvon-Ningaloo Coast. Perth. http://www.planning.wa.gov.au/cgi-bin/index.cgi?page=/whatsnew/ content.html.
Statistical significance (level)
Variable Southern Forests Region Gascoyne Coast Region
Visitor place of origin
Visitor accommodation
Visitor activities
Visitor household income
Visitor age
-
significant (0.01)
-
significant (0.05)
-
significant (0.01)
significant (0.01)
significant (0.01)
-
significant (0.01)
Table 1: Key explanatory variables of visitor expenditure.

Siegrist, D., Clivaz, C., Hunziker, M. & Iten, S. (eds.) (2006). Exploring the Nature of Management. Proceedings of the Third International Conference on Monitoring and Management of Visitor Flows in Recreational and Protected Areas.
University of Applied Sciences Rapperswil, Switzerland, 13-17 September 2006. Rapperswil.
56
Monitoring Sustainable Nature Tourism in Practice – Experiences From Pyhä-Luosto National Park, Finland
Joel Erkkonen & Pertti J. Itkonen
Metsähallitus, Finland
[email protected]@metsa.fi
Keywords: Sustainability, nature tourism, limits of acceptable change (LAC), national park.
Introduction
Natural Heritage Services of Metsähallitus man-ages the majority of protected areas in Finland, including 34 of Finland’s 35 national parks. The main purpose of national parks is nature protec-tion, but during the last few years, promoting local communities and economics has played an increas-ing role in management, especially in remote areas like Finnish Lapland.
Pyhä-Luosto National Park is located in cen-tral Lapland. The oldest part of the park was es-tablished in 1938. The estimated number of visits paid to the national park is about 100 000 annually which are mainly done by domestic visitors.
In order to incorporate nature tourism and nature conservation, Metsähallitus has created general principles for sustainable nature tourism in pro-tected areas managed by Metsähallitus. The prin-ciples include all the three dimensions of sustain-ability: ecological, economical and socio-cultural. These general principles are implemented in prac-tice by preparing management plans of sustainable nature tourism for all the important protected areas where nature tourism plays a significant role. The planning framework is based on the Limits of Ac-ceptable Change (LAC) concept.
Methods
In the LAC process, the use of an area and its im-pacts are monitored by carefully selected indica-tors. To be a useful and valid method also in prac-tise, the selection of indicators plays a crucial role. It should be possible to set justified limits which
are based on the best information available. In ad-dition, it should be possible to measure the indi-cators with reasonable economical and human re-sources.
However, applying ideal indicators is seldom pos-sible in practise for several reasons. On the other hand, protected areas are monitored for many other purposes anyway. Data collected in these monitor-ing systems is often available and can also be ap-plied for monitoring sustainability as such or with minor changes.
Results
The Limits of Acceptable Change process was modified to fit the purposes of the management plan of sustainable nature tourism for Pyhä-Luosto NP. It turned out to be a process as follows and an example of it is shown in table 1.
The goals for nature tourism were set by estab-lishing the general nine principles of sustainable nature tourism in Metsähallitus. More specific desired future conditions were defined for nature tourism and its impacts. A list of indicators and ways of measuring them was selected. Current values of the indicators were invento-ried.Limits of acceptable change were set for the in-dicators. The management actions available to achieve or to maintain desired conditions or to react be-forehand to unacceptable changes were identi-fied.

The Significance of Visitor Monitoring Data for Management, Planning and Policy
57
Eventually, this pilot study of applying LAC pro-cess in practice proved that a set of indicators of sustainability in nature tourism or recreational use of protected area can be found without massive sur-veys or large economical costs. Applicable indica-tors can be found by using existing data collected mainly under regular management operations and through daily customer services. Visitor monitoring plays essential role in this process as standardized visitor survey includes several important indicators of sustainability together with number of visits.
This presentation describes the process of moni-toring sustainability in nature tourism. It also de-scribes creating a management plan of sustainable nature tourism, and the ways in which the indica-tors are being used through incorporation into the overall planning process.
References
Cole, D.N. & McCool, S.F. (1997). The Limits of Accept-able Change Process: Modifications and Clarifica-tions. In: McCool, S.F. & Cole, D.N. (comps.)(1998). Proceedings – Limits of Acceptable Change and relat-ed planning processes; progress and future directions, May 20–22 1997, Missoula, MT. Gen.Tech.Rep. INT-GTR-371, p 61–68. Ogden.
Hendee, J.C. & Dawson, C.P. (2002). Managing for Appro-priate Wilderness Conditions: The Limits of Accept-able Change Process. In: Hendee, J.C. & Dawson, C.P. (eds.) Wilderness Management. Stewardship and Pro-tection of Resources and Values, p 231–261.
Kajala, L., Erkkonen, J. & Perttula, M. (2004). Measures for Developing Sustainability of Nature Tourism in Protected Areas. In: Sievänen, T. et al. (2004)(eds.). Policies, Methods and Tools for Visitor Management – Proceedings of the Second International Conference on Monitoring and Management of Visitor Flows in Recreational and Protected Areas, June 16-20, 2004, Rovaniemi, Finland. Rovaniemi, p 241–246.
Desiredcondition
Indicator Method of measuring the Indicator
Current value 2005
Limits of acceptable change
Management actions
Nature is a major motive of visits
Visitor survey (question 8/1, recreationalmotives).
Visitor survey year 2010
Natureexperiences are either very or rather important reason of the visit for 97%.
Natureexperiences are either very or fairly important reason of the visit for 90%.
1. Co operation with entrepreneurs in marketing and developingproducts.
The customers should know the special features of the local nature and culture
Customercontacts in Nature Centre
Visitor counting and annual statistics (visits, telephone and e-mail)
33 000 contacts in 2005
30 000 contacts 1. Developing nature centre and its exhibition.
2. Marketing and communication
3. Co operation with entrepreneurs
Table 1: Example of LAC indicators in Pyhä-Luosto NP under the following principle of sustainable nature tourism: Customers’ apprecia-tion and knowledge of nature and culture are promoted.

Siegrist, D., Clivaz, C., Hunziker, M. & Iten, S. (eds.) (2006). Exploring the Nature of Management. Proceedings of the Third International Conference on Monitoring and Management of Visitor Flows in Recreational and Protected Areas.
University of Applied Sciences Rapperswil, Switzerland, 13-17 September 2006. Rapperswil.
58
Using Visitor Monitoring to Reduce Ecological Impacts Due to Picnicking and Grilling in Urban Forests in the Vicinity of
Basle, Switzerland
Tessa K. Hegetschweiler, Hans-Peter Rusterholz & Bruno Baur
University of Basle, Switzerland
[email protected]@unibas.ch
Keywords: Picnicking / grilling in forests, ecological impacts, visitor preferences, recreational planning.
Introduction
Outdoor recreation in urban forests has increased in recent decades, leading to ecological conflicts, such as trampling damage to the ground vegeta-tion and soil compaction, making management ac-tions and well-founded recreational planning nec-essary in highly frequented areas (Baur 1999, Baur et al. 2003). In order to achieve satisfactory results, management decisions should preferably be based on information provided by visitor monitoring, rather than on managers‘ intuition alone.
A common outdoor activity in Switzerland is pic-nicking and grilling. The usage of fire rings out-side official picnic sites can lead to soil compac-tion, a reduction of vegetation cover and changes in the soil seed bank (Amrein et al. 2005). The ex-tensive damage in certain highly frequented forest areas is making measures necessary.
Methods
In our study area (an oak-hornbeam forest) in the vicinity of Basle in north-western Switzerland, we are using data from two surveys to develop appro-priate management actions in order to reduce eco-logical impacts caused by picnicking and grilling. In order to develop measures, it is important to find out why forest visitors build fires outside pic-nic sites. Therefore, we conducted a survey in two forest areas and questioned 214 forest visitors pic-nicking and grilling, half of them at official sites
and half of them at “wild“ fire rings. We also con-ducted a postal survey aimed at forestry officials, foresters and public forest owners in the whole of Switzerland. 562 experts returned a completed questionnaire.
Results
The results of the survey aimed at forestry ex-perts show that picnicking and grilling are among the most frequent activities in the whole of Swit-zerland. When asked about the reasons why for-est visitors might create their own “wild“ fire rings, most respondents stated that visitors might be looking for adventurous or romantic spots or simply might want to be alone. Respondents also thought that there were probably not enough of-ficial picnic sites and that woody debris lying around might animate visitors to build a fire. Only a minority attributed self-made fire rings to an unattractive location or unattractive infra-structure of existing picnic sites (Fig. 1).
The survey conducted in the forest itself showed that visitors using official picnic sites differ from visitors using fire rings outside official sites, es-pecially in their preferences concerning loca-tion and infrastructure. Visitors using “wild“ fire rings preferred sites away from forest ser-vice roads with infrastructure as natural as pos-sible (no concrete barbecue pit, tree trunks to sit on) and possibilities for children to help build the fire by collecting wood and stones for the ring.

The Significance of Visitor Monitoring Data for Management, Planning and Policy
59
It can be concluded that picnickers are not a homogenous group of forest visitors. Existing picnic sites meet the requirements of a subset of picnickers. Other visitors do not want picnic sites with a lot of infrastructure near car parks and forest service roads. Visitors wanting more natural surroundings fulfil their requirements by creating their own fire rings. This behaviour can lead to uncontrolled trampling damage in previously untouched forest areas and contrib-ute to the degradation of already heavily used areas.
Visitor management in Switzerland already in-cludes installing new recreational infrastruc-ture such as barbecue pits, but location and infrastructure are usually based on tradition, intuition of forest managers and practicability rather than on visitor preferences. Based on our results, we recommend providing some picnic sites that are closer to the requirements of vis-itors that have steered away from official sites up to now, but that do not necessarily want to be in a remote area. As new sites can be in-stalled away from ecologically sensitive areas, these measures should reduce the number of self-made fire rings being created in the sen-sitive forest area and hereby also reduce eco-logical impacts by picnicking and grilling away from picnic sites.
References
Baur, B. (Ed.) (2003). Freizeitaktivitäten im Baselbieter Wald. Ökologische Auswirkungen und ökonomische Folgen. Liestal.
Baur, B. (1999). Der Allschwiler Wald. In: Allschwiler Schriften zur Geschichte, Kultur und Wirtschaft (11).
Amrein, D., Rusterholz, H.-P. & Baur, B. (2005). Distur-bance of suburban Fagus forests by recreational ac-tivities: Effects on soil characteristics, above-ground vegetation and seed bank. In: Applied Vegetation Sci-ence (8), p 175-182.
0 10 20 30 40 50
unattractive infrastructure of official sites
unattractive location of official sites
woody debris
insufficient number of official sites
adventure / romanticism / individualism
% respondents
Figure 1: Reasons for creating and using self-made fire rings outside official picnic sites.

Siegrist, D., Clivaz, C., Hunziker, M. & Iten, S. (eds.) (2006). Exploring the Nature of Management. Proceedings of the Third International Conference on Monitoring and Management of Visitor Flows in Recreational and Protected Areas.
University of Applied Sciences Rapperswil, Switzerland, 13-17 September 2006. Rapperswil.
60
The Influence of Motorized Access on Hiker’s Route Selectionat Mt. Tsukuba
Taiichi Ito & Mariko Ryugo
University of Tsukuba, Japan
Keywords: Car-dependency, circulation, Mt. Tsukuba, route selection, trailhead, walking experience.
Introduction
Mt. Tsukuba, designated as one of the quasi-national parks of Japan, is not only a region-al landmark but also has been a major outdoor recreational area since the 1730s. As a result, in spite of its modest altitude of 875 meters, di-verse hiking routes to its twin peaks have been developed from all directions. At present, seven routes are officially recognized, and they bring hikers to the summits in less than two hours. The number will be doubled if off-beaten tracks are counted. In addition, two motorized means such as cableways are supplied for casual tour-ists. Thus, the hikers have diverse options to choose from almost 200 combinations at Mt. Tsukuba. This study was conducted to clarify the relation between hiker’s route selection and its reasons as a basis for the better management of this area.
Methods
The authors surveyed hiker’s route selection and its reasons in 2003, then they did similar one fo-cusing on its relation to the mode of traffic access in 2005. Both surveys conducted on clear days in autumn at the col between the peaks because this is the only place most hikers from various routes come and have a break. The interviewers showed a route map to hikers and asked them the routes they took or going to take, then wrote down their se-lection and its reasons. The 2003 survey was con-ducted on 17th and 18th of December, and answers from 461 hikers were obtained. The 2005 survey was done on 23rd of October and 13th of Novem-ber and collected 185 answers.
Results
The 2003 survey revealed that hiker’s route choic-es are quite limited in spite of diverse possibilities (figure. 1). Popular trailheads are located close to cableway terminals with large parking lots. Such a trend brought crowding and soil impact on these trails. Further analysis on the route-selection pat-terns among hikers showed that three fourths of them took different routes for descending (figure 2). It is understandable that hikers prefer to expe-rience different routes on their way back to enjoy a diverse environment just like experiences of Jap-anese strolling gardens. The traversing will give more diverse experiences than circulating, but those who left their cars have to walk on a road to recover them. Thus, car-dependent hikers must choose a circulating route as a compromise.
It also became clear that almost 70 % of hikers to Mt. Tsukuba came by car. These hikers have more freedom to choose diverse trailheads than those who come by bus because bus stops are limited to
Figure 1: Ratio of Visitors on each Route (N=485).
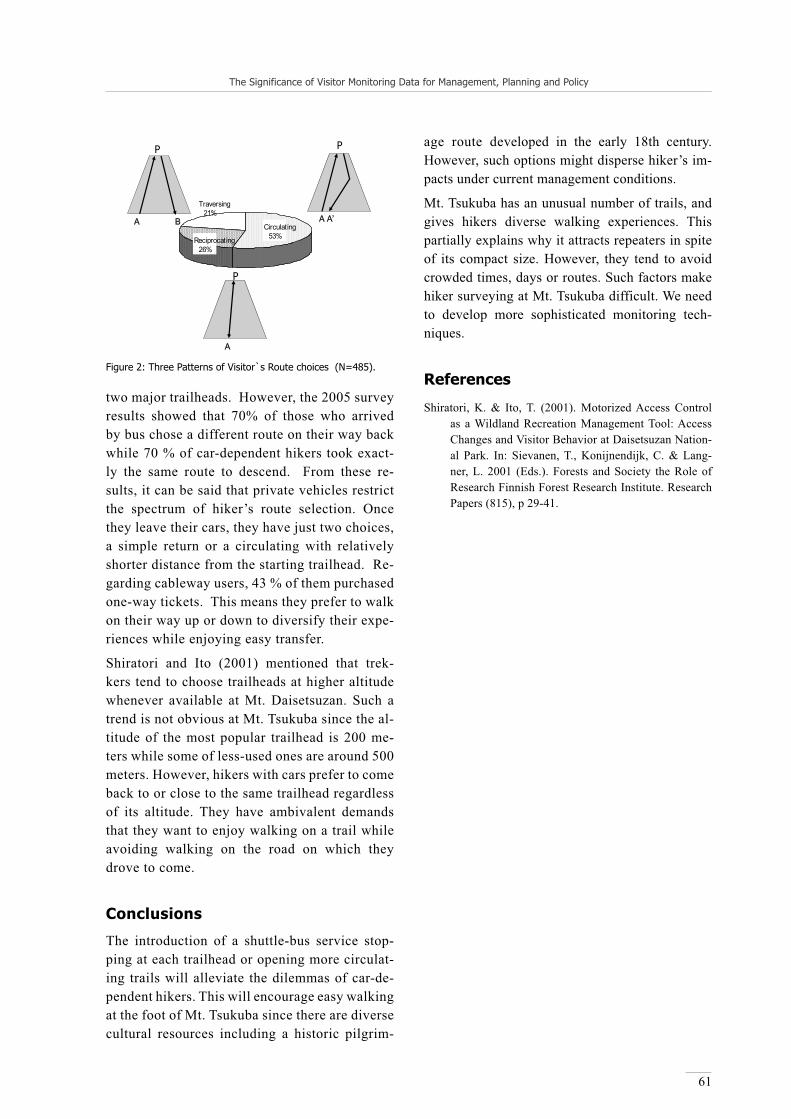
The Significance of Visitor Monitoring Data for Management, Planning and Policy
61
two major trailheads. However, the 2005 survey results showed that 70% of those who arrived by bus chose a different route on their way back while 70 % of car-dependent hikers took exact-ly the same route to descend. From these re-sults, it can be said that private vehicles restrict the spectrum of hiker’s route selection. Once they leave their cars, they have just two choices, a simple return or a circulating with relatively shorter distance from the starting trailhead. Re-garding cableway users, 43 % of them purchased one-way tickets. This means they prefer to walk on their way up or down to diversify their expe-riences while enjoying easy transfer.
Shiratori and Ito (2001) mentioned that trek-kers tend to choose trailheads at higher altitude whenever available at Mt. Daisetsuzan. Such a trend is not obvious at Mt. Tsukuba since the al-titude of the most popular trailhead is 200 me-ters while some of less-used ones are around 500 meters. However, hikers with cars prefer to come back to or close to the same trailhead regardless of its altitude. They have ambivalent demands that they want to enjoy walking on a trail while avoiding walking on the road on which they drove to come.
Conclusions
The introduction of a shuttle-bus service stop-ping at each trailhead or opening more circulat-ing trails will alleviate the dilemmas of car-de-pendent hikers. This will encourage easy walking at the foot of Mt. Tsukuba since there are diverse cultural resources including a historic pilgrim-
age route developed in the early 18th century. However, such options might disperse hiker’s im-pacts under current management conditions.
Mt. Tsukuba has an unusual number of trails, and gives hikers diverse walking experiences. This partially explains why it attracts repeaters in spite of its compact size. However, they tend to avoid crowded times, days or routes. Such factors make hiker surveying at Mt. Tsukuba difficult. We need to develop more sophisticated monitoring tech-niques.
References
Shiratori, K. & Ito, T. (2001). Motorized Access Control as a Wildland Recreation Management Tool: Access Changes and Visitor Behavior at Daisetsuzan Nation-al Park. In: Sievanen, T., Konijnendijk, C. & Lang-ner, L. 2001 (Eds.). Forests and Society the Role of Research Finnish Forest Research Institute. Research Papers (815), p 29-41.
P
’
P
P
Figure 2: Three Patterns of Visitor`s Route choices (N=485).

Siegrist, D., Clivaz, C., Hunziker, M. & Iten, S. (eds.) (2006). Exploring the Nature of Management. Proceedings of the Third International Conference on Monitoring and Management of Visitor Flows in Recreational and Protected Areas.
University of Applied Sciences Rapperswil, Switzerland, 13-17 September 2006. Rapperswil.
62
Visitor and Environmental Impact Monitoring as Basis forSustainable Nature Tourism in Estonian Recreational Areas
Marge Rammo1, Kaidi Maran2, Anu Almik2 & Kalle Karoles2
1State Forest Management Centre, Recreation Department, Tallinn, [email protected]@[email protected]
2Estonian Centre of Forest Protection and Silviculture, Tartu, [email protected]
Keywords: Forest recreation, environmental impact monitoring, recreational load, visitor counting, visitor survey.
The State Forest Management Centre (SFMC) is the agency responsible for the management of state forests, with a total forested area of about 1.08 mil-lion hectares, which is about a half of all Estonian territory covered by forest (2.2 million hectares). In addition to silviculture and wood production, the SFMC is also responsible for multiple forest recreation activities in recreational areas located in state forests without damaging forest and biota.
Since 1997 the SFMC has created diverse oppor-tunities to spend time in nature in 10 recreation-al areas.
In order to clarify the development needs of recre-ational use of forests and to adopt optimal financ-ing decisions the SFMC has conducted surveys and accounting of visitors of recreational areas since the year 2002.
In order to manage the recreational areas in the best way, the needs of users and changes in needs shall be periodically monitored (visitor survey), the number and distribution of visits shall be as-sessed (visitor counting) and the environmental impact of recreational activities shall be systemati-cally observed (surveys on the environmental im-pact and carrying capacity of landscape).
Continuous visitor counting provides information of the areas most visited and the division of the recreational load by objects and types of use.
Visitor counting is carried out in all of the ten recre-ational areas of the SFMC during the period when land is not constantly frozen. The first counters
were installed on the focuses of visitor traffic of a recreational area in 2002. As of 2005, based on the visitor surveys, 29 electronic counters have been installed in the recreational areas of the SFMC.
The results of visitor counting reveal a steep growth in the number of visits within the last years. SFMC network of recreational areas accommodated near-ly 450’000 visits in 2003 and 600’000 in 2005.
Periodic performance of visitor surveys provides the manager with the knowledge of the users pro-file and types of use.
The results of visitor surveys show that three main types of usage are dominant – coastal holiday and camping with a duration of up to 2 weeks, and pic-nics as well as visits to natural monuments signifi-cant in Estonian conditions usually as brief visits.
Due to the increasing recreational load against the background of diverse types of use and expected special preparation of forest landscapes the assess-ment of environmental impacts caused by outdoor recreation has become more and more important.
Regular observation of environmental impact of recreational load allows the impacts of different types of use practiced in different capacities on various landscapes to be clarified.
In 2002 the Estonian Centre of Forest Protection and Silviculture (CFPS) in good cooperation with the SFMC started environmental impact monitor-ing in recreational areas. There was an urgent need to develop a low-cost monitoring system with suf-

The Significance of Visitor Monitoring Data for Management, Planning and Policy
63
ficiently high levels of accuracy. The primary ob-jective of the monitoring was to determine the state of recreational forests and the direction and amount of changes which may vary to some extent in terms of time and causes.
In Estonia, environmental impact is concentrated at and around recreational sites usually developed for visitor use – visitor centers, different hiker and educational trails, campsites, picnic and fire pits and other areas of rest, especially on the coastal ar-eas of rivers, lakes and the Baltic Sea.
In 2002-2005, a network of permanent monitoring transects and sample plots have been established and environmental impact assessments and eval-uations started in 7 recreational areas. The net-work of permanent monitoring transects with dis-tances mainly of 30 m between was established in the campsites. The small sample plots with areas of 1 m2 were located systematically on transect lines. An original system of ecological indicators charac-terizing the condition of the forest ground vegeta-tion, trees, natural regeneration and forest soils has been worked out and tested. Zones of the trails and camping areas with different levels of vegetation and soil damages, shares of bare mineral ground, root exposure and decreases in the soil ground lev-el were measured. In the surrounding forest the vegetation cover, plant species composition, dis-tribution and abundance of injuries were also as-sessed.
As results of environmental impact assessments on campsites the appearance of soil and soil vegeta-tion damages, injuries of natural regeneration and trees seem to be a very real problem, whereby on trails and the surrounding forest damage to the soil and roots of the trees is considerable.
In almost all of the assessed recreational areas, at least in some parts, the environmental impact is al-ready now higher than an acceptable level.
According to our experience, once every 3-5 years seems to be a reasonable frequency for environ-mental impact assessments in most situations.
Recreational use of Estonian state forests has in-creased by 25% within the last three years, the rec-reational types of use have diversified and the pos-sibly greatest share of the recreational activities has been directed to recreational areas prepared for
visitors. The demand for ecotourism is expected to grow in the future. Different survey and monitor-ing systems are required in order to assess the sup-ply and demand of recreational resources.
Regular implementation of the surveys and moni-toring provides a combined result, which enables the manager of the state forest (SFM) to adopt the best resolutions by the recreational load of recre-ational areas, which is increasing,
upon planning development tendencies and managing the existent system;
upon building infrastructure supporting differ-ent needs and types of use;
upon planning and implementing activities of landscape protection;
upon making the most optimal financing reso-lutions.

Siegrist, D., Clivaz, C., Hunziker, M. & Iten, S. (eds.) (2006). Exploring the Nature of Management. Proceedings of the Third International Conference on Monitoring and Management of Visitor Flows in Recreational and Protected Areas.
University of Applied Sciences Rapperswil, Switzerland, 13-17 September 2006. Rapperswil.
64
Visitor Satisfaction Surveys and the Development of Access Standards for National Nature Reserves in England
Simon J. Melville
English Nature, [email protected]
Keywords: Qualitative monitoring, work planning, access standards, visitor satisfaction.
Abstract: It is estimated that National Nature Reserves in England receive around 15 million visitors each year, and this number is increasing. Since the mid 1990s English Nature has undertaken a series of visitor satisfaction surveys on a number of the National Nature Reserves in England. The purpose of the initial studies was to establish the visi-tors’ understanding of National Nature Reserves and what it was that those visitors wanted by way of facilities to im-prove the experience of their visit.
The results of the surveys influenced the development of ‘access standards’ for use in work planning and financial re-source allocation across the suite of 160 National Nature Reserves managed by English Nature.
Following major investment between 2002-2004, a further round of visitor satisfaction surveys has been completed and this paper discusses the results of these and the implications for future access improvement funding and works.
Introduction
English Nature is the government agency that champions the conservation of wildlife and natural features throughout England; work which includes the identification, declaration and management of National Nature Reserves. There are more than 200 National Nature Reserves (NNRs) in England, of which around three quarters are directly man-aged by English Nature1.
Background to visitor satisfaction survey-ingSince the creation of English Nature’s predeces-sor, the Nature Conservancy, in 1949, there has been a significant change in the view taken by the statutory nature conservation organisations in the United Kingdom of the value and use of National Nature Reserves (NNRs). Their origi-nal purpose, to be managed for conservation and as a source of scientific and conservation man-agement advice, has not been lost but expand-ed to include their potential for recreation and
1 National Nature Reserves in England fall into four categories with regard to their tenure. They may be owned or leased by English Nature, subject to statu-tory Nature Reserve Agreement or be owned and managed by an ‘approved body’ (or a combination of these forms of tenure). Only NNRs in the first three are subject of this paper.
public enjoyment. In the early 1990s, it was es-timated that some 3 million visits were made annually to NNRs in England. We currently be-lieve that figure to be around 15 million visits. Visitors to NNRs form the largest single defined and accessible target for English Nature to pro-mote its messages relating to nature conserva-tion and sustainable management of biodiver-sity.
Early in the 1990s English Nature instigated a programme known as Public Appreciation of National Nature Reserves (PAN) through which a series of projects were set up to promote the knowledge and use of NNRs in England by the general public. One of the projects was to ob-tain an understanding of visitors perceptions about the sites and how they were managed.
Methods
Following an initial qualitative stage of research and benchmarking, English Nature employed con-sultants to carry out a series of interviews on 15 NNRs during the Summers and Winters between 1995 and 1997. At each Reserve, three days of in-terviews took place in the summer and a further
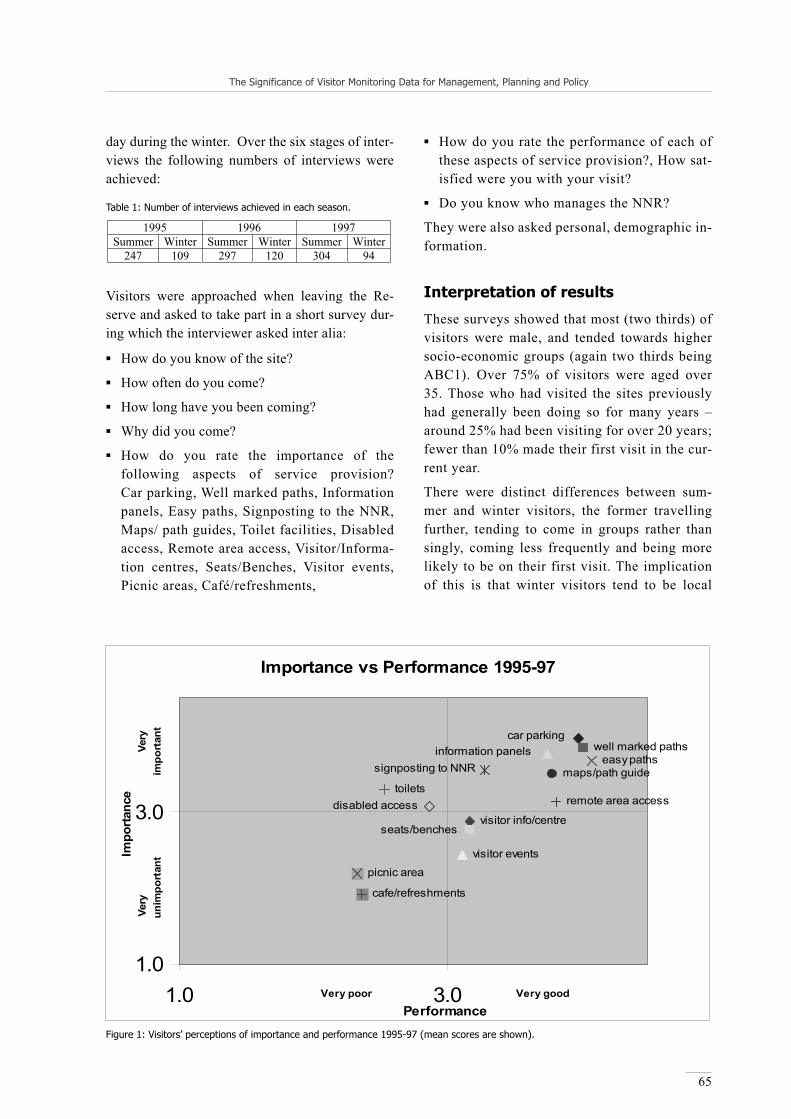
The Significance of Visitor Monitoring Data for Management, Planning and Policy
65
day during the winter. Over the six stages of inter-views the following numbers of interviews were achieved:
Visitors were approached when leaving the Re-serve and asked to take part in a short survey dur-ing which the interviewer asked inter alia:
How do you know of the site?
How often do you come?
How long have you been coming?
Why did you come?
How do you rate the importance of the following aspects of service provision?Car parking, Well marked paths, Information panels, Easy paths, Signposting to the NNR, Maps/ path guides, Toilet facilities, Disabled access, Remote area access, Visitor/Informa-tion centres, Seats/Benches, Visitor events, Picnic areas, Café/refreshments,
How do you rate the performance of each of these aspects of service provision?, How sat-isfied were you with your visit?
Do you know who manages the NNR?
They were also asked personal, demographic in-formation.
Interpretation of results
These surveys showed that most (two thirds) of visitors were male, and tended towards higher socio-economic groups (again two thirds being ABC1). Over 75% of visitors were aged over 35. Those who had visited the sites previously had generally been doing so for many years – around 25% had been visiting for over 20 years; fewer than 10% made their first visit in the cur-rent year.
There were distinct differences between sum-mer and winter visitors, the former travelling further, tending to come in groups rather than singly, coming less frequently and being more likely to be on their first visit. The implication of this is that winter visitors tend to be local
1995 1996 1997 Summer Winter Summer Winter Summer Winter
247 109 297 120 304 94
Table 1: Number of interviews achieved in each season.
Importance vs Performance 1995-97
well marked pathseasy paths
maps/path guidetoilets
remote area access
visitor info/centre
visitor events
picnic area
cafe/refreshments
car parkinginformation panels
signposting to NNR
disabled access
seats/benches
1.0
3.0
1.0 3.0Very poor Very good
Performance
Impo
rtanc
eVe
ry
Very
un
impo
rtan
t
impo
rtan
t
Figure 1: Visitors’ perceptions of importance and performance 1995-97 (mean scores are shown).

The Significance of Visitor Monitoring Data for Management, Planning and Policy
66
people who are regular and frequent users of the sites (often for dog walking). However, winter visitors were more likely to arrive by car.
Figure 1 shows the performance of various aspects of ‘visitor facilities’ on the Reserves in the context of their importance as perceived by the visitors during the first phase of the study (1995-97). Ide-ally, all items should be toward the top right hand corner – where the performance of the most impor-tant items is best. Items in the top left quadrant, deemed by visitors to be important but performing badly, are those that need to be prioritised for at-tention by site managers.
The aspects of the site which were consistent-ly most important to visitors throughout all of the surveys in this first phase were car parking, well marked paths and information panels. Aspects of service ‘not required’ – especially by winter visi-tors - were visitor events, café/refreshments, pic-nic areas, disabled access (although visitors did place some significant importance on this facili-ty, even though not for themselves personally). Overall, 84.6% of visitors expressed themselves as either ‘completely’ or ‘very’ satisfied with their visit. Only a very small percentage (around 3%) expressed any degree of ‘dissatisfaction’. The two items in the top left quadrant, toilets and disabled access, will be referred to later in this paper.
Awareness of English Nature as managers of the sites was 48% for summer visitors and the mean figure for the period of study was just 52%. Aware-ness by visitors of English Nature as an organisa-tion was somewhat higher at 69% (compared to just 2% recognition in a national MORI opinion poll).
Implications for resource allocation
The results from the survey clearly showed the ar-eas that visitors considered to be important to mak-ing their visit more pleasureable. It also indicated that, generally, English Nature was already provid-ing these facilities to a high standard on the Re-serves where the study had taken place. While around 40% of visitors wanted no change, what appeared to come from the study was that visitors wanted ‘more of the same’ rather than an invest-ment in different kinds of facilities.
From an organisational management point of view, while satisfaction was felt at the general tone of visitors’ comments, some dissatisfaction was ex-pressed in the poor recognition of English Nature.
There did not appear to be any particular urgen-cy to provide improvement to any particular ser-vice to satisfy visitors needs although it was recog-nised that a programme of continued investment in the ‘capital’ estate fabric of the Reserves was re-quired. On the other hand, it was suggested that an overhaul of information panels and other signage across the Reserves could bring about an improve-ment in visitor recognition of English Nature’s role as managers as well as improving the performance of this third-most-important service.
Other factors influencing the allocation of resourc-es for visitor-related works on NNRs included im-pending changes to disability discrimination law in the UK and new legislation to improve countryside access in England and Wales. There was a recogni-tion of the part that National Nature Reserves had to play in the provision of better countryside ac-cess; in particular, following the impact of restric-tions during the Foot and Mouth Disease crisis. At the same time, English Nature was undertaking a rebranding of its house style which gave opportu-nity for new on-site signage; while developments in sustainable transport brought consideration of its application to National Nature Reserves, many of which are in relatively remote areas.
Development of access standards
Clearly, improvements to physical estate attributes can be costly. When one is considering works over some 160 sites, of varying size/habitat/proximity to urban areas/etc, the costs soon begin to mount up. For example, to provide basic replacement of entrance signs to all of the Reserves was estimated to cost around £160,000 (232,000 Euros). Yet this allowed just £1,000 per site (1,444 Euros) – a min-iscule amount.
Other works are needed to be considered to up-grade facilities on sites - both where the surveys had taken place and others - to take account of the results of the visitors’ opinions as well as the ef-fects of the legislation changes referred to above and other ‘political’ pressures. Upgrading popular

The Significance of Visitor Monitoring Data for Management, Planning and Policy
67
paths to make them easier for visitors – whether with or without disabilities, new roadside signage to sites, better waymarking of paths and improve-ments to car parking arrangements all come at enormous cost and would need to be carefully pri-oritised to ensure that scarse resources were well spent.
As a first stage in the process of prioritsation, it was determined that the Reserves themselves needed to be categorised according to their appropriateness for development for public access. It was decided that four groups should be identified and the crite-ria for this categorisation were as follows:
Spotlight NNRsThese Reserves should be robust and able to be managed for large numbers of visitors; provide the opportunity for visitors to enjoy the wildlife experience and be suitable for making a signifi-cant contribution to promoting core nature con-servation messages.
Gold NNRsThese Reserves have robust species and hab-itats and no intractable problems of access. They will be developed in order to attract more visitors and may aspire to Spotlight status. It is likely that most NNRs will fit this classifica-tion.
Silver NNRsThese NNRs are used mostly by local people. They are robust enough to allow modest num-bers of people to visit them, using predomi-nantly marked paths and tracks.
Bronze NNRsThese Reserves may contain a high degree of risk to the public or, in most cases, have access restraints linked to tenure. They will have re-stricted access but may include access for spe-cific purposes such as scientific research and education.
The next stage was to consider which of the range of ‘facilities’ were felt to be appropriate for each category of Reserve.
These 26 facilities, shown in Table 2, became known ‘the standards’ and site managers were sub-sequently asked to report progress towards achieve-ment of each for the NNRs under their control.
Subsequent works schedule
Fortuitously, at this time English Nature was allo-cated £10 million (14.4 million Euros) through the government’s Capital Modernisation Fund (CMF) which was set up “as part of the Comprehensive Spending Review in 1998 to support government departments’ capital investment projects to im-prove key public services or public infrastructure.” (Treasury 1).
The aims of the funding to English Nature was “to improve Sites of Special Scientific Interest (SSSI) and increase public access to National Nature Re-serves”. (Treasury 2).
Site managers were invited to bid for funds for par-ticular projects which would deliver improvements against the targetted standards and which could be completed within the allowed 2 year time frame dictated by CMF. In addition, two corporate proj-ects were run concurrently to achieve re-signing of all of the NNRs and to pilot visitor counting appa-ratus (Melville & Ruohonen, 2004).
Follow-up qualitative survey
Following the substantial completion of the works funded through CMF, with additional funding from English Nature’s core funds, a second phase of visitor opinion surveying was carried out using the same set of questions as in the first tranche. As with the first phase, specialist consultants were used to carry out the field work and assessment. Single day-long surveys were carried out during Winter 2004 and Summer 2005 on 15 sites, 6 of which had been included in the original phase. 125 interviews were conducted during the winter sur-vey: 443 during the summer.
Figure 2. shows the importance and performance of the same set of ‘visitor facilities’ perceived by the visitors during the second phase of the study (2004-05). Comparing this figure with Figure 1 shows that, again, the majority of items fall into the top right quadrant. Disabled access appears in this quadrant now (having moved from the top left).
The only item in the top left quadrant (‘very im-portant’ but ‘very poor performance’) is toilets and, in comparison with the earlier survey, their

The Significance of Visitor Monitoring Data for Management, Planning and Policy
68
Standard Spotlight Gold NNRs
SilverNNRs
AmberNNRs
Off-site signing – brown ‘tourism’ sign
Required Preferred Notrequired
Notrequired
Off-site signing – white sign
Required Preferred Preferred Notrequired
Reserve leaflet – full colour
Required Required Preferred Notrequired
Reserve leaflet – b/w or two-colour info sheet
Required Notrequired
Preferred(b/w or full-colour)
Preferred
Web site Required Required Required Required
Media relations ongoing Required Required Required Required
Media training Required Required Required Required
Interpretation training Required Required Required Required
Interpretation plan Required Required Required Required
Green travel plans Required Required Preferred Notrequired
Educational facilities Required Required Required Required
Community involvement and volunteers
Required Required Required Preferred
Links to other places Required Preferred Notrequired
Notrequired
Entrance signs Required Required Required Required
Orientation panel(s) Required Preferred Preferred Notrequired
Interpretation panel(s) Required Required Preferred Notrequired
Self-guided walks Required Required Preferred Notrequired
Access for all abilities Required Required Required Required
Risk assessments Required Required Required Required
Structures in safe condition
Required Required Required Required
All year access Required Required Notrequired
Notrequired
Visitor counting mechanisms
Required Preferred Notrequired
Notrequired
Staff presence (% time) Required Preferred Notrequired
Notrequired
Events programme Required Required Preferred Preferred
Car parking Required Preferred Notrequired
Notrequired
Cycle parking Required Required Required Notrequired
Table 2: The ‘standards’ required for each category of National Nature Reserve.
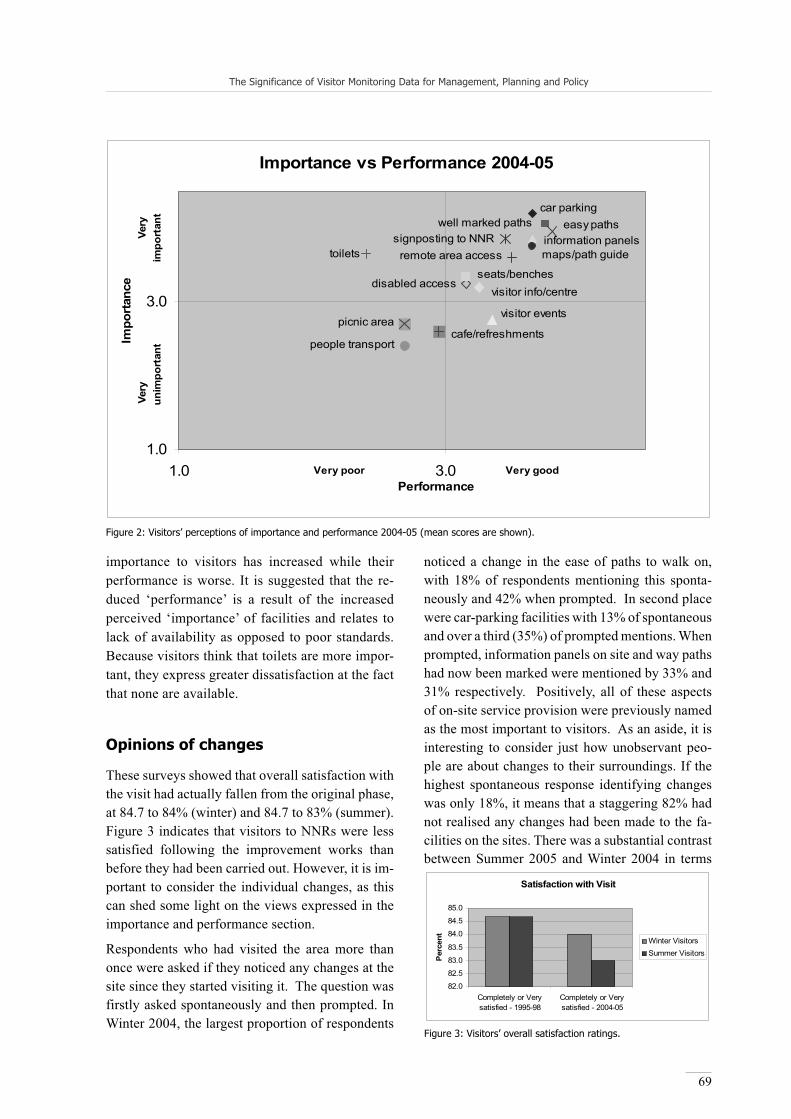
The Significance of Visitor Monitoring Data for Management, Planning and Policy
69
importance to visitors has increased while their performance is worse. It is suggested that the re-duced ‘performance’ is a result of the increased perceived ‘importance’ of facilities and relates to lack of availability as opposed to poor standards. Because visitors think that toilets are more impor-tant, they express greater dissatisfaction at the fact that none are available.
Opinions of changes
These surveys showed that overall satisfaction with the visit had actually fallen from the original phase, at 84.7 to 84% (winter) and 84.7 to 83% (summer). Figure 3 indicates that visitors to NNRs were less satisfied following the improvement works than before they had been carried out. However, it is im-portant to consider the individual changes, as this can shed some light on the views expressed in the importance and performance section.
Respondents who had visited the area more than once were asked if they noticed any changes at the site since they started visiting it. The question was firstly asked spontaneously and then prompted. In Winter 2004, the largest proportion of respondents
noticed a change in the ease of paths to walk on, with 18% of respondents mentioning this sponta-neously and 42% when prompted. In second place were car-parking facilities with 13% of spontaneous and over a third (35%) of prompted mentions. When prompted, information panels on site and way paths had now been marked were mentioned by 33% and 31% respectively. Positively, all of these aspects of on-site service provision were previously named as the most important to visitors. As an aside, it is interesting to consider just how unobservant peo-ple are about changes to their surroundings. If the highest spontaneous response identifying changes was only 18%, it means that a staggering 82% had not realised any changes had been made to the fa-cilities on the sites. There was a substantial contrast between Summer 2005 and Winter 2004 in terms
Importance vs Performance 2004-05
car parkingwell marked paths
information panelssignposting to NNRmaps/path guidetoilets
disabled access
remote area access
visitor info/centreseats/benches
visitor eventspicnic area
cafe/refreshmentspeople transport
easy paths
1.0
3.0
1.0 3.0Very poor Very goodPerformance
Impo
rtanc
eVe
ry
Very
un
impo
rtan
t
impo
rtan
t
Figure 2: Visitors’ perceptions of importance and performance 2004-05 (mean scores are shown).
Satisfaction with Visit
82.0
82.5
83.0
83.5
84.0
84.5
85.0
Completely or Verysatisfied - 1995-98
Completely or Verysatisfied - 2004-05
Per
cent Winter Visitors
Summer Visitors
Figure 3: Visitors’ overall satisfaction ratings.

The Significance of Visitor Monitoring Data for Management, Planning and Policy
70
of the visitors noticing changes but this can be ex-plained by the differences examined in these two audiences examined above (summer visitors be-ing more likely to be first-time visitors). General-ly, summer visitors noticed far fewer changes and of the changes they did notice were principally re-lated to car parking and to the ease of paths to walk on. Respondents were also asked to assess if chang-es they observed have been for the better or for the worse (Figure 4). Overwhelmingly, changes ob-served were for the better as the negative responses were negligible.
Taking these results with the assessment of im-portance and performance, it appears that our vis-itors are expressing a need for increased comfort and guidance, building on the work that has already been carried out. Bearing in mind the high propor-tion of visitors who have previously visited (90%), this need cannot be attributed to a new, more cos-seted, audience now visiting the sites but must in-dicate greater expectations amongst long-term visitors generated by the works that have recent-ly taken place – whether they consciously noticed them or not.
Implications for future development workWhen asked to suggest further improvements to on-site facilities, 43% of those interviewed in the first tranche suggested that English Nature was do-
ing a good job and nothing needed doing. Fol-lowing the works identified above, only 31% re-spondents in the second tranche made the same comment. Of the specific improvements respon-dents asked for, requests for better information and signage by 18% in the first tranche had fall-en to 7% in the second survey, indicating that the improvements to information availability and signage made from the CMF funding had been noticed and appreciated.
In the second survey, 6% were asking for more and improved paths – a slight increase on the 4% in the first survey. The 6% who were want-ing more seating were still wanting it but the 8% demanding toilets had grown to 11% in the sec-ond survey. The surveyors reported that ‘over-whelmingly, the provision of more/better toilets is the improvement that the greatest number of respondents wanted to see’. Currently, English Nature has no proposals to provide toilet facil-ities at its NNRs but should consider including directions to those nearest available in informa-tion about the Reserves.
This project has shown that the use of visitor satisfaction survey data has been valuable in informing the priority of access improvement works to be undertaken on NNRs and, taken with other ‘political’ priorities, has shown that the use of ‘standards’ for reporting progress in implementation has worked. The analysis of two
Opinions of changes
0 20 40 60 80 100
Information panels
Way paths are marked
Visitor information
Seats/benches
Way boundaries are marked
Visitor events
Disabled access
Signposting to Reserve
Car parking
Maps / path guides
Easy paths to w alk on
% expressing satisfaction with each change
Figure 4: Visitors’ opinions of the changes to the standard of facilities on sites.

The Significance of Visitor Monitoring Data for Management, Planning and Policy
71
sets of survey data from ‘before’ and ‘after’ the works were carried out has shown somewhat con-flicting results but these can be explained by the increasing demands and expectations of visitors to National Nature Reserves.
References2
English Nature (1999). NNR Visitor Satisfaction Survey: presentation of baseline findings, Unpublished report prepared by Business & Market Research plc.
English Nature (2006). NNR Visitor Satisfaction Survey Stage2: Summer 2005, Unpublished report prepared by Harris Interactive.
Melville, S. & Ruohonen, J. (2004). The development of a remote-download system for visitor counting. Pro-ceedings of the Second International Conference on Monitoring and Management of Visitor Flows in Rec-reational and Protected areas 2004, p 37–43.
Treasury1: http://www.hm-treasury.gov.uk/Documents/Public_Spending_and_Services/Capital_Modernisa-tion_Fund/pss_cmf_intro.cfm
Treasury2: http://www.hm-treasury.gov.uk/Documents/Public_Spending_and_Services/Capital_Modernisa-tion_Fund/pss_cmf_round3.cfm?
2 Further information is also available at: http://www.english-nature.org.uk

Siegrist, D., Clivaz, C., Hunziker, M. & Iten, S. (eds.) (2006). Exploring the Nature of Management. Proceedings of the Third International Conference on Monitoring and Management of Visitor Flows in Recreational and Protected Areas.
University of Applied Sciences Rapperswil, Switzerland, 13-17 September 2006. Rapperswil.
72
Visitor Counting with Acoustic Slab Sensors in the Swiss National Park
Reto Rupf-Haller1, Michael Wernli1 & Flurin Filli2
1University of Applied Sciences Waedenswil, [email protected]
2Swiss National Park, [email protected]
Keywords: Visitor counting, acoustic slab sensor, Swiss National Park, walking experiments.
Introduction
Monitoring of visitor flow in recreational parks is important to various tasks of management, e.g. to assess the impact of visitors to the nature, to get information about the signification to the regional market or to estimate the demand trends for the fu-ture (Cessford & Muhar 2003). However, data ac-quisition is a very time-consuming and money-in-tensive assignment. There are three main categories of data collection methods: self-counting, direct-counting and indirect counting (Hollenhorst et al. 1992). Depending on the goal of visitor monitoring, different data collection types are used. Self-count-ing methods are quite uncertain because their back-flow is low. With direct-counting methods a lot of information, such as visitor characteristics, visi-tor behaviour and visitor numbers can be collect-ed. The disadvantage of these methods is their big costs. A lot of human resources are needed to col-lect data. Indirect-counting systems generate sim-ple estimations of recreational use, which are quite accurate after calibration (Hollenhorst et al. 1992).
The Swiss National Park (SNP) is situated on the extreme south east of Switzerland, on the border to Italy. The Park was established in 1914 as the first national park of the Alps and of central Europe. Its aims are total protection of nature and research. It covers an area of 172 km2 and has 80 km of public accessible hiking trails. Many research programs concerning various themes of natural environment without direct influence of humans are taking place in the area. So far, there was only little research of visitor use and distribution. Any use of the park, ex-
cept hiking, is prohibited and it is strictly forbidden to leave the trails. That makes it easier to use an in-direct-counting system. The last visitor counting in the Swiss National Park originates from the years 1991-1993 (Lozza 1996). However, since these in-vestigations, some outer circumstances changed (e.g. new direct railway-line into the region) and the technological development progressed. In sum-mer 2005 the SNP started a new visitor monitoring experiment with a pilot project. At four places in three different valleys of the park indirect-counting systems with acoustic slab sensors were installed. For two days in July, human observers counted the visitors who passed the sensors on every counting site. This data was used for checking and calibrat-ing the counting system.
Main questionsIn this survey the calibration process of the auto-matically collected data will be presented. Fur-thermore, main problems of miscounting will be figured out to improve the application and the han-dling of such acoustic slab sensors. Recommenda-tions to get more exact data will be elaborated. Fur-thermore the number of visitors of the SNP during the year 2005 was estimated and will be discussed on the basis of the collected data.
MethodsFour acoustic slab sensors were installed in the first days of July at Mingèr and Margunet Valley and two at Trupchun Valley. The sensors consist of

The Significance of Visitor Monitoring Data for Management, Planning and Policy
73
two pressure sensitive slabs. According to the man-ual of the manufacturer they are buried under an 8 to 10 cm thick layer of soil. Each slab has a sock-et on which it is connected to a data logger. The system registers the visitors hourly. To calibrate the sensors and check the accuracy of the automatically collected data, simultaneous counting by man dur-ing two days was performed, on Monday and Tues-day the 18th and 19th of July 2005. Each day there were observations from 8 a.m. until 6 p.m. The ob-servers counted people who passed the system and kept an eye on their passing behaviour.
To estimate the number of visitors in the SNP, the automatically imposed data must be calibrated. For that reason the number of visitors observed was di-vided by the number of automatically registered visitors. This factor is used as a calibration factor (Ross 2005). To calculate a consistent calibration factor, the mean of every hour can be used (Formu-la I). As there were no evident reasons to explain the outliers with an index bigger than 1, they were also used to calculate the calibration factor.
a: automatically collected data with acoustic slab sensors
cf: calibration factor
m: manually collected data
Based on the data of the counting days and estima-tions about visitor distribution in the SNP for the year 1993 (Lozza 1996) the total number of visi-tors for the whole year 2005 (with the assumption of a similar visitor distribution) was calculated. The sensors were located near the four main entrances of the SNP. On the counting days more sites and di-rections were observed than the sensors covered. On each site the total number of visitors on these days was compiled. The comparison between the estimated persons on the site and the number of people that passed the counter leads to another cor-rection factor. It is described in Formula II.
a: automatically collected data with acoustic slab sensor
cf: calibration factor
s: number of visitors that passed the sensor site
t: total number of visitors in the valley on count-ing days
T: estimated total number of visitors
Lozza (1996) figured out that the four sites cover about 65% of all visitors in the SNP. So the visi-tor numbers as calculated in Formula II were divid-ed by 0.65.
According to the passing behaviour of the visitors and the results of visitor monitoring in SNP, hy-potheses were formulated and tested with walk-ing experiments. The loggers are assumed to work correctly. The hypothesis concerned the following questions:
What is the sensitive area of the counter?
How does step length affect the counting?
How must groups pass the sensor to be counted correctly?
Does composition of covering material affect the sensors counting?
For the experiments the sensors were installed on three different locations covered with different ma-terial. Before covering, the exact position of the panels was flagged to test the stepping sensitivity on the edge and near the counter. To test the sensi-tivity for groups, the group sizes and distance be-tween the hikers were varied. The test persons car-ried a stick of a given length to keep the distance between them constant. In another experiment ar-tificial boundaries were constructed to force the hikers walk in line. The experiments consisted of 10 repeated exceedances. Experiments of bigger groups were not repeated 10 times, but read off af-ter every exceedance.
Results
Visitor counting in the Swiss National ParkTo calibrate the sensors counting visitors in SNP, the automatically and manually counted data were compared. The results show quite a big deflection and data is not very constant. On the x-axis in Fig-ure 1 the number of manually counted visitors is shown. On the y-axis is an index that represents the
I.ammeancf
II. acfs
stacfT ***

The Significance of Visitor Monitoring Data for Management, Planning and Policy
74
division of automatic counts by manual counts. An index below 1 indicates sensor under-count and in-dices above 1 represent sensor over-count.
Except for some over-estimates, when there were few visitors, the counting sensors always mea-sured fewer visitors than really passed. Particu-larly when a lot of visitors passed the system the counting seems to be constant by an index of about 0.5. Causes of under-estimates could be visitors with very long stride who step over the sensors, visitor passing in groups even side by side or with very small distance among each other, or the coun-ter can become less sensitive if the soil above is frozen or very compact (Ross 2005). If the path is too wide, visitors can miss the sensors and are not recorded. Another problem may be caused by the time synchronisation. The sensors count peo-ple hourly. Hikers who pass the system on clock hour may be counted manually for the previous and by the sensors for the following hour. Proba-bly this was the problem on site Trupchun 1, where an index greater than 2.5 was calculated (Figure 1). There was a quite big over-count from 3 to 4 p.m. and an under-count during the hour before. When there are more visitors per hour this problem can-not be figured out. Other reasons for over-count-ing by the sensors may be people crossing the slabs
very slowly, or even turning over. As the sensors were placed near crossings, tourists who are not sure where to go may act as described. Walking ex-periments in the following section will give more information about the counting problems.
In Table 1 the difference between the two data col-lection methods are shown. On site Mingèr and Trupchun 2 the mechanical under-estimate was very high. Less than 50% of the actual visitors were counted by the sensors. Causes of miscounts are described above.
The calculated correction factors range between 2.28 and 1.63 on the four observation places. The quite big (but not significant) differences on the four sites show that the under-estimates are not a bias of the sensors itself, but are specific for the sites. There must be differences in outer circum-stances or in the composition of visitors. Outer cir-cumstances could be wrongly installed sensors, the depth in which the sensor is buried, the path width or the sort of the material that covers it (Muhar et al. 2002).
The calculated correction factors range between 2.28 and 1.63 on the four observation places. The quite big (but not significant) differences on the four sites show that the under-estimates are not a
Figure 1: Comparison of manually collected data with automatic data collection. The index is calculated by the division of automaticallyand manually collected data. An index below 1 represents an under-count by the sensor.

The Significance of Visitor Monitoring Data for Management, Planning and Policy
75
bias of the sensors itself, but are specific for the sites. There must be differences in outer circum-stances or in the composition of visitors. Outer cir-cumstances could be wrongly installed sensors, the depth in which the sensor is buried, the path width or the sort of the material that covers it (Muhar et al. 2002).
Total of visitors for the year 2005The calculation of 110‘000 visitors for the year 2005 is lower than the last estimations (Fig-ure 2). It must be considered that the bases of the estimations are different for the 3 years. In 1991 the estimation of 250‘000 visitors per year based on just two counting days in August. Pos-sibly the good weather on these days resulted in an over-estimation. Already Lozza (1996) could not approve a visitor number of 250‘000. In 1993 the visitors were counted on 15 days (Loz-za 1996). Lozza estimated 150‘000 visitors for the year 1993. Counting over the whole period gives lower visitor numbers than extrapolation of some test days. A peculiarity of the observed data in the year 1993 is the fact that a very pop-ular program to settle bearded vultures in the SNP has been carried out. Also in 2005 there was a bear as special attraction that may have increased visitor numbers. The error bar of the estimation in 2005 describes the confidence in-terval of the correction factor (cf).
Comparing the observations of the year 1993 with 2005, a trend for future attendance could be ventured. Because the type of data collection differs for 2005 it is difficult to give a secure statement. Highly decreasing visitor numbers are not expected. As the insecurity of the calcu-lation reaches the number of 150‘000, the visi-tor numbers are expected to be slightly decreas-ing or to remain constant for the last decade.
Experimental sensor testsThe sensitivity of the sensors was tested with walk-ing experiments. The main results of the experi-ments are listed in Table 2.
The experiments of stepping on the slab border demonstrate that the sensor can not detect every passing hiker. The deviance is not very big. The sensor is less sensitive on the side with the sock-ets, where it missed 10 hikers out of 100. On the opposite side without sockets, the miscount is just half as big.
Big step length may cause problems for the coun-ter but only for very long strides (Ross 2005). For a step length of 80 cm the deviance is 4 percent. Short steps do not cause any deviance. Stepping between the two slabs did not provoke any mis-count either.
The manufacturer declares that children heavi-er than 10 kg trigger counting. Our experiments with two children approve this information only partly. A child that weighs 14 kg provoked an un-der-counting of 13 percent, which is a significant miscount. A child of 22 kg was always counted ac-curately.
Observation Sites
Total of manually counted visitors
Total of automatically counted visitors
Percentage of automatically counted visitors
Calibrationfactor (cf)
Mingèr 201 90 44.8% 2.28 Margunet 469 255 54.4% 1.81 Trupchun1 405 254 62.7% 1.63 Trupchun2 330 159 48.2% 1.96
Table 1: Collected data, deviance and calibration factor on 2 observation days in July.
0
50
100
150
200
250
300
1991 1993 2005
year
num
bers
of v
isito
r (in
thou
sand
s)
Figure 2: Estimations for visitor numbers in the SNP. The data is based on two observation days in 1991, 15 days in 1993 and 4 months of automatic counting in the year 2005.

The Significance of Visitor Monitoring Data for Management, Planning and Policy
76
If the distance between two persons is one me-ter and more, the counting is correct. With less space between hikers there is a quite big devi-ance of up to 40 percent. Walking in line with less than 80 cm distance is not very comfort-able. But if the path is wide enough for hikers to walk at least partly side by side it is very proba-ble that they walk closer. If the distance between persons is too small for the counter it does not matter how close they walk. Groups of three and four persons with small distance provoke few-er miscounts than groups of two persons. Proba-bly it is more difficult to keep the distance con-stant. Furthermore, a group of three and more persons triggers at least twice. If a group passes the sensor side by side the counting is not cor-
rect. A deviance of over 50% was measured for a group of 6 people. If the same group walks in line as close as possible, the deviance is much smaller. It is very interesting that the experi-ment with 7 persons walking as close as pos-sible with boundaries is quite correctly count-ed by the sensor. That means, with boundaries people can not walk closer than one meter, nei-ther do they step beside the slabs. A problem for recreational areas such as the SNP is that the boundaries must be natural or designed incon-spicuously, in a way that neither tempts children to play and provoke an over-count nor allows people to walk closely together or side by side to provoke under-counts.
Number of repetition
Totalobservations Experiment
Meandeviance
10 100 step on border of sensor (socket side) 10%10 100 step on border of sensor (opposition side) 5%10 100 step on border of sensor (both sides) 8%10 100 step length 80cm 4%10 100 step length 30cm 0%10 100 step between two sensors 0% 10 100 hiker with sticks 0%
5 50 children (22kg) 0%5 50 children (14kg) 14%
10 200 2 persons 100cm distance 0% 10 200 2 persons 80 cm distance 42% 10 200 2 persons 60 cm distance 32% 10 300 3 persons 80 cm distance 16% 10 400 4 persons 80 cm distance 13% 10 60 6 persons in group 53%10 60 6 persons in line 13% 10 70 7 persons with boundaries 6%
Table 2: Mean deviance between sensor counting and passing experiments.
Number of repetition
Totalobservations Cover material Experiment
Meandeviance
5 50 Soil and gravel Normal walking 0% 5 50 Soil and gravel Step on border of sensors (side
without socket) 2%
10 100 Soil and wood chips
Normal walking 0%
10 100 Soil and wood chips
Step on border of sensors (side without socket)
46%
5 100 Gravel Normal walking 4%
Table 3: Experiments with different type cover material.

The Significance of Visitor Monitoring Data for Management, Planning and Policy
77
Further research
It is important that the sensors always work properly during the whole season. They must be checked regularly. Ross (2005) mentioned the problem of frozen ground that can provoke un-der-counts with such sensor systems. In the test period it was not possible to check this situation. Another question concerns the verification of the 65% (Lozza 1996) of total park visitors that can be reached with the four test sites. For fur-ther calibration work a proper observation of the time synchronisation between the observers and the sensors is recommended.
Conclusion
For every sensor on each site calibration must be performed (Ross 2005). The calibration may be realized together with visitor interviews to perform visitor surveys at the same time. For the calibration, special regard should be spent on the time synchronisation between the observ-ers and the sensors.
In the year 2005 there were 110’000 estimated visitors in the SNP, which is less than the num-ber of visitors in the year 1993. The data collec-tion was different. Nevertheless, the total num-ber of visitors slightly decreased or remained constant over the last decade.
The results of walking experiments with acous-tic slab sensors showed that they perfectly count single persons who step in the centre of the sen-sors. Under covering material of soil and gravel the sensor detects persons passing on the border of the slab. But the sensor is less sensitive on the sides of the sockets. Long steps may affect the counting accuracy (Ross 2005), but with steps up to 80 cm there are no incisive problems, even if the hikers step only in the middle of the two slabs. Children lighter than 15 kg may not be counted correctly. Groups affect the counting most. If persons are walking very close togeth-er, with a distance under 1 meter, they are of-ten counted as just one person. The hikers must be forced to walk in line. If there is not enough space to walk side by side, their distance nor-mally is in the sensitive band of the counting system. It is recommended using even natural
boundaries or, if such obstacles are not avail-able, to construct light artificial railings that do not encourage to be played with. For example, such railings could be wire fences.
References
Cessford, G. & Muhar, A. (2003). Monitoring options for visitor numbers in national parks and natural areas. In: Journal of Nature Conservation (11), p 240-250.
Hollenhorst, S.J. (1992). Monitoring Visitor Use in Back-country and Wilderness: A Review of Methods.
Lozza, H. (1996). Tourismusbefragung 1993 im Sch-weizerischen Nationalpark. Semesterarbeit Universi-ty of Zurich, Arbeitsberichte zur Nationalparkforsc-hung. Zernez.
Muhar, A., Arnberger, A. & Brandenburg, C. (2002). Meth-ods for Visitor Monitoring in Recreational and Pro-tected Areas: An Overview. In: Arnberger, A., Bran-denburg, C., Muhar, A. (2002) (Eds.). Monitoring and Management of Visitor Flows in Recreational and Protected Areas. Conference Proceedings. Bodenkul-tur University Vienna, Austria, January 30 – February 02, 2002. Vienna, p 1-6.
Ross, J. (2005). Visitor counters in parks: management practice for counter calibration. Wellington.

Siegrist, D., Clivaz, C., Hunziker, M. & Iten, S. (eds.) (2006). Exploring the Nature of Management. Proceedings of the Third International Conference on Monitoring and Management of Visitor Flows in Recreational and Protected Areas.
University of Applied Sciences Rapperswil, Switzerland, 13-17 September 2006. Rapperswil.
78
National Park Characteristics, Regional Setting and Visitor Flows
Jenni Puustinen1, Eija Pouta2, Marjo Neuvonen1 & Tuija Sievänen1
1Finnish Forest Research Institute, [email protected]@[email protected]
2MTT Agrifood Research Finland, [email protected]
Keywords: Recreation, national parks, visitor flows, regression analysis, classification.
Introduction
The importance of national parks as national icons and tourist destinations is widely recog-nized. The visitor flows to national parks are in-creasing all over the world, which affirms their significance for tourism and recreation. Nature-tourists choose their destinations on the basis of natural environment, location and man-made fa-cilities provided for tourists. The travel experi-ences of park visitors also include their experi-ences of tourist services in area surrounding the national park. Understanding the relationship between visitor flows and park characteristics, as well as between visitation and the attractions that are provided outside the park, is crucial in planning and management of existing national parks. This information is also needed in assess-ing impacts of establishment of new parks as the visitor flows and related tourism income can have a significant affect on local economies.
Methods
The objective of this study is to examine the fac-tors which contribute to national parks populari-ty. The study focused on factors such as the natu-ral characteristics of a park, its recreation facilities and services, tourism services in the surrounding communities, and park’s location related to poten-tial users. Two distinct methods, classification and regression modelling were used to analyze the vis-itor flows to all thirty-five national parks in Fin-
land. The park data was received from Finnish For-est and Park Service, and the community data was gathered from various statistical sources.
Results
National parks were first classified in categories which reflected their features in natural condi-tions, provision of recreational facilities, and tourism services in the surrounding communi-ties (table 1). The results of the classification approach show the accumulation of natural val-ues and services. National parks having a high level of natural values typically had a good pro-vision of recreation facilities and both were re-lated to a high number of visits. If the level of natural values were lower a high level of ser-vices did not increase the visitor flow. Further-more, the high level of natural values and rec-reation facilities inside a park were typically associated with a good provision of services in the surrounding communities, which tended to further increase visitation levels.
Next a multiple regression analysis was used to examine the coexistent impact of several inde-pendent variables to park visitation (table 2). The results showed the relative importance of supply factors on visitation. Recreation oppor-tunities, number of biotopes, provision of trails and park’s age increased the number of visits. The results revealed the minor effect of the de-mand factors on park visitation. Only in more
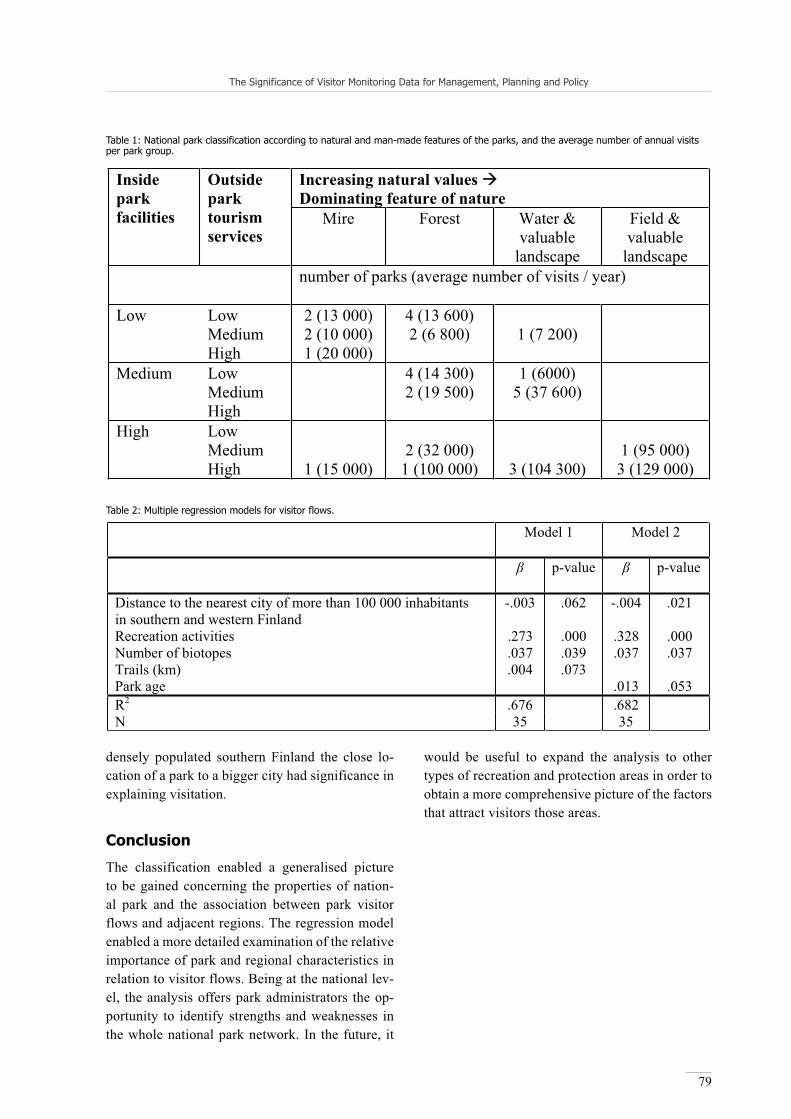
The Significance of Visitor Monitoring Data for Management, Planning and Policy
79
densely populated southern Finland the close lo-cation of a park to a bigger city had significance in explaining visitation.
Conclusion
The classification enabled a generalised picture to be gained concerning the properties of nation-al park and the association between park visitor flows and adjacent regions. The regression model enabled a more detailed examination of the relative importance of park and regional characteristics in relation to visitor flows. Being at the national lev-el, the analysis offers park administrators the op-portunity to identify strengths and weaknesses in the whole national park network. In the future, it
would be useful to expand the analysis to other types of recreation and protection areas in order to obtain a more comprehensive picture of the factors that attract visitors those areas.
Increasing natural values Dominating feature of nature
Insideparkfacilities
Outsideparktourismservices
Mire Forest Water & valuable
landscape
Field & valuable
landscape number of parks (average number of visits / year)
Low Low 2 (13 000) 4 (13 600) Medium 2 (10 000) 2 (6 800) 1 (7 200) High 1 (20 000) Medium Low 4 (14 300) 1 (6000) Medium 2 (19 500) 5 (37 600) High High Low Medium 2 (32 000) 1 (95 000) High 1 (15 000) 1 (100 000) 3 (104 300) 3 (129 000)
Table 1: National park classification according to natural and man-made features of the parks, and the average number of annual visits per park group.
Model 1 Model 2
p-value p-value
Distance to the nearest city of more than 100 000 inhabitants in southern and western Finland
-.003 .062 -.004 .021
Recreation activities .273 .000 .328 .000 Number of biotopes .037 .039 .037 .037 Trails (km) .004 .073 Park age .013 .053 R2 .676 .682 N 35 35
Table 2: Multiple regression models for visitor flows.

Siegrist, D., Clivaz, C., Hunziker, M. & Iten, S. (eds.) (2006). Exploring the Nature of Management. Proceedings of the Third International Conference on Monitoring and Management of Visitor Flows in Recreational and Protected Areas.
University of Applied Sciences Rapperswil, Switzerland, 13-17 September 2006. Rapperswil.
80
Visitor Monitoring in Norwegian National Parks? If so: How Will it Find a Position in the Present Situation with Low Funding,
Biological Hegemony, Expanding User Interests and Indistinct Management Priorities?
Odd Inge Vistad
Norwegian Institute for Nature Research, Norway
Keywords: Social monitoring, ecological monitoring, national park management, tourism, rural development.
Monitoring in Norway
There is no tradition for social monitoring in Nor-wegian national parks, only a few examples of isolated visitor studies. On the other hand, sever-al biological monitoring projects exist, partly as national programs and partly because of the con-servation goals within each area. Often the mon-itoring locations (for national programs) are in national parks because the environmental con-ditions are presumably more stable and predict-able than elsewhere. Generally, even monitoring of biodiversity (in Norway) has to be implement-ed with very low funding, and often under sub optimal conditions (scientifically, practically and concerning database development). Monitoring in protected areas in Norway has a long way to go before reaching a satisfying level and quality (Hagen et al. 2005).
Changes in society and conservation management – conflicting goals?
But something is about to happen that highlights the need for better monitoring. During the last years there has been political focus on the na-tional parks and the mountain areas (where most of our national parks are located): New national parks are still being designated, partly on private land and very often through processes revealing land use conflicts. The ru-ral municipalities want “something back” when “providing” the national and international soci-ety with national parks.
The result is often pilot projects with community based management, and a stronger “will” (mean-ing political statements) to develop a combina-tion of sustainable use and nature conservation. The “mountain text” (St.prp.nr. 65 (2002-2003)) states that commercial activity in national parks is no longer illegal. The critical question is: How can we do it, without developing conflicts, and threatening conservation goals?The “crisis” in traditional agriculture and poor economy in rural districts increases the pressure on economical development in remote areas (for instance in and around national parks). Tourism is often thought of as the answer. A new national tourism plan emphasizes the na-tional parks as an important branding of Norway, and presents an ambitious goal of 25 % more for-eign tourists in Norway by 2010 (Nærings- og handelsdepartementet 2005).In addition we have the European Community biodiversity strategy, and the ambition of halting the biodiversity loss by 2010.Can all these possible conflicting goals and am-bitions be combined, or are they simply in con-flict? Monitoring can be helpful in trying to an-swer this.
A pilot study area
In one of our newly established national parks, Dovrefjell-Sunndalsfjella National Park, two pi-lot projects are being implemented: A community based management model, and the development of a monitoring program.

The Significance of Visitor Monitoring Data for Management, Planning and Policy
81
The local ambition concerning tourism develop-ment is especially high in this area because one of the main national roads (E 6) and the railway between Oslo and Trondheim (Dovrebanen) are crossing the Dovre mountain plateau. On the other hand: The most important reason for establishing this national park was to secure the environmen-tal conditions for the wild reindeer – a species for which Norway has a special international respon-sibility. The reindeer population is vulnerable to-wards different kinds of human activity and infra-structure. These are two important reasons behind the monitoring plan that is now being developed. NINA is responsible for the plan, and the Dovre-fjell council (Dovrefjellrådet - the management authority) is the employer. The national authority for national park management (DN – The direc-torate for nature management) is also involved in this project, because of the principal aspects. Both ecological and social monitoring is included, and the critical frame is to develop a monitoring plan based on the management objectives of the park. This might be the starting point for a new (nation-al) strategy: To develop and improve the monitor-ing in national parks of (hopefully) both ecological and social qualities, and to concentrate on the po-tential threats and developments that are within the possible frame of action for the responsible man-ager. The management goals for each area shall guide the priorities for the monitoring. It seems like The Norwegian Nature Inspectorate (Statens Naturoppsyn – SNO), together with local supervi-sors, will have the main responsibility for the prac-tical monitoring in most national parks.
Local and principal issues
In the presentation I will discuss several (principal and case) challenges in this process:
Integration of monitoring knowledge as a base for management planning and action.
The co action and cooperation between the NINA (and other) researchers, SNO, the local supervisors and the management staff.
The long term building of easy accessible da-tabases
Who will own and have access to databases?
Co action and cooperation between the manag-ers and the different stakeholders? (Monitoring data can be relevant input even for tourism de-velopers).
Monitoring knowledge - management actions? (Moving from traditional management to adap-tive management?).
References
Hagen, D., Eide, N.E., Vistad, O.I., Framstad, E. & Saks-gård, L.(2005). Evaluation of the Provincial Gover-nors monitoring in protected areas (in Norwegian). In: NINA-report 48. Trondheim.
Nærings- og handelsdepartementet (Ministry of Trade and Commerce). (2005). Action plan for Tourism develop-ment (in Norwegian). Oslo.
St.prp.nr. 65 (2002-2003). Additional funding etc. in the state budget… (in Norwegian). Chap. 3.13. Miljøvernde-partementet (the so called ”Mountain Text”).

82

83
Recreation Ecology and Visitor Impact Research: Past, Present and Future
Yu-Fai Leung (Chair)

Siegrist, D., Clivaz, C., Hunziker, M. & Iten, S. (eds.) (2006). Exploring the Nature of Management. Proceedings of the Third International Conference on Monitoring and Management of Visitor Flows in Recreational and Protected Areas.
University of Applied Sciences Rapperswil, Switzerland, 13-17 September 2006. Rapperswil.
84
Recent Recreation Ecology Research in Australia
Ralf Buckley, Catherine Pickering, Guy Castley & Andrew Growcock
Griffith University, Australia
[email protected]@[email protected]@yahoo.com
Keywords: Recreation, ecology, Australia, impacts.
Why do we need recreation ecology research in different countries? Recreational impacts differ considerably between activities and between eco-systems, and Liddle (1997), Sun and Walsh (1998) and Buckley (2004) used these criteria to structure their reviews of research literature. But do findings from one country apply to comparable ecosystems elsewhere?
Different continents and geographical regions have different flora and fauna, even if they have struc-turally similar vegetation types. Considerable ef-fort has been devoted to identifying the differenc-es as well as the similarities: e.g., for coral reefs (Dubinsky 1990), coastal heaths (van der Maarel 1997), or tropical rainforests (Primack & Corlett 2004).
Except at the crudest level such as wholescale veg-etation clearance, recreational impacts are differ-ent in different continents. The broad types are similar, but the specific mechanisms, the quantita-tive relationships, and the shape of stress-response curves may depend on the terrain, climate, evo-lutionary history of plant and animal species and communities.
In addition, people in different countries tend to take part in different recreational activities, using different equipment and in different ways (Weav-er 2001, Buckley 2004, Chizhova 2004, Magro & Amanda de Barros 2004). Land management au-thorities also use different resource and visitor management tools and techniques. These human differences, however, can be adjusted for much more easily than the ecological differences out-lined above.
It is hard to make reliable intercontinental compar-isons, because recreation ecology research effort has been heavily skewed to northern developed nations with strong science research funding pro-grams (Buckley 2005). Land management agencies in southern and developing nations have wrongly assumed that research from the UK and USA ap-plies globally. In Australia, the tourism industry has captured research funding programs and sup-pressed research on impacts.
Australia is one of the world’s 17 megadiverse re-gions (Barlow 1994, Williams et al. 2001). Its flo-ra and fauna have many endemic species, and are generally well adapted to fire, drought and low soil phosphorus, but not to large placental grazing mammals with hard hooves, or to pests and patho-gens from elsewhere. We could thus use compar-isons between semi-arid ecosystems in Australia, southern Africa and north America, or between subtropical forests in Australia and south-east Asia, to examine how similar recreational activi-ties may produce different impacts in structurally similar but functionally different ecosystems.
Most recreation ecology research in Australia has been on high-impact activities within protected ar-eas, carried out a management level and thus rel-evant for international comparisons. This includes activities such as: off road driving (Priskin 2003); horse riding (Whinam et al. 1994, Whinam & Comfort 1996, Newsome et al., 2002, Phillips & Newsome 2002); mountain biking (Goeft & Al-der 2001); heavily-used backcountry hiking trails (Whinam & Chilcott 1999, 2003, Whinam et al., 2003 McDougall & Wright 2004); camping (Tur-

Recreation Ecology and Visitor Impact Research: Past, Present and Future
85
ton et al. 2000; Smith & Newsome 2002; Tal-bot et al. 2003); swimming in freshwater dune lakes (Hadwen et al. 2003, 2005); scuba diving on corals (Rouphael & Inglis 1997, Plathong et al. 2000, Rouphael & Inglis 2002); power-boating in freshwater lakes (Mosisch & Arthington 2004) and coastal seas (Byrnes & Warnken 2004); and whalewatching in New Zealand (Higham & Lus-seau 2004).
There is also recent work on the impacts of infra-structure, such as: roads and powerlines in rain-forest (Goosem 2000, Turton 2003); roads and formed tracks in alpine and subalpine areas (Jones 2000, Johnston & Pickering 2001, McDougall 2001, Johnston & Johnston 2004, Hill & Pick-ering 2006), and tourism infrastructure on coral reefs and islands (Walker 1991). Most protected area management agencies in Australia also carry out monitoring, but this is generally unpublished and not intended as research.
Several recent Australian studies have advanced recreation ecology research at a global level. Two studies have tested the asymptotic stress-response curve proposed as a general model for the impacts of recreational trampling in North American eco-systems (Cole 2004). Rouphael and Inglis (2002) found that impacts of divers on coral reefs are both spatial and temporally heterogeneous, and do not necessarily increase with increasing use. Some in-dividual divers cause so much more damage than others, that their impacts mask any cumulative ef-fects from larger numbers alone.
Growcock (2005), studying trampling and camp-ing in burnt and unburnt alpine and subalpine veg-etation, found that the stress-response curve is commonly sigmoidal, with very little vegetation damage below a lower threshold of use, rapidly increasing damage at intermediate levels, and lit-tle increase in damage at the highest levels. The thresholds represent transitions between differ-ent types of impact. Below the lower threshold there may be physiological effects on plants, but not loss in cover. Between the lower and upper thresholds there is a loss in overall cover caused by death of individual plants, some species before others. Above the upper threshold the living plant cover is largely gone, and the principal impact is loss of leaf litter and soil.
These impacts have been identified and quantified previously (Cole 1995, 2004, Monz et al. 1996, Liddle 1997). The strength of Cole’s work was to identify one parameter, number of passes yielding 50% cover loss, to compare results from different times and places. The key contribution of Grow-cock’s (2005) approach is that it allows the disag-gregation of a rather generalised parameter, loss of plant cover, into a series of successive ecological effects each with its own identifiable mechanism.
There have also been several methodological in-novations. Giese et al. (1999) used artificial eggs with monitoring devices and remote telemetry to examine physiological stress suffered by nesting penguins approached by tourists. Bridle and Kirk-patrick (2003, 2005) examined the breakdown of human waste of various types, in various ecosys-tems, and under various weather conditions using novel forms of synthetic human waste.
Some recreational impacts are hard to detect but still significant ecologically. Warnken and Buckley (2004) distinguished microbiological impacts of hikers swimming in rainforest creeks, from the nu-merically much larger changes due to natural rain-fall fluctuations. Buckley et al. (1998) identified previously unrecorded waterborne pathogens, in-troduced by tourists, in pristine Australian rainfor-est creeks. Various nocturnal marsupial species re-spond differently to spotlights of different colours as well as intensities.
Recreational impacts can occur through complex ecological mechanisms. There is recent Australian research on: effects of trackside weeds on pollina-tion success of native plant species; effects of food supplementation by tourists on community ecol-ogy of bird populations (Oost 2006 in prep.); ef-fects of backcountry hiking trails on predation by quolls and feral dogs; and effects of snow com-paction on small marsupials which travel through subniveal space (Sanecki et al. 2006). One particu-lar issue which has vexed recreation ecologists and protected area managers for some years is the de-gree to which an education and interpretation pro-gram can reduce visitor impacts, actual rather than self reported. Controlled experimental tests are not easy to design, but have been carried out success-fully for guided walks in a rainforest World Heri-tage area (Littlefair 2004).

86
Recreation Ecology and Visitor Impact Research: Past, Present and Future
Transport of weeds is a major recreational impact in Australia (Lonsdale & Lane 1994). Whinam et al. (2005) found ~1000 weed propagules on cloth-ing and equipment from 64 expeditioners to sub-Antarctic islands. Hill and Pickering (2005) exam-ined weeds alongside formed walking tracks in the Australian Alps. Raised steel-mesh walking tracks have far less impact than gravel, paved or informal tracks. In Australia, tourism use of protected areas is a major factor in the spread of the root rot fun-gus Phytophthora cinnamomi, which threatens a wide range of plant species, many of them already at risk of extinction from other causes (Kelly et al. 2003, Schahinger et al. 2003, Buckley et al. 2004, DPIWE 2005, Turton 2005).
Introduced foxes are a threat to many native mar-supials in Australia. In the Australian Alps, fox-es occur at higher densities immediately around ski resorts, leading to increased predation on na-tive marsupials (Green & Osbourne 1994). Snow grooming in winter increases predation even fur-ther, since compaction of subniveal space forc-es native marsupials onto the snow surface where they are more vulnerable to foxes (Sanecki et al. 2006). Even minor additions of nutrients by tour-ists can result in significant impacts in some Aus-tralian ecosystems. In freshwater dune lakes on Fraser Island, a World Heritage site, increased use by tourists causes algal growth, both by direct nu-trient input and through resuspension of sediment (Hadwen et al. 2003, 2005, Hadwen & Bunn 2004). Similar mechanisms were reported for rainforest streams by Warnken and Buckley (2004).
Despite such research, we don’t know whether Australian species and ecosystems behave like in-ternational counterparts. Are trampling impacts in the Australian Alps different from North Ameri-ca because of the species or the experimental de-sign? Do birds on Australian lakes or shorelines take flight at similar distances from approaching tourists as those in North America or Europe? Do vehicle passes along a sandy beach crush the same number of tern eggs or burrowing crabs? Do mar-supials subject to spotlighting behave similarly to placentals?
Key opportunities for international comparisons include the following. We could compare: types and intensities of impacts from the same recre-
ational activities in similar ecosystems on different continents; and the relative ecological significance of different types of impact in different ecosys-tems. We could set out to identify and test subtle and indirect mechanisms of recreational impacts on particular plant and animal species and com-munities, by applying other specialist ecological disciplines such as pollination ecology, fire ecol-ogy, ecotoxicology, population ecology, predation ecology, reproductive ecology and foraging ecolo-gy. We could also examine the indirect impacts of tourism and recreation in altering ecosystem func-tions, e.g. in dune lakes, snow country, rainforests and coral reefs.
References
Barlow, B.A. (1994). Phytogeography of the Australian re-gion. In: R.H. Groves (ed.) Australian Vegetation 2nd Edition, p 3-36. Cambridge.
Bridle, K.L. & Kirkpatrick, J.B. (2003). Impacts of nutri-ent additions and digging for human waste disposal in natural environments, Tasmania, Australia. In: Journal of Environmental Management (69), p 299-306.
Bridle, K.L. & Kirkpatrick, J.B. (2005). An analysis of the breakdown of paper products (toilet paper, tissues and tampons) in natural environments, Tasmania, Austra-lia. In: Journal of Environmental Management (74), p 21-30.
Buckley, R. (ed.) (2004). Environmental Impacts of Eco-tourism. Oxford.
Buckley, R. (2005). Recreation ecology research effort: an international comparison. In: Tourism Recreation Re-search (30), p 99-101.
Buckley, R., Clough, E. & Warnken, W. (1998). Plesiomo-nas shigelloides in Australia. In: Ambio (27), p 253.
Buckley, R., King, N. & Zubrinich, T. (2004). The role of tourism in spreading dieback disease in Australian vegetation. In: R. Buckley (ed.) Environmental Im-pacts of Ecotourism, p 317-324. Oxford.
Byrnes, T. & Warnken, J. (2004). Establishing best-practice environmental management: lessons from the Austra-lian tour boat industry. In: R. Buckley, C. Pickering & D.B. Weaver (ed.). Nature-Based Tourism, Environ-ment and Land Management, p 111-122. Oxford
Chizhova, V.P. (2004). Impacts and management of hikers in Kavkazsky State Biosphere Reserve, Russia. In: R. Buckley (ed.) Environmental Impacts of Ecotourism, p 377-382. Oxford.
Cole, D. (1995). Experimental trampling of vegetation. I. Relation between trampling intensity and vegetation response. In: Journal of Applied Ecology (32), p 213-214.

87
Recreation Ecology and Visitor Impact Research: Past, Present and Future
Cole, D. (2004). Impacts of hiking and camping on soils and vegetation: a review. In: R. Buckley (ed.) Envi-ronmental Impacts of Ecotourism, p 41-60. Oxford.
DEST - Department of the Environment, Sport and Territo-ries. (1994) Australia’s Biodiversity: an Overview of Selected Significant Components. Biodiversity Series Paper No. 2. Canberra.
DPIWE - Department of Primary Industries, Water and Envi-ronment (Tasmania State Government). (2005). Man-aging Phytophthora cinnamomi. http://www.dpiwe.tas.gov.au/inter.nsf/WebPages/EGIL-53Y8FA?open
Giese, M., Handsworth, R. & Stephenson, R. (1999). Mea-suring resting heart rates in penguins using artificial eggs. In: Journal of Field Ornithology (70), p 49-53.
Goeft, U. & Alder, J. (2001). Sustainable mountain biking: a case study from the southwest of Western Australia. In: Journal of Sustainable Tourism (9), p 193-211.
Goosem, M. (2000) Effects of tropical rainforest roads on small mammals: edge effects in community composi-tion. In: Wildlife Research (27), p 151-163.
Green, K. & Osborne, W. (1994). Wildlife of the Australian Snowy Country. Sydney.
Growcock, A.J., Pickering, C.M. & Johnston, S.W. (2004). Walking on ashes: Short-term impacts of experimen-tal trampling on soils after bushfire. In: Victorian Nat-uralist, (12) p 199-206.
Growcock, A.J.W. (2005). Impacts of Camping and Tram-pling on Australian Alpine and Subalpine Vegetation. PhD Thesis, Griffith University.
Hadwen, W.L., Arthington, A.H., & Mosisch, T.D. (2003). The impact of tourism on dune lakes on Fraser Island, Australia. In: Lakes and Reservoirs: Research and Management (8), p 15-26.
Hadwen, W.L. & Bunn, S.E. (2004). Tourist increase the contribution of autochthonous carbon to littoral zone food webs in oligotrophic dune lakes. In: Marine and Freshwater Research (55), p 701-708.
Hadwen, W.L., Bunn, S.E., Arthington, A.H. & Mosisch, T.D. (2005). Within-lake detection of the effects of tourist activities in the littoral zone of oligotrophic dune lakes. In: Aquatic Ecosystem Health and Man-agement (8), p 159-173.
Higham, J. & Lusseau, D. (2004). Ecological impacts of tourist engagement with cetaceans. In: R. Buckley (ed.) Environmental Impacts of Ecotourism, p 171-186. Oxford.
Hill, W. & Pickering, C.M. (2006). Vegetation associated with different walking track types in the Kosciuszko alpine area, Australia. In: Journal of Environmental Management (78), p 24-34.
Johnston, F.M. & Johnston, S. (2004). Impacts of road dis-turbance on soil properties and on exotic plant occur-rence in subalpine areas of the Australian Alps. In: Arctic, Antarctic and Alpine Research (36), p 201-207.
Johnston, F.M. & Pickering, C.M. (2001). Alien plants in the Australian Alps. In: Mountain Research and De-velopment (21), p 284-291.
Jones, M.E. (2000). Road upgrades, road mortality and re-medial measures: impacts on a population of Eastern quolls and Tasmanian devils. In: Wildlife Research (27), p 289-296.
Kelly, C., Pickering, C.M. & Buckley, R.C. (2003) Impacts of tourism on threatened plants taxa and communities in Australia. In: Ecological Restoration and Manage-ment (4), p 37-44.
Liddle, M. 1997. Recreation Ecology. London.
Littlefair, C.J. (2004). Reducing impacts through interpre-tation, Lamington National Park. In: R. Buckley (ed.) Environmental Impacts of Ecotourism, p 297-307. Oxford.
Lonsdale, W.M. & Lane, A.M. (1994). Tourist vehicles as vectors of weed seeds in Kakadu National Park, north-ern Australia. In: Biological Conservation (69), p 277-83.
Magro, T.C. & Amanda de Barros, M.I. (2004). Under-standing use and users at Itataia National Park, Brazil. In: R. Buckley (ed.) Environmental Impacts of Eco-tourism, p 361-376. Oxford.
McDougall, K.L. (2001) Colonization by alpine native plants of a stabilized road verge on the Bogong High Plains, Victoria. In: Ecological Management and Res-toration, (2), p 47-52.
McDougall, K.L. & Wright, G.T. (2004) The impacts of trampling on feldmark vegetation in Kosciuszko Na-tional Park, Australia. In: Australian Journal of Bota-ny (52), p 315-320.
Monz, C.A., Meier, G.A., Welker, J.M., Buckley, R.C., Cole, D.N. & Loya, W.M. (1996). Responses of moist and dry arctic tundra to trampling and warmer temper-atures. In: Bulletin of the Ecological Society of Amer-ica (77/3), p 311.
Mosisch, T. & Arthington, A. (2004). Impacts of recreation-al powerboating on freshwater ecosystems. In: R. Buckley (ed.) Environmental Impacts of Ecotourism, p 125-154. Oxford.
Newsome, D., Milewski, A., Phillips, N. & Annear, R. (2002). Effects of horse riding on national parks and other natural areas in Australia: Implications for man-agement. In: Journal of Ecotourism (1), p 52-74.
Oost, M. (2006)(in prep). Indirect Effects of Park Visitors on Bird Population Dynamics. PhD Thesis, Griffith University.
Phillips, N. & Newsome, D. (2002). Understanding the impacts of recreation in Australian protected ar-eas: Quantifying damage caused by horse riding in D‘Entrecasteaux National Park, Western Australia. In: Pacific Conservation Biology (7), p 256 - 273.

88
Recreation Ecology and Visitor Impact Research: Past, Present and Future
Plathong, S, Inglis, G.J. & Huber, M.E. (2000). Effects of self-guided snorkelling trails on corals in a tropical marine park. In: Conservation Biology (14), p 1821-1830.
Priskin, J. (2003). Physical impacts of four-wheel drive re-lated tourism and recreation in a semi-arid, natural coastal environment. In: Ocean and Coastal Manage-ment (46), p 127-155.
Rouphael, A.B, & Inglis, G.J. (1997). Impacts of recreation-al scuba diving at sites with different reef topogra-phies. In: Biological Conservation (82), p 329-336.
Rouphael, A.B, & Inglis, G.J. (2002). Increased spatial and temporal variability in coral damage caused by recre-ational scuba diving. In: Ecological Applications (12), p 427-440.
Sanecki, G.M., Green, K. Wood, H. & Lindenmayer, D. (2006). The implications of snow-based recreation for small mammals in the subnivian space in south-east Australia. In: Biological Conservation. In Press.
Schahinger, R., Rudman, T. & Wardlaw, T. (2003). Conser-vation of Tasmania Plant Species and Communities Threatened by Phytophthora cinnamomi: Strategic Regional Plan for Tasmania. Technical Report 03/03, Nature Conservation Branch, Department of Primary Industries, Water and Environment, Hobart.
Smith, A. & Newsome, D. (2002). An integrated approach to assessing, managing and monitoring campsite im-pacts in Warren National Park, Western Australia. In: Journal of Sustainable Tourism (10), p 343-359.
Sun, D. & Walsh, D. (1998). Review of studies on environ-mental impacts of recreation and tourism in Austra-lia. In: Journal of Environmental Management (53), p 323-338.
Talbot, L.M., Turton, S.M. & Graham, A.W. (2003). Tram-pling resistance of tropical rainforest soils and vegeta-tion in the wet tropics of north east Australia. In: Jour-nal of Environmental Management (69), p 63-69.
Turton, S.M. (2005). Managing environmental impacts of recreation and tourism in rainforests at the Wet Trop-ics of Queensland World Heritage Area. In: Geograph-ical Research (43), p 140-151.
Turton, S.M., Kluck, T. & Day, T.J. (2000). Ecological im-pacts of visitors at day-use and camping areas. In: J.M. Bentrupperbaumer and J.P. Reser (eds) Impacts of Visitation and Use: Psychosocial and Biophysi-cal Windows on Visitation and Use in the Wet Trop-ics World Heritage Area, p 123-134. Cooperative Re-search Centre for Tropical Rainforest Ecology and Management, Cairns.
Walker T.A. (1991). Tourism development and environmen-tal limitations at Heron Island, Great Barrier Reef. In: Journal of Environmental Management (33), p 117-122.
Warnken, W. & Buckley, R. (2004). In-stream bacteria as a low-threshold management indicator of tourist im-pacts in conservation reserves. In: R. Buckley (ed.) Environmental Impacts of Ecotourism, p. 325-338. Oxford.
Whinam, J. & Chilcott, N. (1999). Impacts of trampling on alpine environments in central Tasmania. In: Journal of Environmental Management (57), p 205-220.
Whinam, J. & Chilcott, N. (2003). Impacts after four years of experimental trampling on alpine/sub-alpine envi-ronments in western Tasmania. In: Journal of Environ-mental Management (67), p 339-351.
Whinam, J. & Comfort, M. (1996). The impacts of commer-cial horse riding on subalpine environments of Cra-dle Mountain, Tasmania, Australia. In: Journal of En-vironmental Management (47), p 61-70.
Whinam, J., Cannel, E. J., Kirkpatrick, J.B. & Comfort, M. (1994). Studies on the potential impact of recreational horse riding on some alpine environments of the cen-tral plateau, Tasmania. In: Journal of Environmental Management (40), p 103 - 117.
Whinam, J., Chilcott, N. & Bergstrom, D.M. (2005). Sub-antarctic hitchhikers: expeditioners as vectors for the introduction of alien organisms. In: Biological Con-servation (121), p 207-219.
Whinam, J., Chilcott, N., Ling, R. & Wyatt, P. (2003). A method for calculating environmental sensitivity to walker trampling in the Tasmanian Wilderness World Heritage Area. In: R. Buckley, C. Pickering & D.B. Weaver (ed.) Nature-Based Tourism, Environment and Land Management, p 151-165. Oxford.
Williams, J., Read, C., Norton, A., Dovers, S., Burgam, M., Procter, W. & Anderson, H. (2001). Australia State of the Environment Report 2001 (Biodiversity Theme Report). Canberra.

Siegrist, D., Clivaz, C., Hunziker, M. & Iten, S. (eds.) (2006). Exploring the Nature of Management. Proceedings of the Third International Conference on Monitoring and Management of Visitor Flows in Recreational and Protected Areas.
University of Applied Sciences Rapperswil, Switzerland, 13-17 September 2006. Rapperswil.
89
Recreation Ecology: Learning from the Past
David N. Cole
Aldo Leopold Wilderness Research Institute, [email protected]
Keywords: Recreation ecology, visitor impacts.
Although it is a relatively young discipline, with few full-time practitioners, recreation ecolo-gy has already developed an impressive array of research traditions. In this paper, I identify the primary traditions of recreation ecology re-search and trace their origins. I use this perspec-tive to suggest future directions for the disci-pline.
Work on recreation impacts on vegetation had begun by the 1920s (Meinecke) and work on animal response to approaching humans by the 1930s (Hediger). But it was not until the 1960s and early 1970s that substantial and cumulative recreation ecology research programs were be-gun. Prior to this, individuals conducted a study or two and then moved on to a different topic.
Many of the primary research traditions were instigated by the earliest substantive recreation ecology research programs. The earliest pro-grams were developed on both sides of the At-lantic – with government-sponsored programs in the United States and Great Britain. Con-cern about recreation impacts led the U.S. For-est Service to support work by Al Wagar, Sid Frissell and Larry Merriam. Although none of these scientists made careers of recreation ecol-ogy, they made substantial contributions to the field. Wagar (1964) provided initial conceptual development of the carrying capacity concept, conducted the first simulated trampling experi-ments and also initiated work on restoration of damaged campsites. Frissell conducted the first study of campsites that receive different levels of use (Frissell & Duncan 1965). This study il-lustrated that impact is inevitable wherever use occurs, suggesting that the manager’s task is to define the maximum acceptable level of im-
pact—not to decide whether or not to allow im-pact. It illustrated the curvilinear relationship between use and impact and was the basis for techniques for monitoring campsites. Merriam, also working on campsites in the same area as Frissell, provided the first long-term studies of trends in impact (Merriam & Smith 1974).
In Great Britain, the government sponsored work by Neil Bayfield, over a 20-year period, on trampling and footpath impacts in the moun-tains of Great Britain. Bayfield developed more realistic experimental techniques, allowing him to describe variation in impact across different vegetation types. He effectively used experi-mentation in concert with general survey tech-niques on impacted sites (Bayfield 1979). His long-term studies allowed him to differentiate between the processes of initial damage and re-covery. He also developed some of the earli-est techniques for monitoring impacts on trails and experimented with restoration techniques. Finally, Mike Liddle brought some of the rig-ors of an academic tradition to the field in the early 1970s with his work on impacts on sand dunes in Wales. In particular, Liddle was among the first to propose generalities about recreation impact and to provide syntheses of knowledge (Liddle 1975).
Current recreation ecology research, largely an extension of this early work, is being conducted on all continents. There have been expansions in the types of ecosystem responses that have been studied, as well as recreational activities. Eco-tourism effects are a recent emphasis area. Sub-stantial progress has been made in translating research results into management implications. Studies of recreational impacts on animals are

Recreation Ecology and Visitor Impact Research: Past, Present and Future
90
now about as numerous as those on vegetation and soil, although less progress has been made in de-veloping generalities from this research.
One major challenge for the future is to develop a stronger theoretical basis for recreation ecology, to develop more useful general principles and to in-crease our predictive abilities. A second challenge is to link our understanding of impacts at small spa-tial scales (the scale at which most research is con-ducted) to larger spatial scales (the scales at which most management planning occurs).
References
Bayfield, N.G. (1979). Recovery of four montane heath communities on Cairngorm, Scotland, from distur-bance by trampling. In: Biological Conservation (15), p 165-179.
Frissell, S.S. & Duncan, D.P. (1965). Campsite preference and deterioration in the Quetico-Superior canoe coun-try. In: Journal of Forestry (65), p 256-260.
Liddle, M.J. (1975). A selective review of the ecological ef-fects of human trampling on natural ecosystems. In: Biological Conservation (7), p 17-36.
Merriam, L.C. & Smith, C.K. (1974). Visitor impact on newly developed campsites in the Boundary Waters Canoe Area. Journal of Forestry (72), p 627-630.
Wagar, J.A. (1964). The carrying capacity of wild lands for recreation. Washington, DC.

Siegrist, D., Clivaz, C., Hunziker, M. & Iten, S. (eds.) (2006). Exploring the Nature of Management. Proceedings of the Third International Conference on Monitoring and Management of Visitor Flows in Recreational and Protected Areas.
University of Applied Sciences Rapperswil, Switzerland, 13-17 September 2006. Rapperswil.
91
Recreation Ecology in East Asia: Redefining Impacts?
Yu-Fai Leung
North Carolina State University, US.A
Keywords: Recreation ecology, visitor impacts, impact monitoring, impact management, trampling, trails, recreation sites, protected areas, East Asia.
East Asia is one of the most populated regions of the world, but it also possesses very rich and di-verse natural and cultural heritage that is protect-ed by a network of over 760 protected areas (Shep-pard 2001). Such resources are, however, subject to tremendous and increasing visitor use pressure. For example, international tourist arrivals in East Asia are estimated to have annual growth rates of 7.2-7.6% between 2000 and 2020, which are the high-est among all world regions (WTO 1999). Domestic recreation and tourism have also experienced rapid growth as socio-economic conditions of the region continue to improve. Protected areas are prime des-tinations of international and domestic visitors. Use pressure is further exacerbated by recent interests of embracing ecotourism as a sustainable develop-ment strategy in most countries/territories. Grow-ing concerns about visitor resource impacts have prompted recreation ecology research that seeks to understand and manage impacts effectively. This paper assesses the current state of recreation ecolo-gy research in East Asia and discusses related chal-lenges and opportunities.
Recreation ecology research in East Asia started late compared to that in Europe and North Ameri-ca. Previous studies were conducted most countries and territories of the region, including Japan, South Korea, Taiwan, and to a less extent, Hong Kong, China and North Korea (Leung & Lee 2003). Many previous studies were published in oriental lan-guages that have prevented them from widely com-municating to international colleagues.
A thorough literature review suggests that there are three main developmental stages of recreation ecol-ogy research in East Asia that largely mirrors the evolution of recreation ecology in general. At the
earliest formative stage before 1970 research was conducted by Japanese botanists who investigat-ed trampling effects on alpine plant communities along trails. Visitor impacts received no research attention elsewhere in the region during that time period.
The situation changed substantially between the 1970s and 1990s when recreation ecology expand-ed to most parts of the region as a likely response to soaring participation of outdoor recreation and resultant impacts in natural and protected areas (Leung & Lee 2003). During this expansion stage concepts and methods of recreation ecology devel-oped in Europe and North America were adapted by East Asian colleagues, though unique measure-ments were also developed. Results of long-term impact monitoring studies on trails were also re-ported (Yoda & Watanabe 2000). These studies en-joyed greater international exposure as more of them were published in English language. The pri-mary focus of research during this stage, howev-er, was still placed on mountainous protected areas and trail-related impact problems.
Since 2000 recreation ecology research in East Asia has continued to grow with more sophisticat-ed methodologies applied in recent studies. At this strengthening stage theoretical discussion on rec-reation ecology began to appear. More recent stud-ies tend to frame research questions in the context of sustainable tourism/ecotourism management (Deng et al. 2004).
Through several decades of recreation ecology a modest body of literature has accumulated for East Asia. However, the diversity and maturity of re-search is still low and research efforts are highly uneven within the region. Recreation ecology re-
Recreation Ecology and Visitor Impact Research: Past, Present and Future
92
search in the region remains to be scholarly pur-suits with very weak ties to management practices. The biggest challenge of all, is how impact and ac-ceptable impact should be defined in the East Asian context. With the sheer amount of visitors to protect-ed areas there are few options besides high concen-tration of use and site hardening. Some common-ly used impact indicators, such as soil compaction, may not be as relevant in East Asian protected ar-eas. Other challenges include lack of baseline data, high levels of non-recreation human influence on protected areas that may mask recreation impacts, lack of devoted researchers in the field, communi-cation barriers due to language and cultural differ-ences, development-dominated planning strategy in some protected areas, and difficulties in gauging the amount and character of use in high-density use environments.
Despite the challenges there are numerous oppor-tunities for recreation ecology in East Asia. There are many under-examined research topics and geo-graphic areas, especially non-mountain protected areas. Some established knowledge in recreation ecology, such as use-impact and productivity-resil-ience relationships, can be evaluated in unexplored habitats and landscapes of the region that may yield new understandings. Landscape-level ecological effects of recreation impacts, such as fragmentation and wildlife disturbance, can be examined. Due to high levels of use in most protected areas, research on effective methods of restoration and environ-mentally and socially sound methods of site hard-ening is likely to make a unique contribution to the region. The feasibility and utility of establishing a region-specific set of visitor use/impact indicators and associated monitoring protocols for East Asia can also be examined (Leung & Lee 2003). Finally, ways to enhance communication between research-ers and protected area managers and facilitate ap-plication of research results should be investigat-ed.
References
Deng, J., Qiang, S., Walker, G. J., & Zhang, Y. (2003). As-sessment on and perception of visitors‘ environmental impacts of nature tourism: A case study of Zhangjia-jie National Forest Park, China. In: Journal of Sustain-able Tourism (11/6), p 529-548.
Leung, Y.-F., & Lee, J.-H. (2003). Recreation ecology and visitor carrying capacity management: Implications for protected areas in East Asia. In: Korean Journal of Ecology (26/2), p 53-58.
Sheppard, D. (2001). Twenty-first century strategies for protected areas in East Asia. In: George Wright Forum (18/2), p 40-55.
WTO (World Tourism Organization) (1999). Guide for Lo-cal Authorities on Developing Sustainable Tourism: Supplementary Volume on Asia and the Pacific. Ma-drid.
Yoda, A., & Watanabe, T. (2000). Erosion of mountain hiking trail over a seven-year period in Daisetsuzan Nation-al Park, Central Hokkaido, Japan. In Cole, D. N., Mc-Cool, S. F., Borrie, W. T., & O‘Loughlin, J. (comps.), Wilderness Science in a Time of Change Conference - Volume 5: Wilderness Ecosystems, Threats, and Man-agement, p 172-180. Ogden.

Siegrist, D., Clivaz, C., Hunziker, M. & Iten, S. (eds.) (2006). Exploring the Nature of Management. Proceedings of the Third International Conference on Monitoring and Management of Visitor Flows in Recreational and Protected Areas.
University of Applied Sciences Rapperswil, Switzerland, 13-17 September 2006. Rapperswil.
93
Recreation Ecology Research in the Americas
Jeffrey L. Marion
U.S. Geological Survey, USA
Keywords: Recreation ecology, visitor impacts.
From its origin in the United States and United Kingdom, recreation ecology as a field of study is over 70 years old and has grown to include a large international audience of scientists and pro-tected area managers. Though there are few full-time recreation ecologists, the number of stud-ies investigating recreation and visitor impacts has grown substantially in the past decade and a recent annotated bibliography included 1108 references (Leung, 2005). This paper provides a brief characterization and review of recent rec-reation ecology research in the Americas. Due to the large number and diverse array of relevant studies this review is largely limited to character-izing the recent research topics and publications of those scientists most active in recreation ecol-ogy research. Recent reviews providing a more comprehensive discussion of this literature in-clude Cole (2004a), Hammitt and Cole (1998), and Leung and Marion (2000).
CanadaThe most active recreation ecology research in Canada has been at the University of Guelph, Ontario, where Dr. Doug Larson directs a Cliff Ecology Research Group. This program has been very active in investigating the ecological impacts of rock climbers (Kelly & Larson 1997, McMillan, Nekola & Larson 2003, McMillan & Larson 2002). Other recent recreation ecolo-gy studies include investigations on visitor im-pacts to the intertidal zone (Alessa, Bennet, & Kliskey 2003), using GIS to determine suitabil-ity for hiking trails (Bridgland, Lemky & Allen 2001), mountain biking impacts to vegetation and soil (Thurston & Reader 2001), campsite im-pact monitoring (Peregoodoff 1998), chemical
impacts to soils from campfires and dishwashing (Arocena, Nepal & Rutherford 2006), and a study of human disturbance on duck nests (Olson & Ro-hwer 1998).
United StatesLand management agencies of the federal govern-ment are the primary source of funding for rec-reation ecology research in the U.S. Specifical-ly, the National Park Service and Forest Service are the primary sponsors, with relatively few dol-lars available from other federal agencies, conser-vation foundations, state parks and forests, and private sources. Only the U.S. Forest Service has provided permanent “hard money” funding sup-porting recreation ecology research; most funding is for specific studies requested by land managers. Consequently, recreation ecology research contin-ues to be very applied, generally focused on pro-viding information for carrying capacity decision making or resolving recreation impact problems.
Numerous government and university scientists conduct occasional recreation ecology studies. However, only four U.S. scientists consider the primary focus of their program of research to be recreation ecology; two of these are employees of the federal government. The following discussion describes their recent and current research studies to illustrate the focus of the most active research programs. Many other studies have been conduct-ed and published but are too numerous to include here.
David Cole is a U.S. Forest Service scientist with the Aldo Leopold Wilderness Research Institute in Montana. While the bulk of his research has focused on camping impacts and experimental trampling, he has recently broadened his work to

Recreation Ecology and Visitor Impact Research: Past, Present and Future
94
include studies of wilderness visitors and non-recreational threats to wilderness ecosystems. Recent recreation ecology studies include stud-ies of camping impacts (Cole & Monz 2004a,b) and basic research on factors that limit natural recovery of campsites (Zabinski & Cole 2000) and evaluating the effectiveness of alternative restoration techniques (Zabinski, Wojtowicz & Cole 2000, Zabinski et al. 2002). He has also authored many recent syntheses of recreation ecology knowledge, including Hampton and Cole (2003), Cole (2004 a,b), Newsome, Cole and Marion (2004), and Gutzwiller and Cole (2005).
The author is a U.S. Geological Survey scien-tist stationed at Virginia Tech, a university in Virginia. He conducts studies in wilderness, na-tional park backcountry and frontcountry set-tings, and in international protected natural ar-eas. His early research and some continuing studies investigate camping impacts (Marion & Farrell 2002, Reid & Marion 2004, Reid & Mar-ion 2005). Recent research has focused on trail degradation and management (Marion & Leung 2004), particularly soil erosion (Aust, Marion & Kyle 2005, Marion & Olive 2006), and meth-odological innovations for assessing trail condi-tions (Marion & Leung 2001, Marion, Leung & Nepal In Press). Other recent studies have in-vestigated the efficacy of low impact education (Daniels & Marion In Press a, Marion & Reid In Press) and how visitors gauge the appropri-ateness of site management actions to limit visi-tor impacts (Cahill, Marion & Lawson In Press, Daniels & Marion In Press, b). Two current studies are examining rock climbing impacts, including collaboration with Chris Carr, a rec-reation ecology doctoral candidate at the Uni-versity of Cincinnati.
Yu-Fai Leung is an Associate Professor at North Carolina State University in their Parks, Recre-ation, and Tourism Management program. His recent studies have focused on trail degradation (see studies cited in preceding paragraph), the selection and monitoring of recreation impact indicators (Leung, Marion & Cole 2002, Leung & Meyer 2004) and the efficacy of low im-pact education (Leung & Attarian 2002, Leung
& Attarian 2003, Wirsching, Leung & Attarian 2003). Other recent and related research has ex-amined the application of geospatial technologies to visitor impact assessments (Leung, Shaw, John-son & Duhaime 2002).
Chris Monz is an Assistant Professor at St. Law-rence University, New York, in their Environmen-tal Studies program. His current research interests include the assessment and management of human impacts to parks with a particular focus on back-country visitor use in high latitude or elevation en-vironments (Cole & Monz 2002, Forbes, Monz & Tolvannen 2004, Monz & Twardock 2004, Monz 2002) and shoreline use on the Atlantic coast (Monz, Young & Leung 2004, Monz, Leung, Ingle & Bauman 2004).
Richard Knight, a wildlife scientist at Colorado State University, is also active in recreation ecolo-gy research, including several recent studies inves-tigating visitor impacts to wildlife (Miller, Knight, & Miller 2001, Taylor & Knight 2003, Camp & Knight 1998).
Central and South America – Numerous recreation ecology studies have been conducted in Central and South American countries over the last decade though most are not reported in the more wide-ly available peer-reviewed literature. The author has been involved in several studies of trail im-pacts in Belize, Costa Rica, Chile and Peru (Far-rell & Marion 2000, 2001, 2002b, Marion & Lin-ville 2000), recreation site impacts in Belize, Costa Rica and Mexico (Farrell & Marion 2000, 2001, Olive 2005), and development of a simplified car-rying capacity decision-making process for pro-tected natural areas (Farrell & Marion 2002a). Other similar studies include a study of soil ero-sion on trails in Ecuador and Costa Rica (Wallin & Harden 1996), trail and recreation site impact assessments at popular tourism sites in Dominica (Christian 1996), campsite monitoring in the Baja region of Mexico (Monz 1998), and recreation im-pact assessments related to implementation of car-rying capacity planning at a park in Patagonia, Ar-gentina (Encabo, Torre & Bergallo 2001).
Other studies have examined the impacts of vis-itation on wildlife, which are a principal feature of interest for nature-based tourists. These include

Recreation Ecology and Visitor Impact Research: Past, Present and Future
95
scuba diving impacts to Caribbean coral and fish communities (Hawkins et al. 1999), the effects of motorized tourboats on flamingos in Yucatan, Mexico (Galicia & Baldassarre 1997), impacts to wild pygmy marmosets in Ecuador (De la Torre, Snowdon & Bejarano 2000), and an assessment of wildlife densities in visited and unvisited areas of a popular Mayan ruin park in Guatemala (Hiding-er 1996).
References
Alessa, L., Bennett, S.M. & Kliskey, A.D. (2003). Effects of knowledge, personal attribution and perception of ecosystem health on depreciative behaviors in the in-tertidal zone of Pacific Rim National Park and Re-serve. In: Journal of Environmental Management (68/2), p 207-218.
Arocena, J.M., Nepal, S.K. & Rutherford, M. (2006). Visi-tor-induced changes in the chemical composition of soils in backcountry areas of Mt Robson Provincial Park, British Columbia, Canada. In: Journal of Envi-ronmental Management (79), p 10-19.
Aust, M.W., Marion, J.L. & Kyle, K. (2005). Research for the Development of Best Management Practices for Minimizing Horse Trail Impacts on the Hoosier Na-tional Forest. In: Management Report. USDA, Forest Service, Final Report. Bedford.
Bridgland, J., Lemky, K. & Allen D. (2001). Use of field-verified GIS classification to determine landscape suitability for hiking trail development. In: Manag-ing protected areas in a changing world: Proceedings of the 4th International Conference on Science and Management of Protected Areas, May 14-19, 2000, p 1470-1479. Wolfville.
Cahill, K., Marion, J.L. & Lawson, S. (In Press). Enhanc-ing the interpretation of stated choice tradeoff analy-sis through the application of a verbal protocol assess-ment. In: Journal of Leisure Research.
Camp, R.J., & Knight, R.L. (1998). Rock climbing and cliff bird communities at Joshua Tree National Park, Cali-fornia. In: Wildlife Society Bulletin (26/4), p 892-98.
Christian, C.S. (1996). Outdoor Recreation and Nature Tourism Related Environmental Impacts in a Tropi-cal Island Setting: Commonwealth of Dominica. PhD Dissertation, Clemson University.
Cole, D.N. (2004a). Environmental Impacts of Outdoor Recreation in Wildlands. In: Manfredo, M., Vaske, J., Field, D, Brown, P. & Bruyere, B. (ed.) Society and Resource Management: A Summary of Knowledge, p 107-116. Jefferson City.
Cole, D.N. (2004b). Impacts of hiking and camping on soils and vegetation: a review. In: Buckley, Ralf (ed.) En-vironmental Impacts of Ecotourism, p 41-60. Walling-ford.
Cole, D.N. & Monz, C.A. (2002). Trampling disturbance of subalpine vegetation, Wind River Mountains, Wy-oming. In: Arctic, Antarctic and Alpine Research (34/4), p 365-376.
Cole, D.N. & Monz, C.A. (2004a). Impacts of camping on vegetation: Response of acute and chronic disturbance on vegetation. In: Environmental Management (32/6), p 693-705.
Cole, D.N. & Monz, C.A. (2004b). Spatial patterns of recre-ation impact on experimental campsites. In: Journal of Environmental Management (70), p 73-84.
Daniels, M.L. & Marion, J.L. (In Press, a). Communicat-ing Leave No Trace Ethics and Practices: Efficacy of two-day Trainer Courses. In: J. of Park and Recre-ation Administration
Daniels, M.L. & Marion, J.L. (In Press, b). Visitor eval-uations of management actions at a highly impacted Appalachian Trail camping area. In: Environmental Management.
De la Torre, S., Snowdon, C.T. & Bejarano, M. (2000). Ef-fects of human activities on wild pygmy marmosets in Ecuadorian Amazonia. In: Biological Conservation (94/2), p 153-163.
Encabo, M. Torre, G., & Bergallo, A. (2001). Management of conservation in spaces of recreational use. In: In-ternational Journal of Hospitality and Tourism Admin-istration (1/3-4), p 43-51.
Farrell, T.A. & Marion, J.L. (2000). Identification and management of visitor impact problems within pro-tected areas in Costa Rica and Belize. In: Harmon, D. (ed.) On the Frontiers of Conservation: Proceedings of the 10th Conference on Research and Resource Man-agement in Parks and on Public Lands, The George Wright Society Biennial Conference March 22-26, 1999, Asheville, NC, p 62-67. Hancock.
Farrell, T.A. & Marion, J.L. (2001). Identifying and as-sessing ecotourism visitor impacts at selected protect-ed areas in Costa Rica and Belize. In: Environmental Conservation (28/3), p 215-225.
Farrell, T.A. & Marion, J.L. (2002a). The Protected Areas Visitor Impact Management (PAVIM) framework: A simplified process for making management decisions. In: Journal of Sustainable Tourism (10/1), p 31-51.
Farrell, T.A. & Marion, J.L. (2002b). Trail impacts and trail impact management related to ecotourism visitation at Torres del Paine National Park, Chile. In: Leisure/Lo-isir: Journal of the Canadian Association for Leisure Studies (26/1-2), p 31-59.

Recreation Ecology and Visitor Impact Research: Past, Present and Future
96
Forbes, B.C., Monz C.A., & Tolvannen, A. 2004. Impacts of Ecotourism in Polar Environments. In: Buckley, R. (editor) The Environmental Impacts of Ecotourism, p 155-170. London.
Galicia, E. & Baldassarre, G.A. (1997). Effects of motor-ized tourboats on the behavior of nonbreeding Ameri-can flamingos in Yucatan, Mexico. In: Conservation Biology (11/5), p 1159-1165.
Gutzwiller, K.J. & Cole, D.N. (2005). Assessment and Man-agement of Wildland Recreational Disturbance. In: Braun, C.E. (ed.) Wildlife Management Techniques Manual, p 779-796. Bethesda.
Hammitt, W.E. & Cole, D.N. (1998). Wildland Recration: Ecology and Management. New York.
Hampton, B., & Cole, D.N. (2003). Soft Paths: How to En-joy the Wilderness without Harming It. Harrisburg.
Hawkins, J.P., Callum, M.R., Hof, T.V., Meyer, K., Tratalos, J. & Aldam, C. (1999). Effects of recreational scuba diving on Caribbean coral and fish communities. In: Conservation Biology (13/4), p 888-897.
Hidinger, L.A. (1996). Measuring the Impacts of Ecotour-ism on Animal Populations: A Case Study of Tikal Na-tional Park, Guatemala. In: Malek-Zadeh, E. (ed.) The Ecotourism Equation: Measuring the Impacts, Bulle-tin Series (99), p 49-59. New Haven.
Kelly P.E. & Larson D.W. (1997). Effects of rock climb-ing on populations of presettlement eastern white ce-dar (Thuja occidentalis) on cliffs of the Niagara Es-carpment, Canada. In: Conservation Biology (11), p 1125–1132.
Leung, Y.-F. (2005). Recreation Ecology and Visitor Impact Research – An Annotated Bibliography. Final Report, USDA Forest Service, Rocky Mountain Research Sta-tion.
Leung, Y.-F. & Attarian, A. (2002). Evaluating the Effec-tiveness of the Leave No Trace Program in the City of Durango, Colorado. Final report submitted to the Leave No Trace, Inc., Boulder, CO.
Leung, Y.-F. & Attarian, A. (2003). Frontcountry visitor in-formation/education programs: Are there lessons for wilderness? In: International Journal of Wilderness, (9/1), p 32-33.
Leung, Y.-F., Marion, J.L., & Cole, D.N. (2002). Visitor impact assessment and monitoring systems: Evolu-tion and current development. In: Bondrup-Nielsen, S. and N. Munro (ed.), Managing Protected Areas in a Changing World: Proceedings of the 4th International Conference on Science and Management of Protected Areas; May 14-19, 2000; Waterloo, Ontario, Canada, p 213-220. Wolfville.
Leung, Y.-F. & Meyer, K. (2004). Research to Support De-velopment of Resource Indicators and Standards for Implementing the Visitor Experience and Resource
Protection (VERP) Framework at Boston Harbor Is-lands, A National Park area. Final report submitted to USDI National Park Service, Boston Harbor Islands National Park Area.
Leung, Y.-F., Shaw, N., Johnson, K., & Duhaime, R. (2002). More than a database: Integrating GIS data with the Boston Harbor Islands visitor carrying capacity study. In: The George Wright Forum (19/1), p 69-78.
Marion, J.L. & Farrell, T. (2002). Management practices that concentrate visitor activities: Camping impact management at Isle Royale National Park, USA. Jour-nal of Environmental Management (66/2), p 201-212.
Marion, J.L. & Leung, Y.-F. (2001). Trail resource impacts and an examination of alternative assessment tech-niques. Journal of Park and Recreation Administration (19/3), p 17-37.
Marion, J.L. & Leung, Y.-F. (2004). Environmentally Sus-tainable Trail Management. In: Buckley, R. (ed.), Environmental Impact of Tourism, p 229-244. Cam-bridge.
Marion, J.L., Leung, Y.-F. & Nepal, S. (In Press). Moni-toring trail conditions: new methodological consider-ations. In: George Wright Forum.
Marion, J.L. & Linville, R. (2000). Trail Impacts and their Management in Huascaran National Park, Andes Mountains, Peru. Report Issued by The Mountain In-stitute and the Virginia Tech College of Natural Re-sources Cooperative Park Studies Unit, Blacksburg, VA.
Marion, J.L. & Olive, N. (2006). Assessing and Under-standing Trail Degradation: Results from Big South Fork National River and Recreational Area. In: USDI, National Park Service, Research/Resources Mgmt. Rpt., Big South Fork National River and Recreation Area. Onieda.
Marion, J.L. & Reid, S.E. (In Press). Minimizing visitor im-pacts to protected areas: The efficacy of low impact education programs. In: Journal of Sustainable Tour-ism.
McMillan, M.A., & Larson, D.W. (2002). The effects of rock climbing on the vegetation of the Niagara Es-carpment in Southern Ontario, Canada. In: Conserva-tion Biology (16), p 389-398.
McMillan, M.A., Nekola, J.C., & Larson, D.W. (2003). Ef-fects of rock climbing on the land snail community of the Niagara Escarpment in southern Ontario, Canada. In: Conservation Biology (17), p 616-621.
Miller, S.G., Knight, R.L. & Miller, C.K. (2001). Wildlife responses to pedestrians and dogs. In: Wildlife Soci-ety Bulletin (29), p 124-132.
Monz, C.A. (1998). Monitoring recreation resource impacts in two coastal areas of western North America: An ini-tial assessment. In: Watson, A.E., Alphet, G., & Hen-

Recreation Ecology and Visitor Impact Research: Past, Present and Future
97
dee, J.C. (comps.). Personal, Societal and Ecological Values of Wilderness: Sixth World Wilderness Con-gress Proceedings on Research, Management and Al-location (1), p 117-122. Ogden.
Monz, C.A. (2002). The response of arctic tundra plant com-munities to human trampling disturbance. In: Journal of Environmental Management (64), p 207-217.
Monz, C.A. Leung, Y.-F., Ingle, C. & Bauman, H. (2004). Visitor Impact Monitoring in the Coastal and Barrier Island Network. In: Harmon, D., Kilgore, B. & Viet-zke, G. (ed.) Protecting our diverse heritage: The role of parks, protected areas and cultural sites. Proceed-ings of the George Wright Society/ National Park Ser-vice Joint Conference April 14-18, 2003, p 135-139.
Monz, C.A. & Twardock, P. (2004). The Resource Impacts of Sea Kayak Use in Prince William Sound, Alaska. In: Buckley, R. (ed.) The Environmental Impacts of Ecotourism, p 309-316. London.
Monz, C.A., Young, E.A. & Leung, Y. (2004). Monitoring the impacts of visitors to shorebird populations in the Coastal and Barrier Island Network areas. In: Bricker, K. (ed.). Proceedings of the 2004 Northeastern Rec-reation Research Symposium, p 373-377. Newton Square.
Newsome, D., Cole, D. & Marion, J. (2004). Environmen-tal Impacts Associated with Recreational Horse Rid-ing. In: Buckley, R. (ed.) Environmental impacts of ecotourism, p 61-82. Wallingford.
Olive, N. (2005). An Assessment of Coastal Recreation Site Conditions in the Gulf of California and Baja Peninsu-la, Mexico: A Gulf Area Monitoring Program. In: Na-tional Outdoor Leadership School Report. Lander.
Olson, R. & Rohwer, F.C. (1998). Effects of human distur-bance on the success of artificial duck nests. In: Jour-nal of Wildlife Management (62/3), p 1142-1146.
Peregoodoff, G. (1998). Recreation impact monitoring of coastal campsites in Gwaii Haanas National Park Re-serve/Haida Heritage Site. In: Munro, N.W. & Wil-lison, J.H. (ed.) Linking Protected Areas with Work-ing Landscapes Conserving Biodiversity: Proceedings of the Third International Conference on Science and Management of Protected Areas, Calgary, p 967-971. Wolfville.
Reid, S.E. & Marion, J.L. (2004). Effectiveness of a con-finement strategy for reducing campsite impacts in Shenandoah National Park. In: Environmental Con-servation (31/4), p 274-282.
Reid, S.E. & Marion, J.L. (2005). A comparison of camp-fire impacts and policies in seven protected areas. In: Environmental Management (36/1), p 48-58.
Taylor, A.R. & Knight, R.L. (2003). Wildlife responses to recreation and associated visitor perceptions. In: Eco-logical Applications (13/4), p 951-963.
Thurston, E. & Reader, R.J. (2001) Impacts of experimen-tally applied mountain biking and hiking on vegeta-tion and soil of a deciduous forest. In: Environmental Management (27/3), p 397-409.
Wallin, T.R. & Harden, C.P. (1996). Estimating trail-related soil erosion in humid tropics: Jatun Sacha, Ecuador, and La Selva, Costa Rica. In: Ambio (25/8), p 517-522.
Wirsching, A., Leung, Y.-F. & Attarian, A. (2003). Swat-ting little bugs: What agencies can do to decrease de-preciative visitor behavior. In: Parks and Recreation (38/11), p 16-22.
Zabinski, C. & Cole, D. (2000). Understanding the factors that limit restoration success on a recreation-impacted subalpine site. In: Cole, D.N., McCool, S.F., Borrie, W.T. & O’Loughlin, J., comps. Wilderness science in a time of change conference, Vol. 5: Wilderness eco-systems, threats, and management; 2000 May 23–27; Missoula, MT. Proceedings, p 216-221. Ogden.
Zabinski, C.A., DeLuca, T.H, Cole, D.N. & Moynahan, O.S. (2002). Restoration of highly impacted subalpine campsites in the Eagle Cap Wilderness, Oregon. In: Restoration Ecology (10/2), p 275-281.
Zabinski, C., Wojtowicz, T. & Cole, D. (2000). The effects of recreation disturbance on subalpine seed banks in the Rocky Mountains of Montana. In: Canadian Jour-nal of Botany (78/5), p 577-582.

Siegrist, D., Clivaz, C., Hunziker, M. & Iten, S. (eds.) (2006). Exploring the Nature of Management. Proceedings of the Third International Conference on Monitoring and Management of Visitor Flows in Recreational and Protected Areas.
University of Applied Sciences Rapperswil, Switzerland, 13-17 September 2006. Rapperswil.
98
Recreation Ecology and Visitor Impact Research: Past, Present and Future
Christopher Monz
St. Lawrence University, USA
Keywords: Recreation ecology, visitor impacts.
Introduction
Visitor activities in parks and protected areas in-evitably have some consequences to natural re-sources. Even the most careful visitors can poten-tially disturb soil, vegetation, and wildlife; and in some cases affect water and air quality. Manage-ment decisions as to the level of acceptable dis-turbance to protected area ecosystems can be dif-ficult and challenging and must be well informed by the best available science.
Considerable research conducted since the 1960’s has demonstrated the relationships between visi-tor use and resource impact (e.g., Leung & Mar-ion 2000, Buckley 2004). This discipline is often referred to as Recreation Ecology. Several fun-damental principles can be generalized from this body of knowledge including:
1. Recreation activities can and often do directly affect the soil, vegetation, wildlife, water and air components of ecosystems.
2. Ecosystem structure and function can also be affected by visitor activities particularly given the interrelationships between ecosystem compo-nents.
3. For a given finite space, the relationship be-tween many ecosystem responses and use is cur-vilinear, with the majority of impact occurring with initial use
4. Although some generalizations apply, resis-tance and resilience to visitor use disturbance is ecosystem specific
5. The distribution of use and visitor behavior are primary driving variables in determining the amount of impact
Given these principles, recreation ecology stud-ies of two types are generally performed in parks and protected areas in an effort to assist manag-ers in the avoidance and mitigation of visitor im-pacts. Experimental studies (e.g. Cole 1995, Cole & Monz 2004) examine causal relationships be-tween use type and intensity and ecosystem-spe-cific components. These studies employ carefully controlled experimental designs and can determine the levels of visitor use a given ecosystem (or eco-system component) can tolerate. Monitoring and assessment studies (e.g. Cole & Hall 1992, Marion & Leung 1997) are perhaps more common as man-agers often find them to be of considerable utility. Conducted over a long term, these studies can pro-vide an initial assessment of the current resource conditions, the trends of how impacts are changing over time, and an evaluation of the effectiveness of management actions.
While recreation ecology continues to be an im-portant and growing field, and visitor impacts to natural resources are an ever present concern of park managers, numerous challenges exist in both the application of recreation ecology principles in management and in the expansion of knowledge in the discipline. First, full time practitioners in this field are very limited, especially compared to hu-man dimensions research. In addition, researchers have mostly worked in relatively small, geograph-ically separated groups, with few opportunities for dialog between the groups. Second, funding for ba-sic scientific investigations utilizing experimental designs has been extremely limited in the best of times and frequently nonexistent. Managers in pro-tected areas have supported most of the work in the field and therefore most studies – understand-

Recreation Ecology and Visitor Impact Research: Past, Present and Future
99
ably – have been monitoring and assessment ef-forts. While monitoring studies are useful, they are typically limited in their ability to examine causal factors and in quantification of use-impact relationships. Finally, confusion and conflicting opinions exist about the importance of recreation use impacts from both park ecologists and so-cial scientists. Heretofore, few seem to recognize that while recreation impacts tend to be of lim-ited extent on an area basis, they also tend to be much more intense than other types of impact in protected areas. Moreover, these intense impacts often proliferate in high value areas containing unique species or other desirable attributes, since these are places visitors often desire to go.
Conclusions
In order to begin to address the above challenges and to expand and revitalize this important field, a group of researchers has recently organized to promote increased collaboration between prac-titioners worldwide. Recent meetings and panel presentations (in 2003 and 2005), including ses-sions at the biennial George Wright Society Con-ference, led to the formation of the Recreation Ecology Research Network. This group seeks to promote the field through increased visibili-ty at professional meetings, research collabora-tions and expanded theoretical and conceptual development of important topics. The forthcom-ing panel session at this conference and the as-sociated publications will be an excellent next step in this process and will strive to establish a future research agenda of international scope. This paper will provide a concise review of the science of recreation ecology including manage-ment implications, a discussion of the current challenges and limitations, and a direction for future research.
References
Buckley, R. The Environmental Impacts of Ecotourism. Wallingford.
Cole, D. N. (1995). Experimental trampling of vegetation I. Relationship between trampling intensity and veg-etation response. In: Journal of Applied Ecology (32), p 203-214
Cole, D. N. & Hall, T. E. (1992). Trends in campsite condi-tion: Eagle Cap Wilderness, Bob Marshall Wilderness and Grand Canyon National Park. USDA Forest Ser-vice Research Paper INT-453.
Cole, D. N. & Monz, C. A. (2004). Spatial patterns of recre-ation impact on experimental campsites. In: Journal of Environmental Management (70), p 73-84.
Leung, Y. & Marion, J. L. (2000). Recreation impacts and management in wilderness: A state-of-knowledge re-view. In Cole, D.N., McCool, S. F., Borrie, W. T. & O’Loughlan, J. (comps.) Wilderness science in a time of change conference– Volume 5: Wilderness ecosys-tems, threats and management. Proceedings RMRS-P-15-Vol-5, p 23-48.
Marion, J.L. & Leung, Y.-F. (1997). An assessment of campsite conditions in Great Smoky Mountains Na-tional Park. USDI National Park Service Research Re-sources Management Report.

100

101
Recreational Impacts on Park Ecosystems
David Cole (Chair)

Siegrist, D., Clivaz, C., Hunziker, M. & Iten, S. (eds.) (2006). Exploring the Nature of Management. Proceedings of the Third International Conference on Monitoring and Management of Visitor Flows in Recreational and Protected Areas.
University of Applied Sciences Rapperswil, Switzerland, 13-17 September 2006. Rapperswil.
102
Visitors to the Highlands of Itatiaia National Park, Brazil, and their Perceptions of Visitor Impacts
Maria Isabel A. Barros1 & Teresa C. Magro2
1Instituto Ekos Brasil, [email protected]
2São Paulo University, [email protected]
Keywords: Visitor characteristics, recreation impact, visitor’s perceptions, Brazilian National Parks.
Abstract: The goal of this research was to characterize the visit and visitors to the highlands of Itatiaia National Park (PNI), located in the state of Rio de Janeiro, Brazil and, based on that information, to explore the guidelines of a visitor education program designed to encompass minimum impact techniques that would help minimize management prob-lems. A questionnaire was applied to 605 people from February to August 2002 in order to collect information about visits and visitors. Among the information collected were group size, activities carried out by visitors, duration of visit, and educational level of visitors, their previous experience and perceptions of the impacts caused by visitors.
Introduction
In Brazil, outdoor recreational activities are not yet adequately explored or advertised, but the appeals of ecotourism and recreation in protected areas such as national parks have increased significantly in recent years. Many protected areas now face the pressure of the increase in the number of visitors, often associated with a demand for a more varied availability of recreational opportunities.
The rise in the number of people who seek closer contact with natural environments, who are inter-ested in outdoor activities and who call for a wid-er array of recreational opportunities aggravate the need for preparing protected areas to cater to those uses through planning and management actions. While several countries have developed great knowledge based on research about recreation management of protected natural areas, Brazil has little information and few successful stories to of-fer on the subject. Not surprisingly, recreational use is mostly seen as a big encumbrance and the increase in recreation-induced impacts is managed mainly by means of restricting use, closing areas and strictly regulating activities, thus leading to a reduction of the available recreational options and to restraints to visitor freedom.
Information concerning the user of a certain pro-tected area is essential to planning and implemen-tation of recreation management actions. That in-formation, which should include the type of visit, visitor’s expectations and perceptions, previous experience and knowledge of minimum-impact techniques is lacking in Brazil, thus hampering de-velopment of recreation management.
The highlands of Itatiaia National Park in the state of Rio de Janeiro were chosen for the study due to their unique characteristics of recreational use and also for being in Brazil’s first national park.
Methods
During the development of this study (February- August, 2002), the Park administration registered the entry of 6,700 visitors. Data on characteriza-tion of the visit and visitor’s profile were obtained by means of a questionnaire comprising closed questions, answered by 605 visitors, selected ran-domly and interviewed during 10 weekends and/or holydays Among the data collected are:
Characteristics of the visit: information that de-scribes relevant attributes of the visit, among them:

Recreational Impacts on Park Ecosystems
103
A. Group size. Information about visitor group size is important to help planning management strate-gies related to groups.
B. Activities done by visitors. The knowledge about visitor’s activities is important to help the under-standing of recreation opportunities preferred at a specific protected area.
C. Duration of visit. The information about visit duration can be used as a success indicator of an area in attracting visitors.
Visitor’s profile: describes visitor’s attributes, such as experience, preferences and demographic data:
A. Educational level (schooling)
B. Previous experience: how long the visitor has come to the Park; how often she or he visits it dur-ing one year; whether she or he usually visits other natural areas; and if she or he usually camps.
Visitor’s characteristics will help the planning of management priorities, communication methods and tools as well as measure the effectiveness of educational programs.
Visitor’s Perceptions: visitors were asked about their subjective evaluation of conditions encoun-tered during the visit and their impact on the qual-ity of the experience. Visitors’ opinions about the area’s current conditions generate important in-formation for monitoring programs. Because that information helps one get a good perspective on how important those problems are to the visitor, it can be used in setting priorities for management actions and strategies. Visitors were also asked to assess several items such as “trails with erosion and with poor maintenance” and “recovery of vegetation in campgrounds”, occurrences noticed by users during their visit to the Park.
Due the fact that this information provides a good perspective about how important the problems are to the visitors, they can be used to prioritize management actions and strategies.
Results
Itatiaia National Park is one of Brazil’s most vis-ited national parks, although the majority of visi-tors concentrate around the so-called “Lower Part” at the foothills of the park, where easier-access at-
tractions are located. The average number of vis-itors to the area under study, called “Planalto” (Highlands) between 1990 and 2002 was 10,173 people per year.
Characteristics of the visit
A. Group size
Group visits predominate among users of the Highlands, probably due to local characteris-tics of wildness and the difficult access. Only 2% of total interviewees declared being alone, 53% said they were part of a group of 2 to 4 per-sons, 29% were in a group of 5-10 people and 16% were part of a group larger than 10 peo-ple strong. Therefore, 84% of interviewees vis-ited the park in small groups of up to 10 peo-ple, although the Highlands occasionally receive groups of 100 or more. According to a compre-hensive study by Roggenbuck and Lucas (1987), aimed at systematizing several studies on char-acteristics of recreational use and of visitors to protected natural areas in the United States, vis-itor groups are small and tend to become small-er with time.
B. User activities during visit
Hiking was mentioned by 41% of interviewees as the main activity done during the visit. Climb-ing the main peaks is done by 44% of interview-ees and only 8% do technical rock climbing. Among interviewees, camping is not currently a very popular activity, either; it is the main ac-tivity for only 4% of users. Data show that al-most all visitors (84%) flock to the two most famous peaks in the Highlands (Agulhas Ne-gras and Prateleiras) or hike on trails that lead to their bases or on the road to Rebouças moun-tain shelter.
Although there are other options for excur-sions such as Couto Peak, Mt. Altar and Aiuru-oca Falls, visitors hardly ever visit them, con-centrating their activities in three places and consequently increasing impact to those areas. That happens in part due to the lack of infor-mation available at the park entrance about the Highlands and their attractions, preventing us-ers from learning about other opportunities for excursions and trails in the area.

Recreational Impacts on Park Ecosystems
104
C. Duration of visit
Most interviewees (83%) planned to stay overnight in the region, probably because access to the area is difficult and long and because of their interest in knowing all attractions in the area, mainly Agulhas Negras and Prateleiras peaks. In spite of the fact that other areas and studies show a trend towards short visits (Roggenbuck & Lucas 1987), that does not happen in the Highlands of Itatiaia National Park, despite the reduction in the number of op-portunities and activities during the past years af-ter camping was banned and access to some trails was closed. According to Kinker (1999), compar-ison of the duration of stay in three Brazilian na-tional parks indicated that duration is proportion-al to the number of attractions available as well as to the degree of freedom the visitor enjoys to move around the area. One can thus infer that the time of visitors’ permanence in the Highlands would in-crease if the offer of alternative recreational activi-ties were also greater.
Visitor Profile
A. Educational Level (schooling)
A very relevant characteristic of the visitors inter-viewed is their high level of schooling. Those who have completed some graduate schooling repre-sent 20% of the total and 19% have completed col-lege. Undergraduate students represent 33%, while 16% are either attending or have graduated from secondary school and 11% are either attending or have completed primary school. That proportion is much higher than the national average and than the educational data for the states where the park is located. That may contribute substantially to the public acceptance of a visitor education program as people who visit the Highlands already possess an educational background that helps them under-stand the importance of everyone’s attitudes and actions in natural areas.
B. Previous experience
Assessment of interviewed visitors’ previous expe-rience is not very conclusive because, while 51% of people declared that they were visiting the park for the first time, 40% stated that they visit the Highlands up to three times a year and 72% stated that they usually visit other natural areas. That last
result was considered a high level of previous ex-perience by Roggenbuck & Lucas (1987). At the same time, 9% of people said they have been visit-ing the park for two years, 10% for 2-4 years, 12% for 4-10 years and 18% have visited the park for more than ten years.
As to previous camping experience, 41% said that when they visit other natural areas they sometimes camp, 29% said they always camp, 23% stated they never camp and 7% did not respond. There-fore, it can be noticed that visitors to the Highlands usually do different activities from those found in the park’s lower part or in other natural areas, in-cluding camping.
Visitor’s perceptionRecent studies suggest that the impacts perceived by visitors may reduce the quality of the experi-ence (Roggenbuck et al. 1993, Vaske1 et al. cit-ed by Leung & Marion 2000). Perceptions are based on how visitors believe that the impacts affect the general qualities of the place such as scenic attributes and the opportunities for isola-tion, and when the impacts are considered unde-sirable. In general, visitors are apparently more sensitive to impacts caused by inappropriate be-havior such as littering, damaging trees and to examples of particularly excessive impacts such as exposed roots.
A well-established principle about recreational use in natural areas is that visitors’ perceptions about the conditions of an area are strongly in-fluenced by their expectations about those con-ditions (Cole et al. 1997). Questions on visitors’ perceptions were therefore conceived so that an-swers would reveal how their experience in the Park was different from what they had expect-ed. They were asked about the number of people they encountered during the visit to the High-lands, about the degradation of the natural areas caused by other visitors and also about the num-ber of management actions that the administra-tion executed to correct the impacts caused by the recreational use. Table 1 summarizes those results.
1 VASKE, J.J., GRAEFE, A.R. & DEMPSTER, A. Social and environmental influ-ences on perceived crowding. In: ANNUAL CONFERENCE OF THE WILDERNESS PSYCHOLOGIC, 3., Morgantown, 1982. Proceedings. p.211-227.

Recreational Impacts on Park Ecosystems
105
Most visitors (35%) reported that they ran into more people during their visit to the Highlands than they had expected, while 30% said they had met the same number of people they had ex-pected. For 55% of visitors that did not alter the quality of their visit.
Likewise, the study by Cole et al. (1997) for six protected mountain areas in the states of Oregon and Washington (USA) revealed that most visi-tors reported that the number of people they met did not affect negatively the quality of their vis-it.
Half the visitors interviewed (50%) stated that degradation of the natural resources caused by visitors was smaller than they had expected and that it did not affect the quality of the visit (58%). In relation to management actions, 31% of visitors said that the number of management actions in the Park was greater than they had ex-pected. For 57% of visitors, the number of man-
agement interventions did not affect the quality of their visit, while for 33% of visitors that num-ber improved the quality of their visit. Those data show the public’s reaction to a greater pres-ence of management actions related to visita-tion as compared to that of the past. Since that study was initiated just after a major fire in the Prateleiras massif, which triggered a series of management actions affecting recreational use, visitors noticed the changes and that did not al-ter the quality of their visit or rather improved it. That shows that visitors are receptive to a great-er presence of management interventions, which may help future strategies for recreational use in the Highlands. The impacts observed by visitors during their stay in the Highlands can be seen in table 2.
Shortcuts and/or secondary trails were the im-pact visitors noticed the most. Following are “eroded and poorly maintained trails”, “over
Impacts % Impacts %
Eroded and poorly maintained trails 29% People cutting grass or trees for firewood 0%
Overcrowded trails 28% Trash/residues left by visitors 20% Shortcuts and secondary trails 44% Feces in inadequate places 8% Recovery of vegetation in campgrounds 20% Noise caused by visitors 24%
Cut or damaged trees 8% Remnants of campfires 6%
Table 2: Impacts observed by visitors during their stay in the Highlands of Itatiaia National Park.
Question % Question %
Number of people seen during visit What that represented to your visitFewer than expected 19 Did not alter the quality of the visit 55Same as expected 30 Diminished the quality of the visit 20More than expected 35 Improved the quality of the visit 25No expectations 16
Degradation of natural areas What that represented to your visitLess than expected 50 Did not alter the quality of the visit 58Same as expected 27 Diminished the quality of the visit 9 More than expected 7 Improved the quality of the visit 33No expectations 16
Number of management actions What that represented to your visitFewer than expected 21 Did not alter the quality of the visit 57Same as expected 26 Diminished the quality of the visit 10More than expected 31 Improved the quality of the visit 33No expectations 22
Table 1: Visitors’ expectations and perceptions as to number of visitors, impact of recreational use and presence of management actions.

Recreational Impacts on Park Ecosystems
106
crowded trails” and “noise caused by visitors”, showing that bad conservation of trails and the large concentration of visitors on two trails did not go unnoticed by people, either.
Impacts least observed were “remnants of camp-fires”, “feces in inadequate places” and “cut or damaged trees”. That probably was due to the fact that those impacts were not readily visible as they occurred in campgrounds whose use is currently banned. Those results also indicate which manage-ment actions must be set as priorities to reestablish adequate conditions for trails and visitation areas in the Highlands, seeking the public’s recognition and approval.
Conclusions
Due to their pristine conditions, the number of visi-tors is increasing faster in the Highlands than in the Park’s lower part, demonstrating that the demand for activities connected with hiking, peak ascents, rock climbing and camping has also increased. However, 84% of visitors to PNI concentrate their activities in three places: Agulhas Negras Peak, Prateleiras Peak and Rebouças mountain shelter, adding to ecological and recreational impacts to those areas.
Although the high concentration of people in the same area has been noticed by visitors and most of them did not report that it affected the quality of their visit, for 20% of the people crowding dimin-ished the quality of their experience. Just as in re-lation to problems connected with campgrounds, the magnitude of crowding is influenced by the frequency of interactions, the types of groups en-countered, the behavior of individuals during group encounters and the place where they meet (Cole 1989). Therefore, even though the judgment as to how many people represent “overcrowding” varies from person to person, many visitors want little contact between groups and one of the objec-tives of management is to minimize crowding and encounters between groups.
Many impacts of recreational use at the study area are caused by management-related aspects, but some impacts are strongly influenced by visi-tor behavior. The high educational level of visitors and the fact that 90% of them mentioned that the
presence of management actions did not disturb or contributed to their experience, is an indicator that PNI visitors are receptive to a higher presence of recreation management and would accept a visi-tor education program. Therefore, considering the techniques recommended by specialized literature and adopted by Leave No Trace program, guide-lines have been elaborated including techniques related to the following issues: deterioration of constructed trails, development of undesired user-created trails, proliferation of campsites, deteriora-tion of established campsites, litter, human waste and crowding.
References
Cole, D.N. (1989). Low-impact recreational practices for wilderness and backcountry. General Technical Re-port INT, 265. Ogden.
Cole, D.N., Watson, A.E.; Hall, T.E. & Spildie, D.R. (1997). High use destination in wilderness: social and bio-physical impacts, visitor responses, and management options. Research Paper INT, 496. Ogden.
Leung, Y.F. & Marion, J.L (2000). Recreations Impacts and Management in Wilderness: A State of Knowledge Review. In: Wilderness Science in a Time of Change. Conference Proceedings: Wilderness Ecosystems, Threats and Management, Missoula, 1999, p 23-48. Fort Collins.
Roggenbuck, J.W. & Lucas, R.C. (1987). Wilderness use and user characterisitics: a state of knowledge review. In: General Technical Report INT, p 204-246. Fort Collins.
Roggenbuck, J.W.; Williams, D.R. & Watson, A.E. (1993). Defining acceptable conditions in wilderness. In: Jour-nal of Environmental Management (17/2), p 187-197.

Siegrist, D., Clivaz, C., Hunziker, M. & Iten, S. (eds.) (2006). Exploring the Nature of Management. Proceedings of the Third International Conference on Monitoring and Management of Visitor Flows in Recreational and Protected Areas.
University of Applied Sciences Rapperswil, Switzerland, 13-17 September 2006. Rapperswil.
107
Trampling after Landscape Level Disturbance: Impacts onSubalpine Vegetation and Soils in the Australian Alps
Andrew J. Growcock1, Catherine M. Pickering1 & Stuart W. Johnston2
1Griffith University, [email protected]
2Australian National University, [email protected]
Keywords: Trampling, subalpine, bushfires, recovery, visitation, protected areas, sustainability, Australia.
The effects of trampling on soils and vegetation are among the most well studied areas in recreation ecology. A major gap in this field of study howev-er, is research that examines the impact of recre-ation in conjunction with natural disturbance. This recognises that natural disturbances are key eco-logical processes and that protected areas can ex-perience landscape level disturbance, which with subsequent visitor use following the natural distur-bance could well exacerbate the impacts on the en-vironment (Figure 1). Therefore, issues that need to be investigated by recreation ecology, include:
1) Comparing the severity of impacts of recreation activities vs impacts of natural disturbances.
2) Examining if recreation impacts can alter the pat-tern of recovery from natural disturbance in ecosys-tems, including the possible slowing or altering of the process of natural recovery.
3) If it is appropriate for management to allow vis-itation in protected areas after landscape level dis-turbances such as long term droughts or fires.
As part of a larger study into recreational impacts in the Australian Alps, this research examined the im-pact of visitor use before and after a large landscape level disturbance caused by bushfires in the sub-alpine grasslands of the Australian Alps in south-eastern Australia (Figure 2). The Australian Alps area is recognised for its high conservation value and is a popular tourism destination in both sum-mer and winter.
In January-February 2003 the Australian Alps ex-perienced their largest bushfires in over 60 years with approximately 70% of the subalpine area burnt during the fires. The intensity of the fires was not constant however, with some areas being only partially burnt and resulting in a mosaic of un-burnt
Figure 1: Visitor use following bushfires can exacerbate the im-pacts on the environment.

Recreational Impacts on Park Ecosystems
108
and burnt vegetation, while other areas were ex-tensively affected with no above ground vegeta-tion remaining after the fire.
In studies prior to the fire, the subalpine grass-lands community was identified as having a trampling threshold level of 150-200 passes be-fore significant short-term damage began to oc-cur to vegetation. Following the fire, a study was undertaken to compare the effect of trampling on the partially burnt and extensively burnt en-vironments to see if the impacts of trampling by visitors differed with the intensity of distur-bance.
The experimental trampling studies were based on the approach developed by Cole and Bay-field (1993). Trampling was applied at two time periods: within weeks of the fire, and then one-year after the fire when vegetation was starting to recover. Vegetation cover and composition and soil characteristics were each examined. The study found that for trampling that occurred within weeks of the bushfires:
(1) Significant short-term impacts occurred with extensive changes to the soil surface evident af-ter only 30 passes.
(2) Natural events (i.e. rainfall) eclipsed the damage caused from up to 200 passes with no significant difference apparent after six weeks;
(3) More than 200 passes may exceed a recov-ery threshold and exacerbate soil loss post fire;
(4) Recovery of species one year after bushfire does not appear to have been affected by tram-pling activities.
When trampling occurred on new sites one-year after the bushfires there were significant im-pacts on both vegetation and soils. Changes oc-curred after as few as 100 passes with reduc-tions occurring in vegetation cover, increases in litter and rapid increases in soil compaction.
These results indicate that trampling at low in-tensities soon after fire can change soil con-ditions and vegetation cover, with thresholds lower than occurred prior to the disturbance. Despite this, natural processes of recovery and change rapidly eclipsed these impacts. Tram-pling on recovering vegetation a year after the fire is of greater concern however, with tram-pling affecting soils and early colonizing spe-cies indicating that the system may have lost its resilience to disturbance. Longer-term effects on soils and vegetation may occur from tram-pling at this time.
These results should be treated as a best case scenario for post fire impacts in the Austra-lian Alps, as trampling under wet conditions or on areas with a steeper gradient are likely to cause greater damage. Further, once distur-bance thresholds have been passed, sites are likely to remain susceptible to damage in the future. Further research into recreation impacts in protected areas after natural disturbance will continue to enhance our understanding of these interactions and processes.
References
Cole, D.N. & Bayfield, N.G. (1993). Recreational tram-pling of vegetation: standard experimental proce-dures. Biological Conservation 63, p 209-215.
Growcock, A.J. (2005). Impacts of Camping and Tram-pling on Australian Alpine and Subalpine Vegetation and Soils. PhD Thesis, School of Environmental and Applied Science, Griffith University, Gold Coast.
Figure 1: Protected areas in the Australian Alps.
In January-February 2003 the Australian Alps experienced the largest bushfires in over 60 years with approximately 70% of the subalpine area burnt. The intensity of the fires however, was not constant. Some areas were only partially burnt resulting in a mosaic of unburnt and burnt vegetation, while other areas were extensively affected with no above ground vegetation remaining after the fire.
Figure 2: Protected areas in the Australian Alps.
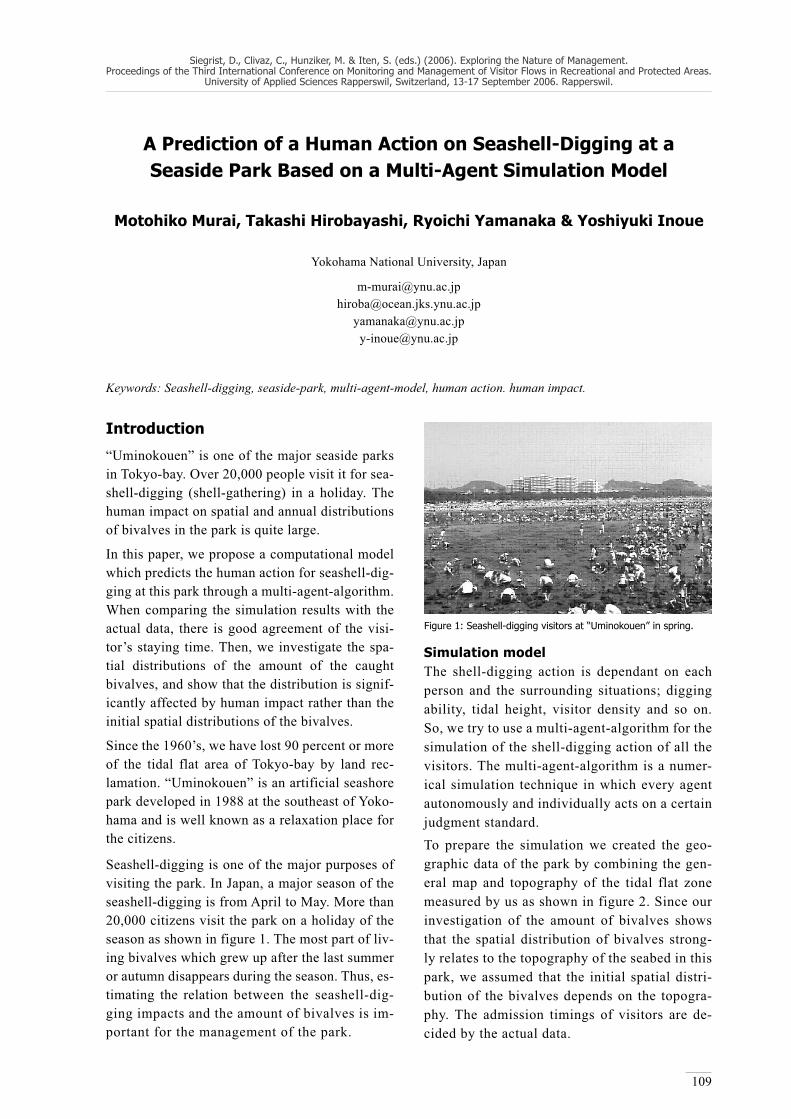
Siegrist, D., Clivaz, C., Hunziker, M. & Iten, S. (eds.) (2006). Exploring the Nature of Management. Proceedings of the Third International Conference on Monitoring and Management of Visitor Flows in Recreational and Protected Areas.
University of Applied Sciences Rapperswil, Switzerland, 13-17 September 2006. Rapperswil.
109
A Prediction of a Human Action on Seashell-Digging at a Seaside Park Based on a Multi-Agent Simulation Model
Motohiko Murai, Takashi Hirobayashi, Ryoichi Yamanaka & Yoshiyuki Inoue
Yokohama National University, Japan
[email protected]@ocean.jks.ynu.ac.jp
[email protected]@ynu.ac.jp
Keywords: Seashell-digging, seaside-park, multi-agent-model, human action. human impact.
Introduction
“Uminokouen” is one of the major seaside parks in Tokyo-bay. Over 20,000 people visit it for sea-shell-digging (shell-gathering) in a holiday. The human impact on spatial and annual distributions of bivalves in the park is quite large.
In this paper, we propose a computational model which predicts the human action for seashell-dig-ging at this park through a multi-agent-algorithm. When comparing the simulation results with the actual data, there is good agreement of the visi-tor’s staying time. Then, we investigate the spa-tial distributions of the amount of the caught bivalves, and show that the distribution is signif-icantly affected by human impact rather than the initial spatial distributions of the bivalves.
Since the 1960’s, we have lost 90 percent or more of the tidal flat area of Tokyo-bay by land rec-lamation. “Uminokouen” is an artificial seashore park developed in 1988 at the southeast of Yoko-hama and is well known as a relaxation place for the citizens.
Seashell-digging is one of the major purposes of visiting the park. In Japan, a major season of the seashell-digging is from April to May. More than 20,000 citizens visit the park on a holiday of the season as shown in figure 1. The most part of liv-ing bivalves which grew up after the last summer or autumn disappears during the season. Thus, es-timating the relation between the seashell-dig-ging impacts and the amount of bivalves is im-portant for the management of the park.
Simulation modelThe shell-digging action is dependant on each person and the surrounding situations; digging ability, tidal height, visitor density and so on. So, we try to use a multi-agent-algorithm for the simulation of the shell-digging action of all the visitors. The multi-agent-algorithm is a numer-ical simulation technique in which every agent autonomously and individually acts on a certain judgment standard.To prepare the simulation we created the geo-graphic data of the park by combining the gen-eral map and topography of the tidal flat zone measured by us as shown in figure 2. Since our investigation of the amount of bivalves shows that the spatial distribution of bivalves strong-ly relates to the topography of the seabed in this park, we assumed that the initial spatial distri-bution of the bivalves depends on the topogra-phy. The admission timings of visitors are de-cided by the actual data.
Figure 1: Seashell-digging visitors at “Uminokouen” in spring.

Recreational Impacts on Park Ecosystems
110
The action of the visitors is categorized into movement-phase and seashell-digging-phase in this simulation. In the movement-phase, each virtual visitor starts with his/her condi-tions which consist of the tolerance range of the sea-depth and visitor’s density, which are based on the result of our questionnaire and the vid-eo analysis. They make a survey of the situa-tion around them and decide the direction of the movement. When they arrived at the posi-tion which fulfills the conditions, their modes change to the seashell-digging-phase.
In the seashell-digging-phase, the visitor catches bivalves by a certain probability. If the amount of the bivalves caught by one digging action has become less than a certain value, the visitor’s mode is changed to the movement-phase for finding a new position of the seashell-digging. When the total quantity of bivalves gathered has reached a certain value or the sun sets, they stop seashell-digging and exit the park from their en-trance point.
Results
Comparison of the distribution of visitors’ staying time between the simulation result and the actu-al observed data is shown in figure 3. The figure shows that both results agree well. The snapshots of the spatial distributions of the seashell-digging visitors are shown in figure 4. We can recognize in both snapshots that the seashell-digging visi-tors vertically queue to the coastal line. These re-sults indicate that the computer code of the multi-agent-algorithm can simulate the human action in the seashore park quite well.
The spatial distribution of the amount of bivalves caught by the virtual visitors is shown in figure 5. Figure 5 indicates that the distribution is affect-ed more by the spatial distributions of the visi-tors rather than by the initial spatial distributions of the bivalves.
In studies conducted in the near future, we should extend this code to predict the human impact on the whole of the seashell-digging season and ex-amine how to manage the park to sustain its role as being a relaxation place for citizens.
Figure 2: The standard depth of the sea in the seaside park.
Figure 3: The distribution of staying time of the visitors.
(A) Simulation
(B) Photograph
Figure 4: The snapshots of the spatial distributions of the sea-shell-digging visitors.

Recreational Impacts on Park Ecosystems
111
References
Gilbert N. & Troitzsch, K.G. (1999). “Simulation for the Social Scientist” Open University Press.
Figure 5: The spatial distributions of the amount bivalves which were caught by the virtual visitors.

Siegrist, D., Clivaz, C., Hunziker, M. & Iten, S. (eds.) (2006). Exploring the Nature of Management. Proceedings of the Third International Conference on Monitoring and Management of Visitor Flows in Recreational and Protected Areas.
University of Applied Sciences Rapperswil, Switzerland, 13-17 September 2006. Rapperswil.
112
Environmental Impacts of Recreational Horse Riding in Protected Areas
Pirkko Siikamäki1, Anne Törn1 & Anne Tolvanen2
1University of Oulu, [email protected]
2Finnish Forest Research Institute, [email protected]
Keywords: Introduced species, erosion, disturbance, horse manure, recreational horse riding, soil, vegetation, visi-tor impact.
Introduction
The use of protected areas as destination ar-eas for nature-based tourisms has increased remarkably during recent decades. Character-istics for this development have not only been the manifold numbers of visitors but also new types of recreational and tourism activities in protected areas. One greatly increased activity in protected areas is recreational horse-riding (e. g. Landsberg et al. 2001, Newsome et al. 2004). Furthermore, it seems that horse-riding will continue to be a significant recreation-al activity even with a considerable growing pressure. Conflicts between horse-riders and other recreational users arise because of direct impacts of horses and because of the greater erosion caused by horse-riding compared to other recreational activities. Environmental impacts of recreational horse riding are indeed both quantitatively and qualitatively great-er than those caused by walkers. Horse-rid-ing causes considerable damages to soils and vegetation by trampling and grazing, defolia-tion and nutrient enrichment by urination and defecation of horses (reviewed in Newsome et al. 2004). Even though recreational horse rid-ing also poses a threat of spreading introduced species via horse manure (Campbell & Gibson 2001), the ecological impacts of horse-riding are poorly studied especially in northern ar-eas.
Methods
We investigated the influence of horse-riding on vegetation and soil characteristics by experimen-tal and monitoring research at Oulanka National Park, north-eastern Finland during 2001-2005. The main aim of the study was to assess and to quan-tify the general environmental impacts of horse-riding in protected areas in northern Finland. Fur-thermore, we specifically focused on the potential risks of horse-riding in spreading alien species to protected areas by conducting a field experi-ment. The study was full-factorial with three fac-tors: (1) removal of humus layer, simulating trails trampled by horses, (2) addition of horse manure and (3) addition of seeds of dwarf shrubs (Vaccin-ium myrtillus, Vaccinium vitis-idaea and Empe-trum nigrum).
Results
Our monitoring data from horse-riding trails and campsites show that even a low number of horse-back riders (about 80 – 100 per year) has caused considerable trail erosion and degrada-tion. Erosion of trails was lowest in the driest forest type, Myrtillus-Calluna-Cladina (MC-ClT) compared to dry heath Empetrum-Myr-tillus forests and moist Hyloconium-Myrtillus forests (figure 1a). Also topography and ele-

Recreational Impacts on Park Ecosystems
113
lower that in slopes (figure 1b). Monitoring re-sults on horse resting areas show that the cov-er of evergreen dwarf shrubs and herbaceous plants decreased due to trampling and grazing by horses. Original forest plant communities were replaced by secondary ones with many species introduced to the national park. Our experimental study on the effects of horse-riding shows that via horse manure a number of introduced species was able to establish them-selves in study plots (figure 2.). Moreover, there was an interaction between horse manure treat-ment and humus removal treatment indicating that among eroded study plots the establish-
ment of introduced species was more quickly compared to control plots without humus re-moval (figure 2). This indicates that the poten-tial risk of introducing alien species to protect-ed areas via horse-riding is related to the level of human-induced disturbance. Alien species are more likely to establish themselves in pro-tected areas when the vegetation and soils are prone to trampling disturbance either by hors-es, hikers or other users. Because of the di-verse impacts to native species and to ecologi-cal processes, horse riding poses a serious risk for the biodiversity of conservation areas at least if not carefully planned and controlled.
HMT EMT MCClTForest type
6,00
7,00
8,00
9,00
10,00
11,00
12,00
13,00
Trai
l dep
th, c
m
flat slopeInclination
7,00
8,00
9,00
10,00
11,00
12,00
Trai
l dep
th, c
m
Figure 1: Mean ( SE) trail depths (cm) of horse-riding trails in Oulanka National Park, Finland in (a) different boreal forest types (HMT = Hyloconium-Myrtillus; EMT = Empetrum-Myrtillus; MCClT = Myrtillus-Calluna-Cladina) and (b) among trails in flat and slope terrain.
Time
Num
ber o
f int
rodu
ced
spec
ies/
m2
0
5
10
15 M0 S0M1 S0M0 S1M1 S1
A
1 2 3
Dist0
Time
0
5
10
15B
1 2 3 4
Dist1
Num
ber o
f int
rodu
ced
spec
ies/
m2
Figure 2: Change in the number of shoots of introduced species per m2 in (a) undisturbed (Dist0) plots and in (b) disturbed plots with removal of humus after treatments. Treatment abbreviations: no manure addition (M0), addition of manure (M1), no seed addition (S0)and addition of seeds (S1). The response was measure at the starting point (Time 1), one month (Time 2), one year (Time 3) and twoyears afterwards (Time 4).

Recreational Impacts on Park Ecosystems
114
References
Campbell, J.E. & Gibson, D.J. (2001). The effect of seeds of exotic species transported via horse dung on veg-etation along trail corridors. In: Plant Ecology (157), p 23-35.
Landsberg, J., Logan, B. & Shorthouse, D. (2001). Horse riding in urban conservation areas: Reviewing scien-tific evidence to guide management. In: Ecological management & Restoration (2), p 36-46.
Newsome, D., Cole, D.N. & Marion, J.L. (2004). Environ-mental impacts associated with recreational horse-rid-ing. In: Buckley, R. (ed.). Environmental Impacts of Ecotourism, p 61-82. Cambridge.

Siegrist, D., Clivaz, C., Hunziker, M. & Iten, S. (eds.) (2006). Exploring the Nature of Management. Proceedings of the Third International Conference on Monitoring and Management of Visitor Flows in Recreational and Protected Areas.
University of Applied Sciences Rapperswil, Switzerland, 13-17 September 2006. Rapperswil.
115
Genesis of Trails in Nature: Monitoring of Visitors’ Effect on Nature
Hans Skov-Petersen
Danish Centre for Forest, Landscape and Planning, Denmark
Keywords: Trampling, trails, nature regeneration, mountain bikes, running, walking, vegetation.
IntroductionOff trail recreational behaviour in nature is a fre-quent event. In Denmark 60 % of visitors claim to have spent a proportion of their activities away from the established trails and roads (Jensen 1998). Sometimes, off trail activities give rise to genera-tion of new trails. But how much does it take to make a trail? And how much time does it take be-fore nature is again restored after the impact has stopped?The effect of trampling is influenced by
the type activity (bicycling, walking, running, riding etc.),the degree of impact (the number of passages) andthe type of nature in which it is taking place (vegetation, soil type, climate etc.).
In classic experiments the effect of the trampling is investigated by application of the entire impact at once (Cole & Bayfield 1993). To assess the mu-tual effect of trampling impacts and nature’s ability to restore itself, the present investigation has been set up as a series of impacts returning every 14 days over an entire year. It is expected that it will be pos-sible to record less effect of trampling over time in fast growing nature types than in areas of less vig-orous vegetation. Therefore the more vigorous the vegetation the more important it is to consider re-generation in trampling experiment designs.
MethodsThe experiment is carried out in three locations of Northern Zealand, Denmark. The three locations were selected to represent different soil and nature
types: Tisvilde Hegn (Pine on sandy soil – tex-ture class 1), Gribskov/Kagerup (beech on clay – texture class 5) and Nødebo (open grass land on loamy sand– texture class 3). The three sites were selected to represent typical, but as different as possible Danish nature types. Nødebo, which was intermediate in terms of soil texture, was selected as a representative of an area exposed to sunlight all year round. At each location three experiments are set up for three activity types: Walking, run-ning and mountain biking. At each location, for each activity type, test-trails were established ac-cording to
The setup means that after the first year, the max-imum impact investigated will be (26 impacts of 105 passages) 2,730 which is a considerable num-ber compared to the standard experiments carried out by Cole and Bayfield (1993) exploiting up to 500 passages.
After every campaign the characteristics of the trail are recorded. After the first year the impact is stopped, and then followed for up to two year
Figure 1: Experiment layout. For each activity (walking, running and bicycling) a trail was constructed. Every 14 days the trail was traversed the number of times indicated, in the direction shown by the arrows.

Recreational Impacts on Park Ecosystems
116
period where only the recording is continued. The recording includes a photograph of the trail at pre-scribed spot (see figure 2), registration of trail depth and width and a visual evaluation of the trail in the following categories:
1. No visible impact
2. Track visible
3. Soil in bottom of track visible
4. Soil in bottom of trail cut up
5. Sign of secondary erosion
Furthermore, every second month the soil com-pression is measured using a nuclear gauge (Ran-drup and Lichter 2001). At each trail, for each ac-tivity type, at each location the soil compression was measured in 10 and 30 cm depth and in trip-licate.
The experiment was started in April 2005 and will continue onto 2007.
ResultsThe presentation will give results from the exper-iment including comparative studies of trampling effects on different soil/nature types given differ-ent activity types and degrees of impact. Results including pictures can be assessed via a web-page which will be demonstrated. The web-page enables comparison of 4 pictures at a time. Along with the pictures, measures and visual evaluation charac-ters are displayed.
ConclusionA clear management implication of the experiment is that if it is possible to document a correlation be-tween impact and trampling effects (given activity and nature type), investigation in field of emerging trails would provide a rule of thumb for assessment of the number of people using the trail. Yet another possible application of the results will be for micro scale simulation of genesis of trails in the nature in the context of agent based modelling systems.
References
Cole, D.N. & Bayfield, N.G. (1993). Recreational Tram-pling of Vegetation: Standard Experimental Procee-dures. In: Biological Conservation (63), p 209-215.
Jensen, F.S. (1998). Friluftsliv i det åbne land (recreation in the open landscape). Danish Forest and Landscape Research Institute.
Randrup, T.B. & Lichter, J.M. (2001). Measuring soil com-paction on construction sites: A review of surface nu-clear gauges and penetrometers. J. of Arboriculture (27/3).
Figure 2: Example of pictures from the database. Both are from the site in Tisvilde Hegn (Sandy soil/pine forest). Both are taken on No-vember 26 2005. Both are from the mountain bike tracks. To the left the track issued to 7 passages per 14 days (a total of 133 since the start of the experiment). To the right the track issued to 105 passages per 14 days (a total of 1995 passages).

Siegrist, D., Clivaz, C., Hunziker, M. & Iten, S. (eds.) (2006). Exploring the Nature of Management. Proceedings of the Third International Conference on Monitoring and Management of Visitor Flows in Recreational and Protected Areas.
University of Applied Sciences Rapperswil, Switzerland, 13-17 September 2006. Rapperswil.
117
Trampling Impacts on Coastal Sand Dune Vegetation in Southeastern Brazil
Daniela C. Talora1, Teresa C. Magro1 & Ana C. Schilling2
1University of São Paulo, [email protected]
2State University of Santa Cruz, [email protected]
Keywords: Trampling impacts on vegetation, recreation ecology, protected areas, coastal sand dunes.
Abstract: Experimental trampling was conducted in a coastal sand dune community located in a State Park in South-eastern, Brazil. To evaluate the effects it was used 5 permanent plots. The trampling intensities were 25, 75, 200, 500 and 1,000 passes and each plot had a control area. Response to trampling was assessed by determining species compo-sition, vegetation cover and height evaluation, right after trampling, 2 weeks, 3 months, 6 months, 9 months and 1 year after trampling. The same parameters were evaluated just before trampling. Although there was a substantial loss of vegetation cover on 500 and 1,000 treatment plots, the study area was recovered in a few months. Reductions in height occurred with less impact: 200 passes. The 500 and 1,000 pass interference didn’t show statistical difference for cover and 200, 500 or 1,000 passes were statistically similar for the community, suggesting weak linearity between impact and amount of use. The results show that this community has a good resilience; probably in response to the natural stress the vegetation suffers continuously. The vegetation’s changes in species composition seem to be more accurate; especially the extinction of rare species and the introduction of alien ones.
Introduction
Large numbers of experiments on vegetation trampling have been conducted since Bates (1935) has published the first research on this subject in the United Kingdom. We could say that the 70s and 80s have produced most pa-pers including different vegetation communi-ties. These works, therefore, were developed in areas that had already been changed for agricul-tural or pastoral purposes. Then, the correlation between impact and amount of use were diffi-cult to achieve. Experimental trampling research was rare and there was a lack of continuity to re-ally understand the effects of the increasing rec-reational pressure over natural areas. In order to standardize the experiments around the world, Cole and Bayfield (1993) presented a protocol where they indicate a proposal on the way re-searchers should evaluate trampling experiments by using parameters that were comparable with
other sites. According to Cole and Monz (2002) research based on this kind of methodology have been contributing to the general knowledge of recreation ecology and to the efficiency of visi-tor management in protected areas.
Considering the growing knowledge on recre-ation ecology, we are now wondering what we have learned from all those experiments and if the managers have been using those experiences to control visitor impacts on natural areas. More than 10 years after Cole’s and Bayfield’s propos-al, many rules are being used to control impacts of recreation in Latin America, but in many cas-es the decisions are still based on the concept of recreational carrying capacity. One can ask why this concept is still used, taking to account that we already know that the number of visitors in a certain area is not the main cause of impacts as we have to consider the type and distribution of use and the visitors’ behaviour. One possible

Recreational Impacts on Park Ecosystems
118
answer is the lack of experiments that indicate the relationship between use and their effects on vegetation in Brazilian ecosystems.
What is considered in the present work is that we still need to raise answers to highlight the effects of trampling on Brazilian vegetation communi-ties in order to make better decisions for the con-servation of natural areas.
Study Area
Considering the lack of information on impacts over Brazilian vegetation, this work will analyse the effects of experimental trampling on coast-al sand dune vegetation at “Parque Estadual da Serra do Mar – Núcleo Picinguaba”, located in Ubatuba, São Paulo State, Brazil.
The total area of Picinguaba is 47,000 hectares, including five beaches. The study area (Fazenda Beach) was chosen because it has the reminis-cence of original vegetation in better conditions, has fewer houses and also has low visitation. All these factors contribute to keep the experimental variables under control. The beach is 4 km long, and receives visitor flows on weekends, holi-days and school vacations. Most visitors take a one-day visit, because there are no hotels there. It has a camping area for at about 40 tents, which is only open on holidays and vacation times (in general with no more than a hundred people). The beach receives school and university groups all year long and the park has simple accommo-dations for them.
The coastal sand dune vegetation is very threat-ened in Brazil, especially at São Paulo State where the big cities are concentrated. Urban people frequently go to smaller cities and nat-ural areas to escape from the crowds. As our country doesn’t have a cold winter, the beaches receive tourists all around the year, and the pres-sure on coastal ecosystems is always increas-ing as a consequence of the need to increase the number of tourist infrastructures. The climate in the area can be classified as tropical wet, with no dry period. The mean precipitation is 2,600 mm per year, and the mean temperature 21oC. The coldest period, from May to September, is also the driest one.
We have chosen the left side of the beach to install the samples, at the 800 final meters, where a very small number of visitors just walk around and rare-ly stay. In general people don’t stop by this area because it is far from the entrance, where there are parking spaces, restrooms, showers and the Visi-tor Center.
VegetationThe dunes at the study area are near the shoreline, being susceptible to invasion by waves, which bring and remove sand and other substrates. When sea level is very high (frequently in winter time) the vegetation can be partially destroyed or re-moved, but the rhizomes and roots are generally kept in soil, which contributes to a quick regen-eration.
The sand dunes’ vegetation is composed mainly by herbs like Hydrocotyle bonariensis, Blutaparon protulacoides and Ipomea pes-capre, and grasses like Panicum racemosum and Stenotaphrum secun-datum. In the transition to the fixed dunes, where there are more bushes than herbs, we can find some vines like Mikania cordifolia. The most frequent bush species in the area are Dalbergia ecastophy-lum and Sophora tomentosa, which form a contin-uous cover on the ground. Among these herbs we can find some characteristic treelets like Schinus terebentifolius, Rapanea umbellate and Rapanea ferruginea. There is also an alien tree species on the beach (Terminalia catapa).
Methods
To evaluate the effects of trampling on coastal sand dune vegetation, permanent plots were used. Five replications of 1,5 m x 5 m were located on the sand dunes, on areas with no evidence of human impacts, as suggested on the protocols of Cole and Bayfield (1993). The sample design was systemat-ic, sorting the first sample and locating the plots in regular intervals. Each replication consists of six lanes delineated at the corners by stakes. The lanes were 0,5 wide, separated by a buffer of 0,4 m, both 1,5 m long (the entire extension of the replication). The treatments were randomly located (control, 25 passes, 75 passes, 250 passes, 500 passes and 1,000 passes) on each sample, in the 0,5 m x 1,5 m lanes (Cole & Bayfield 1993). We have standardized

Recreational Impacts on Park Ecosystems
119
the weight and the type of shoes (tennis) of the tramplers (Cole & Bayfield 1993), as most ex-perimental studies do. The trampling impact was done at once as suggested by Cole and Bayfield (1993). Trampling treatments were applied at the end of the growing season, on March, the end of summer season, the most visited period on this park. Trampling in this season simulates vege-tation changes due to more intensive use in this period of the year. The period with more visitors starts on late December and generally finishes on early March, period of summer vacation end-ing with Carnival holydays. This is considered the better period for beach tourism, not only be-cause it’s vacation time, but also considering it’s the hottest period of the year and the warmest water temperature.
Measurements were taken on two 30 x 50 cm sub-plots, located adjacent to each other, on each treatment (Cole & Bayfield 1993). The parame-ters measured were:
1. Visual estimates of the vegetation cover of each species
2. Visual estimates of bare ground;
3. Measures of vegetation height.
4. Species composition;
5. Species frequency.
The data were collected before trampling, im-mediately after, 15 days after, 3, 6 and 9 months after and 1 year after trampling. Most papers on trampling effects assess the measures just 15 days and one year after trampling. It was decid-ed to take intermediate measures because the community appeared to have a quick recovery.
Data Analysis
As suggested by Cole and Bayfield (1993), the evaluated variables were the community relative cover and relative height.
1. Relative cover (RC): based on the sum of the coverage of all species after trampling, over the initial cover, corrected by a factor that takes the variation of the control plots into account. It is cal-culated for each treatment as follows:
2. Relative Height (RH): similarly to relative cov-er, it is based on the mean of height measures af-ter trampling and for each treatment. The relative height is calculated in a similar way as relative cover:
A Friedman test was used to assess if there were significative differences among the treatments. When any significative difference (p-value= 0,05) was detected, comparison tests were employed between control and each treatment and between each pair of treatments.
Results and discussion
1. Vegetation cover
After the data analysis, it was possible to figure out that the relative cover was mostly affected for the two first measurements (right after trampling and 15 days after it - Figure 1)
The treatment of 1,000 passes showed less cover reduction than the 500 one, considering the mea-surement right after trampling, but there were no statistical differences between them. After 15 days, there were no differences at all. We consid-er that the initial differences between these treat-ments may be a reflex of the species composition, because some species are less resistant than others. These results contribute to the presupposition that there is a weak o linearity between impact and use. After 500-passes, we can double the interference and the vegetation behaviour is still the same.
After one year, the cover differences in the treat-ments were not visible anymore. The same vege-tation response was found by Cole (1995), for 18 vegetation types in the USA.
RC = surviving cover on trampled subplots x cf x 100% initial cover on trampled subplots
Where:
cf = inital cover on control subplots surviving cover on control subplots
RH = mean height of each treatment x cf x 100% initial height on the same treatment
Where: cf = initial height on control subplots height of survivors on control subplots

Recreational Impacts on Park Ecosystems
120
Some species were more vulnerable than others. Grasses like Panicum racemosum were more re-sistant, and the vegetation area where this specie dominates appears to absorb more impact. Lid-dle (1988) suggests that the grasses’ morphology is really more consistent than the dicotyledon-ous. The author points out that some of the most important features that give resistance to grass-es are the rhizomatous or stoloniferous main stems with growing points near the surface of the ground, its frequent branching and the per-
sistent meristems at the base of the leaves, what was observed in this species. The vegetation cover regeneration has occurred in no more than 3 months, what shows the high resilience of this vegetation type (figure 1). Some treatments have even increased the cover after trampling. Liddle (1988) reports that some research has found this pattern, a little increase on vegetation cover and biomass in areas with low trampling intensities. For the author drifts in species composition may explain this increase.
Trampling intensity
Rel
ativ
e C
over
- R
C (%
)
0
20
40
60
80
100
120
140
160
Control 25 75 200 500 1000
Right after 15 days after
3 months after 6 months after
9 months after 1year after
0
20
40
60
80
100
120
140
Control 25 75 200 500 1000
Right after
15 days after
0
20
40
60
80
100
120
140
Control 25 75 200 500 1000
Right after
3 months after
0
20
40
60
80
100
120
140
160
Control 25 75 200 500 1000
Right after
6 months after
0
20
40
60
80
100
120
140
Control 25 75 200 500 1000
Right after
9 months after
0
20
40
60
80
100
120
140
160
Control 25 75 200 500 1000
Right after
1 year after
Figure 1: Relative vegetation cover of the coastal sand-dune, right after, 15 days, 3 months, 6 months, 9 months and 1 year after tram-pling application.
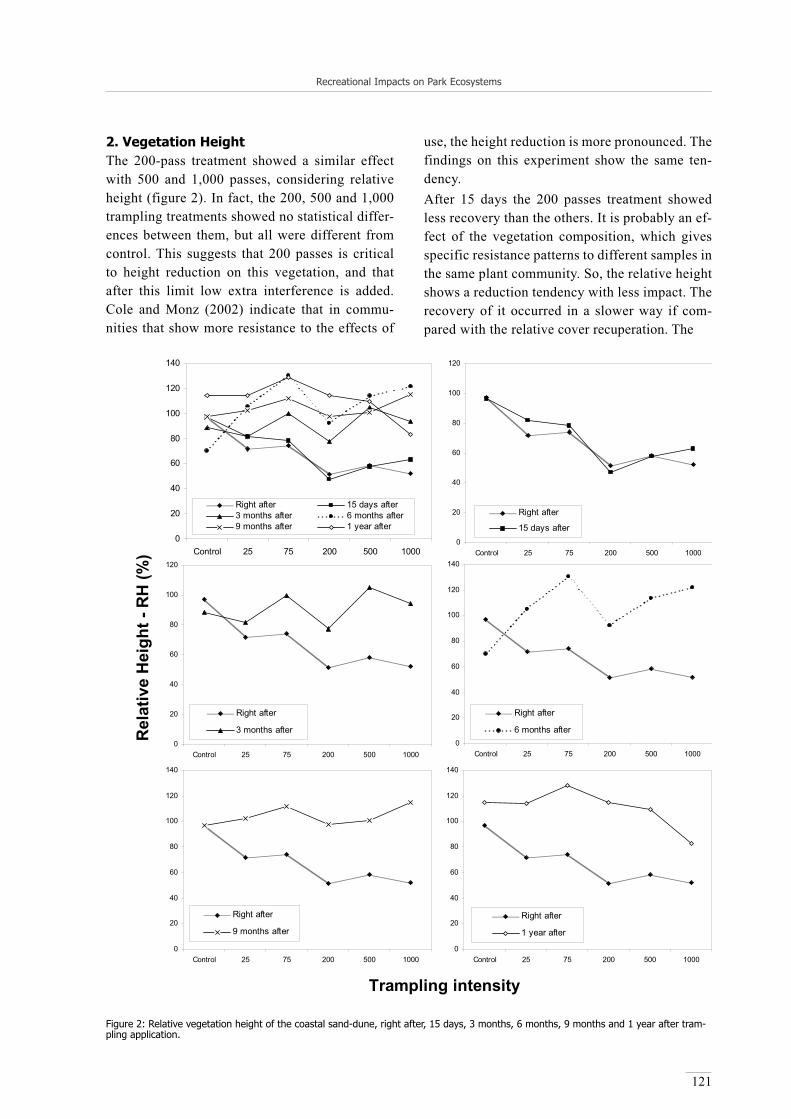
Recreational Impacts on Park Ecosystems
121
2. Vegetation HeightThe 200-pass treatment showed a similar effect with 500 and 1,000 passes, considering relative height (figure 2). In fact, the 200, 500 and 1,000 trampling treatments showed no statistical differ-ences between them, but all were different from control. This suggests that 200 passes is critical to height reduction on this vegetation, and that after this limit low extra interference is added. Cole and Monz (2002) indicate that in commu-nities that show more resistance to the effects of
use, the height reduction is more pronounced. The findings on this experiment show the same ten-dency.After 15 days the 200 passes treatment showed less recovery than the others. It is probably an ef-fect of the vegetation composition, which gives specific resistance patterns to different samples in the same plant community. So, the relative height shows a reduction tendency with less impact. The recovery of it occurred in a slower way if com-pared with the relative cover recuperation. The
Trampling intensity
Rel
ativ
e H
eigh
t - R
H (%
)
0
20
40
60
80
100
120
140
Control 25 75 200 500 1000
Right after 15 days after3 months after 6 months after9 months after 1 year after
0
20
40
60
80
100
120
Control 25 75 200 500 1000
Right after
15 days after
0
20
40
60
80
100
120
Control 25 75 200 500 1000
Right after
3 months after
0
20
40
60
80
100
120
140
Control 25 75 200 500 1000
Right after
1 year after
0
20
40
60
80
100
120
140
Control 25 75 200 500 1000
Right after
6 months after
0
20
40
60
80
100
120
140
Control 25 75 200 500 1000
Right after
9 months after
Figure 2: Relative vegetation height of the coastal sand-dune, right after, 15 days, 3 months, 6 months, 9 months and 1 year after tram-pling application.
Recreational Impacts on Park Ecosystems
122
same situation was observed by Cole and Bayfield (1993), in three different sub-alpine communities in the USA.
Areas where the species Blutaparon portulacoides dominates showed less resistance. These findings may suggest that heavy visitor use should be con-ducted into the areas where grasses dominate.
Conclusions
The results indicate that maybe the chosen param-eters (vegetation cover and vegetation height) are not appropriate to evaluate the trampling impacts in such a vegetation type, because sand dunes al-ready have a high level of natural disturbance and recovery every year, associated with the dynamics of the area. As the community passes through nat-ural stress, such as high tidal variations in winter, with substrate and vegetation removal, they have strategies to survive and to recover very quickly, showing a good resilience.
Reductions in height occurred with less impact than in cover. Probably the first effect of tram-pling for this vegetation type is a decrease in rel-ative height. Similar patterns were found in other researches in the US.
The statistical analysis could demonstrate that the relation between impacts and amount of use is not very linear. After these findings we truly believe that we must reconsider the recreational carrying capacity usage for protected areas in Brazil.
This way, we consider that changes in composi-tion of species can be more accurate to determine the limits of acceptable changes for this plant com-munity, especially the extinction of rare species and the introduction of alien ones. This thought comes from the findings on this research, because although the community recovery was quick, there was species composition drift after the impact.
References
Bates, G.H. (1935). The vegetation of footpaths, sidewalks, car-tracks and gateways. In: Journal of Ecology (23), p 469-87.
Cole, D.N. & Bayfield, N.G. (1993). Recreational trampling of vegetation: standard experimental procedures. In: Biological Conservation (63), p 209-215.
Cole, D.N. & Monz, C. A. (2002). Trampling disturbance of high-elevation vegetation, Wind River Mountains. In: Artic, Antartic and Alpine Research (34/4), p 365-376.
Cole, D.N. (1995). Experimental trampling of vegetation. I. Relationship between trampling intensity and veg-etation response. In: Journal of Applied Ecology (32), p 203-214.
Liddle, M.J. (1988). Recreation and the environment: The ecology of recreation impacts. Section 2. Vegetation and wear. AES Working Paper 1/88. Griffth Univer-sity.

123
Protected Areas and New Paradigmsof Regional Development
Ingo Mose (Chair)

Siegrist, D., Clivaz, C., Hunziker, M. & Iten, S. (eds.) (2006). Exploring the Nature of Management. Proceedings of the Third International Conference on Monitoring and Management of Visitor Flows in Recreational and Protected Areas.
University of Applied Sciences Rapperswil, Switzerland, 13-17 September 2006. Rapperswil.
124
Integrated Conservation Processes – A Tool for Reducing Conflicts in Area Conservation Processes
Ingrid Bay-Larsen1, Ronald Bjøru2, Svein Morten Eilertsen2
& Gunn Elin Fedreheim1
1Nordland Research Institute, [email protected]
2Bioforsk, [email protected]
Keywords: Integrated conservation process, use – protection conflicts, use – use conflicts, stakeholders, business de-velopment, local participation.
Introduction
In the field of area management, controversies and conflicts appear according to different interests, values, rights and facts. A wide range of stakehold-ers, like commercial interests, property owners, in-digenous people, environmentalists, hikers, author-ities at different levels and sectors, as well as the local community, promote strong rights and inter-ests according to area resources along the Norwe-gian coastline as well as the mountain landscapes and rural regions. In addition, disputes regarding local vs. national governance and management of common lands, amenities and biodiversity have a long history. The governance and management of protected areas hence suffer from conflicts occur-ring at different levels, i.e.:
Interests, i.e. commercial vs. non-commercial interests
Fundamental values from which area planning and management should be outlined.
Different right holders (property owners, vs. public right to access) and undefined prima-facie rights.
Factual contradictions.
Sectoral planning, including contradictive na-tional authorities (i.e. land use, vs environment, vs. fisheries/aquaculture, vs. rural and local de-velopment), and regulatives (Plan and Building Act vs. Nature conservation act).
The different conflicts can be divided into use-protection conflicts, which mostly occur between local communities and municipalities on the one side, and centralized environmental authorities and environmental organisations on the other, and conflicts between traditional and new utilisation of protected outfields and common land (use-use conflicts).
Whereas the former has long history and is well-known (and established) the latter one is expected to increase over the next decade as commercializa-tion of the outfields, including protected areas, was politically agreed upon in 2003 [St.prp.65 2002-2003]. In that sense, new actors as well as new ways of commercial exploitation of area resourc-es are being introduced on land and shorelines all over Norway. Authorities responsible for area management as well as coastal and rural develop-
Local communities/ Traditional use
Nature conservation New business activity Figure 1: Different interacting interests in protected areas.

Protected Areas and New Paradigms of Regional Development
125
ment should be aware of the changing dynamics between i.e. different economical agents and the local communities, as well as between protection authorities and different user interests.
As figure 1 shows, there are reasons to believe that, due to an expected increase in both conservation and commercial activities, future conflicts may ap-pear between the three different parties: traditional users, conservation interests and new business.
Here we would focus on a particular approach within area planning, namely integrated conserva-tion and county planning processes, and the way that this approach seems to facilitate both nature protection as well as coastal and rural develop-ment. IUCN (International Union for Conservation of Nature) has emphasized the need for partner-ships between local communities and conservation authorities. We believe that approaches like this will both strengthen the relationship between con-servation and user interest, and reduce the conflicts that may appear in conservation processes. We will also present an ongoing project, which greatly will emphasize this integrated approach.
Traditional conflicts both in conser-vation processes and in protectedareas
Use-protection conflicts Conflicts regarding protection of nature have long traditions in Norway. For many rural and coastal communities it is perceived as a paradox that area protection, which excludes the locals from exploit-ing the areas, should be the sufficient tool for pres-ervation, since careful use of the areas in many oc-casions is the reason for why the site has become worthy of protection. Clearly, many of the protec-tion-use conflicts express concern over economi-cal loss and ability to govern private property or commonly used land. For two of the municipalities taking part in the integrated plan processes, more than 50 and 75 per cent of the area will be protect-ed according to the Nature Conservation Act. This may clearly represent a heavy burden for sparsely populated communities fighting against decreas-ing population and a scarce labour market. When establishing national parks or “the 100m protec-
tion zone” along the shoreline, property owners have to withold large areas for collective purposes like ecosystem preservation, outdoor life and rec-reation.
In addition to economical and household interests, conservation conflicts may also reflect a more fun-damental and value-laden disparity connected to the value of nature. According to environmental ethics nature may be of instrumental, inherent or intrinsic value for people. Whereas nature is con-ceptualised as something of inherent value by the international environmental community [UN 1992] like i.e. biodiversity, nature clearly also is consid-ered as something of instrumental value, that is, valuable because it supports people. Hence area management may suffer from dissension accord-ing to what values or ends are at stake; is it the cul-tural landscape or wilderness? Is it the ecological mechanisms or the maximisation of yield? Both lo-cal communities and private property owners are provoked by central government and NGOs that do impose negative impacts on them (i.e. restrictions on land use), in order to realise their particular vi-sions for nature use and management, without tak-ing into account that their visions not necessarily correspond to local values. Moreover, the values protected by international environmental conven-tions are sometimes expressed as absolute values in the sense that they are “right” and/or true.
Authorities at different levels (local, regional and national) may also be considered as stakeholders in these processes as they have duties they aim to fulfil through area planning. Area protection is the main tool for the Ministry of Environment to ful-fil national and international obligations regard-ing i.e. protections of biodiversity and natural her-itage for future generations. At the same time, the Ministry of Agriculture or Ministry of Fishing may have strong interests in the area, resulting in clash of national interests and regulations at a local lev-el. The regional and local potential to plan holisti-cally is therefore constrained by national sectoral planning.
Finally, concepts of knowledge and unsettled judi-cial regimes also complicate the picture. For exam-ple, people may disagree according to the factual basis onto which protection measures are decided, like the number of predators or fish, the calculated

Protected Areas and New Paradigms of Regional Development
126
probability for species extinction, or the environ-mental impact from increased traffic or physical installations. This brings into account differences between local and scientific knowledge. Unsettled regulations may also represent a problem for use of area resources. In Sámi regions this is of fun-damental concern, like i.e. Tysfjord municipality where Sámi people claim their rights to land and waters on the basis of ILO convention 169. The County Governor on the other hand, pursues the Nature Conservation Act as the tool to regulate ar-eas of conservation interests.
Use-use conflictsEven though protective measures may hinder eco-nomical development and local management of area resources, there is not necessarily a contra-diction between business activity and nature pres-ervation. Area protection may be of great benefit to both traditional businesses and new, innova-tive activities. For example, will area intensive businesses like reindeer herding, rough grazing, and ecotourism welcome regulations that prevent technical interventions and fragmentation of land-scapes (roads, installations etc). Protection may also be beneficial to businesses in coastal and ma-rine areas, i.e. for the fishing industry (spawning ground), fishing tourism, and aquaculture. “Na-tional parks” are being marketed worldwide and have become important branding for the tourist industry as well as i.e. different niche-products.
However, a peaceful relationship between author-ities and commercial agents does not seem to be sufficient for economical development to take place, as economical actors also need to relate to other right-holders, including other businessmen and -women. In Norwegian mountain National parks a considerable amount of economical activ-ity is taking place, and particularly tourist busi-nesses are accelerating. However, conflicts ap-pear, both among different tourist operators in the same area, and between the tourist industry and local community.
An integrated approach
Area management encompasses different prior-ities of different parties. Additionally, it seems clear that both business interests and conser-
vation interests need local legitimacy for ful-filling their aims. This confirms the need for a participatory and integrated approach within area management, that is suited to resolve dis-putes and conflicts, not only between conser-vation regimes and local communities, but also between new innovative business approaches and traditional ways of exploiting coastal and mountain areas.
In Northern Norway several conservation pro-cesses emphasizing local participation and pub-lic partnership are taking place at present. Dur-ing the last five years, the County Governor in Nordland (CGN) has established three partner-ships with regional/local authorities (county municipality and/or municipality). These pro-cesses combine conservation and county area planning into one process, and aim at develop-ing sustainable, holistic area plans that bene-fit both conservation and user interests. While the CGN has the over-all responsibility for the development of conservation regulations, the county municipality is supposed to promote business interests during the planning process. Additionally, all stakeholders are invited to join different fora, i.e. working groups on busi-ness activity, outdoor-life, culture, history and the like. Property owners are asked to register any use- or spatial preference they may have in the particular area. Compared to convention-al conservation processes, these integrated ap-proaches clearly undertake a new design for area conservation as it includes a wide range of stakeholders. County plans on the other hand, have longer traditions for including stakehold-ers i.e. throughout the implementation of the Norwegian Plan- and Building Act among oth-ers.
Preliminary results stemming from follow re-search and evaluations of the three plan pro-cesses indicates that the level of conflicts be-tween national authorities and local community is lowered, and that confidence between the conservation and user interests has increased. This might have connection to other results like i.e:
1. A wide range of stakeholders take part in the combined processes.

Protected Areas and New Paradigms of Regional Development
127
2. A lot of information about the areas has been possessed through impact assessments and in-clusion of local knowledge.
3. The stakeholders have increased their knowl-edge about one another; their views, interests, rights etc.
4. The processes have worked out as meeting plac-es and facilitated the exchange of information; facts about the area, commercial ideas, planning traditions within different legal frameworks etc.
5. A list of initiatives for facilitating economical development has been developed.
6. Financial funds for realising business projects have been established.
The processes in Nordland aim at highlighting new commercial possibilities connected to protected ar-eas and opens up for regulative adjustments so that conservation instructions do not restrict economi-cal actors unnecessarily. Though conflicts between different user interests, in particular between rein-deer husbandry and hiking/outdoor-life, have been excessively debated, it seems as though the pro-cesses in general stimulate cognitive and norma-tive matters, like understanding and confidence, as well as economical and instrumental factors like financial funding and concrete innovative mea-sures.
The partnerships between the two authoritative bodies at the regional level have clearly balanced the planning processes according to the many user interests (i.e. economical and private interests) as these have been represented at the uppermost level of the planning process by the municipality and county municipality. Moreover, the delibera-tive approach, including the many stakeholders in the area, has facilitated meeting places where con-flicting issues as well as common interests have been debated. Exclusion and closed decision mak-ing fora may effectively promote speculations and misunderstandings in situations where parties suf-fer from lack of trust and confidence. On the other hand, a robust and reliable relationship between the governing and governed parties is not automatical-ly gained simply by gathering people in a meeting. To attain a compromising and flexible dialogue, the many issues at stake need to be articulated and de-bated. It seems as though this has been the case for
the three processes in Nordland, and that the pro-cesses have contributed to both procedural legiti-macy, as well as several benefits in the meaning of increased knowledge (in a broad sense), less time and resource-demanding conflicts, entrepreneurial and innovative measures, as well as improved in-frastructure at the regional level.
PROBUS – Protected areas as resources for coastal and rural business development:
The facilitating efforts made (i.e. projects on infra-structure and innovation policies) have not yet led to concrete results, probably due to scarce tradi-tions and knowledge in the local community, about developing new niches like ecotourism. This indi-cates that a judicial framework for commercialisa-tion is not enough for entrepreneurial performance to take place, and that innovative aims also depend upon viable ideas and entrepreneurial abilities and performance.
Integrated conservation processes and their impli-cation on business development in protected areas will be evaluated through the PROBUS – project. Questions remaining to answer are, amongst oth-ers:
Can deliberative processes serve as a tool for re-solving area conflicts and conflicts due to social and institutional features?
How do business actors participate in the con-servation processes, and what do they do to af-fect decisions?
Looking upon the integrated conservation process-es is only one of four main goals with the proj-ect. The others are linked to gaining knowledge of commercial activity in relation to protected areas, evaluating formal and informal institutions and their role in business development, and obtaining knowledge on area-conflicts between nature con-servation, traditional use and new business devel-opment.
The project aims will be fulfilled with the com-bination of several methodologies, both qualita-tive and quantitative approaches: case studies, fol-low-studies, surveys, interviews, investigation of sources and GPS-monitoring. The project has cho-sen four cases, representing all the three northern-most counties in Norway. The cases vary in size

Protected Areas and New Paradigms of Regional Development
128
and how developed the conservation process is, and they also vary in conservation status. By follow-up studies it is possible to evaluate the integrated processes and include observations in conservation processes: meetings and the role of business ac-tors. In monitoring the business activities in these areas, the project will use surveys to measure the legitimacy of new businesses or protective regula-tions. Interviews will be used to get a deeper and more complete understanding, and of main interest here are reindeer herders, farmers, public agencies and the established fora in the on-going planning processes. The investigation of sources will mainly focus on the process documents from the conser-vation planning procedures. These documents are kept by the county governor in each county. GPS-monitoring will be used to log the movements of reindeer, hikers/tourists, hunters, boats etc.
The project’s main objective is to improve the lev-el of knowledge on how different factors influence the possibilities for business development in the protected areas. We expect the results to contrib-ute to an integrated model for future area manage-ment, encompassing commercial development in protected areas. The time period for the project is from 2006 to 2009.

Siegrist, D., Clivaz, C., Hunziker, M. & Iten, S. (eds.) (2006). Exploring the Nature of Management. Proceedings of the Third International Conference on Monitoring and Management of Visitor Flows in Recreational and Protected Areas.
University of Applied Sciences Rapperswil, Switzerland, 13-17 September 2006. Rapperswil.
129
Visitor Management and Destination Management as Tools for Sustainable Regional Development
Niek M.A. Beunders
Breda University of Applied Sciences, the Netherlands
Keywords: Visitor management, local community, sustainable regional development, sustainable tourism develop-ment, destination management, supply chains, biodiversity, conservation.
Introduction
This paper explores the interdependency between protected areas (PA’s) and the regions in which they are located. Processes of change in the rural world are not only a threat to the sustainability of the economy and the quality of life of communities that live from agriculture, forestry or fishing, but equally jeopardize biodiversity and affect protect-ed areas. Rural areas, their communities and nature conservation could have a common stake in find-ing models of sustainable development.
Tourism is gaining acceptance as a tool for sus-tainable development. Visitors to protected areas could contribute significantly to support the econ-omy of PA’s and rural communities. The challenge is to define the role of visitor management (VM) in sustainable regional (tourism) development and to come to a strategic approach to implement this role successfully. The possibility to connect visitor management to the innovative concept of Tourism Destination Management is explored.
In order to understand the mutual dependency be-tween successful conservation management and sustainable rural tourism development, a closer look at the challenges that rural areas and PA’s have in common can be useful. Areas with high ecologi-cal values are often located in relatively remote ru-ral areas. Many traditional and natural landscapes survived mainly due to their remoteness. Unfavor-able conditions for modern farming and forestry have been able to sustain only a limited local pop-ulation, for whom traditional land use was not so much a choice, but a necessity. Those isolated ar-eas also have never been able to create attractive
conditions for investments in other sectors. That leads to a situation where the desire of rural com-munities to have access to modern life standards could easily be neglected. Rural areas are con-fronted with an exodus, because the traditional ag-ricultural activities were no longer competitive on globalizing markets and because the quality of life was no longer attractive to young and talented peo-ple. Land abandonment seems to go side by side with intensification of farming and forestry. The remaining farmers are forced to comply with mod-ern efficiency standards that require an increased use of herbicides, pesticides and heavy machinery, which in their turn require bigger plots of land, that are not compatible with the small scaled character of the landscape that biodiversity requires. Forest-ry and other rural activities face similar processes of intensification. If unemployment rates and pov-erty are growing, the pressure of the local popula-tion on the natural resources will only increase.
While the establishment of a protected area is a great step forward from the conservation point of view, it deprives the local population of a part of its resources and sets limits to traditional activi-ties with an important economic and social func-tion (hunting, grazing, logging). PA’s that were not successful in accommodating communities inter-ests by creating economic alternatives tend to suf-fer from practices that under the new regime have become illegal: hunters become poachers and con-flicts arise.
Although tradition is not always a guarantee for ecological sustainability, traditional land use forms part of the conservation of biodiversity. The lack

Protected Areas and New Paradigms of Regional Development
130
of economic sustainability of this land use has become a common threat to protected areas and rural communities.
If areas are sparsely populated and their econom-ic value decreases, the temptation to use them for high impact activities like construction of tour-ism resorts and ski slopes, infrastructure, storage of nuclear waste, mining, logging or hydro-en-ergy projects increases. Although these develop-ments in big part take place outside the protect-ed area boundaries, their impact on conservation can be huge. At the same time these activities are usually not under the control of communities and do not sustain the rural economy.
Biodiversity does not stop at the boundaries of protected areas: many species depend on a healthy, natural environment and ecological cor-ridors. The future of nature conservation is con-nected to the future of the countryside. Conser-vation depends on conservation of a rural way of life and on a healthy rural economy. The in-sight that protected area management should be based on good, pro-active relationships with its environment is gaining ground1 . Stakeholder in-volvement and community involvement have be-come new standards in conservation.
Protected areas often share with rural commu-nities a need to enhance economic sustainabili-ty. New models for sustainable regional develop-ment should be based on establishing economic and social links between PA and environment. Given the limitations for economic activities that sensitive landscapes and protected areas of-fer, sustainable tourism development has become an accepted strategy for conservation2, although there still is limited empirical evidence of its ef-fectiveness3.
This paper advocates an approach in which a pro-tected area could be a catalyst for regional de-velopment. Tourism can only play a role in this process if the region has sufficient potential to
1 E.g.: Arthur and Mc Hall, Integrated Heritage Management;Denman. R, The Tourism Company, WWF Guidelines for Community-based Eco-tourism Development, 2001. http://assets.panda.org/downloads/guidelinesen.pdf.
2 E.g.: WWF, IUCN, Europarcs, EU.
3 Tourism according to definitions includes staying overnight and thus requires a more complex infrastructure than visitor management. Its economic impacts and benefits are also bigger, since staying overnight includes a higher spending. Every tourist is a visitor once entering the PA, but not every visitor is a tourist.
become a successful tourism destination. Visitor management can be an important tool to maxi-mize the contribution of tourism/ visitor flows to sustainable development and conservation. In or-der to play that role effectively, a strategic ap-proach is required.
Methods
This paper is based on the experiences of the au-thor as a consultant in the field of sustainable tour-ism development in protected areas and in rural ar-eas and on desk research.
Before the role of visitor management can be as-sessed and a strategic approach to this new role can be presented, some major challenges for sustain-able tourism development are identified:
1. From the perspective of regional development, tourism is in the first place an economic activi-ty that has to meet criteria of feasibility, strategic planning, successful marketing, business develop-ment and proper management.
2. Tourism development will have to be integrated in an overall perspective of sustainable develop-ment. Integration of tourism in the local economic and social structures requires due attention.
3. Sustainable Tourism Development requires a highly professional approach. Rural communities, PA management, NGO’s and other stakeholders of-ten lack the expertise and resources to develop and manage a successful tourism destination.
4. Expectations about the feasibility of tourism de-velopment have to be based on an objective assess-ment of tourism potential, human resources and stakeholder support.
5. Although PA’s can be considered to be a crucial part of the tourism potential of destinations, few protected areas can be considered to be a “stand alone” destination. The success of tourism depends on the ability of the wider region to develop into a competitive destination.
6. Tourism consists of many different markets that share one characteristic: they are highly competi-tive. Tourism will only be able to generate the ex-pected benefits if the right market segments are targeted. Expected benefits are high, while the car-

Protected Areas and New Paradigms of Regional Development
131
rying capacity is usually fairly low. Unfortunate-ly protected areas attract a variety of market seg-ments and some protected areas have to deal with mass tourism and with negative tourism impacts. An example: the eco-tourism4 market targets tour-ists with a specific interest in nature and culture. Yet this market is far from homogeneous: pre-ferred activities range from bird watching to high risk adventure. There is a fierce competition be-tween suppliers and between destinations. In-creased mobility makes destinations in different countries and even different continents to di-rect competitors. Tropical rainforest experienc-es, for example, are offered in countless desti-nations worldwide.
7. Rural tourism destinations and eco-tourism destinations usually do not have a very pro-nounced tourism profile that distinguishes them from their competitors. Tourism accessibility is often low due to the remoteness. There is a dis-persed, small scale supply of tourism products and services. Since the average professional ex-pertise of suppliers is low it is hard to offer a quality product. Many different suppliers and stakeholders are involved and a good structure for co-operation and co-ordination is lacking.
These challenges make clear that only long term strategies, based on an integrated approach and proper management to implement these strate-gies, will generate the expected results. Without such a strategy tourism will have little chance to be a sustainable activity that generates the eco-nomic, social and ecological benefits expected. The role of local communities, craftsmen and entrepreneurs and the use of local resources seem to be underestimated.
Tourism Destination Management (TDM) is a comprehensive strategic approach to make a destination competitive and to manage and mar-ket it properly5 . A tourism management organi-zation with a clear mandate from all stakehold-ers should be set up in order to formulate and implement a sustainable tourism strategy. A ma-
4 Responsible travel to natural areas tat conserves the environment and im-proves the well-being of local people (The Ecotourism Society, www.ecotourism.org).
5 Beunders N. Framework for the development of a tourism destination man-agement introduction training course for managers in the tourism industry, June 2004 (Unpublished document for the Slovene State Secretary of Tourism).
jor task is to turn the dispersed supply of tour-ism products and services into a coherent and attractive product. Engagement of PA manage-ment in TDM implies a proactive role of a pro-tected area in destination development and a co-operation with tourism stakeholders. It gives management a say in decision making process-es on tourism development and land use of the wider region. TDM offers new perspectives for the applications of visitor management systems at a larger scale, while enhancing the quality of the visitor experience, reducing negative im-pacts and planning the expected socio-econom-ic benefits for conservation and local commu-nities.
In this approach visitor management (VM) ex-pands across the PA borders and aims at a struc-tured co-operation with the wider region. Al-though the focus will be on the economic role of VM, benefits for more traditional functions like interpretation are obvious.
A VM plan should forms part of the overall management plan and contribute significantly to its conservation objectives. If the PA assumes a role in regional sustainable development, this role will have to be specified in objectives.
As table 1 shows, visitor management con-sists of many possible products and services and yet the inventory is far from complete and not adapted to local conditions. Although from a management perspective these elements are likely to be perceived as tasks, they also can be perceived as services or ‘products’ to the visi-tor and to the destination. This prevents the sit-uation where the PA is one of the core attrac-tions of the destination and is investing heavily in quality services for visitors, but is not bene-fiting from tourism revenues. The question is, how these benefits can be made tangible and who is going to pay a fair price for these servic-es. Tasks and responsibilities, costs and benefits have to be clearly defined.
These ‘products’ have to be integrated in a sys-tematic way in the tourism products that the destination offers. Synergy with other suppliers and with the destination as a whole should be assessed. This leads to efficiency, cost reduc-
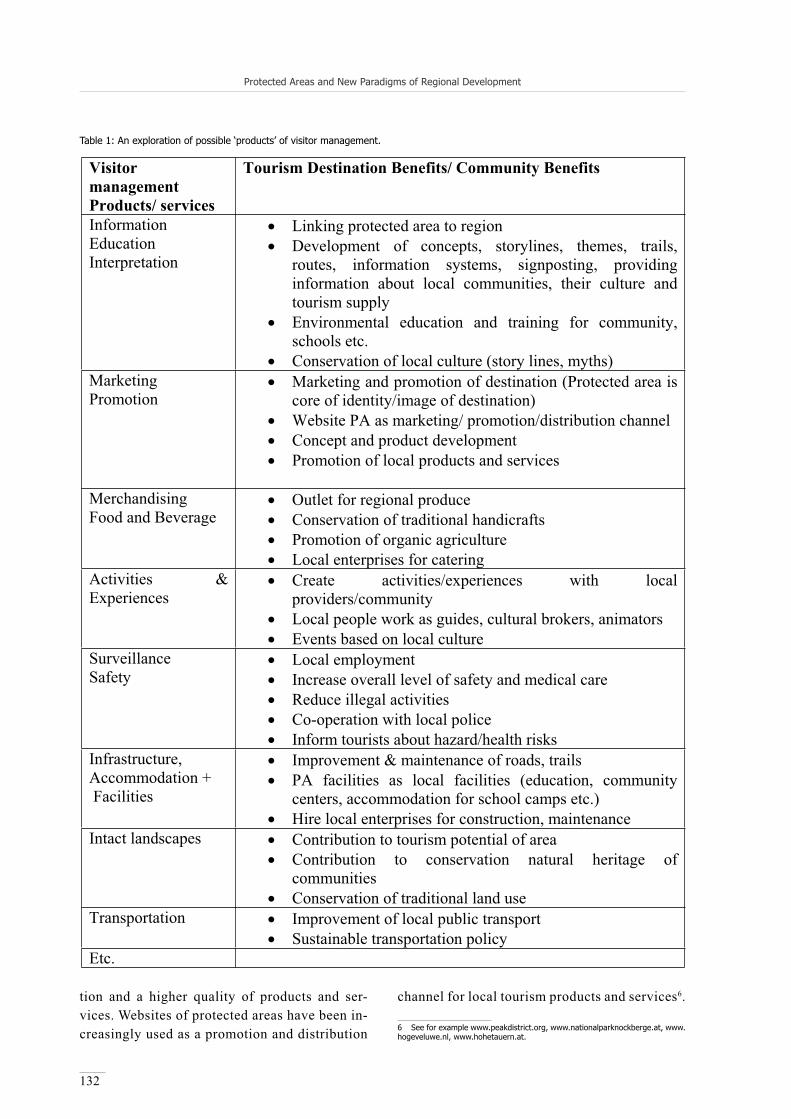
Protected Areas and New Paradigms of Regional Development
132
tion and a higher quality of products and ser-vices. Websites of protected areas have been in-creasingly used as a promotion and distribution
channel for local tourism products and services6.
6 See for example www.peakdistrict.org, www.nationalparknockberge.at, www.hogeveluwe.nl, www.hohetauern.at.
VisitormanagementProducts/ services
Tourism Destination Benefits/ Community Benefits
Information EducationInterpretation
Linking protected area to region Development of concepts, storylines, themes, trails, routes, information systems, signposting, providing information about local communities, their culture and tourism supply Environmental education and training for community, schools etc. Conservation of local culture (story lines, myths)
MarketingPromotion
Marketing and promotion of destination (Protected area is core of identity/image of destination) Website PA as marketing/ promotion/distribution channel Concept and product development Promotion of local products and services
MerchandisingFood and Beverage
Outlet for regional produce Conservation of traditional handicrafts Promotion of organic agriculture Local enterprises for catering
Activities & Experiences
Create activities/experiences with local providers/communityLocal people work as guides, cultural brokers, animators Events based on local culture
SurveillanceSafety
Local employment Increase overall level of safety and medical care Reduce illegal activities Co-operation with local police Inform tourists about hazard/health risks
Infrastructure, Accommodation + Facilities
Improvement & maintenance of roads, trails PA facilities as local facilities (education, community centers, accommodation for school camps etc.) Hire local enterprises for construction, maintenance
Intact landscapes Contribution to tourism potential of area Contribution to conservation natural heritage of communitiesConservation of traditional land use
Transportation Improvement of local public transport Sustainable transportation policy
Etc.
Table 1: An exploration of possible ‘products’ of visitor management.

Protected Areas and New Paradigms of Regional Development
133
Maybe the most significant contribution of the PA to regional development is the development of new concepts, products and services. The PA has in the eye of the potential visitor and con-sumer a high brand value that represents intact nature, exciting nature based experiences, qual-ity, reliability and safety. Some protected areas have turned their logo into a quality brand for local (tourism) products and services. The PAN Parks logo is being awarded to local businesses that have a partnership with the PA.
In order to maximize the benefits for the local economy, VM should make use of the concept of Local Supply Chains. A Supply Chain com-prises the suppliers of all the goods and servic-es that go into the delivery of tourism products to consumers7. A Local Supply Chain focuses on local suppliers. A methodology similar to qual-ity certification systems could analyze the steps of the production process of all products to see if optimal use is made of local resources. Simul-taneously other sustainability and quality crite-ria can be applied to make sure that production processes meet high standards.
If the use of local resources is limited, an analy-sis should be made of the local potential.
Training programs, business support and (mi-cro) credits can help to increase local involve-ment.
Results
Experiences in the field show a need for new and practical methods in the interfaces of visi-tor management, sustainable tourism develop-ment and destination management. The con-cepts mentioned lack consensus of definitions and a sound theoretical framework based on em-pirical research.
Emerging tourism destinations around protect-ed areas have serious problems to formulate and implement integrated approaches. A lack of know how from PA management, staff, local communities, stakeholders and NGO’s seems to be a major bottleneck.
7 Tapper, R. & Font,. X.: Tourism Supply chains, Report of a Desk Research Proj-ect for the Travel Foundation, Leeds, no date (www.leedsmet.ac.uk) p.3.
Despite the need for further elaboration and empir-ical research, the benefits of the approach could be considerable:
The tourism potential of protected areas will be more diverse. Even hard core eco-tourists can enjoy the charm of couleur locale and small her-itage elements linked to their nature experience. The options for product diversification increase. Integration of protected area and environment increases the quality of the experience of the vis-itor. Authenticity is a prime motive for eco-tour-ists. Local people providing distinctive tourism services and products, are ambassadors of the lo-cal culture and have a value added for the tour-ism experience. The sense of place is enhanced by tasting of regional products, by following old trading routes, trails of shepherds and pilgrims, learning about survival skills and economies long gone.
An attractive gamma of activities and facilities can increase the length of stay and the average spending per tourist/day. Visitors that stay over-night become tourists, according to definitions. They spend significantly more than day visitors; not only on accommodation, but also on food and beverage, souvenirs and local products. Increas-ing the length of stay reduces transportation, in-creases income and creates a more profound ex-perience. Contacts with residents develop more spontaneously and tourists develop a sense of ownership to the area. This can also stimulate re-peat visits and word to mouth publicity.
Visitor management that makes use of the nat-ural and cultural resources of the whole region makes zoning systems more efficient. Land-scapes outside the PA can be very attractive to visitors, while being less sensitive to negative impacts.
The cultural identity of local communities can be strengthened by linking their cultural heri-tage and their way of life to the site and the land-scape. The community’s stewardship to the land-scape and its role in shaping and maintaining it should be emphasized. Storylines and themes can be developed based on community input. This will increase the community’s sense of ownership for the PA.

Protected Areas and New Paradigms of Regional Development
134
This approach offers unique opportunities for interpretation: reading the landscape through the eyes of the community brings a landscape to life and creates a thorough understanding of the landscape, its ecology, its history and its cultur-al dimensions. The human dimension makes in-terpretation of natural values more accessible. Living landscapes have a higher tourism poten-tial than landscapes that merely are open air mu-seums.
Communities can have an active role in visitor management. Community members, if properly trained, can be excellent guides, hosts in visitor centers, rangers, cooks, waiters and managers. Maintenance of facilities, landscape and visitor infrastructure offers another opportunity. Land-scape elements like old paths can be conserved by proper tourism use. Conservation of natural and cultural heritage and income generation go hand in hand.
Cultural events and festivals reflect and enhance the local identity, while at the same time they are unique tourism attractions. They facilitate spontaneous and real contacts between locals and visitors.
Market access is a key problem for people in ru-ral areas. Although local produce is often dis-tinctive, of high quality and organic, local pro-ducers do not have the knowledge and means to get to the right markets. Visitor centers and websites seem to be good promotion- and distri-bution-channels for local products, but also for local accommodation and services like guiding, bike- and horse rent etc. Visitor management can bring the consumer to the producer, but also the producer to the consumer. Marked routes can include providers of local products and ser-vices and thus stimulate business development or sustain existing local businesses that are of-ten vital to the quality of life of the community (pubs, shops). Direct sale brings producer and consumer in direct contact. Local traditions of-fer good interpretation tools. Craftsmen give demonstrations and sell their products. Products with a soul. Products for guests that have a great story to tell, because they discovered a very spe-cial place…
References
European Commission. Directorate-General for Enterprise, Tourism Unit. (2003). Using natural and cultural heri-tage to develop sustainable tourism in non-traditional tourist destinations. Luxemburg
Bramwell, B. & Lane, B. (1993). Interpretation and Sus-tainable Tourism: The Potentials and Pitfalls. In: Jour-nal of Sustainable Tourism (1/2).
Hall, M. & McArthur, S. (2000). Integrated Heritage Man-agement. London.
Ritchie, J.R.B. & Crouch, G.I. (2003). The Competitive Destination, A sustainable tourism perspective. Oxon.
Schouten, F., Beunders, N., Landre, M. & Barten, C. (2005). Managing Visitors: helping the frail to prevail. Breda.

Siegrist, D., Clivaz, C., Hunziker, M. & Iten, S. (eds.) (2006). Exploring the Nature of Management. Proceedings of the Third International Conference on Monitoring and Management of Visitor Flows in Recreational and Protected Areas.
University of Applied Sciences Rapperswil, Switzerland, 13-17 September 2006. Rapperswil.
135
Socio-Cultural Benefits of Pan Parks: Case Study at Bieszscady National Park, Poland
Stuart P. Cottrell & Jana Raadik
Colorado State University, USA
[email protected]@lamar.colostate.edu
Keywords: Sustainable development, dimensions, prism of sustainability, protected areas, PAN Parks.
Introduction
World Wildlife Fund’s Protected Area Network (PAN Parks) aims to balance tourism and nature conservation via partnerships with conservation or-ganizations, travel agencies, business communities and other groups on a local, national and interna-tional level. For PAN Park’s verification, a protect-ed area must meet five principles each with specif-ic criteria (i.e., nature values, habitat management, visitor management, sustainable tourism develop-ment strategy, and business partnerships) (PAN Parks, 2005).
There are eight PAN Park locations including Rus-sia, Finland, Sweden, eastern European countries and Italy with new parks targeted for verification in 2007. A sustainable tourism strategy is necessary to combine tourism’s potential and socio-economic development with overall nature conservation goals of protected areas (Cottrell & Cutmisu, 2006). PAN Park’s principles include guidelines to develop and implement a Sustainable Tourism Development Strategy. Bieszscady National Park (BNP) in Po-land was verified as a PAN Park in 2002.
The goal of this pilot study was to develop mon-itoring of the socio-cultural benefits of PAN Park status for communities and tourism development at BNP. The central question was Does PAN Parks benefit socio-cultural development in PAN Park lo-cations? A local PAN Park advisory group devel-oped a sustainable tourism development strategy to link the park to tourism development in the re-gion.
Methods
Both qualitative and quantitative methods were used in the pilot-study conducted over a 5-day period in November, 2005. Eighteen semi-struc-tured interviews were conducted among stakehold-ers representing BNP staff, local authorities, PAN Park business partners, tourism businesses, and NGOs to represent the PAN Parks region. Inter-views explored tourism development, sustainabil-ity of tourism in the context of socio-cultural, eco-nomic, environmental and institutional capacity building and the role of PAN Parks on beliefs about sustainable tourism development. Interviews were conducted in Polish by an interpreter with transla-tions made directly onsite. A five-page self-admin-istered questionnaire with both English and Polish versions was administered among 36 stakehold-ers involved in tourism to solicit responses about familiarity with PAN Parks, PAN Parks status of BNP, participation in tourism planning, tourism to BNP, satisfaction with tourism development, and socio-demographics. Study participants were se-lected by the local PAN Parks coordinator via tele-phone a few days prior to the interview period to make an appointment.
Criteria for selection were based on sector repre-sentation (e.g, park employee, accommodation, tour operator, local government) and availability. The prism of sustainability, a holistic framework of sustainable development, was used as the theo-retical lens to examine the economic, socio-cultur-al, environmental and institutional aspects of

Protected Areas and New Paradigms of Regional Development
136
tourism development (see Eden et al., 2000; Span-genberg & Valentin, 1999). As a pilot study, limita-tions were lack of representation of actors besides tourism or park related interests.
Results
Results of both methods were compiled to assess the socio-cultural benefits of PAN Parks. For the qualitative, a partnership for sustainable develop-ment among stakeholders was evident supporting an overall vision of sustainable tourism develop-ment. PAN Park certification contributed most to environmental protection and an improved com-munity attitude toward nature conservation. So-cio-cultural aspects for the community were not-ed as public outreach, environmental education, promotion of the arts, and sustainable develop-ment of the region. Open communication between the park and local communities received mixed re-ports indicating a need for further awareness build-ing among local residents. From the quantitative survey, stakeholders familiar with PAN Parks gave higher satisfaction scores for the cultural, econom-ic and environmental aspects of sustainability than did those who did not know about it. Respondents overall were not very happy with the quality of tourism development in the region with more than 50% not satisfied.
Conclusion
PAN Parks with its sustainable tourism develop-ment strategy process is viewed as a driving force for sustainable development combining protect-ed area concern for environmental protection with active involvement of tourism businesses. Al-though cause/effect (PAN Parks concept) cannot be claimed, perhaps those stakeholders familiar with the ideals supported by PAN Parks have a bet-ter understanding of what sustainable tourism in-volves; consequently they tend to value the impor-tance of the various aspects of sustainability more than those people not informed about PAN Parks. The PAN Parks Foundation will begin the system-atic monitoring of the socio-economic aspects of PAN Parks certification at verified national parks across the various protected area sites.
References
Cottrell, S.P. & Cutumisu, N. (In Press 2006). Sustainable tourism development strategy in WWF Pan Parks: Comparison between a Swedish and Romanian Na-tional Park. In: Scandinavian Journal of Hospitality and Tourism (6/2).
Eden, M., Falkheden, L. & Malbert, B. (2000). Interface. The Built Environment and Sustainable Development: Research Meets Practice in a Scandinavian Context. In: Planning Theory & Practice (1/2), p 259- 284.
PAN Parks (2005). http://www.panparks.org.
Spangenberg, J.H. & Valentin, A. (1999). Indicators for Sustainable Communities. Wuppertal Institute for Cli-mate, Environment and Energy. The Prism of sustain-ability. http://www.foeeurope.org/sustainability/sus-tain/t-content-prism.htm

Siegrist, D., Clivaz, C., Hunziker, M. & Iten, S. (eds.) (2006). Exploring the Nature of Management. Proceedings of the Third International Conference on Monitoring and Management of Visitor Flows in Recreational and Protected Areas.
University of Applied Sciences Rapperswil, Switzerland, 13-17 September 2006. Rapperswil.
137
Fostering Sustainable Regional Development withIndicator Based Certification Procedures
Vicente Carabias-Hütter1, David Kümin1 & Dominik Siegrist2
1Zurich University of Applied Sciences Winterthur, [email protected]@zhwin.ch
2University of Applied Sciences Rapperswil, [email protected]
Keywords: Sustainable regional development, indicators, certification procedure, Label region, check lists, Swiss Regional Dashboard.
Abstract: Sustainable regional development is the long-term aim of alpine landscape and habitats. Therefore, areas with high ecological qualities and sufficient socio-cultural potential, but insufficient economical subsistence will have to develop into respective ‘Label regions’. An adequate implementation strategy should be supported by a reliable in-dicator system, which finally will lead to certification procedures for regional management. With the certification, ‘La-bel regions’ are identified and gain an advantage on the market for sustainable tourism.
Introduction
Sustainable development is rooted in Switzer-land’s Federal Constitution as one of the goals of public-sector action. Taking the ‘Sustainable De-velopment Strategy 2002‘ and the relevant legis-lation as specific points of reference, the Swiss Federal Office for Spatial Development (ARE) has put the importance of sustainability to spa-tial development in concrete terms. The ARE’s thinking concentrates on key aspects of sustain-able development: Socioeconomic elements, ur-ban development, land usage and mobility. The assumption is that sustainable spatial develop-ment in this sense will have a positive knock-on effect on sustainability as it relates to other sectoral policies, such as the conservation of the countryside, areas of particular historical or cul-tural importance and biodiversity (ARE 2005).
Given the concept of sustainability as the rele-vant normative base of regional development, the value-reduction of traditional alpine landscapes in terms of production mode has to be seen as a possible negative impact on sustainability which finally will lead to new regional policy strate-gies.
Furthermore, state subsidies are continuously de-creasing in Switzerland. That is why Boesch et al. (2003) proposed a new typology of alpine regions (Fig. 1) which enables a more efficient focussing of the scarce public funds. In this new typology, intensely used alpine regions should not get subsi-dies anymore, because their high value added en-ables them to survive in the market by themselves. On the other side, depleting regions characterised by decreasing value added and ongoing depopu-lation should not get subsidies anymore too, be-cause for these problems subsidies are not an effi-cient instrument. Certified ‘Label regions‘ (Fig. 1) may well be a solution in order to focus the scarce public funds to locations and activities with a max-imum promotion of sustainable development. In addition, ‘Label regions‘ will have a market ad-vantage, e.g. in nature-based tourism or in quality agricultural products. Also, in the context of gov-ernmental sustainability strategies, they can obtain state transfer payments more easily due to the ap-proved efforts for sustainable regional develop-ment.
In this context, the key question to be answered is: What would a future certification system for these Label regions look like?

Protected Areas and New Paradigms of Regional Development
138
Goals
The intended main result of this Swiss research project (Boesch et al. 2003) was to come up with regional policy recommendations, with the long-term objective of contributing to a sustainable de-velopment of alpine regions. The core element is outlining the concept of ‘Label region’, both in the context of justification (i.e. reasoning about trends, aims and goals) and in the context of operation (i.e. establishing operational tools, like indicator-based certification procedures).
Implementation
Through a sustainability goal analysis and comple-mentary Delphi-expert questioning an adequate set of indicators for sustainable regional development has been set up. From the plethora of certification systems a performance- and a process-oriented one have been selected as the most useful for the pur-pose of indicator-based sustainable regional devel-opment. With this selection not only the most im-portant orientations (performance and process) of certification systems are covered but also the dif-ferent ways of controlling quality (self-assessment and public control).
Statistical values for indicators are mostly not avail-able or are only processed with difficulty. Norma-tive values for indicators are often not readily at hand and cannot be ‘retrieved’ without difficulty (depending on the societal and political context). Should the availability of data actually advance to
the critical volume, then the enquiry into, and as-sessment of sustainable regional development by means of check lists (in which indicators are in-cluded in question form) would have to be taken into account, which would in turn be carried out by independent auditors.
An integral goal and indicator set for the three di-mensions – society, environment, and economy – is particularly suited for the task of transferring the concept of sustainable development at regional level. Amongst other things, indicators are able to depict space-oriented and socio-economically rel-evant facts.
Depending upon the certification system that is fi-nally adopted and the data situation on a regional level, sustainability indicators will have to be put into action in different ways.
In a process-oriented certification system, the continual improvement of sustainable regional development will have to be verified. For self-declaration, check lists can be used to assess the indicators development.
In a performance-oriented certification system, data for each single sustainability indicator will have to be retrieved for comparison with com-parable regions, with a certain time frame and/or with the threshold value needed to keep.
A combination of the strengths of both certification systems is in our opinion the most suitable solution for the identification of ‘Label regions’ as thereby the participation of the concerned region as well as the accuracy of performance data are guaranteed.
'Intensely used Region''tr
ansf
ers '
:st
ate
subs
i die
s
0'Depleting Region'
POLICY
MARKETvalue added
'Label-Region'
What would a future certification system look like?Status quo
'Intensely used Region''Intensely used Region''Intensely used Region''tr
ansf
ers '
:st
ate
subs
i die
s
0'Depleting Region''Depleting Region''Depleting Region'
POLICY
MARKETvalue added
'Label-Region''Label-Region''Label-Region'
What would a future certification system look like?Status quo
Figure 1: New typology of alpine regions (Boesch et al. 2003).
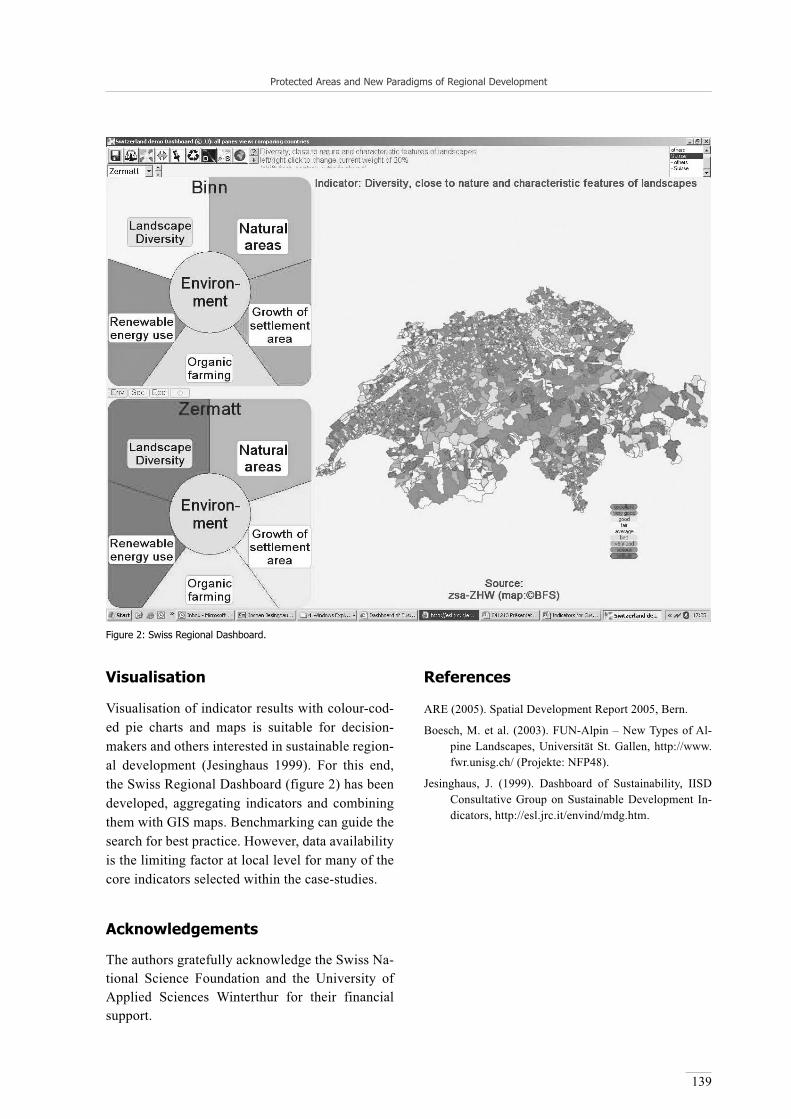
Protected Areas and New Paradigms of Regional Development
139
Visualisation
Visualisation of indicator results with colour-cod-ed pie charts and maps is suitable for decision-makers and others interested in sustainable region-al development (Jesinghaus 1999). For this end, the Swiss Regional Dashboard (figure 2) has been developed, aggregating indicators and combining them with GIS maps. Benchmarking can guide the search for best practice. However, data availability is the limiting factor at local level for many of the core indicators selected within the case-studies.
Acknowledgements
The authors gratefully acknowledge the Swiss Na-tional Science Foundation and the University of Applied Sciences Winterthur for their financial support.
References
ARE (2005). Spatial Development Report 2005, Bern.
Boesch, M. et al. (2003). FUN-Alpin – New Types of Al-pine Landscapes, Universität St. Gallen, http://www.fwr.unisg.ch/ (Projekte: NFP48).
Jesinghaus, J. (1999). Dashboard of Sustainability, IISD Consultative Group on Sustainable Development In-dicators, http://esl.jrc.it/envind/mdg.htm.
Figure 2: Swiss Regional Dashboard.

Siegrist, D., Clivaz, C., Hunziker, M. & Iten, S. (eds.) (2006). Exploring the Nature of Management. Proceedings of the Third International Conference on Monitoring and Management of Visitor Flows in Recreational and Protected Areas.
University of Applied Sciences Rapperswil, Switzerland, 13-17 September 2006. Rapperswil.
140
Large Scale Protected Areas + Tourism = Regional Development?
Hubert Job, Daniel Metzler & Manuel Woltering
Ludwig-Maximilians-Universität München, Germany
[email protected]@bwl.uni-muenchen.de
Keywords: Large Scale Protected Areas, regional economic impacts, value-added analysis.
Abstract: The results of this research clearly indicate that tourism in Large Scale Protected Areas can generate con-siderable benefits for the regional economy, especially in peripheral and structurally disadvantaged regions. For in-stance, in Mueritz National Park it is estimated that guests whose key motivation for visiting was the brand ‘National Park’ (a share of nearly 44% of all 390 000 visitors in 2004) created the equivalent of 261 full time job equivalents. In Berchtesgaden National Park only about 10% of 1.13 million visitors in 2002 have been attracted by the Protected Area brand, generating about 206 jobs. In the regions of Hoher Flaeming and Altmuehltal 211 respectively 483 jobs were created by Nature Park related tourism. But in the latter cases these impacts are largely not ascribable to the sta-tus as a Protected Area.
As indicated by this research, more importance should be attached to the issue of tourism in Large Scale Protected Ar-eas. Financial benefits of tourism in National Parks and Nature Parks may contribute to increasing acceptance of na-ture conservation. Therefore decision-making processes in nature protection and regional tourism policy need to more fully incorporate aspects of durable economic development. Therefore decision-making processes concerning nature protection and tourism policy need to more fully incorporate the concept of sustainability, whether with regard to na-ture-based and ecotourism in Protected Areas in general, or with specific regard to Nature Parks and conservation as well as development of cultural landscapes therein.
Introduction
What kind of regional economic benefits can tour-ism induce in National Parks and other Protected Areas? This is the central question of our confer-ence contribution.
On an international level Protected Areas have rep-resented most important tourism destinations for a long time, notably the category of National Parks e.g. in North America, Africa or Australia. Only recently, in Central Europe Large Scale Protect-ed Areas have been integrated into tourism plan-ning strategies as part of a holistic approach that seeks to account for both economic and ecological well-being. The regional economic impacts on lo-cal communities as a result of tourism in Protected Areas are of particular importance, although they cannot be covered sufficiently because of data gen-
erating problems. So far this topic formed the fo-cal point of interest of only a few research studies (Küpfer 2000, Job et al. 2003) which can hardly be compared because of their different methodologi-cal approaches. For this reason a Research and De-velopment project funded by the German Feder-al Ministry of Environment was carried out in one National Park and two Nature Parks during 2004 in Germany. The target was to generate a standard-ized procedure for estimating the economic ben-efits of tourism in Large Scale Protected Areas. The introduced method of a value-added analysis could be a basis for future studies with respect to the comparability of their results.
This contribution is structured as follows: section II deals with the economic perspective on Large Scale Protected Areas in general, while section III explains the relationship between Large Scale Pro-

Protected Areas and New Paradigms of Regional Development
141
tected Areas and tourism in detail; section IV intro-duces the method used for estimating the econom-ic impacts and section V then shows the results of the case studies; section VI discusses the outcomes and section VII finally gives a short summary and some reasoning for future research.
Large Scale Protected Areas in aRegional Economic Perspective
In principle Large Scale Protected Areas are a kind of public good characterized by their non-exclud-ability as well as their non-rivalness, i.e. it is not possible to exclude an individual from their con-sumption. Furthermore there does not exist any process of price-building in the market for these goods as it is common for private goods (e.g. clothing, furniture). Hence it is difficult to deter-mine the financial value of public goods, e.g. of a National Park.
Economic values of Large Scale Protected Areas comprise different components: use values and non-use values. The latter are characterised by the dependency of their revenues on the direct ‘utili-sation’ of the reserve like forestry. Use values can be further distinguished in three types of values: the so-called existence values are closely associ-ated with the intrinsic significance of nature. They reflect the benefit of knowing that the Large Scale Protected Area exists even though the probability of visiting the Protected Area or getting direct use of it in another way is quite low. Rather similar are the intentions of the bequest values which refer to the will of some people to protect e.g. special nat-ural phenomena for future generations. At last the option values are also related to the future possibil-ities of using Large Scale Protected Areas respec-tively their resources, e.g. because of its biodiver-sity as an untested gene pool for pharmaceutical or agricultural products (WCPA 1998).
Within the use values a distinction has to be made between direct and indirect ones: While the latter comprise primarily ecological functions like e.g. avalanche or watershed protection, which are usu-ally unmeasured by any market, the former are of particular interest for a local economy. Amongst others they include activities such as agriculture, hunting, recreation and tourism – values derived
from the direct use of a Large Scale Protected Area. The focus of the following case study will be on this last issue, i.e. on the direct use values and especially the economic effects created by tourism investigated in terms of a value-added-analysis.
Large Scale Protected Areas and Tourism
Large Scale Protected Areas are normally charac-terised by a size of more than 10 000 ha and an established full time management. Their prima-ry function is the conservation of valuable nature landscapes, but also of man-made environments which are not in excessive use. In Germany there are three categories of Large Scale Protected Ar-eas: National Parks (IUCN category II), Biosphere Reserves (VI) and Nature Parks (V). In princi-ple Protected Areas categorised this way are pro-vided with positive attitudes. Especially National Parks represent a well-known brand standing for intact nature landscapes, one of the most important unique selling propositions in tourism nowadays. That is why beside their original dedication nearly all Large Scale Protected Areas are used in a more or less touristic fashion.
In general the relationship between nature conser-vation and tourism can be seen as ambivalent: on the one hand tourism is often based on a sound en-vironment, whereas on the other side unmanaged tourism may affect natural processes adversely. In spite of the numerous drawbacks, tourism can also have some positive effects on the nature. On the part of the local population missing accep-tance for the goals of nature conservation often can be found. Many inhabitants of buffer zones of Large Scale Protected Areas feel that they are re-stricted in their private, but also job-related actions through the conservation restrictions. Positive eco-nomic impacts and possibilities to participate in tourism-related jobs and income help to show that regions with Large Scale Protected Areas do not necessarily end up as black holes of economic de-velopment. Therefore tourism represents an oppor-tunity to conserve endangered ecosystems while it may also have positive effects on regional devel-opment. Because of their mostly peripheral posi-tion – mostly within economically laggard regions

Protected Areas and New Paradigms of Regional Development
142
– it is thought about Large Scale Protected Areas as a conscious instrument for sustainable develop-ment, even in Central Europe (e.g. Hammer 2001). For this reason the main emphasis of regional stud-ies on the impacts of tourism are their effects on in-come and employment.
With a value-added analysis it is possible to esti-mate the effects, which emanate from special sup-plies – in our case: Large Scale Protected Areas. Added value thereby means the sum of wages, sal-aries and profits. For the calculation, results of vis-itor counts that comprise total number of visitors as well as structural data on visitors and interviews on expenditures of visitors have to be linked to the detailed analysis of selected companies. The lat-ter is needed to reveal the cost structures of the businesses profiting from tourism demand and provides data on the amount of added value that is gained from touristic turnover. Additionally, to these first-round effects, it is accounted for effects in the second round when directly benefiting com-panies buy inputs from other businesses.
Methods
The application of input-output analysis or similar advanced research methods fail as a result of non-existing appropriate premises like e.g. regionalised input-output-tables and the associated prohibitive expensive data gathering. For this reason one Na-tional Park and two Nature Parks were examined by a value-added analysis within the R&D project (see map 1). The thereby selected Mueritz Nation-al Park in the north-east of Germany represents the central tourist attraction of the region in the south of Mecklenburg-Western Pomerania. Such a dom-inant role of the Protected Area as a destination’s highlight is rarely the case: for instance the alpine Berchtesgaden National Park is just one among several attractions in the region that is one of the oldest tourism destinations in Germany with a tra-dition over 150 years old. The situation in Ber-chtesgaden will also be considered in this paper because of a nearly identical pilot study conducted in 2003 (Job et al. 2003).
Because of the numerous Nature Parks in Germa-ny (95) with their multifaceted structures it is hard to draw general conclusions about this category of
Large Scale Protected Areas. Several factors were included to select the two case study examples Alt-muehltal in Bavaria and Hoher Flaeming in Bran-denburg, e.g. the size of the conservation area or their spatial relation to more densely populated areas. The particular extent of the four investiga-tion areas is defined by the community boundaries: They include all municipalities located within the conservation area and those which are intersected by the boundary of the Large Scale Protected Area. In the case of the National Parks also communities outside the conservation area will be included, if they are adjacent to the territory of the park.
One critical factor of the research is the total num-ber of guests visiting the reservation (both day trip-pers and tourists). In Germany no access limita-tions for Protected Areas exist. Therefore reliable figures about visitor numbers are hard to assess. At the moment only unsatisfying approximate es-timates can be obtained. Especially, for statistical purposes this fact aggravates sound analysis as the basic population is unknown. To solve this prob-lem a random sample survey that is obtained by seasonally distributed counts and short interviews at different sites within the Large Scale Protect-ed Area, accounting for possible activities is advo-cated. Moreover this method covers the ratio be-tween day trippers and overnight staying tourists. The results of the counts in combination with the findings of the short interviews enable a reliable estimation of the touristic turnovers on the basis of the daily expenditures – surveyed in the long inter-views – to all Park visitors. Basis for weighting of the results are temporal, spatial and structural fac-tors as well as parameters caused by the weather.
Altogether eight steps are necessary to calculate the economic impact in terms of full time jobs with the findings of the different surveys: by multipli-cation of the visitor number and the average dai-ly expenditures (differentiated by the varied tar-get groups), the gross turnover of all park visitors can be calculated. Afterwards these total revenues are analysed by the different profiting sectors with their special VAT and value added rates. Thus it is possible to identify the importance of different vis-itor groups for a Large Scale Protected Area. The next step is to estimate the net turnover by subtrac-tion of the VAT from the gross turnover. The direct

Protected Areas and New Paradigms of Regional Development
143
income of the region (i.e. wages, salaries and prof-its) derives from the multiplication of the net turn-over and the respective value added rates. The in-direct effects on income of preliminary businesses have also been calculated in a separate step. The sum of the direct and indirect income effects is the added value within a region and measures the total impact on regional income. At last to get the equiv-alent of full time jobs the total income effects have to be divided by the average regional social income per person. This results in an indicator describing the hypothetical number of individuals who could live on the basis of the income created by tourism in a Large Scale Protected Area.
Results
National Parks Mueritz/BerchtesgadenFor Mueritz National Park about 390 000 visitors could be estimated in 2004, while there were ap-proximately 1.13 million visitors in Berchtesgaden National Park in 2002. The visitors of both reser-vations were divided into two groups with refer-ence to the National Park as the decisive criterion to visit the region (Job et al. 2003). Using this pro-cedure results in a proportion of 44% of Nation-al Park tourists in a narrower sense in the Mueritz region. The other 56% are designated as non-Na-tional Park tourists. 77% of all interviewed visi-tors in the National Park Mueritz knew the cate-gory of the Large Scale Protected Area correctly. Also the question about the role of the status as a Large Scale Protected Area can be assessed posi-tively: for about 57% of the guests the status of a National Park affected their decision to visit the re-gion to a high or very high degree. Rather differ-ent are the findings in this context for the National Park Berchtesgaden: just about 18% of the visitors answered that question in the same way described above. Nevertheless 57% of them knew the right category, although altogether just about 10% of all interviewed visitors could be designated as Na-tional Park tourists in a narrower sense. This se-vere discrepancy in the structure of the visitors can be explained by the different history of the Nation-al Parks, but also because of the very long tradition of Berchtesgaden as an alpine tourism destination where the Park only plays a subordinate role.
All visitors of the National Park Mueritz gener-ate an annual gross turnover of approximately 13.4 million euros. The value added rate for day trippers was about 37%, for the overnight tourists of about 40%. Thus a sum of income (direct and indirect) of 6.9 million euros can be estimated that is caused by tourism in the National Park. About two-thirds of this sum account for the direct side and one-third for the indirect side of income. Taking into account only the National Park tourists in a narrower sense (generating an income of 2.9 million euros) and the average gross regional income per person in the Mueritz region (10 918 euro in 2004), the tour-ism originally induced by the Large Scale Protect-ed Area creates 261 full time job equivalents. The results for the National Park Berchtesgaden are stated as follows: with a gross turnover of about 9.3 million euros and a total added value of 4.6 million euros as well as an average gross regional income per person of 22 500 euros (2002), 206 full time job equivalents are generated by the Nation-al Park tourists in a narrower sense. This less total effect – despite of the more than two-times higher attendance compared to the National Park Mueritz – reflects the rather low share of true National Park tourists in a clearer way.
Nature Parks Altmuehltal/Hoher FlaemingApproximately 300 000 guests visited Hoher Flaeming Nature Park in 2004, whereas this fig-ure is more than three times higher in Altmuehltal (about 910 000 visitors). From a tourism perspec-tive Hoher Flaeming Nature Park is characterized by its proximity to Berlin and therefore the major-ity of day trips (83% share of all trips) are most-ly undertaken from there. With a share of 63% the day trippers in Nature Park Altmuehltal are also the dominant visitor group, but the overnight stay-ing tourists have a greater effect than in Hoher Flaeming. Compared to the category of National Parks in the case of the Nature Parks there is no distinction between the ‘Nature Park tourists’ and ‘non-Nature Park tourists’ because the mostly dif-fuse border will pose problems in the operational-isation.
To estimate the equivalents of full time jobs creat-ed by the complete tourism in both cases, the aver-age gross social income per person in Bavaria (21 214 euros) and Brandenburg (14 182 euros) have
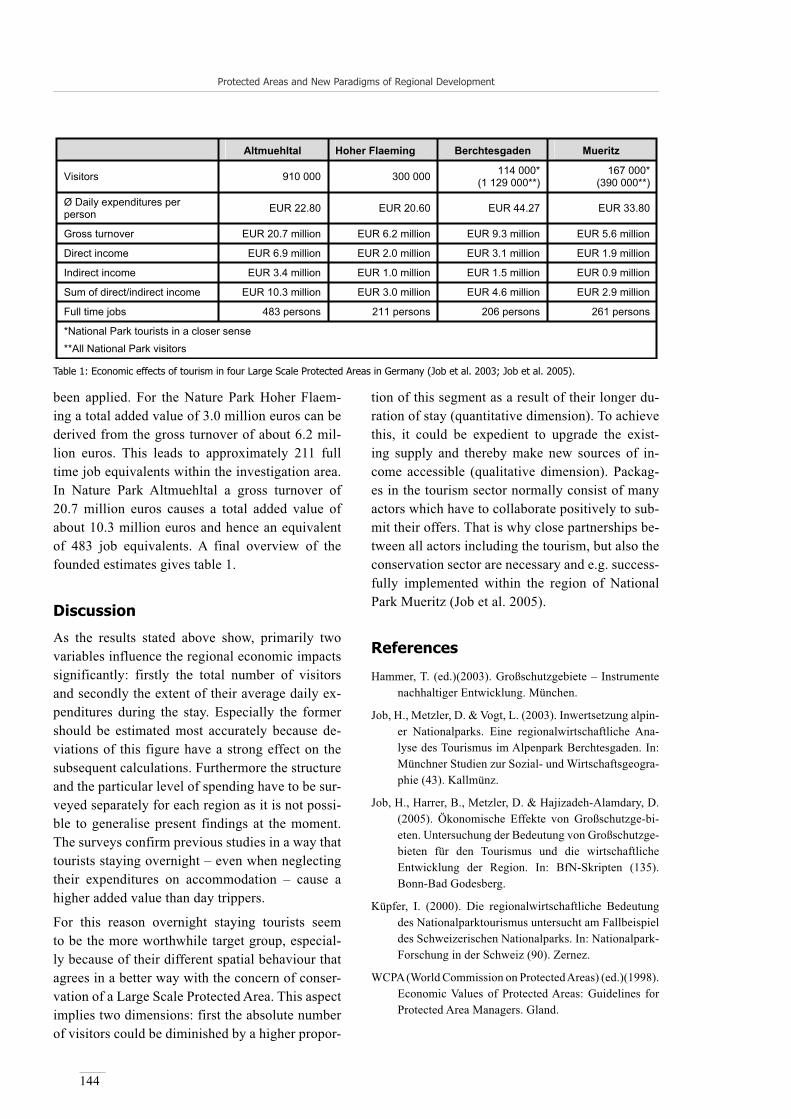
Protected Areas and New Paradigms of Regional Development
144
been applied. For the Nature Park Hoher Flaem-ing a total added value of 3.0 million euros can be derived from the gross turnover of about 6.2 mil-lion euros. This leads to approximately 211 full time job equivalents within the investigation area. In Nature Park Altmuehltal a gross turnover of 20.7 million euros causes a total added value of about 10.3 million euros and hence an equivalent of 483 job equivalents. A final overview of the founded estimates gives table 1.
Discussion
As the results stated above show, primarily two variables influence the regional economic impacts significantly: firstly the total number of visitors and secondly the extent of their average daily ex-penditures during the stay. Especially the former should be estimated most accurately because de-viations of this figure have a strong effect on the subsequent calculations. Furthermore the structure and the particular level of spending have to be sur-veyed separately for each region as it is not possi-ble to generalise present findings at the moment. The surveys confirm previous studies in a way that tourists staying overnight – even when neglecting their expenditures on accommodation – cause a higher added value than day trippers.
For this reason overnight staying tourists seem to be the more worthwhile target group, especial-ly because of their different spatial behaviour that agrees in a better way with the concern of conser-vation of a Large Scale Protected Area. This aspect implies two dimensions: first the absolute number of visitors could be diminished by a higher propor-
tion of this segment as a result of their longer du-ration of stay (quantitative dimension). To achieve this, it could be expedient to upgrade the exist-ing supply and thereby make new sources of in-come accessible (qualitative dimension). Packag-es in the tourism sector normally consist of many actors which have to collaborate positively to sub-mit their offers. That is why close partnerships be-tween all actors including the tourism, but also the conservation sector are necessary and e.g. success-fully implemented within the region of National Park Mueritz (Job et al. 2005).
References
Hammer, T. (ed.)(2003). Großschutzgebiete – Instrumente nachhaltiger Entwicklung. München.
Job, H., Metzler, D. & Vogt, L. (2003). Inwertsetzung alpin-er Nationalparks. Eine regionalwirtschaftliche Ana-lyse des Tourismus im Alpenpark Berchtesgaden. In: Münchner Studien zur Sozial- und Wirtschaftsgeogra-phie (43). Kallmünz.
Job, H., Harrer, B., Metzler, D. & Hajizadeh-Alamdary, D. (2005). Ökonomische Effekte von Großschutzge-bi-eten. Untersuchung der Bedeutung von Großschutzge-bieten für den Tourismus und die wirtschaftliche Entwicklung der Region. In: BfN-Skripten (135). Bonn-Bad Godesberg.
Küpfer, I. (2000). Die regionalwirtschaftliche Bedeutung des Nationalparktourismus untersucht am Fallbeispiel des Schweizerischen Nationalparks. In: Nationalpark-Forschung in der Schweiz (90). Zernez.
WCPA (World Commission on Protected Areas) (ed.)(1998). Economic Values of Protected Areas: Guidelines for Protected Area Managers. Gland.
Altmuehltal Hoher Flaeming Berchtesgaden Mueritz
Visitors 910 000 300 000 114 000* (1 129 000**)
167 000* (390 000**)
Ø Daily expenditures per person EUR 22.80 EUR 20.60 EUR 44.27 EUR 33.80
Gross turnover EUR 20.7 million EUR 6.2 million EUR 9.3 million EUR 5.6 million
Direct income EUR 6.9 million EUR 2.0 million EUR 3.1 million EUR 1.9 million
Indirect income EUR 3.4 million EUR 1.0 million EUR 1.5 million EUR 0.9 million
Sum of direct/indirect income EUR 10.3 million EUR 3.0 million EUR 4.6 million EUR 2.9 million
Full time jobs 483 persons 211 persons 206 persons 261 persons
*National Park tourists in a closer sense **All National Park visitors
Table 1: Economic effects of tourism in four Large Scale Protected Areas in Germany (Job et al. 2003; Job et al. 2005).

Siegrist, D., Clivaz, C., Hunziker, M. & Iten, S. (eds.) (2006). Exploring the Nature of Management. Proceedings of the Third International Conference on Monitoring and Management of Visitor Flows in Recreational and Protected Areas.
University of Applied Sciences Rapperswil, Switzerland, 13-17 September 2006. Rapperswil.
145
Key Success Factors for Nature-Based Tourism in ProtectedAreas of the Alps
Florian Lintzmeyer, Dominik Siegrist & Stefanie Hass
University of Applied Sciences Rapperswil, Switzerland
[email protected]@[email protected]
Keywords: Protected areas, park management, nature-based tourism, Delphi survey, Alpine Convention.
IntroductionThe role of parks in regional development varies widely across the Alps. In some regions, parks have truly become catalysts for economic development, while in others they struggle to make a substantial contribution (see Hammer 2003, 205). When dis-cussing economic benefits created by protected ar-eas, tourism is clearly one of the main branches where these benefits are being generated. Against this backdrop, the survey SUSTOURPARK gath-ers first-hand information from Alpine park manag-ers and tourism representatives on successful park tourism.
MethodsA pool of 78 relevant park managers and tourism representatives from Austrian, French, German, Ital-ian, and Swiss protected areas was identified in co-operation with the Alpine Network of Protected Ar-eas. These experts on park management and tourism in protected areas were then asked to participate in a two-round online-Delphi-survey. While the com-parably small number of 27 returns does not allow representative conclusions, the survey succeeded in identifying important goals and framework con-ditions of park management schemes, trends and needs of park tourism, park-related management tools, and critical factors for success as perceived by experts working in the field.
ResultsIn the eyes of park managers, the most important goals of park management in the Alps are current-ly and in the future the promotion of nature-based
tourism, environmental education, and the promo-tion of sustainable regional development (see fig-ure 1). Traditional core objectives of protected ar-eas such as habitat and species protection are rated as being of secondary importance, which is due to the perception that these goals are safeguarded un-der current circumstances.
In the future, the experts consider scenic landscape, good accommodation facilities at fair prices, guest-houses featuring regional products and good service to be crucial factors in visitors’ decision making processes. In the context of a much voiced call for upgrading tourism facilities in the Alpine region, it is interesting to note that participants of the survey considered park tourism to be mostly directed to-wards simple and middle standard accomodations.
Park representatives are calling on the tourism in-dustry to actively develop products that are tailored to the specific needs of certain target groups. Pro-tected areas, in their eyes, need to be incorporated even more into the regional chain of tourist services and experiences.
However, one still needs to keep in mind that suc-cessful tourism in protected areas is not so much de-fined by increasing visitor arrivals as by ecological and socio-cultural impact mitigation. The quality of the visitor experience thus remains the only unique selling proposition for protected areas in a competi-tive tourism market, while aiming at price compet-itiveness would jeopardize their ecological and so-ciocultural basis.
For implementing these park objectives and re-solving conflicts between conservation and tour-ism, managers have a variety of instruments at their
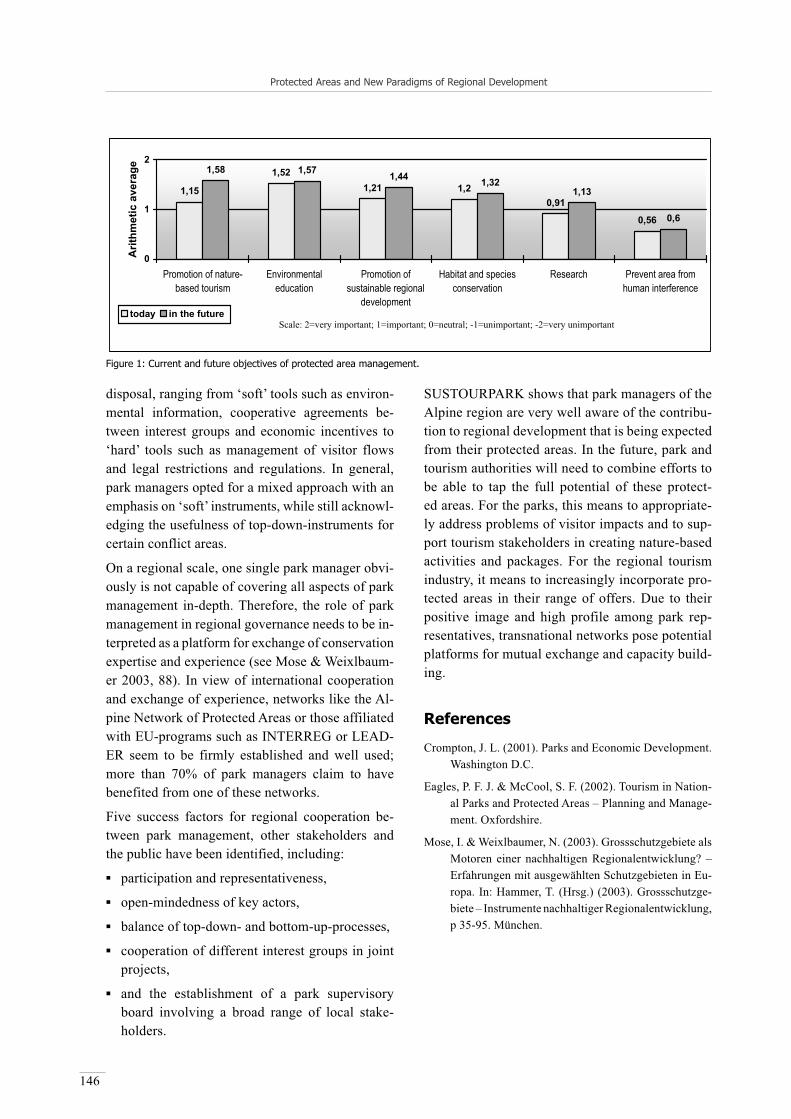
Protected Areas and New Paradigms of Regional Development
146
disposal, ranging from ‘soft’ tools such as environ-mental information, cooperative agreements be-tween interest groups and economic incentives to ‘hard’ tools such as management of visitor flows and legal restrictions and regulations. In general, park managers opted for a mixed approach with an emphasis on ‘soft’ instruments, while still acknowl-edging the usefulness of top-down-instruments for certain conflict areas.
On a regional scale, one single park manager obvi-ously is not capable of covering all aspects of park management in-depth. Therefore, the role of park management in regional governance needs to be in-terpreted as a platform for exchange of conservation expertise and experience (see Mose & Weixlbaum-er 2003, 88). In view of international cooperation and exchange of experience, networks like the Al-pine Network of Protected Areas or those affiliated with EU-programs such as INTERREG or LEAD-ER seem to be firmly established and well used; more than 70% of park managers claim to have benefited from one of these networks.
Five success factors for regional cooperation be-tween park management, other stakeholders and the public have been identified, including:
participation and representativeness,
open-mindedness of key actors,
balance of top-down- and bottom-up-processes,
cooperation of different interest groups in joint projects,
and the establishment of a park supervisory board involving a broad range of local stake-holders.
SUSTOURPARK shows that park managers of the Alpine region are very well aware of the contribu-tion to regional development that is being expected from their protected areas. In the future, park and tourism authorities will need to combine efforts to be able to tap the full potential of these protect-ed areas. For the parks, this means to appropriate-ly address problems of visitor impacts and to sup-port tourism stakeholders in creating nature-based activities and packages. For the regional tourism industry, it means to increasingly incorporate pro-tected areas in their range of offers. Due to their positive image and high profile among park rep-resentatives, transnational networks pose potential platforms for mutual exchange and capacity build-ing.
References
Crompton, J. L. (2001). Parks and Economic Development. Washington D.C.
Eagles, P. F. J. & McCool, S. F. (2002). Tourism in Nation-al Parks and Protected Areas – Planning and Manage-ment. Oxfordshire.
Mose, I. & Weixlbaumer, N. (2003). Grossschutzgebiete als Motoren einer nachhaltigen Regionalentwicklung? – Erfahrungen mit ausgewählten Schutzgebieten in Eu-ropa. In: Hammer, T. (Hrsg.) (2003). Grossschutzge-biete – Instrumente nachhaltiger Regionalentwicklung, p 35-95. München.
1,15
1,521,21 1,2
0,91
0,56
1,58 1,57 1,44 1,321,13
0,6
0
1
2
Promotion of nature-based tourism
Environmentaleducation
Promotion ofsustainable regional
development
Habitat and speciesconservation
Research Prevent area fromhuman interference
Arit
hmet
ic a
vera
ge
today in the futureScale: 2=very important; 1=important; 0=neutral; -1=unimportant; -2=very unimportant
Figure 1: Current and future objectives of protected area management.

Siegrist, D., Clivaz, C., Hunziker, M. & Iten, S. (eds.) (2006). Exploring the Nature of Management. Proceedings of the Third International Conference on Monitoring and Management of Visitor Flows in Recreational and Protected Areas.
University of Applied Sciences Rapperswil, Switzerland, 13-17 September 2006. Rapperswil.
147
Walking towards Concerted Management of Hiking-PathNetworks: A Well Engaged but Tricky Challenge
for French Alpine Protected Areas
Alexandre Mignotte
University of Geneva, Switzerland
Keywords: Hiking paths, mountain protected areas, management, co-operation, stakeholders.
Introduction
Hiking-path networks are intimately related to the rural areas they cross. They are also used by the managers of nature reserves to enhance their ac-ceptance by, and co-operation with, the local and mainly rural areas within which they have been es-tablished. The managerial approach of such net-works is currently based on continual consulta-tion with stakeholders and can be considered as a means of mediating in local-area issues.
The encouragement of collective action is part of an effort to establish co-operation between local areas. This should enable unilateral, fragmented, area-based approaches to be transformed into glob-al, interconnected, negotiated ones in which local areas develop in conjunction with one another.
Nevertheless, whereas different original and suc-cessful initiatives have been set up in many French alpine protected areas, the definition of common objectives regarding the accessibility and the maintenance of these networks is still delicate to implement.
Besides, the different types of concrete interven-tions and strategies developed by protected areas managers and local stakeholders directly concern the visitors of such areas. Actually, these opera-tions influence the way that hikers, climbers, farm-ers, hunters, etc. use the networks while the combi-nation of these operations also contribute to build global monitoring tools like the observatory of the natural reserves of Haute-Savoie (France). This observatory is supplied with many data produced by several surveys addressed to visitors.
The stake of the management of visitors’ flows thus can not be separate from one of the most im-portant goal of protected areas: their integration in the local areas within which they have been creat-ed and their participation to local dynamics (social, cultural, economical, etc.).
Then, the basic but complex question we want to develop here is the following one:
Can hiking path networks contribute to local de-velopment and to enhance local acceptance of pro-tected areas, when these networks form the subject of collective management strategies?
The main objective of this proposition is thus to go through concerted initiatives about hiking-path networks in protected areas and visitor monitoring operations, in order to bring into light some ma-jor methodological trends which may improve the management of protected areas within a local and sustainable development perspective.
Methods and Results
This paper first considers the emergence of parti-cipation and collective action issues in the French territorial planning policy and more precisely in regard to the management of natural protected ar-eas. It implies a brief historical overview of proce-dures and measures adopted and applied both by French institutions and natural protected areas.
These contextual elements introduce the presenta-tion of some strategies developed by protected ar-eas (Natural Reserves of Haute-Savoie, National Park les Ecrins). We will particularly focus on the original and complex device elaborated in the Nat-

Protected Areas and New Paradigms of Regional Development
148
ural Reserves of Haute-Savoie. This tool contrib-utes to a global monitoring of the different users of hiking-paths and more generally of the whole protected areas. Our observations are essential-ly based on textual analysis of discourse obtained from local actors during personal interviews. We also explored the constitution and functioning of management processes and tools by the mean of an active collaboration with managers of protected areas, and thanks to regular participations to field sessions and meetings with technicians and mem-bers of the administrative staff of protected areas.
Finally, this communication reconsiders the effi-ciency of these strategies and interventions aimed at the improvement of the local acceptance of pro-tected areas. It also underlines the importance of a global and regulated management of hiking-path networks, which have to be thought as a major her-itage for local inhabitants as for all types of visi-tors.
References
Beuret, J.-E. (1999). Petits arrangements entre acteurs: les voies d‘une gestion concertée de l‘espace rural. In: Nature, Sciences, Sociétés (7/1).
Kalaora, B. (2003). Concertation, outil ou art de vivre en-semble? In : Montagnes Méditerranéennes (18).
Mermet, L. (1992). Stratégies pour la gestion de l’environnement. La nature comme jeu de société? Paris.
Mignotte, A. (2004). Entre fragmentation et interconnex-ion territoriale. La gestion des réseaux de sentiers en espaces naturels protégés rhône-alpins (Réserves Na-turelles de Haute-Savoie, Parc National des Ecrins, Réserve Naturelle des Gorges de l‘Ardèche). Doctoral thesis Joseph Fourier University, Grenoble.
Mignotte, A. & Vodinh, J. (2003). Quelle démarche globale de suivi pour les réserves naturelles de Haute-Savoie? Réflexions autour de la construction d‘un observa-toire. In: Actes du 9ème Forum des gestionnaires. Les suivis scientifiques pour la gestion des espaces na-turels, Paris, 26/03/2003. Quétigny.

Siegrist, D., Clivaz, C., Hunziker, M. & Iten, S. (eds.) (2006). Exploring the Nature of Management. Proceedings of the Third International Conference on Monitoring and Management of Visitor Flows in Recreational and Protected Areas.
University of Applied Sciences Rapperswil, Switzerland, 13-17 September 2006. Rapperswil.
149
Protected Areas as a Tool for Regional Development?
Ingo Mose1 & Norbert Weixlbaumer2
1University of Oldenburg, Germany [email protected]
2University of Vienna, [email protected]
Keywords: Protected areas, paradigm shift, integrated nature conservation, regional development.
Abstract: The last decades have witnessed significant changes in protected area policies in Europe as well as through-out the world. As a result, the total area set aside has more than quadrupled, and today almost 14 percent of the world‘s ecosystems are protected compared with only about 3 percent in 1970. In Europe, first and foremost, large protected areas with an integrative character gain importance increasingly. Based against this background, this paper on the one hand deals with the multifunctionality of post modern large protected areas as well as with the paradigm shift in pro-tected area policies in Europe. On the other hand this paper analyses the advancement and future perspectives of these policies, and reflects upon the current use of protected areas as tools for a sustainable regional development.
Introduction
In the course of the global debate on sustainabili-ty large protected areas with an integrative charac-ter are becoming increasingly significant. The ex-pectations on protected areas are outgrowing the mere species and area protection functions. The current paradigm shift according to the Durban Ac-cord (2003) demands the simultaneous satisfaction of diverse functions. This change in area protec-tion policy – often seen as progress - bears howev-er a multitude of dangers and unresolved questions respectively: Are all types of natural and cultural landscape represented? Are they adequately pro-tected? Are those that claim to be a model land-scape for sustainable regional development living up to their promise? Are there too many protected areas that exist merely on paper?
What are the formulas to meet these dangers and to find the answers to the unresolved questions re-spectively? In other words, keeping in mind the in-novative paradigm of area protection and regional development, where does the potential of large pro-tected areas lie?
The goal of this paper is to lead to this set of ques-tions and issues. From a theoretical perspective of the paradigm shift this paper should further estab-
lish the basis for discussing the practical examples laid out in the consecutive papers treating area pro-tection policy.
Multi-functionality as a basis for the continued par-adigmatic advancement
Large protected areas based on current scientific knowledge are rarely mono-functionally oriented, but rather often fulfill a multitude of different tasks simultaneously. Today the general consensus is that the following goals and functions, which leave the traditional nature protection paradigm behind, are the center of attention:
• Preservation and advancement of biodiversity – regulatory function
• Regional and supra-regional welfare-effects – habitat function
• Gene pool as well as natural disaster-prevention – support function
• Sustainable regional development – development function
• Environmental education and training – informa-tion function
The multi-functional orientation of large protected areas bears in equal measure enormous challeng-es and substantial conflict-potential. The multitude

Protected Areas and New Paradigms of Regional Development
150
of diverse expectations for these protected areas has great potential to create conflict about the very purpose of beneficial use of the area. This conflict can break out because of opposing interests be-tween the protected area and its surroundings or even due to clashing interests within a protected area. The spatial overlapping of nature protection and tourism or of nature protection and agricul-ture exemplifies this issue. Today, it is therefore all the more important to spatially coordinate and steer the diverse goals and functions with all of the different available tools. This is particularly important when it comes to defining and designat-ing different categories of protected areas.
International and national catego-ries of protected areas – the IUCN category VThroughout the world the role of protected ar-eas is covered by very diverse nationally and re-gionally protected area concepts. Europe on its
own is covered with protected areas of great – oftentimes confusing – diversity. In Germany there are for instance eleven different types of protected areas (cf. Büchter & Leiner 2000), in Austria there are twelve (cf. ÖROK 1997, 18). In order to increase internationally the trans-parency and at the same time the comparability of protected areas with regards to their goals, the IUCN developed a worldwide category-sys-tem of protected areas.
If one examines the spatial dimension of each category in Europe, the significant predomi-nance of Category V becomes a striking fact (protected landscapes) by taking up the larg-est surface ratio by far (cf. figure 1). Even if, according to the official IUCN-diction, all six categories are considered to be of equal rel-evance, one cannot deny a certain image-hi-erarchy between the different categories. In contrast to the prestigious and financially lu-crative Category II (national park), the Cate-
Figure 1: Distribution of the IUCN categories of protected areas in Europe (Chape et al. 2003, 40).

Protected Areas and New Paradigms of Regional Development
151
gory V (protected landscape) receives only lit-tle attention (the reasons for this see: Mose & Weixlbaumer 2006).
The ‘lack of clarity’ with regard to the national and international categories of protected areas can be especially well exemplified with the Cat-egory V. According to the IUCN this category describes a protected area, “the management of which is mainly oriented towards the protection of a landscape or a marine area and also serves recreation” (EUROPARC & IUCN 1999, 30). It is an area, “where the interaction of man and na-ture has formed a landscape of a particular char-acter over the course of time, with outstanding aesthetical, ecological and/or cultural values and oftentimes exceptional biological diversity. The undisturbed continuation of this traditional interaction is vital for the protection, conserva-tion and enhancement of the area” (ibid.).
The disparity of large protected areas that fall into Category V is substantial. The classifica-tions according to national law include Parco Naturale Regionale (Italy), Parc Naturel Ré-gional (France), Parc Natural (Spain), Parque Natural (Portugal), Naturpark (Austria and Ger-many), Regionaler Naturpark und Naturerlebni-spark (Switzerland), Area of Outstanding Nat-ural Beauty und National Park (Great Britain). Lastly, cross-nationally the category of the bio-sphere reserve is also part of Category V. There-by the multitude of terms does not just reflect different linguistic views, but also cultural, le-gal and most of all, conceptual views. For com-parison purposes in literature cf. Henderson 1992, Schmidt 1995, Weixlbaumer 1998, 2001, Mose & Weixlbaumer 2002, Hammer 2003.
The large protected areas that fall into Category V of the IUCN, are not just of interest because of their large surface ratio, but also due to their underlying conceptual views. It is widely rec-ognized that biosphere reserves, nature parks, regional parks etc. are considered to be the es-sential category of the dynamic-innovation par-adigm. This paradigm is characterized by a moderate anthropocentrism, where man plays an essential integrative role.
Paradigm shift in protected areapolicy
Depending on the latest trend of the understand-ing of nature and the zeitgeist respectively, differ-ent basic principles in area protection policy have developed within Europe and beyond (e.g. North America). Taking national park policy as an exam-ple, Henderson (1992) analyzed substantial char-acteristic differences between the United States and Canada as well as Great Britain. Referring to the 19th century he basically distinguishes be-tween the preservationist-movement “protection without use” in the United States and the conser-vationist-movement “protection through use” in Canada and Great Britain. On the one hand wil-derness was conserved, and on the other hand nat-ural landscape was cultivated and value was added by tourism. Preservation and protection with little understanding for integration, i.e. without serious-ly thinking beyond the boundaries of the protect-ed area, were the basic elements of the concepts of protected areas until the middle of the 20th century. By the end of the 20th century things had changed, at least in the United States and Canada, decisive-ly. Today the trend in both countries is headed to-wards ecosystem-based management (Slocome & Dearden 2002, 297ff.), even though this term is not always explicitly used. The ecosystem-based man-agement approach replaces the isolated nature pro-tection aspect with an integrative approach, which was also expressed in the Durban Accord (2003).
Figure 2: The main paradigm strands in area protection policy.
Protected Areas and New Paradigms of Regional Development
152
Based on this background, one has to conclude that there are essentially two different concepts of area protection that can clearly be separated: On the one hand is the paradigm of the static-preservation approach (segregation approach) and on the other hand the paradigm of the dy-namic-innovation approach (integration protec-tion) (cf. figure 2, Weixlbaumer 2005).
The following attributes characterize the static-preservation approach:
Based on the dichotomy of “protection- and pollution area,” nature protection and busi-ness areas are spatially separated i.e. bell jar and reservation policy respectively: Protect-ed areas have only little contact with the out-side world.
It is a matter of sectoral protection that only targets certain species and is, subsequently, area-oriented. The two main tools of clas-sical nature protection are species and area protection. The mechanistic worldview is the ideological basis of this approach.
The basic principle of species and area pro-tection is often pursued with a rather rudi-mentary management structure, that often-times is situated only on a supra-regional level (e.g. NGO or national government of-fice). Furthermore the management frequent-ly has no choice but to view this task as one of many others. Norms exist – management however plays no essential role with the ex-ception of national parks of the Category Ia and Ib. Nature protection happens through idealizing – primarily to preserve the sub-jects of protection.
The shaping of norms and the designation of protected areas happens top-down. It is a sort of “sovereign” nature protection, mostly pro-hibitive in nature.
The acceptance of all interested parties (e.g. abutters to the protected area) is not scruti-nized in this normatively driven approach.
Then again the paradigm of the dynamic-inno-vation approach (integration approach) is char-acterized by the following basic principles and attributes:
Nature protection is a spatially and temporally basic principle that attempts to overcome the “protection and pollution area”dichotomy.
The basic principle of sustainable develop-ment is expressed by turning from pure area protection towards procedural protection. Be-yond that the principle is expressed by the aimed model effect for areas and procedures outside the protected areas. The transactionis-tic world view is the ideological basis of this approach.
Integrative protection and landscape develop-ment measures are usually achieved by an ad-equate management structure (on location and oftentimes additionally by a supra-regional al-liance or a governmental office). Nature pro-tection becomes more and more professional.
Nature protection by using a policy-mix is considered to be a societal task (top-down and bottom-up approaches are intertwined). There-fore measures are less normative, instead they build on a high degree of voluntariness.
The acceptance of all relevant people is essen-tial. In general it is the result of a cooperative effort of all parties involved.
The background to this dynamic-innovation ap-proach, as opposed to the static-preservation ap-proach, is the thought of “Mitwelt” (in the sense of Meyer-Abich 1990). A moderate anthropocen-trism, declining any radical forms, has priority over a non-anthropocentric view. Nature can only be protected and advanced by man in a sustain-able way if mankind considers itself to be a part of nature. In this way, mankind takes on the in-side perspective to its protected areas. Therefore the criticism of “science-obsessed nature protec-tion” does not apply to this approach (cf. Plachter 1991). In fact, research and management have to be oriented in an inter- and transdisciplinary way in order to give enough consideration to in-tegrative basic principles and attributes. A stron-ger recognition of the human science component is explicitly required (cf. Erdmann 2000).
The outcome of this is the notion of area protec-tion, which in Europe is above all oriented to-wards the sustainable development of strongly-affected landscapes, with an explicit innovation
Protected Areas and New Paradigms of Regional Development
153
element. The main tool of this approach is in many cases the large family of “nature parks” (and the IUCN-Category V respectively), that experienced a boom Europe-wide from the 1960’s onward.
Even if in reality this generalized polarization is not all that black and white, one can more or less de-scribe the traditional area protection policy as be-ing a “protection and pollution area ideology”. Due to an increase in knowledge in the nature protection realm, the dynamic-innovation approach has been established in Europe in recent years. The chal-lenge of this approach is to make the integration of different interests (in use) possible. This approach attempts to satisfy the interests of protection and use on the “experimental ground” nature park in a socially, economically and environmentally sound way. In other words it is the goal to conserve and form the regulatory, habitat, support, development and information functions of protected areas, while simultaneously using large protected areas beyond their boundaries as tools of sustainable regional de-velopment.
In the practical everyday world of area protection, the strategic measures and main paradigm strands presented in this paper interact in a complementary way. Depending on the requirements of nature pro-tection and the regional situation, both approaches can be legitimately used.
Based on its basic principles, attributes and “back-ground-philosophies”, Europe’s booming land-scape, nature, regional and biosphere parks, as well as numerous national parks (that are not part of the IUCN-Category II) of the past decades have to be attributed to the dynamic-innovation approach. If one excludes national parks, there are roughly 600 managed protected areas that fall into the IUCN-Category V in Europe alone.
Outlook
In the last two decades large protected areas have increased their importance within Europe. This is not just true because of the substantial surface ratio in various European countries, but is also true with regard to the diverse functions of large protected areas. In connection with the above is the obvious paradigm shift, which is in a strict sense a para-digm complement. Accordingly the advancement
function of protected areas has received an increas-ingly significant importance as opposed to the pro-tection function. An immediate expression of this fact is the downright boom of protected areas of the IUCN-Category V, which are all oriented towards the integration of protection and use functions. In Europe this is on a regional level particularly the very heterogeneous nature and regional park set-ting. On an international level one has to mention the prestigious biosphere concept. Examining its functions of (according to UNESCO) development, conservation, as well as logistical support, one can see that it represents the implementation of the sus-tainability notion into practice (cf. ÖAW 2005).
For the future advancement of protected area poli-cy it will be important to primarily pursue the path of stronger integration of protection and use in the years to come. In addition, large protected areas ought to be used consistently (also) as tools for a sustainable regional development. As the previous practical experience shows, the approach of a dy-namic-innovation area protection seems to be an increasingly suitable conceptual framework which can highlight practicable models for mankind to treat the landscape that we live in and that we use, be it as an individual or be it as a society. In short this framework should enable us to try out sustain-able ways to live and do business.
References
Büchter, C. & Leiner, C. (2000). Schutzkategorien im Naturschutzrecht. Systematische und kritische Über-sicht. Kassel.
Chape S. et al. (comp.) (2003). 2003 United Nations List of Protected Areas. Cambridge.
Erdmann, K.-H. (2000). Naturschutz – quo vadis? Anregun-gen zu einer Neuausrichtung. In: PGM (143), p 80-85.
EUROPARC & IUCN (1999). Richtlinien für Manage-ment-Kategorien von Schutzgebieten. Interpretation und Anwendung der Management-Kategorien für Schutzgebiete in Europa. Grafenau.
Hammer, T. (Hrsg.) 2003. Großschutzgebiete – Instrumente nachhaltiger Entwicklung. München.
Henderson, N. (1992). Wilderness and the Nature Conser-vation Ideal: Britain, Canada and the United States Contrasted. In: AMBIO (21/6), p 394-399.
Meyer-Abich, K. M. (1990). Aufstand für die Natur. Von der Umwelt zur Mitwelt. München.

Protected Areas and New Paradigms of Regional Development
154
Mose, I. & Weixlbaumer, N. (Hrsg.) (2002). Naturschutz: Großschutzgebiete und Regionalentwicklung In: Naturschutz und Freizeitgesellschaft (5). Sankt Au-gustin.
Mose, I. & Weixlbaumer, N. (2006). A New Paradigm for Protected Areas in Europe? In: Mose, I. (ed.). Protect-ed Areas and Regional Development in Europe. To-wards a New Model for the 21st Century? London. (forthcoming).
ÖAW (Österreichische Akademie der Wissenschaften) (Hrsg.) (2005). Leben in Vielfalt. UNESCO-Bio-sphärenreservate als Modellregionen für ein Mitein-ander von Mensch und Natur. Wien.
ÖROK (Österreichische Raumordnungskonferenz) (Hrsg.) (1997). Naturschutzrechtliche Festlegungen in Öster-reich (135). Wien.
Plachter, H. (1991). Naturschutz. Stuttgart.
Schmidt G. (1995). Naturschutzplanung in Spanien. Verbindung zwischen Naturschutz und umweltver-träglicher Entwicklung – ein Modell für die ländlichen Räume Europas? In: Naturschutz und Landschaftspla-nung (27), p 69-75.
Slocombe S., Dearden Ph. (2002). Protected Areas and Eco-system-Based Management. In: Dearden & Rollins (eds.). Parks and Protected Areas in Canada. Planning and Management, p 295-320. Oxford-N.Y.
Weixlbaumer, N. (1998). Gebietsschutz in Europa: Konzep-tion – Perzeption – Akzeptanz. In: Beiträge zur Bev-ölkerungs- und Sozialgeographie (8). Wien.
Weixlbaumer N. (2001). Gebietsschutzpolitik in Italien und Frankreich – Welcher Umgang mit welcher Natur? In: Berliner Geographische Arbeiten (91), p 97-105.
Weixlbaumer, N. (2005). „Naturparke“ – Sensible Instru-mente nachhaltiger Landschaftsentwicklung. Eine Ge-genüberstellung der Gebietsschutzpolitik Österreichs und Kanadas. In: Mitteilungen der Österreichischen Geographischen Gesellschaft (147), p 67-100.
Siegrist, D., Clivaz, C., Hunziker, M. & Iten, S. (eds.) (2006). Exploring the Nature of Management. Proceedings of the Third International Conference on Monitoring and Management of Visitor Flows in Recreational and Protected Areas.
University of Applied Sciences Rapperswil, Switzerland, 13-17 September 2006. Rapperswil.
155
Overcoming National Park Conflicts by Regional Development: Experiences from the Doñana Area in Southern Spain
Andreas Voth
University of Vechta, Germany
Keywords: Land use conflicts, regional development, Doñana National Park, Spain.
Abstract: The number of protected areas in Spain has increased considerably in the last two decades. The country’s membership in the European Union favoured an important economic growth and social change and was also funda-mental for the evolution of environmental policies and the exchange of management concepts for protected areas. The intensive use of natural resources was followed by a growing awareness of land use conflicts and the necessity of na-ture conservation. The area around the National Park of Doñana in Andalusia, presented in this contribution, is an out-standing example of a long history of competing land use interests and recent efforts to overcome conflicts introduc-ing new concepts of regional development based on the principals of sustainability and participation. A regional label highlights the national park image to stimulate environmental sensibility and marketing. The local population increas-ingly perceives a new consciousness of their common problems, opportunities and responsibility.
Introduction: The protected areas policy in Spain
Since the adherence of Spain to the European Union, a significant consolidation and regional-ization of the country’s environmental policy takes place and is reflected by an amazing proliferation of protected areas of different categories. The local-ization of most areas with some kind of protection in disfavoured rural districts requires a progressive transition from traditional policies of passive con-servation to new approaches of active conservation, integrating the local population and surrounding territories and converting the protected areas into instruments of sustainable development (Troitiño et al., 2005). A recent shift of paradigm can be ob-served in protection policies in Spain towards new instruments of environmental planning and man-agement taking into account the close interrelations between protected natural areas and their social and economic environment. Even the national parks are no longer seen as areas isolated from the rest of the territory, and their peripheral protection zone is in-creasingly regarded as part of a surrounding area of socioeconomic influence offering opportunities for the promotion of sustainable development.
The beginning processes of democratization, social and economic change and the political status of Au-tonomous Communities granted to the regions gave a fresh impetus to the amplification and declaration of national parks and to the diffusion of other cate-gories of protected areas. The transfer of responsi-bilities for environmental legislation to the regional level caused a real boom of protected areas and also a change of their objectives and tasks. The priorities shifted gradually from landscape and ecosystem conservation to regional development. The region-alization process has not only led to an institutional change of the Spanish Network of National Parks, but also to a parallel evolution of regional networks and innovative types of protected areas character-ized by an increasing integration of development functions. The case of Andalusia demonstrates the enormous expansion of the protected areas based on the own legal framework of 1989. The Nation-al Park of Doñana in the Guadalquivir river marsh-lands at the Atlantic coast is surrounded by nature parks and becomes incorporated into the Network of Protected Areas of Andalusia (RENPA).The Action Plan published by Europarc-Spain (2002) provides orientations and recommendations on different planning and management processes in the protected areas and seeks to increase citizens’

Protected Areas and New Paradigms of Regional Development
156
awareness and participation concerning conserva-tion and development decisions. In this document, protected areas are regarded as basic instruments for territorial planning and as diffusion centres of new sustainable development strategies. The Span-ish Action Plan assesses that the switch towards the planning of protected areas integrated into a wider territorial framework is still very limited and more conceptual than real, so that a specific document about the present difficulties and opportunities to integrate protected natural areas in regional plan-ning has been elaborated recently (Europarc-Spain, 2005). Environmental and regional planning legis-lation are responsibility of the autonomous regions. For some protected areas, the sub-regional plan-ning level has gained greater importance. This is the case in the area of socioeconomic influence of the Doñana National Park, where a specific document for regional planning (Junta de Andalucía, 2004) was designed to adjust a previous document to the changing legislation in Andalusia and to take up the recommendations elaborated by an International Commission of Experts concerning the severe land and water use conflicts and development opportu-nities (Comisión Internacional de Expertos, 1992). The new legal framework for planning and sustain-able development in the Doñana area is based on a detailed characterization and analysis of present uses, infrastructure and demands around the nation-al park and contains ambitious objectives and ac-tion lines to make nature conservation and different economic uses and opportunities compatible.
Methods
The study of land use conflicts and regional de-velopment in the Doñana area forms part of a long term research line of the author about concepts of economic upgrading of natural and cultural heri-tage in Europe, especially in Spain. The objec-tives are also combined with own recent analysis about the role of regional products in processes of regional development. Experiences and results of earlier studies deeling with problems of intensive agriculture in the Doñana area (Voth 1998 2004a) were of great importance for the ongoing research activities around the National Park. The evaluation of publications and planning documents, as well
as interviews with regional experts are the main methods used. A long term field observation and documentation in the park area and frequent per-sonal contacts with local actors are essential for the application of qualitative research methods fo-cussed on the area’s evolution in time.
Land use conflicts around the Doñana National Park
The Doñana area is certainly one of the best stud-ied and documented territories in Spain, and the large National Park has become the country’s most famous protected area on the international level, but also the most conflictive and difficult to man-age. First initiatives to protect part of the Gua-dalquivir river marshlands were directly relat-ed to the foundation of the World Wildlife Found (WWF) in 1961. The wetlands, pine forest and coastal dune ecosystems are of vital importance for many migrating birds and for the survival of the Iberian Lynx. Thanks to international pressure and financing, a growing area could be protected, leading to the declaration of almost 35,000 hect-ares of Doñana as a national park in 1969, ampli-fied to more than 50,000 hectares in 1978. The pro-tection initiatives have saved an important part of Doñana from being transformed for intensive ag-riculture, mass tourism, urbanization and traf-fic infrastructure, but nature conservation was not compatible with the dominating economic devel-opment policy of that time. The marshlands in the triangle between Sevilla, Huelva and Cádiz were an objective of several development plans compet-ing directly with the conservation interests. Inten-sive irrigation and the modernization of rice grow-ing in the Northeast part of the marshlands (Voth 1998) as well as the massive groundwater extrac-tion for an agricultural colonization scheme at the Northern park border threatened the complex eco-system. The deforestation caused by the dynamic expansion of export-oriented strawberry growing on the coastal plains also affected the Doñana area (Voth 2004a). The implementation of the industrial growth pole in Huelva and new seaside urbaniza-tions called for the construction of a road connect-ing the cities of Huelva and Cádiz, but these plans were never put into practice. The renouncement of

Protected Areas and New Paradigms of Regional Development
157
this road and of other large infrastructure projects in the park area is still used by local interest groups as an argument for claiming a continuous reception of different kinds of compensation.
The parallel but uncoordinated promotion of the National Park, intensive agriculture and mass tour-ism in neighbouring or even overlapping areas caused serious problems still not fully resolved. Traditional activities, an increasing number of modern land use interests and external impacts put the Park under pressure (figure 1). Severe land use conflicts characterized the relationship between the Park and the local population and have led to an unsustainable situation requiring new develop-ment concepts and institutions (Voth 2004b). In 1998, a mining accident caused a destructive con-tamination of the Guadiamar River, an important catchment area of the Doñana wetlands, and dem-onstrated the vulnerability of the National Park.
Nevertheless, this threat once again directed the political and scientific attention on Doñana and at-tracted new funds for conservation and develop-ment.
Even substantial compensations could not guaran-tee the acceptance of the protected area, and tra-ditional concepts based on the conciliatory effects of subsidies turned out to be inadequate as a long-term solution. Some authors denounce not only the lack of information and participation of locals in planning processes, but also the ‘culture of assis-tance’ becoming firmly fixed in the population liv-ing around protected areas (Troitiño et al. 2005). In the case of Doñana, a compensation policy at-tempted to overcome the long lasting conflicts be-tween nature conservation and economic interests, and people continuously expected the arrival of new ‘development plans’ to generate a new eco-nomic upturn, as Ojeda (1993) demonstrated in his
Figure 1: The diversity and interrelationship of land use interests in the Doñana area.
Protected Areas and New Paradigms of Regional Development
158
detailed analysis. Decades of uncoordinated sector policies strengthened the deep rooted idea of local communities to have a legitimate claim to compen-sation for renouncing a complete transformation of the area for intensive agriculture and tourism de-velopment. New concepts were needed.
New concepts of sustainable devel-opment in the Doñana area
Increasing land use conflicts forced the regional administration to look for an alternative way of de-velopment for the Doñana area. The judgement of the International Commission of Experts (1992) in charge of an independent evaluation study tried ‘to make compatible the justifiable aspirations of the inhabitants in municipalities surrounding Doñana for a better life with an integral conservation of Doñana’s ecosystems, from a perspective of sus-tainable development. The experts were convinced that the conservation of the Park could represent a comparative advantage for the area regarding the expanding market of nature tourism and the market segments for agricultural products with a quality label or a denomination of origin. To achieve this goal, they also recommended a general improve-ment of the infrastructure in the area and the re-alization of an ambitious programme of education and professional training. The start of a Plan for Sustainable Development (PDS) in 1993 was the logical consequence of the analysis of problems and opportunities. With the financial support of EU funds, the regional administration implemented the plan and created the Foundation ‘Doñana 21’ to promote social participation and public and private actions for the sustainable development of Doña-na and its area of socioeconomic influence. Tak-ing the role of a new development agency for the 14 municipalities constituting the area of Doñana, the Foundation supports coordination and coopera-tion among different entities and social agents and stimulates the participation and own initiatives of the local population.
In a workshop organized by the Foundation ‘Doña-na 21’ in 1997, local experts and the mayors of all municipalities within the socioeconomic influence area approved a ‘Doñana Local Charter for Sus-tainable Tourism’, considering that “the present
trend in tourist demand, in accordance with the no-tion of sustainable development, requires a prod-uct which is integrated into the particular charac-teristics of the area.” The existence of the protected area is promising a life quality of great attractive-ness for new seasonal or permanent residents, so that nature conservation is not only perceived yet as an obstacle to economic development (Elbersen & Prados 1999). Also the tourist flows have grown considerably, and the National Park receives more than 400,000 visitors annually, although less than 20% of them participate in paid tours inside the Park. Analysis of visitor statistics show a signifi-cant seasonality and spatial concentration of vis-itor flows on the mayor visitor centres (Litago et al. 2003). Public relations of the park administra-tion are directed to tourists as well as to residents. Great efforts of environmental education are made to improve people’s comprehension and estimation of their park. Recent problems like the introduc-tion and diffusion of exotic species (e.g. American tortoises) and of new aggressive sports (e.g. quads) demonstrate the necessity of innovative approach-es in the management of visitor flows and public information. Originally, the primary objective of public use concepts was to offer facilities of en-vironmental interpretation and education, but the increasing demand for other recreational activities and additional services requires a change in pub-lic use planning and gives private enterprises new opportunities. The number of visitor centres and information points has increased drastically in re-cent years, most of them managed by the park ad-ministration, but also through service concessions. Doñana already shows a certain saturation of this type of infrastructure and a great variety of other tourist attractions and facilities (figure 2). Recent-ly emerging centres of rural tourism indicate an al-ternative way outside the traditional seaside urban-izations. Tourism in and around the protected areas offers news opportunities of economic develop-ment and plays an important role in the diffusion of the regional image. Of all thirteen Parks compos-ing the Spanish Network of National Parks, Doña-na is the only one possessing the entire collection of protection titles: after its important enlargement of 1978, the Doñana was recognized as Biosphere Reserve in 1981, Wetland of International Impor-tance in 1982, Protected Area with European Di-

Protected Areas and New Paradigms of Regional Development
159
ploma since 1985, Special Protection Area for Birds in 1988 and UNESCO World Heritage Site in 1994. The outstanding international prestige of the protected areas offers best opportunities for estab-lishing a concept of regional marketing using the name of Doñana. Therefore, one of the innovative initiatives carried out in the framework of the Plan of Sustainable Development (PDS) is the quality label ‘Etiqueta Doñana 21’ created by the Founda-tion in 1998 to enhance the differential values that the companies of the Doñana area offer. This sign of environmental respect and prestige is expected to improve the external image of Doñana and the companies’ competitiveness and market access for their products and services. The distinctive label is granted only to local companies that incorporate and combine systems of quality and environmental management and fulfil detailed requisites for cer-tification. Enterprises that like to obtain the label
have to adopt ISO regulations and to demonstrate a continuous improvement of their environmental behaviour in a process evaluated by external cer-tification. Up to 2005, seventeen enterprises and institutions already received the certification, and forty others have started the evaluation process to obtain it. Most of these enterprises are dedicated to agricultural production and marketing (35%), ser-vices related to tourism (32%) and to handcraft and industrial activities (12%). The regional name of Doñana also is presented as a quality label on dif-ferent international tourist fairs and used for desti-nation marketing.
The introduction of the Etiqueta Doñana 21 label is only one piece in a wide set of measures covered by the PDS that consists of several programmes: the improvement of the water management, the struc-tures in agriculture and the sustainable use of natu-ral resources are specific objectives of the Plan, as
Figure 2: Tourism infrastructure around the Doñana National Park.

Protected Areas and New Paradigms of Regional Development
160
well as fomenting tourism and other economic ac-tivities and infrastructure compatible with environ-mental conservation. The recommendations of the International Group of Experts and main objectives of the first PDS are put into practice with the assis-tance innovative concepts and important financial funds. The considerable economic change that can be observed in the park region improves the con-ditions for a change of attitudes towards the pro-tected area. After a successful realization and eval-uation, a second PDS for the Doñana area is being elaborated in 2006 and based on the local Agen-da 21 process. The PDS must integrate all territo-rial and sector policies related with the park area. The participation of local actors and rural develop-ment groups in the elaboration process and man-agement of the plan is of fundamental importance in order to overcome persisting land use conflicts by regional development. The complex interrela-tionship between different actors and the recent ex-periences with new concepts of park management and marketing are of significant interest for further studies and a potential application in other regions with protected areas.
References
Comisión Internacional de Expertos sobre el Entorno de Doñana (1992). Dictamen sobre estratégias para el desarrollo socioeconómico sostenible del Entorno de Doñana. Sevilla.
Elberson, B. & Prados, M.J. (1999). Desarrollo rural y cali-dad de vida en el entorno del Parque Nacional de Do-ñana. In: Revista de Estudios Regionales (55), p 47-76.
Europarc-Spain. (ed.) (2002). Action Plan for the Protected Natural Areas of the Spanish State. Madrid.
Europarc-Spain. (ed.) (2005). Integración de los espacios naturales protegidos en la ordenación del territorio. Madrid.
Fernández, J. & Pradas, R. (2000). Historia de los Parques Nacionales españoles. Vol. 1. Madrid.
Fundación Doñana 21. (ed.) (1998). Foundations for a Mod-el of Sustainable Tourism in Doñana. Huelva.
Junta de Andalucía. (ed.) (2004). Plan de Ordenación del Territorio del Ambito de Doñana. Sevilla.
Litago, J., Moral, M. & Marquiegui, I. (2003). Evolución del número de visitas al Parque Nacional de Doña-na. In: L. Júdez Asensio et al. (eds.): Valoración del uso recreativo del Parque Nacional de Doñana, p 7-30. Madrid.
Ojeda Rivera, J.F. (1993). Doñana: Esperando a Godot. Se-villa.
Troitiño Vinuesa, M.A. et al. (2005). Los espacios protegi-dos en España: significación e incidencia socioterrito-rial. In: Boletín de la A.G.E (39), p 227-265.
Voth, A. (1998). Die Industrialisierung der Reiswirtschaft in den Marismas des Guadalquivir in Spanien. In: Eu-ropa Regional (6/4), p 35-43.
Voth, A. (2004a). Erdbeeren aus Andalusien. Dynamik und Probleme eines jungen Intensivgebietes. In: Praxis Geographie (34)(3/2004), p 12-16.
Voth, A. (2004b). Nationalpark Doñana – Nutzungskonflik-te und Ansätze nachhaltiger Entwicklung. In: Geogra-phie heute (25/225), p 42-47.

161
162
Relevance and a Sense of Connectionin Canada’s National Parks
Steve Whittingham (Chair)

Siegrist, D., Clivaz, C., Hunziker, M. & Iten, S. (eds.) (2006). Exploring the Nature of Management. Proceedings of the Third International Conference on Monitoring and Management of Visitor Flows in Recreational and Protected Areas.
University of Applied Sciences Rapperswil, Switzerland, 13-17 September 2006. Rapperswil.
163
Parks Canada’s Framework for Recreational Activities
Frances Gertsch & Ed Jager
Parks Canada, Canada
[email protected]@pc.gc.ca
Keywords: Recreational activities, assessment, national parks, integration, involvement.
Introduction
Parks Canada is mandated – through nation-al policy – to assess the recreational activities that take place in national parks, national histor-ic sites, national marine conservation areas and historic canals.
Parks Canada is committed to providing visitors with opportunities to participate in recreation-al activities that will allow them to experience and connect with Canada’s national parks, na-tional historic sites, national marine conserva-tion areas and historic canals. Working with our partners and the public, Parks Canada needs to provide high quality recreational opportunities in ways that offer visitors opportunities to learn, experience and connect with these special plac-es while, at the same time, protecting the natural and cultural resources that make them special.
To do this, Parks Canada is developing a new way to make decisions about recreational activ-ities. It is agreed that the process to make these decisions needs to be nationally consistent, trans-parent and open to the public and that it should be adaptable and flexible enough to allow deci-sions to reflect the local context. In addition, the new decision framework needs to help manag-ers make decisions about new or changing ac-tivities.
Methods
The following five principles provide the context and vision for the assessment of recreational ac-tivities in national marine conservation areas, na-tional parks and national historic sites managed by
Parks Canada. These principles aim to promote de-cision-making that is nationally consistent, trans-parent and open to the public and reflects the lo-cal context.
Parks Canada’s core principles for assess-ing recreational activities are…
Respect for natural and cultural resources
The activity supports and contributes to the pro-tection, maintenance and enhancement of eco-logical integrity of national parks, commem-orative integrity of national historic sites or sustainable use of national marine conserva-tion areas. Parks Canada and its partners con-tinue to seek innovative solutions to mitigate or avoid undesirable environmental, social or cul-tural impacts.
Promote and enhance public understanding, ap-preciation and enjoyment
The activity enriches understanding and appre-ciation by providing engaging opportunities for visitors to connect with Canada’s natural and cultural heritage. The activity enhances public enjoyment and negative impacts on the experi-ence of other visitors. The activity fosters sup-port, involvement and further discovery of nat-ural and cultural resources and their associated heritage areas.
Value and involve local communities
The activity respects the rights and values of lo-cal communities, property owners and Aboriginal peoples. The activity supports the long-term eco-nomic, social, cultural and environmental bene-fits to these groups, as well as the Parks Canada mandate. Opportunities for recreational activi-

Relevance and a Sense of Connection in Canada‘s National Parks
164
ties in national parks, national historic sites, na-tional marine conservation areas and historic ca-nals will complement those offered by local and regional industries, interests and groups.
Evoke a sense of place
The activity evokes a sense of place. It provides visitors with the opportunity to discover what makes the national park, national historic site, na-tional marine conservation area or historic canal unique. It respects the importance that Canadians place on these special places. When visitors learn about and experience these activities, they believe them to be consistent with their view of Canada’s national parks, national historic sites, national ma-rine conservation areas and historic canals.
Results
The Recreational Activities Assessment Frame-work was developed as a tool to help managers make better decisions about recreational activities. It can be used in one of two situations:
Management Planning ProcessesThe first situation is during the management plan-ning process. Using the Framework in this context provides an opportunity to assess the suite of rec-reational activities offered and how they work to-gether. It also provides an opportunity to improve overall performance of the three core elements of the mandate in relation to recreational activities.
When, a planning team identifies an area of con-cern related to a recreational activity, that activi-ty should be assessed during the planning process. The Recreational Activities Assessment Frame-work should be used and stakeholders (from the protection, tourism and education sectors) should be involved. The planning team does not need to assess every recreational activity occurring at a site during management planning, but must give consideration to the entire context in which recre-ational activities occur to ensure that all areas of concern are addressed.
Single Activity AssessmentsThe second situation is between planning cycles (which occur every 5 years). This may be required if: (a) managers are approached about a new activ-
ity; (b) an activity changes significantly and new concerns emerge; or, (c) new concerns about an ex-isting activity emerge that are significant enough to be addressed immediately. In this situation, the Recreational Activities Assessment Framework should be used to assess and make a decision about the activity. Key stakeholders should be involved in this application of the Framework.
Communicating about decisions related to recre-ational activities assessments is an important part of their success. As a rule of thumb, people who have an interest should have an opportunity to be involved in assessing the activity. The broader public should have an opportunity to provide in-put to the process during existing public forums (e.g. management planning, annual planning fo-rum, etc.).

Siegrist, D., Clivaz, C., Hunziker, M. & Iten, S. (eds.) (2006). Exploring the Nature of Management. Proceedings of the Third International Conference on Monitoring and Management of Visitor Flows in Recreational and Protected Areas.
University of Applied Sciences Rapperswil, Switzerland, 13-17 September 2006. Rapperswil.
165
Healthy Parks for People
David Lipton
Parks Canada, Canada
Keywords: National parks, visitor experience, health, sustainability, community involvement.
Introduction
This project is a three-year initiative at Prince Ed-ward Island National Park, which engages a range of local, national and international interest groups and partners in the development of new options for memorable visitor experiences that contribute to improved health of the park ecosystem and the visitor.
Prince Edward Island National Park is the 3rd smallest national park in Canada, yet it receives the highest national park visitation outside of the mountain parks in the Canadian Rockies. Its small land base, composed of spectacular beach-es, dynamic coastal dunes, wetlands, salt marsh-es and forest habitat, is congested with more than 1,000,000 visitors annually.
Visitor use is focused on swimming, camping and hiking. These activities are supported by exten-sive park infrastructure and facilities, which have been developed over the last 70 years. Access for visitor use is via the Gulf Shore Parkway, a two-lane highway which extends along the Park shore-line, a distance of 28 kilometers. Constructed in the 1950s, this highway guides visitors to expan-sive parking areas, beach facilities, beach access points, trailheads and campgrounds. Its use as a transportation corridor for vehicles has encour-aged access by family vehicles and has contribut-ed to the establishment of visitor use patterns that are threatening the ecological integrity of the Park ecosystem and limiting options in terms of quality visitor experience, not to mention the negative im-pact the highway has had on the use of alternative means of transportation.
In addition, over the past 35 years the Park has ac-quired a large buffer land base adjacent to the Park boundary (Crown Land holdings). While these
lands are not yet gazetted as part of the National Park boundary, they do present an opportunity to eliminate parking infrastructure and facilities in-side the Park boundary by relocating them to the adjacent Crown lands. The elimination of parking areas would result in restored habitat and enhanced ecological integrity inside the National Park. The relocation would also provide an opportunity to address patterns of visitor use that are negatively impacting on the Park’s ecological integrity.
Given that the natural processes of land and sea are continuing to erode the shoreline and threaten facilities and infrastructure, the timing is right to address negative effects in patterns of visitor use. By introducing changes to the Gulf Shore Parkway that support the reduction of parking, active trans-portation and habitat improvement, Parks Canada will foster a culture of use that results in mass pub-lic contribution to the health and stewardship of the environment. The changes will create new op-tions and activities for the healthy enjoyment of truly memorable visitor experiences.
This project will engage non-traditional sectors such as consumer businesses, health sector, ath-letes, the performing arts, permanent and season-al residents, aboriginals, seniors and youth. They will contribute, together with visitors, tourism op-erators and government, to the work of creating and sustaining a healthy park for people
Methods
The project vision is for park visitors to enjoy memorable experiences in ways that enhance the Park’s ecological integrity and its surrounding en-vironment, while offering them new and healthy ways to experience and learn from the Park. Visi-

Relevance and a Sense of Connection in Canada‘s National Parks
166
tors’ experiences will lead to a sense of attach-ment to the national park, to an interest in learn-ing more about its natural resources and to a commitment to their on-going protection.
Objectives of the project are:To enhance the protection and sustainability of the National Park ecosystems.
To promote the role and involvement of the general public, Park users and collabora-tors in protecting and sustaining the environ-ment.
To create new, high quality visitor experience options that promote and support healthy life-styles and a healthy environment.
To reduce visitor parking inside the Nation-al Park, and
to increase public awareness, understanding and support for Parks Canada’s role and lead-ership in developing sustainable tourism ini-tiatives.
Criteria for Success include:Multi-use corridor is constructed and available for public use.
Number of people using the corridor by activ-ity.
Number of vehicles entering and traveling in the National Park.
Percentage of visitor satisfaction with the trans-portation options.
Level of comprehension by visitors of messages conveyed by Park interpretive programs.
Community and visitor attitudes toward changes to the visitor experience approach as measured by frequency of positive media statements.
Participation of communities and partners in de-livery of Parks Canada project initiatives.
Indicators of improved ecological integrity of the Park’s ecosystem, for example: number of asphalt parking spaces, area restored to natural state, number of wildlife mortalities etc.
Field Unit’s revenue is not negatively impacted by implementation of this project and its asso-ciated options.
Results
Critical success factors include:
A communications strategy that builds local, pro-vincial and national support for this project, and recognition of its goals as a healthy option for the visitor and a positive contribution to the Park’s ecosystem.
Social science research information on current and potential visitors’ interests and needs.
New and memorable visitor experience options that convey desired messages.
A new approach to moving visitors to and within the Park that promotes group and active transpor-tation modes.
A revenue strategy that is supported by the local community and is consistent with Agency policy.

Siegrist, D., Clivaz, C., Hunziker, M. & Iten, S. (eds.) (2006). Exploring the Nature of Management. Proceedings of the Third International Conference on Monitoring and Management of Visitor Flows in Recreational and Protected Areas.
University of Applied Sciences Rapperswil, Switzerland, 13-17 September 2006. Rapperswil.
167
Memorable Visitor Experiences Lead to Relevanceand Sustainibility
Carol Sheedy
Parks Canada, Canada
Keywords: Relevance, visitor experience, national parks, connection, sense of place.
Introduction
Parks Canada welcomes annually more than 22 million visitors to the national parks, national his-toric sites and national marine conservation ar-eas of Canada. The Agency sets the stage for visi-tors to enjoy meaningful, high-quality experiences through the provision of information, infrastruc-ture, facilities, programs, services and personnel. The visitor experience is the cumulative outcome of the individual’s visit and their interactions with Parks Canada, and its partners. This includes pre and onsite trip planning information, reception and orientation services, interpretation programming, campgrounds, hiking trails and other recreational services, visitor safety programs, and ongoing post visit information.
Through the services, facilities, programs, person-nel and infrastructure offered at national parks, na-tional marine conservation areas and national his-toric sites; Parks Canada provides Canadians with opportunities to enjoy, understand and appreciate Canada‘s natural and cultural heritage and to create their own memories. Parks Canada aims to stage meaningful and exceptional experiences, making these special places important and relevant to Ca-nadians. Visits to national parks, national histor-ic sites and marine conservation areas help to foster a shared sense of responsibility for environmental-ly and culturally sound actions that will extend be-yond their boundaries, and influence the values of Canadians as a whole. The experiences and knowl-edge gained through visits to national parks, na-tional historic sites and national marine conser-vation areas will provide visitors with a clear and strong sense of Canada, adding to the well-being and health of all Canadians.
Results
A visitor’s experience at a national park, national historic site or national marine conservation area is unique and personal. It results from: purposeful and personal connections with the heritage resources and settings; personal interactions with Parks Cana-da’s guides, storytellers and guardians; and the pro-vision of information, facilities, infrastructure, ser-vices and programs designed to respond to visitor needs and expectations. Parks Canada will continue to provide opportunities to contribute to a visitor’s personal growth and understanding, through expla-nation and connection with the authentic and na-tionally significant resources protected and present-ed in these places. These encounters will illustrate the relevance of the national parks, national marine conservation areas and national historic sites to Ca-nadians and reinforce a sense of connection with this heritage. Programs, services and facilities will continue to be provided in a manner that respects the Agency’s traditional high standards for quali-ty, cleanliness and safety, and a commitment to the protection of the heritage values of these places.
Parks Canada has always provided high quality programs and services. The Agency is now refining its approach to better understand and subsequent-ly meet the emerging interests of visitors through a wide spectrum of activities and programs. In consideration of their needs and expectations, the Agency is proactive in tailoring opportunities for visitors to experience Canada’s natural and cultur-al wonders.
The travelling public is a dynamic entity; the cycle of change of their needs, expectations and behav-iours is rapid and will require monitoring and anal-

Relevance and a Sense of Connection in Canada‘s National Parks
168
ysis at both national and local levels. This will in-clude monitoring of recreation, leisure and tourism trends, ongoing public opinion polling and ongo-ing analysis of other contemporary information.
Visitor feed back also will be actively sought by operational managers through tools such as com-ment cards and other real time methods as a way of monitoring visitor perceptions and responding through ongoing service improvements. This will provide staff with information that they can act upon quickly in direct response to visitors’ needs.
To Canadians and people worldwide, nation-al parks, national marine conservation areas and national historic sites represent the best of Cana-da. This image is founded on the attributes of au-thenticity, national significance, uniqueness, qual-ity of service, sustainability and good value. Most importantly, national parks and national historic sites continue to be highly valued by visitors for the scope, variety and richness of the experienc-es they offer.
As the cornerstones behind quality natural and cultural tourism experiences, the national parks, national marine conservation areas and national historic sites of Canada can be positioned as the quintessential opportunities to experience Canada.
The visitor experience begins prior to arrival at a national heritage place. The provision of clear and easily accessible information helps to influence and respond to visitor expectations. Parks Canada will continue to provide pre-visit information via its expanded national toll-free telephone service, its tourism industry partners and its own Web site which will be improved to better serve potential visitors with their planning requirements. The im-proved campground reservation system addresses visitor expectations for advance trip planning and assurance of available campsites.
A key component of information provision is on-site welcoming and orientation. Providing visitors with the right information at this stage of their visit will ensure that visitors benefit fully and safely of all opportunities for enjoyable experiences. Over the next five years, Parks Canada will also enhance the quality and consistency of signage and other information services.
Key is the provision of a range or continuum of op-portunities for visitors both at individual national parks and national historic sites and also through links between different heritage areas. Parks Cana-da will work to broaden the range of opportunities for visitors within the context of maintaining the ecological and commemorative integrity of these special places in order to reach both existing vis-itors and non-visitors with a menu of diverse and tailored experience opportunities.
While maintaining a core level of service for all po-tential visitors, the number and types of programs and activities and the related services offered will be developed with consideration of current and fu-ture market segments. The need to identify key markets through research and respond with desir-able programs and activities is essential to increas-ing the relevance of the parks and sites to Canadi-ans.
Parks Canada has long known that for many visi-tors, personal contact with friendly, knowledgeable and, engaging staff is a key element of a memora-ble experience. For this reason personal interpre-tation is at the core of many Parks Canada expe-rience. Parks Canada will continue to work with partners to augment investments in the develop-ment and delivery of professional and authentic learning experiences.
Facilities such as day-use areas, trails, camp-grounds, visitor centres, water and sewer systems, and roads afford onsite opportunities that optimise visitor understanding, enjoyment and appreciation. By the very nature of national parks, national ma-rine conservation areas and national historic sites, services often vary by scope and scale and are de-pendent on the unique characteristics of each loca-tion, as well as the needs and expectations of dif-ferent visitor markets.
Parks Canada will be renewing its visitor related assets strategically and seeking opportunities to make adjustments to its asset base by achieving a better understanding of how its facilities respond to visitor expectations and contribute to meaning-ful visitor experiences. The Agency will take ad-vantage of opportunities, to right size, innovate and modernize infrastructure to realize improved efficiency, standards and levels of service. In cases

169
where facilities are no longer responding to visitor needs and expectations for environmentally or cul-turally sensitive experiences, they will be phased-out or decommissioned.
Finally, the Agency will involve and work closely with community and business stakeholders to de-sign visitor experience opportunities that meet the needs of their shared markets while respecting the rights and values of host communities, neighboring property owners and Aboriginal peoples. Through partnerships and collaborative efforts, Parks Can-ada will advance visitor experiences opportunities offering economic, social, cultural and environ-mental benefits as well as create a sense of con-nection and attachment to Canada’s heritage place for the visitors.
Relevance and a Sense of Connection in Canada‘s National Parks

Siegrist, D., Clivaz, C., Hunziker, M. & Iten, S. (eds.) (2006). Exploring the Nature of Management. Proceedings of the Third International Conference on Monitoring and Management of Visitor Flows in Recreational and Protected Areas.
University of Applied Sciences Rapperswil, Switzerland, 13-17 September 2006. Rapperswil.
170
Integration – Resource Protection and Memorable Visitor Experiences in the Lake Louise Community of Banff
National Park
Steve Whittingham
Parks Canada, Canada
Keywords: Integration, protection, visitor experience, management plan, community plan.
Introduction
In the heart of the Canadian Rockies and Banff National Park, Lake Louise is an important inter-national symbol of Canada and the national park system. It is part of the Canadian Rocky Moun-tain Parks World Heritage Site. Banff, like all na-tional parks, is dedicated to preserving a special part of Canada’s natural and cultural heritage for the benefit, education and enjoyment of present and future generations. One of the biggest ques-tions for national parks is how to clearly state the direction national parks are taking in managing development, growth and use.
In Lake Louise, growth has been carefully con-trolled. However because of its remarkable com-bination of natural features, stunning scenery, im-portant railway history, as well as its outstanding trail system, Lake Louise is a primary destination for many visitors to Banff National Park. This is cresting demands for expanded services, facili-ties and residential accommodation. The role of its plan is to guide change and ensure the national parks’ mandate is supported for years to come.
Results
The following principles and recommendations have been applied in the Lake Louise Community Plan as follows:
1. No Net Negative Environment ImpactThe Lake Louise Community Plan enforces the principle of No Net negative Environmental Im-pact by reducing the hamlet boundary by approxi-
mately 37%, rehabilitating more than 40 hectares of disturbed lands inside and outside of hamlet, developing human use strategies for the area and placing rigid conditions on all implemented to gauge the health of the park in relation to the com-munity.
The Canadian Environmental Assessment Act (CEAA) will be rigorously applied to new devel-opment proposals and any environmental issues will be mitigated to ensure the principle of No Net Negative Environmental Impact is maintained.
2. Appropriate Use GuidelinesThe Lake Louise Community Plan identifies a Her-itage Tourism Framework that reinforces national park values. It also defines principles and specif-ic examples of basic and essential services. Only those proposals consistent with this framework will be approved. Social science data on visitor needs and expectations will guide the design and implementation of experience opportunities.
3. Responsible Growth ManagementFixed low growth and development guidelines for residential, visitor accommodation, institutional and commercial retail spaces have been identified in the plan. A modest increase in a range of com-mercial accommodation will help fill the demand for overnight services. The majority of this growth respects existing commitments. New expansion beyond these is limited and will be phased over time. Staff housing to address current problems is proceeding and must be in place prior to any com-mercial and institutional expansion. Infrastructure
Relevance and a Sense of Connection in Canada‘s National Parks
171
issues and staff housing associated with commer-cial expansion must be addressed before occupan-cy permits are issued.
4. Leadership in Environmental Steward-ship and Heritage ConservationA landscape improvement strategy is a foundation of the Lake Louise Community Plan. This strategy will reduce non-native plant species and discour-age large mammals from entering the community. A detailed environmental stewardship strategy is identified and will help the community reduce the impact of its operation.
Important heritage structures in the community have been identified. Strict architectural and rede-velopment guidelines have been created to protect these structures and the heritage character of Lake Louise.
Conclusion
In shaping the direction for Lake Louise, Parks Canada relied on public input and involvement of Lake Louise Advisory Board. The Community Plan is part of a sensitive, comprehensive and in-tegrated management strategy for the Lake Lou-ise area that began with the Banff National Park Management Plan. A transportation study, ski area guidelines and human use strategies for the park will provide additional direction.
The Lake Louise Community Plan is a tool that will help Parks Canada and the community makes decisions that are consistent with National Parks mandate and the vision for Banff National Park. The strategies outlined in this plan are basis for all decisions made within the community of Lake Louise ensuring the health of the park environmen-tally, socially and economically. By applying the principles in this plan, Lake Louise will continue to be a living example of national park values.

172
Sustainability and Carrying Capacity Studiesin Recreational Settings
Robert Manning (Chair)

Siegrist, D., Clivaz, C., Hunziker, M. & Iten, S. (eds.) (2006). Exploring the Nature of Management. Proceedings of the Third International Conference on Monitoring and Management of Visitor Flows in Recreational and Protected Areas.
University of Applied Sciences Rapperswil, Switzerland, 13-17 September 2006. Rapperswil.
173
Sustainable Trail Management, Definitions and a Management Model
Sinead H. O’Connor Gotra & Ken E. Boyle
Dublin Institute of Technology, Ireland
[email protected]@dit.ie
Keywords: Sustainable Trail Management, Indicators, Integrated Planning Frameworks, Local Community Participation.
Introduction
Apart from Hugo (1999), existing literature on “sustainable trail” development frequently empha-sizes the importance of biodiversity conservation or physical trail surface management (Marion & Leung 2004).The extent to which the sustainabil-ity principles (Social, economic and environmen-tal) have been developed, accepted and applied by trail management bodies and relevant stakeholders as the basis for ‘sustainable trail management’ is a paradigm that is explored in this research. The re-search sets out to establish a definition and model for sustainable management of trails.
Methods
To do this three studies were carried out, and the first addressed the question “what is a sustainable trail?” This work was done through online debate discussion generated among a community of trail managers, users and researchers. The second part of the work examined current practices by trail managers in protected areas. The objective was to establish issues and practice related to trail man-agement where conservation of the resource was also a priority. A questionnaire was distributed to managers in a network of designated areas identi-fied through the International Union for the Con-servation of Nature. In the third strand of the work the National Waymarked Ways Advisory Commit-tee (NWWAC), a body charged with the manage-ment of long distance walking routes in Ireland, and the researchers examined how the current model of management of these routes could be
made sustainable through a process of consultation and discussion with local trail management com-mittees. The key elements of each methodology are outlined in table 1.
Results
Study one: The sustainable trail definedSustainability indicators for trail settings were di-verse and ranged from broad to specific levels of description of environmental, social and econom-ic criteria (figure 1). Political indicators of sustain-able trail development were less discernable with-in the debate contributions.
There was an overall consensus by the participants that the “sustainable trail” was a realistic concept. The basic premise for making the “sustainable trail” a reality included governmental support, on-going stakeholder participation and commitment and multi-dimensional and long-term frameworks. Furthermore, emphasis was placed on the need for trail development activities to receive adequate and continuous funding, resource and personnel support and inputs from relevant sources.
Study two: Trail management practiceThe application and practice of environmental trail condition assessment and monitoring was limit-ed. For managers that did attempt to assess envi-ronmental conditions, subjective assessments were employed and data was based mainly upon ad hoc personal observations or alerts from recreation us-ers of signs of damage. Key indicators of trail dam-age were coarse and included general observations

Sustainability and Carrying Capacity Studies in Recreational Settings
174
of broad changes in bare ground relative to vege-tative cover and large-scale erosion features rather than detailed analysis of specific vegetative spe-cies and soil properties. A limited number of man-agers used standard criteria or guidelines to assess the overall quality of trails and a minority of man-agers checked the accuracy and precision of the methods applied. Environmental trail condition data was considered most useful in aiding trail maintenance decisions and activities.
For managers who did not conduct environmen-tal trail condition assessments reasons included lack of information, staff and resources to con-duct such activities. Managers were not specifical-ly qualified for undertaking issues directly related to trail management with a cross-section of man-agers indicating qualifications in administration, business, social sciences, arts as well as environ-mental sciences. Managers remit in conservation areas was generally not directly focused on trail
Core Objective Define and examine the need for a sustainable trail management framework. Overall Study Objective/Task
Core Tasks Collaborative investigation and international review of ideal and current trail management frameworks. Changes needed to meet sustainability requirements at a national/regional level
Characteristics Method 1 International Debate
Method 2 International Management Questionnaire
Method 3 Management Workshop
Target Population Diverse/Multiple Targets Participants drawn from a variety of organizations internationally, directly or indirectly related to trail management
Specific Target Group IUCN- Members Participants are drawn from one organization that shares a specific management mandate globally
Specific Target Group NWWAC- Local committee members, Ireland Participants are drawn from one organization that shares a specific management mandate relating to trail development nationally
Scale of study International- Macro International- Meso National Research Strategy Conceptual Design/ Visionary/
Scenario building using Grounded Theory Approach
Evaluative study and mapping of current management position
Case Study approach Consensus based study: Integrative study of current management practices, visionary goals and action plans
Research Tool Email/ Internet Survey Postal Survey Workshop series Sampling method (Non-probabilistic)
Snowball sampling Key informants from a range of organizations were identified as having suitable knowledge on the study themes or access to a database of suitable participants Key informants identify and recruit potential collaborators in target organizations
Purposive sampling Individual managers identified through an established database
Purposive sampling A specific number of known members of one organization selected to participate. In-depth exploration of one trail setting
Key features Open-ended narrative questions Unstructured format Exploratory approach that allows flexibility for respondents to explore in depth and qualify their answers on key concepts in unlimited ways.
Closed questions Structured format Consider predetermined specific issues relating to trail management Evidence of existing and future management actions relating to specific themes Answers are specific to selected management themes
Facilitated workshop series including presentations, surveys, group work and open feedback sessions Direct communications with key actors
Outcome of Approach
Visionary/ New Concept developmentNew Management Scenarios Ideal features of a sustainable trail management framework World position and identification of key issues, actors, indicators related to sustainable trail management
Current Position Management Trends Lay out the major positions taken, and not taken in relation to specific trail management activities Identify areas of concern around trail management issues
Applied Vision/Theory Application and evaluation of the sustainability theory in a specific management context
Table 1: Overview of methodologies applied to address the three research themes defining sustainable trail management, managementpractice and development of a sustainable management model.

Sustainability and Carrying Capacity Studies in Recreational Settings
175
related issues. There was an absence of skilled and trained staff whose remit could address as-pects of trail management. Most of the employ-ees involved in trail management activities were permanent staff responsible for the management of the conservation areas as well as attending to a range of issues relating to trail planning, maintenance, assessment, information provi-sion and administration. Additional support for trail maintenance was achieved through part-time, seasonal and casual volunteers. External contractors were used mainly for trail construc-tion. There was limited training and assessment of work performance of staff in relation to trail-related responsibilities.
Despite the diversity of challenges in relation to recreation and other land use activities that can occur in conservation areas, very few man-agers had adopted integrative planning proce-dures such as the C-CAP, LAC and VIM frame-works, although there was a request for more information on the LAC model. Further infor-mation was also requested by managers on how to develop trail management plans.
Study three: The NWWAC Visionary and Action Planning Exercise
The visioning and action planning process high-lighted first the key management strengths, prob-lems and challenges that existed in the national trail network. Key issues that required attention were the unsuitability of the long-distance con-cept as a basis for Waymarked Way design, poor trail planning, routing and maintenance, lack of linkage to surrounding facilities and accommo-dation, and lack of local awareness. The local committee members identified limitations such as fragmented and erratic funding, lack of local community involvement and long-term commit-ment, lack of young people represented in man-agement activities and lack of group support and co-ordination.
On a consensus basis, the local committee mem-bers worked with the agreed set of issues and cre-ated a set of priority action goals for tackling the sustainable development of the network. In to-tal, four key Waymarked Way vision areas for sustainable development were agreed upon by the executive and local management committee
Level I Long term development and wellbeing of the trail ecosystem
Level II
Environmental Political Social
Access
Economic
Soil erosion Bare and trampled width Overall % cover Soil type, condition Landscapes the trail crosses Disruption to adjacent land Litter Solar aspect Scenic views Exposure Noise levels Effectiveness of maintenance
Legislation Government
support
Access Accommodation Services Interest and
variety levels User information Levels of use Conflict levels
between user/owner groups
Employment Level of
volunteering Level of
maintenance Safety Level of
community involvement
Level of monitoring
Budgeting Financial
backing Maintenance
costs/year Revenues
generated
Figure 1: Key indicators for a sustainable trail.

Sustainability and Carrying Capacity Studies in Recreational Settings
176
members relating to the local community, land management, research and trail management. A total of twenty more specific actions or indicators for change were identified in order to achieve the four key visionary Waymarked Way goals.
Of priority, the local management committees throughout the national network agreed that the lo-cal community were the core focus of a sustainable vision. The sustainable development of the Way-marked Way network would require management activities that enhance local community involve-ment, use of trails and benefits from related trail developments, including enhanced accessibility and increased use of trails, employment opportuni-ties, and education and health benefits.
The vision and action plan marked a sharp shift in values from the previously adopted long distance management model where tourists were the sole beneficiaries of trail developments to a sustainable management model that was based on local com-munity input, commitment and benefits.
To support and help achieve the action plan, the local committee members identified an expansive and diverse set of potential national, regional and local stakeholders and governmental departments in the areas of agriculture, conservation, forestry, education, heritage and recreation.
Conclusion
The key components for a sustainable trail were defined both at a theoretical level through the sus-tainable trail debate and in an applied context through the NWWAC visionary process. In both studies there was a shift from considering one as-pect of sustainability to considering economic, so-cial and environmental dimensions together. The sustainable trail debate depicted the “sustainable trail” as fundamentally a multi-dimensional con-struct that reflects broadly an overarching long-term and integrated consideration of social, envi-ronmental and economic trail issues.
The findings highlighted that maintenance of cer-tain necessary or desired characteristics of trail management settings is central to a “sustainable trail”. However, the characteristics of a sustain-able trail management setting are value-based and
scale-based and as a result there is no ideal set of trail features that depict a well-maintained “sus-tainable trail”. The submissions revealed that there are multiple definitions, scales, trail features, man-agement settings, landscapes, social, environmen-tal and economic issues that can contribute to the concept.
In practical application, the sustainable principles are more clearly understood at a national scale, as when applied to the National Waymarked Ways network. At this scale, the definition for a “sustain-able trail” outlined issues that were at the heart of Waymarked Way management challenges and as-pirations.
The vision that emerged from the NWWAC con-sultative process is:
“For local communities throughout Ireland to cre-ate, manage and use a network of scenic and di-verse walking routes that are of a quality that:
Makes the best use of local knowledge and awareness, facilities and available resources,
Brings economic and social opportunities into the locality, and
Protects our natural heritage and environment for future generations.”
The study also demonstrates that in a specific set-ting, the application of sustainable principles may result in tradeoffs between social, environmental and economic goals. Although all three sustain-able goals were incorporated into the final shared NWWAC vision, not all three cornerstones were equally addressed in the action plan. Since the lo-cal community was identified as the key means for the NWWAC to achieve sustainability, most of the vision and action goals were related to ways of achieving local community involvement in trail management activities and increased participa-tion and benefits in trail related activities. The lo-cal committee members anticipated that economic and environmental benefits would be achieved as a consequence of this social focus.
The sustainable trail concept developed sharply contrasts with the trends that emerged in the review of international trail management practices and challenges. In practice, there was no clear sense of trail development or management reflecting

Sustainability and Carrying Capacity Studies in Recreational Settings
177
an integrative approach towards environmen-tal, social and economic issues. In particular, very few managers adopted recreation planning frameworks such as LAC which are considered as useful decision-making models for integrat-ing multiple issues, activities and perspectives. Planning was solely addressed through physi-cal trail design, construction and maintenance activities.
Achieving a sustainable trail is difficult where staffing and land use issues take priority over trail management. The manager survey results suggest that trail maintenance is more “wait and see” with focus on repair and recovery activi-ties, rather than maintenance and improvement of the original conditions or setting. This con-trasts with findings in the sustainable debate study and the planning approach taken by the NWWAC, which create a sense of overall con-cern about the future from the perspective of a trail organisation, a community or the environ-ment. The studies emphasise that the time ho-rizon of planning for sustainable trail develop-ment is long-term, and incorporates more than one phase of a trail life cycle such as trail con-struction or trail maintenance. It spans trail de-sign and exploration through to closure or re-newal of a site. Thus, short- and long-term concerns come into play.
What are the indicators for a sustainable trail?A suite of indicator levels and categories emerged as a result of the theoretical and applied studies, as follows:
a. Core values
There proved to be unshakable and absolute core of sustainability values common to both the debate study and the visionary exercise that were precursory to the process of identifying suitable and specific sustainable trail indicators. There was a mutual and accepted understand-ing that a sustainable trail process must reflect the three cornerstones of sustainable develop-ment that maintain and develop in parallel and together the environment and respects the live-lihoods and needs of people in the setting. It fol-lows that the “result” against which the success
of a trail development or trail management activity should be judged is the achievement of, or the con-tribution to, human and ecosystem well-being to-gether.
Expanding from these findings there are two dif-ferent ways of organizing possible sustainable in-dicators.
b. Theoretical approach: Generic indicator groups
In the debate, the participants were asked to theo-retically recommend key indicators for a sustain-able trail in general terms. The indicators were clas-sified into four broad and generic environmental, social, economic and political sectors. The environ-mental cornerstone received the most diverse range of indicators and levels of detail. In particular, the participants elaborated upon specific features such as trail path width, amount and type of vegetation and soil condition. The remaining three areas of so-cial, economic and political aspects yielded more general indicators.
c. Applied approach: Visionary action plan
The Waymarked Way study highlighted indicator requirements at a national scale and the findings suggest that a more comprehensive basis for indi-cator development could be achieved at this level. In total, four key Waymarked Way vision areas for sustainable development were agreed by the execu-tive and local management committee members re-lating to the local community, land management, research and trail management. A total of twenty more specific actions or indicators for change were identified in order to achieve the four key visionary Waymarked Way goals. Although the action goals were qualitatively devised, there are signs in this first-step study of attempts to set measurable goals within a broad integrative planning framework. Management priorities and timescales were de-vised and understood by the group as a whole that were organised into short, medium and long term objectives. It also became clear, that for each of the actions under the four key management themes a range of partnerships and management bodies were responsible for supporting and achieving the action goals. The three different levels of indicator feed-back that emerged in these studies suggest that in-dicator representation in the trail setting must be
Sustainability and Carrying Capacity Studies in Recreational Settings
178
wider than a consideration of ecological factors alone. Just as the NWWAC study emphasised the importance of the social dimension of trail devel-opment, this is further supported by the internation-al survey of trail management trends in conserva-tion areas where the ecological aspects of trail use were placed in context of the multiple land, recre-ation uses, diverse impacts and management issues to be addressed. With many issues to address it ap-peared that management had little time or resourc-es to develop detailed trail deterioration assess-ment and monitoring protocols. Instead, managers adopted simple assessment procedures that used coarse environmental trail damage indicators that were measured subjectively and qualitatively. Very few managers assessed detailed aspects of environ-mental trail damage such as changes in vegetative structure but used other indicators mainly associat-ed with user impacts such as litter, visual intrusion, overcrowding, noise and wildlife impacts to deter-mine quality of the route. With multiple physical, environmental and social indicators to consider on the immediate trail sur-face, it is clear that in a management setting where many responsibilities and issues are at play, that a broad set of indicators are more appropriate and can be assessed simply and efficiently.
How do you achieve a sustainable trail?There are no universally accepted indicators or ex-amples of how to measure and achieve a sustain-able trail. In the sustainable debate study, a set of broad crite-ria were highlighted as significant in supporting the evolution of such a process including the long-term commitment and participation of the local commu-nity, support at a governmental level, integration of trail issues with wider policies such as the envi-ronment, health and the economy. In essence, trail settings require a broad and wider recognition and integration by multiple land use and development sectors so that they can be developed in a sustain-able manner. The three broad cornerstones of sustainable devel-opment that are recognised globally, together with Hugo’s comprehensive trail management model (1999) are useful as a benchmark for managers to evaluate existing approaches towards trail manage-ment and development in diverse settings. The ho-
listic nature of the sustainable trail concept enables standards to be set that managers can measure with their own experiences and practices. In the man-agement of trails in protected areas existing man-agement practices contrasted sharply with the ide-al of sustainable trail management. It was clear that managers were involved in a matrix of land use is-sues and associated management problems with lit-tle room for a detailed trail planning framework that could integrate specifically all aspects of so-cial, environmental and economic trail develop-ment. Feedback from the international survey sug-gested that trail management was not a key area of concern and as a result there were limited resourc-es, funding and personnel available to support trail development and management activities. Further-more, there was limited awareness and knowledge of aspects of trail management such as trail degra-dation assessment, monitoring and maintenance.
With the experience gained from the sustainability debate study and the NWWAC case study, there is much scope for trail management settings to adopt planning frameworks that are rooted in the princi-ples of sustainable development.
The NWWAC study demonstrated the need to plan sustainable trails at a national level so that the sus-tainability principles could be transferred to region-al and local scales of application. The NWWAC study concluded with one mutually shared set of objectives within a network that reflected many dif-ferent types of trails and issues as well as chang-es in user demands. This lead to a transformation in the identity of the network from being solely a long distance route provider to a more expansive and diverse set of multiple short community-based recreation routes that reflected contemporary soci-etal demands.
References
Hugo, M.L. (1999). A comprehensive approach towards the planning, grading and auditing of hiking trails as ecotourism products. In: Current Issues in Tourism (2/2&3), p 138-173.
Marion, J.L. & Leung, Y.-F. (2004). Environmentally sus-tainable trail management. In: Buckley, R. (ed.). En-vironmental Impact of Tourism, p 229-244. Cam-bridge.

Siegrist, D., Clivaz, C., Hunziker, M. & Iten, S. (eds.) (2006). Exploring the Nature of Management. Proceedings of the Third International Conference on Monitoring and Management of Visitor Flows in Recreational and Protected Areas.
University of Applied Sciences Rapperswil, Switzerland, 13-17 September 2006. Rapperswil.
179
The Adoption of Social Carrying Capacity for the Management of Theme Park Settings
Hsin-You Chuo
National Chung Hsing University, Taiwan
Keywords: Crowding norms, theme parks, Taiwan.
Abstract: In order to manage the quality of visitor experience, social carrying capacity has been prevailingly applied to the planning of contemporary parks and natural environments. The common underlying logic of the applications is that carrying capacity can be determined through the identification of management objectives and associated indicators and standards of quality. Indicators can be monitored over time and carrying capacity is reached once standards have been reached. In this study, visitors’ “reported queuing time” for using their favorite facilities in theme parks was adopted as the indicator. Accordingly, visitors’ crowding norms, the queuing-norm-crowding relationship, and the applicability of social carrying capacity to the management of theme park settings were analyzed and discussed respectively.
Introduction
As applied to outdoor recreation from wild-life management, carrying capacity has evolved from a primary emphasis on ecological impacts to a dual focus which includes social consid-erations. The ecological aspect of concern re-fers to the integrity of the resource base which implies some threshold or tolerance level af-ter which further exploitation or use may cause permanent damage to the natural ecosystem. From the social point of view, as more people visit a particular natural area, not only the en-vironmental resources of the area are affected, but also the quality of the visitor experience. Accordingly, social carrying capacity has been prevailingly applied to the planning of contem-porary parks and to natural environments in the US. The common underlying logic of the appli-cations is that carrying capacity can be deter-mined through the identification of management objectives and associated indicators and stan-dards of quality. Indicator variables can be mon-itored over time and once standards have been reached, carrying capacity has been reached as well. In order to manage the quality of visitor experience in a particular natural area, visitor’s perceived crowding is usually used to represent
the magnitude of deterioration caused by the increasing number of visitors. As a result, the notion of social carrying capacity has become closely associated with the concept of crowding (Stankey & McCool 1989).
Crowding can be defined as a negative evaluation of a certain density level in a given area (Fleish-man, Feitelson & Salomon 2004, Gramman 1982, Lee & Graefe 2003, Vaske, Shelby, Graefe & He-berlein 1986). The term “perceived crowding” is often used to emphasize the subjective or evalu-ative nature of the concept. Perceived crowding combines descriptive information (i.e. the den-sity experienced by the individual) with evalua-tive information (i.e. the individual’s evaluation of that density) (Vaske & Donnelly 2002). In this context, the density experienced by the visitors in a natural environment is represented by the in-dicator variable “reported encounter” and crowd-ing is a negative evaluation of those encounters. In other words, visitors’ perceived crowding in-volves a value judgment that the number of en-counters they had exceeds their definition of an acceptable standard.
Norms are the standards that individuals use for evaluating the conditions they experienced as good or bad, better or worse (Vaske et al. 1986).

Sustainability and Carrying Capacity Studies in Recreational Settings
180
While social norms are those norms which are per-ceived by the individual to be shared by collec-tive members in a society, personal norms arise from within the individual as feelings of moral ob-ligation (Roggenbuck, Williams, Bange & Dean 1991). Since social norms are assessed by aggre-gating the personal norms, researchers (Donnelly, Vaske, Whittaker & Shelby 2000, Roggenbuck et al. 1991) have been interested in some characteris-tics of social norms, such as norm prevalence and crystallization of norms, derived from data at the individual level. In this context, norm prevalence refers to the percent of respondents giving a norm, and crystallization of norms refers to the level of collective consensus or agreement. In addition, re-searchers (Vaske & Donnelly 2002) have also been interested in the theoretical relationship between encounters, norm, and perceived crowding—when encounters exceed a visitor’s norm for seeing oth-ers, perceived crowding will increase.
This study attempts to apply social carrying ca-pacity to the management of theme parks—recre-ation settings that built in forms of artificial en-vironments. Most early crowding studies focused primarily on wilderness areas (Manning 1999), recently, researchers have become interested in crowding issues within frontcountry settings (e.g. Kuentzel & Heberlein 2003; Manning, Lime, Fre-imund & Pitt 1996, Roggenbuck et al. 1991, Tar-rant & English 1996, Vaske, Donnelly & Petruzzi 1996). While concepts derived from management of social carrying capacity have repeatedly been shown to be important for backcountry visitors, re-search that explores the types of norms and impact indicators appropriate for frontcountry settings would facilitate this understanding (Vaske & Don-nelly 2002; Vaske, Donnelly & Whittaker 2000). Furthermore, Westover and Collins (1987) claim that the extension of crowding studies to urban set-tings has both theoretical and pragmatic signifi-cance. However, since the reported encounter is less useful in high density than in low density envi-ronments (Heywood 1993, Shelby & Vaske 1991), visitors’ “reported queuing time” for using their fa-vorite facilities in theme park settings was adopted as “impact indicator” to represent the magnitude of their experienced density. This study attempts not only to analyze prevalence and crystallization
of visitors’ crowding norms and the queuing-norm-crowding relationship but also to discuss the appli-cability of the normative approach extending from natural to artificial environments and the market-ing implications of the results of this study. Ac-cordingly, the following six research questions were developed:
1. What is the respondents’ prevalence of crowd-ing norms for acceptable queuing time in theme park settings?
2. What is the respondents’ level and crystalliza-tion of crowding norms in theme park settings?
3. Will respondents’ perceived crowding increase when reported queuing time exceeds their norms for queuing? In other words, is the perceived crowding of respondents who reported that queu-ing time (T) exceeded their crowding norms (N) different from those who reported that T did not exceed their N?
4. Is there a significant linear correlation between respondents’ reported queuing time (T), crowding norms (N), and perceived crowding?
5. Are there differences or similarities in the corre-sponding findings derived from natural and artifi-cial environments?
Methods
The target population for this study was visitors to the five leading theme parks in Taiwan (i.e. Jenfusan, Leofoo, Yamay, Formosan Aborigi-nal Culture Village, and Window on China). A quota sampling technique was employed to se-lect elements of the research sample from the sampling population based on the official report (Tourism Bureau 2004) on annual attendance to domestic theme parks in Taiwan in 2003. The field survey for data collection was conducted between April and June of 2004. Junior students from a local university were trained as inter-viewers for data collection. Interviewers sta-tioned near the exit gates of the five parks invit-ed departing visitors to participate in this study. All subjects were selected based on their will-ingness to volunteer their personal information on site. For all analyses, a significance level of p < 0.05 was used.

Sustainability and Carrying Capacity Studies in Recreational Settings
181
In order to contrast the results of this study with the results obtained from the natural environments, the single-item scale (shown in Figure 1) devel-oped by Heberlein and Vaske (1977) was adopt-ed in this study. Since findings using this measure of crowding have been compiled from 35 stud-ies addressing 59 different natural areas and more than 17,000 visitors, this diversity of applications suggests that investigators have found this single item measure of crowding to be universally use-ful (Shelby, Vaske, & Heberlein 1989). In this sin-gle-item scale (ranging from 1 to 9), the first two points label the situation as uncrowded, and the re-maining seven points label it as crowded to some degree.
In this study, there is also a question for measuring crowding norms that asks respondents to give the longest queuing time they would tolerate for their favorite facilities, with a response of “makes no difference to me.” Some researchers (Hall & Shel-by 1996; Hall, Shelby & Rolloff 1996; Manning et al. 1996; Roggenbuck et al. 1991) have included a third response category “makes a difference but can’t give a number.” Although the three-choice option provides respondents with a more exhaus-tive set of response categories, this study did not include the third response category because the de-rived findings may have less managerial relevance (Donnelly et al. 2000).
Results
By using quota sampling technique, a research sam-ple consisting of 1,440 respondents was obtained from visitors to the five leading theme parks. The result shows that the distribution patterns of the re-spondents’ demographics were consistent with the practical observation of theme park visitors’ char-acteristics in the real world.
Donnelly et al. (2000) reviewed 30 different crowding studies, representing 56 norm evaluation contexts in natural environments (26 in backcoun-try and 30 in frontcountry settings) from 20 years of research. The results of their analysis showed
that the average norm prevalence was 70%, the median was 71%, and the standard deviation was 18%. In detail, norm prevalence in backcoun-try (mean = 81.2%, SD = 15.9) was significantly higher than in frontcountry (mean = 60.7%, SD = 13.8) evaluation contexts in terms of reported en-counters. The result of this study shows that 63.4 % of the respondents in theme park settings speci-fied their crowding norms in terms of queuing time for using their favorite facilities. By comparison, prevalence of theme park visitors’ crowding norms was lower than the mean of all crowding studies conducted in natural environments as a whole, but higher than the average norm prevalence in front-country evaluation contexts specifically.
The 913 respondents who indicated specific ac-ceptable queuing time for using their favorite fa-cilities in theme park settings demonstrate high-ly crystallized consensus or shared agreement. Roggenbuck et al. (1991) suggest that crystalliza-tion (or dispersion) can be portrayed by both the coefficient of variation and the range of maximum acceptable queuing time between the first and the third quartiles of respondents. Table 1 lists the median, the maximum acceptable queuing time for the first and the third quartile of respondents with the most restrictive norms, mode, mean, stan-dard deviation, the range, and coefficient of vari-ation for the distribution of the 913 respondents’ norms for queuing (i.e. the upper limit of accept-able queuing time). Since this study used differ-ent impact indicator (i.e. queuing time) from the indicator (i.e. encounters) widely adopted in other crowding studies, in order to compare results de-rived from different scales, coefficient of variation becomes the most appropriate measure represent-ing level of norm crystallization. Accordingly, the level of crystallization found in this study (C.V. = 0.6358) is much more significant than the levels found in previous crowding studies (e.g. C.V. rang-es from 0.94 to 1.74 in Roggenbuck et al. 1991) which have been conducted in natural environ-ments. In addition, the median (15 minutes) repre-sents the length of queuing time which 50% of the
1 2 3 4 5 6 7 8 9 Not at all Crowded Slightly Crowded Moderately Crowded Extremely Crowded
Figure 1: Standardized measure of perceived crowding.

Sustainability and Carrying Capacity Studies in Recreational Settings
182
respondents would find unacceptable. Since the norms are highly crystallized, 75% of the respondents would find acceptable if the length of queuing time could be lowered slightly to 10 minutes.
A statistical relationship of queuing—norm—crowding was observed that when respondents’ reported queuing time exceeded their norma-tive limits of tolerance, their perceived crowd-ing increased significantly. The result shows that 88.2% of the respondents reported short-er queuing time than their norms, while 11.8% reported longer queuing time than their norms. Mean perceived crowding were significantly higher for respondents reporting longer queu-ing than their norms (t = 6.397, p < 0.000). When the reported queuing time was short-er than the norm, respondents felt “slightly” crowded with an average score of 3.67. On the contrary, when reported queuing time ex-ceeded the norm, respondents felt “slightly” to “moderately” crowded with an average score of 4.85.
Table 2 shows the correlation between those who reported longer or shorter queuing time than their norm tolerance and perceived crowd-ing across all evaluation contexts. Since a statistical relationship was observed across all theme park evaluation contexts, only the strength (effect size) of the relationship in sum was examined in this study. Across all 5 eval-uation contexts, the average correlation was 0.237 with significance at a 0.001 alpha level. According to Malhotra (1999), this result sug-gests that the strength of the queuing—norm—crowding relationship can be characterized as “small” to “medium.”
Discussion and conclusionSince the relatively importance of encounters de-creases in situations where visitors expect numer-ous others to be present, Donnelly et al. (2000) suggest that researchers should identify which impacts are important to the setting being stud-ied and measure not only encounters but other im-pact indicators. According to the results of this study, visitors’ queuing time for using their fa-vorite facilities seems to be an appropriate impact indicator representing negative impacts of the density in artificial environments such as theme park settings. By adopting the impact indicator, the results of this study consistent with previous findings in Donnelly et al. (2000) that evaluation contexts with norm prevalence scores lower than the median score (71%) of all crowding studies are more often higher density settings.
ReferencesDonnelly, M.P., Vaske, J.J., Whittaker, D. & Shelby, B.
(2000). Toward an understanding of norm preva-lence: A comparative analysis of 20 years of re-search. In: Environmental Management (25/4), p 403-414.
Heberlein, T.A. & Vaske, J.J. (1977). Crowding and vis-itor conflict on the Bois Brule River (report WISC WRC 77-04). University of Wisconsin Water Re-sources Center.
Manning, R.E. (1999). Studies in outdoor recreation: Search and research for satisfaction. Oregon State University Press.
Roggenbuck, J.W., Williams, D.R., Bange, S.P. & Dean, D.J. (1991). River float trip encounter norms: Ques-tioning the use of the social norms concept. In: Jour-nal of Leisure Research (23/2), p 133-153.
Shelby, B., Vaske, J.J., & Heberlein, T.A. (1989). Compar-ative analysis of crowding in multiple locations: Re-sults from fifteen years of research. In: Leisure Sci-ence.
Median 1st Quart Mode Mean S.D. Minimum Maximum C.V. 15 mins 10 mins 10 mins 17.9 mins 11.38 0 mins 60 mins .6358
N = 913
Table 1: Level and Crystallization of Crowding Norms in Theme Parks.
Mean S.D. Pearson’s r Significance T-N (minutes) -8.12 12.21 Perceived crowding* 3.81 1.83
.237 .000
N = 895
Table 2: Relationship between Reported Queuing Time (T), Norms (N), and Perceived Crowding.

Siegrist, D., Clivaz, C., Hunziker, M. & Iten, S. (eds.) (2006). Exploring the Nature of Management. Proceedings of the Third International Conference on Monitoring and Management of Visitor Flows in Recreational and Protected Areas.
University of Applied Sciences Rapperswil, Switzerland, 13-17 September 2006. Rapperswil.
183
Recreation Carrying Capacity Analysis at Khao Leam Ya – Mu Ko Samed National Park, Thailand
Dachanee Emphandhu1, Thamasak Yemin2, Sura Pattanakiat3, Chatchai Tantasirin1, Ranuka Ruschano1, Surachet Chettamart1 & Mayuree Nasa1
1Kasetsart University, [email protected]
[email protected][email protected]
[email protected]@hotmail.com
2Ramkhamhaeng University, [email protected]
3Mahidol University, [email protected]
Keywords: Recreation carrying capacity (RCC), impact, national park, Thailand.
Abstract: The objective of this research was to determine recreation capacity at Khao Leam Ya - Mu Ko Samed Na-tional Park (LY-KS NP). The study investigated the existing capacity of recreation resources by analyzing four capac-ity types: ecological (ECC), physical (PCC), facility (FCC), and social (SCC). This paper presented the findings on 3 main islands: Ko Samed, Ko Kudee, Ko Talu, and some snorkeling sites. The results found the ECC, PCC, and FCC exceeded at Ko Samed. At Ko Kudee, found the exceeded PCC while at Ko Talu found the exceeded PCC and FCC. One snorkeling site found FCC exceeded. The maximum carrying capacity at Ko Samed and Ko Kodee was 4,100 and 168 people per night respectively. Most ecological carrying capacities, however, have not yet determined since long term monitoring is needed.
Introduction
Khao Leam Ya - Mu Ko Samed National Park (LY-KS NP) experiences high recreational use as a pop-ular marine park near Bangkok. Visitors come to enjoy park scenery, snorkeling and beach activi-ties. Annual visitor numbers have almost doubled from 265,248 to 437,017 from 2003 to 2005. The focus of this research was to establish a long term monitoring programme of recreational impacts and assess recreation capacity at LY-KS NP.
Methods
The study followed Shelby and Herberlein’s (1986) definition of recreation carrying capacity as “the level of use beyond which impacts exceed stan-dards”. The study investigated the existing capac-
ity of recreation resources in the study area by an-alyzing four capacity types: ecological, physical, facility, and social. The results presented here were from 2004-2005 with data collection carried out during high tourist season, October through May.
For the ecological carrying capacity (ECC), the researchers identified the national park conserva-tion targets (CTs) to set up indicators for long term monitoring of recreation capacity analysis. They were water quality, percentage of root exposure and vegetation regeneration on trails, amount of garbage and visual quality related to garbage man-agement and percentage of changes in live coral coverage at diving sites. Information on visitor use such as number of visitors and their behavior at each recreation site was related to the existing ecological impacts upon the CTs indicators. Two

Sustainability and Carrying Capacity Studies in Recreational Settings
184
workshops with park managers, ecologists, ma-rine scientists, and the research team were held to set the acceptable impact levels for these indica-tors. Finally, the RCC analysis model was devel-oped with 3 levels of impacts: exceeding capacity/extreme impacts, approaching or at capacity/ mod-erate impacts, and below capacity/low impacts.
Physical carrying capacity (PCC) was determined by assessing the impact of available space on rec-reation. The researchers analyzed the Recreation Opportunity Spectrum (ROS) using GIS. Recre-ation space was measured together with the space required by a visitor for each recreation activity in different ROS zones. The visitor number at each recreation site was recorded to determine the im-pact of available space. The levels of impacts relat-ed to carrying capacity were classified into 3 levels: exceeding capacity/extreme impacts, approaching or at capacity/moderate impacts, and below capac-ity/low impacts with the acceptable impact of each level set at more than 80%, 50 to 80%, and less than 50% of maximum number of people at one time (PAOT) the space can accommodate, respectively.
Facility carrying capacity (FCC) examined whether facilities were able to accommodate existing visitor use and classified impacts into 3 levels: exceeding capacity/extreme impacts, approaching or at capac-ity/moderate impacts, and below capacity/low im-pacts with the acceptable impact of each level set at more than 80%, 50 to 80%, and less than 50% of maximum number of people at one time (PAOT) the facility can accommodate, respectively.
Finally, the social carrying capacity (SCC) was studied at selected recreation sites by a question-naire survey of 342 respondents by opportunistic sampling. The crowding scale was set from 0 to 9 where 0 means not at all crowded and 9 means ex-tremely crowded. The standard of visitor crowding impact was also set to determine the existing lev-el of social impact. ROS was also employed here to identify the desired visitor experiences against their actual experiences. The levels of impacts re-lated to social carrying capacity were classified into 3 levels: exceeding capacity/extreme im-pacts, approaching or at capacity/moderate im-pacts, and below capacity/low impacts which
Figure 1: The overall research process of recreational capacity analysis at LY-KS NP.

Sustainability and Carrying Capacity Studies in Recreational Settings
185
Table 1: RCC indicators and acceptable impact levels for LY-KS NP.
Recreation capacity Recreational capacity Levels indicators Below capacity At or Approaching
capacityExceeding capacity
Impacts Low or No concern High to Moderate concern
Extreme concern
Ecological Capacity - Amount of soil loss from gully
erosion on dirt road (ton/ha) <25% of road area found soil erosion more than 31.25
ton/ha
25-50% of road area found soil
erosion more than 31.25 ton/ha
>50% of road area found soil erosion more than > 31.25
ton/ha- Root exposure (area in sq. m) <25 % of the entire
area of trail 25-50 % of the
entire area of trail > 50 % of the entire
area of trail - Sea water quality
Temperature TurbiditypHSalinityDOTotal Fecal coliform Oil film
Reference from the water quality standard for coastal water (Office of Natural Resources and Environmental Policy and Planning,2004)
- Fresh water quality Temperature TurbiditypHSalinityBODDOTotal Fecal coliform Oil film
Reference from the water quality standard for inland fresh water for recreation uses (Office of Natural Resources and Environmental
Policy and Planning.2004)
- Garbage Smell/ odor No smell within 20
metersSlight to moderate
smell within 20 meters
Severe or bad smell/odor within
20 meters Visual impact No garbage/litter
found outside garbage can
Found some garbage/litter
outside garbage can causing moderate
visual impact
Found a lot of garbage/ litters that cause high visual
impact
Garbage amount (kg/person/day)
<0.8 0.8-1.5 >1.5
- Plant regeneration (Difference in number of seedlings from 1x1 sq m permanent plots between disturbed area next to trail and undisturbed area)
Important Species (CTs): Mallotus floribundus Memecylon geddesianumMemecylon cyaneum Hydnocarpus ilicifolius
<25% of Difference in No. of seedlings
25-50% of Difference in No. of
seedlings
>50% of Difference in No. of
seedlings
Physical Capacity - Number of People at One Time
(PAOT) the space can accommodate
Less than 50% of the max. PAOT
50 to 80% of the max. PAOT
>80%of the max. PAOT
Facility Capacity - Number of People at One Time
(PAOT) the facility can accommodate
Less than 50% of the max. PAOT
50 to 80% of the max. PAOT
>80%of the max. PAOT
Social Capacity - Perception of Crowding, scale
from 0-9 0-3 >3-5 >5
- Decreased % of live coral reef coverage (before and after high season)
<25% 25-50% >50%

Sustainability and Carrying Capacity Studies in Recreational Settings
186
Table 2: RCC analysis of root exposure at KBT and KKD trails.
Capacity Levels Standard value (% root exposure
% of trail area where root exposure density found
density) KBT trail KKD trail Below CC (No/ Low impact)
<25 96.15 92.63
At and Approaching CC (Medium impact)
25-50 2.25 6.32
Exceeding CC (High impact)
>50 1.60 1.05
Total 100 100
Table 3: Water quality and recreational capacity analysis at LY-KS NP.
Data Water quality indicators and capacity level 1/collection sites Temper
ature 1/C
Turbidity3/
pH 1/ Salinity 1/(PPt)
DO 1/ BOD 3/ Total Fecal
Coliform 2/
(MPN/100ml)
Oil film Total CC Level
29.9 7.97 8.05 0.1 6.3 1.8 <2 No trace 1. Reservoir Koh Samed
Below Exceed Below - Below Exceed Below Below
Exceed
29.5 1.50 8.13 28.5 6.1 <2 Seen some
2. Sai Keaw
Below Below Below Below Below - Below Approach
Approach
29.8 1.03 8.17 28.7 6.5 <2 No trace 3. Wong Deun
Below Below Below Below Below - Below Below
Below
28.9 1.79 8.16 28.7 5.9 <2 No trace 4. Lung Dam
Below Below Below Below Below - Below Below
Below
29.1 1.98 8.21 28.7 6.2 <2 No trace 5. Aao Kew Na Noak
Below Below Below Below Below - Below Below
Below
28.8 1.60 8.12 28.8 6.3 <2 No trace 6. Aao Kew Na Nai
Below Below Below Below Below - Below Below
Below
29.7 2.11 8.05 28.6 6.2 <2 No trace 7. Aao Praw
Below Below Below Below Below - Below Below
Below
29.2 1.70 8.15 28.7 6.5 <2 No trace 8. Koh Kudee diving site
Below Below Below Below Below - Below Below
Below
28.9 1.62 7.70 28.7 5.8 <2 No trace 9. Koh Talu diving site
Below Below Below Below Below - Below Below
Below
28.7 1.81 8.13 28.7 5.9 <2 No trace 10. Koh Jan diving site
Below Below Below Below Below - Below Below
Below
29.3 1.27 8.04 28.6 6.1 <2 No trace 11. Leam Rue Taek diving site Below Below Below Below Below - Below Below
Below
29.9 8.7 7.93 28.7 5.1 350 Seen some
12. Nuantip pier
Below Exceed Below Below Below - Below Approach
Exceed
29.2 2.92 8.26 28.7 5.2 27 Seen some
13. Na Dan pier
Below Below Below Below Below - Below Approach
Approach

Sustainability and Carrying Capacity Studies in Recreational Settings
187
the acceptable impact of each level was set by the crowding scale of more that 5, 3 to 5, and 0-3, respectively. The social carrying capacity did not cover the study of perception of local people living nearby the national park.
After the four carrying capacities were investi-gated, the overall capacity of each recreational site was determined. The researchers identified what carrying capacity type limited the recre-ation use of each site by locating the highest im-pact found among the four carrying capacities. Figure 1 shows the overall research process and table 1 shows the recreational capacity analy-sis indicators and their acceptable impact lev-els. This paper presents the findings on 3 main islands: Ko Samed, Ko Kudee and Ko Talu.
Results and Discussion
Soil loss and root exposure Only 5.92 % of the total dirt road area had soil loss >31.25 T/ha. The soil loss impact was still low and below capacity level. Impacts on root exposure at Khao Bo Thong (KBT) and Ko Kudee (KKD) na-ture trails were found to be minimal. Only 1.59 and 1.05 % of KBT and KKD trail areas had root expo-sure coverage more than 50 %, which is the highest root exposure density (table 2). The present recre-ation use levels at both trails did not exceed the rec-reation capacity regarding root exposure impact.
Water qualityWater quality parameters with severe and moderate impacts were turbidity, BOD and oil film (table 3). Turbidity values were exceeded at Ko Samed reser-
Table 4: RCC analysis on garbage and litter management at LY-KS NP.
Data collection sites Impacts related to garbage management Odor/smell Visual impact Garbage amount
(kilogram/visitor/day) Overall Capacity
levelKo Samed 1. Garbage rest area /
dumping field Exceeding CC Exceeding CC 2.54 kg/person/day
Exceeding CCExceed
2. Garbage cans position (6 sites)
Below CC Below CC
3. Bo Thong Nature Trail
Exceeding CC Exceeding CC
Ko Kudee and Ko Talu 4. Ko Kudee Nature
TrailBelow CC Below CC No data Below
5. Ko Talu Below CC Approaching CC No data Approach
Table 5: The recreation impacts on vegetation regeneration at KBT and KKD Nature Trails.
Levels of Impact and Capacity Levels
Standardvalue (%)
Decreased number of seedlings between disturbed and undisturbed areas (%)
KBT Trail (number of plots =20)
KKD (number of plots =10)
Mallotus floribun-
dus
Memecylongeddesia num
Mallotus floribun
dus
Meme-cylon
cyaneum
Hydno Carpus- ilicifolius
No/ Low impact (Below CC)
Less than 25%
- 24.4 +22.2 +73.3
Medium impact (At and Approaching CC)
25-50% - 33.7
High impact (Exceeding CC)
> 50% - 87.5
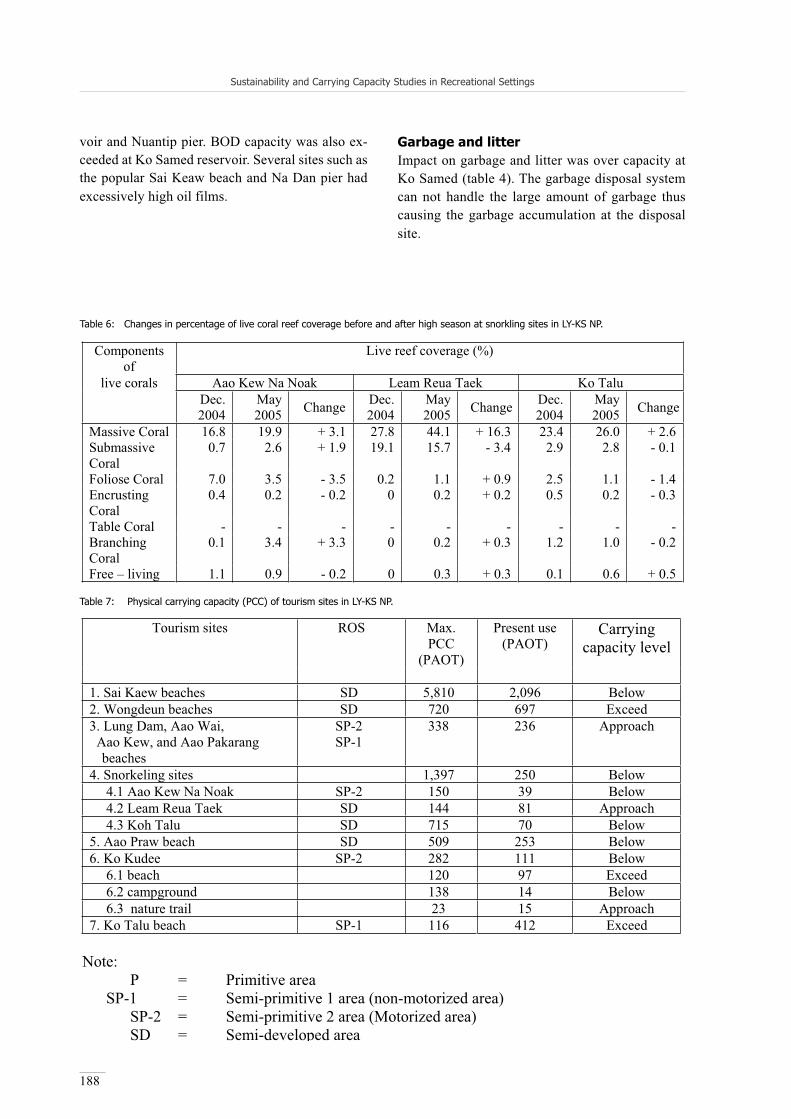
Sustainability and Carrying Capacity Studies in Recreational Settings
188
voir and Nuantip pier. BOD capacity was also ex-ceeded at Ko Samed reservoir. Several sites such as the popular Sai Keaw beach and Na Dan pier had excessively high oil films.
Garbage and litterImpact on garbage and litter was over capacity at Ko Samed (table 4). The garbage disposal system can not handle the large amount of garbage thus causing the garbage accumulation at the disposal site.
Table 6: Changes in percentage of live coral reef coverage before and after high season at snorkling sites in LY-KS NP.
Components of
Live reef coverage (%)
live corals Aao Kew Na Noak Leam Reua Taek Ko Talu Dec.2004
May2005 Change Dec.
2004May2005 Change Dec.
2004 May2005 Change
Massive Coral 16.8 19.9 + 3.1 27.8 44.1 + 16.3 23.4 26.0 + 2.6Submassive Coral
0.7 2.6 + 1.9 19.1 15.7 - 3.4 2.9 2.8 - 0.1
Foliose Coral 7.0 3.5 - 3.5 0.2 1.1 + 0.9 2.5 1.1 - 1.4EncrustingCoral
0.4 0.2 - 0.2 0 0.2 + 0.2 0.5 0.2 - 0.3
Table Coral - - - - - - - - -Branching Coral
0.1 3.4 + 3.3 0 0.2 + 0.3 1.2 1.0 - 0.2
Free – living 1.1 0.9 - 0.2 0 0.3 + 0.3 0.1 0.6 + 0.5
Tourism sites ROS Max. PCC
(PAOT)
Present use (PAOT)
Carryingcapacity level
1. Sai Kaew beaches SD 5,810 2,096 Below 2. Wongdeun beaches SD 720 697 Exceed 3. Lung Dam, Aao Wai, Aao Kew, and Aao Pakarang
beaches
SP-2SP-1
338 236 Approach
4. Snorkeling sites 1,397 250 Below 4.1 Aao Kew Na Noak SP-2 150 39 Below 4.2 Leam Reua Taek SD 144 81 Approach 4.3 Koh Talu SD 715 70 Below
5. Aao Praw beach SD 509 253 Below 6. Ko Kudee SP-2 282 111 Below
6.1 beach 120 97 Exceed 6.2 campground 138 14 Below 6.3 nature trail 23 15 Approach
7. Ko Talu beach SP-1 116 412 Exceed
Note:P = Primitive area
SP-1 = Semi-primitive 1 area (non-motorized area) SP-2 = Semi-primitive 2 area (Motorized area) SD = Semi-developed area
Table 7: Physical carrying capacity (PCC) of tourism sites in LY-KS NP.

Sustainability and Carrying Capacity Studies in Recreational Settings
189
Vegetation seedlings Results from the 1st year data showed only high impact on decreased number of seedlings between disturbed and undisturbed areas at KKD trail for Hydnocarpus ilicifolius which is considered an im-portant species for Dry Dipterocarp forest at LY-KS NP (table 5). These figures however were only
from the first year measurement. Long term moni-toring of this indicator is definitely needed for an accurate recreation capacity analysis.
Recreation sites/ data collection sites
Recreation carrying capacity Recreation uses (persons)
ECC SCC PCC FCC Total
Ko Samed Islands
1. Main dirt road Below - - - Below No Data 2. KBT nature trail Exceed
(garbage)- Below Exceed <10
persons/day 2/3. Reservoir and
nearby dumping field
Exceed (garbage, water
quality)
- - Exceed (Garbage)
Exceed 15,667persons/month 1/
4. Sai Keaw beaches Approach (water
quality)
Approach Below Approach Approach 2,096(PAOT) 2/
5. Wong Deun beaches
Below Approach Exceed Approach Exceed 697(PAOT) 2/
6. Lung Dam beaches Below Below Approach Approach Approach 236 (PAOT) 2/
7. Aao Praw beach Below Approach Below Approach Approach 236 (PAOT) 2/
Ko Kudee Islands
8. KKD nature trail Inconclusive (vegetation)
- Approach - Approach 15 (PAOT)
9. Ko Kudee beach Below Approach Exceed Approach Exceed 97(PAOT) 2/
10. Campground - - Below - Below 14 (PAOT) 2/
Ko Talu Islands
11. Ko Talu beach - Approach Exceed Exceed Exceed 412(PAOT) 2/
Snorkeling sites 12. Aao Kew Na Noak Inconclusive
(coral reef) - Below Approach Approach 39
(PAOT) 2/13. Leam Reua Taek Inconclusive
(coral reef )- Approach Exceed Exceed 81
(PAOT) 2/15. Ko Talu Inconclusive
(coral reef) Below Approach Approach 70
(PAOT) 2/Piers Exceed
16. Nuantip Exceed (Water quality)
- - Approach Exceed No Data
17. Na Dan Approach (Water quality)
- - Approach Approach No Data
1/ Secondary data from high tourism season in 2001-2004 2/ PAOT = People at One Time during visitor survey on weekends and holidays at high
tourism season
Table 8: Summary of the ecological, social, physical, and facility carrying capacities of recreation sites in LY-KS NP.
Sustainability and Carrying Capacity Studies in Recreational Settings
190
Live coral reef coverage Data on the percentage of live coral reef coverage before and after high season is presented in table 6. Most sites experienced decreased coverage. How-ever, at this early stage of our long term research, these figures were inconclusive for RCC analysis.
Physical carrying capacity (PCC) and Social capacity (SCC)
With respect to PCC for beach activities, Wong-deun was over capacity. Many private bunga-lows located in this area together with easy access brought quite a few people here. Ko Talu beach was also considered over capacity. It was designat-ed as a SP-1 recreation opportunity for a quiet and remote experience and had limited beach area and therefore cannot accommodate very large numbers of visitors. However this island is now popular for most tour programs for lunch stops and afternoon relaxation. Ko Kudee is another site that exceeded physical capacity, especially for the beach area. For most snorkeling sites, the spaces are acceptable except at Leam Reua Taek where current numbers approach space capacity. Table 7 presents the analysis of PCC for several sites in the national park.
The over capacity of space for beach activities was consistent with the findings of the social car-rying capacity measured at 4.2 from 9 for Ko Talu and Ko Kudee and 4.0 for Wong Deun beaches. Use levels at Ko Talu, Ko Kudee and Wongdeun beaches are over physical carrying capacity and approaching/at social capacity. The crowding scale at other tourism sites was 3.8 at Sai Keaw and 3.7 at Aao Praw beach, respectively.
Facility Carrying Capacity (FCC)
Most facilities for tourist services in LY-KS NP could accommodate current use levels. Only at the restroom at Ko Talu was over capacity. Since accommodation development at Ko Samed has been very demanding, park management has launched strict regulations for any new develop-ment in Ko Samed to cap the growth. It is expect-ed that the number of overnight stays should not be more than the current figures of 4,100 people per night (inclusive of campgrounds) while Ko Kudee should not exceed 168 people per night.
Overall Carrying CapacityAfter the four carrying capacity assessments were completed, the overall capacity was deter-mined as shown in Table 8. At Ko Samed, the maximum carrying capacity for overnight use is now set at 4,100 people per night, with accom-modation as the constraint. High impact on gar-bage management was also found at this level. However, national park management is trying to reduce garbage impact by launching a strat-egy on visitor management focusing on garbage reduction through interpretation and education-al programs. Several aspects of the ecological impacts analysis for RCC cannot be completed at this time since long term monitoring is need-ed to obtain enough data for meaningful analysis on ecological carrying capacity especially at snor-keling sites.
References
Shelby, B. & Hererlein, T. A. (1986). Carrying Capacity in Recreation Settings. Corvallis.
Office of Natural Resources and Environmental Policy and Planning (2004). Water Quality Standards. Bangkok.

Siegrist, D., Clivaz, C., Hunziker, M. & Iten, S. (eds.) (2006). Exploring the Nature of Management. Proceedings of the Third International Conference on Monitoring and Management of Visitor Flows in Recreational and Protected Areas.
University of Applied Sciences Rapperswil, Switzerland, 13-17 September 2006. Rapperswil.
191
Beyond Carrying Capacity in Recreation Management: In Search of Alternatives
Yves Hausser1, Tony Travis2 & Andrea Finger-Stich1
1University of Applied Sciences Western [email protected]
2University of Birmingham, UK
Keywords: Camping capacity, concept, management tools, ecology.
Carrying Capacity is a largely used concept in the field of recreation. While the notion originates in Pastoralist ecology, the concept has been adapted to various situations in recreation management, in both terrestrial, marine, and freshwater ecosystems and even in urban areas.
The original concept relied on a strong relation-ship between food resource and pastoral pressure; this link has disappeared in the field of recreation. The concept is largely used but in the meantime is subject to an important amount of criticism, shed-ding doubts on the concept’s ability to be replicat-ed in different situations. Many authors who use the concept are very critical when it comes to its field application. It is in fact very difficult to estab-lish a mechanical relationship between the level of frequentation and the degree of impacts.
Despite these criticisms, the concept is still largely used and has been developed in different compo-nents, considering the ecological, economic, soci-ological and lastly perceptual aspects. (Briassiou-lis 2000, Papageorgiou et al. 1999, Buckley 1999). In a historical perspective the concept of carrying capacity has been regularly adapted and readapt-ed to a more integrated ecosystem management approach encompassing social and biophysical dimensions. From pastoral ecology, where the concept estimates mostly biotic processes, its im-portation in recreation ecology meant transferring the specific notion of livestock pressure on pas-tures to evaluating impacts of a large diversity of tourism related activities on ecosystems defined as complex social and natural dynamics. This exten-
sion of the meaning jeopardizes the very relevance of the concept (Cole 2004). Indeed, these last de-velopments have finally added more confusion to the debate, some authors accepting new compo-nents like “perceptual CC” or “sociological CC”, which rely heavily on subjective appreciation re-garding the state of a natural area, while others re-ject it massively. The development of alternatives to the model has never changed this attempt to es-tablish a fixed relationship between degree of use and degree of impacts, not taking into account the limits outlined by Hughes (1999) regarding our limited understanding of ecological processes and through varying spatio-temporal scales.
It is indeed surprising to see that a concept that is so criticised remains largely used, and could more probably be explained by the absence of attractive alternatives. The present article intends to make a review of the current acceptation, use and crit-icisms of the concept and to seek for possible so-lutions of real alternatives in matter of manage-ment tools. The (legitimate) demand of managers of natural resources for estimations of measurable thresholds, beyond which ecosystem functions be-come irreversible, prevented some scientists from discarding the concept, even though it implies sub-stantial uncertainty and complexity when applied to evaluating recreational pressures. The actors who most cling to the CC concept are managers and policy-makers who interpret it in normative terms. But even this normative use is a fallacy, because the effectiveness of the concept in con-vincing decision-makers to adjust recreation uses

Sustainability and Carrying Capacity Studies in Recreational Settings
192
- according to a presumed risk associated with rec-reation uses trespassing the CC limit - has barely been proven.
When it comes to management, decision making processes often define CC by considering site-spe-cific objectives and related activities, which is in-deed tautological and permits the legitimization of one sided interests, particularly if there is no real participatory strategy.
References
Buckley, R. (1999). An ecological perspective on carry-ing capacity. In: Annals of Tourism Research (26/3), p 705–708.
Cole, D. N. (2004). Carrying capacity and visitor manage-ment: facts, values and the role of science. In: Harmon, D., Kilgore, B. M. & Vietzke, G. E. (eds.). Protecting our diverse heritage: the role of parks, protected areas, and cultural sites, p 43-46. Hancock.
McCool, S. F. (1990). Limits of Acceptable Change: Evo-lution and Future. Graham, R. & Lawrence, R. (eds.). Towards Serving Visitors and Managing Our Resourc-es: Proceedings of a North America Workshop on Vis-itor Management in Parks and Protected Areas.
McCool, S.F. & Stankey, G.H. (1984). Carrying capacity in recreational settings: Evolution, appraisal and appli-cation. In: Leisure Sciences (6/4) p 453–473.
Hughes, G. 2002. Environnmental Indicators. Annals of Tourism Research, (29/2) p 457–477.

Siegrist, D., Clivaz, C., Hunziker, M. & Iten, S. (eds.) (2006). Exploring the Nature of Management. Proceedings of the Third International Conference on Monitoring and Management of Visitor Flows in Recreational and Protected Areas.
University of Applied Sciences Rapperswil, Switzerland, 13-17 September 2006. Rapperswil.
193
Level of Sustainable Activity: Moving Visitor Simulation from Description to Management
Robert M. Itami
GeoDimensions Pty Ltd, Australia
Keywords: River traffic simulation, river traffic management, level of sustainable activity, RBSim, pattern of use simulation.
Introduction
Visitor pattern of use simulations are an effective tool for describing and quantifying the distribu-tion, density, speed, and flow patterns of human movement in a variety of environments from wil-derness back-country settings to highly urbanised high use settings (Cole 2005). The technical de-velopment of special purpose simulators for rec-reation environments continues using simulation paradigms including discrete-event simulation, cel-lular automata and multi-agent simulation. How-ever, regardless of the methodology used to simu-late visitor pattern of use, the outputs are always the same – a quantitative description of movement patterns. Whereas the quantitative analysis of vis-itor flows is fundamental to a better understanding of the complex interactions of human use, the im-pacts of these patterns on the quality of experience and behaviour can only be discovered through so-cial science methods that elicit responses from us-ers about their expectations, experiences, attitudes, preferences and behavioural responses to visitor densities, queuing times, flow rates, the distribu-tion of destinations, and the capacity of facilities. Only by linking the social and environmental im-plications to the flow patterns generated by human pattern of use simulations can we begin to manage the quality of experience for visitors.
This issue is at the heart of a complex manage-ment problem in Melbourne, Victoria Australia. The Melbourne Waterways Committee commis-sioned a study to determine the traffic capacity of the Maribyrnong and Yarra Rivers (see figure 1) to develop a traffic management plan on the basis of the current level of river traffic and the projected
traffic for the next 5 and 10 year periods. The ur-gency for this study is prompted by existing con-flicts between commercial passenger ferries and rowing and canoeing, and the increasing commer-cial and recreational traffic in the shipping zone. On top of this is the impending Melbourne Dock-lands development, which will create marinas for 700 to 1000 new private and public berths in the heart of the study area.
Earlier consultancies had established projected growth rates for commercial and recreational traf-fic, however a defensible method for determining river capacity for the various forms of traffic had not been determined. The underlying assumption had been that some single metric like “maximum number of vessels per hectare” could be estab-lished to determine the overall capacity of the river system. This definition, however does not recog-nize the very different physical operating charac-teristics of a rowing skull compared to a passenger ferry, or the quality of experience required for pas-sive recreation versus competitive training. It is clear a robust defensible way of defining river ca-pacity that takes into account river characteristics, competing users, vessel types, and physical infra-structure had to be developed.
Level of Sustainable Activity
The Level of Sustainable Activity (LSA) concept is a generalisation of the Level of Service concept developed by the Transportation Research Board (2000). River capacity is different for each user group and varies in relation to river geometry, the provision of facilities, and the interaction with oth-

Sustainability and Carrying Capacity Studies in Recreational Settings
194
er users. River traffic management must therefore be based on a comprehensive framework that in-tegrates all the relevant factors in a format that is easy for users and decision makers to understand and that can be adapted to a wide range of environ-ments and travel modes.
LSA can be thought of as a scale of end-user ex-perience. Each river zone will have a range of ser-vice levels defined for each vessel type ranging from very low levels of use, with minimal envi-ronmental and social impacts to high-density use with high levels of user interaction, higher levels
of potential environmental and social impacts, and more intensive facility and management require-ments (see Table 1).The LSA concept integrates:
Physical characteristics of the river, including navigable depth, width, and bank erosion poten-tial. Physical characteristics of different vessel types, their stopping distance and safe passing distance and speed. User preferences for levels of use for specific activities in specific river zones.
Figure 1: The “2 Rivers” study area – Port Phillip Bay to the south and the 7 river management zones.
Rowers/Paddlers Motorised Commercial and Recreational
Level of Sustainable
Activity Area/Boat Boats/Ha Area/Boat Boats/Ha
Quality of Service
A 10,000 m2 1 10,000 m2 1 Highest B 5,000 m2 2 5,000 m2 2 C 2,500 m2 4 2,500 m2 4 D 769 m2 13 1,250 m2 8 E 625 m2 16 714 m2 14 Lowest
Table 1: Level of Sustainable Activity vessel density definitions for Rowers/Canoeists and Motorised vessels. LSA level A is the lowest density and the highest quality of service. LSA level E is the highest density and lowest quality of service. This table allows the manager or analyst to link outputs from the river traffic simulation to quality of experience or river users.

Sustainability and Carrying Capacity Studies in Recreational Settings
195
User attitudes toward competing traffic Safety, Environmental and Social risk factors relating to increasing use densities.
Suggestions from users on management options for dealing with the above risks.
Each river user-type (rowers, commercial tour op-erators, water taxis, and ships) has different re-quirements in terms of safety, ability to perform their intended activity, and level of satisfaction based on the mix and density of vessels sharing the river zone. In the LSA framework two types of ser-vice are addressed:
activity within a single user group (e.g. row-ers in relationship to rowers or commercial ves-sels in relationship to other commercial vessels) and
aevel Sustainable Activity between different us-ers (e.g. rowers in relationship to commercial vessels).
The presentation will discuss the use of focus groups and river traffic simulations using RBSim (Itami et al. 2004) of the LSA levels to generate river capacity definitions and management options for each river zone.
References
Cole, D.N., comp. (2005). Computer simulation modeling of recreation use: current status, case studies, and fu-ture directions. Gen. Tech. Rep. RMRS-GTR-143. Fort Collins.
Itami, R., Raulings R., MacLaren G., Hirst K., Gimblett R., Zanon D. & Chladek P. (2004). RBSim 2: Simulating the complex interactions between human movement and the outdoor recreation environment. In: Journal of Nature Conservation.
Transportation Research Board (2000). Highway Capacity Manual 2000. Washington D.C.

Siegrist, D., Clivaz, C., Hunziker, M. & Iten, S. (eds.) (2006). Exploring the Nature of Management. Proceedings of the Third International Conference on Monitoring and Management of Visitor Flows in Recreational and Protected Areas.
University of Applied Sciences Rapperswil, Switzerland, 13-17 September 2006. Rapperswil.
196
A Study on Procedures to Establish Standards ConcerningTrail Management in Sub-Alpine Zones of Protected Areas
Akihiro Kobayashi1, Tetsuya Aikoh2 & Kazushige Yamaki3
1Senshu University Hokkaido College, [email protected]
2Hokkaido University, [email protected]
3Tohoku Research Center, [email protected]
Keywords: Trail, management, procedure, protected area, sub-alpine, Japan, ecological, visual, Daisetsuzan.
Introduction
Trails are considered necessary in protected areas to help people get about, to increase enjoyment, and to protect the environment by concentrating traffic on trail tracks. However, lack of management re-sults in erosion and muddiness of trail tracks, and destruction of vegetation along the trails. Degrad-ed trail conditions detract from their functional and recreational value. The level or type of the design and maintenance of the trails is not always consis-tent with the preferences of the visitors, which re-duces the quality of the visitor experience.
The environmental impact of the trails, including the ecological and visual impact, should be mini-mised by a systematic management decision pro-cess to set the standards for trails. The difficult is-sue of balancing the dual objectives of visitor use and resource protection can be hard to address without a framework to structure and guide deci-sion-making (McCool 1994). The purpose of this paper is to propose a procedure of standard of trail management in a fragile sub-alpine zone in a pro-tected area and to assess visitor impact problems on trail tracks
Methods
Most recreation management decisions have both a descriptive and an evaluative component (Cole 2004). These components are included in the pro-cess of identifying strategies for addressing visi-
tor-caused impact on trails, and selecting appro-priate management actions to minimise or prevent unacceptable impacts.
Trail impact assessment studies have been fre-quent over the last 30 years (Hammit & Cole 1998). However, the issue hasn’t been adequately discussed in order to set a standard for techniques for maintenance and construction that is suitable for the conditions from ecological, visual, and technical perspectives and their mutual relation-ship. It is necessary to classify the problem into a material phenomenon and a psychological phe-nomenon. The material phenomenon is grasped from an ecological viewpoint. The causal rela-tionship changes are usually caught in the 101 m to 102 m and monthly range. On the other hand, the psychological phenomenon is grasped from a scenic viewpoint. The causal relationship chang-es are usually caught in the 102 m to 104 m and seasonal range. The scale of range between mate-rial and psychological change is different in time and space. We introduce two procedures into the model of “the standard of trail maintenance” ac-cording to the difference in scale of space and a distinction between a descriptive and an eval-uative component. One procedure is based on the geographic distribution pattern of natural re-sources and use pattern at the area scale. Anoth-er procedure is to focus a maintenance technique based on scientific data to deal with ecological impact at the scale of the site.
Sustainability and Carrying Capacity Studies in Recreational Settings
197
Daisetsuzan National Park was chosen for this case study. Hokkaido nature conservation of-fice under the Ministry of the Environment es-tablished a panel to identify management tac-tics for visitor impact problems, and to include an analysis step employing experts. Experts can include agency representatives, scientists, non-government organization staff who were nomi-nated by the office for Hokkaido conservation of nature. The panel works with protected area managers and staff to analyse impact problems, select management actions.
Results
Step 1 of 1st procedure: “Ranking for protection of visitor experience“ was closely connected with the goal of Daisetsuzan National Park. This rank-ing was based on the scientific knowledge of the panel and the existing administrative plan and a desirable use condition referring to the concept VERP to identify protected area values, purpos-es, and management objectives. Step 2 of 1st pro-cedure: “Ranking for conserving the trail condi-tion” was settled in parallel based on the degree of necessity and urgency of countermeasures re-ferring to ecological fragility through field inves-tigations and previous research. Step 3 of 1st pro-cedure: “Maintenance level of trail” was set up in nine categories that made the matrix of “Ranking for dealing with conserving a trail condition” and “Ranking for protection of visitor experience“.
2nd procedure: At site scale, “Guidance of tech-niques for trail maintenance” was formed sepa-rately from the procedure of “Standard of trail maintenance”. Step of “Guidance of techniques for trail maintenance” was composed of “Effec-tiveness of countermeasures“, “Sampling dam-aged site“, and “Understanding of impact causes”. The contents of “Effectiveness of countermea-sures” was to be adjusted to “Direction of coun-termeasures” of each trail sec-tion. “Direction of countermeasures“ was set based on the compari-son between “Current condition” and “Ideal con-dition“. The matrix of factors of encouraging low visitor use and increasing the resistance of tracks showed a mutual balance sheet to examine the “Direction of counter measures”.
But this has not yet been tested in the field. It would be useful to apply it in a variety of protected areas and to improve the framework.
References
Hammitt, W.E. & Cole, D.N. (1998). Wildland Recreation: Ecology and Management (2nd ed.). New York.
Cole, D.N. (2004). Monitoring and Management of Rec-reation in Protected Areas: the Con-tributions and Limitations of Science. http://www.metla.fi/julkaisut/workingpapers/2004 /mwp002.htm.
McCool, S.F. (1994). Planning for sustainable nature de-pendent tourism development: The Limits of Accept-able Change system. In: Tourism Recreation Research (19/2), p 51–55.
USDI National Park Service (1997). VERP: A Summary of the Visitor Experience and Resource Protection (VERP) Framework. Denver.

Siegrist, D., Clivaz, C., Hunziker, M. & Iten, S. (eds.) (2006). Exploring the Nature of Management. Proceedings of the Third International Conference on Monitoring and Management of Visitor Flows in Recreational and Protected Areas.
University of Applied Sciences Rapperswil, Switzerland, 13-17 September 2006. Rapperswil.
198
Understanding and Managing Soundscapes in National Parks:Part 1- Indicators of Quality
Peter Newman1, Robert E. Manning2, Ericka Pilcher1, Karen Trevino3
& Michael Savidge3
1Colorado State University, [email protected][email protected]
2University of Vermont, [email protected]
3U.S. National Park Service, [email protected]
Keywords: Natural sounds, perceptions, national parks, visitor experience.
Introduction
A growing body of research has documented the potential impacts of outdoor recreation in nation-al parks and related areas. These impacts apply to multiple components of the landscape, includ-ing soil, vegetation, water, and wildlife. More-over, there are often aesthetic implications of these impacts that can degrade the quality of the visitor experience. Research and management attention is now being extended to include aural impacts of outdoor recreation, and natural quiet – the sounds of nature undisturbed by human-caused noise – is now being recognized as an important and endan-gered resource in national parks and related areas. Moreover, ecent policies by US National Park Service has made the protection, maintenance, and restoration of the natural soundscape a priority and consider natural quiet as a value and a resource in its own right.
Research related to sound and noise in nation-al parks and related areas have traditionally giv-en aircraft disturbances much attention. For ex-ample, Mace, Bell & Loomis (1999) questioned whether typical helicopter noise found in nation-al parks would influence perceived aesthetic qual-ity of landscapes and visitor’s feelings of tranquil-ity and solitude. They suggest that when sounds
are considered inappropriate for a specific area, the noise would become annoying and likely detract from other experiences such as enjoyment of na-ture (Mace et al. 1999). Noise was defined as un-wanted sound, and affect was defined as emotion. Results suggest that even low levels of helicopter noise would affect visitor tranquility and solitude (Mace et al. 1999).
There is now a growing interest in how noise cre-ated by the increasing numbers of visitors to parks and related areas can mask the sounds of nature and detract from the quality of the visitor experi-ence.
Methods
Research conducted by Kariel (1990) suggested that simply investigating sound levels alone may not get at the true nature of annoyance with those sounds. Kariel suggested that understanding the physical characteristics and their socio-psycho-logical characteristics along with sound levels may be a better way to predict whether sounds are deemed as annoying, pleasing, or accept-able. For example, high pitched sounds are usual-ly deemed more annoying than low pitch sounds, and rhythmic sounds such as an engine are gen-erally considered more annoying than continu-

Sustainability and Carrying Capacity Studies in Recreational Settings
199
ous sounds. However, because many sensory ex-periences occur along with sound, it is important to consider the larger context of the setting. Be-cause many people tend to visit natural areas to get away, enjoy nature, and relax, sounds that interfere with these goals may also be deemed as annoying (Kariel 1990).
During the summer of 2005, a “listening exercise” was conducted at in Muir Woods National Monu-ment. The purpose of this exercise was to 1) identify the natural and human-induced sounds that visitors heard most frequently, 2) distinguish the character-istics of sounds identified, and 3) understand how visitors perceived those sounds. From July 16th -27th, 2005, visitors (n= 280) were asked to listen and then identify sounds on a checklist. Building on methods used by Kariel (1990), the checklists in-cluded possible physical characteristics of sounds, and allowed visitors to rate each sound on a scale of -4 (very annoying) to +4 (very pleasing).
Results
Figure 1 displays the median ratings of each sound heard by visitors (-4 through +4) and the percent-age of visitors that heard the sounds. The results
are displayed using a concept similar to Impor-tance/Performance (Hollenhorst & Gardner 1994). Importance/Performance provides a graphic repre-sentation of the relationship between importance and performance and provides information as to where management action should be directed. It is broken into four quadrants, with the percentage of people hearing sounds listed on the Y axis, and the median ratings of those sounds listed on the X axis. The upper left quadrant contains sounds that were rated negatively and heard frequently. More than 70% of visitors heard all of the following sounds: people (73%), water (81%), wind (74%), and groups talking (73%). These sounds should be considered as first priority for management con-sideration. The lower left quadrant contains sounds that were rated negatively, but were heard by less than 50% of the people; in most cases these sounds were heard by less than 25% of the people. These sounds should be monitored, but considered second priority for management. The upper right quadrant contains water, wind and bird song, sounds that visitors heard most often and found most pleasing. The lower right quadrant contains sounds that visi-tors found pleasing but did not hear as often.
100% People
Unknown
Group Talking
Water
Wind
75% BirdSong
~50%
Loud Children Group Activities
Soft Person
BirdChatter
<25% Loud Group
Loud Adult
Groundscare
Child Crying
Trash Lid
Cell Phone
Radio
Concession
Vehicles:UnknownPassenger
& Bus
Aircraft Unknown
Jet
DigitalCamera
BuildingSounds
Individualon
Boardwalk
Aircraft Propeller
Truck
Insects Small
Mammal Animal
-4 -3 -2 -1 0 +1 +2 +3 +4
Management 1st Priority
Management 2nd Priority
Management 3rd Priority
Figure 1: Median ratings of each sound heard by visitors (-4 through +4) by the percentage of visitors that heard the sounds.

Sustainability and Carrying Capacity Studies in Recreational Settings
200
Conclusion
These data provide important management infor-mation and can inform the development of indica-tors of quality related to soundscapes. In addition to supplementing current sound monitoring and logging efforts in Muir Woods, this study helped with the development of a study instrument for a 2nd phase of research. Based on study findings, the second phase was designed and conducted to mea-sure normative standards of quality for the sound-scape of the park. This study is described in a companion abstracts by Manning et al. and will be followed up with a conceptual piece on comput-er simulation modeling proposed by Lawson and Plotkin.
References
Hollenhorst, S. & Gardner, L. (1994). The indicator per-formance estimator approach to determining accept-able wilderness conditions. Environmental Manage-ment (18), 901-906.
Kariel, H.G. (1990) Factors affecting response to noise in outdoor recreational environments. In: The Canadian Geographer (34/2), p142-149.
Mace, B.L., Bell, P.A., Loomis, R.J. & Haas, E.E. (2003). Source attribution of helicopter noise in pristine na-tional park landscapes. In: Journal of Park and Recre-ation Administration (21/3), p 97-119.

Siegrist, D., Clivaz, C., Hunziker, M. & Iten, S. (eds.) (2006). Exploring the Nature of Management. Proceedings of the Third International Conference on Monitoring and Management of Visitor Flows in Recreational and Protected Areas.
University of Applied Sciences Rapperswil, Switzerland, 13-17 September 2006. Rapperswil.
201
Understanding and Managing Soundscapes in National Parks:Part 2 - Standards of Quality
Robert E. Manning1, Peter Newman2, Ericka Pilcher2, Jeffrey Hallo1,William Valliere1, Michael Savidge3 & Daniel Dugan4
1University of Vermont, [email protected]
[email protected]@uvm.edu
2Colorado State University, [email protected][email protected]
3U. S. National Park Service, [email protected]
4Dan Dugan Sound Design, [email protected]
Keywords: Soundscapes, standards of quality, norms, park management, national parks.
A growing body of research has documented the potential impacts of outdoor recreation in nation-al parks and related areas. These impacts apply to multiple components of the landscape, includ-ing soil, vegetation, water, and wildlife. For ex-ample, visitors to parks can trample fragile soils and vegetation, erode soils, pollute waters, and dis-turb wildlife. Moreover, there are often aesthet-ic implications of these impacts that can degrade the quality of the visitor experience. Research and management attention is now being extended from conventional landscapes to “soundscapes” and in-cludes aural impacts of outdoor recreation. “Nat-ural quiet” – the sounds of nature undisturbed by human-caused noise – is now being recognized as an important and endangered resource in nation-al parks and related areas. In particular, human-caused noise can mask the sounds of nature, dis-turb wildlife, and detract from the quality of the visitor experience.
Research at Muir Woods National Monument (Cal-ifornia), a unit of the U.S. National Park System, was designed to enhance understanding and man-agement of the park’s soundscape. An initial sur-vey of visitors found that the park’s soundscape
was important to many respondents in determining the quality of the visitor experience. For example, some respondents reported that hearing the sounds of nature added to the quality of the visitor expe-rience, while other respondents reported that hu-man-caused noise detracted from the quality of the visitor experience. Based on these findings, two subsequent phases of research were designed and conducted. This research was designed using the framework of indicators and standards of quality as developed in contemporary park management and carrying capacity frameworks, including Lim-its of Acceptable Change and Visitor Experience and Resource Protection.
The first phase of research was conducted to mea-sure and analyze the natural and human-caused sounds that visitors hear in the park. A represen-tative sample of visitors participated in an “attend-ing logging” exercise in which they recorded the sounds they heard in the park and their reactions to these sounds. Large percentages of visitors re-ported hearing the natural sounds of the park (e.g. rushing water of Redwood Creek, wind through the trees, birds calling and singing) as rated these types of sounds as “pleasant”. However, large per-
Sustainability and Carrying Capacity Studies in Recreational Settings
202
centages of visitors also reported hearing many hu-man-caused sounds (e.g. visitors talking, boister-ous behavior of children) and rated these types of sounds as “annoying”. This study is described in a companion abstract by Newman et al.
Based on resulting data, a second phase of research was designed to explore normative standards of quality for human-caused noise in the park. Five tape recordings were prepared that included an ini-tial recording of natural quiet only and four re-cordings of increasing levels of human-caused noise. Metrics designed to construct these tapes and measure the visitor-caused noise included in the study tapes were 1) sound pressure level, 2) human noise-free interval, 3) percent of time natu-ral sounds were audible, 4) percent of time human sounds were audible, and 5) number of human-caused sound events. These tapes were incorpo-rated into a survey administered to a representa-tive sample of park visitors. Respondents listened to each of the five study tapes and were asked to 1) rate the acceptability of each tape recording on a nine-point scale that ranged from -4 (“very un-acceptable”) to +4 (“very acceptable”), 2) identi-fy the types of sounds they found pleasing and an-noying, and 3) identify the tape recording that best represented the conditions of the park during their visit. Aggregate respondent ratings of the accept-ability of each of the five study tapes were plotted to form a social norm curve. Resulting data pro-vide an empirical basis to help formulate standards of quality for the soundscape of the park.

Siegrist, D., Clivaz, C., Hunziker, M. & Iten, S. (eds.) (2006). Exploring the Nature of Management. Proceedings of the Third International Conference on Monitoring and Management of Visitor Flows in Recreational and Protected Areas.
University of Applied Sciences Rapperswil, Switzerland, 13-17 September 2006. Rapperswil.
203
Understanding and Managing Soundscapes in National Parks: Part 3 – Computer Simulation
Steven R. Lawson1 & Kenneth Plotkin2
1Virginia Polytechnic Institute and State University, [email protected]
2Wyle Labs, [email protected]
Keywords: Soundscapes, computer simulation, monitoring, park management, national parks.
Introduction
Natural sounds are increasingly being recognized both as a natural resource of national parks and re-lated protected areas to be conserved, as well as an integral part of visitors’ experiences of parks and protected areas. For example, in response to grow-ing concern about the effects of scenic air tours on the “soundscapes” within national parks and vis-itors’ enjoyment of natural sounds, the U.S. Na-tional Park Service established a Soundscapes Program Center to assist parks in developing air tour and soundscape management plans. Further-more, recent studies of national park visitors have found that enjoyment of quiet, solitude, and natu-ral sounds adds to the quality of the visitor experi-ence, while human-caused noise can interfere with visitors’ enjoyment.
Recent research at Muir Woods National Monu-ment (California), a unit of the U.S. National Park System, was designed to enhance understanding and management of the park’s soundscape. This re-search was designed using the framework of indi-cators and standards as developed in contemporary park management and carrying capacity frame-works, including Limits of Acceptable Change (LAC) and Visitor Experience and Resource Pro-tection (VERP). The first phase of research was conducted to measure and analyze the natural and human-caused sounds that visitors hear in the park. A second phase of research was designed to ex-plore normative standards of quality for human-caused noise in the park. Resulting data provide an empirical basis to help formulate indicators and
standards of quality for the soundscape of the park. These two phases of research are described in com-panion abstracts by Pilcher et al. and Manning et al., respectively.
Indicator-based frameworks like LAC and VERP are applied by monitoring the condition of indica-tor variables and initiating management respons-es if standards of quality are violated. However, due to the dispersed nature of recreation within na-tional parks and related protected areas, it is often difficult to monitor indicators of quality through direct observation. For example, research at Muir Woods has been conducted to identify indicators and standards of quality related to visitors’ expe-riences of the parks’ soundscape, yet it is difficult to monitor on-the-ground whether those standards have been violated. Similarly, it is difficult and politically risky to test the effectiveness of alterna-tive management practices through on-the-ground trial and error when standards are violated.
Methods
Recent research suggests that computer simula-tion may be a useful tool to monitor “hard to mea-sure” indicators. For example, computer sim-ulation modeling has been used to monitor the number of people at one time at popular attractions sites within Arches National Park, USA (Lawson et al., 2003), the percentage of groups who must share backcountry campsites with other groups at Isle Royale National Park, USA (Lawson & Man-ning, 2003) and the number of hiking and camping encounters among groups in the John Muir Wil-

Sustainability and Carrying Capacity Studies in Recreational Settings
204
derness of the Inyo National Forest, USA (Law-son et al. in press). In addition, previous research has demonstrated the utility of computer simula-tion modeling to test the effectiveness of alter-native management practices in a manner that is more comprehensive, less costly, and less polit-ically risky than on-the-ground trial and error. For example, simulation modeling has been used to assess the effects of changes in infrastructure at Twelve Apostles National Park, Australia (Ita-mi 2005); implementation of trailhead quotas in Yosemite National Park, USA (van Wagtendonk 2003); regulation of travel routes in Isle Royale National Park, USA (Lawson in press); and alter-native transportation systems in Arches National Park, USA (Lawson et al. 2003) on crowding-re-lated indicators of quality.
Results
This paper will draw upon examples from the re-search reviewed above to demonstrate, concep-tually, the potential utility of integrating data from simulation models of ambient sound in na-tional parks into computer simulation models of visitor flows within the same areas to monitor sound-related indicators of quality. Further, this paper will explore the potential utility of com-puter simulation modeling to examine the effects of alternative management policies (e.g. air tour management alternatives, alternative transporta-tion planning) on the soundscapes visitors expe-rience within national parks and related protect-ed areas.
References
Itami, R. (2005). Port Campbell National Park Australia: Predicting the Effects of Changes in Park Infrastruc-ture and Increasing Use. In: Cole, D. (ed.). Comput-er Simulation Modeling of Recreation Use: Current Status, Case Studies, and Future Directions, RMRS-GTR-143, p 57-64.
Lawson, S. (in press). Computer Simulation as a Tool for Planning and Management of Visitor Use in Protected Natural Areas. In: Journal of Sustainable Tourism.
Lawson, S., Itami, B., Gimblett, R. & Manning, R. (in press). Benefits and challenges of computer simulation mod-eling of backcountry recreation use in the Inyo Na-tional Forest. In: Journal of Leisure Research.
Lawson, S. & Manning, R. (2003). Research to inform man-agement of wilderness camping at Isle Royale Nation-al Park: Part I – descriptive research. In: Journal of Park and Recreation Administration (21/3), p 22-42.
Lawson, S., Manning, R., Valliere, W., & Wang, B. (2003). Proactive monitoring and adaptive management of so-cial carrying capacity in Arches National Park: An ap-plication of computer simulation modeling. In: Jour-nal of Environmental Management (68), p 305-313.
Van Wagtendonk, J. (2003). The wilderness simulation mod-el: A historical perspective. In: International Journal of Wilderness (9/2), p 9-13.
Siegrist, D., Clivaz, C., Hunziker, M. & Iten, S. (eds.) (2006). Exploring the Nature of Management. Proceedings of the Third International Conference on Monitoring and Management of Visitor Flows in Recreational and Protected Areas.
University of Applied Sciences Rapperswil, Switzerland, 13-17 September 2006. Rapperswil.
205
Managing Sustainable Eco-Tourism in Van Vihar National Park
Ravi Shanker Kanoje
Sitanadi Wildlife Sanctuary, India
Key Words: Sustainable eco-tourism, tourism carrying capacity, physical carrying capacity, real carrying capacity, effective carrying capacity, management capacity.
Abstract: Tourism Carrying Capacity determines as to what extent the influx of tourists may be allowed to manage the sustainable eco-tourism in a protected area. The concept of tourism carrying capacity is easy to perceive in theory, but in actual practice it is very difficult to quantify. Tourism carrying capacity is rarely estimated. Van Vihar is a unique combination of safari and zoological park. Its legal status is national park. White tiger and albino Sloth Bear are the main attraction to the tourists. In the winter season migratory water birds take refuge. It is situated at the bank of Up-per Lake of Bhoj Wetland, The Ramsar Site; Wetlands of International Importance, in the Central Indian. More than 35 thousand tourists visit Van Vihar annually. The three levels of tourism carrying capacities i.e. physical carrying ca-pacity, real carrying capacity, and effective carrying capacity were estimated and compared. Implications on manage-ment of eco-tourism were discussed.
IntroductionTourism Carrying capacity determines as to what extent the influx of tourists are allowed to manage the sustainable eco-tourism in a protected area. The concept of tourism carrying capacity is not very dif-ficult to perceive in theory, but it is very difficult to quantify (Ceballes-Lascurain 1996). The National Wildlife Action Plan 2002-2016 recommends con-ducting tourism carrying capacity studies to gauge extent of tourism in most visited protected areas (Anon, n. d.). Tourism carrying capacity is rare-ly estimated. However Ceballes-Lascurain, (1996) has illustrated its calculations. Rajesh Gopal & Shukla (n. d.) estimated the tourism carrying capac-ity of Kanha Tiger Reserve. Bhattayachar (2005) presented an exhaustive documentation of the eco-tourism of Van Vihar National Park. Tourism carry-ing capacity of Van Vihar has not been worked out so far; therefore the author has attempted to quanti-fy it and discussed implications of management of eco-tourism.
Methods
General observations were made in the Van Vihar National Park for a week in June 2004. Available information and literatures were analysed. Tour-
ism carrying capacity of the Van Vihar was esti-mated by following the methodology as given by Cifuentest (1992) and illustrations given by Ce-balles-Lascurain, (1996). Some criteria were es-tablished and assumptions were made based on the biophysical, ecological, social and climatic factors that influence the public use of the site. The three levels of tourism carrying capacities i.e. physical carrying capacity, real carrying capacity, and ef-fective carrying capacity were estimated and com-pared. Implications of management of eco-tourism were discussed.
Study site
Van Vihar National Park is spread over 445 hect-ares at the bank of Upper Lake of Bhoj Wetland more popularly called of “Bhopal Kaa Tal” in the rugged hilly terrain at the heart of the capi-tal city Bhopal of Madhya Pradesh State in the Central India. The altitude varies from 450 me-ters to 650 meters above mean sea level in the Plateau of Vindhaychal Hill Ranges. It is situat-ed at the 23° 13‘ 48“ N latitude and 77° 23‘ 24“ E longitude. Van Vihar is basically a combina-tion of safari park as well as zoological park but it enjoys the legal status of a national park under

Sustainability and Carrying Capacity Studies in Recreational Settings
206
Wildlife (Protection) Act 1972. Intention notifica-tion was issued in 1983 and finally declared as a national park in 1984.
The committed conservation efforts rehabilitated the habitat with 12 species of mammals (table 1). The carnivores are kept in captivity in large en-closures in the natural environmental conditions whereas the herbivores are let free ranging in their natural habitat. The Marsh Crocodile Crocodylus palustris (Lesson) is reared in pools. The animals are fed in the evening.
White tiger and albino Sloth Bear are the main at-traction to the tourists. Some ponds have been de-veloped where water birds may be observed at close quarters. In the winter season migratory wa-ter birds take refuge there. The Bhoj Wetland is a Ramsar Site: a wetland of international impor-tance. It is a unique, near natural, man-made wet-land, representative of the Central Indian Plateau region. The Bhoj Wetland is spread over an area of 3201 hectares supports a wide variety of flora and fauna, including 160 species of birds, regular-ly supporting over 20,000 birds including migra-tory species in winter (Ramsar Sites Directory and Overview September 2005).
The park is equipped with a battery operated bus for tourists which provides an environmental friendly atmosphere. Excursion on the five kilometres long nature trail following the bank of the Bhoj Wetland in the early morning and late in the evening pro-vides ample opportunities to witness the wild ani-mals. The rising sun in the morning and setting sun in the evening behind the hills and its reflection on the lake is an unforgettable, delightful experience. The interpretation centre is a place to appreciate the value of the nature conservation.
Its superb natural environment and typical situa-tion makes it a major tourist destination in India About 35 thousand tourists visit Van Vihar Nation-al Park each year, http://envfor.nic.in/cza/vanvi-har.htm (15 March, 2006).
Results
Tourism carrying capacity is a specific type of car-rying capacity and refers to the carrying capacity of the biophysical and social environment with re-
spect to tourist activity and development (Wolters 1991). It represents the maximum level of visitor use and related infrastructure that an area can ac-commodate. Following the methodology of Cifuen-test (1992) and illustrations of Ceballes-Lascurain (1996), calculation of the various tourism carry-ing capacity of the Vanvihar National Park is as below.
Physical carrying capacity is defined as the maxi-mum number of visitors that can physically fit into a defined space, over a particular time. It is given by the formula;
The Rotation Factor is the number of permissible daily visitor to a site. It is given by the formula:
Rf = Opening period / average time per visit.
For the calculation of Physical Carrying Capacity the following basic information are used and as-sumptions are made:
1. Tourists are allowed to enter with all types of ve-hicle. They may move freely on the 5 km long all weather nature trail.
2. Tourists visit individually or in a group and the minimum distance between the individuals or groups may be 50 meters.
3. Average size of group is of 10 members.
4. Van Vihar National Park remains open through-out the year for tourists.
5. The visiting hours are as follows:
6. Minimum time required to visit the site is 1 hour and 30 minutes.
Here “A” is the total length of the nature trail which is 5 Km. or 5000 meter, where the tourists are al-lowed to make observations.
One visitor or group per unit length of nature trail V/a =1 / 50.
Pcc = A× (V/a) ×Rf Where Pcc = Physical Carrying Capacity, A = Length or Area of a nature trail, V/a = One visitor or group per unit length or area of nature Rf = Rotation factor (number of group of visitors per day).
March to September 06.00 AM to 10.30 PM 03.30 PM to 06.30 PM October to February 06.30 AM to 11.00 AM 03.00 PM to 06.00 PM

Sustainability and Carrying Capacity Studies in Recreational Settings
207
Each day available visiting hours are 4.30 hours in the morning and 3.00 hours in the evening, the Rotation factor for morning and evening are calcu-lated by dividing the available visitor hours by the time required for one visit.
Rotation factor in the morning hours: Rf = 4.30 hours / 1.30 hours = 3
Rotation factor in the evening hours: Rf = 3.00 hours / 1.30 hours = 2
Therefore the total rotation factor “Rf” is 5, three in the morning and two in the evening.
Now by using the formula of the Physical Carrying Capacity “Pcc” may be calculated as:
The physical carrying capacity will be 500 groups visit per day or 5000 visitors a day with the aver-age group size of 10 visitors.
Real carrying capacity is defined as the maximum number of visits to a site, once the correction fac-tors or reduction factors derived from the particu-lar characteristics of the site have been applied to the Physical Carrying Capacity (Pcc). The correc-tive factors are obtained by considering biophysi-cal, environmental, ecological, social and manage-ment variables.
Real Carrying Capacity is given by the formula:
Where Rcc = Real Carrying Capacity,
Cf = Corrective factor.
Corrective factor are expressed in percentage, it is given by the formula:
Consideration of the environmental, ecological, management social variables for the calculation of corrective factors:
(1) Excessive sunshine: Sunshine is intensive in the following periods making visits to the site un-comfortable during the opening hours.
Each day available visiting hours are 4.30 hours in the morning and 3.00 hours in the evening, thus to-tal available visiting hours is 7.30 hours. Whereas each day excessive sunshine are 1.30 hours in the morning and 1.30 hours in the evening thus total excessive sunshine is 3.00 hours.
Corrective factor for excessive sunshine is calcu-lated by using the formula:
(2) Rain fall: Rainy season is for 4 months from July to October and winter rain occurs in Decem-ber and January. In the evening hours usually hail storm occurs in months of February and March, Pre-monsoon rain is experienced from 15th June. Thus there are 90 rainy days per year and rain fall may occur for one and half hours during visiting hours which may hinder the visitation. Thus the to-tal rainy hours each year are 90 × 1.50 and consid-ering 360 days in a year visitation hours are 360 × 7.5.
Corrective factor for excessive rain fall is calculat-ed by using the formula:
(3) Disturbance to wildlife: Migratory birds occur in the Bhoj Wetland and in ponds especially created for water birds and forests. The nature trail follows the bank of Bhoj Wetland and ponds in the Park, migratory birds may get disturbed for six months from October to March in the winter and spring
Pcc = A× (V/a) ×Rf or Pcc = 5000 meter × (1/50meter) × 5or Pcc = 500
Rcc = Pcc × (100-Cf1) ×100
(100-Cf2) ×100
Cf = M1×100Mt
Where M1 = Limiting magnitude of the variables, Mt = Total magnitude of the variables.
March to September 09.00 AM to 10.30 AM 03.30 PM to 05.00 PM October to February 9.30 AM to 11.00 AM 03.00 PM to 04.30 PM
Cf1 = M1×100Mt
= 3.00×1007.50
= 40%
Cf2 = M1×100Mt
= 90×1.5×100360 ×7.50
= 5%
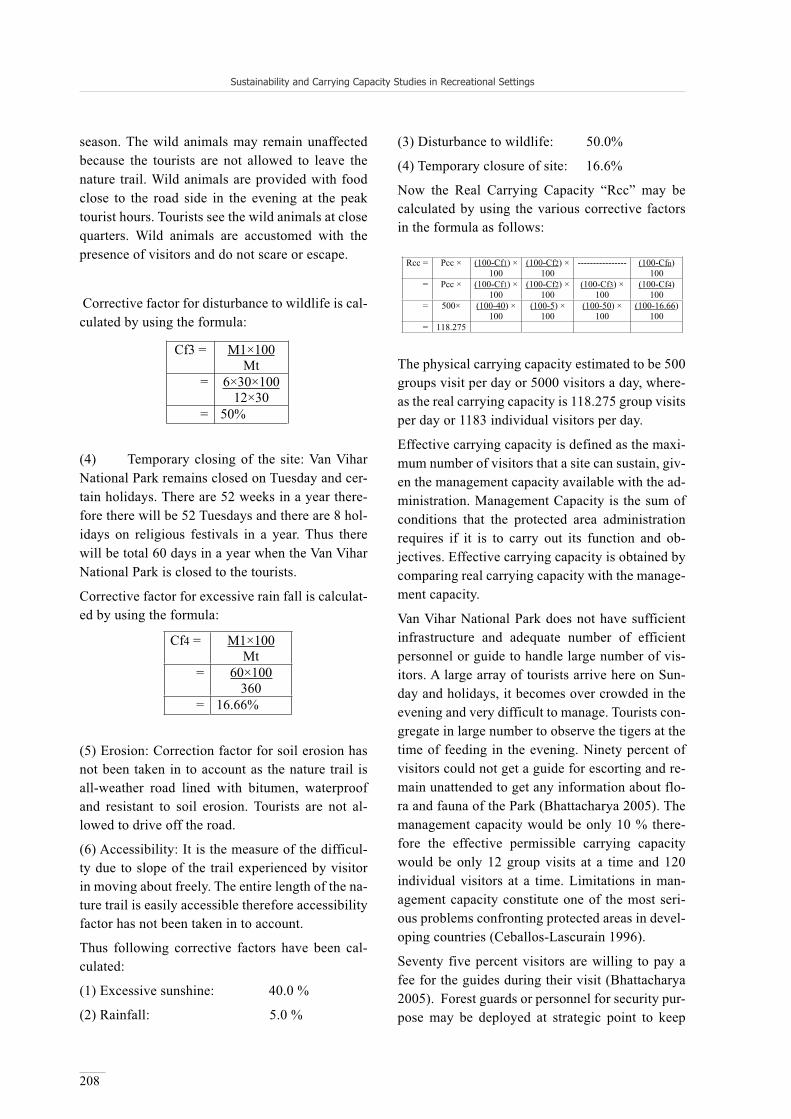
Sustainability and Carrying Capacity Studies in Recreational Settings
208
season. The wild animals may remain unaffected because the tourists are not allowed to leave the nature trail. Wild animals are provided with food close to the road side in the evening at the peak tourist hours. Tourists see the wild animals at close quarters. Wild animals are accustomed with the presence of visitors and do not scare or escape.
Corrective factor for disturbance to wildlife is cal-culated by using the formula:
(4) Temporary closing of the site: Van Vihar National Park remains closed on Tuesday and cer-tain holidays. There are 52 weeks in a year there-fore there will be 52 Tuesdays and there are 8 hol-idays on religious festivals in a year. Thus there will be total 60 days in a year when the Van Vihar National Park is closed to the tourists.
Corrective factor for excessive rain fall is calculat-ed by using the formula:
(5) Erosion: Correction factor for soil erosion has not been taken in to account as the nature trail is all-weather road lined with bitumen, waterproof and resistant to soil erosion. Tourists are not al-lowed to drive off the road.
(6) Accessibility: It is the measure of the difficul-ty due to slope of the trail experienced by visitor in moving about freely. The entire length of the na-ture trail is easily accessible therefore accessibility factor has not been taken in to account.
Thus following corrective factors have been cal-culated:
(1) Excessive sunshine: 40.0 %
(2) Rainfall: 5.0 %
(3) Disturbance to wildlife: 50.0%
(4) Temporary closure of site: 16.6%
Now the Real Carrying Capacity “Rcc” may be calculated by using the various corrective factors in the formula as follows:
The physical carrying capacity estimated to be 500 groups visit per day or 5000 visitors a day, where-as the real carrying capacity is 118.275 group visits per day or 1183 individual visitors per day.
Effective carrying capacity is defined as the maxi-mum number of visitors that a site can sustain, giv-en the management capacity available with the ad-ministration. Management Capacity is the sum of conditions that the protected area administration requires if it is to carry out its function and ob-jectives. Effective carrying capacity is obtained by comparing real carrying capacity with the manage-ment capacity.
Van Vihar National Park does not have sufficient infrastructure and adequate number of efficient personnel or guide to handle large number of vis-itors. A large array of tourists arrive here on Sun-day and holidays, it becomes over crowded in the evening and very difficult to manage. Tourists con-gregate in large number to observe the tigers at the time of feeding in the evening. Ninety percent of visitors could not get a guide for escorting and re-main unattended to get any information about flo-ra and fauna of the Park (Bhattacharya 2005). The management capacity would be only 10 % there-fore the effective permissible carrying capacity would be only 12 group visits at a time and 120 individual visitors at a time. Limitations in man-agement capacity constitute one of the most seri-ous problems confronting protected areas in devel-oping countries (Ceballos-Lascurain 1996).
Seventy five percent visitors are willing to pay a fee for the guides during their visit (Bhattacharya 2005). Forest guards or personnel for security pur-pose may be deployed at strategic point to keep
Cf3 = M1×100Mt
= 6×30×10012×30
= 50%
Cf4 = M1×100Mt
= 60×100360
= 16.66%
Rcc = Pcc × (100-Cf1) ×100
(100-Cf2) ×100
---------------- (100-Cfn)100
= Pcc × (100-Cf1) ×100
(100-Cf2) ×100
(100-Cf3) × 100
(100-Cf4)100
= 500× (100-40) × 100
(100-5) × 100
(100-50) × 100
(100-16.66)100
= 118.275

Sustainability and Carrying Capacity Studies in Recreational Settings
209
regular vigil over the activities of tourists. Eighty percent of visitors showed interest in the park management if they are given a chance to do so, 10 % of local people visit more than 10 times year (Bhattacharya 2005). Therefore, orientation pro-grammes may be conducted for some visitors to train them as guides and may be given opportu-nities for their part time volunteer services to the park in the peak hours in the tourist seasons. Six-ty percent of visitors do not know anything about code of conduct that is to be observed in the Vanvi-har National Park (Bhattacharya 2005). Signposts carrying necessary information may be placed at vantage points and a brochure may be distributed. Very few visitors, only 4 %, liked the interpreta-tion centre from where they could have obtained most of information about Vanvihar and wildlife (Bhattacharya 2005). Therefore the interpretation centre may be equipped with audio-visual aided models to make it more informative and attractive. Films on wildlife may be displaced in the evening. Diesel and petrol driven vehicles create noise and air pollution therefore only electric and bio-diesel driven vehicle may be allowed to enter. Tourists may also be allowed with the cycle rickshaw. A cy-cle rickshaw is a two seated manually operated ve-hicle. Training in eco-tourism may be imparted to the cycle rickshaw puller, they may be provided with a pair of binoculars and wild animal and bird indicator booklets. This will spread awareness for nature conservation to the common people and em-ployment too.
The disturbances may be diminished by rigidly ob-serving rules and regulations. Commitment to some restrictions and obligations may be taken from the
visitors before their entry into the park. Thus man-agement capacity may be increased by employing adequate number of personnel and imparting envi-ronmental education to make the staff more effi-cient, and developing improved infrastructures.
Each subsequent level constitutes a corrected ca-pacity level of the level which precedes. Physi-cal Carrying Capacity is always greater than Real Carrying Capacity and Real Carrying Capacity is greater or equal to Effective Carrying Capacity. Anyhow, effective carrying capacity will never be greater than real carrying capacity even in the most favourable conditions (Ceballos-Lascurain 1996). If it is exceeded, deterioration of the areas resourc-es, diminish visitor satisfaction and adverse im-pacts upon the society, economy and culture of the area can be expected to ensure (McIntyre & Heth-erington 1991).
Carrying capacity depends on place, season and time, user’s behaviour, facility design, pattern and level of management and the dynamic character of the environments (Ceballos-Lascurain 1996). Therefore estimation of carrying capacity may be revised from time to time with the changes in the factors that influence carrying capacity.
The physical carrying capacity gives the maxi-mum number of visitors that can be physically accommodated, real carrying capacity gives the maximum number of visitors that can be permit-ted without causing loss or destruction to the eco-system and effective carrying capacity gives the maximum number of visitors that can be sustained with the present management capacity. Eco-tour-ism is sustainable if the tourism activity is within the effective tourism carrying capacity. However
S. N. Common Name Scientific Name Habit 1 Spotted Deer Axix axix (Erxleben) 2 Sambar Cervus unicolor (Kerr), 3 Blue Bull Boselaphus tragocamelus (Pallas) 4 Black Bock Antilope cervicapra (Linnaeus) 5 Four-horned Antelope tetracerus quadricornis (Blainville), 6 Wild Boar Sus scrofa (Linnaeus) 7 Common Languor Presbytis entellus (Dufressne)
Herbivores
8 Tiger Panthera tigris (Linnaeus) 9 Panther Panthera pardus (Linnaeus)
10 Asiatic Lion Panthera leo persica (Linnaeus), 11 Sloth Bear Melursus ursinus (Shaw), 12 Hyena Hyaena hyaena (Linnaeus)
Carnivores
Table 1: Mammals of Van Vihar National Park.

Sustainability and Carrying Capacity Studies in Recreational Settings
210
tourism activity should never be allowed to exceed the real carrying capacity. A ceiling on the num-ber of tourists/tourist vehicles permitted to enter the protected area should be laid down, keeping in mind each protected area’s individual characteris-tics (Anon, n. d.). Once the different levels of car-rying capacities are estimated suitable strategies should be planned to increase the tourism carrying capacity. Otherwise the number of tourists may be restricted by increasing the entry fee and imposing strict rules and regulations.
Acknowledgement
The author is grateful to the Director Van Vihar National Park for his permission to visit Van Vi-har National Park and my colleague Mr. Vijai Ku-mar Mishra; he escorted me in the Van Vihar Na-tional Park.
References
Anon (n. d.). National Wildlife Action Plan (2002-2016). New Delhi.
Bhattacharya, A. K. (2005). Ecotourism and Livelihoods Capacity Building for Local Authorities. New Delhi.
Ceballos-Lascurain, H. (1996). Tourism, Ecotourism and Protected Areas: The State of Nature- Based Tourism around the World and Guidelines for its Development. Gland and Cambridge
Cifuents, A. M. (1992). Determination de Capacidad de Carga Tourism en Areas Protegidas. Costa Rica.
McIntyre, G. & A. Hetherington (1991). Sustainable Tour-ism Development: Guidelines for Local Planners. Madrid.
Rajesh G. & Shukala R. (n. d.). Management Plan for Kanha Tiger Reserve for the Period 2001-02 to 2010-11 Vol. I Text. M. P. Forest Dept. Mimeo.
Wolters, T. M. (1991). Tourism Carrying Capacity. Paris.

Siegrist, D., Clivaz, C., Hunziker, M. & Iten, S. (eds.) (2006). Exploring the Nature of Management. Proceedings of the Third International Conference on Monitoring and Management of Visitor Flows in Recreational and Protected Areas.
University of Applied Sciences Rapperswil, Switzerland, 13-17 September 2006. Rapperswil.
211
Recreational Carrying Capacity Assessment in a Turkish National Park
Selçuk Sayan & Veli Ortaçe me
Akdeniz University, Turkey
[email protected]@akdeniz.edu.tr
Keywords: Recreational carrying capacity, social carrying capacity, Termessos National Park, Antalya, Turkey, pro-tected areas.
Introduction
National parks and protected areas are favorite places for recreation activities. They are original-ly established to provide people with places for in-spiration, recreation and spiritual renewal. Public visits to parks and protected areas continue to in-crease and may threaten the integrity of natural and cultural resources and the quality of the visitor ex-perience (Lawson et al. 2003); consequently plan-ning, management, and monitoring are developed as the steps of a system to establish a balanced lev-el between conservation and recreational use.
Carrying capacity analysis in the wilderness pro-vides a basis for recreational planning and man-agement of protected areas in the visitor manage-ment context. Extensive human use and high visitor numbers could be a problem for such areas. The re-sult is usually deterioration of natural and cultural resources and diminished visitor satisfaction. Car-rying capacity analysis is the part of a framework which aims to protect the natural and cultural re-sources under human use and provides best social conditions for visitor experience.
Determination of carrying capacity for an outdoor recreation area requires information or data re-lated with the resource, the visitor characteristics and the provided infrastructure which is specific to each protected area because of its unique natural and cultural characteristics, location, state of the public use and climatic conditions. Hence methods and parameters could change in different cases ac-cording to the concept and priorities of the frame-work.
The aim of this work is to estimate the recreation-al carrying capacity of Termessos National Park which is one of the important protected areas in the Mediterranean Region of Turkey. It is also aimed to provide a basis for the better management of visitors; consequently better protection of the bio-physical and historical characteristics of the area in a sustainable way.
As being one of the five national parks in the Prov-ince of Antalya, Termessos is highly appreciated by foreign tourists. The Park is located 34 km to the northwest of Antalya City (figure 1). The sur-face area of the park is 6702 ha and situated in the altitude ranges from 250 to 1663 m from the sea level. Termessos is the name of ancient Roman city which once had been located within the national park borders.
Termessos National Park is a unique site to vis-it because of its richness both for natural and cul-tural resources. Cultural resources of the site fo-cus on Termessos, the ancient Roman city itself. Flora and fauna of the Park are of high value. 680 plant species representing 92 families belonging
Figure 1: Location of Termessos National Park.

Sustainability and Carrying Capacity Studies in Recreational Settings
212
to 5 vegetation types namely maquis, forest, rock, hydrophilous and culture plants were identified in the Park area (Alçıtepe 1998).
Among the major mammals in the National Park area are Canis vulpes (common fox), Canis aures(jackal), Ursus arctos (grizzly bear), Capra ae-gagrus (wild goat), Mustela foina (beech marten), Meles meles (Eurasian badger), Sus scrofa (wild boar), Lepus europaeus (European hare), Dama dama (dama gazelle), Felis silvestris (wild cat), Lynx lynx (European Lynx) and Lutra lutra (com-mon otter). 113 bird species representing 32 fami-lies some of which are endangered live in Termes-sos. Protection of the habitats of following species is of particular importance: Circateus gallicus(short-toed eagle), Strix aluco (eurasian tawny owl), Bubo bubo (eurorasian eagle owl), Accipiter nisus (sparrow hawk), Falco peregrinus (pelegrine falcon), Falco biarmicus (lanner falcon), Asio otus (long-eared owl).
Methods
Recreational carrying capacity of Termessos Na-tional Park was determined with the combination of two different methods. The Methodology for Estimating Protected Area Carrying Capacity by Cifuentes (1992), and the Carrying Capacity As-sessment Process (C-CAP) by Shelby and Heber-lein (1986) were used. Basically the first method provides the calculation of physical, real and ef-fective carrying capacities by using environmen-tal, ecological, climatic and managerial parameters in a formulation. The logic of this method depends on the factors which reduce the level of visitation for making carrying capacity estimations. The sec-ond method (C-CAP) provides the calculation of social carrying capacity. It makes possible to deter-mine social norms and preferences of people (visi-tors) and provides to collect empirical data for the evaluative dimension of carrying capacity.
Three different types of carrying capacities are identified in the Methodology for Estimating Pro-tected Area Carrying Capacity (Cifuentes, 1992). Physical carrying capacity (PCC) is the maximum number of visitors that can physically fit into a de-fined space, over a particular time, and expressed according to the following formula:
PCC = A x V/a x Rf
where A is the available area for public use, V/a is Visitor/area occupied, and Rf is the rotation factor (number of permissible visits per day). Rf is calcu-lated as follows:
Rf = opening period / average time of one visit
Real carrying capacity (RCC) is the maximum per-missible number of visits to a site, once the correc-tive (i.e. reductive) factors derived from the partic-ular characteristics of the site have been applied to the PCC. These corrective factors are obtained by considering bio-physical, environmental, ecologi-cal, social and management variables. RCC is ex-pressed by the following general formula where Cf is a corrective factor expressed as a percentage:
RCC = PCC – Cf1 – Cf2 –……… – Cfn
Thus, the formula for measuring RCC is:
RCC = PCC x (100 – Cf1 / 100) x (100 – Cf2 / 100) x ……… x (100 – Cfn / 100)
Corrective factors are closely linked to the specif-ic conditions and characteristics of each site. They are expressed in percentage terms, using the fol-lowing formula:
Cf = Ml / Mt x 100
Where, Cf is the corrective factor, Ml is the limit-ing magnitude of the variable, and Mt is the total magnitude of the variable.
Effective (or permissible) carrying capacity (ECC) is the maximum number of visits that a site can sustain, considering the management capacity (MC) of the site. ECC is obtained by comparing RCC with the MC of the corresponding protect-ed area administration. It is expressed with the fol-lowing formula:
ECC = RCC x MC
Social carrying capacity (SCC) involves descrip-tive and evaluative components (Shelby and He-berlein, 1986). Descriptive data focuses on objec-tive characteristics of recreation systems where the evaluative component critically considers the dif-ferent objective impacts produced by management parameters in an effort to determine their relative merits. The C-CAP method does not contain for-mulas; it employs some methods to make estima-tions for the social capacity for example previous
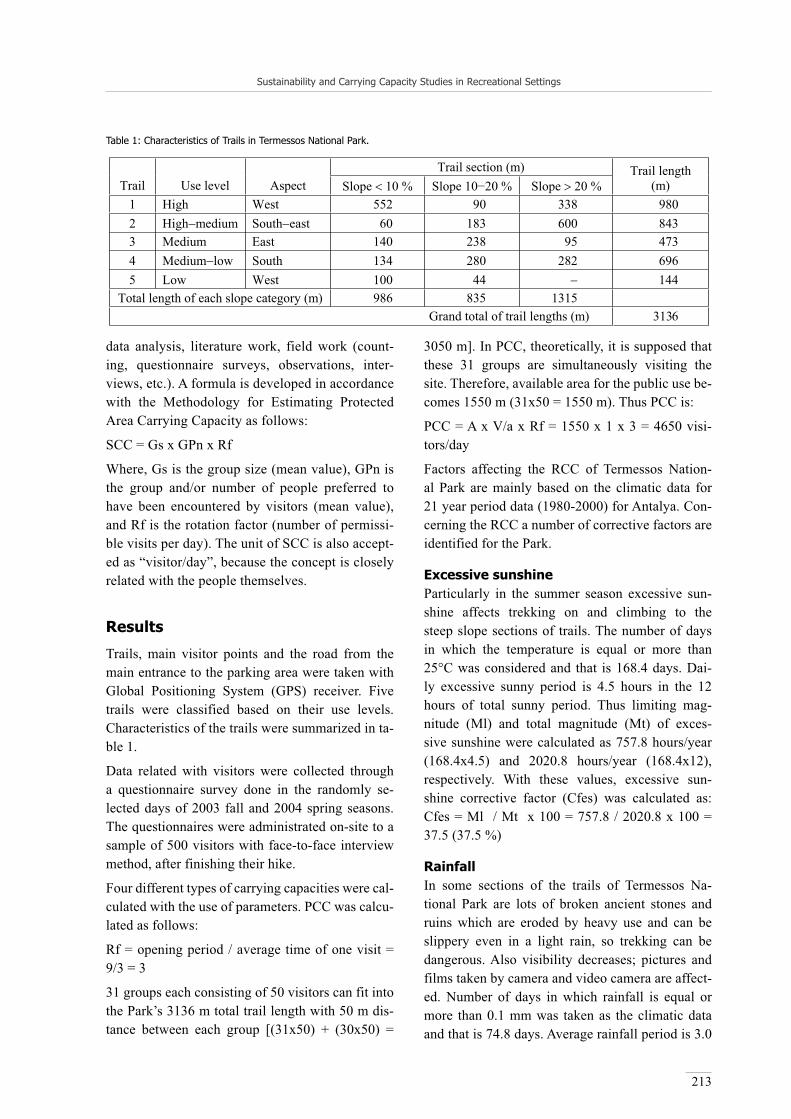
Sustainability and Carrying Capacity Studies in Recreational Settings
213
data analysis, literature work, field work (count-ing, questionnaire surveys, observations, inter-views, etc.). A formula is developed in accordance with the Methodology for Estimating Protected Area Carrying Capacity as follows:
SCC = Gs x GPn x Rf
Where, Gs is the group size (mean value), GPn is the group and/or number of people preferred to have been encountered by visitors (mean value), and Rf is the rotation factor (number of permissi-ble visits per day). The unit of SCC is also accept-ed as “visitor/day”, because the concept is closely related with the people themselves.
Results
Trails, main visitor points and the road from the main entrance to the parking area were taken with Global Positioning System (GPS) receiver. Five trails were classified based on their use levels. Characteristics of the trails were summarized in ta-ble 1.
Data related with visitors were collected through a questionnaire survey done in the randomly se-lected days of 2003 fall and 2004 spring seasons. The questionnaires were administrated on-site to a sample of 500 visitors with face-to-face interview method, after finishing their hike.
Four different types of carrying capacities were cal-culated with the use of parameters. PCC was calcu-lated as follows:
Rf = opening period / average time of one visit = 9/3 = 3
31 groups each consisting of 50 visitors can fit into the Park’s 3136 m total trail length with 50 m dis-tance between each group [(31x50) + (30x50) =
3050 m]. In PCC, theoretically, it is supposed that these 31 groups are simultaneously visiting the site. Therefore, available area for the public use be-comes 1550 m (31x50 = 1550 m). Thus PCC is:
PCC = A x V/a x Rf = 1550 x 1 x 3 = 4650 visi-tors/day
Factors affecting the RCC of Termessos Nation-al Park are mainly based on the climatic data for 21 year period data (1980-2000) for Antalya. Con-cerning the RCC a number of corrective factors are identified for the Park.
Excessive sunshineParticularly in the summer season excessive sun-shine affects trekking on and climbing to the steep slope sections of trails. The number of days in which the temperature is equal or more than 25°C was considered and that is 168.4 days. Dai-ly excessive sunny period is 4.5 hours in the 12 hours of total sunny period. Thus limiting mag-nitude (Ml) and total magnitude (Mt) of exces-sive sunshine were calculated as 757.8 hours/year (168.4x4.5) and 2020.8 hours/year (168.4x12), respectively. With these values, excessive sun-shine corrective factor (Cfes) was calculated as:Cfes = Ml / Mt x 100 = 757.8 / 2020.8 x 100 = 37.5 (37.5 %)
RainfallIn some sections of the trails of Termessos Na-tional Park are lots of broken ancient stones and ruins which are eroded by heavy use and can be slippery even in a light rain, so trekking can be dangerous. Also visibility decreases; pictures and films taken by camera and video camera are affect-ed. Number of days in which rainfall is equal or more than 0.1 mm was taken as the climatic data and that is 74.8 days. Average rainfall period is 3.0
Trail section (m) Trail Use level Aspect Slope 10 % Slope 10 20 % Slope 20 %
Trail length (m)
1 High West 552 90 338 980 2 High medium South east 60 183 600 843 3 Medium East 140 238 95 473 4 Medium low South 134 280 282 696 5 Low West 100 44 144
Total length of each slope category (m) 986 835 1315 Grand total of trail lengths (m) 3136
Table 1: Characteristics of Trails in Termessos National Park.

Sustainability and Carrying Capacity Studies in Recreational Settings
214
hours. Limiting magnitude of rainfall was calcu-lated as 224.4 hours/year (74.8x3). Total magni-tude of rainfall is related with the visiting hours of the park. Daily opening period is 9 hours and it is calculated as 3285 hours/year (9x365). Rain-fall correction factor (Cfr) was calculated as:Cfr = Ml / Mt x 100 = 224.4 / 3285 x 100 = 7.0 (7 %)
StormWinds with a speed of equal or more than 17.2 m/s are defined as “storms” (Anonymous 2004). Storms are effective on the recreational activ-ities, thus considered as a corrective factor. Average number of stormy days is 12.5 and effective period is 7 hours. Limiting magnitude of storm was calcu-lated as 87.5 hours (12.5x7) and total magnitude is the same as calculated in rainfall; 3285 hours/year. So, storm corrective factor (Cfs) is calculated as:Cfs = Ml / Mt x 100 = 87.5 / 3285 x 100 = 3.0 (3.0 %)
ErosionIntensive use of the trails causes erosion; therefore erosion was considered as a corrective factor. The relationship between slope ranges and soil types shown in the table 2 indicates the erodibility of any place under visitor use. Gravel, sand and clay soils on slopes of between 10 and 20 %, present a me-dium risk of erosion; lime soils on slopes between 10 and 20 %, present a high risk of erosion, as do all the soil types on slopes exceeding 20 %. Rec-reational activities in Termessos National Park are performed in the linear segments. Trails in the park have sections with medium and high erosion risk related with the slope range, and soil type is gener-ally lime to sand. Total length of the trails is 3136 m of which 835 m present medium and 1315 high erosion risk. Limiting magnitude of erosion is 2150 m (835+1315) and total magnitude 3136 m. Hence
erosion corrective factor (Cfe) is calculated as:Cfe = Ml / Mt x 100 = 2150 / 3136 x 100 = 68.5 (68.5 %)
AccessibilityAccessibility is related with the degree of difficul-ty, due to the slope of the trail, experienced by vis-itors. Termessos National Park is situated gener-ally a rough area having steep slopes. According to the table 1, first and second trail slope catego-ries (categories: 10% and 10-20%) form the ma-jority (58%) of the total trail length. So, a site-specific evaluative standard was considered for Termessos National Park for the trail slope. Trails with slopes less than 20 % were considered suit-able for visitors. Slope range more than 20 % was used as the limiting magnitude (1315 m) for the accessibility correction factor. Thus accessi-bility corrective factor (Cfa) was calculated as:Cfa = Ml / Mt x 100 = 1315 / 3136 x 100 = 42.0 (42 %)
Disturbance to WildlifeAmong the mammals Capra aegagrus (wild goat) has of particular importance for the Park. Also 7 birds of pray are endangered in the area. Therefore disturbance to wildlife was considered as a limiting factor in Termessos. Mating season for wild goat is between October 15 and November 15 (1 month) and for bird species April and May (2 months). Thus, limiting magnitude is 3 (1+2), and the to-tal magnitude is 12 (12 months). Disturbance to wildlife corrective factor (Cfw) was calculated as:Cfw = Ml / Mt x 100 = 3 / 12 x 100 = 25.0 (25 %)After having calculated all corrective factors for Termessos National Park, RCC was calculated by converting the corrective factors in percents into coefficients. Thus RCC was calculated as fol-lows:
SlopeSoil type 10 % 10 % - 20 % 20 %
Gravel or Sand low medium high Lime low high high Clay low medium high
Table 2: Erosion risks of soils in different slopes (Cifuentes 1992).

Sustainability and Carrying Capacity Studies in Recreational Settings
215
RCC = PCC x (100 – Cfes / 100) x (100 – Cfr / 100) x (100 – Cfs / 100 x (100 – Cfe / 100) x (100 – Cfa / 100) x (100 – Cfw / 100)RCC = 4650 x (100 – 37.5 / 100) x (100 – 7.0 / 100) x (100 – 3.0 / 100 x (100 – 68.5 / 100) x (100 – 42.0 / 100) x (100 – 25.0 / 100)RCC = 4650 x 0.625 x 0.93 x 0.97 x 0.315 x 0.58 x 0.75 = 359 visitors/day
Management capacity of Termessos Nation-al Park is derived from its administrative sta-tus. Facility conditions are thought to be suffi-cient. Long-term Management Plan (Anonymous 1969) considered the need for 26 personnel. How-ever only 7 personnel (1 manager, 1 clerk, 1 for-est ranger, 1 driver and 3 workers) are in charge at the moment. The management capacity (MC) for Termessos National Park was calculated as 27 % (7/26x100). Thus ECC was calculated as:ECC = RCC x MC = 359 x 0.27 = 97 visitors/day
Social Carrying Capacity (SCC)SCC was calculated using the data obtained by questionnaire surveys. 67.8 % of the vis-itors come to Termessos National Park in groups. Rotation factor had been calculat-ed as 3 before; thus SCC was calculated as:SCC = Gs x GPn x Rf = 12 x 2.5 x 3 = 90 visitors/dayThis value is the daily capacity. Theoretically SCC at one time has to be one third of this value be-cause of the three rotations which was calculated for one day.
Discussion and Conclusion
Termessos National Park is a place to be the home of an ancient Roman city and unspoiled habitat for most species of Mediterranean flora and fauna. In this study physical, real and effective carrying ca-pacities of the Park were calculated through the for-mulas in the methodology by Cifuentes (1992).
Six corrective factors related with the bio-phys-ical characteristics of the area were applied. His-torical background could be another corrective fac-tor on the recreational use of Termessos. However, inclusion of the visitor capacity regarding the ru-ins itself as a corrective factor needs comprehen-sive research. Determining a reasonable number of visits which aims the sustainability of the cultural resource needs the use of professional instruments
to measure the effects on the ruins; therefore ru-ins themselves were not considered as a corrective factor.
Species in the natural vegetation could also be an-other corrective factor. However no endemic spe-cies were encountered in the trails and nearby areas used by the visitors. Therefore a correction factor for the plant species was not applied.
ECC was calculated as 97 visitors per day which means 35.405 visitors per year. Total visitor num-ber in the period 1995-2005 was 328.654 visitors which means an average of 29.878 visitors per year, and 82 visitors per day. So, actual visiting state of the Park is below the capacity that was calculated in this research. SCC which was integrated into the research was calculated separately from the previ-ous three levels of carrying capacity. It was calcu-lated 90 visitors per day which means an average of 32.400 visitors per year. It is interesting that the re-sults of ECC and SCC are very close to each oth-er although they were calculated separately. This is the original finding of this study, not been found in the previous studies.
Final numbers for recreational carrying capacity is 97 visitors/day, and for social carrying capacity 90 visitors/day. In the case of Termessos, it seems easier to establish a recreational carrying capaci-ty for the National Park. Both visitor numbers are very close to each other and lower than the actual average visitor numbers; thus any of them can be used as the maximum visitor number. Actual vis-itor numbers are suitable for the site and current visitation conditions should be maintained. If the management system is improved, the recreation-al carrying capacity may be increased. Therefore a balanced management system is of importance for the sustainability of the natural resources; for the protection of cultural heritage and for the quality of recreation experience.
References
Alcitepe, E. (1998). Termessos Milli Parki (Antalya) Flor-asi Uzerinde Bir Arastirma. Akdeniz Universitesi Fen Bilimleri Enstitusu Biyoloji Anabilim Dali Y. L. Tezi, Antalya.
Anonymous (1969). Termessos Milli Parki Uzun Devreli Gelisme Plani, T.C. Orman Bakanligi Orman Genel Mudurlu u Milli Parklar Dairesi, Ankara.

Sustainability and Carrying Capacity Studies in Recreational Settings
216
Cifuentes, M. (1992). Determinacion de Capacidad de Car-ga Turistica en Areas Protegidas. Turrialba.
Lawson, S.R., Manning, R.E., Valliere, W.A. & Wang, B. (2003). Proactive Monitoring and Adaptive Manage-ment of Social Carrying Capacity in Arches National Park: an Application of Computer Simulation Model-ing. In: Journal of Environmental Management (68), p 305-313.
Shelby, B. & Heberlein, T.A. (1986). Carrying Capacity in Recreation Settings. Corvallis.

217

218
Nature Tourism: Concepts and Experiencesin Recreational and Protected Areas
Yves Hausser & Dominik Siegrist (Chairs)

Siegrist, D., Clivaz, C., Hunziker, M. & Iten, S. (eds.) (2006). Exploring the Nature of Management. Proceedings of the Third International Conference on Monitoring and Management of Visitor Flows in Recreational and Protected Areas.
University of Applied Sciences Rapperswil, Switzerland, 13-17 September 2006. Rapperswil.
219
Comparison of Forest Recreation and Nature Tourism in Hungary, Italy and Slovakia Based on the First Outputs of the
COST E33 Action
Dóra Drexler1, Mária Bihu ová2 & Barbara Mariotti3
1Technical University of Munich, [email protected]
2Slovak Agricultural University, [email protected]
3University of Florence, [email protected]
Keywords: COST E33, forest recreation, nature tourism, regional comparison.
Introduction
COST Action E33 ‘Forest Recreation and Nature Tourism’ (FORREC) is a network of European re-searchers and practitioners who are involved in forestry, landscape architecture and tourism. The main objective of COST Action E33 is to improve the quality of information available to policy mak-ers and forest managers on the recreation and tour-ism benefits of forestry.
The present paper attempts to review the first out-comes of the COST Action E33 to gain an over-view of the major demands, conflicts and poten-tials of nature tourism and forest recreation in Hungary, Slovakia and Italy. On the basis of the overview, hypotheses are stated regarding the de-velopment of forest recreation and nature tour-ism in the investigated countries. These should build the basis of further and more detailed in-vestigations.
57
1
42
43
44
13
32
2
66
0
10
20
30
40
50
60
70
80
90
100
%
Hungary Slovakia Italy
Ownership of forests
Private forests
Communityowned forests
State/publicforests
Figure 1: Ownership of the forests in Hungary, Slovakia and Italy.

Nature Tourism: Concepts and Experiences in Recreational and Protected Areas
220
Methods
In COST Action E33 a questionnaire has been pre-pared to gather information about the general con-ditions, conflicts and approaches to the manage-ment of forest recreation and nature tourism in Europe (Wirth & Pröbstl 2005). The questionnaire has been filled out by experts in each participating country. The questionnaires were not statistically significant but aimed to draw a general picture of the countries.
The present paper is based on the data collected about the three mother-countries of the authors, delegates of COST Action E33. The topics of for-est cover, ownership, legislation, forest functions and forest planning are discussed.
Forest cover varies in the examinated countries. (Sk: 40,8%. I: 30%, H: 19,4%). The ownership pat-terns have radically changed in Hungary and Slo-vakia during the last 15 years. After 1990, wood-lands have been returned to private owners. In Italy 2/3 of the forests ownership is private (figure 1).
16,1% of forests are designated for recreation in Slovakia. The forests with priority of health, social benefits, tourism, education and research enclose only 2% of forests in Hungary. In Italy forests are not classified by law as “recreational forests”. Rec-reation is considered to be a major function of the greater part of the forests, so forest management plans include it as a driving aspect.
The proportion of timber production and protec-tion functions show main aspects of forest utili-zation. Economic use predominates forests (Sk: 67%, H: 65%, I: 58%). The proportions of protect-ed forests are also quite high (I: 34%, H: 20%, Sk: 16,9%). Protected forests play a significant role in forest recreation. In Italy the proportions of forest functions are changing because of the neglect of silvicultural activities in many mountainous zones and an increase of protection and tourist-recre-ational values.
Planning of recreation and nature tourism in for-ests is usually undertaken by foresters and forest service personnel, sometimes in collaboration with landscape architects, environmental educators and local administrators. Some more information about legislation and planning tools is shown in table 1.
Hypotheses
Hungary and Slovakia need to develop and man-age recreation and tourism in forests in light of the relatively new private land owning structures and market. The forest landscapes offer qualities un-available in many more developed European coun-tries. These are e.g. remoteness, quietness and the presence of wildlife as well as hunting prey. As a tool for rural development, forest recreation and nature tourism are likely to have an increasingly important role in these countries.
Despite the longstanding tradition of nature/moun-tain tourism in Italy, nowadays an increasing im-portance of new types of nature tourism can be found. The trend in delivering appropriate policies concerning forest recreation as well as providing skills for the operators of the sector is highly posi-tive. Planning, design and management of forests with major recreation functions and nature tourism are particularly developed in publicly owned for-ests and protected areas, where the social and pub-lic issues are considered as driving forces. The pri-vate owners’ interest is still low in investing and activating forms of recreation and nature tourism management in their forests.
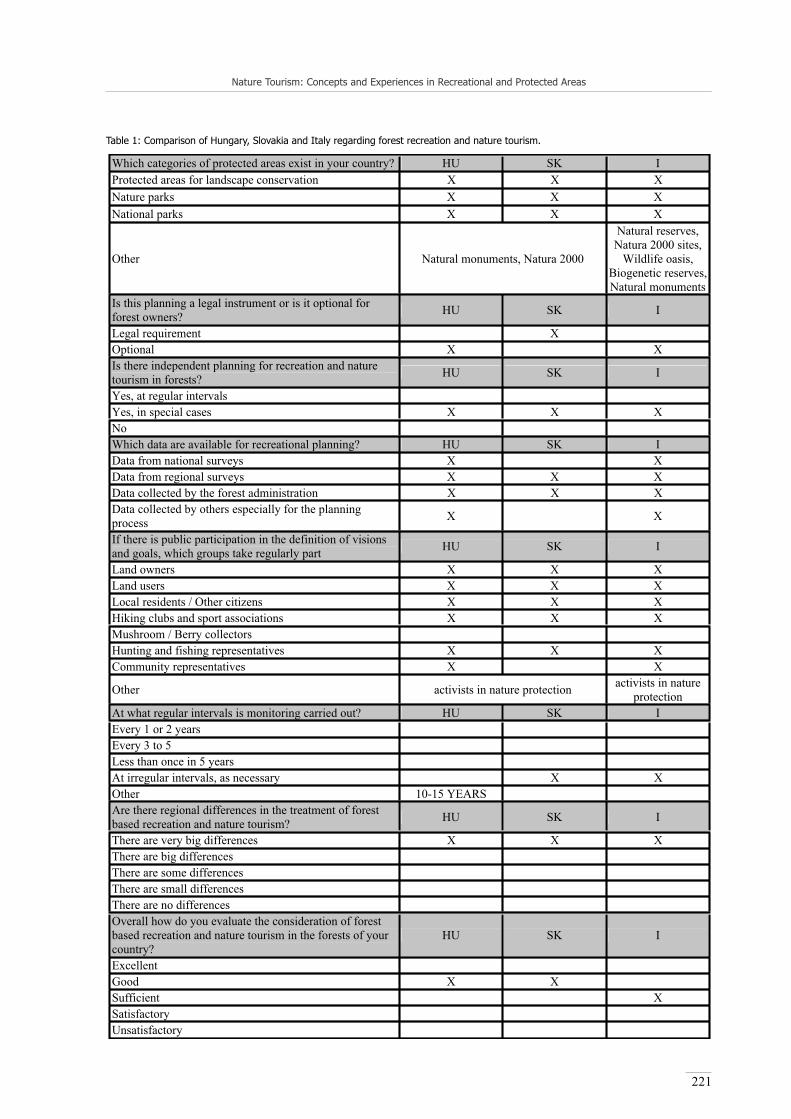
Nature Tourism: Concepts and Experiences in Recreational and Protected Areas
221
Which categories of protected areas exist in your country? HU SK IProtected areas for landscape conservation X X X Nature parks X X X National parks X X X
Other Natural monuments, Natura 2000
Natural reserves, Natura 2000 sites,
Wildlife oasis, Biogenetic reserves, Natural monuments
Is this planning a legal instrument or is it optional for forest owners? HU SK I
Legal requirement X Optional X X Is there independent planning for recreation and nature tourism in forests? HU SK I
Yes, at regular intervals Yes, in special cases X X X No Which data are available for recreational planning? HU SK IData from national surveys X X Data from regional surveys X X X Data collected by the forest administration X X X Data collected by others especially for the planning process X X
If there is public participation in the definition of visions and goals, which groups take regularly part HU SK I
Land owners X X X Land users X X X Local residents / Other citizens X X X Hiking clubs and sport associations X X X Mushroom / Berry collectors Hunting and fishing representatives X X X Community representatives X X
Other activists in nature protection activists in nature protection
At what regular intervals is monitoring carried out? HU SK IEvery 1 or 2 years Every 3 to 5 Less than once in 5 years At irregular intervals, as necessary X X Other 10-15 YEARS Are there regional differences in the treatment of forest based recreation and nature tourism? HU SK I
There are very big differences X X X There are big differences There are some differences There are small differences There are no differences Overall how do you evaluate the consideration of forest based recreation and nature tourism in the forests of your country?
HU SK I
Excellent Good X X Sufficient X Satisfactory Unsatisfactory
Table 1: Comparison of Hungary, Slovakia and Italy regarding forest recreation and nature tourism.

Nature Tourism: Concepts and Experiences in Recreational and Protected Areas
222
References
Cieszewska, A., Drexler, D., Bihu ová, M., Kalincsák, P. & Prochazka, J. (2005).
Regional Report of Eastern European Countries. Czech Re-public, Hungary, Latvia, Lithuania, Poland and Slova-kia. COST Action E33 ‘FORREC’ Forest Recreation and Nature Tourism. Working Group for Recreation Planning and Management.
Ferenc, G. (1996). State Forest Management in the Transi-tion Period from Planned Economy to Market Direct-ed One. IUFRO-95 Papers and Abstracts. http://www.metla.fi/iufro/iufro95abs/rsp14.htm
Pattichis, G., Kazafaniotis, S., Kazepi, M., Hatzistathis, A., Castro, J.M., Rubin G., Mariotti, B. & Comic, L. (2005). Planning and Management Practices in the Mediterranean Region. A Study Report for Cyprus, Greece, Croatia, Portugal, Italy and Serbia-Montene-gro and Portugal. COST Action E33 ‘FORREC’ For-est Recreation and Nature Tourism. Working Group for Recreation Planning and Management.
Salbitano, F. (2005). I Boschi alla Porta di Casa: parteci-pazione e selvicoltura nie boschi urbani e periurba-ni. In Corona, P., Iovino, F., Maetzke, F., Menguzzato, G., Nocentini, S. & Portoghesi, L. (a cura di). Foreste Ricerca Cultura. Scritti in onore di Orazio Ciancio, p 457-475. Firenze.
Wirth, V. & Pröbstl, U. (2005). Questionnaire for the COST Action E33 about Forest Recreation and Nature Tour-ism. COST Action E33 ‘FORREC’ Forest Recreation and Nature Tourism. Working Group for Recreation Planning and Management.

Siegrist, D., Clivaz, C., Hunziker, M. & Iten, S. (eds.) (2006). Exploring the Nature of Management. Proceedings of the Third International Conference on Monitoring and Management of Visitor Flows in Recreational and Protected Areas.
University of Applied Sciences Rapperswil, Switzerland, 13-17 September 2006. Rapperswil.
223
Birdwatching and Protected Areas of Georgia
Ramaz Gokhelashvili & Lela Azniashvili
Georgian Center for the Conservation of Wildlife, Georgia
[email protected]@gccw.org
Keywords: Georgia, birdwatching, protected areas, assessment, nature resources management.
Introduction
Birdwatching is a new type of nature based tour-ism for Georgia and little is done yet at nation-al level for its development. The major reasons that are supportive for birdwatching development in Georgia are – diversity, rarity, endemism and important congregations of birds, globally recog-nized wetlands and Important Bird Areas, sever-al wintering sites, existence of major bird migrato-ry corridors and stopover or “refueling” areas, and all these in combination of unique cultural-histor-ical attractions. Potential benefit of birdwatching
development to the national economy is estimated at about 40 million USD per year (Gavashelishvi-li et al. 2005).
One of the major strategic objectives for Georgia Protected Areas development is to promote nature tourism in these areas. This objective is declared by the government of Georgia and the Protected Areas authorities. Birdwatching, as part of nature based tourism, may significantly benefit Protected Areas of Georgia by increasing their incomes, and at the same time, by positively changing the pub-lic’s perceptions about nature resources. This pa-
Figure 1: Protected Areas of Georgia.

Nature Tourism: Concepts and Experiences in Recreational and Protected Areas
224
per analyses the current situation of management of protected areas in Georgia to compare it with the declared objectives.
Methods
The geographical distribution of Important Bird Areas and the range of the Caucasian Black Grouse (Tetrao mlokosiewiczi) were compared to the exist-ing protected areas in Georgia using a GIS to ex-amine system level planning results in contrast to the tourism development objectives. In addition, the current situation in existing protected areas was assessed by collecting and analyzing the following information for twenty randomly selected protect-ed areas: biological importance (species richness, endemism, number of globally threatened species, etc.), socio-economic importance (provision of re-sources or services to surrounding settlements), vulnerability (existing and potential threats), man-agement effectiveness (existence, quality and im-plementation status of management plans) and available funding (provided by both the national government and international donors).
Results
The Protected Areas system of Georgia (figure 1) is comprised by 21 Nature Reserves (IUCN Cat-egory I), 4 National Parks (IUCN Category II), 3 Natural Monuments (IUCN Category III) and 11 Sanctuaries (IUCN Category IV). The major prob-lems identified in protected areas of Georgia are: non-existence of management plans or low effec-tiveness of existing management plans; lack of marketing; very low capacities for tourism man-agement.
The Important Bird Areas are the most attractive places for nature tourists, including birdwatchers, because they are identified and delineated with in-ternationally approved and tested criteria and refer to the biologically richest sites (Gokhelashvili et al. 2004). The Protected Areas System and the Impor-tant Bird Areas of Georgia (figure 2) are compared by overlaying these maps. It is found that only 15 % of Important Bird Areas fall within protect-ed areas. Besides, the map of Caucasian Black Grouse, one of the most attractive species for bird-watchers (Gokhelashvili et al. 2005), is overlaid to
Figure 2: Important Bird Areas of Georgia.

Nature Tourism: Concepts and Experiences in Recreational and Protected Areas
225
the protected areas map (figure 3), which shows that only 4.5% of the Caucasian Black Grouse hab-itats are within current protected areas of Georgia.
Conclusion
The conclusion is made that the current Protect-ed Areas system of Georgia does not support one of its strategic objectives to develop nature based tourism. The recommendations are pre-sented to make relevant changes both at system-level planning and at management planning of individual protected areas. Recommendations are grouped in four major categories: 1) En-largement of protected areas - Tusheti, Kazbe-gi and Lagodekhi; 2) Establishment of new pro-tected areas at key sites – Meskheti, Javakheti, Adjara and Racha-Svaneti; 3) Capacity build-ing of existing protected areas to improve the management effectiveness - Borjomi-Kharagau-li National Park, Tusheti National Park, Kolkhe-ti National Park, Kazbegi Nature Reserve, Vash-lovani National Park, Algeti Nature Reserve and Lagodekhi Nature Reserve, 4) Development of birdwatching guidelines for the protected areas – relevant infrastructure, training of guides, na-tional and international marketing.
References
Gavashelishvili L., Gokhelashvili R., Javakhishvili Z. & Tarkhnishvili D. (2005). A Birdwatching Guide to Georgia. Tbilisi.
Gokhelashvili R., Gavashelishvili L. & Javakhishvili Z. (2005). Caucasian Black Grouse Action Plan. Tbilisi.
Gokhelashvili R., Javakhishvili Z. & Azniashvili L. (2004). Important Bird Areas of Georgia. Tbilisi.
Figure 3: Caucasian Black Grouse and Protected areas of Georgia.

Siegrist, D., Clivaz, C., Hunziker, M. & Iten, S. (eds.) (2006). Exploring the Nature of Management. Proceedings of the Third International Conference on Monitoring and Management of Visitor Flows in Recreational and Protected Areas.
University of Applied Sciences Rapperswil, Switzerland, 13-17 September 2006. Rapperswil.
226
Nature-Based Activities on Urban – Green Requirements of Nature-Based Activities in an Urban Environment
Holger Kretschmer
German Sport University Cologne, Germany
Keywords: Sport, nature sports, urban green, visitor employed photography.
Introduction
The exertion of nature-based activities is no longer related to rural or suburban spaces. Especially na-ture-based sport plays a major part in daily recre-ation and is requested within the communities. As an effect of growing demand for semi-natural areas in cities, a higher pressure on nature and conflicts between different user-groups has been recog-nized. These conflicts are a result of lack of prac-ticable planning-guidelines for nature-based sport in an urban environment. In particular, sport-de-velopment-planning, the traditional instrument for planning activity-spaces, has fewer concepts to in-tegrate urban green into their work. Planners have concentrated on building and managing facilities over the last 50 years and were not able to deal with nature-bases activities.
Methods
Until the late 1980s the Golden Plan was the main tool for planning sport facilities. The aim was a homogeneous supply of sport facilities on the basis of strict parameters as e. g. sport area in m² per capita. As a consequence, there is a stock of 170.000 facilities in Germany which are great-ly subsidized up to a degree that is no longer ac-ceptable. In that consequence it was necessary to change planning strategy. It switched from an area-wide supply of facilities to a demand-driv-en strategy. The result was two main concepts for planning sport facilities: “The Guideline for Sport-Facility-Management” (BISP 2000) and “The Integrated Planning” (Rütten, Schröder & Ziemainz 2003). Both strategies start with a sur-
vey to identify the sport behaviour of the local population. Afterwards it is possible to calcu-late the needed facilities with a statistical proce-dure by using “The Guideline”. “The Integrated Planning” analyses the results of the survey in a “round-table-discussion” with all participants of the sport system. Then the participants work out a sport-development-concept in a dialogue-process.
However, both methods focus on built sport fa-cilities. The importance of active outdoor-rec-reation is mentioned in both, but with no rele-vance for practical planning.
Results
It is important to integrate nature-based activ-ities into planning strategies because gener-al developments in society have affected sport and lead to massive changes in exertion sport (Wopp 2005). The changes with main effects are individualisation and excess of ageing. As a re-sult competitive sports are demanded less while there’s a higher request for endurance sports. Being fit and healthy are the most named mo-tives for doing sport. Nature-based activities such as running, walking and cycling are always among the top 5 activities in surveys about fa-vourite sports within the communities (Hübner 2004, Kirschbaum 2002).
Regarding these developments it seems to be necessary to expand current planning-strategies through concepts for nature-based activities.
Nature Tourism: Concepts and Experiences in Recreational and Protected Areas
227
Conclusion
The project “nature-based activities in urban ar-eas” wants to do basic research for a development of planning-guidelines. The aim of the project is to create a model of an ideal space for nature-based activities in urban areas. Which image of nature do sportspeople have in mind when doing nature-based activities in an urban environment? Which elements of landscape are preferred and what in-frastructure is needed?
The project started with monitoring an urban park with infrared-counters (trafX) in September 2005 to identify user-frequency during the course of a day. In combination with quantitative surveys it was possible to identify a peak of use in the late morning and one in the afternoon. It was also pos-sible to detect preferred paths and areas of low in-terest within the park.
But fieldwork within the project has shown that monitoring of user-frequency and doing quantita-tive surveys are just the first step to improve ur-ban green for nature-based activities. The results of the quantitative research allow no conclusions about the quality of the environment needed. To identify these needs it was necessary to operate with qualitative methods in addition to the quanti-tative research. A photo assisted method, the visi-tor employed photography (VEP), has been adapt-ed to the urban environment and the researched activities get and categorize information about the quality of preferred landscapes. Corresponding to the categories, different types of spaces are devel-oped.
The presentation will discuss the latest results of the project and give an outline of the question of ideal activity space.
References
Hübner, H. & Kirschbaum, B.(2004). Sporttreiben in Müns-ter 2003. Ergebnisse der Einwohnerbefragung 2003 und Trends im Sportverhalten der Münsteraner seit 1991. Münster.
Kirschbaum, B. (2003). Sporttreiben und Sportverhalten in der Kommune. Möglichkeiten der empirischen Er-fassung des lokalen Sportverhaltens als Basis kommu-naler Sportstättenentwicklungsplanung. Münster.
Bundesinstitut für Sportwissenschaft. (2000). Leitfaden für die Sportstättenentwicklungsplanung. Schorndorf.
Rütten, A., Schröder, J. & Ziemainz, H. (2003). Handbuch für die kommunale Sportentwicklungsplanung. Frank-furt am Main.
Wopp, C (2005). Schrumpfende Städte, ältere Menschen, leere Kassen. Sport(stätten)entwicklungsplanung in Zeiten demografischen Wandels. Vortrag anlässlich der Jahrestagung der Arbeitsgemeinschaft Deutscher Sportämter am 21.04.2005. in Zwickau. In: Gemeinde und Sport (2/2005), p 8-18

Siegrist, D., Clivaz, C., Hunziker, M. & Iten, S. (eds.) (2006). Exploring the Nature of Management. Proceedings of the Third International Conference on Monitoring and Management of Visitor Flows in Recreational and Protected Areas.
University of Applied Sciences Rapperswil, Switzerland, 13-17 September 2006. Rapperswil.
228
The Pan Parks Sustainable Tourism Strategy as a Tool forNature-Based Tourism Development in and around
Protected Areas
Zoltán Kun & Mylène van der Donk
PAN Parks Foundation, Hungary & The Netherlands
[email protected] [email protected]
Keywords: sustainable tourism, strategy, development, stakeholders, verification, PAN Parks, protected areas, com-munities.
Introduction
Since 1997, the PAN Parks Foundation has been challenging European protected areas to meet higher management standards and to provide high quality tourism experiences. The key to the foundation’s success has been the engagement of local businesses and local communities with pro-tected area managers in the visitor management of protected areas. The foundation aims to com-bine high nature management standard of protect-ed areas with quality tourism, bringing together several stakeholders and involving local commu-nities. All stakeholders of PAN Park’s regions have its role in contributing the development of the region’s nature-based tourism package. The tool which guides them through this development process is called the Sustainable Tourism Devel-opment Strategy (STDS). This paper discusses this process and deals with the lessons learned from its implementation in 8 different Europe-an protected areas. The EU DG Environment, re-ferred to PAN Parks as one of the most relevant initiatives to manage sustainable tourism in NA-TURA 2000 sites (European Commission DG Environment, 1999).
Methods
While working with protected area managers and local partners we recognised a serious lack of knowledge in relation to tourism development in rural regions. Therefore the foundation com-missioned experts to design an easy process that guides its partners through the process of defin-ing a Sustainable Tourism Development Strategy (STDS) which includes all major points mentioned in the CBD Guidelines. When preparing this strat-egy a wide range of experts of different fields have been consulted.
The foundation developed a third-party verifica-tion system, which includes three elements:
1) 5 Principles and criteria for sustainable man-agement and tourism development (see table 1 for principle 4 which relates the STDS).
2) The verification manual.
3) Independent verification.
Results
Since March 2006 eight national parks across Eu-rope are certified by PAN Parks and are working on the implementation and development of the strategy (see figure 2). Many others throughout the continent have engaged in negotiations which may eventually lead to their joining the network. Al-though there is a growing network of PAN Parks, the benefits of the concept for both the local com-munities and biodiversity conservation should be
Figure 1: PAN Parks Logo.

Nature Tourism: Concepts and Experiences in Recreational and Protected Areas
229
further studied. PAN Parks Foundation therefore developed a methodology of cost-benefit analysis, which can help measuring the socio-economic de-velopment of the regions. The network of certified PAN Parks presents a modern management prac-tice, which involves communities more in nature conservation through visitor management. The pro-tected areas joining the network act as role models in terms of ensuring long-term protection of biodi-versity and adding economic value to nature. The network of certified PAN Parks presents a modern
management practice which acts as a kind of role model in terms of ensuring long-term protection of biodiversity and adding economic value to nature.
The development of the STDS has been experi-enced by most of the regions as one of the most dif-ficult parts of the certification. Communication be-tween the protected areas, the communities and the local entrepreneurs improves as a result of proper development of the STDS. Involving all stakehold-ers in the process involves effort and is a time con-suming task, especially in those areas where large distances and the lack of modern communica-tion technology make the situation more difficult. However, the efforts from the park management are highly appreciated by the local stakeholders. A study done in Bieszczady, Poland, showed that lo-cal partners and non partners value being involved and informed as a very positive effect of the PAN Parks project.
References
European commission, DG Environment. (1999). Sustain-able tourism and Natura 2000 Guidelines, initiatives and good practices in Europe. Montpellier.
www.panparks.org
Principles on the Sustainable Tourism Development Strategy 4.1: A Local PAN Park Group is set up and assumes responsibility for formulating, implementing, and monitoring STDS and executes verification of the business partners. Stakeholders and potential PAN Parks partners formally confirm their support and commitment to the conservation goals of the protected area and PAN Parks Foundation.[1]4.2: The Local PAN Park Group formulates, implements, and monitors the STDS for the PAN Parks region. 4.3: The PAN Parks region[17] has sufficient tourism potential and carrying capacity for sustainable tourism.[18] 4.4: The Communications and Marketing Strategy of the STDS aims at informing all target groups. 4.5: Planned tourism development and existing tourism activities are based on sustainable use of the ecological resources of the PAN Park region. 4.6: Tourism development and existing tourism activities are based on sustainable use of the socio-economic resources of the PAN Park region, including minority and if appropriate indigenous people's issues. 4.7:Planned tourism development and existing tourism activities are based on sustainable use of the cultural resources of the PAN Park region.
Table 1: Principle and criteria of STDS.
Figure 2: Overview of certified PAN Parks.

Siegrist, D., Clivaz, C., Hunziker, M. & Iten, S. (eds.) (2006). Exploring the Nature of Management. Proceedings of the Third International Conference on Monitoring and Management of Visitor Flows in Recreational and Protected Areas.
University of Applied Sciences Rapperswil, Switzerland, 13-17 September 2006. Rapperswil.
230
Management of Ecotourism in National Chambal Sanctuary, India
R.J. Rao
Jiwaji University, India
Keywords: Ecotourism, Chambal River, Crocodile Sanctuary, wilderness values, customer satisfaction.
Introduction
India is a major destination for International Tourists. During the last decade, a trend emerged in India for nature-based tourism and ecotourism. In Central India there are many wildlife sanctu-aries, particularly areas like National Chambal Sanctuary in Gwalior region have large attrac-tions for Eco-tourism. This paper is the result of a study conducted in the National Chambal Sanc-tuary to investigate the potential for integrating crocodile conservation with ecotourism. Its main objective is to identify and where possible assess the potential long-term benefits and opportuni-
ties of strategically integrating crocodile conser-vation requirements with the future needs of eco-tourism industry.
Methods
A survey of ecotourism operators was conduct-ed to know the interests of tourists visiting the Chambal Sanctuary. Interviews were taken with ecotourists at different years while studying the ecology of aquatic animals in the Chambal Riv-er. Students were requested to fill the interview schedules on their interests, facilities available for ecotoursim and conservation programmes of
Figure 1: Map of National Chambal Sanctuary showing three entry points (Pali, Dholpur and Etawah) for ecotourism.

Nature Tourism: Concepts and Experiences in Recreational and Protected Areas
231
Figure 3: Ecotourism in the National Chambal Sanctuary., India
Figure 2: Wildlife in the National Chambal Sanctuary, India.

Nature Tourism: Concepts and Experiences in Recreational and Protected Areas
232
endangered species in the Sanctuary. Impact of ecotourism on the sanctuary has been assessed using the data on ecotourists and the manage-ment programmes of the Sanctuary.
Results
The National Chambal Sanctuary is one of the best-managed wildlife sanctuaries specially created for conservation of Gharial crocodile and other wild-life species like dolphin, otter, freshwater turtles, migratory birds etc. A large population of croco-diles is naturally breeding in the wild. Large num-bers of domestic and international tourists visit the sanctuary during peak tourist season from October to April. The sanctuary is quite suitable for wildlife tourism, river rafting, canoeing, adventure tourism, religious tourism, and cultural tourism. A crocodile rehabilitation centre, head-quarters of the Sanctu-ary is located near the Chambal River to view the crocodiles and turtles in captive condition. The val-ues of wilderness of the National Chambal Sanc-tuary are: good water quality, safe wildlife habitat, protecting rare and endangered species, providing scenic beauty, recreation opportunities, conserving natural areas for educational and scientific study, providing income for tourist industry. The NCS has all three important values like aesthetic, education and recreation.
Ecotourism in the Chambal Sanctuary is often as-sociated with small group activities. Larger-scale tourism operations include day tours to Nadagaon in Uttar Pradesh sector from Agra, day trips at Ra-jghat in Rajasthan and Madhya Pradesh sector, boat trips up to Gharial nesting sites at Tigri-rethoura, or visits to view large numbers of migratory birds on the beach. All these tours provide an educational program for tourists as well as direct experience.
Large numbers of scientists visited the sanctuary to study wildlife conservation on the river and also made educational films. In India Ranthambhore Ti-ger Reserve in Rajasthan, which is approximately 25 km north of the Chambal Sanctuary is a major wildlife tourist attraction. The Rajasthan Govern-ment has taken initiatives to promote tourism in the National Chambal Sanctuary, to attract tourists coming to Ranthambhore to visit the Chambal also.
There is a well organised tourism sector in Agra in Uttar Pradesh. Every year many tourists visit Agra to see the world famous Tajmahal. The travel agents in Agra developed a tourism package for the tour-ists from Agra to Chambal Sanctuary to view wild animals like dolphins, crocodiles, migratory water-fowl etc. including the crocodile rearing centre at Deori, Morena.
This study explored two research questions relat-ed to the nature of customer satisfaction among various segments of visitors at National Cham-bal Sanctuary. Research studies revealed that vis-itors to the Sanctuary were better educated, more friendly towards conservation organizations and more supportive of efforts to protect the wilder-ness characters of the area. The social change in the region, national focus on the region’s natural resources and a growing urban population, as well as educational efforts contributed to the increased tourism in the Sanctuary.
Conclusion
This paper argues for a detailed assessment of the ecological characteristics and natural features that attract tourists to the National Chambal Sanctu-ary. The studies revealed that people interested in seeing aquatic animals and birds visit the sanctu-ary regularly. The Government is interested to pro-mote ecotourism in the sanctuary. However, better information is needed on tourists’ desires, expecta-tions and needs including tourist activity and ful-fillment, across the tourism spectrum. It is rec-ommended that the ecotourism in the National Chambal Sanctuary be ecologically sustainable, and for this to be successful that it contribute to the long-term maintenance of ecosystems and spe-cies in the Sancatuary. Major mechanisms for inte-grating biodiversity conservation and ecotourism and nature-based tourism in the National Chambal Sanctuary are explored in this study.

Siegrist, D., Clivaz, C., Hunziker, M. & Iten, S. (eds.) (2006). Exploring the Nature of Management. Proceedings of the Third International Conference on Monitoring and Management of Visitor Flows in Recreational and Protected Areas.
University of Applied Sciences Rapperswil, Switzerland, 13-17 September 2006. Rapperswil.
233
Analysis of Nature-Based Tourism in the Sumava National Park, Czech Republic: 1997-2004
Viktor Trebicky1 & Martin Cihar2
1EnviConsult Ltd., Czech Republic [email protected]
2Charles University, Czech [email protected]
Keywords: National parks, nature-based tourism, visitors, environmental pressure, CO2 emissions, monitoring.
Introduction
The past decades have seen a pronounced in-crease in tourism, both domestically and inter-nationally. Tourism is primarily based on mo-bility and the consumption of distances, places and visual images. Therefore, it has traditional-ly been regarded as an environmentally benign sector, with a positive economic impact on lo-cal, regional and national economies. However, since the mid-1970s, evidence of tourism’s neg-ative environmental, economic and social im-pacts has accumulated. Natural areas and pro-tected areas are the most vulnerable. They are visited by a growing number of visitors, both in the Czech Republic and abroad. Travel defined by its principle aim – visiting natural areas – is called nature-based tourism.
On a global scale, nature-based tourism ac-counts for about 10% of international tourism and is often regarded as the fastest growing tourist sector, with annual growth rates of 15% (Gössling 1999). Official indicators of nature-based tourism’s volume in the Czech Repub-lic are not available; the only published expert study found nature-based destinations to have a 17% share among the “126 top tourist areas in the Czech Republic”.
As tourism is probably the world’s largest in-dustry and nature-based tourism is becoming an increasingly important sector, the direct and in-direct impacts on protected areas are on the rise (Gössling 1999). Therefore, a systematic re-search and monitoring of nature-based tourism
in protected areas is needed. In the Czech Re-public, Sumava National Park was chosen as a study area for monitoring and assessing nature-based tourism development over a longer (eight year) period. It is the country’s largest national park, visited by 1.1 to 1.3 million visitors an-nually.
Methods
Results are based on annual surveys that were carried out in the high summer season over a nine day period at four monitoring points in the central part of the park, from 1997 to 2004. The survey’s methods include interviewing a ran-dom sample of visitors, via an extensive ques-tionnaire. The following number of question-naires were collected:
N1997 = 1,274, N1998 = 1,020, N1999 = 1126, N2000 =665, N2001 = 959, N2002 = 648, N2003 = 900, N2004
= 911.
The questionnaire was split into nine sections with 42 questions in total:
Tourist socio-demographic characteristics (7 questions)
Itineraries (5 questions)
Modes of transport and types of accommoda-tion (5 questions)
Purpose of visit and role of the national park (5 questions)
Environmental awareness of visitors (6 ques-tions)

Nature Tourism: Concepts and Experiences in Recreational and Protected Areas
234
Evaluation of conservation and tourism man-agement in the park (4 questions)
The park’s carrying capacity in terms of visitor numbers (3 questions)
Tourist activities and spending in the national park (7 questions)
Over the eight years of monitoring, 7,503 complet-ed questionnaires were collected. The total num-ber of records derived from these questionnaires was 450,000. The primary data were entered into an MS Access database and statistically processed in the NCSS program (Hintze 2001). In the next stage, the primary data were statistically treated using the 2 test for evaluating cases where results differed between different years of monitoring. In such cases, a modifier pair test, based on the Bon-ferroni Difference was used for identification of the particular year and sub-question where the dif-ference occurred.
Further, the 2 test and Kruskal-Wallis one-way ANOVA were employed to determine differences between visitors’ socio-demographic characteris-tics and their attitudes and opinions towards man-agement of the park. CO2 emissions related to the three tourism sub-sectors (travel to and from the park, travel within the park and visitor accommo-dation) were calculated for the years 2000-2004. Regarding transport, calculations were based on emission factors, occupancy (load) rates and trav-el distances both to the park and within the park. For accommodation, calculations were based on an estimation of energy use associated with various types of accommodation, as well as relevant emis-sion factors.
Finally, total individual CO2 emissions for each park visitor were calculated by adding up emis-sions from transport to/from the park, transport within the park and accommodation. Regression analyses were carried out to investigate the extent to which different factors determine the total emis-sions of CO2 per person. Kruskal-Wallis one-way ANOVA was used to determine differences be-tween visitor characteristics with regard to total emissions of CO2.
The calculation of CO2 emissions was limited by several uncertainties and simplifications, e.g. the calculation of emission factors, the use of the na-
tional average load factors for busses and trains, the estimation of average distances travelled with-in the national park, the use of New Zealand’s data on accommodation energy intensity and the omission of CO2 produced by tourists’ internal metabolisms. Combined, these errors and uncer-tainties may amount to 20-30% of the total results. The total margin of error is therefore 20-45% (a tentative and indicative estimate).
Results
Comparing Sumava National Park’s visitors with the population of the Czech Republic, we learned that the first group is better educated, higher in so-cial status and more often male than female. Fur-ther, park visitors tend to be in the middle (25-39 years) and upper-middle (40-59 years) age groups. These findings correspond with many authors and institutions dealing with nature-based tourism and eco-tourism (e.g. Wight 1996).
Positive trendsThe results of monitoring show that nature-based tourism in Sumava National Park went through significant change over the eight years of study. From the point of view of regional sustainable de-velopment, some positive trends can be named, i.e. the regional, semi-autarkic character of tourism in the park; the fact that the distances travelled by tourists within the park have not increased; the fact that the costs of recreation have not grown faster than inflation; and the positive attitudes towards conservation management in the park.
The regional, semi-autarkic character of tourism in the park can be illustrated by two findings. Firstly, in the national make-up of respondents, there is a prevailing domination of Czech tourists. Over the eight-year period, an average of 93% of park visi-
Year 1997 2000 2004N (number of respondents) 1,122 557 795Average distance 198 196 204Median distance 160 160 170Minimum 40 40 40Maximum 625 676 626
Table 1: Travel distances to SNP (in km).

Nature Tourism: Concepts and Experiences in Recreational and Protected Areas
235
tors were Czech. The share of foreign visitors has never exceeded 10%. If we focus in more detail on the Czech visitors, the highest proportion of tourists came from nearby districts. Prague and nine other nearby districts accounted for 55% of the Czech visitors.
The median travel distance by Czech tourists to the park increased only 10 km over the eight years. Average distances increased by 8 km (ta-ble 1). First-time visitors are mostly younger people and students, mostly from distant larg-er cities. Repeated visits to the park are mainly from nearby regions.
The distance travelled to the national park is an important indicator from the point of view of associated CO2 emissions (see below) and for the estimation of the recreational value of the park using the travel costs method.
The median recreational costs per visit (costs spent by tourists for accommodation and food in the park) rose from 2,100 CZK (82 USD) in 1997 to 2,800 CZK (109 USD) in 2004. This rep-resents an increase of 33%, which corresponds with inflation over the same period. Multiplying
the median recreation costs per tourist stay with the lower estimate of total annual visits to a broader region of Sumava (1.1 million) reveals a rough approximation of the total gross annual expenditures on recreation in Sumava National Park. For the year 2004, the result is 1.65-2.20 billion CZK (64-86 million USD), which is 9-12% of the total domestic expenditures on rec-reation.
Finally, tourists’ attitudes towards conserva-tion management can be regarded as positive. For example, if we use the eight-year average, 57% of those visitors polled declared their un-willingness to enter the forbidden Zone 1 of the park; 65% of visitors were able to cite specific ecological problems in the park; and only 17% suggested that the environmental quality in the park has declined over the past years. However, this was the highest share among the Czech na-tional parks.
Negative trendsOn the other hand, significant negative trends were also identified, i.e. a growing dependence on car use, a reaching of the park’s carrying capaci-
Transport in the NP (97-04)
0,0%
10,0%
20,0%
30,0%
40,0%
50,0%
60,0%
1997 1998 1999 2000 2001 2002 2003 2004
Bike Car"Green" bus Hiking entirelyLineární (Car) Lineární (Hiking entirely)
Figure 1: Transport modal split in the Sumava National Park (1997-2004).

Nature Tourism: Concepts and Experiences in Recreational and Protected Areas
236
ty in terms of visitor numbers, an increasing level of consumption among visitors, a passive form of tourism developing and a very small share of ac-tive ecotourists among park visitors.
The car dependence of travelling to and within the park increased over the monitoring period. On av-erage, 82% of visitors travelled by car to the park. This share increased from 78% in 1997 to 85% in 2004. The bus was the second most popular trav-el mode, but its share of modal split was 10 times smaller. While travelling within the park, most vis-itors combine different travel modes. However, several important trends were identified, such as a decreasing share of people using entirely non-pol-luting modes of transport (walking or walking/cy-cling). From 2000 to 2004, their number decreased from 48% to 31%. Secondly, the share of car use in combination with other transport modes has grown proportionally (from 33% to 54% – see figure 1).
According to several authors (e.g. Hall 1999), transport for tourists is not just a means of getting from A to B, but can be an end in itself. Experi-ence while in transport is then an essential part of the tourist experience (Hall 1999). In this context, transport to/from the Sumava National Park and
especially transport within the park is an impor-tant part of the nature-based tourism experience. To meet the objective of CO2 emissions reduction associated with passenger transport, a modal shift away from cars is necessary. As our results illus-trate, nevertheless, most of the people associate their nature-based tourism experience with using a car. Paradoxically, the nature-based tourism ex-perience is to some extent a car-based experience and changing the modal choice of visitors would therefore require altering the way they experience nature. It is not surprising that policies aimed to reduce car dependence have so far had only minor influences on behaviour.
The carrying capacity of visitor numbers in the central areas of the park has nearly been reached. Only a small percentage of visitors (less then 5%) would not mind if the number of visitors increased further. The feeling that tourism is too concentrat-ed is more widely held by tourists in the park’s central areas than in the more peripheral areas (in 2004, 53% of visitors stated that the intensity of tourism is too high). The carrying capacity of visi-tor numbers has been reached or even exceeded in many protected areas worldwide (Gössling 1999).
0
100
200
300
400
500
600
700
0 5 10 15 20 25 30 35 40 45Length of stay (days)
Tota
l em
issi
ons
of C
O2
(kg/
visi
t)
20002004R2=0,575R2=0,284
Figure 2: Regression analysis for length of stay and total emissions of CO2 per visit for 2000 and 2004 data.
Nature Tourism: Concepts and Experiences in Recreational and Protected Areas
237
The most sensitive areas are protected areas in de-veloping countries, which are exposed to an ever-growing number of visitors (Boo 1990).
Several trends have been identified suggesting a growth in consumption and a passive form of tour-ism in Sumava. The consumption patterns of park visitors were shifting towards less sustainable op-tions – car dependence increased as well as the ‘pace of visit’ (preference of cycling over walking, etc.). Based on the results of the survey, we esti-mated the share of active eco-tourists among park visitors to be only 3-5%. The rest of the visitors may be categorised as passive eco-tourists.
Regarding visitors’ perceptions of Sumava Nation-al Park, we learned that it is to a large degree based on mental images of the Sumava (“clean, pristine, natural nature”). However, over the last years, this image contradicted reality in the park. The im-age didn’t inspire visitors to act accordingly – in a more environmental friendly way.
CO2 emissions from nature-based tourism
Concerning the CO2 emissions caused by nature-based tourism in Sumava National Park, expressed both per visit and per person, results reveal grow-ing emissions (by 9% from 74.3 kg CO2/visit/per-son to 81.6 kg CO2/visit/person). The accommoda-tion sector dominates total CO2 production, with a 63% and 62% share in 2000 and 2004, respec-tively.
Regression analyses were carried out to investi-gate whether there is a linear relationship between the total emissions of CO2 per person and two ex-planatory variables: length of stay and distances travelled to the park. The results show that there is a positive correlation between length of stay and emissions of CO2 in 2000 (r2 = 0.575; corre-lation coefficient 0.7585; P = 0.000). This rela-tionship was weaker but still significant in 2004 (r2 = 0.284; correlation coefficient 0.533; P = 0.000) – see figure 2.
In 2004, distance was also a significant factor (r2 = 0.262; correlation coefficient 0.512; P = 0.000), which means that 26% of variations in total emissions of CO2 per visit in 2004 can be ex-plained by distance travelled to the park. In 2000, this relationship was weaker (r2 = 0.077; correla-tion coefficient = 0.278; P = 0.005).
Several conclusions for the Park Administration and regional tourism management have been de-rived from the above-mentioned results. The Park Administration should be aware of temporary trends of nature-based tourism in Sumava and should actively prevent continuous attempts for ‘hard’, quantitative development of the tourism in-dustry in the park. The environmental information system of the Park Administration has to be re-conceptualised to meet the true mental images of the park. It should also try to highlight alternatives to the way that most people currently experience nature, which is based on car use. Moreover, it was suggested that the Park Administration conduct re-search based on the willingness-to-pay method to set the optimal level of the park entrance fee. If es-tablished, entrance fees can generate a significant amount of income to finance the Park Administra-tion’s activities connected with tourism.
Finally, the biggest challenge for all ‘stakeholders’ is to change human behaviour patterns in the park. This will be a time-consuming process and both governmental and Park Administration actions are essential for the enforcement of appropriate mea-sures. To provide valuable scientific arguments for such measures, further research is needed on the tourism-national parks interface, especially with regard to direct and indirect impacts of tourism.
References
Boo, E. (1990). Ecotourism: The Potentials and Pitfalls, vol. 1 and 2.Washington, DC.
Gössling, S. (1999). Ecotourism - a means to safeguard biodiversity and ecosystem functions? In: Ecological Economics (29), p 303 - 320.
Hall, D.R. (1999). Conceptualising tourism transport: in-equality and externality issues. In: Journal of Trans-port Geography (7), p181 - 188.
Hintze, J. (2001). NCSS and PASS. Number Cruncher Sta-tistical Systems. Kaysville. www.ncss.com.
Wight, P.A. (1996). North American Ecotourists: Market Profile and Trip Characteristics. In: Journal of Travel Research (34/4), p 2-10.
238
Requirements for Recreation and their Integrationinto Landscape Planning
Matthias Buchecker (Chair)

Siegrist, D., Clivaz, C., Hunziker, M. & Iten, S. (eds.) (2006). Exploring the Nature of Management. Proceedings of the Third International Conference on Monitoring and Management of Visitor Flows in Recreational and Protected Areas.
University of Applied Sciences Rapperswil, Switzerland, 13-17 September 2006. Rapperswil.
239
Local Residents’ Relationship towards their Nearby Outdoor Recreation Areas
Matthias Buchecker & Jacqueline Frick
Swiss Federal Research Institute for Forest, Snow and Landscape Reasearch, Switzerland
[email protected]@wsl.ch
Keywords: Outdoor recreation, quality of life, requirements, landscape management, survey.
Introduction
In the last decades, recreation has become a main aspect of people’s quality of life (Müller 1999). It is assumed that especially opportunities for nearby outdoor recreation are of crucial significance for people’s lives allowing them to regulate their phys-ical and psychological resources (Hobfoll 2001, Fuhrer & Kaiser 1994). In contrast to residential areas, nearby recreation areas have so far been ne-glected in formal planning procedures. There is also only little empirically confirmed knowledge regarding the local residents’ relationship towards their nearby recreation areas and the qualities peo-ple expect of such areas. To fill this gap we start-ed a study aiming at answering the following ques-tions:
What are the expectations of the residents re-garding their nearby recreation areas?
Which factors influence the recreational use of specific areas
Which actions regarding the improvement of recreation areas do the residents perceive as needed?
In which form could the residents’ requirements be best included in the planning of recreation areas?
Methods
We conducted the study in a district at the Northern fringe of the city of Zürich using methods of quan-titative social science research. Therefore we sent standardised questionnaires to a random sample of
1000 local residents. The return rate of this survey reached 32%, and the achieved sample proved to be balanced in terms of socio-demographic crite-ria. In the questionnaire questions on the perceived quality of the interviewees’ residential area were combined with questions focussing on the specif-ic quality of four nearby outdoor recreation areas (attractiveness, use intensity, activities, participa-tion in decision making). This survey also serves as a basis for a landscape development planning for this district, which will be started in the next months.
Results
The statistical analysis of the data revealed that the local residents of the investigated district generally appreciated their nearby outdoor recreation areas better than their more immediate residential areas. The proximity of the recreation areas proved to be more relevant for people’s use of these areas than their attractiveness and explained a large amount of the variance of use. The requirements for attrac-tive nearby recreation areas appeared to be high-ly diverse, and more determined by attracting than disturbing (i.e. urbanisation driven) characteris-tics. Astonishingly, considering the high use-den-sity of these areas crowding did not appear to be a major challenge for attractiveness; much more dis-turbing revealed to be aspects such as littering or traffic noise. In spite of the high significance the recreation areas had for them, only a small part of the interviewees have so far participated in shap-ing their everyday surroundings. Interestingly,

Requirements for Recreation and their Integration into Landscape Planning
240
most relevant for this abstinence was not the gen-eral disinterest in such activities, but people’s re-luctance to going out on a limb.
The results suggest that easy and quick access seems to be most important to maintain and im-prove the use and attractiveness of nearby outdoor recreation areas. Therefore measures to enhance nearby outdoor recreation should concentrate on improving the access opportunities from the res-idential areas to the closest recreation areas. To raise the attractiveness within the recreation areas, a better inclusion of the local residents into the planning of outdoor recreation areas is needed fac-ing the diversity of requirements expressed. This can be reached best by offering them opportunities to express their wishes and ideas in a more private way, with interviews, questionnaires including spatial-explicit items (photos, maps) or discus-sions within “homogenous” groups (e.g. mothers, elderly people).
To base the so far neglected outdoor recreation planning on people’s recreation needs, more re-search is required. In particular a better under-standing of the function of nearby recreation areas for people’s regulation of their physical and psy-chological resources is called for.
References
Fuhrer, U. & Kaiser, F. (1994). Multilokales Wohnen. Bern.
Hobfoll, S.E. (2001). The influence of culture, communi-ty, and the nested-self in the stress process: advanc-ing conservation of resources theory. In: Stress, cul-ture and community: The psychology and physiology of stress, p 51-87. New York.
Müller, H. (1999). Freizeit und Tourismus. Eine Einführung in Theorie und Politik. Bern.

Siegrist, D., Clivaz, C., Hunziker, M. & Iten, S. (eds.) (2006). Exploring the Nature of Management. Proceedings of the Third International Conference on Monitoring and Management of Visitor Flows in Recreational and Protected Areas.
University of Applied Sciences Rapperswil, Switzerland, 13-17 September 2006. Rapperswil.
241
Landscape Planning for Nearby Outdoor Recreation –Implications from an Exploratory Interview Study
Barbara Degenhardt & Matthias Buchecker
Swiss Federal Institute for Forest, Snow and Landscape Research, Switzerland
[email protected]@wsl.ch
Keywords: Nearby outdoor recreation, recovery, work load, strain, motive, behavioural resource, landscape man-agement, peri-urban.
Introduction
Environments that promote recovery and recre-ation are a fundamental resource of modern so-ciety. Empirical studies suggest that the expe-rience of nature is an important motivation for outdoor recreation activities in general, as well as for nearby outdoor recreation. But this need for natural areas for recovery and recreation is in conflict with the current landscape development in peri-urban areas in Switzerland and in West-ern Europe in general. Competing forms of land use in these areas, such as settlement, road con-struction, and nature conservation increase the pressure on nearby recreational areas.
Most of the existing research, particularly in Switzerland, that has been done on nearby out-door recreation behaviour focuses on forest rec-reation and neglects recreation in open country. However, recreation in open country, or in com-bination with forest recreation, seems to be of importance as well, especially if one considers that people practicing outdoor activities repeat-edly mentioned landscape preferences for open-ness and diversification. Moreover, in most of the research, on-site visitor surveys using short and/or full-structured questionnaires have been preferred. These methods make it difficult to gain insight into less obvious, but also behav-iour-relevant factors for nearby outdoor recre-ation and the relationships between those fac-tors. To gain more insight into it, we explored the decision strategies of nearby outdoor recre-ationists.
Methods
The city of Frauenfeld (22000 inhabitants) in the East of Switzerland was chosen as the case study area. Relying on a theoretical sampling strategy, in June/July 2005 we contacted, par-ticipators in the three most common outdoor recreation activities in Switzerland; namely walking/hiking, biking, and jogging. The sam-ple included both men and women, from dif-ferent age groups, who were contacted at three different sites in forest and open country dur-ing the week and at the weekend according to a time and place scheme. The response rate was 46 percent and 18 problem-focused interviews were conducted with 8 walkers/hikers, 6 bikers and 4 joggers.
The central questions of the interview guideline were: What causes people to use the nearby out-door recreational area? With which aims do peo-ple use the area? What factors are relevant for which routes of the recreational area they use? When do they use it alone and when do they use it in company with other people? What are the relationships between those aspects? The in-terviews were analysed by qualitative content analysis using the software NVivo 2.0.
Results
Five domains of factors were identified; namely loads, strains, motives, behavioural resources, and characteristics of the nearby outdoor recre-ational area.
Requirements for Recreation and their Integration into Landscape Planning
242
Out of 25 loads, 21 related explicitly to the life do-main of work, two loads to the private life domain, and another two to both domains. Loads were sub-classified into three dimensions. Firstly, demands related to the (work) activity itself such as concen-tration demands, or emotional work. Secondly, the loads of the social context in which the activity is embedded such as the type and quantity of social contacts. Thirdly, the loads related to the physical environment in which the activity has to be ful-filled such as the noise level at work.
The dimensions of strains were all related to per-sonal strains and were further classified into psy-chological and physical strains. Psychological strains include cognitive capacity, emotional con-stitution, and psychological exhaustion. Physical strains include physical tension, pain, and deper-sonalisation.
The motives for using the nearby outdoor recre-ation in daily life also had a focus on personal, so-cial, and environmental aspects. Mood-regulation, and personal growth are examples of the motives that relate to the persons themselves. The motives with a social focus include motives such as gen-erativity and intimate communication. Motives related to the environmental aspects refer to, for example, the experiences of certain landscape el-ements.
Characteristics of the nearby outdoor recreation-al area that influence people‘s behaviour were classified into four types: 1) environmental char-acteristics with personal meaning such as places of biographical importance, 2) natural-geographi-cal characteristics referring to, for example, flora, geographical features, and weather, 3) construc-tional characteristics such as intensity of develop-ment and infrastructure, and 4) social character-istics of the environment such as crowding, and noise level.
The behavioural resources that moderate the re-alisation of use motives were also classified into personal, social, and environmental conditions. Personal conditions relate to, for example, time, knowledge, and state of health. Social conditions refer to the availability of companions and the needs of their companions. Environmental condi-tions include amongst others factors of the inside
and outside living conditions, and characteristics of the access area. The focus of the presentation will be directed towards the different behavioural resources.
Outlook
The results of this explorative research will pro-vide a basis for the development of a question-naire-based household survey and provide input data for the development of a GIS-based suitabil-ity map for the use of nearby outdoor recreation-al areas.
Siegrist, D., Clivaz, C., Hunziker, M. & Iten, S. (eds.) (2006). Exploring the Nature of Management. Proceedings of the Third International Conference on Monitoring and Management of Visitor Flows in Recreational and Protected Areas.
University of Applied Sciences Rapperswil, Switzerland, 13-17 September 2006. Rapperswil.
243
Development of a Zoning Instrument for Visitor Management in Protected Areas
René J.H.G. Henkens, Rene Jochem, Rogier Pouwels & Peter A.M. Visschedijk
Alterra Green World Research, The Netherlands
[email protected]@wur.nl
[email protected]@wur.nl
Keywords: Recreation, visitor, breeding birds, protected area, Natura 2000, disturbance, impact, zoning, nature management, PROGRESS.
Introduction
PROGRESS (PROmotion and Guidance for Recre-ation on Ecologically Sensitive Sites) is an initiative co-funded by the EU Interreg IIIB Program. It’s a four-year international project between the Forestry Commission (UK), Office National des Forêts (Fr), Research Institute Alterra (NL), the Country site Agency (UK) and Tourisme Seine et Marne (Fr). The project aims to reduce the impacts arising from the increasing demands of recreation on protected conservation areas; in this case the New Forest in the UK and the Forêt de Fontainebleau in France. Besides their designation as Natura 2000 sites these areas have in common that they are situated within reach of large centres of population attracting mil-lions of visitors each year. Due to their populari-ty, some parts of both sites are coming under in-creasing recreation pressure and action is needed to help protect the habitats and wildlife these sites have been designated for. One of the project’s main objectives therefore is to develop a zoning instru-ment which can serve as a management tool for the redirection of visitor flows.
Methods
The GIS-based models MASOOR and LARCH de-veloped at Alterra are the basic elements of the zon-ing instrument. MASOOR stands for Multi Agent Simulation of Outdoor Recreation; agents being user-groups like walkers etc. MASOOR models the recreational use of a road/path network in an area.
Input for the model are GIS-maps of car parks as a visitor starting point and the network of roads/paths to move around on. Input on visitor densi-ties has been derived from car park capacities, the estimated car park turn over rate and the results of year round traffic counters. Input on visitor charac-teristics has been derived from interviews like the type of user-groups; group size; duration of the vis-it; walking distance etc. (Visschedijk et al. 2002). Interviews have been carried out near car-parks on several days throughout the year, in order to verify seasonal differences. GPS’s were handed out to vis-itors in order to analyse the actual use of the area, to compare it with the interviews and consequently to validate the output of the model. Due to the scale of both sites, MASOOR had to be extended with a separate tool to allow for a quick scan on potential problem locations; a common scale problem which has also been recognised by Gimblett (2005).
The model LARCH stands for Landscape Assess-ment using Rules for Configuration of Habitat. LARCH determines ecological networks for spe-cific species in a patchy landscape and assesses the potential sustainability of these networks (Opdam et al. 2003, Verboom & Pouwels 2004). The results of LARCH may differ from the actual species dis-tribution due to external factors like visitor distur-bance which affect the ecological carrying capaci-ty. An intensive literature research on dose-impact relations of recreation and breeding birds has been carried out (Henkens et al. 2003) and laid down in a database easily accessible for modelling purposes.
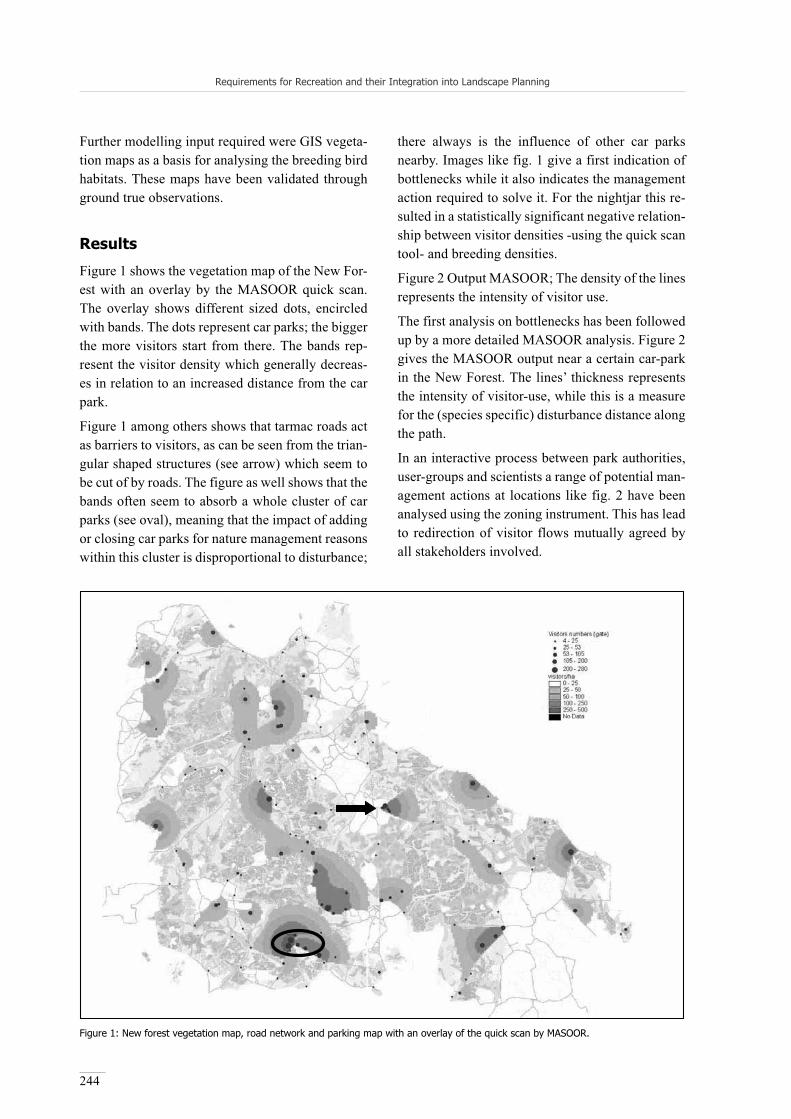
Requirements for Recreation and their Integration into Landscape Planning
244
Further modelling input required were GIS vegeta-tion maps as a basis for analysing the breeding bird habitats. These maps have been validated through ground true observations.
Results
Figure 1 shows the vegetation map of the New For-est with an overlay by the MASOOR quick scan. The overlay shows different sized dots, encircled with bands. The dots represent car parks; the bigger the more visitors start from there. The bands rep-resent the visitor density which generally decreas-es in relation to an increased distance from the car park.
Figure 1 among others shows that tarmac roads act as barriers to visitors, as can be seen from the trian-gular shaped structures (see arrow) which seem to be cut of by roads. The figure as well shows that the bands often seem to absorb a whole cluster of car parks (see oval), meaning that the impact of adding or closing car parks for nature management reasons within this cluster is disproportional to disturbance;
there always is the influence of other car parks nearby. Images like fig. 1 give a first indication of bottlenecks while it also indicates the management action required to solve it. For the nightjar this re-sulted in a statistically significant negative relation-ship between visitor densities -using the quick scan tool- and breeding densities.
Figure 2 Output MASOOR; The density of the lines represents the intensity of visitor use.
The first analysis on bottlenecks has been followed up by a more detailed MASOOR analysis. Figure 2 gives the MASOOR output near a certain car-park in the New Forest. The lines’ thickness represents the intensity of visitor-use, while this is a measure for the (species specific) disturbance distance along the path.
In an interactive process between park authorities, user-groups and scientists a range of potential man-agement actions at locations like fig. 2 have been analysed using the zoning instrument. This has lead to redirection of visitor flows mutually agreed by all stakeholders involved.
Figure 1: New forest vegetation map, road network and parking map with an overlay of the quick scan by MASOOR.

Requirements for Recreation and their Integration into Landscape Planning
245
Conclusions
The GIS based zoning instrument proved to be a handy decision support tool for nature managers to identify locations where visitor disturbance suppresses the quality of birds’ breeding habitat beyond a certain threshold and to find best ways to redirect visitor flows.
A statistically significant negative relationship has been found between visitor disturbance and breeding densities of the nightjar.
The participatory GIS approach built trust among stakeholders about data and tools that were used, which increased the acceptance of proposed actions to redirect visitor flows.
Further scientific research should among others focus on dose-impact relations between visitor pressure and the breeding success of birds, or other biodiversity features concerned.
References
Gimblett, H. R. (2005). Modelling Human-Landscape In-teractions in Spatially Complex Settings: Where are we and where are we going? Paper presented at the MODSIM 2005 International Congress on Modelling and Simulation, Modelling and Simulation Society of Australia and New Zealand, December 2005.
Henkens, R.J.H.G., Jochem, R.,. Jonkers, D.A, de Mole-naar, J.G., Pouwels, R., Reijnen, M.J.S.M., Visschedi-jk, P.A.M., & de Vries, S. (2003). Analysis on the im-pact of recreation on breeding birds. Literature study and coupling of the models FORVISITS and LARCH (in Dutch). The Netherlands Environmental Asses-ment Office (MNP). Document 2003/29.
Opdam, P.F.M., J. Verboom and R. Pouwels (2003). Land-scape cohesion: an index for the conservation poten-tial of landscapes for biodiversity. In: Landscape Ecol-ogy (18), p 113-126.
Verboom, J. & Pouwels, R. (2004). Ecological function-ing of ecological networks: a species perspective. In: Jongman, R.H.G. & Pungetti, G. (Eds.) Ecological Networks and Greenways: Concepts, Design, Imple-mentation p 56-70. Cambridge.
Visschedijk, P.A.M. & R.J.H.G. Henkens (2002). Recre-ation monitoring at the Dutch Forest Service. In: Arn-berger, A., Brandenburg, C., Muhar, A. (2002) (Eds.). Monitoring and Management of Visitor Flows in Rec-reational and Protected Areas. Conference Proceed-ings. Bodenkultur University Vienna, Austria, January 30 – February 02, 2002. Vienna.
Figure 2: Output MASOOR; The density of the lines represents the intensity of visitor use.
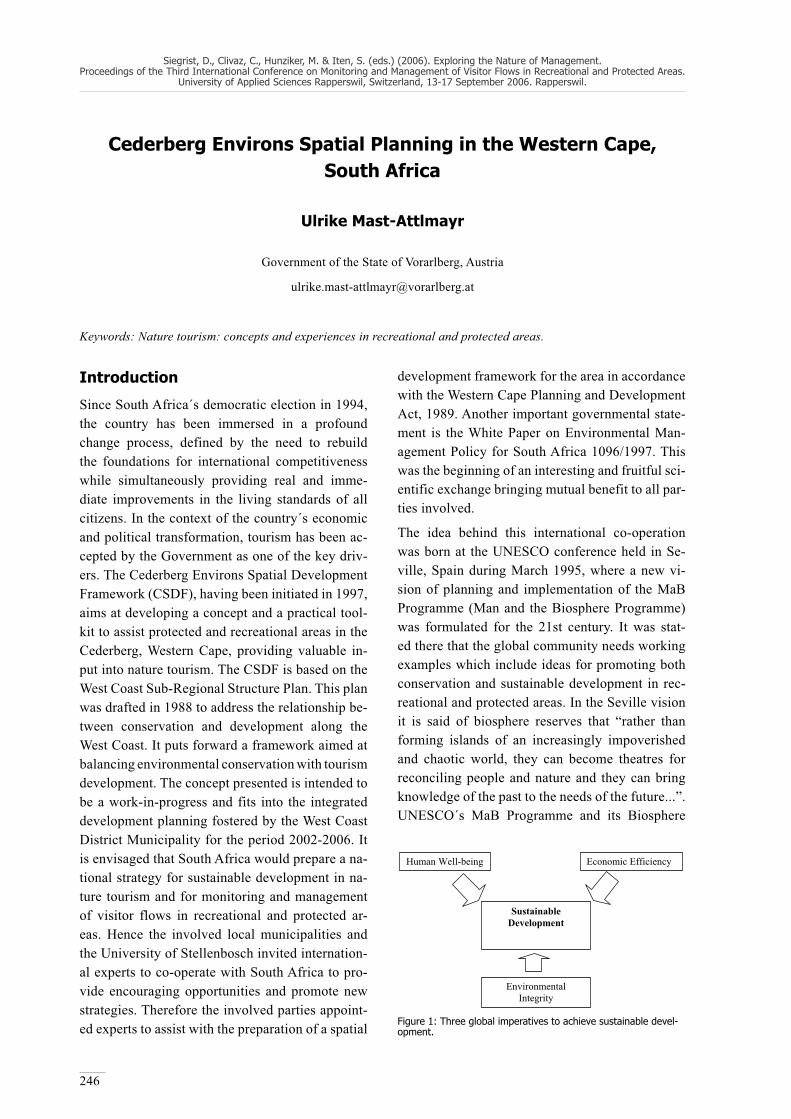
Siegrist, D., Clivaz, C., Hunziker, M. & Iten, S. (eds.) (2006). Exploring the Nature of Management. Proceedings of the Third International Conference on Monitoring and Management of Visitor Flows in Recreational and Protected Areas.
University of Applied Sciences Rapperswil, Switzerland, 13-17 September 2006. Rapperswil.
246
Cederberg Environs Spatial Planning in the Western Cape, South Africa
Ulrike Mast-Attlmayr
Government of the State of Vorarlberg, Austria
Keywords: Nature tourism: concepts and experiences in recreational and protected areas.
Introduction
Since South Africa´s democratic election in 1994, the country has been immersed in a profound change process, defined by the need to rebuild the foundations for international competitiveness while simultaneously providing real and imme-diate improvements in the living standards of all citizens. In the context of the country´s economic and political transformation, tourism has been ac-cepted by the Government as one of the key driv-ers. The Cederberg Environs Spatial Development Framework (CSDF), having been initiated in 1997, aims at developing a concept and a practical tool-kit to assist protected and recreational areas in the Cederberg, Western Cape, providing valuable in-put into nature tourism. The CSDF is based on the West Coast Sub-Regional Structure Plan. This plan was drafted in 1988 to address the relationship be-tween conservation and development along the West Coast. It puts forward a framework aimed at balancing environmental conservation with tourism development. The concept presented is intended to be a work-in-progress and fits into the integrated development planning fostered by the West Coast District Municipality for the period 2002-2006. It is envisaged that South Africa would prepare a na-tional strategy for sustainable development in na-ture tourism and for monitoring and management of visitor flows in recreational and protected ar-eas. Hence the involved local municipalities and the University of Stellenbosch invited internation-al experts to co-operate with South Africa to pro-vide encouraging opportunities and promote new strategies. Therefore the involved parties appoint-ed experts to assist with the preparation of a spatial
development framework for the area in accordance with the Western Cape Planning and Development Act, 1989. Another important governmental state-ment is the White Paper on Environmental Man-agement Policy for South Africa 1096/1997. This was the beginning of an interesting and fruitful sci-entific exchange bringing mutual benefit to all par-ties involved.
The idea behind this international co-operation was born at the UNESCO conference held in Se-ville, Spain during March 1995, where a new vi-sion of planning and implementation of the MaB Programme (Man and the Biosphere Programme) was formulated for the 21st century. It was stat-ed there that the global community needs working examples which include ideas for promoting both conservation and sustainable development in rec-reational and protected areas. In the Seville vision it is said of biosphere reserves that “rather than forming islands of an increasingly impoverished and chaotic world, they can become theatres for reconciling people and nature and they can bring knowledge of the past to the needs of the future...”. UNESCO´s MaB Programme and its Biosphere
Human Well-being Economic Efficiency
SustainableDevelopment
Environmental Integrity
Figure 1: Three global imperatives to achieve sustainable devel-opment.

Requirements for Recreation and their Integration into Landscape Planning
247
Reserve concept is a global programme of interna-tional scientific co-operation dealing with people-environment interactions.
In 1995 the International Institute for Sustainable Development (IISD) pointed out that sustainable development occurs at the intersection of three global imperatives shown in the figure above (fig-ure 1). If these imperatives are not balanced sus-tainable development cannot be achieved. In the case of the Cederberg Environs, this equation largely hinges on environmental integrity.
Study Area
The Cederberg Environs, a mountainous area of about 12700 km2, are situated within the south-western part of South Africa and cover areas with-in the Western Cape Province and the Northern Cape Province. The Cederberg Environs offer a unique diversity of cultural and natural resources that have huge potential for nature tourism. There-fore it is of national and international importance due to its exceptional conservation value (table 1).
Currently 389 253 ha of the area studied has statu-tory conservation status. All my data presented re-fers to this area.
The Cederberg Environs and their proclaimed con-servation areas have grown into a popular destina-tion for tourists attracting more than 70000 visi-tors per annum. It is internationally known for its exceptional scenic beauty and unique flora. Many rare endemic fynbos species occur in the area stud-ied with the Clanwilliam cedar (Widdringtonia ce-darbergensis) probably being the most notable. Further more this area shows some important char-acteristics as follows:
The Cederberg Environs comprise unique nat-ural environmental attributes that justify their status as a national asset.
The natural environment and its resources are susceptible to overexploitation or inappropriate use.
The tourism sector depends on the environ-ment.
CONSERVATION STATUS RESOURCE AREA (HECTARES)Wilderness Area Cederberg 71 000 Groot Winterhoek 24 000 National Parks Tankwa Karoo 43 000 Provincial Nature Reserves Cederberg 2 800 Groot Winterhoek 5 500 Matjiesrivier 13 000 Oorlogskloof 5 570 Mountain Catchment Areas Cederberg 59 000 Koue Bokkeveld 96 000 Private Nature Reserves Groenfontain 2 400 Kagga Kamma 6 000 Zuurfontain 12 000 Local Nature Reserves Ramskop 50 Akker-en-Dam 1 800 Nieuwoudtville 115 Natural Heritage Sites Bushman´s Kloof 7 000 Beaverlac 2 000 Bo-Boschkloof 1 000
Visgat 1 000 National Monuments The Wuppertal Area 36 000
TOTAL 389 235
Table 1: Statutory Conservation Area profile.

Requirements for Recreation and their Integration into Landscape Planning
248
There is a substantial need for community de-velopment programmes.
Protected areas are of importance to all people of the world, and therefore international legal instru-ments give the opportunity to ensure that impor-tant sites are given appropriate recognition and support in the retention of their integrity. For ex-ample, biosphere reserves are such international-ly designed protected areas, which are managed to demonstrate the value of conservation. This mod-ern international concept of protected areas should be adopted for the Cederberg Environs.
The estimated total population of the area stud-ied is 57000. The area is sparsely populated with 2,2 people/km2. It is described as primarily ru-ral with 60% of the population living on farms or communal property – deriving more than 50% of their net profit from tourism.
Methods
The CSDF was drafted in accordance with the ba-sic vision and mission set down in the provincial growth and development strategy. Additional fun-damental guidance was provided by the discussion document “Towards a New Environmental Policy for South Africa” by the Department of Environ-mental Affairs and Tourism, 1996 stating that:
“In the process of transforming the South African society, the South African Government states as one of its priorities, that the government must ensure that all South African citizens, present and future, have the right to a decent quality of life through the sustainable use of resources. It also states that environmental considerations must be built into every decision and that current legislation should be revised with a view to establishing an effective system of environmental management in South Af-rica. The underlying principle of sustainable devel-opment is not only recognised as a priority by the South African Government but also international-ly in Agenda 21”. To balance the above aspirations with sustainable utilisation of the natural environ-ment and its community supporting resources, this mission was applied as a guideline to the formula-tion of a specific vision and mission statement for the Cederberg Environs:
Vision: creating a model of co-operative plan-ning and management for human well-being and environmental stustainibility;
Mission: facilitating the management and monitoring of the Cederberg Environs in or-der to benefit the needs of the present with-out compromising the ability of future gener-ations to meet their needs.
Spatial development generally implies certain dimensions or levels of change of environment. A certain degree of change has to be accepted. It is, however, important for inevitable change to provide certain limits to protect the “sense of place” of the affected environment. This re-quires planners, managers and decision-makers to define natural conditions and to undertake ac-tions to maintain or achieve these conditions. Changes to the environment could be eliminat-ed if all use was prohibited. Such prohibitions are, however, neither possible nor feasible. The challenge is therefore not one of how to pre-vent human-induced change, but rather one of deciding how much change will be allowed to occur, where it will be allowed and which ac-tions are needed to control it. Therefore co-or-dinated public participation was a fundamental principle of the planning process.
Biosphere reserves provide the building blocks for bioregional planning or spatial development in a bioregion. They are the most widely im-plemented and recognised of the various bio-regional planning programmes existing world-wide. The management objectives of these sites are to conserve the diversity and integrity of bi-otic communities for present and future use. At these sites emphasis is given to the integration of functions such as research, resource manage-ment, monitoring, training and education in or-der to help solve problems locally, nationally and internationally. Therefore it should bring to-gether all interested groups in a partnership ap-proach both at site and network levels. And last but not least it should improve the understand-ing of the tourist´s relationship with the natural world through programmes of public awareness, information, formal and informal education.

Requirements for Recreation and their Integration into Landscape Planning
249
The biosphere reserve concept has been found an ideally suited mechanism to apply bioregional planning principles in an area where a variety of land uses and activities are found. Each biosphere reserve must be approved by Unesco´s Man and the Biosphere International Co-ordinating Coun-cil before it is offically designated. (South Africa`s first biosphere reserve, The Kogelberg Biosphere Reserve, was registered in 1998.) The biosphere reserve concept is based on a structure of interre-lated zones, namely a core area, a buffer zone and transition zones. Appropriate conservation status and land use are assigned to each zone. The con-cept aims to ensure that all zones of a bioregion contribute appropriately to conservation and sus-tainable development. Furthermore human dimen-sions of a bioregion should be reflected in a more significant way.
The CSDF process was based on the following strategic planning process showing an iterative process (figure 2) that was based on active public participation at all levels of planning which start-ed in 1997.
Currently the development is in phase 4. It is a pro-cess that concentrates on the selection of issues of strategic importance which have long term conse-quences. Emphasis is being put on practical results and it provides a mechanism for co-operation be-tween all sectors, community groups and the gen-eral public.
ResultsThe project offers diverse and interesting out-comes. Some of which are being presented here having international relevance. Figure 3 gives an overview of the recommendations put forward by the CSDF.
STRATEGIC PLANNING PROCESS
Phase 1: Step 1: Organization Step 2: Scanning of the Cederberg Environs Phase 2: Step 3: External Analysis Step 4: Internal Analysis Phase 3: Step 5: Formulation of Policy and Strategy Step 6: Final DraftPhase 4: Step 8: Implementation of Bioregional Planning Process Step 9: Recommendation for Management and Monitoring
Figure 2: Three global imperatives to achieve sustainable development.
ECONOMIC and SOCIAL ENVIRONS
Management of Nature Tourism Fair Trade in Tourism
NATURAL ENVIRONS Biophere Reserve Concept Biodiversity Corridors
LEGISLATIVE & INSITUTIONAL FRAMEWORK
CEDERBERG ENVIRONS SPATIAL DEVELOPMENT FRAMEWORK RECOMMENDATIONS
Figure 3: CSDF: Recommendations for sustainable development in the Cederbergs.

Requirements for Recreation and their Integration into Landscape Planning
250
The CSDF aims at achieving strategic goals to promote equitable access to and sustainable use of natural and cultural resources and to promote environmentally sustainable lifestyles in the area studied. Therefore it is important to integrate envi-ronmental management with all economic and spa-tial development activities in order to satisfy basic needs of the local people and the tourists visiting this area.
Nature tourism has been identified as one of the sectors with the largest potential for growth and development in the Western Cape. It is a major driver of post-apartheid socioeconomic growth. Nature tourism in the Cederberg is very seasonal with the main concentration of tourists visiting the region during the spring flower season. The most important problems or limiting factors of monitor-ing nature tourism being analysed in this study are the following:
Shortage of appropriate tourist accommodation for nature tourism;
Inadequate road maintenance limiting access to recreational and protected areas;
Lack of co-operation between community tour-ism structures;
Lack of guidelines for developing tourist facil-ities;
Lack of human resource management skills;
Nature based tourism is one of the key economic activities that can be developed in the region. To be effective such a strategy needs to identify the po-tential nature based tourism opportunities that ex-ist and correlate these areas of key importance with biodiversity conservation areas.
In 2001 the innovative project “Fair Trade in Tour-ism Initiative” has been established to improve tourism. The so called Fair Trade in Tourism South Africa (FTTSA) advocates equity in tourism by promoting sanctioned fair trade in tourism prin-ciples – fair share, democracy, respect, reliability and transparency and sustainibility by awarding a special label, the FTTSA trademark. FTTSA cer-tification is based on a rigorous assessment pro-cess which tests the extent to which staff and oth-er stakeholders benefit meaningfully from tourism activities. The trademark provides credibility while
simultaneously opening up access to niche markets. This fair trade concept has newly been adopted for the Cederberg Environs. The main results FTTSA expects to achieve over the next few years include: increased awareness about fair trade in tourism in the area studied, increased demand for other FTT-SA projects in related areas.
Also the levels of social development of the peo-ple play an important role in the manner the natural environment and its resources are used. The inten-tion would be to integrate such opportunities into a managed environment that is generating economic returns and creating jobs. It is one important goal of the study to develop human resources. The CSDF process provides guidelines to facilitate social de-velopment and economic empowerment in order to improve the well-being of the local people. Elec-tronic medium was used to facilitate the public par-ticipation process and the collection of data. Rele-vant information has been put onto a geographical information system (GIS) so that information will be available for end users for different purpose (e.g. information, education, training). Further on such a system implies that information can be eas-ily updated. Key issues within the area were photo-graphed and video-taped. This material is used for diverse national training programmes: “Reach & Teach” is used in secondary schools newly having tourism as a subject in the syllabus; “Ubuntu-We Care” is a customer-training programme aimed at service providers. Capacity-building programmes for emerging entrepreneurs will be a specific focus of the training programmes in the next few years.
The final draft gives recommendations of scientists and practitioners from a series of workshops as well as analysis for the implementation of the bio-sphere concept in the Cederberg Environs as part of the Bioregional Planning Programme in the West Coast Region. The recommended zoning has been described and illustrated. A summery of the recom-mended land use in the respective zones is provid-ed next. The basic principle is that the core areas have the highest conservation status and the low-est intensity land uses while transition zone 3, con-versely, has the lowest conservation status and the highest intensity land uses. Conservation status de-creases and land use intensity increases progres-sively moving away from the core area.
Requirements for Recreation and their Integration into Landscape Planning
251
The recommended core areas comprise the statutory conservation areas, namely statutory wilderness areas, national parks and provincial nature reserves. No development is allowed in these areas. It is important to know that “wil-derness” represents the highest conservation status and serves as a benchmark for conserva-tion management. The Cederberg Wilderness Area has been divided into three zones. A max-imum of 50 people per day is permitted into each zone. The CSDF provides strategies for improving the core areas.
The area comprises large tracts of proclaimed mountain catchment areas, sections of which are currently serving as unofficial buffer zones for the statutory wilderness areas and nature reserves. The purpose of buffer zones is to pro-tect ecological and social integrity of the core area. They serve as natural corridors that are essential for the functioning of ecological sys-tems. No large-scale development is to be al-lowed in the buffer zone. Any form of develop-ment must be planned by a multi-disciplinary forum to prevent environmental degradation. The CSDF provides spatial guidelines and strategies for consolidating and extending the buffer zones. The buffer zones are followed by three transition zones.
The transition zone 1 surrounds the buffer zone and represents an area where the natural and cultural environment is of high value. Low im-pact land-uses are allowed (e.g. fynbos utilisa-tion, ecotourism with small scale resort devel-opment). All development must be guided by a management plan and by regular environmental auditing in accordance with appropriate stan-dards (refer to ISO 14001). In transition zone 2 activities that extract natural resources such as agriculture, forestry and mining are dominant activities. Small scale low impact urban devel-opment and tourism development (e.g. resorts) can be allowed. This zone has the addition-al role of protecting high potential agricultur-al areas from urban expansion. Environmental control must be exercised to regulate impacts of intensive development. In transition zone 3 large-scale urban and rural development can be accommodated. Theses zones were identi-
fied to control the negative impacts of major development (e.g. agricultural, industrial and urban development) by actively promoting co-operation between the key role players. Effec-tive co-operation is a fundamental requirement there. Spatial guidelines and strategies for con-solidating and extending transition zone 1-3 are given in the CSDF.
There are some other interesting results as shown in certain projects by various initiatives on differ-ent matters. Some of these initiatives of the CSDF are discussed as follows:
In 2004 Cape Nature Conservation in conjunction with the Cape Action for People and the Environ-ment (CAPE) have been launching the Greater Cederberg Biodiversity Corridor (GCBC). CAPE realised that efforts to conserve life-supporting processes should include natural corridors that stretch across habitats. These would help ensure the conservation of critical habitat types and sup-port the concepts of holistic conservation. This initiative places emphasis on the natural and cul-tural resources of the Cederberg Environs. As a rule it has been established to ensure the survival of specific species and their habitats and to sur-vey visitor flows. Though the primary aim is con-servation, the corridor provides opportunities for the social and the economic “upliftment” of lo-cal communities through tourism development. Some interesting projects supported by GCBC to control visitor flows are:
The establishment of donkey cart treks by the Wuppertal Conservancy
Surveys of the plant and animal life of the Tankwa Karoo.
Capacity control of visitors in the Cederberg Wilderness Area.
Conclusion
Pristine and unspoilt natural habitats supporting a diversity of plant and animal life in a landscape of scenic beauty must be considered a valuable re-source for the present and even more for future gen-erations. The conservation of the natural environ-ment of the area studied is therefore paramount.

Requirements for Recreation and their Integration into Landscape Planning
252
Environmental health is the key to sustainable de-velopment in the Cederberg Environs. The prima-ry threat to environmental health is fragmentation of the community–supporting ecosystems. There-fore the CDSF addresses issues such as biodiver-sity conservation, visitor management and human resources development with the aim of breaking the cycle of environmental degradation and pro-moting well-being of all the people of the Ced-erberg Environs. Rather than forming islands in a world increasingly affected by human impacts, biosphere reserves can become examples for rec-onciling people and nature. The CSDF gives an ex-ample how to overcome the problems of isolated hot-spots of protected areas. All the participants of the CDSF hope to stimulate further activities in this planning process for the mutual benefit of all parties affected.
References
Fuggle, R. & Rabie, A. (1999). Environmental Management in South Africa. Wetton.
Jordaan, M. (2000). Tourism in South Africa. Bloemfon-tein.
Hunter, C. & Green, H. (1989). Tourism and Environment. A sustainable relationship? London, New York.
Moss, D. (1999). Cederberg Environs, Spatial Development Framework. Moorreesburg.
World Conservation Union (IUCN), National Nations En-vironment Programme (UNEP), World Wildlife Fund for Nature (WWF). (1991). Caring for the Earth: A Strategy for Sustainable Living. Gland.

Siegrist, D., Clivaz, C., Hunziker, M. & Iten, S. (eds.) (2006). Exploring the Nature of Management. Proceedings of the Third International Conference on Monitoring and Management of Visitor Flows in Recreational and Protected Areas.
University of Applied Sciences Rapperswil, Switzerland, 13-17 September 2006. Rapperswil.
253
Local Recreational Areas: Accounting for Peoples’ Needs in the Development and Selection of Planning Instruments
Harry Spiess1, Margit Mönnecke2, Karin Wasem2 & David Kümin1
1Zurich University of Applied Sciences Winterthur, [email protected]@zhwin.ch
2University of Applied Sciences Rapperswil, [email protected]
Keywords: Local recreation, leisure-trends, peri-urbanisation, planning instruments, landscape planning, landscape development concept, spatial planning, sustainable development.
Abstract: The goal of the ‘ANAP’ research project is to indicate how peoples’ needs for and expectations towards lo-cal recreation areas can be met by the means of employing different planning instruments.
An in-depth analysis of the available literature reveals what people actually require and expect and the functional ca-pacity of the planning instruments is illustrated by four case studies. Evaluation of these case studies not only gives rise to recommendations concerning the future implementation of the various planning instruments, it also yields pro-posals for improving their performance in future development phases.
Peri-urbanisation leads to the rapid disappearance of attractive open landscapes in built-up areas. As a result, there is less space available for local recreational purposes, and people have to travel increasingly far to find the kind of land-scape they are looking for. In order to tackle and hopefully improve this situation in the long term, adequate instru-ments for controlling the way landscapes are developed within built-up areas are absolutely essential.
This research project aims to show how the different planning instruments can be implemented to achieve best out-comes for people seeking decent recreational areas. The planning instruments selected and developed have to be aimed at preserving an attractive landscape. The insights gained from this research provide the basis for recommendations concerning the future implementation of planning instruments, as well as for their future development.
The project ‘ANAP’ is a cooperative project between the ‘Research Centre for Leisure, Tourism and Landscape’ (FTL) at the University of Applied Sciences in Rapperswil (HSR), and the ‘Institute for Sustainable Development’ (INE) at the University of Applied Sciences in Winterthur (ZHW). Other project partners include the Federal Research Insti-tute for Forestry, Snow and Landscape (WSL), Green City Zurich (GSZ), Cantonal Agency for Spatial Planning and Survey of Zurich (ARV), Cantonal Agency for Waste, Water, Energy and Air of the Canton of Zurich (AWEL), and the Cantonal Agency for Spatial Planning of the Canton of Basle. Activities have started in 2003 and will end in 2006.
Research structure and methods
The project encompasses three main phases:
1. AnalysisIn an extensive analysis of the literature on the subject, the needs of people looking for local rec-reation, and recent trends in the field of local rec-reation were identified and collected.
2. Evaluation
The planning instruments best suited to lead to the kind of local recreation facilities and land-scapes that people want were evaluated. In addi-tion, the usefulness of planning instruments for resolving potential conflicts between the inter-ests of different stakeholders in the use of space was analysed. Towards this end, four projects in

Requirements for Recreation and their Integration into Landscape Planning
254
which areas close to built-up areas have been re-developed were selected as case studies, and evaluated:
a. Landscape-Development Concept (see Schubert 2000) ‘Limmatraum Zürich’
b. Land-use concept ‘Allmend Brunau Zurich’
c. Development planning Salina-Raurica (vi-cinity of Basle)
d. Development and implementation concept Töss / Leisental (Winterthur)
The following methods were used in the evalu-ation phase:
Analysis of existing studies
Analysis of planning instruments
Analysis of case studies
Subject-specific interviews with experts
3. ConclusionThe insights gained from the research provide the basis for formulating recommendations for the implementation of selected planning instru-ments in order to ensure that peoples’ needs in the field of local recreation can be taken into ac-count more effectively.This paper presents two partial project-results - an overview of current trends in leisure and rec-reation, the case study ‘Töss/Leisental’ (Winter-thur) - and the conclusion.
Overview of current trends in leisure and recreationTable 1 presents the results of the analysis of the literature addressing current and future trends in leisure and recreation relevant for spatial plan-ning in built-up areas. Trends indicate a continu-al, significant growth in both indoor and outdoor
Relevancy regarding recreation in agglomeration areas
Leisure and recreation trends Currentimportance
Anticipated developmentover the next 10 to 20 years
Impact on the change of landscape (Quality)
Strain on landscape (Quantity)
Fitness sports, outdoor (Jogging) Club sports, outdoor (football, tennis)Indoor sports (badminton, volleyball, gymnastics, etc.)
Soul sports (mountain biking, windsurfing, inline skating)Fun sports (para-sailing, verti-biking, bungee-jumping)Extreme sports (icefall-climbing, cave-diving)
Tren
d-sp
orts
Thrill sports (base-jumping, canyoning)
‘Being out in the open air’ (walking, hiking, biking) WellnessEvent shopping Amusement parks Mega events in sports and culture Virtual recreational offers (video games, play stations, virtual hotels)
- -
Key: low relevance high relevance
Table 1: Leisure and recreational trends and their impacts.

Requirements for Recreation and their Integration into Landscape Planning
255
recreational activities, even with no population in-crease. This will inevitably lead to an increased use of open spaces in built-up areas.
The trend towards even more rapid sequencing of activities (recreation, sports, work, family), or to-wards the simultaneous practice of different activ-ities (‘multi tasking’) will increase, and will be-come an important factor in the development of local recreation areas in European agglomera-tions.
However, the focus on trend sports should not be over estimated. Focussing on Germany, Opas-chowski (2004) finds that only a small fraction of the population is attracted to ‘trend sports’ and that the demographic trends towards an ageing popula-tion will lead to an increase in more relaxing activ-ities such as walking, hiking and cycling.
Evaluation of the Development and Implementation Concept Töss/Leisental (Winterthur)All case studies used a three level evaluation grid (figure 1) with only one adding a fourth level to evaluate the impact of the respective project on sustainable development. In addition to the in-
depth examination of the planning documentation, three to five expert interviews were carried out in all case studies.
By way of an example, the methodological con-cept and some of the results of the evaluation of the Development and Implementation Concept Töss / Leisental (Winterthur) are presented below.
The case study “Töss” investigates a small proj-ect whose aim it was to allow a river to re-find its natural course. At the end of the 1990’s, a decision was taken to allow the river more freedom in cer-tain sectors rather than to renovate existing dams. Up to the present, only a few interventions have been implemented. The development of the land-scape is mainly left to the forces of the river itself.
During the compilation of the Development and Implementation Concept, several potential con-flicts between goals such as groundwater supply, forest use, protection of nature, and research re-quirements were identified. Authorities managed to reduce the conflict potential by creating a trans-disciplinary ‘core group’. As a result, it was pos-sible to plan and implement the project compara-tively quickly.
Levels of evaluation I Evaluation of objectives
Which objectives with respect to recreation were considered in the planning?
Have objectives been operationalized? What design features are planned for implementation?
Does the planning process include the expectations of relevant stakeholders?
II Evaluation "state of the art"
To what extent are the requirements included from a professional point of view?
To what extent are the requirements of future users implemented?
To what extent should further aspects of recreational use of space be implemented?
III Evaluation of the Process What instruments have been implemented in order to assess future users’ expectations?
How has the involvement, collaboration, participation of stakeholders been organised?
Has a solution been reached that gains wide acceptance among relevant stakeholders?
What conflict solving strategies are ready to be implemented?
IV Evaluation of the contribution to sustainable development (where available) Ecological dimension: to what extent has living space for people, animals and plants been preserved, and to
what extent can natural resources be used, taking into account the quality of life of future generations? Economic dimension: to what extent has the well-being and development capacity of the economy been
considered? Social dimension: to what extent has society (people, their lives and development, solidarity and well-being)
been considered?
Figure 1: Levels of evaluation (Source: Based on Mönnecke, 2000).

Requirements for Recreation and their Integration into Landscape Planning
256
It is interesting to note that the interests of peo-ple looking for local recreation opportunities were only included marginally. Nevertheless, when questioned on the subject, comments made both by experts and by passers-by at the actual location of the project, indicate a high level of acceptance of the river project’s goals. Future research will have to validate whether or not the following quote is universally applicable: “as long as we shape at-tractive river landscapes, people will come to see them”.
Conclusion
A comparison of the four case studies based on the dimensions presented in figure 1 lead to the fol-lowing conclusions.
Dimension I: Evaluation of objectivesThe goals formulated in the planning documents are principally dedicated to aesthetics (e.g. within the context of rehabilitating river sections) and in-frastructure (e.g. roads and pathways). The catego-ries relating to the use of natural environments (e.g. the creation of natural areas requiring no mainte-nance suitable for children and young people), re-solving conflicts (e.g. between various leisure ac-tivities such as cycling and walking, or between leisure activities and environmental protection), and the designation of areas for leisure (e.g. ar-eas for peaceful, contemplative relaxation, fun and games etc.) are considered to a lesser degree.
Dimension II: Evaluation “State of the Art”All case studies concentrate on up-grading the lei-sure potential of less attractive areas – e.g. opening up streams, rehabilitating natural environments. Additional leisure-time opportunities will be cre-ated, such as skating and cycling facilities along the banks of the Sihl and the Limmat.
Only the implementation concept of the project “Allmend Brunau” systematically determined the needs of people seeking leisure and relaxation be-fore the planning process.
The needs of future user groups – which should be taken into account - are not explicitly addressed in the case studies. The reason being that it is rather difficult to give substantial weight to potential fu-
ture user groups in the participation process since current users and inhabitants are generally not pre-pared to consider such needs when “their” local leisure facilities are at stake.
Dimension III: Evaluation of the ProcessAll planning processes examined included some form of collaboration in different phases of the processes. However, the precise form of collabora-tion was different in each project. In all case stud-ies, the participation process led to improved com-munication and collaboration between the various actors (authorities, politicians, citizens):
Involvement of the local population
Involvement of young people (e.g. skate-board-ers and cyclists in the Allmend Brunau case)
Improved exchange between cantonal, commu-nity and state authorities
Focussed public communication work involving experts (Töss/Leisental)
Thanks to close collaboration between different actors throughout the planning processes, various goals were achieved. However, the right selection of participants to involve is a key factor for suc-cess.
Participative processes lead to new expectations of those involved. It is important that the goals of col-laboration, the possibility to influence participants and especially the relationship between collabora-tion and decision-making are clearly defined and communicated.
However, the analysis also revealed the limitations of participatory processes, especially when ap-plied to events that target a very heterogeneous au-dience. Not all participants were able to accommo-date the views of others, keeping strictly to their initial position. As a conclusion, participatory pro-cesses are instruments best used for the analysis of requirements, and needs, rather than for resolving conflicts.
It is safe to assume that participatory processes have led to a broader acceptance of the various projects within the relevant population. Most of the requirements and objections expressed could be accommodated in the design of the projects. In all the case studies, certain stakeholders felt they

Requirements for Recreation and their Integration into Landscape Planning
257
had been inadequately included in the process. In such cases, it was found to be important to con-tinue the dialogue with these groups, and to keep looking for potential solutions acceptable to all participants concerned. A suitable con-cept concerning information and communica-tion, at both the planning and the implementa-tion phases proved to encourage acceptance.
Dimension IV: Evaluation “Sustainability”Only one case study (Töss) was evaluated rel-ative to its contribution to sustainable devel-opment. Whether projects are really eco-nomically efficient, ecologically viable and socially acceptable can only be precisely eval-uated when the initial steps towards transfor-mation have been taken, and the consequences of the measures employed can be observed at least to some degree.
On the level of development and transfer con-cepts, it becomes clear that the main focus of the planned measures is seldom equally distrib-uted between the three sustainability dimen-sions: economy, society, and environment. In the Töss case study, for example, the main fo-cus clearly resided on the ecological dimen-sion.
Recommendations
The following recommendations are the result of the evaluation of both formal and informal planning instruments, and the analysis of the four case studies.
Combination of formal and informal plan-ning instruments: In order to implement goal- and result-oriented planning instruments, the following elements should be combined with a clear purpose in mind: formal instru-ments, such as general guidelines on spatial planning, usage planning and zone selection planning, are mainly suitable for ensuring and establishing leisure requirements. Infor-mal instruments, such as landscape develop-ment concepts, forest development planning
and Local Agenda 21 are especially suit-able for dealing with the needs of individu-als seeking leisure.
Creation of “nature experience” as well as spaces to encourage learning about nature: Within the planning framework for the fu-ture, it is important to pay more attention to the needs of both children and young people. Natural areas requiring no maintenance (e.g. quarries, gravel pits, former fields, areas in the forest) which are left to themselves and which can be designed and changed have be-come rare in residential areas.
Orientation on success factors: previously gathered experience and knowledge for iden-tifying success factors shows that project re-sults are not only influenced by the content structure of a project, but also by the proce-dural form, the way a project is carried out, and the behaviour of the participants. The studies undertaken by Wolf and Appel 2003, Stoll 1999, Brendle 1999, Wiener and Rihm 2002 offer an overview of success factors for the planning and transfer of projects within the fields of sport/leisure/tourism/mobility and nature protection.
Equal and timely inclusion of all relevant ac-tors: It is essential to ensure that all relevant actors are equally included in all phases of the planning process.
Win-win situation for all participating actors: If the planning process is to succeed and be accepted, it is absolutely vital that it results in an improvement of all individual actors’ situations (win-win situation).
Speedy transfer of measures: A speedy trans-fer of measures encourages motivation and ensures that the same people can be involved at all stages, from conflict resolution to trans-formation.
Monitoring and controlling: To ensure that the measures taken are effective, it is essen-tial to ensure that both the measures and reg-ulations are monitored and adhered to after implementation.

Requirements for Recreation and their Integration into Landscape Planning
258
Establishing a communication concept: Suc-cessful planning processes contain com-munication concepts, which describe how agreements, measures and regulations are communicated to all the relevant parties con-cerned.
Further research requirements
The following areas require more research.
Selecting participants to be included in the par-ticipation process: The evaluation of the four case studies revealed that the careful selection of participants is a major challenge. The diffi-culty resides in the necessity to identify all those persons who will be affected, either positively or negatively, by a specific project. At the same time a high number of participants is likely to substantially complicate the process.
Significance of the soft location factor “local leisure”: Additional sound knowledge of the significance of the “soft” location factor ‘(lo-cal) leisure’ compared to the classical location factors is absolutely vital and necessary. This would provide planners and politicians with the necessary arguments to increasingly in-clude leisure aspects into planning processes. Local leisure-time facilities are increasingly be-ing seen as a relevant marketing factor for com-munities, towns and regions. The most imme-diate and nearest leisure facilities available play an increasingly important role when choosing ei-ther where to live or where to set up a business. However, the relative importance of the leisure factor compared to other classic location factors (e.g. availability of highly qualified employees, communication networks, taxation, etc.) remains unclear.
Representative surveys on leisure-time needs outside the forests: In order to counteract the sometimes extremely high numbers of people who visit nearby forests, and the constantly di-minishing proportion of open and green spaces, more effort should be put into making agricultur-al and cultural landscapes more attractive for lei-sure time activities.
References
Brendle, U. (1999). Musterlösungen im Naturschutz – Poli-tische Bausteine für erfolgreiches Handeln. Münster.
Mönnecke, M. (2000). Evaluationsansätze für die örtli-che Landschaftsplanung. Grundlegung, Konzipierung und Anwendung. Dissertation am Fachbereich Land-schaftsarchitektur und Umweltentwicklung der Uni-versität Hannover. Hannover.
Opaschowski, H.W. (2004). Deutschland 2020: wie wir morgen leben - Prognosen der Wissenschaft. Wies-baden.
Stoll, S. (1999). Akzeptanzprobleme bei der Ausweisung von Grossschutzgebieten: Ursachenanalyse und An-sätze zu Handlungsstrategien. Frankfurt/Main.
Wiener, D. & Rihm, I. (2002). Erfolgsfaktoren und Qua-litätsstandards partizipativer Prozesse in Gemeinden, Quartieren, Städten und Regionen. Vorstudie. Basel.
Wolf, A. & Appel, E. (2003). Wirksamkeit freiwilliger Ver-einbarungen zwischen Natursport und Naturschutz. Abschlussbericht. Universität Duisburg-Essen.

259
260
Participation Processes in Recreationaland Protected Areas
Ulrike Pröbstl (Chair)

Siegrist, D., Clivaz, C., Hunziker, M. & Iten, S. (eds.) (2006). Exploring the Nature of Management. Proceedings of the Third International Conference on Monitoring and Management of Visitor Flows in Recreational and Protected Areas.
University of Applied Sciences Rapperswil, Switzerland, 13-17 September 2006. Rapperswil.
261
Participatory Processes and Participatory Research – A Tool for Conflict Identification and Development
of Management Decisions
Wolfgang Lexer1, Christiane Brandenburg2, Felix Heckl1, Andreas Muhar2,Friedrich Reimoser3 & Richard Zink3
1Umweltbundesamt GmbH, [email protected]
2University of Natural Resources and Applied Life Sciences, [email protected]
3University of Veterinary Medicine, [email protected]
Keywords: Biosphere reserve, conflict management, stakeholder participation, participatory research, protected ar-eas, sustainable use, wildlife management.
Introduction
The targeted and farsighted management of con-flicts is a basic task of any protected area manage-ment. This holds particularly true for Biosphere Reserves, which – being a non-typical category of protected area serving both conservation and sus-tainable development objectives – are subject to a comparatively weak regulatory regime in terms of legal restrictions and prescriptions for land use management. Instead, management of Biosphere Reserves has to rely to a large extent on governing a complex network of stakeholders with compet-ing interests and conflicting goals. That includes taking a pro-active role in conflict situations, ne-gotiating trade-offs, and canalizing conflicts in a productive way that serves the obligations and ob-jectives of the protected area. Approaches to ef-fective management of land use-related conflicts under these conditions must be responsive to the inherent complexity of those conflicts (Daniels & Walker 1997). Successful reconciliation of con-flicts, compliance with decisions, acceptance of management measures and active commitment to their implementation on part of the stakehold-ers inevitably requires participatory processes.
In response to these requirements, the Austrian three-year research project “Integrated Sustainable Wildlife Management in the Biosphere Reserve Wienerwald - ISWI-MAB” is based on a participa-tory and collaborative research approach (Cornwall & Jewkes 1995). The project area “Wienerwald” is a forest-dominated, multiple-use landscape charac-terized by overlapping of various land use inter-ests, including intense recreational uses and hunt-ing activities. This causes a variety of conflict situations that threaten sustainable development. Overarching objectives of our research project are the analysis of antagonistic and (potentially) syner-gistic interactions between wildlife, wildlife man-agement and other relevant forms of land use (e. g. recreation, forestry, agriculture, transport system, land development, nature conservation) on a re-gional scale. Cross-sector, integrated approaches to land use management shall be developed, includ-ing tools for assessment and monitoring of sustain-able use. Since humans are the key-factor in under-standing and controlling the relationship between wildlife resources and society (Kellert & Brown 1985), these research objectives required involve-ment of stakeholders from the very beginning.

Participation Processes in Recreational and Protected Areas
262
Methods
Conflicts are defined by Conrad (1990) as “com-municative interactions among people who are interdependent and who perceive that their inter-ests are incompatible, inconsistent or in tension.” Participatory approaches provide an appropriate framework for identification and reduction of land use-related conflict potentials (Daniels & Walker 1997).
The project-related stakeholder process involves major stages of participation: (i) information, (ii) consultation, (iii) collaborative decision-mak-ing, and (iv) participation in implementation of actions (Umweltbundesamt 2006). Building on existent Biosphere Reserve-related consultancy fora and based on a social network analysis, rel-evant stakeholders were identified and a multi-sector and interdisciplinary stakeholder platform composed of representatives of different forms of land uses (hunting, recreation and tourism, for-estry, etc.), landholders, local politicians, mem-bers of authorities, and NGOs was established (figure 2).
Different socio-empirical techniques were ap-plied to gather information on regional wildlife-related conflicts and stakeholder opinions: in-depth expert interviews, questionnaires for key visitor and land user groups (mail survey, on site visitor interviews), and interactive discussions
within the participation panel. Data evaluation will be done by multivariate analysis. In parallel, a consultative technical work group representing a sub-set of the broader participation panel col-laborated in development of an assessment set for sustainable hunting (practical field testing, interviews, review of draft products, workshops). Intermediate and final results are reviewed and discussed at regular meetings of the participation panel, which also provides guidance on further work steps. It is envisaged that the stakeholder process shall develop a self-sustaining dynamic and serve as a long-term panel for conflict man-agement in the project follow-up phase.
Results
The presentation will focus on methodological issues of participation processes in a sustainable use research project within a Biosphere Reserve setting. Drawing references also to experiences from previous projects, the theoretical consid-erations underlying the participatory project de-sign will be outlined (Umweltbundesamt 2006). The structure, organisation and functioning of the participation process will be characterised, and the collaborative and consultative research methods will be described. Based on the lessons learnt, the benefits as well as the problems and limitations of participation processes will be discussed. Quality
Figure 1: Simplified model of land use interactions and conflicts related to wildlife management.

Participation Processes in Recreational and Protected Areas
263
criteria for effective participation shall be identi-fied, and selected key results of the expert and land user surveys will be presented.
References
Cornwall, A. & Jewkes, R. (1995). What is participatory re-search? Elsevier.
Daniels, S.E. & Walker, G.B. (1997). Collaborative learn-ing and land management conflict. In: Solberg, B. & Miina, S. (eds.), Conflict management and public par-ticipation in land management. Proceedings of the In-ternational Conference in Joensuu, Finland, 17 – 19 June 1996. EFI Proceedings No. 14, 1997. p 37-60.
Umweltbundesamt (ed.)(2004). Vielfalt statt Zwiespalt. Begleitfaden zum Mitgestalten von Lebensräumen – ein Beitrag zur Umsetzung der Biodiversitätskonven-tion. Berlin.
Figure 2: Organisation of the participation panel.

Siegrist, D., Clivaz, C., Hunziker, M. & Iten, S. (eds.) (2006). Exploring the Nature of Management. Proceedings of the Third International Conference on Monitoring and Management of Visitor Flows in Recreational and Protected Areas.
University of Applied Sciences Rapperswil, Switzerland, 13-17 September 2006. Rapperswil.
264
Tourism Development and Local Actors’ Engagement for Sustaining Alpine Forests
Andrea S. Finger-Stich & Alicia C. Tanner
University of Applied Sciences Western Switzerland, Switzerland
andré[email protected]@hesge.ch
Keywords: Participatory natural resources management, community forestry, sustainable tourism and rural develop-ment.
Introduction
Tourism development in alpine areas fosters a ter-tiarization of local economies, with a trend to di-minished dynamism in the primary sector in gen-eral, and in forestry in particular. Besides the many causes eroding the primary sector, the fall in alpine timber production is also due to compressed prices in the context of a globalized timber market and to increasing costs of forest labor making mountain extraction even less competitive. These conditions prevailing now for over three decades, a substan-tial part of the alpine seasonal forestry work has shifted to the tourism sector and much of the alpine forests are no longer managed, are aging, remain untended and are no longer a resource for sustain-ing local livelihoods.
The goal of this paper is to compare alpine com-munes with varying forms and intensities of recre-ational and tourism development in order to iden-tify how recreational values shape local actors’ perceptions of alpine forests (inferring expressed forest related conflicts and values) and local ac-tors’ strategies of action, when participating in the management of these forests.
Based on research about local actors’ partici-pation in forestry in Alpine communes (Finger-Stich 2005), it seems that tourism development can induce local actors’ disinterest in taking part in communal forestry. Based on a sample of six case studies of six alpine communes in the French (Haute-Savoie) and Swiss (cantons of Vaud and Va-lais) Alps, the results show that local actors’ partic-ipation in communal forestry tends to decline with
the development of their commune’s tourism sec-tor. More precisely, this withdrawal in local actors’ engagement is manifested in:
Decreased municipal investment in the local forest
Forest management delegated to the forest ser-vice
Forest workers from private and community enterprises marginalized (economically and in their representation in local governance struc-tures)
Use conflicts between the agriculture and for-estry sectors relatively high and unsolved.
The baseline study shows that resource as well as patrimonial, recreation and conservation values re-lated with the local forest tend to be more often expressed by rural communities developing low impact recreation services, than by local actors re-siding in communes that have developed high im-pact tourism and recreational activities (skiing in particular).
Beyond the analysis of forest perceptions, the base-line study (Finger-Stich 2005) identifies the actors and places (communes) where collective social in-teractions promote more quality of life values (in-cluding patrimonial, recreational and conservation related forest values) and which aim more at en-hancing livelihood or production functions of for-ests (i.e. the production of timber and fuelwood, the sustaining of forest related jobs and revenues). It distinguishes social interaction processes ac-cording to their capacity to more or less reproduce

Participation Processes in Recreational and Protected Areas
265
resource management structures or change them. By differentiating results according to the types of actors interviewed, the analysis indicates that lo-cal actors working in tourism and involved in lo-cal governance, often try to integrate both liveli-hood and quality of life interests and are therefore key players fostering more multi-functional forest-ry. Multi-functional forestry being constitutive of definitions of “sustainable forestry”, in mountain regions in particular (OEFM 2000), an enhanced participation of the tourism sector in alpine forest-ry could be considered as conducive to sustainable alpine forestry.
Methods
The present contribution focuses the analysis of the baseline study on the question of how tourism and recreational interests shape local actors’ per-ceptions and involvement in collective actions re-lated with communal forest management. It also inquires into an additional sample of alpine com-munes taking part in the elaboration of a Forest Charter in Haute-Savoie. The base-line research is based on social action theories and methodol-ogies (Crozier & Friedberg 1977, Giddens 1987), on qualitative interview methods (open-ended and semi-structured) and on a grounded theory ap-proach for analysing the data (Glaser 1992). Local actors’ perceptions of forest values and conflicts were induced through a systematic and compar-ative text analysis, and so were the 21 collective actions identified in the initial sample of 6 com-munes. The dataset includes over 100 interviews conducted with local actors of various occupation, gender and age encountered in the communes, where the primary, secondary and tertiary sectors have more or less impact on local land uses and where geographic, demographic and accessibility conditions vary (Bätzing 1993).
Results
The addition proposed by the present paper is to further discuss these results by focusing on recre-ational related conflicts and values and then chal-lenges them by looking at an enlarged sample of communes. Indeed, preliminary research in a new sample of alpine communes indicates that some
communes that have invested in quite massive forms of winter and summer tourism development can also develop a dynamic communal forestry ca-pacity by, for example:
Valuing local forests as a resource for bio-en-ergy (investment in communal fuelwood-run heating facility, etc.)
Investing in local forest management planning, for instance, by developing a territorial Forest Charter
Transmitting and upgrading local forestry know-how, forestry training for forest owners, organi-zation of Forest Fairs, etc.
Collection of taxes on overnights and recre-ational activities reinvested in local forestry.
Conclusion
In a context of increasing forest related recreation-al values and decreasing financial and institutional capacities of forestry administrations (observed in Swiss and French alpine regions in particular), the paper helps forest and recreation managers consid-er local communities’ recreational interests in rela-tion with local forestry and to engage them accord-ingly in the management of their forests.
References
Bätzing, W. (1993). Der Sozio-ökonomische Strukturwan-del des Alpenraums im 20. Jahrhundert. Bern.
Crozier, M. & Friedberg, E. (1977). L‘Acteur et le Système. Paris.
Finger-Stich, A. (2005). Social Agency in Alpine Commu-nal Forests: Local Actors’ Interactions with Commu-nal Forests in the French and Swiss Alps. Doctoral thesis, University of Albert-Ludwigs. http://www.fre-idok.uni-freiburg.de.
Giddens, A. (1987). Social Theory and Modern Sociology. Cambridge.
Glaser, B.G. (1992). Basics of Grounded Theory Analysis. Mill Valley.
OEFM, European Observatory of Mountain Forests. (2000). White Book 2000 on Mountain Forests in Europe. Chambéry.

Siegrist, D., Clivaz, C., Hunziker, M. & Iten, S. (eds.) (2006). Exploring the Nature of Management. Proceedings of the Third International Conference on Monitoring and Management of Visitor Flows in Recreational and Protected Areas.
University of Applied Sciences Rapperswil, Switzerland, 13-17 September 2006. Rapperswil.
266
Recreation Interests and Participation in River Restoration Projects
Berit Junker & Matthias Buchecker
Swiss Federal Institute for Forest, Snow and Landscape Research, Switzerland
[email protected]@wsl.ch
Keywords: Public participation, river restoration, land-use conflict, public acceptance, social sustainability, water resources management, case studies.
Introduction
Rivers and river spaces have become landscape el-ements with an ever widening spectrum of func-tions. They do not only fulfil drainage and eco-logical functions, but are also of high meaning for people as economical, social and recreational re-sources, i.e. as general living spaces.
Since 1991 the Swiss Federal Law on Hydraulic Engineering explicitly calls for combining all flood security measures with ecological revalorisations, i.e. restorations of the river spaces. Of such resto-ration projects large and numerous ones are cur-rently carried out or are planned for the near future throughout Switzerland and Europe. But as expe-rience has proven, they are often highly conflictu-al. The loss of economically used land accompa-nied by such restorations, the threatened status quo in the aesthetic and ecological quality of the locals’ recreational and overall living space and the prev-alent top-down planning in this field often arouse resistance. Therefore, suitable participation and communication strategies are key elements for the successful realization of restoration projects.
Methods
This study presents the main results of two case studies on river restoration projects at the Swiss rivers Thur and Flaz. Both of these studies imple-mented a method triangulation including:a) qualitative interviews with the local population/recreational users, representatives of organised stakeholders groups as well as decision makers;b) standardised questionnaire surveys among the
local public and stakeholder groups and c) direct observation of the consensus-finding pro-cesses.
These two case studies served also as base for the subsequent design of a representative Swisswide survey by means of a standardised questionnaire. The survey included visualisations of differing states of river spaces varying in the depicted nat-uralness and usability for recreation/accessibility. The survey included also questions on the use of river spaces, on their meaning for the public, and on general attitudes of the Swiss population/recre-ational users towards river restorations.
Results
The two case studies (Thur, Canton Thurgau, be-tween Weinfelden and Bürglen; Rivers Flaz/Inn, Canton Grisons, project Samedan) showed that the public/recreational users primarily perceive at-tributes of rivers that characterise them as part of the local living space (recreation, nature experi-ence, part of home). They perceive only marginal-ly functional aspects of river uses (economic use, danger, channel).
A comparison between surveys of the general pub-lic/recreational users and representatives of stake-holder groups directly involved in the decision-making process at the River Thur project showed differing profiles of claims. In general, recreation-al users of both case studies regions had a more positive attitude towards restoration projects than the stakeholder groups directly involved in the decision-making process. Correspondingly, the stronger involvement of the public/recreational us-

Participation Processes in Recreational and Protected Areas
267
ers in the restoration project Flaz/Inn had the effect that essentially less resistance was raised against the project than against the restoration of the Riv-er Thur (Junker & Buchecker 2006). The public at the River Thur expressed in the survey the de-sire to become involved in the planning and deci-sion making process. The majority would be ready to become active mainly by shipping in ideas and choosing from proposed project alternatives.
The Swiss-wide survey confirmed that the atti-tudes of the public as indicated in the case stud-ies highly correspond with those of the Swiss pub-lic. An assessment of scenarios depicting different degrees of restoration showed that the Swiss pub-lic prefers the most restored scenario in regard to the river space (vegetation) as well as in regard to the river morphology (more space for the riv-er, meandering, with gravel banks and creeks, etc.). Correspondingly, the public clearly supports river restorations in combination with flood protection measures. The desire of the Swiss public to partici-pate in the restoration process is even greater than in the case study regions. Unexpectedly was also the result that the public perceives it as important to have a say in river restorations as in local land use planning (Junker & Buchecker, subm.).
A stronger consideration of the broader public and recreational users in the planning of river restora-tion projects would be favourable on the basis of these results.
References
Beierle, T.C. & Konisky, D.M. (2000). Values, conflict, and trust in participatory environmental planning. In: Journal of Policy Analysis and Management (19/4), p 587-602.
Daniel, T. C. (2001). Whither scenic beauty? Visual land-scape quality assessment in the 21st century. In: Landscape and Urban Planning (54), p 267-281.
Gobster, P.H. & Hull, R. B. (ed.) (2000). Restoring Na-ture. Perspectives from the Social Sciences and Hu-manities. Washington D.C.
Grimble R. & Wellard, K. (1997). Stakeholder method-ologies in natural resources management: a review of principles, contexts, experiences and opportuni-ties. In: Agricultural Systems (55/2), p 173-193.
House, M. & Fordham, M. (1997). Public Perceptions of River Corridors and Attitudes towards River Works. In: Landscape Research (22/1), p 25-42.
Jackson, L.S. (2002). Consensus processes in land use planning in British Columbia: the nature of suc-cess. In: Progress in Planning (57), 1-90.
Linder, W. & Vatter, A. (1996). Kriterien zur Evalu-ation von Partizipationsverfahren. In: Selle, K. (ed.), Planung und Kommunikation, p 181-188. Wiesbaden.
Luz, F. (1994). Zur Akzeptanz landschaftsplanerischer Projekte. Frankfurt.
Morrison, K. (2003). Stakeholder participation in deci-sion making – institutional forms. In: Water Sci-ence and Technology (47), p 167-169.
Schenk, A. (2000). Relevante Faktoren der Akzep-tanz von Natur- und Landschaftsschutzmassnah-men. Ergebnisse qualitativer Fallstudien. In: Ost-schweizerische Geographische Gesellschaft (5). St. Gallen.
Tunstall, S.A. & Tapsell S.M. (1999). How Stable are Public Reponses to Changing Local Environ-ments? A `Before` and `After` Case Study of Riv-er Restoration. In: Journal of Environmental Plan-ning and Management (42/4), p 527-547.
Webler, T., Tuler S. & Krueger R. (2001). What is a good public participation process? Five Perspec-tives from the public. In: Environmental Manage-ment (27/3), p 435-450.

Siegrist, D., Clivaz, C., Hunziker, M. & Iten, S. (eds.) (2006). Exploring the Nature of Management. Proceedings of the Third International Conference on Monitoring and Management of Visitor Flows in Recreational and Protected Areas.
University of Applied Sciences Rapperswil, Switzerland, 13-17 September 2006. Rapperswil.
268
How Social ‘Demand’ Overlaps in Forest Management A Sociological Analysis of the Relation between Forest and
Society in France (1960-2005)
Nathalie Lewis
Cemagref-Bordeaux, France
Keywords: Forests, France, society, perception, attitudes, social dynamics, surveys.
IntroductionThe 2001 French forest policy pointed out sus-tainable and multifunctional forest management: two catchwords in which appeal to society. The same law recognized the social value of forests for recreation and nature tourism: “to satisfy so-cial requests related to the forest”. However, what do we mean by ‘social demand’ related to the for-est? Which place is really made for society, visi-tors and recreation in France? The role of the in-dividuals, the importance of the forest for them, needs to be questioned. It is essential to approach the ‘social’ component in a comprehensive way.
This knowledge exists in France, but is often spread out and uncoordinated. The data are sparse and/or targeting very specific objectives. This pa-per wishes to present research started in 2003 at the request of the National Forestry Office (ONF).
We will focus here on the results of the first phase (a theoretical and analytical one), and also dem-onstrate how that analytical survey served there-after to structure the national survey of 2004 and localise qualitative investigations. In analysing those various data, we wish to guide forest man-agers in their quest to understand and answer fine visitor perceptions, needs and expectations. Indi-rectly, in methodological terms, we want to map out relevant methodologies and remarks in order to strengthen our understanding of the forest-so-ciety relationship.
Methods
For this study, we constituted an initial database of 215 documents that were analyzed accord-ing to a contents analysis scale. The ‘state of the art’ of the main surveys held between 1960 and
Main French Survey related to the relation between forest and society since 19601969 SARES Regional (Ile-de-France) 1973 Ballion / INSEEs France1971-73 R. Ballion Regional (Ile-de-France)1973-79 INRA d’Orléans Regional (Ile-de-France) 1991 BVA for ONF France1992 BVA for DERF Urban Woods 1996 IFEN / CREDOC France1997-1998 Inra, Nancy Regional (Lorraine) 1998-1999 CREDOC Regional (Ile-de-France) 2000 SOFRES for La Collective du Bois et de la Forêt France2000 IFEN France2000 Forêt Méditerranéenne Regional (PACA, Languedoc-Roussillon et
Corse)2001-2002 IFEN France2002 Laboratoire d’Économie forestière de Nancy France2004 ONF France
Table 1: Main French Survey related to the relation between forest and society since 1960.

Participation Processes in Recreational and Protected Areas
269
2003 shows two major moments: 1969-1980 peri-od when the forest was apprehended as a consumer good, and the 1990s when, influenced by the rais-ing of environmental concerns, the relationship to the forest became more individualized.
The forest, paradigm of nature, has become a sym-bol of frailty. The images of deforestation of Am-azonian forests and forest fires become entangled with the local woods. The public opinion changed vis-à-vis the forest resource. Nevertheless, recent studies (ONF 2004) show that today practices re-main sensibly the same ones as those observed in the 1960s.
Since 1960, the forest is a place ‘out of the city’ and is appraised as such by the urban population, which composed 62 % of the population in 1960 (76% in 2003). The compilation of data lets us understand what could appear paradoxical; one would hunt for the ‘natural’ aspect while at the same time seeking a certain infrastructure.
Results
It is difficult to grasp roughly, what is hidden under the concept of ‘social demand’. In analyzing chron-ologically the various results from the 1960-2004 investigations we observed – regardless of a new sensitivity to the environmental concerns – stabili-ty in forest activities and still a strong symbolic at-tachment to the forest.
Selected results drawn from the latest survey relat-ed to forest and society (ONF 2004):
One of the natural spaces most attended during free time and the holidays.
The frequentation still correlated with the so-cio-professional status and education level.
Walking remains the principal activity in for-est, but followed closely by gathering.
Users are not willing to contribute financially for the costs of management... but seem ready to take part in voluntary actions.
Men’s and women’s forest attendance is con-siderably different (motivation, location with-in the forest space, activity…)
Before considering the development of indica-tors and variables suitable for the measurement of behaviour evolution related to the forest, it ap-peared vital to understand the main social ten-dencies that had crossed that field. In France, in social sciences, this theme had been given a rath-er short-term and sparse scientific production.
In analysing what has been done since 40 years, in highlighting stable and changing behaviour, we will be able to formulate more accurate pro-spective lines for future forest management. Un-derstanding ‘social demand’ is a work in prog-ress mainly because ‘society’ is also in perpetual movement.
This type of results appears necessary in this pe-riod of 1) participative management, 2) forest demand for leisure, 3) critical reasoning by the population regarding forest exploitation. Today forest management is in transformation; forest actors must adapt themselves to new standards that are directly related to forest production, to environmental standards and to societal trans-formations. Today’s new era brings in a multi-functional forest, a space in perpetual transfor-mation.
Selected results drawn from the latest survey related to forest and society (ONF, 2004):
One of the natural spaces most attended during free time and the holidays.
The frequentation still correlated with the socio-professional status + education level.
Walking remains the principal activity in forest, but followed closely by gathering.
Users are not willing to contribute financially for the costs of management... but seem ready to take part in voluntary actions.
Men’s and women’s forest attendance is considerably different (motivation, location within the forest space, activity…)
Table 2: Selected results drawn from the latest survey related to forest and society (ONF, 2004).

Participation Processes in Recreational and Protected Areas
270
References
Deuffic, P., Granet, A.-M. & Lewis, N. (2004). 1960 – 2003: évolution de la demande sociale face à la forêt. In: Rendez-Vous Techniques (5/été), p 10-14.
Dobré M., Lewis, N., Deuffic, P. & Granet, A.-M. (2005). La fréquentation des forêts en France. In: Rendez-Vous techniques (9/été), p 49-57.
Kalaora, B. (1993). Le musée vert: radiographie du loisir en forêt. Paris.
Lewis, N. (2004). De 1960 à 2003 des enquêtes pour cer-ner le lien forêt et société. Working paper, Cemagref. Bordeaux.

Siegrist, D., Clivaz, C., Hunziker, M. & Iten, S. (eds.) (2006). Exploring the Nature of Management. Proceedings of the Third International Conference on Monitoring and Management of Visitor Flows in Recreational and Protected Areas.
University of Applied Sciences Rapperswil, Switzerland, 13-17 September 2006. Rapperswil.
271
Local Participation in the Development of Tourist Centresin the Peripheral Regions of Finnish Lapland
Seija Tuulentie & Ilona Mettiäinen
Finnish Forest Research Institute, Finland
[email protected]@metla.fi
Keywords: Local participation, planning, sustainable tourism, periphery, regional development.
Introduction
Tourism is regarded extremely important and often the only growing industry in peripheral regions. The municipalities that are engaged in tourism de-velopment and that have tourist centres in their ar-eas have been winners in regional development in many ways (Hall & Boyd 2005). Thus, it is natu-ral that the local and regional authorities are ea-ger to enhance tourism development. For the local population, however, the growth of tourism is not only a positive circumstance. People in such areas as Finnish Lapland are bound to move from tradi-tional natural resource based occupations at least in some extent to the field of tourism. Double oc-cupation is often required: for example in Finn-ish Lapland such career combinations as reindeer herding and car testing are possible. Tourism also drastically changes the physical environment as well as the ways of using it. For example local in-habitants’ traditional ways of using nature (berry picking, hunting, fishing) and areas available for them may be reduced or harmed due to growing demand of land use for tourism.
The ideal of socially sustainable tourism focuses on ensuring that the benefits of tourism are spread as widely as possible throughout the host commu-nity. Also, the local communities should be heard and taken into account when altering the places into tourist resorts (e.g. Swarbrooke 2002). How-ever, the real growth of tourism centres has not fol-lowed the ideal. In Finnish Lapland, for example, the tourist centres have often been allowed to grow on the terms of the market demand and the plan-ning has come far behind. In some cases, growth
expectations in tourism have been a dominating factor also in planning, and other needs and inter-ests of the locals may have been forgotten. As a re-sult, local economies may be too dependent on only one field of business, tourism. However, the other strong field of business is forestry, which mainly has controversial land-use interests with tourism. This can also sometimes cause problems.
Methods
This presentation evaluates the planning pro-cesses from the viewpoint of local participa-tion in two ski tourism centres in Finnish Lap-land. The research has been done in the project “Tourist Destinations as Landscape Laboratories – Tools for Sustainable Tourism” (2004-2007) which is financed by EU Life Environment pro-gramme and coordinated by the Arctic Centre of the University of Lapland. The geographical ob-jects of the project, tourist centres of Levi and Ylläs, are situated in areas with remarkable ame-nity values, and Ylläs is located beside the most visited national park in Finland. Both of the cen-tres can accommodate around 20 000 tourists and both have a variety of tourist services from dog sledges and snow mobile safaris to ski slopes and cross-country-skiing facilities. The centres also have extensive plans for further growth in terms of customers, seasons, and areas required. A gen-eral problem is balancing the aims to promote economical and regional development through excessive tourism investments and the fragility of both the northern European nature and local communities (Hakkarainen 2005).

Participation Processes in Recreational and Protected Areas
272
In this research the data has been collected by fo-cus group interviews both among the local popu-lation and among authorities and such in-between groups as second home owners and recurrent sea-sonal workers. The total amount of the interview-ees is about 70. The discussions have dealt espe-cially with the possibilities of the local inhabitants and other actors to affect the development of the tourist resort in its different stages.
Results and Discussion
There has been a major change in possibilities to participate in and affect the local development and land-use, as participative planning was imple-mented to Finnish legislation in 2000 partly due to the European Union. The new legislation de-mands that the “people involved” should be heard in every land-use situation that affects their envi-ronment (Leino 2006). This legislation has given more hope that the local opinions will be truly tak-en into account. Before, in the past decades, lo-cal inhabitants’ points of view were often neglect-ed and left unheard in planning, as legislation did not require wide hearing of local inhabitants, but only of land owners. In both Levi and Ylläs tour-ist resorts, the first large planning process since the new legislation are going on as general plans are being made for both tourist centres. Local inhabit-ants have great expectations towards the projects. Among the biggest problems until now have been that local actors are still somewhat unfamiliar with the new kind of planning processes, which can lead to participating too late regarding the plan-ning process, for example. The results also show that in addition to participating in official planning processes, local inhabitants have several ways of affecting their environment, such as pleas and ini-tiatives, municipal democracy and cooperation in local associations.
References
Hakkarainen, M. (2005). Mapping of structural and demo-graphic features of Levi and Ylläs. (In Finnish with English abstract.). Rovaniemi. http://www.arcticcen-tre.org/?deptid=21742.
Hall, C. M. & Boyd, S. (2005). Nature-based Tourism in Pe-ripheral Areas. Development or Disaster? Clevedon.
Leino, H. (2006) Citizen participation and the dynamics of urban planning. (In Finnish with English summa-ry.). University of Tampere. http://acta.uta.fi/pdf/951-44-6566-0.pdf.
Swarbrooke, J. (2002). Sustainable Tourism Management. Oxon.

Siegrist, D., Clivaz, C., Hunziker, M. & Iten, S. (eds.) (2006). Exploring the Nature of Management. Proceedings of the Third International Conference on Monitoring and Management of Visitor Flows in Recreational and Protected Areas.
University of Applied Sciences Rapperswil, Switzerland, 13-17 September 2006. Rapperswil.
273
The Tourists’ View on Protected Areas
Veronika Wirth, Petra Sterl & Ulrike Pröbstl
University of Natural Resources and Applied Life Sciences, Austria
[email protected]@boku.ac.at
Keywords: Protected areas, tourism, Natura 2000, Alps, destination choice, marketing.
IntroductionDue to the high biodiversity of the alpine space there is a high density of protected areas. Over the past few years, large areas of the Alps have been included in the Natura 2000 network. At the same time, the Alps are one of the most important leisure and tourism regions in Europe and tourism is one of the most important economic factors in the re-gion. An instrument to manage the requirements of sensitive species and habitats and tourism use is the Natura 2000 management plan. The Interreg IIIB- Project AlpNaTour investigates how the concerns of recreation and tourism can be integrated in this process. This article focuses on the relevance of Natura 2000 for tourism marketing and branding.
Methods
The study areas AlpNaTour investigates are al-pine Natura 2000 sites1 in Germany, Austria, Italy and Slovenia. This article focuses on Germany and Austria. The German test site “Falkenstein” is lo-cated in Allgäu, Bavaria. It is a rather small, sensi-tive area (987 ha) in one of the most famous alpine destinations in Germany. In peak days during sum-mer there are more than 3,300 visitors in parts of the Natura 2000 site.
The Natura 2000 site “Nordöstliche Randalpen” in Lower Austria is a large area (64,066 ha) includ-ing the plateau of “Schneeberg”, the easternmost peak of the Alps with 2,000 m of altitude. Sensi-tive habitats likely to be disturbed are alpine grass-
1 In this article all protected areas according to the Habitats Directive (Direc-tive 92/43/EEC) and the Birds Directive (Directive 79/409/EEC) are subsumed as Natura-2000-sites.
lands. The area is a typical day trip destination from Vienna mainly in autumn and summer. Stan-dardised personal interviews have been conducted during summer and autumn of 2005, on six days in the “Falkenstein” on seven days in the “Sch-neeberg” areas. These days included both week-days and weekends. There were 297 respondents on “Falkenstein” and 134 respondents on “Schnee-berg”. The refusal rate was low.
ResultsAsked for the main reason to visit the respective area the visitors gave “Nature and Landscape” clearly as the most important reason. Asked how important the existence of protected areas is for their destination choice, 48% of the interviewed visitors in the German test site stated that it is very important and 31% that it is rather important. In the Austrian test site for 34% of the interviewed visi-tors the existence of protected areas is very impor-tant and for 32% it is rather important for their des-tination choice.
The visitors were also asked about their recognition of different categories of protected areas. The best known categories turned out to be “Nature Reserve” (“Naturschutzgebiet”), which was recognized by 92% of the Falkenstein respondents and 89% of the Schneeberg respondents, and ”National Park“, which was recognized by 88% of the Falkenstein respondents and 90% of the Schneeberg respon-dents. The visitors were also fairly familiar with the categories “Protected Landscape” (“Landschaftss-chutzgebiet”) and “Natural Monument” (“Natur-denkmal”). The category “Natura-2000-Site”, how-ever, is unknown to the majority of the visitors. For
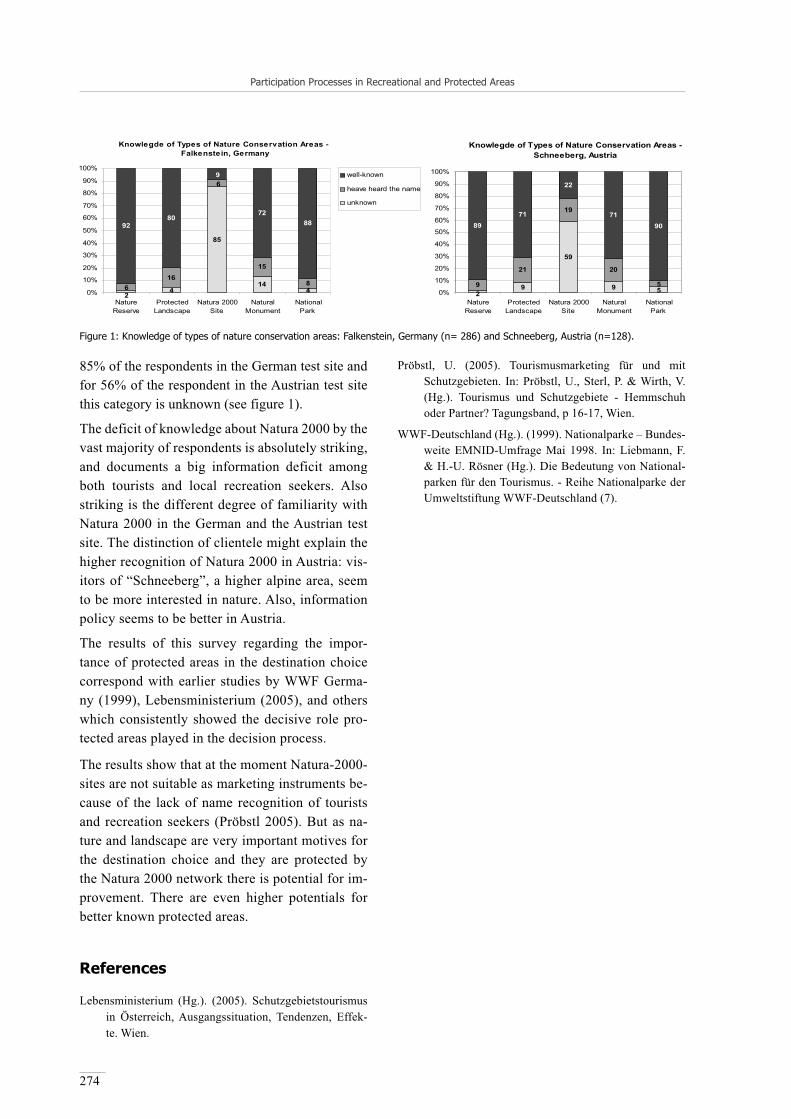
Participation Processes in Recreational and Protected Areas
274
85% of the respondents in the German test site and for 56% of the respondent in the Austrian test site this category is unknown (see figure 1).
The deficit of knowledge about Natura 2000 by the vast majority of respondents is absolutely striking, and documents a big information deficit among both tourists and local recreation seekers. Also striking is the different degree of familiarity with Natura 2000 in the German and the Austrian test site. The distinction of clientele might explain the higher recognition of Natura 2000 in Austria: vis-itors of “Schneeberg”, a higher alpine area, seem to be more interested in nature. Also, information policy seems to be better in Austria.
The results of this survey regarding the impor-tance of protected areas in the destination choice correspond with earlier studies by WWF Germa-ny (1999), Lebensministerium (2005), and others which consistently showed the decisive role pro-tected areas played in the decision process.
The results show that at the moment Natura-2000-sites are not suitable as marketing instruments be-cause of the lack of name recognition of tourists and recreation seekers (Pröbstl 2005). But as na-ture and landscape are very important motives for the destination choice and they are protected by the Natura 2000 network there is potential for im-provement. There are even higher potentials for better known protected areas.
References
Lebensministerium (Hg.). (2005). Schutzgebietstourismus in Österreich, Ausgangssituation, Tendenzen, Effek-te. Wien.
Pröbstl, U. (2005). Tourismusmarketing für und mit Schutzgebieten. In: Pröbstl, U., Sterl, P. & Wirth, V. (Hg.). Tourismus und Schutzgebiete - Hemmschuh oder Partner? Tagungsband, p 16-17, Wien.
WWF-Deutschland (Hg.). (1999). Nationalparke – Bundes-weite EMNID-Umfrage Mai 1998. In: Liebmann, F. & H.-U. Rösner (Hg.). Die Bedeutung von National-parken für den Tourismus. - Reihe Nationalparke der Umweltstiftung WWF-Deutschland (7).
Knowlegde of Types of Nature Conservation Areas - Falkenstein, Germany
85
144
1615
8
9280
7288
24
6
6
9
0%
10%
20%
30%
40%
50%
60%
70%
80%
90%
100%
NatureReserve
ProtectedLandscape
Natura 2000Site
NaturalMonument
NationalPark
well-known
heave heard the name
unknown
Knowlegde of Types of Nature Conservation Areas - Schneeberg, Austria
9
59
99
21 20
8971
22
7190
52
19
50%
10%
20%
30%
40%
50%
60%
70%
80%
90%
100%
NatureReserve
ProtectedLandscape
Natura 2000Site
NaturalMonument
NationalPark
Figure 1: Knowledge of types of nature conservation areas: Falkenstein, Germany (n= 286) and Schneeberg, Austria (n=128).

275

276
Landscape and its Images
Marcel Hunziker (Chair)

Siegrist, D., Clivaz, C., Hunziker, M. & Iten, S. (eds.) (2006). Exploring the Nature of Management. Proceedings of the Third International Conference on Monitoring and Management of Visitor Flows in Recreational and Protected Areas.
University of Applied Sciences Rapperswil, Switzerland, 13-17 September 2006. Rapperswil.
277
What Does Sustainable Development Look Like?Visions of Two Swiss Unesco Regions
Norman Backhaus & Urs Müller
University of Zurich, Switzerland
[email protected]@geo.unizh.ch
Keywords: Sustainable development, image analysis, conservation, participation, representation of space.
Introduction
The establishment of a nature reserve usual-ly means a change of access to the area and its resources. Therefore, anticipated constraints for the use of resources can lead to opposition against nature conservation projects. Hence, bot-tom up initiated and broadly accepted conserva-tion areas are rare, because different actors have different mental images about what their region should look like. Such images are expressed in written texts and visual publications (i.e. infor-mation brochures, newspaper articles). Visual images that have an influence on “images in the head” play an important role for the structuration of landscape and the potential of appropriation of space. This includes the landscape‘s potential for tourism and formation as living space.
People‘s actions are grounded in the meanings they attribute to things. These meanings are con-structions and elements of social structures that are widely shared. The knowledge that these structures represent leaves its mark on all in-dividual actions. This incorporated knowledge then shapes the way people comport themselves and how they interact with their environment. If a tourist finds out from a guide-book what the recognised sights in a region are, he or she can or will look out for these sights in a way that a tourist lacking the same knowledge would not think of doing (cf. Culler, 1988: 166). Knowl-edge feeds on experiences, especially on recur-rent or intense ones. However, these experiences
are not simply stored away mentally but are ac-tively absorbed on the basis of pre-existing men-tal images.
Objective
In our research we analysed how images influ-ence sustainable regional development, using two case studies in Switzerland: The Entlebu-ch (UBE) and the Jungfrau-Aletsch-Bietschhorn (JAB) regions that became, of their own initiative, so-called model regions for sustainable develop-ment. We learn much about how “image produc-ers” imagine their regions’ sustainable develop-ment through the way they presented their region during the application process (viz. a UNESCO biosphere reserve or a UNESCO world heritage site). We subsequently asked “How did the proj-ect leaders present the concept of sustainability to the public?”, and “What potential appropria-tions of space are suggested by the images?”
Choosing a human geographical perspective we are particularly interested in how visual represen-tations suggest certain interactions with space, i.e. how the space in each region can or should be appropriated during the process of becoming a biosphere reserve or a world heritage site and how its resources can be used. The published im-ages convey notions about potential spatial rela-tions that they can have within the predefined re-gions. They show the current land-use activities and those that are possible and desirable.

Landscape and its Images
278
Behind this approach lies the notion that different social groups can imagine different kinds of spa-tial appropriation, and that these can result in di-verging notions about their region’s development and even to conflicts. If differing ideas of the same region develop further, into visions for its future development, conflicts are to be expected. These conflicts can be a consequence of unreflected re-productions of the social images inherent to each group. Therefore, it is an important precondition for sustainable development to take place that un-questioned social images be dealt with on a discur-sive level.
Methods
The coverage of the process of becoming UNES-CO-label regions in local and national newspapers, magazines and information brochures was anal-ysed for the period of several years before the cru-cial polls and some time after it. We concentrat-ed on the images and their surrounding text and made a quantitative content analysis. Despite the actual hype about “visual culture” and the “icon-
ic turn” (cf. Müller 2006a,b), there are only few studies that tackle a large number of pictures such as more than 500 like we did. Hence we had to de-velop a set of categories of potential spatial appro-priations. We started with the rough division be-tween “natural environment“ and “cultural space“ and further sub-divided these categories taking the size of images into account. Thus, we were able to produce condensed overviews of individual publi-cations that could be compared with each other. A few selected images were analysed more thorough-ly with a semiotic-hermeneutic approach (Müller-Doohm 1997). Moreover, the image producers were interviewed about their intentions regarding their selection of images for their publications.
Results
Results show that the representations of the conser-vation areas are different depending on the “view” adopted in the publications and the audience that was addressed (inside-outside, before the poll and after etc.) as well as on the context in which they were produced. The analysed publications (see fig-
Figure 1: Proportions of culture space and natural environment (in%) of UNESCO Biosphere Entlebuch (UBE) and UNESCO World Heri-tage Jungfrau-Aletsch-Bietschhorn (JAB).

Landscape and its Images
279
ure 1 for a selection) differed quite much accord-ing to these views. In the UBE the difference be-tween inside and outside view was striking. While outsiders depicted UBE mainly as a nature space with little human presence (mostly in the form of traditional agriculture), the promoters of the UBE avoided to portray it that way and drew a contrast-ing image of a modern and diverse living space with a growing economy based on high-tech firms and many role models who stand for sustainable development. In the JAB this inside outside dif-ference is not seen, in fact the region was also por-trayed in the same way for the people living in the area as it was for (potential) tourists.
Conclusions
The results have to be regarded in the light of the context of the case study areas. For instance, the avoidance of the UBE promoters of showing much natural environment is a result of a national protec-tion scheme (regarding moors) that was opposed by the local people. Nevertheless, we can con-clude that the image of a multioptional area with an emphasis on living space, that was created by the UBE promoters (and others such as the local paper) with their use of different image types, con-tributed positively to a participatory process that is still ongoing. In the JAB, where this was not done in the same way, this participatory process took not place and had to be initiated later with much diffi-culty. Thus, the choice of images that are published during a process involving sustainable develop-ment can have a furthering or hindering influence on participatory processes.
On first glance this has not much to do with visi-tor flows into and within regions. However, if the mental images of visitors (that are influenced by material images published in newspapers and mag-azines) differ greatly from those of the local people and if that difference is not acknowledged and dis-cussed by the regions managers and to a certain ex-tent by the local people, misinterpretations, misun-derstandings and even conflicts can arise that are detrimental to a sustainable development and tour-ism in a protected area. Therefore, our recommen-dations – in a nutshell – of reflecting on ones rou-tines when selecting images, using a multifaceted
range of images, asking role models to partake, not avoiding opposing images etc. lead to a more transparent (visual) communication that enhances participatory processes that includes the needs and wishes of visitors and at the same time is able to clarify impossible or unappropriate desires and no-tions.
References
Culler, J. (1988). Semiotics of Tourism. In: Culler, J. (ed.): Framing the Sign: Criticism and Its Institutions, Uni-versity of Oklahoma Press, Norman and London, p 153-167.
Müller-Doohm, S. (1997). Bildinterpretation als struktural-hermeneutische Symbolanalyse, Sozialwissenschaftli-che Hermeneutik, p 81-108. Opladen.
Müller, U. (2006). Die Kraft der Bilder in der nachhalti-gen Entwicklung - Die Fallbeispiele UNESCO Bio-sphäre Entlebuch und UNESCO Weltnaturerbe Jung-frau-Aletsch-Bietschhorn. Dissertation zur Erlangung der naturwissenschaftlichen Doktorwürde, Universität Zürich.
Müller, U. (2006). Die Macht der Bilder in der nachhaltigen Entwicklung, in: Backhaus, N., Buschle, M., Gorgus, N., Müller, U. & Moreno, T. (ed.): Kraft der Bilder. Vorstellungen über Nachhaltigkeit – ein Entschei-dungsspiel, Schriftenreihe Humangeographie (21), p 21-49. Zürich.

Siegrist, D., Clivaz, C., Hunziker, M. & Iten, S. (eds.) (2006). Exploring the Nature of Management. Proceedings of the Third International Conference on Monitoring and Management of Visitor Flows in Recreational and Protected Areas.
University of Applied Sciences Rapperswil, Switzerland, 13-17 September 2006. Rapperswil.
280
Experiencing Nature – The Recognition of the Symbolic Landscape within Research and Management of Visitor Flows
Ramona van Marwijk & Jaap Lengkeek
Wageningen University, The Netherlands
[email protected]@wur.nl
Keywords: Social construction, nature experiences, symbolic landscape, environmental values, human-environment interaction.
Introduction
Large visitor numbers in nature areas threat-en the sustainability and create problems to the management of these areas. A comprehensive understanding of visitor use, including visitors’ temporal and spatial distribution is fundamen-tal for effective park management. Recent re-search presents computer-based modelling as an effective tool to manage visitor behaviour in natural environments (Cole et al. 2005, Gim-blett et al. 2001, Lawson et al. 2003). The Dutch MASOOR (Multi Agent Simulation Of Outdoor Recreation) and the American/Australian RB-Sim (Recreational Behaviour SIMulator) are ex-amples of models that are capable of modelling individual recreation needs. They offer multi-agent simulations with autonomous agents that can perform activities defined in behavioural rules. However, the theoretical foundations of recreation experiences and spatial behaviour is weak (Elands & Marwijk 2005) and the simula-tion of human-environment interactions is in its infancy (Gimblett 2005). The behavioural rules (and their validity) are often not explicitly indi-cated in simulation studies. Often, when agents do not behave as in observed reality, behav-ioural rules are adjusted to obtain the expect-ed behaviour (ibid.). Why is it so difficult to design the ‘right’ behavioural rules? Recent re-search has even shown that it is not possible to define groups of visitors based on their spatial behaviour alone (O’Connor et al. 2005, Tacza-nowska et al. 2006). Our assumption is that up
to now, researchers have overlooked the fact that there is a difference between the physical (ob-jectively measurable) environment and the sym-bolic (mental) environment.
In general, simulation models represent the phys-ical environment (a system of trails, roads and/or facilities) and model the behaviour of visi-tors as they interact with the environment and with each other. In this paper we want to clarify that the physical environment is endowed with meaning, and that an understanding of the dif-ferent meanings and values of the environment – the symbolic environment – is crucial for an understanding of visitor spatial behaviour and consequently for defining visitor groups.
Our specific research question is ‘How can the symbolic environment be integrated in research and management of visitor flows?’1 As a basic assumption we state that a visitor’s time-spatial behaviour in nature areas is based on the mean-ings and values she or he ascribes to places.
Multiple realities: environmental val-ues
An environment may have different meanings to different persons. Reality cannot be objective-ly known and described; people ascribe certain experiences to an environment. Cultural codes and individual characteristics such as expertise
1 This paper is part of an ongoing PhD project that aims to theoretically and empirically found the values of landscape characteristics and the relation with visitor patterns of use, in order to improve a management tool (simulation model) for effective ecosystem management (2005-2009).

Landscape and its Images
281
and education have a powerful role in this process (Nassauer 1995, Pennartz 1992). The physical en-vironment can be relevant to its users in a variety of different ways. The types of relevance can be linked to four different values attributable to the surroundings. These values are useful to consid-er when describing the symbolic landscape as they are transactional: they reflect the interplay of hu-man and environmental forces. Based on the val-ues, an environment can acquire a number of total-ly different significances or meanings (Lengkeek et al. 1997).
The four values can be applied when developing visitor typologies and comprehend behaviour. Vis-itor typologies can help managers of leisure des-tinations with effective marketing, to adjust the physical environment and infrastructure to visitor behaviour, and to minimize negative social (e.g. crowding) and environmental impacts of visitor use. The four environmental values serve as tools in describing recreational behaviour characteris-tics. A semantic differential, a technique for mea-suring meaning, can be used for measuring the four values. This implies that visitors help to differen-tiate the meaning of the symbolic landscape by re-sponding to several pairs of bipolar adjectives. The data from the semantic differentials can be ana-lyzed with factor analysis. The factors help clarify-ing how sets of pairs define the multidimensional semantic space of the symbolic landscape. Further-more, relationships can be found between different meanings of the symbolic landscape and time-spa-tial behaviour2.
Visitor management
An implication of the introduction of the symbol-ic environment in recreation research and man-agement is that visitor groups can be labelled ac-cording to their prevailing value. It is interesting to know which values – constituting the symbol-ic landscape – are related to spatial behaviour pat-terns. The symbolic landscape is not an indepen-dent ‘invention’ of the visitor; it is based on the physical landscape that is managed by forest ser-vices and nature organizations. This suggests that managers can influence visitors’ multiple symbol-
2 Time-spatial behaviour of visitors in nature areas can be recorded by GPS.
ic landscapes and consequent behaviours. Howev-er, planning for freedom is a rather paradoxical ex-ercise.
References
Cole, D. N., et al. (2005). Chapter 1: Why Model Recreation Use? In D. N. Cole (Ed.), Computer Simulation Mod-eling of Recreation Use: Current Status, Case Studies, and Future Directions (pp. 1-2). Fort Collins.
Elands, B. & Marwijk, R. v. (2005). Expressing recreation quality through simulation models: useful manage-ment tool or wishful thinking? (Paper presented at the 11th International Symposium on Society and Natural Resource Management, June 16-19, Östersund, Swe-den ed.). Wageningen.
Gimblett, H. R. (2005, December 2005). Modelling Human-Landscape Interactions in Spatially Complex Settings: Where are we and where are we going? Paper pre-sented at the MODSIM 2005 International Congress on Modelling and Simulation, Modelling and Simu-lation Society of Australia and New Zealand, Decem-ber 2005.
Gimblett, H. R., et al. (2001). Geographic Simulation of Wilderness Recreation Behavior. In: Journal of For-estry (99), p 36-42.
Lawson, S. R., et al. (2003). Proactive monitoring and adap-tive management of social carrying capacity in Arches National Park: an application of computer simulation modeling. In: Journal of Environmental Management (68), p 305-313.
Lengkeek, J. et al. (1997). The multiple realities of the ru-ral environment. The significance of tourist images for the countryside. In: H. de Haan & N. Long (Eds.), Im-ages and realities of rural life, Wageningen perspec-tives on rural transformations. Assen: Van Gorcum.
Nassauer, J. I. (1995). Culture and changing landscape structure. In: Landscape Ecology (10/4), p 229-237.
O’Connor, A., et al. (2005). Geo-temporal tracking and analysis of tourist movement. In: Mathematics and Computers in Simulation (69), p 135-150.
Pennartz, P. J. J. (1992). The symbolic infrastructure of an environment art project. Planning and Design (19), 205-220.
Taczanowska, K., et al. (2006). Exploring spatial behaviour of visitors in peri-urban recreational areas: multi-attri-bute analysis of individual route profiles. Paper pre-sented at the CORP 2006: 11th International Confer-ence on Urban Planning & Regional Development in the Information Society. February 13th - 16th 2006, Vienna, Austria.

Siegrist, D., Clivaz, C., Hunziker, M. & Iten, S. (eds.) (2006). Exploring the Nature of Management. Proceedings of the Third International Conference on Monitoring and Management of Visitor Flows in Recreational and Protected Areas.
University of Applied Sciences Rapperswil, Switzerland, 13-17 September 2006. Rapperswil.
282
Historic Landscapes in Urban Regions: Recreation and Use Conflicts in Mikhalkovo, Moscow
Elena Petrova
Moscow State Lomonosov University, [email protected]
Keywords: Historic landscapes, informative tourism, urban regions.
Introduction
Historic landscapes are of great importance for de-velopment of recreation and informative nature tourism, especially within large urban areas, such as Moscow. We regard historic landscapes as natu-ral and cultural landscapes combined with historic monuments. In other words, a historic landscape is nature combined with history. This landscape cat-egory can be added by a scene of a historical event or legend, a country estate or summer-residence of a famous historic person, historic parks, and oth-er places of historic importance. These landscape’s images attract visitors as unique areas and areas with “historic memories”. Visitors can enjoy the beauties both of nature and architectural ensem-bles. Simultaneously they can learn from nature and receive historical information (figure 1). His-toric landscapes often give visitors the only op-portunity for contact with nature in urban regions. That is why recreation and tourism development based on historic landscapes can be a good part of ecological (nature) informative tourism develop-ment. Mikhalkovo is our research region. It is one of the historic landscapes at northwestern environs of Moscow. This cultural landscape was formed by country-seat (Russian: usad’ba), which was typi-cal for Moscow suburbs in the eighteenth – nine-teenth centuries.
Methods
We tried to trace changes in these cultural land-scapes during the last century, to study their po-tential for recreation and informative nature tour-ism goals, and to find out use conflicts at this area. The main methods of our research were collabo-
ration of historical and geographical approaches, including archive research, historic documents in-vestigations as well as area exploration and maps comparison.
Results
The historic landscapes of Mikhalkovo can be a good area for informative tourism development. It preserved many typical features of cultural land-scapes in the urban suburbs. At the same time it has a very large, rich, and unique history. It was firstly mentioned in 1584 in documents as “a waste ground that was a village Mikhalkovo”. The main popularity of this estate is connected with the names of Duchess Dashkova (a companion of the empress Katherine the Second) and – later – of Graf Panin. In the time of Panin (the eighteenth century) this landscape undergoes great changes. Here, the famous Russian architect Bazhenov built one of the most beautiful and original architectural ensembles in the Moscow province in the pseudo-Gothic style. A large beautiful landscape park with picturesque cascade-ponds on the river Golovin-sky was also a part of the country-seat surrounded by a big forest. In the nineteenth century industrial
Figure 1: Historical information for visitors in Mikhalkovo park.
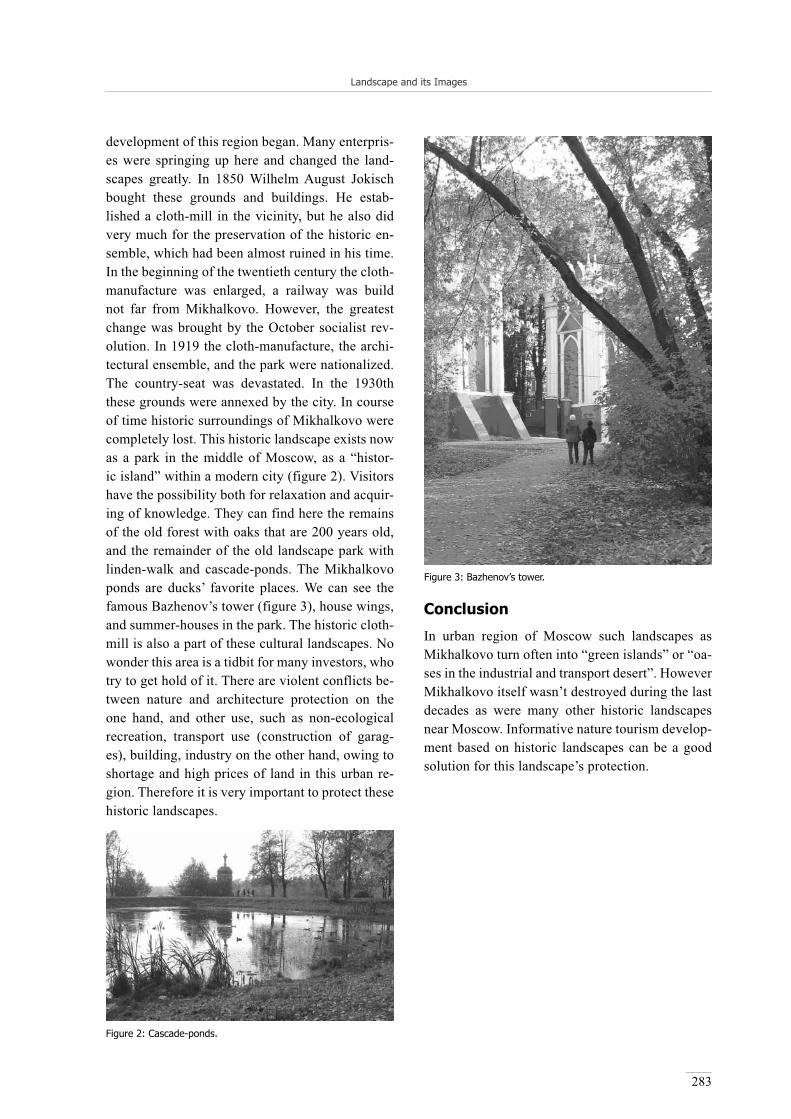
Landscape and its Images
283
development of this region began. Many enterpris-es were springing up here and changed the land-scapes greatly. In 1850 Wilhelm August Jokisch bought these grounds and buildings. He estab-lished a cloth-mill in the vicinity, but he also did very much for the preservation of the historic en-semble, which had been almost ruined in his time. In the beginning of the twentieth century the cloth-manufacture was enlarged, a railway was build not far from Mikhalkovo. However, the greatest change was brought by the October socialist rev-olution. In 1919 the cloth-manufacture, the archi-tectural ensemble, and the park were nationalized. The country-seat was devastated. In the 1930th these grounds were annexed by the city. In course of time historic surroundings of Mikhalkovo were completely lost. This historic landscape exists now as a park in the middle of Moscow, as a “histor-ic island” within a modern city (figure 2). Visitors have the possibility both for relaxation and acquir-ing of knowledge. They can find here the remains of the old forest with oaks that are 200 years old, and the remainder of the old landscape park with linden-walk and cascade-ponds. The Mikhalkovo ponds are ducks’ favorite places. We can see the famous Bazhenov’s tower (figure 3), house wings, and summer-houses in the park. The historic cloth-mill is also a part of these cultural landscapes. No wonder this area is a tidbit for many investors, who try to get hold of it. There are violent conflicts be-tween nature and architecture protection on the one hand, and other use, such as non-ecological recreation, transport use (construction of garag-es), building, industry on the other hand, owing to shortage and high prices of land in this urban re-gion. Therefore it is very important to protect these historic landscapes.
Conclusion
In urban region of Moscow such landscapes as Mikhalkovo turn often into “green islands” or “oa-ses in the industrial and transport desert”. However Mikhalkovo itself wasn’t destroyed during the last decades as were many other historic landscapes near Moscow. Informative nature tourism develop-ment based on historic landscapes can be a good solution for this landscape’s protection.
Figure 2: Cascade-ponds.
Figure 3: Bazhenov’s tower.
Siegrist, D., Clivaz, C., Hunziker, M. & Iten, S. (eds.) (2006). Exploring the Nature of Management. Proceedings of the Third International Conference on Monitoring and Management of Visitor Flows in Recreational and Protected Areas.
University of Applied Sciences Rapperswil, Switzerland, 13-17 September 2006. Rapperswil.
284
Mapping the Attractiveness of the Dutch Landscape:A GIS-Based Landscape Appreciation Model (Glam-2)
Sjerp de Vries, Janneke Roos-Klein Lankhorst & Arjen E. Buijs
Alterra Green World Research, The Netherlands
[email protected]@[email protected]
Keywords: Landscape appreciation, GIS, regression, naturalness, urbanisation, historical distinctiveness, skyline disturbance, validation.
IntroductionThe main objective of Dutch nature policy is to make an essential contribution to a liveable and sustainable society through the conservation, res-toration, development, and sustainable use of na-ture and landscape. One of the motives of the Dutch government behind this objective is that ‘we want a beautiful country to live and work in’ (LNV 2000). To accommodate this desire, it is necessary to know where people like the landscape in their environ-ment and where they do not. It is also important to know which physical characteristics of the land-scape contribute to this attractiveness. To provide such information in a cost-efficient way, a GIS-based model was developed to map, monitor, and simulate the attractiveness of the landscape in one’s living environment. The first version of this model, entitled “GIS-based Landscape Appreciation Mod-el (GLAM)”, was strongly based on existing theo-retical insights. However, it was only moderately successful, one of the problems being the overlap of the GIS-indicators for several of the theoretically important characteristics of the landscape (De Vries & Gerritsen 2003). The Netherlands Environmental Assessment Agency commissioned a second, im-proved version on the model. In this paper this sec-ond version is presented, as well as its validation.
ModelThe model predicts landscape attractiveness based solely on nationally available GIS-data on the land-scape for each 250 x 250 meter cell. GLAM-2 dis-tinguishes three positive GIS-indicators: Natural-
ness, Historical distinctiveness, Relief, and three negative ones: Skyline disturbance, Urbanisation, Noise level. Each indicator has five levels signify-ing how positive (or negative) the physical state of the landscape is thought to be evaluated by the av-erage Dutch resident with regard to this aspect. The outcomes of a national survey among almost 3000 Dutch residents were used to determine the optimal weights for the different indicators (De Vries & Van Kralingen 2002). In the survey people were asked to rate the countryside surrounding their place of resi-dence. To bring the GLAM-predictions at the same level as the rated surrounding countryside, an av-erage predicted value was calculated over all cells within a five kilometre radius of the respondents’ postcode. The six indicators ‘explained’ 36% of the variance in attractiveness scores (averaged over 3 or more respondents with the same postcode). Ac-tually the regression analysis showed that only four of the six indicators were needed to achieve this re-sult: Relief and Noise level had no added predic-tive value.
Validation study
GLAM-2 has been validated using data from an-other, more recent survey on landscape attractive-ness (SNM 2005). Almost 5000 people living in or nearby one of 52 delineated areas were asked to rate the landscape within this delineated area. Results showed that GLAM-2 explained 47% of the variance in the average attractiveness rating of the 52 areas. So, rather than shrinkage, an increase in explained variance was observed. This increase

Landscape and its Images
285
is thought to be due to the averages per area be-ing based on a larger number of people (between 42 and 142, rather than 3 or more). Also the fact that the area to be rated was clearly delineated may have helped. Of course the model (still) has its lim-itations. For example, we do not consider GLAM to be suited for use at a very detailed, local level. On the other hand, comparisons of GLAM-predic-tions and judgements made by landscape experts clearly show that landscape quality and its attrac-tiveness to lay people are two separate things. All in all, although we intend to develop the model fur-ther, we think GLAM-2 already constitutes a use-ful tool for policy makers and spatial planners.
References
De Vries, S. & Gerritsen, E. (2003). Van fysieke kenmerken naar landschappelijke schoonheid; de voorspellen-de waarde van fysieke kenmerken, zoals vastgelegd in ruimtelijke bestanden, voor de schoonheidsbelev-ing van Nederlandse landschappen. In: Alterra-rapport 718/Reeks Belevingsonderzoek 7. Wageningen.
De Vries, S. & Van Kralingen, R.B.A.S. (2002). De belev-ing van het Nederlandse landschap door haar bewon-ers; de geschiktheid van het SPEL-instrument voor monitoringsdoeleinden. In: Alterra-rapport 609. Wa-geningen.
LNV. (2000). “Nature for people, people for nature”, poli-cy document on nature, forest and landscape in the 21st
century. The Hague.
Roos-Klein Lankhorst, J., De Vries, S., Buijs, A., Bloem-men, M. & Schuiling, C. (2005). BelevingsGIS versie 2; waardering van het Nederlandse landschap door de bevolking op kaart. In: Alterra rapport 1138/Reeks Belevingsonderzoek 14. Wageningen.
SNM. (2005). Nederland kan zo mooi zijn; onderzoek naar de beleving van 52 gebieden door omwonenden. Deel I: landelijke conclusies en resultaten. Utrecht.

Siegrist, D., Clivaz, C., Hunziker, M. & Iten, S. (eds.) (2006). Exploring the Nature of Management. Proceedings of the Third International Conference on Monitoring and Management of Visitor Flows in Recreational and Protected Areas.
University of Applied Sciences Rapperswil, Switzerland, 13-17 September 2006. Rapperswil.
286
The Landscape Method of Analysis and Assessment ofEcotourism Destinations in the Republic of Kazakhstan
Dilya B. Woodward & Galina V. Geldyeva
Ministry of Science and Education of the Republic of Kazakhstan
[email protected]@escape.kz
Keywords: Kazakhstan, ecotourism, landscape, ecotourism destinations, plains, mountains, natural territorial complex.
Introduction
Global environmental changes call for alternative solutions in natural resources management and for the development of ecologically safe industries for the global economy. These changes affect the tour-ism industry as well. Every year the growing num-ber of tourists has an influence on natural environ-ment. High concentrations of people in popular tourist attractions result in the destruction of land-scapes, waste and noise pollution, and the contam-ination of the environment by transportation ex-haust gases.
Mass tourism without consideration given to the ecological consequences has caused the gradual degradation of natural habitats and environments. One of the causes is high tourist demand which leads to overcrowding in popular tourist attrac-tions. Considering these factors, planning of tour-ist flows and tourist load balancing can not be un-derestimated.
According to “Conception of the Development of Tourism in the Republic of Kazakhstan”, the growth of the world-wide tourism industry will occur due to the appearance of new tourist attrac-tions, since the traditional tourism markets have already reached their maximal capacity. For that reason Kazakhstan has a unique opportunity to oc-cupy a niche in the global tourism industry.
Considering the fast and steady growth of tourism and its great influence on the environment, society, and all sectors of economy, the government of Ka-zakhstan has identified the tourism sector as one of the priorities of its long term development pro-
gramme. Therefore, the need for the scientific jus-tification for tourism in Kazakhstan is vitally im-portant in order to avoid irreversible consequences that could occur as a result of tourist impact (deg-radation of natural complexes or landscapes and their improper use).
Kazakhstan is the second largest territory in the Newly Independent States (after Russia) and the ninth largest territory in the world occupying 2.7 million m2. The country’s landlocked location in the centre of Asia determines its physiograph-ic characteristics, hydrographic features, soil and plant cover, fauna and landscapes.
Presently, the development of management tech-niques for tourist flows in protected areas in the Republic of Kazakhstan is not receiving adequate attention. This is due to the inadequacy in the ex-isting regulating system, and the fact that the tour-ism market is at its early development stage. There is no well-defined solution to this problem because different types of landscapes from forest-steppe to glacial-nival have different degrees of stability.
Methods
Standard methods of landscape analysis include: cartographical, cartometrical methods, methods of landscape profiling, landscape-indication meth-ods, statistical methods, methods with the use of GIS and remote sensing.
The method of landscape analysis for scientifical-ly based ecotourism planning is geared towards the complex evaluation of ecological conditions, and the recreational potential of landscapes. This is a

Landscape and its Images
287
multiple-step method to the assessment of natu-ral-territorial complexes that are linked by one main goal – the thorough assessment of charac-teristics of ecotourism destinations.
The diversity of landscapes of the plain and moun-tain areas of Kazakhstan and their use for recre-ational purposes determines the need of the strict following of landscape-ecological requirements for recreational reclamation. The management of tourist flows on protected territories must be done
according to the types of landscapes with the con-sideration of their spatial structure and with the use of coefficients.We propose a new method for re-search and management of tourist flows with the use of the landscape method for the preservation of the unique destiwwnations of ecotourism and pro-tected areas.
By landscape we understand a specific territory, homogeneous in origin and evolution of devel-opment and indivisible by zonal and azonal char-
Figure 11: Fragment of Landscape Map of Kazakh SSR, scale 1 : 5 000 000, Edited by Chupakhin, special content by Veselova L.K., Geldy-eva G.V. Bayan Aul National Park
1 LegendLandscapes of PlainsSteppes11 Deluvial-proluvial plain in carbonate black earth soils20 Hummocky topography in black southern carbonate black earth and dark-hazelnut solonetz soils29 Peneplain in dark-hazelnut soils with solonetz31 Denudation plain in hazelnut normal and underdeveloped soils34 Denudation plain in hazelnut normal soils with solonetz35 Denudation plain in dark-hazelnut solonetz soils36 Denudation plain in dark-hazelnut underdeveloped soils37 Deluvial-proluvial plain in dark-hazelnut soils with solonetz38 Deluvial-proluvial plain in hazelnut normal soils41 Deluvial-proluvial plain in dark-hazelnut carbonate soils and meadow-hazelnut with solonetz soils47 Fluviolacustrine plain in dark-hazelnut soils with solonetz49 Fluviolacustrine plain in meadow solonetz and solonchaks and dark-hazelnut soils53 Fluviolacustrine plain in dark-hazelnut soils54 Fluviolacustrine plain in dark-hazelnut soils56 Aluvial-proluvial plain in dark-hazelnut and and meadow-hazelnut soils59 Hummocky topography in dark-hazelnut soils 60 Hummocky topography in dark-hazelnut solonetz soils62 Hummocky topography in hazelnut carbonate and underdeveloped soils63 Hummocky topography in hazelnut normal soils Semi-deserts87 Fluviolacustrine plain in light-hazelnut soils

Landscape and its Images
288
acteristics. It has a united geological fundament, same-type relief, climate and uniform combination of hydrothermal condition, soils and biocenose and similar combination of geosystems.
Natural landscapes and ecotourism are closely in-terrelated. An analysis of landscape heterogeneity of ecotourism destinations is a required step of the development of tourism industry. The landscape-ecological approach to the planning of ecotourism routes includes the assessment of heterogeneity and stability of specific landscapes that are valu-able tourists’ destinations and allows the calcula-tion of an optimal ratio between landscapes and tourist loads. Scientific and methodological bases of ecotourism include the analysis of the landscape structure of the territory and comprehensive char-acterization of natural and natural-anthropogenic landscapes. They differ from each other by zonal conditions and their recreational potential.
Specific landscape research that includes the as-sessment of natural territorial complexes and nat-ural resources as ecotourism sites, takes into ac-count the analysis of natural components (relief, climatic conditions, soil and vegetation cover etc.) in their interrelationships and complex consider-ation of landscape characteristics of the tourist destination. Therefore, an analysis of geological-geomorphologic, hydro-geologic, climatic, zonal soil and land conditions is essential for ecotourism planning and development. The landscape-ecolog-ical approach would also include the assessment of aesthetic attractiveness of the landscape and the carrying capacity of each individual landscape.
The issues of ecotourism planning and their so-lutions differ, depending on the native zones and physiographic regions. The main task of planning and designing the network of ecotourism routes is to obtain reliable data on landscape resource po-tential and thorough exploration of landscapes.
The analysis of natural settings of the Republic of Kazakhstan shows that all physiographic process-es and phenomena in landscapes closely follow the general tendency of the evolution of modern landscapes. The regional structure of natural land-scapes of Kazakhstan is represented by individual morphostructural elements: plains of the Western-Syberian platform, lowlands, plains and plateaus
of the Turan platform, high plains, plateaus, hum-mocky topography and insular mountains of the Kazakh sheet, and intermountain troughs and epi-platform mountain ranges of South-Eastern Ka-zakhstan.
Plain landscapes are found on a vast territory of the country and are represented by the following types and subtypes: forest-steppe region with subtypes of southern and atypical forest-steppe; steppe with subtypes of northern and southern steppes; semi-desert and desert. Mountain landscapes are rep-resented by nival, mountain-meadow, forest, for-est-steppe, steppe, semi-desert and desert types of landscapes. Each of the mentioned types of land-scapes is an area with high tourism potential.
Local physiographic conditions and processes linked to the geological structuring and display of modern tectonic movements, features of re-lief, soil and vegetation cover determine the land-scape kinds. The diversity of natural properties of the Republic of Kazakhstan is the cause for a great number of kinds of landscapes in plains as well as in mountains. There are 201 kinds of landscapes on the territory of the country with arid natural territo-rial complexes prevailing (more than 50%).
The modern landscape structure of Kazakhstan has a definite latitudinal differentiation of the types of landscapes due to the extension of the country in meridian direction. The amount of solar heat in-creases from north to south and the atmospher-ic pressure decreases, both factors affect the soil-vegetation cover. Close interrelationship of natural factors leads to the isolation of different types of landscapes – from forest-steppe landscapes in the North to steppe- and dry-steppe in the South.
Mountain type of landscape occupies 17% of the country and is highly diverse. The structure of mountain type of landscape is determined by the following factors: by the location of mountains in arid zone of intercontinental deserts, by absolute height of mountains (up to 7 000 m) and by latitu-dinal and longitudinal extension. These factors as-sisted the formation of the specific spectrum of al-titudinal zonality of landscapes. Mountain types of landscapes also include the landscapes of moun-tain ridges, submontane and intermontane troughs. They were formed within the limits of orogen-
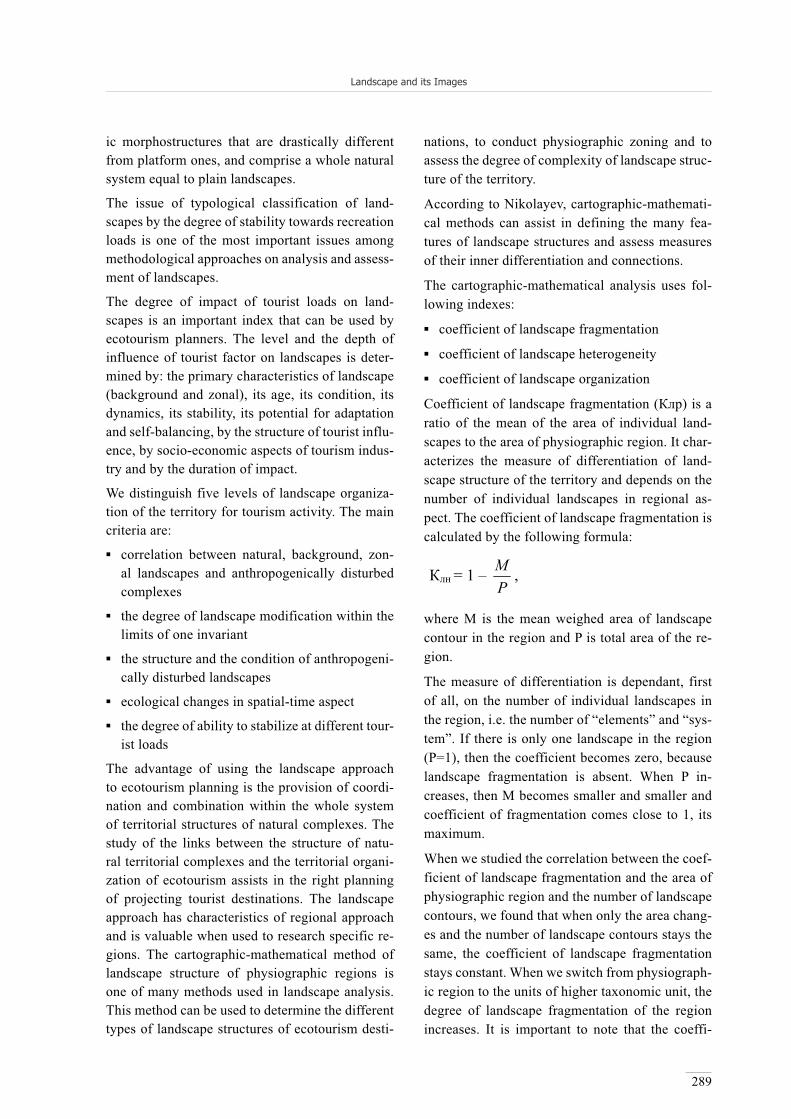
Landscape and its Images
289
ic morphostructures that are drastically different from platform ones, and comprise a whole natural system equal to plain landscapes.
The issue of typological classification of land-scapes by the degree of stability towards recreation loads is one of the most important issues among methodological approaches on analysis and assess-ment of landscapes.
The degree of impact of tourist loads on land-scapes is an important index that can be used by ecotourism planners. The level and the depth of influence of tourist factor on landscapes is deter-mined by: the primary characteristics of landscape (background and zonal), its age, its condition, its dynamics, its stability, its potential for adaptation and self-balancing, by the structure of tourist influ-ence, by socio-economic aspects of tourism indus-try and by the duration of impact.
We distinguish five levels of landscape organiza-tion of the territory for tourism activity. The main criteria are:
correlation between natural, background, zon-al landscapes and anthropogenically disturbed complexes
the degree of landscape modification within the limits of one invariant
the structure and the condition of anthropogeni-cally disturbed landscapes
ecological changes in spatial-time aspect
the degree of ability to stabilize at different tour-ist loads
The advantage of using the landscape approach to ecotourism planning is the provision of coordi-nation and combination within the whole system of territorial structures of natural complexes. The study of the links between the structure of natu-ral territorial complexes and the territorial organi-zation of ecotourism assists in the right planning of projecting tourist destinations. The landscape approach has characteristics of regional approach and is valuable when used to research specific re-gions. The cartographic-mathematical method of landscape structure of physiographic regions is one of many methods used in landscape analysis. This method can be used to determine the different types of landscape structures of ecotourism desti-
nations, to conduct physiographic zoning and to assess the degree of complexity of landscape struc-ture of the territory.
According to Nikolayev, cartographic-mathemati-cal methods can assist in defining the many fea-tures of landscape structures and assess measures of their inner differentiation and connections.
The cartographic-mathematical analysis uses fol-lowing indexes:
coefficient of landscape fragmentation
coefficient of landscape heterogeneity
coefficient of landscape organization
Coefficient of landscape fragmentation ( ) is a ratio of the mean of the area of individual land-scapes to the area of physiographic region. It char-acterizes the measure of differentiation of land-scape structure of the territory and depends on the number of individual landscapes in regional as-pect. The coefficient of landscape fragmentation is calculated by the following formula:
where M is the mean weighed area of landscape contour in the region and P is total area of the re-gion.
The measure of differentiation is dependant, first of all, on the number of individual landscapes in the region, i.e. the number of “elements” and “sys-tem”. If there is only one landscape in the region (P=1), then the coefficient becomes zero, because landscape fragmentation is absent. When P in-creases, then M becomes smaller and smaller and coefficient of fragmentation comes close to 1, its maximum.
When we studied the correlation between the coef-ficient of landscape fragmentation and the area of physiographic region and the number of landscape contours, we found that when only the area chang-es and the number of landscape contours stays the same, the coefficient of landscape fragmentation stays constant. When we switch from physiograph-ic region to the units of higher taxonomic unit, the degree of landscape fragmentation of the region increases. It is important to note that the coeffi-
= 1 – PM ,

Landscape and its Images
290
cient of landscape fragmentation is not related to zonal differentiation of the territory but depends on the geologic-geomorphologic peculiarities.
An important characteristic of the structure of phys-iographic regions is the measure of their landscape heterogeneity. The following formula is used to cal-culate the coefficient of landscape heterogeneity:
Where S is the area (%) of the particular group (kind) of landscapes in the region, n is the number of landscape groups, n2 is the number of combi-nation of groups in two.
The coefficient of landscape heterogeneity shows not only the degree of the complexity of different kinds of landscapes that comprise the structure of the region, but also the correlation between their ar-eas. The coefficient of landscape heterogeneity in-creases in those regions, where there is a great di-versity of kinds of landscapes and a great number of landscape contours. The last characteristic is the most important element in landscape fragmentation of the region. Therefore, landscape heterogeneity correlates not only to the kinds of landscapes but to fragmentation of landscape structure as well.
When we analyzed the values of coefficients of landscape heterogeneity of physiographic regions, we found that their values somewhat increase dur-ing the transition from the units of low taxonom-ic rank to the units of high taxonomic rank. How-ever, this increase is insignificant and therefore is not compared to the variations of the coefficient of landscape fragmentation.
Geographic variability of the coefficient of land-scape heterogeneity of physiographic regions is an interesting one. The dependence of from vertical and horizontal partition of the relief, litho-logic complexes of rocks and the degree of drain-age of the territory was established. Maximal val-ues of the coefficient are present in those regions of the Republic of Kazakhstan, where forest-steppe and steppe fractured natural complexes dominate. Low values of coefficients of landscape heteroge-
neity are found in regions with alluvial and aeoli-an plains. The heterogeneity of landscape structure usually increases where its fragmentation decreas-es and vice versa.
The coefficient of landscape organization enables us to analyze the inner regularity of the landscape structure of the region. It is calculated by compari-son of and K and provides data on interrela-tionships of geosystem elements and structural or-der. The higher the landscape fragmentation of the region and lower landscape heterogeneity, the more regulated is its structure. On the other hand, when values of fragmentation and heterogeneity come close, the organization of landscape structure falls.
Conjugated analysis of values of landscape struc-ture shows the degree of organization of natural-territorial complex. The experiments revealed that the lowest indexes of landscape organization are linked to rapprochement of values of landscape fragmentation and heterogeneity.
Cartographic-mathematical characteristics of land-scape structure provide tools for comparative anal-ysis and classification of physiographic regional units on their degree of complexity and zonal struc-ture.
Results
The issues of tourist flows regulations for different types of landscapes include a broad scope of eco-logical tasks for determining the carrying capacity limits. The management of tourist flows should be based on the precise carrying capacity numbers of the particular landscape. Our research showed that the least ecological tolerance to recreational loads have desert landscapes (for example Barsakelm-es Reserve). The landscapes of insular low lands of the steppe zone of Kazakhstan are the most tol-erant to tourist loads. (Bayan-Aul National Park, Kurgaldzhin State Reserve).
,2
1
1C
jmmijinn
ni nji
K

Landscape and its Images
291
Conclusion
The method of landscape analysis provides com-plex evaluation of ecological conditions of the area and the recreational potential of landscapes. This multiple-step method can be employed for eco-tourism planning.
References
Kalesnik, S. (1968). Encyclopedic Dictionary of Geograph-ic Terms. Soviet Encyclopedia. Moscow.
Nikolayev, V. (1978). Classification and Small-scale Car-tography of Landscapes. Moscow.
Geldyeva, G. (2002). Landscape-ecological Foundations of Ecotourism Planning of Turkestan Region. Turkestan.
Geldyeva, G. & Veselova, L. (1992). The Landscapes of Kazakhstan. Alma-Ata.
Republic of Kazakhstan Government Decree. (2001). Con-ception of the Development of Tourism in the Repub-lic of Kazakhstan. Almaty.

292
Good Solutions between Sports, Nature and Landscape
Margit Mönnecke (Chair)

Siegrist, D., Clivaz, C., Hunziker, M. & Iten, S. (eds.) (2006). Exploring the Nature of Management. Proceedings of the Third International Conference on Monitoring and Management of Visitor Flows in Recreational and Protected Areas.
University of Applied Sciences Rapperswil, Switzerland, 13-17 September 2006. Rapperswil.
293
Snowshoeing in Protected Areas: Bridging the Gap betweenAttitude and Behaviour
Benjamin Freuler1, Marcel Hunziker1 & Heinz Gutscher2
1Swiss Federal Institute for Forest, Snow and Landscape Research, [email protected]@wsl.ch
2University of Zurich, [email protected]
Keywords: Recreational conflicts, social influence, attitude-behaviour consistency, snowshoeing, protected areas, quasi-experimental design.
Introduction
The frequency and diversity of outdoor activities increased in the last years. New leisure activities such as snowshoeing are very popular and growing constantly, but they might affect sensitive wildlife habitats. Snowshoe walkers especially like half-open forests, which are at the same time the habitat of rare species. Efforts of recreation management tend to solve these conflicts not by means of strict regulations, but reducing disturbance by active steering through information and infrastructure.
For example, outdoor managers try to reduce rec-reational conflicts between snowshoeing and wild-life by defining a limited number of trails, to chan-nel visitors. In a case study, we evaluate the impact of such steering efforts in a social psychological framework. We don’t focus on the planning pro-cess or the ecological component, but on the influ-ence of behaviour.
From a survey among Swiss snowshoe walkers, we know that they are willing to avoid protected ar-eas if they are informed. Furthermore, they think that it makes sense to install signposts to inform and sensitise visitors. On the other hand our survey among more than 350 foresters showed that for-est visitors often ignore behaviour appeals and that snowshoeing causes severe ecological problems especially in the subalpine area. Furthermore so-cial psychological research indicates that self-re-ported behaviour and attitude are often inconsis-tent with observed behaviour.
Therefore we focus on the following questions in our case study:
Can the behaviour of snowshoe walkers be in-fluenced by steering efforts?
Under which conditions are steering efforts suc-cessful in protecting wildlife?
Are observed behaviour of snowshoe walkers and their self-reported behaviour and attitudes towards protected areas consistent, and if not, how can the consistency be increased?
Methods
Contrary to many social psychological studies our data collection is not limited to self-reported be-haviour or to an artificial setting, but we observe evident behaviour in a natural and applied setting. In cooperation with local authorities we planned and implemented several snowshoe trails in com-bination with a theory-based communication con-cept and a quasi-experimental research design. Our conceptualisation was based on previously conducted surveys among foresters and snowshoe walkers.
In a three-step design we analyzed how visitors re-acted to steering efforts. First we marked trails and installed signposts at the starting points with ba-sic trip information and maps with protected areas (setting A). During a second phase, we combined setting A with additional signposts which con-tained behaviour appeals (not to leave the trail),
Good Solutions between Sports, Nature and Landscape
294
ecological information (sensitivity of wildlife in winter) and information about the protected area and alternative trails (setting B). In a third step we additionally installed signposts at critical points, where snowshoe walkers tend to leave the trail (setting C).
In all of those three phases we assessed if people stayed on the trail and if the contingent of deviat-ing snowshoe walkers changed depending on the setting.
Results
Our preliminary results indicate that in setting A the influence on behaviour was rather weak. A lot of snowshoe walkers still left the marked trail and crossed the protected area, and only 30% stayed on the trail. So the contingent of visitors who respect-ed the protected area was much lower, as could have been expected based on attitudes and self-re-ported behaviour assessed in previously conducted surveys. We registered a rather high inconsistency between reported and observed behaviour.
In setting B (additional signposts with appeals and information), the number of visitors who stayed on the trail and respected the protected area increased significantly to 80%. In setting C we assessed a de-clining level of people staying on the trail (50%), but it was still higher than in setting A.
Conclusion
Our observations so far suggest that snowshoe walkers overrate their ecological attitudes and their self-reported ecological behaviour in question-naires if we compare it to observed behaviour in the natural settings. However, the gap between attitude and behaviour can be bridged partly if snowshoe walkers are provided with appropriate information, ecological education, rationale and appeals. Addi-tional signposts at critical deviation points don’t in-crease the consistency between attitude and behav-iour. It’s necessary to combine on-site information with communication and education, which starts earlier, because snowshoe walkers hardly change their route once they started a trip. Moreover ef-forts must be reinforced continuously to avoid a de-crease of achieved positive effects.
References
Manning, R. E. (2001). Studies in Outdoor Recreation. Or-egon State University Press. Corvallis.
Ingold, P. (2004). Freizeitaktivitäten im Lebensraum der Alpentiere. Bern.
Radü, G. (2004). Schneeschuhlaufen – Eine Trendsportart. Zürich.
Zeidenitz, C. (2005). Freizeitaktivitäten in der Schweiz – wegen oder gegen Natur und Landschaft? Birmens-dorf.
Zimbardo, P. G. & Leippe, M. R. (1991). The psychology of attitude change and social influence. New York.

Siegrist, D., Clivaz, C., Hunziker, M. & Iten, S. (eds.) (2006). Exploring the Nature of Management. Proceedings of the Third International Conference on Monitoring and Management of Visitor Flows in Recreational and Protected Areas.
University of Applied Sciences Rapperswil, Switzerland, 13-17 September 2006. Rapperswil.
295
Outdoor Leisure Activities: Motivation, Attitudes and Strategies Promoting Responsible Behaviour towards Nature
and Landscape
Marcel Hunziker & Christina Zeidenitz
Swiss Federal Institute of Forest, Snow and Landscape Research, Switzerland
[email protected]@gmx.ch
Keywords: Leisure, outdoor activities, motivations, attitudes, behaviour, social science, qualitative and quantitative methods, intervention experiments.
Introduction
Outdoor activities can have negative effects on nature and landscape. According to the “Swiss Landscape Concept”, people should therefore be encouraged to behave responsibly towards nature and landscape. Authorities and sports as-sociations have tried to reach this aim by giving advice, but their success has never been evalu-ated.
Thus, in order to provide scientific support to the Swiss authorities and NGOs, the three cen-tral aims of this project were:
(1) to analyse the motivations for carrying out outdoor leisure activities and, in particular, to investigate the importance of the experience of nature and landscape as such motivation,
(2) to identify the driving factors for responsi-ble behaviour towards nature and landscape,
(2) and to evaluate behaviour changing strate-gies, promoting responsible behaviour towards nature and landscape.
Methods
To reach these aims, five methodical steps were un-dertaken:
Figure 1: The extended theoretical model for responsible behaviour towards nature and landscape with the original „Ajzen-factors“ (boxes with continuous lines) and the inductively gained factors (boxes with broken lines).

Good Solutions between Sports, Nature and Landscape
296
(1) In the preparative part expert interviews were conducted in order to identify two out-door leisure activities that are most problematic due to being frequent, having considerable im-pact on nature, being unorganised and thus dif-ficult to steer, and representing different sea-sons (summer/winter) as well as two different main characteristics (trend-oriented/classic). These two were free riding (ski or snowboard) and picnicking.
(2) In the inductive part the analysis of qual-itative data, collected by problem-centred in-terviews with individuals carrying out the be-fore-selected outdoor activities, revealed deep insights into the different motivations for these activities and into the driving factors of respon-sible behaviour towards nature and landscape.
(3) Theory development: Based on the “theory of planned behavior” (Ajzen & Madden 1986) and the results of the inductive part – such as the extraction of initial factors like motivation (Rheinberg, 1993), attitude towards nature and landscape, perception of problems (Hunecke et al. 1999), acceptance of behaviour-strategies, knowledge and external factors – an extended theoretical model was developed to take a clos-er look at the underlying factors determining re-sponsible behaviour towards nature and land-scape (see figure 1).
(4) In the deductive part a representative nation-wide postal survey was conducted in Switzer-land (n=1340 German-Swiss and French-Swiss participants) to test the above-mentioned model and to provide representative quantitative data regarding the motivations and the importance of nature and landscape experience in this con-text.
(5) In the experimental part intervention experi-ments were undertaken in order to evaluate be-haviour-changing strategies. For this purpose one experiment was conducted for each of the two above-mentioned selected outdoor leisure activities (free riding and picnicking). The ef-fects were measured by an experimental design with control groups and surveys before and af-ter the interventions.
ResultsThe results of the nationwide survey showed that “closeness to nature” is one of the most important motivational factors whereas risk experience is not as important as is often assumed. Of course, there are considerable differences between the motivations for different activities such as pic-nicking and free riding (see figure 2). But never-theless, nature and landscape experience are the most important motivations also for the trend ac-tivities such as free riding.
1 2 3 4 5
Recreation
Scenic beauty
Nature experience
Wellness, fitness
Social experience
Self experience
Fun
Observation of wildlife
Escape from daily life
Flow experience
Soleness
Saving costs
Adventure, risk Picnickers (n = 740)Free riders (n = 116)
Figure 2: The motivations for carrying out the outdoor leisure activities free riding and picnicking.

Good Solutions between Sports, Nature and Landscape
297
The extended theoretical model could be corrob-orated empirically: it was shown that responsible behaviour towards nature is often not only influ-enced by “Ajzen-factors” such as subjective norms or perceived behaviour control but also for exam-ple by landscape preferences (see table 1).
The intervention experiments showed that, among several intervention types, prompts seem to have an effect on attitude and behaviour, albeit only a minor one on behaviour. On the other hand, the of-fer of infrastructure has no effect on attitude but a significant effect on behaviour. In addition, it be-came clear that the amount of information provid-ed to the people should be small and easy to un-derstand.
Conclusion
The results reveal the importance of the role of na-ture and landscape as a motivation for carrying out outdoor leisure activities and, thus, encourage pub-lic agencies and NGOs to build on this motivation in the further development of strategies that shall promote responsible behaviour towards nature and
landscape. Aiming at influencing people in this sense it is important to bear in mind that a combi-nation of prompts, motivating to show the desired behaviour, and (little!) information, explaining the necessity of the behaviour, as well as providing in-frastructure, enabling to show the desired behav-iour, is most suitable.
References
Ajzen, I. & Madden, T. J. (1986). Prediction of Goal-Di-rected Behavior: Attitudes, Intentions, and Perceived Behavioral Control. In: Journal of Experimental So-cial Psychology (22), p 453-474.
Rheinberg, F. (1993). Anreize engagiert betriebener Freizeit-aktivitäten - ein Systematisierungsversuch. Vortrag im Rahmen der DGfP-Fachgruppe Pädagogische Psy-chologie, Mannheim, September 22-24, 1993.
Hunecke, M., Matthies, E., Blöbaum, A. & Höger, R. (1999). Die Umsetzung einer persönlichen Norm in umwelt-verantwortliches Handeln- Ansätze zur Reduktion des motorisierten Individualverkehrs in einer Kleinstadt. In: Umweltpsychologie (3/2), p 10-22.
Predictors B S.E.BAttitudes towards behaviour .394 .035 .38***Importance of scenic beauty .060 .015 .13***Subjective norms .072 .021 .11***Knowledge .037 .013 .09**Perceived behavioural control .067 .024 .09**External factors .079 .031 .08*Attitudes towards protection measures .036 .015 .07*
Stepwise-Regression; n=1340; r2= .39***; *: p<.05 ; **:p<.01; ***:p<.001
Table 1: The predictors of the intention of nature/landscape responsible behaviour.
Table 2: The effect of infrastructure and prompt/information on the intention to behave ecologically responsibly (picnicking).
Table 3: The effect of simple and differentiated information (both combined with a prompt) on reported behaviour (free riding).

Siegrist, D., Clivaz, C., Hunziker, M. & Iten, S. (eds.) (2006). Exploring the Nature of Management. Proceedings of the Third International Conference on Monitoring and Management of Visitor Flows in Recreational and Protected Areas.
University of Applied Sciences Rapperswil, Switzerland, 13-17 September 2006. Rapperswil.
298
An Improved Methodological Approach to Recreation Conflict Analysis in the Black Forest
Carsten Mann1 & James D. Absher2
1Albert-Ludwigs-University Freiburg, [email protected]
2USDA Forest Service, [email protected]
Keywords: Conflict analysis, Black Forest recreation planning, methodological integration, triangulation, nature sport, user-group conflict, social world.
Introduction
Germany’s recreation management is tradition-ally integrated into spatial planning systems ori-ented towards the protection of ecosystems. The scientific inputs to management have been large-ly determined by quantitative impact and conflict studies with an emphasis on nature protection (e.g. Schemel & Erbguth 2000). Conclusions of far most studies were that careful conflict and visitor flow management is needed for a sustainable landscape development. Today, however, Germany’s recre-ational situation has changed: New activities and increased participation by people seeking different recreational experiences challenge management in many areas (Schmied et al. 2002; and others). Apart from ecological problems, social conflicts occur between and within user-groups and land management agencies (e.g. Pröbstl 2000). Because systematic sociological studies of Germany’s natu-ral resource management are rare, there is a lack of understanding of the leisure differences that might lead to conflict. In turn, this leads to incomplete management and, at times, wrong management de-cisions (e.g. Mann 2006).
This paper begins with a review of the scientific lit-erature that underlies this situation and proposes a model, based on the methodological work of May-ring (2001) and others, that better integrates quan-titative and qualitative approaches. While induc-tive and deductive approaches are often viewed as incompatible scientific approaches (Kelle & Erz-
berger 2000), new attempts combine the two meth-odological steps in order to evaluate the validity of results and to gain a greater ascertainment, descrip-tion, and understanding of a subject (Flick 1998). To analyze user-groups’ recreation conflict poten-tials, an integrated methodological design using a triangulation technique was chosen for this study.
Methods
This study empirically tests a model derived from the work of numerous recreation and resource management authors (e.g. Jacob & Schreyer 1980; Graefe & Thapa 2004; and Opaschowski 1999). Possible impacts were evaluated with the addition of questions about the infrastructure, visitors en-countered, forest management and experiential im-pacts.
These items originate from recent German and American recreation conflict literature. Addition-al questions of how impacts affect the individual satisfaction rate, visitor reactions and management preferences complete the model’s explanatory power (figure 1).
The adequacy of the model to explain conflicts was tested with two key ideas:
1) The sensitivity to conflicts as described by a combination of factors and motives,
2) The ability of the model to better understand recreation conflicts through the user group’s social world.

Good Solutions between Sports, Nature and Landscape
299
A purposive sample from six distinct nature sport organizations and 200 activity clubs was obtained. For the data collection, various methods were em-ployed, dependent upon the activity’s organiza-tion and the expected demography of the mem-bers. From the 845 returned questionnaires, 805 were useable. This was followed by 16 structured, validating interviews. Using data from the Black Forest nature sport groups, five activity factors and four motive groups were derived to encapsulate the recreationists’ “social world” that exists inde-pendently of a recreational stay (pre-experience). This re-integration of social dimensions into plan-ning processes and management concepts results in a new method for exploring visitor demands and conflict perceptions for forest-based recreation.
Conclusion
The results from this study confirm the validity of this mixed-method, triangulation approach and suggest the importance of using it to enhance the accuracy of management decisions where conflicts may occur due to the differences in the interests and values of recreationists and on-going social development. Moreover, recognizing local social worlds and recreational needs and linking them in a directed fashion into the planning process should improve sustainable landscape management and protect nature from an uncontrolled use.
References
Flick, U. (1998). Qualitative Forschung. Theorien, Me-thoden, Anwendung in Psychologie und Sozialwis-senschaft. Rowohlt.
Graefe, A.R. & Thapa, B. (2004). Conflict in natural re-source recreation. In: Society and Natural Resources, a summary of knowledge. 10th International Sympo-sium on Society and Natural Resource Management.
Jacob, G.R. & Schreyer, R. (1980). Conflict in outdoor rec-reation: a theoretical perspective. In: Journal of Lei-sure Research (12/4), p 368-380.
Kelle, U. & Erzberger, C. (2000). Qualitative und quantita-tive Methoden: kein Gegensatz. In: Flick, U. (2000). Qualitative Forschung – ein Handbuch, p 299–309.
Mann, C. (2006). Konflikte in Erholungsgebieten – Ursa-chen, Wirkungen und Lösungsan- sätze. In: Freiburg-er Schriften zur Forst- und Umweltpolitik, (12).
Mayring, P. (2001). Kombination und Integration qualitati-ver und quantitativer Analyse. In: Forum Qualitative Sozialforschung (2/1). http://qualitative-research.net/fqs/fqs.htm
Opaschowski, H.W. (1999). Umwelt, Freizeit, Mobilität. Konflikte und Konzepte. Opladen.
Pröbstl, U. (2000). Ökologische Skigebietsuntersuchungen als Beitrag zur Umsetzung der UVP-Änderungsrich-tlinie in Bayern. In: Aktuelle Forschungsberichte, p 143–153.
Schemel, H.-J. & Erbguth, W. (2000). Handbuch Sport und Umwelt. Aachen.
Schmied, M, Buchert, M. & Hochfeld, C. & Schmitt, B. (2002). Umwelt und Tourismus, Daten, Fakten, Pers-pektiven. Forschungsbericht 200 87 112 (BMU). Ber-lin.
Figure 1: The conflict analysis model.
Siegrist, D., Clivaz, C., Hunziker, M. & Iten, S. (eds.) (2006). Exploring the Nature of Management. Proceedings of the Third International Conference on Monitoring and Management of Visitor Flows in Recreational and Protected Areas.
University of Applied Sciences Rapperswil, Switzerland, 13-17 September 2006. Rapperswil.
300
Outdoor Activities in Nature and Landscape – Practice-Oriented Solutions
Karin Wasem & Margit Mönnecke
University of Applied Sciences Rapperswil, Switzerland
[email protected]@hsr.ch
Keywords: Outdoor activities, nature sports, good practice examples, sensitisation, environmental communication, conflict resolution, success factors, toolbox.
IntroductionOutdoor activities belong to our everyday life. Al-though outdoor activities providing enjoyment of nature are in rising demand and have a positive in-fluence on our health and well-being they can also lead to conflicts with nature and landscape. There is a lot of effort put into finding out how to perform outdoor activities and at the same time avoid or mi-nimise negative impacts on nature and landscape.
There are different solutions and strategies available to resolve problems between outdoor activities and environmentally sensitive areas. They range from legal prohibitions, zoning, blocking sensitive areas, pleas, information strategies, incentive-based strat-egies up to voluntary agreements between sports associations and nature conservation. However, it has to be considered that these strategies often are of theoretical character. The question whether the strategies are well accepted by the outdoor activ-ists and whether they lead to the intended effects often remains unanswered. Considering these facts the main objective of this project is to evaluate ex-isting strategies and resolutions that have already been applied and tested on site. This will provide a basis for recommendations and indications on how to perform outdoor activities in accordance with the aims of nature and landscape conservation.
Methods
To meet this objective six well-known case studies in Switzerland, applying different con-flict resolution strategies, have been evaluated. The examples concerned outdoor activities such
as hiking, freeriding, snowshoeing, paragliding and river-rafting. The goal of the evaluations was to identify success factors and to develop solution-orientated tools and instruments.
The findings of the evaluation are presented in form of a toolbox containing conflict resolu-tion strategies, good practice examples as well as success factors that have proven their useful-ness in handling and resolving problems aris-ing between outdoor activities and nature and landscape. The toolbox provides support for au-thorities, policy-makers and stakeholders deal-ing with conflicts in this field. The toolbox is part of the internet information system “Natur-SportInfo” (www.natursportinfo.de/ch) of the Bundesamt für Naturschutz (Germany) and the Federal Office for the Environment FOEN (Switzerland) and is therefore accessible to a broad audience.
Besides good practice examples and the success factors of conflict resolution, the toolbox em-phasizes the role of environmental communica-tion. It points out vehicles and means of com-munication which can be used to reach target audiences and make sportsmen and -women en-vironmentally conscious and informed. The so-called “communication paths” can be described as follows:
Internal communication: This means the in-ternal communication of associations or clubs. The target audience can for example be reached by club-journals, club-homepag-es, excursions for club-members, etc.

Good Solutions between Sports, Nature and Landscape
301
Training and further education: Environ-mental communication can take place in training courses or further education courses for sportsmen and -women or sports-instruc-tors. Furthermore, environmental topics can also be an obligatory part of an examination that is needed to obtain a licence or permis-sion to perform sports activities (e.g. para-gliding).
Commercial events and outdoor trips: On the basis of commercial events and outdoor-trips (for example events or trips of outdoor-companies, sports schools, NGO’s) partici-pants can be sensitized to the environment and landscape on site.
Communication gates: These are the gates that have to be passed by all those performing an outdoor activity. The gates refer to different stages of the activity and can be described as “prearrangement”, “equipment”, “journey and arrival”, “transport and sojourn in the area” as well as “performance of the outdoor activity”.
Results and Discussion
With this project an important contribution has been made to the discussion on how to sensitize sportsmen and sports-women on environmen-tal issues. Working with “communication paths” is a new and promising approach in this field of
Figure 1: Entrance page to the „Toolbox“ within the website of the NaturSportInfo internet information system.

Good Solutions between Sports, Nature and Landscape
302
research. By emphasizing the “communication gates” particular attention is drawn to athletes not organised in associations. The fact has become ap-parent that in practice as well as in practice-orient-ed research, common efforts should be made to im-prove the accessibility of this target group.
References
Beier, K. (2001). Anreizstrukturen im Outdoorsport. Schorndorf.
Ingold, P. (2004). Freizeitaktivitäten im Lebensraum der Alpentiere. Konfliktbereiche zwischen Mensch und Tier – mit einem Ratgeber für die Praxis. Bern/Stutt-gart/Wien.
Schemel, H.-J. & Erbguth, W. (2000). Handbuch Sport und Umwelt: Ziele, Analysen, Bewertungen, Lösungsan-sätze, Rechtsfragen. Aachen.
Wolf, A. & Appel E. (2003). Wirksamkeit freiwilliger Ver-einbarungen zwischen Natursport und Naturschutz. Abschlussbericht. Universität Duisburg-Essen.

303

304
Simulating Recreational Behaviour –on Agents and Environment
Andreas Muhar, Hans Skov-Petersen& Randy Gimblett (Chairs)

Siegrist, D., Clivaz, C., Hunziker, M. & Iten, S. (eds.) (2006). Exploring the Nature of Management. Proceedings of the Third International Conference on Monitoring and Management of Visitor Flows in Recreational and Protected Areas.
University of Applied Sciences Rapperswil, Switzerland, 13-17 September 2006. Rapperswil.
305
Applying an Agent-Based Modelling Approach to Simulating Spring Black Bear Hunting Activities in Prince
William Sound, Alaska
Randy H. Gimblett1, Aaron Poe2 & Spencer G. Lace1
1University of Arizona, [email protected]@email.arizona.edu
2Chugach National Forest, [email protected]
Keywords: Agent-based modeling, recreation, wilderness, monitoring, simulation, management, human-landscape interactions.
Introduction
Black bear harvest levels have increased rapidly during the past 10 years in Prince William Sound (PWS), Alaska. Alaska Department of Fish and Game (ADF&G) has found a 100% increase in re-ported bear harvest between 1995 and 2001. In reg-ulatory year 2001/02, this area reached a record of 436 bears taken which was approximately 25% more than any other black bear harvest unit in Alas-ka. The Chugach National Forest (CNF) which man-ages the vast majority of the land surrounding PWS desired a tool with which to assess the spatiotempo-ral distribution of the spring black bear harvest with hopes of assessing its overlap with other recreational groups. This study combines Geographic Informa-tion Systems (GIS) with existing standardized har-vest datasets and an agent based modeling approach to analyze complex, spatially dynamic patterns of black bear hunting in PWS. This study illustrates that human use simulation modeling, driven by a harvest record dataset, can inform decision making to positively and proactively manage human-land-scape interactions and enhance long-term manage-ment of harvested wildlife populations.
Methods
Black bear harvest season is open from Septem-ber 1 – June 30, although the majority of harvest (~80%) occurs in during May and June. In this
six-week period, bear hunters likely become the most prevalent recreation use group on the shore-line of PWS. CNF has received several reports of user conflicts in the western Sound between bear hunting groups and other non-harvesting use of the shoreline during late May and early June. Using RBSim2 (Itami et al. 2003) in conjunction with a harvest database containing location information for bear kill sites in the area. A rule based simula-tion was constructed to develop a comprehensive understanding of the relationship between the spa-tial-temporal patterns of hunter use and bear har-vest in PWS. The simulation outputs provided a di-rect method for integrating an understanding of the implications of visitor use on the management of biological systems and identify potential locations of user conflict.
Results
There are several interesting findings from the simulation outputs based on the Bear harvest data, logical assumptions and rules derived from expert. Peak hunter use days ranged between 315 and 503 on the main travel routes to less than 26 days in re-mote areas. There was a cumulative use of routes over the nine year period ranges from 1015 to 2338 visitor hunter use days. While the average hunt-er use per day for each node was approximate-ly 3.5, these averages generally fell below 2 per day for the nine years. However, over nine years

Simulating Recreational Behaviour - on Agents and Environment
306
(1996-2004) the amount of hunter use days rang-es widely from over 10,000 to less than 2,000, de-pending on the Capacity Area (CA). Not all CAs were used equally. Some hunting areas received considerable more use than others. For example, CAs such as 5 (6,000 – 10,000 hunter days), 12, 13, 16 and 17 (2,000- 6,000 hunter days) are the most heavily used in the study area. These same CAs consistently have the highest number of to-tal visits and trends in bear habitat and overnight facilities. But CA 5 receives the most visitor use days and number of bear taken. Capacity entries 1 (CA 18), 13 (CA 52) reveal some commercial use but dominated mostly by non-commercial activity. Locale entries 12 (CA 49), 68 (CA 16), 71 (CA 17) & 78 (CA5), reveal equal if not dominant commer-cial versus non-commercial use. In other words in these four areas there is a significant amount of re-ported commercial activity. The later 3, 5, 16 & 17 in earlier analysis are not only the sites most fre-quently visited by commercial activity, but also are the most frequented overall, account a high per-centage of the areas where the most bears are har-vested and where the duration of stay and the most overnight activity occurs. Private boats accounted for approximately 75% of the travel use entering into the CAs and Water Taxis an additional 15%.
There is a growing body of research focused with-in the context of human-environment interactions. This work examines the need to develop a compre-hensive and empirically based framework for link-ing the social, biophysical and geographic disci-plines across space and time. While this prototype still requires further validation, it strongly illus-trates the potential of human use simulation mod-eling to bridge a significant social science knowl-edge gap to improve the ability of decision making to positively and proactively manage human-land-scape interactions and promote long-term protec-tion of the landscape.
References
Itami, R, Raulings, R., MacLaren, G., Hirst, K., Gimblett, R., Zanon D. & Chladek P. (2003). RBSim 2: Simu-lating the complex interactions between human move-ment and the outdoor recreation environment. In: Journal for Nature Conservation (11), p 278-286.

Siegrist, D., Clivaz, C., Hunziker, M. & Iten, S. (eds.) (2006). Exploring the Nature of Management. Proceedings of the Third International Conference on Monitoring and Management of Visitor Flows in Recreational and Protected Areas.
University of Applied Sciences Rapperswil, Switzerland, 13-17 September 2006. Rapperswil.
307
Developing Agent-Based Models of Recreational Behaviours at a Landscape Scale: The Case of Recreational Fishing in
Northern Ontario
Len M. Hunt, Rob Kushneriuk & Nigel Lester
Ontario Ministry of Natural Resources, Canada
[email protected]@mnr.gov.on.ca
Keywords: Recreational fishing, agent-based model, landscape scale, repeated nested logit.
Agent-based models depicting recreational be-haviours are becoming an important tool used by researchers and resource managers. These mod-els provide opportunities for individuals to learn about complex relationships that agents have with environs and other agents. Past agent-based models have taught managers much about recre-ational use and impacts at specific sites or small areas (e.g. Itami and Gimblett 2001). Research-ers, however, have spent less effort to operation-alize these models at a landscape scale.
Adopting a landscape scale for an agent-based model of recreational behaviours is important for at least two reasons. First, resource managers are increasingly using a landscape scale when man-aging resources upon which recreationists de-pend. Consequently, managers increasingly re-quire information about how management and other changes to recreational sites are likely to impact recreational behaviours at many recre-ational sites. For example, if fishing quality de-clines at one popular fishing site, managers will require information about expected changes in fishing use at that site along with these expected changes in use at all other fishing sites.
Second, behavioural processes such as recre-ational site choice typically operate at a land-scape scale. When an inappropriate scale for a recreational behaviour is used, one likely pre-dicts biased behavioural responses since the rec-reationists may substitute their current site for a competing site. We showcase an agent based model of recreational fishing behaviours devel-
oped for residents of northern Ontario, Canada. Our application focuses on over 400 fishing sites in an area with hundreds of square kilometres. While developing an agent-based model at this landscape scale is daunting, we illustrate some benefits of this approach during the presenta-tion.
The behavioural rules for the angling agents come from an econometric model estimated (i.e. calibrated) from observed trip timing and site choices of anglers (see figures 1 and 2). The re-peated nested logit model (Morey, Rowe & Wat-son 1993) represents an effective method to link the amount, timing, and locations of fishing trips taken by anglers. Since this model is consistent with random utility theory, one can use the mod-el for economic welfare assessments besides as a guide for the behaviours of angling agents. Our application extends the normal estimation of the repeated nested logit model in three im-portant ways. First, we formally account for dif-ferent patterns of substitution among the fish-ing sites that are available to anglers. Second, we account for various trip contexts that include trip duration (day versus multiple day trips) and trip type (public versus private accommodation trips). Finally, the models account for many de-tails around the timing of recreational fishing trip behaviours. Trip timing decisions are relat-ed to calendar events (e.g. day of week, holi-days), weather (e.g. precipitation), culturally de-fined dates (e.g. children returning to school in September), and others.

Simulating Recreational Behaviour - on Agents and Environment
308
Calibration of the agent-based model is on-go-ing to ensure a good fit between monitored fish-ing site use and the use predicted by the model. Ef-forts are also underway to create a more dynamic agent-based model of recreational fishing. By pro-gramming fish as agents, we hope to provide a link to the impacts of angling behaviours on fisheries abundance. This model would allow us to predict longer-term effects of management decisions on recreational fishing.
References
Itami, R. M. & Gimblett, H. R. (2001). Intelligent recre-ation agents in a virtual GIS world. In: Complexity In-ternational (8), p 1-14.
Morey, E. R., Rowe, R. D., & Watson, M. (1993). A repeat-ed nested-logit model of Atlantic salmon fishing. In: American Journal of Agricultural Economics (75), p 578-592.
Figure 1: Spatial pattern of observed fishing site use for northern Ontario anglers.
Table 1: Temporal pattern of daily fishing participation rates (%) for northern Ontario anglers.

Siegrist, D., Clivaz, C., Hunziker, M. & Iten, S. (eds.) (2006). Exploring the Nature of Management. Proceedings of the Third International Conference on Monitoring and Management of Visitor Flows in Recreational and Protected Areas.
University of Applied Sciences Rapperswil, Switzerland, 13-17 September 2006. Rapperswil.
309
Using Computer Simulation Modeling to Monitor the Multiple Dimensions of Wilderness Solitude in Great Smoky Mountains
National Park
Brett C. Kiser1, Steven R. Lawson1 & Robert M. Itami2
1Virginia Polytechnic Institute and State University, [email protected]
2GeoDimensions Pty Ltd, [email protected]
Keywords: Computer simulation, monitoring, wilderness, wilderness solitude, Great Smoky Mountains National Park.
Introduction
The Wilderness Act of 1964 requires that wil-derness areas be managed to provide outstand-ing opportunities for solitude. Perhaps the most commonly used indicator to operationalize the concept of wilderness solitude has been the num-ber of encounters visitors have with other groups (Dawson 2004, Stewart & Cole 2001). Find-ings from a recent study of wilderness hikers in Shenandoah National Park suggest that there may be multiple dimensions of encounters that influence the extent to which wilderness visitors experience solitude, and that indicators of wil-derness solitude might include factors such as the timing and location of encounters (Hall 2001). Indicators of wilderness solitude might also in-clude the number of encounters during different phases of the wilderness trip, for example, “en-try”, “immersion”, and “exit” phases (Borrie & Roggenbuck 2001).
Monitoring encounters in wilderness and back-country recreation areas through on-the-ground observation has proven to be difficult, given that visitor use tends to be dispersed over relatively large, remote areas that typically have multiple access points (Lawson, Itami, Gimblett & Man-ning, in press). Furthermore, obtaining visitor reported encounters after the fact may not be re-liable due to the lack of precision in visitors’ re-call process (Watson, Cole, Turner & Reynolds
2000). Using indicators of wilderness solitude that include spatial and temporal dimensions of encounters as described above presents an even greater challenge for monitoring.
Recent research suggests that computer simula-tion modeling may be a useful tool for monitor-ing “hard to measure” indicators of quality (Law-son, Manning, Valliere & Wang 2003). Computer simulation models can be developed from rela-tively easy to obtain information to generate spa-tially and temporally precise estimates of visi-tor use and inter-group encounters throughout a dispersed recreation area. The purpose of this study is to explore the potential utility of com-puter simulation modeling for assisting wilder-ness and backcountry managers in monitoring multiple dimensions of wilderness solitude. In particular, this study will examine the validity and reliability of computer simulation estimates of wilderness solitude indicators that account for the timing and location of hiking and camping encounters.
The study area is composed of a network of multi-use trails and backcountry campsites in the Cosby and Big Creek areas of Great Smoky Mountains National Park, USA. The Cosby and Big Creek areas are used by day use hikers, day and over-night horseback riders, and backpackers, includ-ing Appalachian Trail thru-hikers. Most of the trails and campsites in the study area fall with-

Simulating Recreational Behaviour - on Agents and Environment
310
in the boundary of the park’s proposed wilderness, which is managed as congressionally designated wilderness (National Park Service 1995).
Methods
Several types of visitor use data will be collected during May 2006 and used as inputs into the com-puter simulation model developed in this study. Route surveys will be administered to day use hikers and horseback riders at trailheads as they exit the study area to gather information regard-ing group size, points and time of entry and depar-ture from the study area, travel route, and location and duration of extended stops within the study area. Trip itineraries for overnight visitors, includ-ing campsite locations, will be obtained from man-datory backcountry camping permits. Mechanical trail-traffic counters placed at each trailhead in the study area will be used to obtain counts of the num-ber of groups entering the study area per day. Data collectors will walk portions of the trails within the study area with GPS units to gather information used to calculate hiking speeds. Collection of val-idation data will include the number of other en-counters randomly selected people have with other groups recorded through direct observation.
Results
The data described above will be used to develop a computer simulation model of visitor use with-in the study area. A baseline simulation will be conducted with the model to estimate the current spatial and temporal distribution of day hiking, horseback riding, and backpacking use, as well as the multiple dimensions of inter-group encounters that account for the timing and location of inter-actions among visitor groups. Comparisons will be made between the results of the baseline simu-lation with observation data to assess the validity of model outputs. Additional simulations will be conducted to assess the effects of alternative man-agement policies on a range of encounter-related indicators of wilderness solitude. Policy simula-tions might include tests of the effects of day use trailhead quotas, revised overnight permit quotas, and development of additional trails and/or camp-sites on indicators of wilderness solitude.
Conclusion
This paper will provide insight into the reliabili-ty and validity of computer simulation model es-timates of multiple dimensions of inter-group en-counters in a backcountry recreation setting. This information will improve park managers’ ability to assess the extent to which visitors have opportuni-ties to experience wilderness solitude in the parks’ backcountry and proposed wilderness.
References
Borrie, W. T. & Roggenbuck, J. W. (2001). The dynam-ic, emergent, and multi-phase nature of on-site wil-derness experiences. In: Journal of Leisure Research (33/2), p 202-228.
Dawson, C. P. (2004). Monitoring outstanding opportuni-ties for solitude. In: International Journal of Wilder-ness (10/3), p 12-14, 29.
Hall, T. E. (2001). Hikers‘ perspectives on solitude and wil-derness. In: International Journal of Wilderness (7/2), p 20-24.
Lawson, S. R., Itami, R., Gimblett, H. R. & Manning, R. E. (in press). Benefits and challenges of computer simu-lation modeling of backcountry recreation use in the Desolation Lake Area of the John Muir Wilderness. In: Journal of Leisure Research.
Lawson, S. R., Manning, R. E., Valliere, W. A. & Wang, B. (2003). Proactive monitoring and adaptive manage-ment of social carrying capacity in Arches National Park: an application of computer simulation model-ing. In: Journal of Environmental Management (68), p 305-313.
National Park Service. (1995). A strategic plan for manag-ing backcountry recreation: in Great Smoky Moun-tains National Park. USDI National Park Service.
Stewart, W. P. & Cole, D. N. (2001). Number of encounters and experience quality in Grand Canyon backcountry: consistently negative and weak relationships. In: Jour-nal of Leisure Research (33/1), p 106-120.
Watson, A., Cole, D. N., Turner, R. & Reynolds, P. (2000). Wilderness recreation use estimation: a handbook of methods and systems. In: USDA Forest Service Gen-eral Technical Report RMRS-GTR-56. Rocky Moun-tain Research Station.

Siegrist, D., Clivaz, C., Hunziker, M. & Iten, S. (eds.) (2006). Exploring the Nature of Management. Proceedings of the Third International Conference on Monitoring and Management of Visitor Flows in Recreational and Protected Areas.
University of Applied Sciences Rapperswil, Switzerland, 13-17 September 2006. Rapperswil.
311
Evaluating Spatiotemporal Interactions between Winter Recreation and Wildlife Using Agent-Based Simulation Modeling
on the Kenai Peninsula, Alaska
Aaron Poe1, Randy H. Gimblett2, Michael I. Goldstein3 & Phil Guertin2
1Chugach National Forest, [email protected]
2University of Arizona, [email protected]
3USDA Forest Service, [email protected]
Keywords: Wilderness management, agent-based simulation, recreation behaviour, geographic information systems, spatial/temporal patterns.
Introduction
Concern has been expressed throughout North America regarding the potential for dispersed win-ter recreation activity, such as snowmobiling and helicopter skiing, to disturb wildlife species. Such disturbance occurs at a time when many animals have increased costs of mobility and decreased availability of forage resources, and may be espe-cially detrimental to wildlife populations. At the same time, winter sports enthusiasts are increasing in number and dispersing great distances into nat-ural areas. Throughout the Kenai Peninsula, Alas-ka, the most extensive dispersed recreation occurs in terrestrial habitats during winter (approximately December through April). Land within this area is managed almost exclusively by the Chugach Na-tional Forest (CNF). Dispersed winter recreation-al activities (e.g. snowmobile riding, heli-skiing, cross-country skiing, alpine skiing, snowboarding, and snow-shoeing) occur when deep snow and fro-zen bodies of water allow easier access to back-country areas. Snowmobiles travel dozens of miles into the backcountry from road access points along the Seward and Sterling Highways. Additional-ly, aircraft supported activities now provide win-ter access to a number of remote locations. While some data have been collected at a few discrete lo-cations that serve as access points for winter recre-
ation opportunities (e.g. parking lots), it is doubtful whether these data can be extrapolated to spatial scales meaningful for managing or evaluating po-tential impacts from dispersed winter recreation. While winter can be a stressful season for wild-life if forage resources or quality of thermal cov-er are reduced, these snow conditions may also re-strict movement between habitat patches, increase movement costs and diminish the probability of es-cape from predators. This paper describes a novel technique to quantify the spatiotemporal intensi-ty of human overlap with wildlife on winter land-scapes. Recreation Behavior Simulator (RBSim) was used to model the spatiotemporal distribu-tion of dispersed winter recreationists on the Ke-nai Peninsula and Upper Turnagain Arm area of Alaska. Simulation results were used to measure overlap with habitat for denning grizzly bears and mountain goats.
Methods
Flight survey efforts completed during 1995-1996 estimated five wolverines per 100 km2 for the Ke-nai Peninsula. Subsequent flight surveys, complet-ed during April of 2004 documented wolverine presence throughout much of the KPT but results are neither spatially nor temporally explicit enough

Simulating Recreational Behaviour - on Agents and Environment
312
to describe species distribution relative to winter recreation. Aside from mapping wildlife presence in KPT, spatial patterns of dispersed winter rec-reation also mapped using aerial surveys during the winters of 2004 and 2005. Data were collect-ed by systematic aerial survey of 60 sub-watershed sample units, ranging from 40 to 160 km2 in size. A stratified random selection of sample units and complete area search techniques were used. Path-ways and destinations used by winter recreation-ists and locations of individual recreation parties (snowmobile, pedestrian, and aircraft supported) were mapped by user type. Survey flights occurred on randomly selected days, stratified by weekend vs. weekday, between mid-January and mid-April of 2004 and 2005. In addition, vehicle counts of the 42 plowed parking lots along the Seward high-way system between Girdwood and Seward were conducted between mid-January and mid-April of 2004 and 2005. Each count enumerated the to-tal number of vehicles and trailers per parking lot. Two hundred and seventy-eight recreation user in-terviews were conducted at 42 parking lots along the Seward and Sterling Highway corridor between Girdwood and Seward, Alaska. Surveys were con-ducted during three, 30-day periods beginning in mid-January and continuing through mid-April, 2005. Survey days and locations were selected by stratified random sample.
Results
Using the aerial surveys, questionnaires and park-ing lot counts a model was developed to simulate the spatial and temporal distributions of winter rec-reationists in the Kenai Peninsula and Upper Turn-again Arm area (KPT) using RBSim (Itami 2003). Though RBSim has routinely been used to evalu-ate spatiotemporal patterns of recreation use along linear trail networks and their associated recreation facilities (Gimblett 2002) few attempts have been made to characterize recreation use of areal fea-tures at the landscape scale. Through the applica-tion of RBSim, the temporal nature of dispersed recreation is integrated with spatial pathways used by winter recreationists. Resulting distributions are compared to the spatial descriptions of habi-tats used by mountain goats, grizzly bears and wol-verines. This paper demonstrates the application of
RBSim for predicting the spatial distribution and intensity of winter recreation in an individual wa-tershed within the KPT. It is hoped that the tech-niques used can be employed to evaluate winter recreation throughout the study area.
References
Gimblett, H.R. (2002). Integrating Geographic Information Systems and Agent-Based Modeling Techniques for Simulating Social and Ecological Processes. London.
Itami, R., Raulings, R., MacLaren, G., Hirst, K., Gimblett, R., Zanon, D. & Chladek, P. (2003). RBSim 2: Simu-lating the complex interactions between human move-ment and the outdoor recreation environment. In: Journal for Nature Conservation, p 278-286.

Siegrist, D., Clivaz, C., Hunziker, M. & Iten, S. (eds.) (2006). Exploring the Nature of Management. Proceedings of the Third International Conference on Monitoring and Management of Visitor Flows in Recreational and Protected Areas.
University of Applied Sciences Rapperswil, Switzerland, 13-17 September 2006. Rapperswil.
313
Exploring Spatial Behaviour of Individual Visitors asBackground for Agent-Based Simulation
Karolina Taczanowska, Andreas Muhar & Arne Arnberger
University of Natural Resources and Applied Life Sciences, Austria
[email protected]@[email protected]
Keywords: Spatial behaviour, visitor flows, agent-based simulation, GIS, recreation.
Introduction
Computational modelling and simulation gain in-creased importance as tools supporting planning and management of visitor flows in natural recre-ation sites. The agent-based approach focuses on modelling behaviour of individual artificial agents operating in a virtual environment. In order to set adequate model parameters and to produce reliable outputs, generic assumptions and theories con-cerning human spatial behaviour and recreational experience require validation against the real phe-nomena (Cole 2005, Elands & van Marwijk 2005, Gimblett et al. 1996, Skov-Petersen 2005). With-in this context, the paper addresses the question of how individual visitors use recreational space. The aim of this study was to characterize spatial prefer-ences of individual recreationists and to define vis-itor profiles corresponding to their spatially mani-fested acts. The case study area – the Lobau – is a heavily used, peri-urban recreational site, situated within the city borders of Vienna, Austria and is a part of the Danube Floodplains National Park.
Methods
On-site visitors were interviewed about their out-door activities, visiting motives, length of stay, lo-cal knowledge, etc., at main entrance or intersec-tion points on randomly selected days. As part of the on-site interviews, respondents were asked to mark on a map (1:25.000) the route that they took on that day (Arnberger et al. 2000). The sample size was 532. Additionally, detailed data covering environmental features of the area were collected.
Following, numerous attributes of the routes were derived from the interrelated data. Those com-prised physical features of the environment, route geometry and topology as well as spatial informa-tion provided on site. In the first step, the route at-tributes were explored using basic statistical meth-ods. Next, cluster analysis was applied to identify groups of visitors with similar spatial behaviour. For data storage and analyses GIS, relational data-base management and statistics software packages were used. Figure 1 presents the methodology used in this study.
Results
The results demonstrate the great diversity of routes respondents took or planned to take dur-ing their visit to the Lobau. Reported trips ranged from long-distance loops, following marked and well paved trails, up to the destination-oriented shortcuts leading from a parking place to the near-est picnic or swimming spot. Selected attributes of routes have been presented below, more details can be found in (Taczanowska et al. 2006). In terms
SURVEY• VISITOR CHARACTERISTICS
• ROUTES
DATA BASE (MS Access)
SPATIAL DATA• PATH NETWORK
• INFRASTRUCTURE
SPATIAL ANALYSIS (GIS)
STATISTICAL ANALYSIS (SPSS)
RESULTS
(N = 511)
Figure 1: Methods used for analysing route profiles.

Simulating Recreational Behaviour - on Agents and Environment
314
of distances travelled, the mean value of the route length was 7.0 km. The shortest distance reported in the Lobau was 163 meters long, the longest one: 25.7 km. Generally, two types of route shapes were distinguished: a loop and traverse. The large major-ity of the respondents finished their trips in starting locations, making loops (80%). More than a half of recreationists (52%) did not retrace their paths, however considerably large share of visitors part-ly (32%) or totally (16%) repeated the trail on their way back. In most cases (52%), the respondents followed exclusively the marked trails. About ten percent of the interviewees were predominantly off-trail users. The visitors tended to use prepared and well maintained paths. Gravel and asphalt sur-faces were most willingly used among the Lobau visitors while performing different types of recre-ational activities. Three general types of spatial be-haviour among the Lobau visitors were identified: classical visitors, speedy visitors and off-trail users (table 1). Table 1 presents selected characteristics of the defined types.
This study delivered practical information on how individuals use a recreational setting and contrib-uted to better understanding the human-environ-ment interactions. The analysis revealed that there was no straightforward way to derive information on spatial behaviour from the demographic char-acteristics. The findings of this research might be a valuable basis for creating, testing and calibrating computational models of recreational use.
References
Arnberger, A., Brandenburg, C., Cermak, P. & Hinterber-ger, B. (2000). Besucherstromanalyse für den Wiener Anteil am Nationalpark Donau-Auen, Bereich Lobau. Vienna.
Cole, D. (2005). Future Directions for Simulation of Recre-ation Use. In: D. Cole (Editor), Computer simulation modeling of recreation use: current status, case stud-ies, and future directions, p 3-9. Fort Collins.
Elands, B. & van Marwijk, R. (2005). Expressing recre-ation quality through simulation models: useful man-agement tool or wishful thinking?
Gimblett, H.R., Durnota, B. & Itami, B. (1996). Spatial-ly-Explicit Autonomous Agents for Modelling Rec-reation Use in Complex Wilderness Landscapes. In: Complexity International (3).
Skov-Petersen, H. (2005). Feeding the agents - collecting parameters for agent-based models. In: Batty, S.E. Computers in Urban Planning and Urban Manage-ment (60).
Taczanowska, K., Arnberger, A. and Muhar, A. (2006). Ex-ploring Spatial Behaviour of Visitors in Peri-Urban Recreational Areas - Multi-attribute Analysis of Indi-vidual Route Profiles. In: Schrenk, M. CORP 2006 & Geomulitmedia06, p 315-323.
yp gy pSelected attributes of routes Share of the sample (N=532)
Classical visitors 59 %
Speedy visitors 31 %
Off-trail users 10%
Dominating trail surface gravel asphalt unpaved Dominating trail width middle wide middle / narrow Signage (mean value) 85.1 % 89.9 % 53.8 % Length of route (mean value) 6.6 km 9.1 km 3.1 km
Table 1: Typology based on spatial behaviour of the Lobau visitors.

315

316
Visitor Monitoring Methods, Modelingand Data Management
Andreas Bernasconi & Michael J. Campbell (Chairs)

Siegrist, D., Clivaz, C., Hunziker, M. & Iten, S. (eds.) (2006). Exploring the Nature of Management. Proceedings of the Third International Conference on Monitoring and Management of Visitor Flows in Recreational and Protected Areas.
University of Applied Sciences Rapperswil, Switzerland, 13-17 September 2006. Rapperswil.
317
Monitoring Trail Use with Digital Still Cameras: Strengths, Limitations and Proposed Resolutions
Michael J. Campbell
University of Manitoba, Canada
Keywords: Monitoring, digital camera, data management, activity identification.
Introduction
The monitoring of public use of natural areas has received increasing interest over the past 2 decades as managers of protected areas become concerned about visitor use types, levels, and in-tensity along with the accuracy and validity of their visitor use information. It has been suggest-ed that this information is inadequate and often based upon the estimates or best guesses of area managers and park wardens. In order to deal with this lack of visitor use information a number of researchers have begun to examine and assess a variety of means of collecting visitor use data. Watson et al (2000) describe a range of approach-es that have been employed to understand visitor use characteristics including estimation, visitor observation, registration, permits, surveys, me-chanical counters, 35 mm camera triggered at in-tervals or by activity, and more recently video monitoring (Arnberger et al. 2003, 2005). Digital photography is another recent development that has seen little application in visitor monitoring but may hold promise to further the science of visitor monitoring in natural areas. Understand-ing the limits and benefits of the various methods is essential for informed management.
The changing structure of Canadian society and its influence on the use, appreciation and under-standing of Canada’s natural heritage presents a significant challenge to Parks Canada (Parks Canada 2005). In addition, there is little empiri-cal data detailing the impacts these changes are having on the use of natural areas. Parks Cana-da has recognized these issues and is concerned that the changing cultural make-up of Canada
coupled with a decrease in visitation will result in reduced support for parks and protected areas (Parks Canada 2005). Given its mandate and the desire to facilitate visitor experience such that Canadians appreciate their natural heritage and develop a culture of conservation (Parks Canada 2005) it is imperative that Parks Canada under-stand the patterns of use in its various parks. In-formal and anecdotal observations by researchers and managers suggest that day use of backcoun-try trails and facilities is increasing and may be placing unknown stress on park resources. Mon-itoring of visitor use of natural areas is essen-tial for effective management of parks and natu-ral areas and in many cases managers rely on best guesses to estimate use (Watson et al. 2000).
This project evolved from an impact monitoring study developed in response to concerns that in-creasing use of the backcountry trails and camp-sites in Riding Mountain National Park might be negatively affecting the parks ecological in-tegrity. Working in consultation with the park, researchers at the University of Manitoba de-veloped and implemented a backcountry impact-monitoring program during the summer of 2001 (Campbell & MacKay 2004, MacKay & Camp-bell 2004). In excess of 50% of all backcoun-try respondents to the monitoring survey were day users, despite the fact that overnight users were strategically sampled through the use of the backcountry reservation system (Campbell et al. 2001). This mirrored results from other Canadi-an National Parks that suggested overnight use of the backcountry had peaked in 1979 (the year the median baby boom was aged 21) and had de-clined slightly since (Page et al. 1996). Clear-

Visitor Monitoring Methods, Modeling and Data Management
318
ly problems for managers of Canadian National Parks were different than those of their American counterparts where crowding and overuse are of-ten significant issues1.
Methods
Information regarding day use of backcountry trails can be difficult to capture as registration is not typically mandatory, voluntary registra-tion boxes have unknown reliability, and inter-cept surveys are labour intensive and costly. In-creasingly technology has been employed in an attempt to clarify use patterns in parks and nat-ural areas. Infrared (IR) trail counters have had limited success as they do not differentiate be-tween humans and wildlife, thus recording false readings. 35 mm cameras linked to IR sensors al-low researchers to distinguish between wildlife and humans but film-based systems are limited to 36 exposures and therefore require significant maintenance. In addition, film based systems can incur significant costs for film and development. Digital cameras used in conjunction with IR sen-sors may be able to overcome some of these con-cerns but still remain a relatively untested tech-nology in the field.
Over the course of the summer seasons in 2004 and 2005 several digital camera/passive infra-red (IR) sensor units were installed along back-country trails in Riding Mountain National Park in Canada. Each unit was self contained and en-closed in a waterproof housing. IR sensors were calibrated over the course of 48 hours by observ-ers and set to low sensitivity to reduce the likeli-hood of being triggered by birds and small mam-mals. Digital cameras were set in standby mode to reduce battery drain and calendars and clocks set to the appropriate time. The cameras were also set to the lowest resolution possible to: 1) maxi-mize the number of events that could be record-ed; 2) speed the refresh rate of the camera and; 3) reduce the likelihood that individuals could be recognized in the resulting images. In addition, lenses were blurred to further reduce the likeli-hood of identification of individuals. Each digi-
1 Cole (1997) suggests that less attention be paid to already crowded sites and more attention should be focused upon lees popular areas.
tal camera contained a 512 MB or 1 GB memory card capable of storing 3346 or 6690 images re-spectively.
In the first year of the study cameras were placed on 3 backcountry trails. In the second year of the study cameras were place on 4 backcountry trails and 2 interpretive trails (at the request of the park). Placement of the cameras was critical to their accuracy and effectiveness and represented the most challenging and time consuming com-ponent of unit setup.
Results
A summary of the results of the monitoring pro-gram is presented in table 1 and is intended to be illustrative of the type of information that can be gleaned from the system employed here. As such, the significance of the results to park managers is not the focus of this discussion. The use of digital still cameras linked to passive infrared sensors can provide managers of parks and natural areas with a cost effective and accurate means of evaluating the spatial, temporal and activity type of use occurring on park trails.
The digital camera sensor units employed in the Riding Mountain Study allowed researchers to identify numbers of visitors, group size, direction of travel, the type of activity engaged in, day use vs. overnight use (evidence of backpacks) and in some cases the amount of time people spent on the trail. When compared to simple mechanical coun-ters, combining the digital camera with the coun-ter not only provides greater information and de-tail but also can be used to assess the accuracy of the counters. That is the image captured will in-dicate the size of the party or if there was indeed an event. When compared with counters or sen-sors linked to 35 mm camera advantages include ease of data management, lower maintenance costs in both time and money, and detailed information about trail use.
A primary benefit of digital cameras linked to pas-sive infrared sensors lies in the attribute file asso-ciated with each digital still image. Using DOS, a directory file of the attributes is created and saved as an RTF file. The resulting RTF file is then im-ported into Excel where temporal data can be ma-

Visitor Monitoring Methods, Modeling and Data Management
319
nipulated and analyzed. This tab-delimited file can then be exported to SPSS or other similar pro-grams for further analysis. While 35 mm print film can also record time and date of events the data must be manually entered resulting in increased costs and time. Similarly, 35 mm cameras linked to trail counters do not provide a single merged file. In the case of digital images blank images can be eliminated from the database (stored for later review) and the data files remain associated with each image, greatly reducing the drudgery that is often associated with monitoring work (Gardner and Campbell 2002).
In addition to providing ease of manipulating time and date data, the addition of a digital camera to a passive sensor provides more information about the nature of trail activities. In the Riding Moun-tain study researchers were able to determine the ratio of, and type of activity (hike, bike, horse), the peak times of these activities and in some cases the length of time people spent on the trail. Some au-thors have suggested that Passive IR sensors can be triggered by non-human events such as snow,
cloud cover etc resulting in lower accuracy than for active IR or Radio frequencies (Swedish En-vironmental Protection Agency 2000). By adjust-ing the sensitivity of passive IR sensors and com-bining them with digital photos these limitations can be minimized. When positioned correctly, the resultant image provides evidence of whether the sensor was triggered by a trail event or other fac-tors. Generally, however the effect of environmen-tal triggers is evident in the images as fog, cloud etc and data sets are easily cleaned. In addition, this overcomes the most significant limitation of Radio and active IR Beams, that of hikers traveling side-by-side and resulting in only a single count.
Arnberger (2005) noted that at low use levels, counting (by researchers) was more accurate than video observation data. However, in very large low use areas with many entry and exit points such as Riding Mountain National Park (and many other Canadian National Parks) the use of personnel to perform counts is, except in rare cases, prohibitive-ly expensive. As noted previously counters alone (whether, Passive IR, Active IR, radio beam, pneu-
Trail Number ofevents*
Number of individuals
Average Party size
User type Peak activity
%Day use
North Escarp-Ment1
242 88 2.1 Hike 95% Bike 5%
60% 10:00 – 14:00
92
MoonLake2
88 49 2.5 Hike 90% Bike 10%
58% 10:00 – 14:00
100
Brule 542 266 2.0 Hike 92% Bike 8%
51% 10:00 – 14:00
100
Grey owl 117 19 1.9 Hike 70% Bike 30 %
55% 10:00 – 14:00
100
Central2 1127 234 2.5 Hike 56% Bike 36% Horse 8%
60% 10:00 – 14:00
97
Ominik2, 3 622 888 2.3 Hike 99% Bike 1 %
52% 10:00 – 14:00
100%
1 Monitor placed orthogonal to trail assumed many cyclists missed 2 Monitor placement ideal and calibration suggests `98% accuracy 3 Interpretive trail near townsite *Events refer to total number of times the camera was triggered, irrespective of whether there was activity captured or not. Note that in some situations (e.g. Central trail) individuals lingered in front of the camera for some time resulting in multiple counts. However the images allowed this to be easily rectified.
Table 1: Trail use counts, party size, type and timing based upon digital camera sensors.

Visitor Monitoring Methods, Modeling and Data Management
320
matic or other) require delicate calibration to dif-ferentiate between user types (eg. horse, bike) and in many cases differentiation is impossible. Fur-thermore, in low use areas wildlife may be a sig-nificant portion of trail activity. Film based camer-as linked to active IR sensors have been employed and shown to be very effective and highly accurate. However, the costs associated with purchasing and developing film can be significant and when cou-pled with the limited storage capacity and addition-al data management costs, make film based sys-tems a poorer choice.
All trail monitors require some degree of mainte-nance. Maintenance includes ensuring the units are functioning properly, monitoring data capacity and ensuring adequate power (battery life). Contain-ing the sensor and the camera in one sealed unit thus protecting the sensitive electronics from the elements minimized maintenance of the units em-ployed in this study. In addition the single sealed unit ensured that there was no need to connect sen-sors to cameras with external cables2. Given the ad-vances in digital storage media (512 MB up to 3000 images, 1 GB, up to 6000 images), the fact that im-ages were collected at the lowest possible resolu-tion, and the relatively low levels of use in RMNP, data capacity was not an issue. The number of events and to some degree ambient air temperature impacted battery life. However, even in the most extreme of cases (high use and low temperatures – a rare condition in RMNP) battery life averaged 5-6 weeks. As a result, when batteries were replaced every 3-4 weeks no data was lost. Finally, mainte-nance involved checking to ensure that vandals and or wildlife did not damage the units. Despite the fact that most of the units were in plain view, none were stolen, though some were moved and this re-sulted in lost data. In addition, several units were damaged by wildlife, and one irreparably so. This is discussed further in limitations below.
LimitationsDespite the numerous advantages of using digital cameras linked to passive infrared sensors the sys-tem is not without its limitations. The most signifi-
2 In comparative studies undertaken in 2004, active infrared sensors linked to 35mm cameras were frequently damaged by wildlife when connecting cables were chewed through. Cables were replaced 5 times over the course of 8 weeks and as a result very little data was collected.
cant challenge in employing the current generation of digital cameras and IR sensors is the time lag be-tween the camera emerging from standby and the taking of the picture. The units employed in this study experience a nominal delay of between .8 and 1.5 seconds between the sensing of an event and the capture of an image. In a number of cases this meant that the camera was triggered but no image was captured thus resulting in decreased accuracy. In general, this type of underreporting was noted when cyclists moving at speed passed the camera before an image could be captured.
The simplest way of resolving this issue is to en-sure that the camera unit is optimally placed. This involves ensuring the unit is placed at a bend in the trail on level ground and that the trail user is mov-ing away from or towards the unit rather than or-thogonal to it. This placement has the added advan-tage of being able to capture large groups strung out along the trail thus providing more accurate counts. The negative consequence of this solution is that it leaves the unit much more exposed and visible and therefore increases the potential for vandalism and theft. Given that the units were secured to trees with straps rather than some form of locking mech-anism, this is a significant concern.
A second approach applied in 2004 is to separate the sensors from the camera unit so that the delay from sensor trigger to image capture can be accommo-dated for. This setup allows somewhat more flexi-bility and facilitates the concealment of the camera, however it also requires external wiring to connect the sensor to the camera and more time to setup and calibrate. Given there are now three pieces of equipment, it can be more difficult to conceal and maintain. External wiring should be avoided if at all possible as wildlife has a tendency to chew through the cables. Finally advances in digital photography may provide a solution. Digital SLR cameras are currently on the market featuring startup to image capture lags (from power off to shot) of less than .2 seconds and lower lags from standby. Unfortu-nately, at present these units are also quite expen-sive and require expensive proprietary batteries. In addition, the best cameras for these purposes tend to be simple with relatively few functions and the trend has been towards more complicated instru-ments.

Visitor Monitoring Methods, Modeling and Data Management
321
While for the most part the units required main-tenance checks every three weeks, on a few occa-sions the units were damaged or moved by wild-life and rendered ineffective for periods of time. Bears in particular were attracted to the units when new and would rub against them and occasional-ly chew on the housing. While only one unit was significantly damaged, the units were moved from their optimal position and as such failed to regis-ter trail events. It is worth noting that in the second year of the study the only units affected by wildlife were the new units indicating that, perhaps, there is some scent associated with the cases or electron-ics that is attractive to wildlife.
Conclusion
Digital cameras linked to passive infrared sensors have the potential to provide managers of parks and natural areas with valuable and detailed in-formation regarding visitor use of the areas in a manner that is both cost effective and facilitates ease of data management. In order to capitalize upon the potential benefits of this new technolo-gy it is imperative that the units be properly cali-brated and more importantly properly positioned. Based upon two years of study in Riding Moun-tain National Park in Manitoba, Canada the most effective configuration is one that places the cam-era in an exposed location oriented parallel to vis-itor movements and as such it must be placed in secure housings and locked to posts or poles. The first iteration of this design is currently being em-ployed in Riding Mountain National Park and to date has been effective in dealing with the limi-tations identified above. Less intrusive and more visually appealing installations are being designed for use in 2007, as is the possibility that linking digital cameras with radio beam may allow for a more concealed camera placement. Finally digital SLR cameras are being investigated as possible so-lutions to the issues of time lags between the sens-ing of an event and camera firing.
ReferencesArnberger, A. & Hinterberger, B. (2003). Visitor monitor-
ing methods for managing public use pressures in the Danube Floodplains National Park, Austria. In: Jour-nal for Nature Conservation (11), p 260-267.
Arnberger, A., Haider, W. & Brandenburg, C. (2005). Eval-uating visitor-monitoring techniques: a comparison of counting and video observation data. In: Environmen-tal Management (35/4), p 1-12.
Banff-Bow Valley Study (1996). Banff-Bow Valley Study: at the crossroads. Technical report of the Banff-Bow Valley Task Force. Ottawa.
Campbell, J. M. & MacKay, K. J. (2004). The role of peo-ple, place and process in implementing a successful backcountry monitoring program: the case in Riding Mountain National Park. In: Environments (32/1), p 31-45.
Campbell, J.M., MacKay, K.J. & Steiner, C. (2001). Recom-mendations for implementing an integrated backcoun-try monitoring strategy at Riding Mountain National Park, HLHPRI Technical Report HLHPRI091B.
Cole, David N. (1997). Recreation management priorities are misplaced--allocate more resources to low-use wilderness. In: International Journal of Wilderness (3/4), p 4-8.
Gardner, J. & Campbell, J.M. (2002). A century of research in Banff and surrounding national parks. Bondrup-Neilsen, S. & Munroe, N.W.P. (eds.) Managing pro-tected areas in a changing world. Proceedings of the 4th International Conference on Science and Manage-ment of Protected Areas (SAMPAA IV). Waterloo, ON. May 14-19, 2000. p 234-243.
MacKay, K. J. & Campbell, J. M. (2004). An integrated ap-proach for measuring environmental impacts in na-ture based tourism and outdoor recreation settings. In: Journal of Tourism Analysis (9/3), p 141-152.
Parks Canada (1996). Riding Mountain National Park Man-agement Plan. Ottawa.
Parks Canada (2005). Response of the Minister of the en-vironment to the recommendations made at the third minister‘s roundtable on Parks Canada. Ottawa.
Watson, A.E., Cole, D.N., Turner, D.L. & Reynolds, P.S. (2000). Wilderness recreation use estimation: a hand-book of methods and systems. USDA General Techni-cal report RMRS-GTR-56.
Siegrist, D., Clivaz, C., Hunziker, M. & Iten, S. (eds.) (2006). Exploring the Nature of Management. Proceedings of the Third International Conference on Monitoring and Management of Visitor Flows in Recreational and Protected Areas.
University of Applied Sciences Rapperswil, Switzerland, 13-17 September 2006. Rapperswil.
322
Going Ahead: From Visitor Monitoring to Recreational Use Monitoring – The Example of the EU Regional Recreation Area
Berchtesgaden National Park / Salzburger Kalkhochalpen
Sabine Hennig
Friedrich-Alexander University Erlangen-Nuremberg, Germany
Keywords: Visitor monitoring, visitor management, recreational use, stakeholder, nature and landscape compatible recreation activities, visitor counting, recreation infrastructure, large protected areas, national park regions, work-flow.
Abstract: Recreation is an important issue for protected areas and especially for national parks where visitor numbers are growing. This can be seen as a result of the increasing interest in nature- and landscape based recreation. Conse-quently, there is a rising demand to manage this kind of human use accordingly. Therefore, measures must be based on well-founded data as well as widespread knowledge and understanding of recreation. Associated investigations must not only focus on visitors. Interest must also inhere to infrastructure, nature- and landscape compatible activity forms, and stakeholders. Another aspect is the need to incorporate protected areas in a larger planning framework. All too of-ten national parks are regarded as something apart from the adjacent lands. But particularly recreation in park areas cannot be seen separately from the surroundings. By integrating all data regarding to recreation in databases and GIS, persons responsible for management-decisions can gain a comprehensive impression of this object. An according mon-itoring-system considering feasibility and continuation as well as the (future) workflow is worked out in an exempla-ry manner within the scope of the InterReg-IIIa project “EuRegional Recreational Area Berchtesgaden National Park/Salzburger Kalkhochalpen”.
Introduction
Recreation is one of the main purposes of national parks. Since years the interest in nature- and land-scape based recreation increases. As a result visi-tor numbers are still growing, especially in Central European national parks. Consequently, a rising demand to manage this kind of human use accord-ingly can be observed in protected areas. To com-ply with this, adequate measures, concepts and guiding principles must be developed. They should be based on well-founded data and information as well as widespread knowledge and understanding about recreation, its dependencies and coheren-cies. However, corresponding studies of recreation focus mainly on visitors so far: Today investiga-tions in form of visitor monitoring (e.g. numbers, characteristics, behaviour, and expectations) are an essential component of proactive and adaptive
park management. In order to support visitor man-agement, which at present faces more and more visitors as well as an increasing number of forms of activity (e.g. ski-hiking, snowshoeing, nordic walking), it must be pointed out that not only visi-tors must be a matter of investigation, but also the whole object of recreation as a further comprehen-sive conception of park visits and visitors. Even though, literature research clarifies the nu-merous different aspects of relevant data and in-formation as well as methods (compare e.g. Mu-har, Arnberger & Brandenberger 2002, Hennig & Laube 2005), unfortunately, recreation and recre-ational activities are generally poorly understood and poorly documented (see Payne et al. 2004). It is marked by estimations and the absence of reli-able information. Furthermore, almost all aspects (e.g. methods, data, and concepts) relate to visitors and not to the abstract object of “Recreation”.

Visitor Monitoring Methods, Modeling and Data Management
323
Moreover, data and information regarding to visi-tors or recreation are often not well integrated in existing information structures and systems like da-tabases and GIS (Giles 2003). However the digital availability of data and information is an important issue. This facilitates a comprehensive insight into recreation to persons responsible for management-decisions.In consequence, different demands result: First, na-ture and landscape compatible recreation in nation-al parks must be analysed to crystallize and model its key-components. Second, an adequate infor-mation system must be designed, to integrate and bring together all relevant data and information. This is done in an exemplary manner for the Ger-man Berchtesgaden National Park. The main pur-pose is to end up with a recreational use monitor-ing system which can be seen as a more widespread visitor monitoring. This way, it should be possible to give answers continuously to different questions concerning recreational use within the park area.
Study area focussing recreational useBesides nature protection, research, and environ-mental education the opportunity to recreation is one main objective in the German Berchtesgaden
National Park. The Berchtesgaden National Park (IUCN-Category II) is the only German alpine na-tional park. It borders by approximately 70 km (2/3 of its borderline) the Austrian federal state Salz-burg. The Austrian - German region is also estab-lished as EuRegio Salzburg / Berchtesgadener Land / Traunstein. Figure 1 shows locality, regional con-text and bordering situation of the Berchtesgaden National Park and its surroundings.In general, tourism and recreation are significant aspects in the region. Since the year 1880 the area can be characterized as a traditional holiday loca-tion. Consequently, recreation is also of major con-cern for the Berchtesgaden National Park. But right now the description and evaluation of recreation-al use inside the park is only based on little infor-mation (see Hennig & Laube 2005) and some (es-timated) visitor numbers. For instance in 2002, the visitor number per year was calculated by charge-able public parkings located outside the park area and maintained by the municipalities bordering the protected area. The thus gained visitor num-ber refers to about 1.2 million people per year vis-iting the Berchtesgaden National Park. Beside this number, there exists neither quantitative nor tem-poral (e.g. dependency on daytime or season, dura-tion) or spatial (e.g. spatial distribution in the park
Figure 1: EuRegional Recreational Area Berchtesgaden National Park / Salzburger Kalkhochalpen.

Visitor Monitoring Methods, Modeling and Data Management
324
area) information according to distinct recreation activities within the park area. Moreover visitors entering the German protected area from Austria are at present not registered at all. Even though infrastructure is an essential element to carry out the different forms of activity, except for some se-lective data about facilities sited inside the park area (e.g. trails, mountain huts), no data about in-frastructure is available, especially in the directly bordering Austrian area. Thereby, it is difficult to get a realistic assessment about the status of recre-ation within the park area.
To meet demands concerning the survey of recre-ation mentioned above, much-needed data and in-formation is collected and made available by a monitoring system particularly designed for the Berchtesgaden National Park. This happens by the InterReg-IIIa project “EuRegional Recreation-al Area Berchtesgaden National Park / Salzburger Kalkhochalpen” (duration: May 2005 - December 2006).
Modelling recreational use
Usually, monitoring is defined as information or data sampling which is repeated in certain inter-vals of time and serves certain scientific and/or management purposes. It differs from pure ob-servation or surveys due to its repeated and rep-licable character that enables comparison over time and the evaluation against a target. Defini-tion of investigation purpose and object deter-mines the monitoring system in proceeding and methods. The intention of the said project is to enable the persons responsible for the field of recreation within the park management to de-sign and apply guiding principles, management concepts and measures. Hence, a fundamental understanding of nature and landscape based recreation in the Berchtesgaden National Park is essential. Besides the existing estimation of the visitor number per year this requires detailed data and information about recreation:
What kind of summer und winter activities can be distinguished?
How many visitors perform what kind of ac-tivity?
Where do different activities take place?
Which infrastructure is essential to perform the distinguished main summer and winter activi-ties?
What kind of infrastructure is available to guide or inform visitors?
What kind of infrastructure categories can be distinguished in general?
How many visitors use the different kinds of in-frastructure elements?
Is the infrastructure supply consistent to the vis-itor number and their activity forms?
By which organisations or persons is the infra-structure supported and maintained?
Which organisations or persons promote recre-ation activities within the park area?
By which organisations or persons is what kind of visitor number and information available?
Which infrastructure located outside the nation-al park plays an important role to enable vis-its to it?
etc.
To respond to the numerous dependencies and co-herencies mentioned by these questions it gets ob-vious that one must focus not only on visitors but on the comprehensive object for analysis “Rec-reation”. Therefore, it is helpful and necessary to split the object into its relevant aspects: recreation-al use can be described by the number of persons executing different forms of activity depending on, and therefore using the available infrastruc-ture within the scope of a certain spatial and tem-poral context. Furthermore, recreation depends on specific “rules” e.g. weather dependency, person-al condition, and season. Finally, recreational ac-tivities and infrastructure must always be seen in the context of organisations or persons responsible for maintenance and support. By this assumption, a model of the abstract object for analysis “Rec-reation” is generated. It permits us to gain insight into structures and functions of recreation. Gener-ally, the model is based on the entirety of identi-fied, available and collectable information, depen-dencies and coherencies concerning recreation. To

Visitor Monitoring Methods, Modeling and Data Management
325
model “Recreation” for the case of the Berchtes-gaden National Park four information-components or categories were defined (see figure 2):
1. park visitors (e.g. numbers, characteristics, ac-tivities),
2. nature- and landscape compatible activities (e.g. spatial and temporal use patterns, demands on in-frastructure),
3. infrastructure (e.g. depending on activities, re-sponsibility to stakeholders),
4. stakeholder (e.g. infrastructure, offers).
Adequate methods of monitoring must be applied in an applicable way focussing on each singular “building-block” of the model “Recreation”. Data is collected regarding to the categories’ specific el-ements. All data – geodata as well as attribute data - is managed by the database RDBMS Oracle-XE- and the GIS ArcGIS on the basis of individually implemented database structures. In the following sections the named categories will be examined more closely.
Park visitors
A rising need for park management to know more about park visitors as key component of recreation is indisputable. Important are for example visitor number, undertaken activities, and temporal and spatial use patterns.
For the Berchtesgaden National Park visitor data is gathered by the standard methods of visitor mon-itoring listed for example by Muhar, Arnberger & Brandenburg (2002): cameras in combination with
time-lapse videos, personal counting and inter-views etc. Data collection takes place inside and outside the park. All locations of data gathering are situated in exclusive positions characterized by its significance to recreation inside the protected area.
In addition, data related primarily to visitor num-bers are available through countings by parking tickets, by ticket sales of the Jenner-Bergbahn (ca-ble cars) and the Königssee-Schifffahrt (boat cruis-es) and by overnight stays at the numerous alpine huts like e.g. Carl-von-Stahlhaus, Kärlingerhaus, Watzmannhaus. Depending on the method and in-stitution by which visitor data are collected, data are available by different levels of aggregation (e.g. time: hour, day, month, year; grouped by ac-tivity). As data management occurs by the RDBMS Oracle-XE, the differently aggregated data can be compiled and made comparable by adequate data-base structures (e.g. tables, constraints, views, ref-erences). Thus, it is possible to carry out statistical analysis to get a temporal overview. Further on, for a spatial survey the (statistically elaborated) data are linked to geodata representing the existing in-frastructural elements using GIS.
Nature and landscape compatible ac-tivities
In the Berchtesgaden National Park only forms of activity compatible with nature and landscape are tolerated. In the mountainous environment of the “EuRegional Recreation Area Berchtesgaden Na-tional Park / Salzburger Kalkhochalpen”, the main recreational activities are
Figure 2: Aspects, components or respectively categories of the model “Recreation”.

Visitor Monitoring Methods, Modeling and Data Management
326
during the summer season: mountain biking, hiking, promenading;
during the winter season: promenading, ski hik-ing, sledging and snowshoeing.
Literature research, expert interviews and obser-vations provide insight into the forms of activity. Spatial requirements of the distinct outdoor activ-ity focussing infrastructure, nature and landscape as well as temporal and social use patterns must be noticed. The corresponding information is includ-ed in the database linked to data of infrastructure and visitors. Especially for winter activities like ski hiking, and snowshoeing, temporal use patterns in the context of season and day-time are important (core-time of activities: midwinter - during noon, early spring – during morning hour) in respect e.g. to the mating-season of the grouse family.
Infrastructure
The exercise of nature and landscape based rec-reation activities requires infrastructure. Only through infrastructure can recreation activities take place. Therefore, identification and character-isation of such elements is an important aspect to survey recreation. At present ten classes of infra-structural elements are defined for the study area:
parking lots,
trails (for hiking, biking, ski-hiking etc.),
bus stops,
visitor information centres,
mountain pastures (with food and beverage ser-vice),
mountain huts,
guiding elements,
environmental education elements,
benches, tables, picnic-supply and
natural phenomena like lookout points, “geo-tope”, cascades etc.
Not only infrastructure located inside the park area is relevant. To gain insight into recreational use in the national park, infrastructure situated outside the park area must also be considered: Most hiking, biking or skiing trails start from outside the pro-
tected area. The chargeable public parking lots are all located outside the park area. In most cases they are the starting point for park visits. Therefore, both - in the national park and in the surroundings - in-frastructure elements get mapped by GPS and by the use of digital aerial photographs. The surveyed spatial data is managed by GIS (ArcGIS) togeth-er with the spatial dependencies between the infra-structure elements: e.g. parking as starting point of a trail; huts as end points of trails, information ele-ments accompanying a trail. Relevant attributes to the different infrastructure elements in context with recreation activities (biking, skiing, hiking, snow-shoeing etc.), the demands of usage (e.g. duration, weather, condition, opening time), the organisa-tion responsible for maintenance (e.g. public park-ings by municipalities, trails by alpine associations or the park administration) are managed by a da-tabase (RDBMS Oracle-XE). To handle the data accordingly a particularly database structure was designed. Visitor numbers and characteristics are - after being elaborated statistically - linked to the in-frastructure elements.
Stakeholders
Besides the state park administration, regional and local aspects affect the park area. Therefore, local and regional stakeholders are of importance: As mentioned before, stakeholders support and main-tain infrastructure inside as well as outside the park. Also, numerous and various data and informa-tion relevant to tourism and recreation within the study area are available by different stakeholders (e.g. municipalities, alpine associations, and tour-ism agencies). But unfortunately, co-operation be-tween individual stakeholders (including although the park administration) as well as communication or exchange regarding data and information, bare-ly exist.
Following regional planning, land use planning, tourism concepts, nature conservation strategies etc. all stakeholders within the region and with rel-evance for recreational use in the park are identi-fied and characterised. Their contact-information, field of activity (e.g. tourist offers, infrastructure), availability of visitor data (mainly visitor num-bers), their (hierarchical) organisation and depen-dencies as well as their spatial activity area (e.g.

Visitor Monitoring Methods, Modeling and Data Management
327
municipal area, planning area) etc. is held by par-ticular tables in the database RDBMS Oracle-XE and GIS (ArcGIS).
Figure 3 illustrates the general conception of the (computer-based) integration of data and informa-tion according to the four “building-blocks” and categories of the model “Recreation” visitors, in-frastructure, activities, and stakeholder.
Conclusion and future prospects
Monitoring of recreation is more comprehensive than visitor monitoring and is more suitable to ful-fil the present needs concerning the management of recreation within national parks. The combination of data according to visitors, infrastructure, activ-ity forms, and stakeholders, its consequent ongo-ing observation as well as progressive data input in database and GIS provides a good basis for sus-tainable management measures. As nearby areas generally influence protected areas by their rec-reational offers, infrastructure elements, and as a source of visitors - being residents or being tourists - entering the park for recreational reasons, grow-ing demand on data and information concerning the neighbouring area is evident. The comprehen-
sion of a national park region instead of the sepa-rately treated, island-like national park is essential - particularly in Central Europe. Therefore, one in-tention of monitoring is to gain a sustainable and boundless awareness in this German-Austrian rec-reational area. By the combination and analysis of different spatial and attribute data (e.g. social net-works, spatial analysis methods etc.) for the Ber-chtesgaden National Park and the bordering area this can lead to a zoning of the surroundings. The adjacent land can be categorized by is importance to the field of recreation succeeding in the park area. It is therefore important, as monitoring activ-ities concern the protected area and its surround-ings, that management measures also regard the park area and the adjacent lands. In consequence, population, stakeholder and park administration should agree on discussions and co-operation on management solutions – following the monitoring results. But particularly in Europe an exigency to integrate protected areas into larger scopes exists. All too often protected areas are regarded as some-thing apart from the adjacent land and the border-ing regions. Nevertheless, especially in context of recreation, national parks cannot be seen separate-ly from the surroundings (compare Hannemann & Job 2003).
Figure 3: General database conception.

Visitor Monitoring Methods, Modeling and Data Management
328
Due to the border situation with Austria and the prospect of an Austrian nature park neighbour-ing the Berchtesgaden National Park, to be estab-lished in 2006, the demand for a monitoring sys-tem crossing the park borders is even more evident. This gets strengthened by the guiding principles of the EuRegio Salzburg / Berchtesgadener Land / Traunstein which the Berchtesgaden National Park and its surroundings are part of. Generally, in Cen-tral Europe research on protected areas in border-ing situation is an important issue. Investigations are urgently needed for borderland protected areas. Activities in this field are poorly established, but they must increase. A good possibility of approach concerning this problem can be seen in this ongo-ing project and its focus on the border situation of the Berchtesgaden National Park.
References
Giles, W. (2003). GIS Applications in Tourism Planning. www.cnc.bc.ca/gis/Documents/340TourismTermPaper.pdf.
Hannemann, T. & Job. H. (2003). Destination “Deutsche Nationalparke” als touristische Marke. In: Zeitschrift für Tourismus (58), p 6-17.
Hennig, S. & Laube, M. (2005). Besuchermonitoring in Na-tionalparken. Eine Bestandsaufnahme in Deutschland, Österreich und der Schweiz. In: Standort – Zeitschrift für Angewandte Geographie (4/2005), p 199-204.
Muhar, A., Arnberger, A. & Brandenburg, C. (2002). Meth-ods for Visitor Monitoring in Recreational and Pro-tected Areas: an Overview. In: Arnberger, A., Bran-denburg, C., Muhar, A. (2002)(eds.). Monitoring and Management of Visitor Flows in Recreational and Protected Areas. Conference Proceedings. Bodenkul-tur University Vienna, Austria, January 30 – February 02, 2002. Vienna.
Payne, R.J., McIntyre, N., Yuan, M. Moore, J., Bradford, L. & Elliott, S. (2004). Recreation Experience Preferen-ces and Activity Profiles in a Crown Forest Landscape in Ontario, Canada. http://www.metla.fi/julkaisut/workingpapers/2004/mwp002.html.

Siegrist, D., Clivaz, C., Hunziker, M. & Iten, S. (eds.) (2006). Exploring the Nature of Management. Proceedings of the Third International Conference on Monitoring and Management of Visitor Flows in Recreational and Protected Areas.
University of Applied Sciences Rapperswil, Switzerland, 13-17 September 2006. Rapperswil.
329
Application of a Remote Controlled Ultralight Air Vehicle (UAV) for Park Management and Visitor Monitoring
Alexander Krämer1 & Hans-Peter Thamm2
1German Sport University Cologne, [email protected]
2Centre for Remote Sensing of Land Surfaces, [email protected]
Keywords: High resolution remote sensing, visitor monitoring, park management, change detection.
Introduction
For efficient park management it is a necessity to have detailed information about the natural-spatial environment of the park, their changes as well as the amount, behaviour and the spatial distribution of the visitors in a high spatial and temporal resolu-tion. From remote sensed images some of these im-portant information concerning vegetation and veg-etation dynamics, animal tracks, erosion etc. can be derived. But the “classical” remote sensed images have limitations. Satellite images often don’t have the desired spatial and temporal resolution and the acquisition of aerial photos is expensive.
Also data about the frequency and spatial behav-iour of visitors are necessary to develop manage-ment strategies. For visitor monitoring numerous techniques exist. A good description of different methods can be found in Muhar et al. (2002). He stated that the use of aerial imagery as a monitor-ing method is limited due to its high cost and the fact that only single snapshots of recreational use are taken.
Methods
The remote controlled UAV (ultralight air vehicle) can be a solution for these problems. It is compar-atively cheap, light, easy to handle and to fly and can provide aerial photos in a very high spatial res-olution and in the desired temporal resolution.
It is a remote controlled air vehicle with a 5.5 hp strong 2-stroke engine and a weight of approxi-mately 6 kg. A payload of 5.5 kg can be carried.
The frame of the UAV hangs at a special type of parachute which serves as a wing (figure 1). This allows a slow and stable flight and also guaran-tees high safety in case of a failure of the motor. The sensor carrier is gimbal-mounted. Different sensors (digital cameras, video cameras, multi-spectral cameras, etc.) can be mounted. The in-stantaneous field of view is transmitted to the operators an can be seen on special goggles or a (laptop) screen. Pictures are taken via remote control. The actual position of the UAV which is taken by a GPS is also transmitted to the op-erator. A maximum flight speed of 25 km/h can be reached. This restricts the use of the UAV for wind conditions lower than 6 m/s. A maxi-mum flight height of 4500 m and an operation distance up to 5 km are possible. The length of the runway is dependant on the wind conditions and varies between 5 m and 25 m. A detailed de-scription of the UAV and its applications can be found in Thamm and Judex (2006).
Results / Conclusion
Some of the advantages and disadvantages of the UAV are listed in table 1.
Some examples of the successful use of the UAV and its contribution to park management and vis-itor monitoring will be presented:
Contributions to park management in the Pen-jari national park in Benin including vegeta-tion monitoring, change detection and hydro-logical questions as well as fire management.

Visitor Monitoring Methods, Modeling and Data Management
330
Feasibility study for visitor monitoring with the UAV as addition to traditional monitoring sys-tems in urban recreation areas in Cologne, Ger-many.
Mapping of ski and animal tracks in the Black Forest.
Furthermore numerous application fields are pos-sible – from landscape photography to derivation of high resolution digital terrain models. Due to the comparatively low costs and high usability the UAV is a very interesting tool.
References
Muhar, A., Arnberger, A. & Brandenburg, C. (2002). Meth-ods for Visitor Monitoring in Recreational and Pro-tected Areas: An Overview. In: Arnberger, A., Bran-denburg, C. & Muhar, A. (eds.): Monitoring and Management of Visitor Flows in Recreational and Protected Areas. Conference Proceedings, Bodenkul-tur University, Vienna. p. 1-6.
Thamm, H.-P. & M. Judex (2006). The “low cost drone” – an interesting tool for process monitoring in a high spatial and temporal resolution. In: ISPRS Mid-term Symposium 2006, „Remote Sensing: From Pixels to Processes“, Enschede, 8-11 May 2006, the Nether-lands.
Figure 1: Picture of the UAV (left), image taken by the UAV for visitor monitoring in an urban recreation area in Cologne, Germany.
Advantages Disadvantages Very high spatial resolution (up to 1 cm) dependent on sensor and flight heightHigh temporal resolution Coverage of greater areas in short time Various sensors can be used (e.g. optical, multi-spectral, thermal,..) Low cost compared to “classical” remote sensingComparatively easy to operate and to maintain Lightweight, easy to set up and to transport Standardised semi automatic image processing possible
Depended on weather conditions (wind, mist, rainfall) In some areas complex permit procedures Optical sensors have restrictions (Monitoring of processes under closed canopy not possible – thermal sensors could overcome this problem) Possible disturbance of animals has to be taken into account Operator should have visual contact with the UAV
Table 1: Some advantages and disadvantages for the use of the UAV.
Siegrist, D., Clivaz, C., Hunziker, M. & Iten, S. (eds.) (2006). Exploring the Nature of Management. Proceedings of the Third International Conference on Monitoring and Management of Visitor Flows in Recreational and Protected Areas.
University of Applied Sciences Rapperswil, Switzerland, 13-17 September 2006. Rapperswil.
331
Segmentation of Visitors’ Cross-Cultural Values inForest Recreation
Chieh-Lu Li1, Harry C. Zinn2, Garry E. Chick2, James D. Absher3
& Alan R. Graefe2
1The University of Hong Kong, [email protected]
2The Pennsylvania State University, [email protected]@psu.edu
3USDA Forest Service, [email protected]
Keywords: Segmentation, cross-cultural values, ethnicity, Hofstede, Inglehart, Kahle, Postmodern values, forest recreation.
Introduction
Recreation visitors to national forests are not all alike. Marketing applications have used values as the criterion for segmenting the population into ho-mogeneous groups of individuals (e.g. Madrigal & Kahle 1994). Values can provide potentially pow-erful explanations of visitor behavior because they are inner- and central-oriented within a person’s cognitive system, remarkably stable over time and serve as the standards of conduct (Rokeach 1973). Because culturally diverse populations may have varying values, and values may influence other, more specific beliefs as well as behaviors, it is im-portant to study these values among increasingly diverse populations in a variety of contexts. There-fore, in this paper, we examined the potential util-ity of Hofstede’s measure of cultural values (1984) for group segmentation in an ethnically diverse population in a forest recreation context.
Methods
In 2002, the visitors to the Angeles National Forest (ANF) near metropolitan Los Angeles were sur-veyed. Because we intended to segment a popula-tion of diverse cultural values and beliefs among various ethnic groups in this study, a simple ran-
dom sample of all visitors would not efficient-ly yield adequate respondents of diverse ethnic groups. An on-site survey was administered at ANF sites frequented by ethnically diverse popula-tions1. Using purposive sampling, a total of 1,332 visitors were approached, 154 of whom declined or were unable to participate the on-site survey. Of the 1,178 informants who responded, four sur-vey questionnaires were incomplete. This resulted in 1,174 usable surveys, with a net response rate of 88 percent. Overall, 38 percent were white (n = 444), 27 percent Hispanic (n = 312), 27 percent Asian (n = 319), and 8 percent “other” including African-American, American-Indian, “other”, and missing values (n=97)2.
Results
Confirmatory factor analysis was first applied to confirm the theoretical models of Hofstede’s four cultural dimensions of values (Power distance, In-
1 The use of verbal surveys to determine “values” and preferences is a very common practice. Researchers need to acknowledge the limitations of this para-digm.
2 There were 14 sampling sites selected in the ANF. However, about 90 per-cent of the responses came from three developed sites close to Los Angeles metropolitan area. At sampling sites further from the urban edge, fewer visi-tors were encountered, especially on weekdays. Most of the survey respondents were hikers, backpackers as well as picnicking and scenic drive visitors, but also including small number of bikers, campers, resort guests, nature center visitors, and cabin owners.
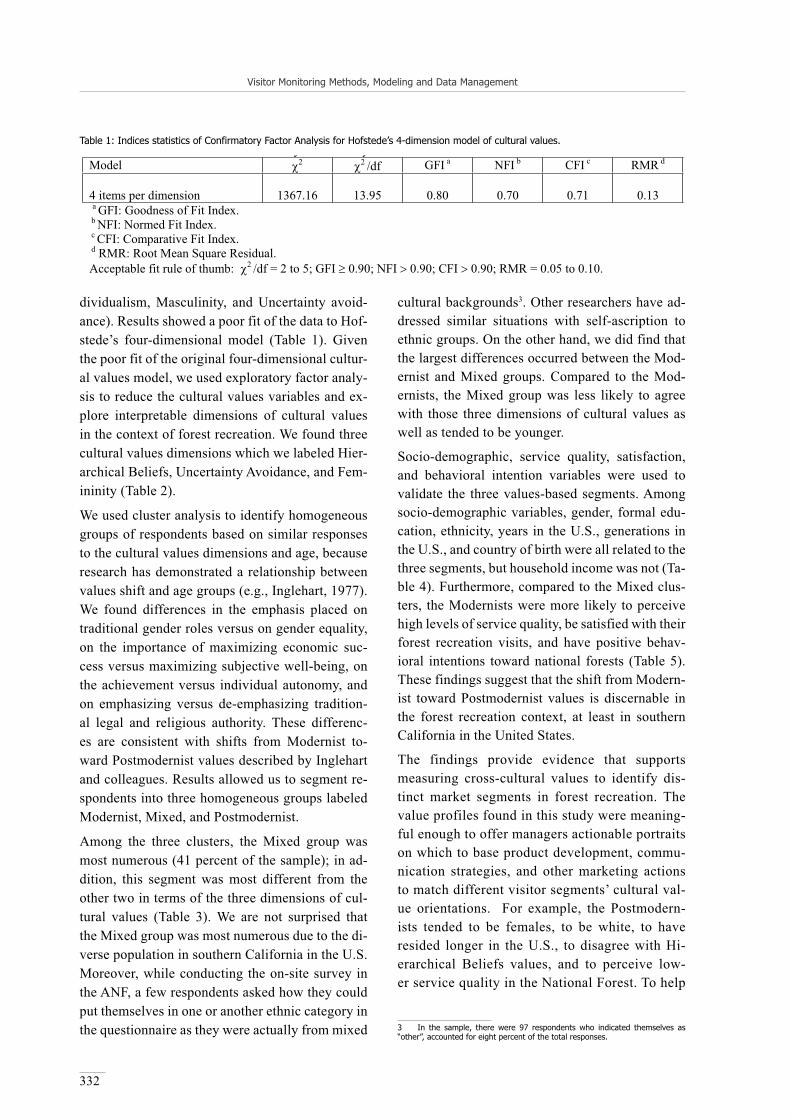
Visitor Monitoring Methods, Modeling and Data Management
332
dividualism, Masculinity, and Uncertainty avoid-ance). Results showed a poor fit of the data to Hof-stede’s four-dimensional model (Table 1). Given the poor fit of the original four-dimensional cultur-al values model, we used exploratory factor analy-sis to reduce the cultural values variables and ex-plore interpretable dimensions of cultural values in the context of forest recreation. We found three cultural values dimensions which we labeled Hier-archical Beliefs, Uncertainty Avoidance, and Fem-ininity (Table 2).
We used cluster analysis to identify homogeneous groups of respondents based on similar responses to the cultural values dimensions and age, because research has demonstrated a relationship between values shift and age groups (e.g., Inglehart, 1977). We found differences in the emphasis placed on traditional gender roles versus on gender equality, on the importance of maximizing economic suc-cess versus maximizing subjective well-being, on the achievement versus individual autonomy, and on emphasizing versus de-emphasizing tradition-al legal and religious authority. These differenc-es are consistent with shifts from Modernist to-ward Postmodernist values described by Inglehart and colleagues. Results allowed us to segment re-spondents into three homogeneous groups labeled Modernist, Mixed, and Postmodernist.
Among the three clusters, the Mixed group was most numerous (41 percent of the sample); in ad-dition, this segment was most different from the other two in terms of the three dimensions of cul-tural values (Table 3). We are not surprised that the Mixed group was most numerous due to the di-verse population in southern California in the U.S. Moreover, while conducting the on-site survey in the ANF, a few respondents asked how they could put themselves in one or another ethnic category in the questionnaire as they were actually from mixed
cultural backgrounds3. Other researchers have ad-dressed similar situations with self-ascription to ethnic groups. On the other hand, we did find that the largest differences occurred between the Mod-ernist and Mixed groups. Compared to the Mod-ernists, the Mixed group was less likely to agree with those three dimensions of cultural values as well as tended to be younger.
Socio-demographic, service quality, satisfaction, and behavioral intention variables were used to validate the three values-based segments. Among socio-demographic variables, gender, formal edu-cation, ethnicity, years in the U.S., generations in the U.S., and country of birth were all related to the three segments, but household income was not (Ta-ble 4). Furthermore, compared to the Mixed clus-ters, the Modernists were more likely to perceive high levels of service quality, be satisfied with their forest recreation visits, and have positive behav-ioral intentions toward national forests (Table 5). These findings suggest that the shift from Modern-ist toward Postmodernist values is discernable in the forest recreation context, at least in southern California in the United States.
The findings provide evidence that supports measuring cross-cultural values to identify dis-tinct market segments in forest recreation. The value profiles found in this study were meaning-ful enough to offer managers actionable portraits on which to base product development, commu-nication strategies, and other marketing actions to match different visitor segments’ cultural val-ue orientations. For example, the Postmodern-ists tended to be females, to be white, to have resided longer in the U.S., to disagree with Hi-erarchical Beliefs values, and to perceive low-er service quality in the National Forest. To help
3 In the sample, there were 97 respondents who indicated themselves as “other”, accounted for eight percent of the total responses.
y yModel 2 2 /df GFI a NFI b CFI c RMR d
4 items per dimension 1367.16 13.95 0.80 0.70 0.71 0.13 a GFI: Goodness of Fit Index.
b NFI: Normed Fit Index. c CFI: Comparative Fit Index. d RMR: Root Mean Square Residual. Acceptable fit rule of thumb: 2 /df = 2 to 5; GFI 0.90; NFI 0.90; CFI 0.90; RMR = 0.05 to 0.10.
Table 1: Indices statistics of Confirmatory Factor Analysis for Hofstede’s 4-dimension model of cultural values.

Visitor Monitoring Methods, Modeling and Data Management
333
g y Modernist 3
(n = 287) Mixed
(n = 358) Postmodernist
(n = 230) F for
ANOVA Hierarchical Beliefs 1 3.6a 2.9b 2.2c 485.0***
Uncertainty Avoidance 1 4.0a 3.1b 4.0a 332.1***
Femininity 1 4.2a 3.0b 4.0c 369.0***
Age 2 37.7a 34.0b 33.5b 9.8***
1 Hierarchical Beliefs, Uncertainty Avoidance, and Femininity scores ranged from 1 (strongly disagree) to 5 (strongly agree). 2 Age in years used as a continuous variable. 3 Group means sharing different superscripts differ significantly at 0.05 level in a post-hoc Scheffe test. *** Significant at the 0.001 level.
Table 3: Three-cluster solution of cultural values and age via cluster analysis.
y p y yNew factors
Hofstede’s original cultural value dimensions and items a
Factor 1 Hierarchical
Beliefs b
Factor 2 Uncertainty Avoidance
Factor 3 Femininity
-Power distance 1. Inequalities among people are both expected and desired. c .61 .20 .14 2. Less powerful people should be dependent on the more
powerful. .75 -.00 .12
3. Inequalities among people should be minimized. .04 .17 .19 4. There should be, and there is to some extent,
interdependencies between less and more powerful people. d
.37 .34 .22
Individualism 5. Everyone grows up to look after him/herself and his/her
immediate family only. .71 .01 .07
6. People are identified independently of the groups they belong to. d
.51 -.00 .43
7. An extended family member should be protected by other member in exchange for loyalty.
.65 .07 .19
8. People are identified by their position in the social networks to which they belong. d
.49 .40 -.21
Masculinity 9. Money and material things are important. .67 .21 -.08 10. Men are supposed to be assertive, ambitious, and tough. .75 .18 -.06 11. Dominant values in society are the caring for others and
preservation. .21 .20 .78
12. Both men and woman are allowed to be tender and to be concerned with relationships.
-.07 .44 .70
Uncertainty avoidance 13. High stress and subjective feeling of anxiety are frequent
among people. .05 .81 .16
14. Fear of ambiguous situations and of unfamiliar risks is normal.
.09 .85 .11
15. Uncertainty is a normal feature of life and each day is accepted as it comes.
.06 .82 .21
16. Emotions should not be shown. .69 -.10 .15 a Item scores ranged from 1 (strongly disagree) to 5 (strongly agree). b Total variance explained is 52.33 %. Factor 1, Hierarchical Beliefs, explained 25.28 %; factor 2, Uncertainty
Avoidance, explained 17.09 %, and factor 3, Femininity, explained 9.96 % of variance. c N = 788. Cases were excluded listwise. Principal components extraction and Varimax rotation methods were used. d Item deleted due to low and inconsistent factor loadings.
Table 2: Reanalysis of Hofstede’s cultural values items with exploratory factor analysis.

Visitor Monitoring Methods, Modeling and Data Management
334
the Postmodernist group enjoy the National For-est, managers could design recreation facili-ties and services to better meet the needs of the Postmodernists (e.g., increase safety infor-mation and other concerns for females, such as using signs, brochures, or emergency tele-phones, and the presence of Forest Service of-ficers, rangers, and volunteers); encourage the
use of persuasive, courteous, non-coercive communication that guides visitors while min-imizing hierarchical power distance between visitors and Forest Service personnel. Addi-tionally, developing programs that allow vis-itors to have more friendly and non-enforce-ment-related interactions with Forest Service personnel may also help reduce cultural values
Values segments Characteristics Modernist Mixed Postmodernist ANOVA &
Chi-square tests3
Gender1 Female 37 38 51 Male 63 62 49
2(2) = 12.57**,
Cramer’s V= 0.12
Less than $ 20,000 13 19 14 $ 20,000 – $ 34,999 17 16 18 $ 35,000 – $ 49,999 17 18 14 $ 50,000 – $ 64,999 16 14 11 $ 65,000 – $ 79,999 12 12 12
Household income1
$ 80,000 or more 26 21 31
2 (10) = 11.32,
Cramer’s V= 0.087
Not complete high school
3 4 2
High school diploma/GED
12 15 8
Technical or business school
5 6 2
Some college 15 18 20 College degree 35 35 35 Some graduate work 5 6 7
Formal education1
Graduate degree 25 17 27
2 (12) = 21.39*,
Cramer’s V= 0.115
Whites 28 37 55 Hispanics 35 28 22
Ethnicity1
Asians 37 35 23
2(4) = 36.49***,
Cramer’s V= 0.150
Generation in the US1
1st generation 35 37 21 2(6) = 22.71***,
2nd generation 24 13 23 Cramer’s V= 0.145 3rd generation 18 14 20 4th generation 24 36 36 Country born1 USA 51 60 73 Outside USA 49 40 27
2 (2) = 24.79***,
Cramer’s V= 0.176 Years stayed in the US2
Number of years stayed in USA
15.8a 17.5 ab 20.1 b F(2, 386) =3.76*
* Significant at the 0.05 level, ** significant at the 0.01 level, *** significant at the 0.001 level. 1 For Chi-square test, numbers reported in cells refer to cell percentages. 2 Mean with different subscript letter significantly differed at the p = 0.05 level after Scheffe test adjustment. 3 The number showed in the brock indicated the degree of freedom. Cramer’s V was a measure of association, with values 0.10 or less considered weak, between 0.10 and 0.30 moderate, and 0.30 or higher considered strong.
Table 4: Comparison of Socio-demographics of Modernist, Mixed, and Postmodernists in the Angeles National Forest.

Visitor Monitoring Methods, Modeling and Data Management
335
gaps between Postmodernists and officials, lead-ing to enhanced perceptions of service quality and increased customer satisfaction.
Our results suggest several areas where addi-tional research is needed. First, we found lim-ited support for using Hofstede’s cross-cultural measure of values in the forest recreation con-text. The use of Hofstede’s measure in the park and recreation context has also been criticized by others. Our findings suggest that there are some degrees of validity to aspects of Hofstede’s un-derlying conceptualization, but additional test-ing will be needed. Specifically, we suggest test-ing other measures of cross-cultural values (e.g., Kahle, Beatty, & Homer, 1986) against Hofst-ede’s in this context. Second, in order to ensure obtaining a highly diverse sample, we employed purposive sampling procedures to collect data. This means, of course, our sample was not ran-dom, and it is inappropriate to estimate popula-tion characteristics from our results. Additional research employing probability sampling will be needed to develop a more complete understand-ing of patterns of values segmentation in park and recreation and to better understand relation-ships among cultural values, socio-demograph-ic, and service quality related variables.
References
Hofstede, G. (1984). Culture’s Consequences: International Differences in Work-Related Values. Beverly Hills.
Inglehart, R. (1977). The silent revolution: Changing val-ues and political styles among western publics. Princ-eton.
Kahle, L.R., Beatty, S.E. & Homer, P.M. (1986). Alternative measurement approaches to consumer values: The List of Values (LOV) and Values and Lifestyles (VALS). In: Journal of Consumer Research (13), p 405-409.
Madrigal, R. & Kahle, L.R. (1994). Predicting vacation ac-tivity preferences on the basis of value-system seg-mentation. In: Journal of Travel Research (32/3), p 22-28.
Rokeach, M. (1973). The nature of human values. New York.
, gModernist Mixed Postmodernist Dependent variable
Index/dimension1 Mean2 SD Mean SD Mean SD F for
ANOVA Service quality index3 3.95 a .58 3.64b .68 3.77c .57 21.05***
Facilities 3.94a .59 3.64b .72 3.80a .60 17.43***
Service 4.00a .67 3.72b .81 3.87ab .74 11.02***
Information 3.86a .72 3.50b .76 3.55b .75 20.59***
Management 4.02a .62 3.69b .74 3.87c .65 19.12***
Satisfaction index 6.94a 1.4 6.55b 1.5 6.84ab 1.6 5.72**
Behavioral intentions index 4.20a .54 3.78b .72 4.01a .63 34.73***
**Significant at p 0.01; ***Significant at p 0.001. 1 Service quality and behavioral intentions index/dimension coded on a 5-point scale from 1 = Strongly disagree
to 5 = Strongly agree, while satisfaction index on a 9-point scale from 1= not at all satisfied to 9 = extremely satisfied.
2 Mean with different subscript letter significantly differed at the p = 0.05 level after Scheffe test adjustment. 3 Service quality dimension was created by taking the mean of the service quality items within the same
dimension; service quality index, by four service quality dimensions; satisfaction index, by three satisfaction items, and behavioral intentions index, by five behavioral intentions items.
Table 5: Comparison of perceptions of service quality, satisfaction and behavioral intentions of Modernist, Mixed, and Postmodernists in the Angeles National Forest.

Siegrist, D., Clivaz, C., Hunziker, M. & Iten, S. (eds.) (2006). Exploring the Nature of Management. Proceedings of the Third International Conference on Monitoring and Management of Visitor Flows in Recreational and Protected Areas.
University of Applied Sciences Rapperswil, Switzerland, 13-17 September 2006. Rapperswil.
336
Estimating Visitor Use with a Photoelectric Counting System:A Calibration Study
Chi-Chuan Lue
National Dong Hwa University, Taiwan
Keywords: Wilderness use estimation, mechanical counting, calibration, reliability.
With little or no reliable wilderness use informa-tion, managers cannot adequately judge trends of resource condition and visitor use. Such data is essential for assessing visitor impacts to the re-source conservation, facilities planning, budget-ing, marketing, and visitor management. Gov-ernment agencies that manage outdoor recreation resources have been slow to recognize the impor-tance of consistently corrected and valid wilder-ness use data (Loomis 2000). The objectives of this research were to calibrate a wilderness use es-timation system and to explain the potential errors coming from the system and from inappropriate visitor traffic behavior.
Researchers designed a Photoelectric Counting System (PCS) that records individual visits. PCS was installed 400 meters down from the main trail-head at Da Wu Mountain, Southern Taiwan. Da Wu Mountain is adjacent to the biggest nature reserve in Taiwan. The PCS is an instrument that includes two scanners that emit infrared beams across the trail. The infrared beams were received on the oth-er side of the trail and the counter advanced each time when an up-hill visitor passed by two scan-ners. Total count, date, and time to the second of each count were recorded in an electronic log.
Two methods were used to calibrate the counters, cameras and human observers by previous research (Watson et al. 2000). Calibration done by human observers was applied to the study. Observers sta-tioned close enough to the counter so that all traffic activating the counter was observed. In addition, the observers stationed at the hidden place, which makes observation as less intrusive as possible. For calibration purposes, observers recorded four
types of information, including: number of indi-viduals, number of groups, direction of travel, date and time of entry and exit. A quota sampling plan was developed to reflect the fluctuation of visitor number due to monsoon/non-monsoon season and weekday/weekend. A total 30 sampling days were generated to represent the calibration period (246 days). The schedule of human observation was ar-ranged to represent the temporal pattern of visitor use. Furthermore, the time period of human obser-vation could not be too long to prevent fatigue and boredom of observers. Thus, the period of human observation began at 7:30 AM, ended at 15:30 PM in each sampling day, which covered almost 75% of total wilderness use.
This PCS was used successfully in the field. The system produced individual and total visitor count data analysis reports tailored to specific and di-verse managerial objectives, such as visitors’ fre-quency distribution per month, visitors’ frequency distribution per week day, visitors’ frequency dis-tribution per hour. The PCS was set up to count trail traffic; the reliability of counter data was as-sessed by simultaneous monitoring of trail traffic by human observers. Research results show that high correlation between data recorded by human observers and recorded by PCS (r = 0.994). Dur-ing 30 sampling days, records of 10 days appeared overestimation, records of 11 days appeared un-derestimation. In addition, 595 groups were re-corded during calibration period. 77 groups gener-ated either overestimation bias or underestimation bias. Temporary stops at the middle of two scan-ners were the source of major error for inappropri-ate visitor traffic behavior. Consequent down-hill moving intrigued incorrect counts and was a ma-

Visitor Monitoring Methods, Modeling and Data Management
337
jor error for the PCS. In conclusion, the distance between two scanners should be kept short and the path going through two scanners should be re-served limited space that only allows for one visi-tor to pass at a time in order to produce more ac-curate data.
References
Loomis, J. B. (2000). Counting on recreation use data: A call for long-term monitoring. In: Journal of Leisure Research (32/1), p 93-96.
Watson, A.E., Cole, D.N., Turner, D.L. & Reynolds, P.S. (2000). Wilderness recreation use estimation. A hand-book of methods and systems. USDA Forest Service RMRS-GTR-56. Ogden.
ANOVA
Model SS df MS F Sig
Regression 66821.101 1 66821.101 2136.895 .000
Residual 875.565 28 31.270
Total 67696.667 29
Coefficients
Unstandardized CoefficientsModel
B Std. Error T Sig
Constant -.260 1.518 -.171 .865
X 1.009 .022 .994 46.227 .000
Table 1: Table of Regression Model: dependable variable-visitor observed, independent variable-PCS counts.

Siegrist, D., Clivaz, C., Hunziker, M. & Iten, S. (eds.) (2006). Exploring the Nature of Management. Proceedings of the Third International Conference on Monitoring and Management of Visitor Flows in Recreational and Protected Areas.
University of Applied Sciences Rapperswil, Switzerland, 13-17 September 2006. Rapperswil.
338
The Road to a Strategic Typology of Visit Itineraries
David J. McVetty
Parks Canada, Canada
Keywords: Transportation, latent class clustering, behaviour patterns, national parks.
Introduction
This paper presents an analysis of travel itinerar-ies to Canada’s Mountain National Parks. Its re-sults suggest that new analytic tools can help the science community to address longstanding visitor modelling issues to better understand the outcomes of visitor use in protected areas.
The urban transportation demand literature has been addressing these issues with decades of re-search to model peoples’ temporal and spatial dis-tribution. This literature has long recognised that urban traffic patterns are best studied as myriad in-dividual travel patterns (Kutter, 1973; Meister et al, 2005). This allows the system to be viewed like an ecosystem: complex, non-linear, non-probabi-listic, and dynamic, with an array of inter-relation-ships (McKercher, 1999).
Like natural science, the search for deep-seated patterns can help to define and explain the system. However, the search for ways to find meaningful patterns in travel itinerary data is one of the lon-gest standing issues. Specifically, there has yet to be agreement on the practical approaches that work within the capacity of desktop computers (Kutter, 1973; Joh et al, 2002; Schlich, 2003; Meister et al, 2005, O’Connor et al, 2005). One of the earli-est approaches, which predates desktop computers, may offer a useful approach. Kutter’s influential 1973 paper called for methods to establish useful behavioural typologies to reduce large volumes of behaviour to a manageable level. If distinct sets of place/activity behaviours exist, this understanding could form the basis for effective system model-ling, as subsequent research could study these dis-creet groups to determine the sequential dimension and develop a rule-based heuristic model of trav-el behaviour.
Methods
The purpose of this study is to determine if useful behavioural typologies can be developed for Can-ada’s Mountain National Parks. The analysis uses latent class clustering to search for patterns. Latent class models offer an improvement over traditional approaches to segmentation, cluster, factor, regres-sion analyses, by allowing deeper searches for pat-terns in diary data (Magidson & Vermunt, 2002). This paper explores “visit type” classification, or common sets of itineraries as suggested by latent class cluster analysis of activity/location “events”. It illustrates the example with data from a 2003 survey of 2,376 visitor parties to Canada’s Moun-tain National Parks.
Results and Conclusion
The results suggest that the visit type approach of-fers a useful approach to the longstanding issue of reducing complex behaviour and has relevance to the ongoing study of visitor impacts in protected areas. Parks Canada and its partners continue to explore visit type classification to better under-stand the system of visitor use in its parks, to map visitor use and explore spatial relationships, to de-velop “behavioural footprints”, and to correlate impacts (positive or negative) to visit patterns.
References
Joh, C. H., Arentze, T., Hofman, F. & Timmermans, H. (2002). Activity pattern similarity: A Multidimension-al Sequence Alignment Method. In: Transportation Research B (36), p 385-403.
Kutter, E. (1973) A Model for Individual Travel Behaviour. In: Urban Studies (10), p 235-258.
Visitor Monitoring Methods, Modeling and Data Management
339
Magidson, J. & Vermunt, J. K. (2002). Latent class models for clustering: A comparison with K-means. In: Cana-dian Journal of Marketing Research (20), p 36-43.
McKercher, B. (1999). A chaos approach to tourism. In: Tourism Management (20), p 425-434.
Meister, K., Frick, M. & Axhausen, K. W. (2005) A GA-based household Scheduler. Proceedings of the 84th Annual Meeting of the Transportation Research Board. January 9-13, 2005, Washington, DC.
O’Connor, A., Zerger A. & Itami, B. (2005). Geo-temporal tracking and analysis of tourist movement. In: Math-ematics and Computers in Simulation (69/2005), p 135–150.
Schlich, R. (2003). Homogeneous Groups of Travellers. Proceedings of the 10th International Conference on Travel Behaviour Research. August 10-15, 2003, Lu-cerne, Switzerland.
Wets, G., Vanhoof, K., Arentze, T. & Timmermans, H. (2000). Identifying Decision Structures Underlying Activity Patterns: An Exploration of Data Mining Al-gorithms. Proceedings of the 79th Annual Meeting of the Transportation Research Board. January 9-13, 2000, Washington, DC.
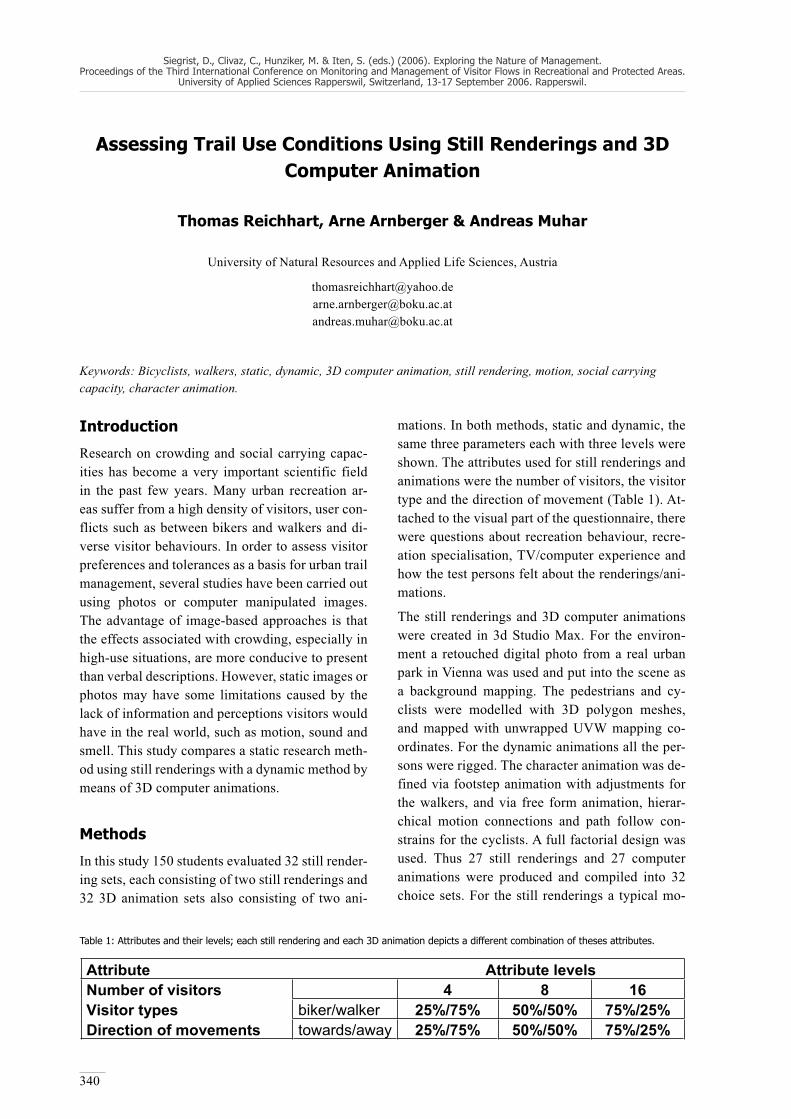
Siegrist, D., Clivaz, C., Hunziker, M. & Iten, S. (eds.) (2006). Exploring the Nature of Management. Proceedings of the Third International Conference on Monitoring and Management of Visitor Flows in Recreational and Protected Areas.
University of Applied Sciences Rapperswil, Switzerland, 13-17 September 2006. Rapperswil.
340
Assessing Trail Use Conditions Using Still Renderings and 3D Computer Animation
Thomas Reichhart, Arne Arnberger & Andreas Muhar
University of Natural Resources and Applied Life Sciences, Austria
[email protected]@[email protected]
Keywords: Bicyclists, walkers, static, dynamic, 3D computer animation, still rendering, motion, social carrying capacity, character animation.
Introduction
Research on crowding and social carrying capac-ities has become a very important scientific field in the past few years. Many urban recreation ar-eas suffer from a high density of visitors, user con-flicts such as between bikers and walkers and di-verse visitor behaviours. In order to assess visitor preferences and tolerances as a basis for urban trail management, several studies have been carried out using photos or computer manipulated images. The advantage of image-based approaches is that the effects associated with crowding, especially in high-use situations, are more conducive to present than verbal descriptions. However, static images or photos may have some limitations caused by the lack of information and perceptions visitors would have in the real world, such as motion, sound and smell. This study compares a static research meth-od using still renderings with a dynamic method by means of 3D computer animations.
Methods
In this study 150 students evaluated 32 still render-ing sets, each consisting of two still renderings and 32 3D animation sets also consisting of two ani-
mations. In both methods, static and dynamic, the same three parameters each with three levels were shown. The attributes used for still renderings and animations were the number of visitors, the visitor type and the direction of movement (Table 1). At-tached to the visual part of the questionnaire, there were questions about recreation behaviour, recre-ation specialisation, TV/computer experience and how the test persons felt about the renderings/ani-mations.
The still renderings and 3D computer animations were created in 3d Studio Max. For the environ-ment a retouched digital photo from a real urban park in Vienna was used and put into the scene as a background mapping. The pedestrians and cy-clists were modelled with 3D polygon meshes, and mapped with unwrapped UVW mapping co-ordinates. For the dynamic animations all the per-sons were rigged. The character animation was de-fined via footstep animation with adjustments for the walkers, and via free form animation, hierar-chical motion connections and path follow con-strains for the cyclists. A full factorial design was used. Thus 27 still renderings and 27 computer animations were produced and compiled into 32 choice sets. For the still renderings a typical mo-
Attribute Attribute levels Number of visitors 4 8 16 Visitor types biker/walker 25%/75% 50%/50% 75%/25% Direction of movements towards/away 25%/75% 50%/50% 75%/25%
Table 1: Attributes and their levels; each still rendering and each 3D animation depicts a different combination of theses attributes.

Visitor Monitoring Methods, Modeling and Data Management
341
ment of the 20 sec animation strip was extract-ed and saved as a static slide. The animated film-strips had 400 frames each and were looped three times when shown to the test persons. Therefore, for each set the respondent had 60 seconds to an-swer five questions related to the films and still renderings. The students had to choose which sce-nario of the two they prefer, where they would not walk, ride a bike, or jog anymore, and which sce-narios they think are still tolerable. All choice sets where shown in a standardized manner with two video beamers to two different groups at the same time. Each student evaluated eight 3D animation sets and eight still rendering sets.
Results
The study showed that the evaluation of static ver-sus dynamic scenarios led to different results. In general trail scenarios based on the 3D animations tended to be less preferred by students compared to still renderings.
Regarding recreational activities, in 35% of the sce-narios based on still renderings the students would not walk anymore, while this number increased to 38% based on the animations. For jogging and cy-cling activities only slightly different results were gained. The study also showed that at mid use lev-els the results for the static and dynamic scenari-
os were rather similar, but at high use densities (16 persons in view) the evaluation differed dramati-cally. Compared to low use levels, at high use situ-ations animations were over proportionally regard-ed as more preventing from recreational activities than still renderings.
Across all scenarios, 52% of the still renderings were judged as tolerable. This share decreased to 49% when the same scenarios but in motion were evaluated. In the next step data will be analyzed using multivariate methods (multinomial logistic analysis).
The respondents were also asked about the suit-ability of the still renderings and animations for the evaluation of trail use scenarios. While for still renderings 54% of the students answered they could place themselves “well” or “very well” into the shown scenarios, for the animations even 60 % answered with “well” or “very well”.
Study limitations
Even if dynamic 3D computer animations are clos-er to the real world scenery than still renderings, they are always abstractions of the real situation visitors would find in urban parks. There are still many parameters that could influence the evalua-tion of the scenarios very strongly (sound, smell, and place).
Figure 1: Choice set consisting of two still renderings.

Siegrist, D., Clivaz, C., Hunziker, M. & Iten, S. (eds.) (2006). Exploring the Nature of Management. Proceedings of the Third International Conference on Monitoring and Management of Visitor Flows in Recreational and Protected Areas. University of Applied
Sciences Rapperswil, Switzerland, 13-17 September 2006. Rapperswil.
342
such as water body for waterfalls, trail body for na-ture trails, coral reef area for islands, etc., as well as to cover development area, and 100 meters of natural buffering from the key resources. At each recreation site a survey of users and their behavior was conducted. 1,550 visitors completed the study questionnaires.
Results
The study found that over 80% of the study sites were situated within the boundaries of protected ar-eas, national parks in particular, where site devel-opment and uses were regulated by the government. The majority of the recreation sites were moder-
Figure 1: Distribution of the study sites.
Exploring Recreation Diversity in Thailand: A Nation-Wide Study of Nature-Based Recreation Resources and Behavior
Noppawan Tanakanjana
Kasetsart University, Thailand
Keywords:Recreation diversity; nature-based recreation area; Thailand
Introduction
Recreation diversity in this study is defined as di-versity in key components of the recreation sys-tem, including recreation resources, recreation us-ers, and recreation activities. The study explores recreation diversity in 9 types of nature-based rec-reation areas in Thailand, including waterfalls, riv-ers and lakes, caves, hot springs, geo-morpholog-ical sites, scenic areas, nature trails, islands, and beaches. 1,504 nature-based recreation sites are listed in the country’s record. However, no previ-ous study has provided basic knowledge about rec-reation resources and behavior at the country level. This study was initiated to fill that knowledge gap, as a part of a project entitled “Decision Support System for Sustainable Management Planning of Nature-based Recreation Areas”, funded by Thai-land Research Fund (Tanakanjana, et. al, 2006). It was completed in September 2005.
Method
Purposive cluster sampling was used to select the study sites. 119 sites around the country were cho-sen. These included 27 waterfalls, 10 rivers and lakes, 14 caves, 10 hot springs, 10 geo-morpho-logical sites, 10 scenic areas, 13 nature trails, 10 is-lands, and 15 beaches. The distribution of the sites is presented in Figure 1. Inventories on basic char-acteristics of recreation resources were conducted using GPS tools along with other associated tools. The size of the recreation area, the area remaining natural, access conditions, and distance between each site were measured. Site boundaries were identified to cover the location of key resources

Visitor Monitoring Methods, Modeling and Data Management
343
ate to small in size. The average size of waterfalls was 6,375.57 square meters, rivers and lakes was 7,694,298.77 square meters, caves was 4,262.40 square meters, hot springs was 2,021.25 square meters, geo-morphological sites was 94,401.30 square meters, scenic areas was 8,988.60 square meters, nature trails was 531,052.30 square me-ters, islands was 3,282,310.80 square meters, and beaches was 95,266.02 square meters. Most areas were preserved in their natural state; the overall, average percentage for all types of recreation areas of areas without vegetative alteration and physical development was 85.59%. However, the percent-ages differed slightly for each type of recreation area, as presented in Table 1.
The access to most recreation areas is by dirt road, making the sites moderately easy to get to, par-ticularly during the dry season (from November to April). The majority of the sites had addition-al recreation areas situated in a radius of 80 kilo-meters from the sites themselves (some of which were also included in the study). The average num-ber of additional recreation sites in the radius was 50. Though the natural basic characteristics of rec-reation resources within each type of recreation area were diverse, site management of most recre-ation areas was uniform and consistent. Basic fa-cilities such as parking areas, walkways, interpre-tive signs, trash cans, toilets, etc. were provided to area visitors at almost all sites. Most sites had vis-itor surveillance and control, and indirect control by interpretive programs, to some degree. The sim-
ilarity of site and user management somehow led to low diversity in the recreation experience that visitors obtain from visiting the sites.
Results from the visitor survey found that the proportion of male and female users was almost equal. Their average age was 30 years and most of them completed a university degree program. The majority of users lived in city areas. Over 50% of them had experience in visiting the site in which they were surveyed before. Most user groups were individual-mass tour groups with an average group size of 10 people (Mean = 10.49; SD. = 12.83). Generally, the diversity in socio-demographic characteristics of visitors to nature-based recreation areas in Thailand was moder-ate to low.
Recreation motivation or desired recreation ex-perience was another aspect of recreation diver-sity explored in this study. This was measured with a 5-point rating scale on how important each motivational item is in visiting each site. It was found that the three motivating factors with the highest mean score were motivation for be-ing with nature, with a score of 4.31, motivation for escaping from crowds and noise, with a score of 4.21, and motivation for experiencing the sce-nic beauty of the landscape, with a score of 4.12. Discriminant analysis found that the mean scores of the 15 motivational items were significant-ly different among each type of recreation area. For only 3 items, including motivation in cultur-al learning, motivation in being independent, and
( )Recreation area category Percentage of
natural area Percentage of
developed area Waterfalls 91.30 8.70River and Lakes 90.76 9.24Caves 81.32 18.68Hot springs 56.97 43.03Geo-morphological sites 83.32 16.68Scenic areas 87.61 12.39Nature trails 94.02 5.98Islands 99.96 0.04Beaches 85.08 14.92Average 85.59 14.41
Table 1: Percentage of natural area and developed area within each type of recreation area (n=119).
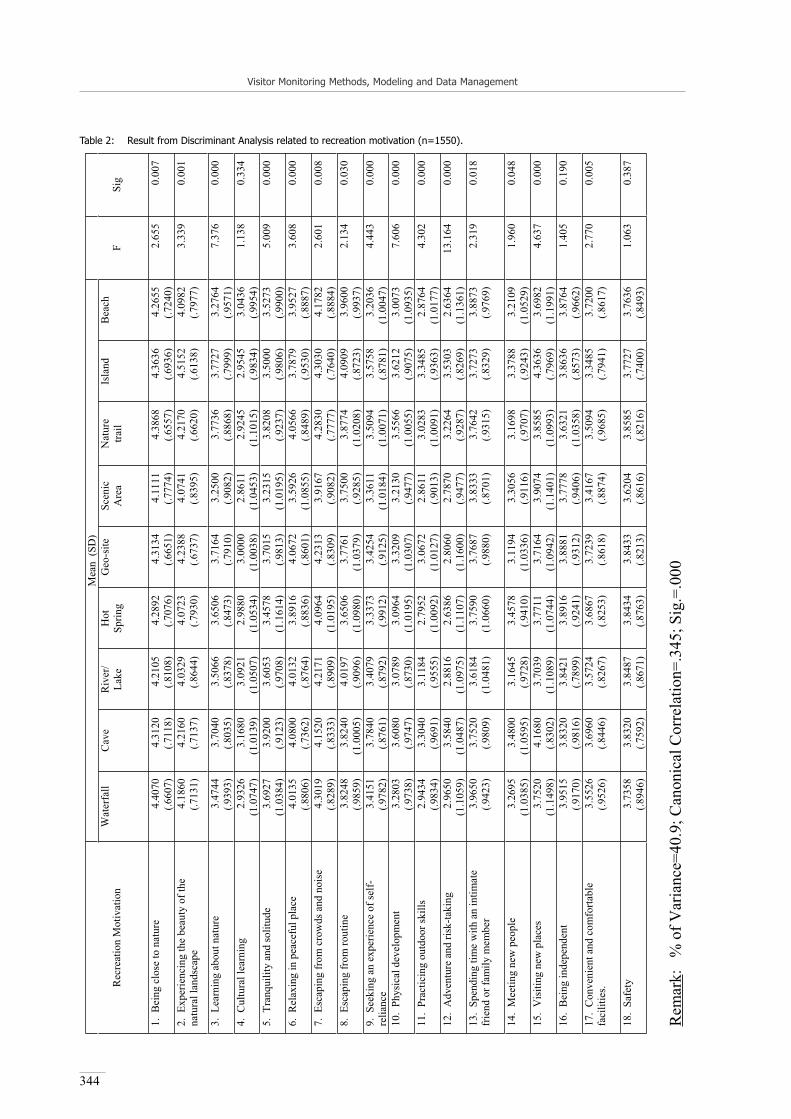
Visitor Monitoring Methods, Modeling and Data Management
344
Mea
n (S
D)
Rec
reat
ion
Mot
ivat
ion
W
ater
fall
Cav
e R
iver
/ La
keH
otSp
ring
Geo
-site
Sc
enic
A
rea
Nat
ure
trail
Isla
nd
Bea
ch
F Si
g
1. B
eing
clo
se to
nat
ure
4.40
70
(.660
7)
4.31
20
(.711
8)
4.21
05
(.810
8)
4.28
92
(.707
6)
4.31
34
(.665
1)
4.11
11
(.777
4)
4.38
68
(.655
7)
4.36
36
(.693
6)
4.26
55
(.724
0)
2.65
5 0.
007
2. E
xper
ienc
ing
the
beau
ty o
f the
na
tura
l lan
dsca
pe
4.18
60
(.713
1)
4.21
60
(.713
7)
4.03
29
(.864
4)
4.07
23
(.793
0)
4.23
88
(.673
7)
4.07
41
(.839
5)
4.21
70
(.662
0)
4.51
52
(.613
8)
4.09
82
(.797
7)
3.33
9 0.
001
3. L
earn
ing
abou
t nat
ure
3.47
44
(.939
3)
3.70
40
(.803
5)
3.50
66
(.837
8)
3.65
06
(.847
3)
3.71
64
(.791
0)
3.25
00
(.908
2)
3.77
36
(.886
8)
3.77
27
(.799
9)
3.27
64
(.957
1)
7.37
6 0.
000
4. C
ultu
ral l
earn
ing
2.93
26
(1.0
747)
3.
1680
(1
.013
9)
3.09
21
(1.0
507)
2.
9880
(1
.053
4)
3.00
00
(1.0
038)
2.
8611
(1
.045
3)
2.92
45
(1.1
015)
2.
9545
(.9
834)
3.
0436
(.9
954)
1.
138
0.33
4
5. T
ranq
uilit
y an
d so
litud
e
3.69
27
(1.0
384)
3.
9200
(.9
123)
3.
6053
(.9
708)
3.
4578
(1
.161
4)
3.70
15
(.981
3)
3.23
15
(1.0
195)
3.
8208
(.9
237)
3.
5000
(.9
806)
3.
5273
(.9
900)
5.
009
0.00
0
6. R
elax
ing
in p
eace
ful p
lace
4.
0135
(.8
806)
4.
0800
(.7
362)
4.
0132
(.8
764)
3.
8916
(.8
836)
4.
0672
(.8
601)
3.
5926
(1
.085
5)
4.05
66
(.848
9)
3.78
79
(.953
0)
3.95
27
(.888
7)
3.60
8 0.
000
7. E
scap
ing
from
cro
wds
and
noi
se
4.30
19
(.828
9)
4.15
20
(.833
3)
4.21
71
(.890
9)
4.09
64
(1.0
195)
4.
2313
(.8
309)
3.
9167
(.9
082)
4.
2830
(.7
777)
4.
3030
(.7
640)
4.
1782
(.8
884)
2.
601
0.00
8
8. E
scap
ing
from
rout
ine
3.82
48
(.985
9)
3.82
40
(1.0
005)
4.
0197
(.9
096)
3.
6506
(1
.098
0)
3.77
61
(1.0
379)
3.
7500
(.9
285)
3.
8774
(1
.020
8)
4.09
09
(.872
3)
3.96
00
(.993
7)
2.13
4 0.
030
9. S
eeki
ng a
n ex
perie
nce
of se
lf-re
lianc
e3.
4151
(.9
782)
3.
7840
(.8
761)
3.
4079
(.8
792)
3.
3373
(.9
912)
3.
4254
(.9
125)
3.
3611
(1
.018
4)
3.50
94
(1.0
071)
3.
5758
(.8
781)
3.
2036
(1
.004
7)
4.44
3 0.
000
10.
Phys
ical
dev
elop
men
t 3.
2803
(.9
738)
3.
6080
(.9
747)
3.
0789
(.8
730)
3.
0964
(1
.019
5)
3.32
09
(1.0
307)
3.
2130
(.9
477)
3.
5566
(1
.005
5)
3.62
12
(.907
5)
3.00
73
(1.0
935)
7.
606
0.00
0
11.
Prac
ticin
g ou
tdoo
r ski
lls
2.94
34
(.983
4)
3.30
40
(.969
1)
3.11
84
(.955
5)
2.79
52
(1.0
092)
3.
0672
(1
.012
7)
2.86
11
(.901
3)
3.02
83
(1.0
091)
3.
3485
(.9
363)
2.
8764
(1
.017
7)
4.30
2 0.
000
12.
Adv
entu
re a
nd ri
sk-ta
king
2.
9650
(1
.105
9)
3.58
40
(1.0
487)
2.
8816
(1
.097
5)
2.63
86
(1.1
107)
2.
8060
(1
.160
0)
2.78
70
(.947
7)
3.22
64
(.928
7)
3.53
03
(.826
9)
2.63
64
(1.1
361)
13
.164
0.
000
13.
Spen
ding
tim
e w
ith a
n in
timat
e fr
iend
or f
amily
mem
ber
3.96
50
(.942
3)
3.75
20
(.980
9)
3.61
84
(1.0
481)
3.
7590
(1
.066
0)
3.76
87
(.988
0)
3.83
33
(.870
1)
3.76
42
(.931
5)
3.72
73
(.832
9)
3.88
73
(.976
9)
2.31
9 0.
018
14.
Mee
ting
new
peo
ple
3.26
95
(1.0
385)
3.
4800
(1
.059
5)
3.16
45
(.972
8)
3.45
78
(.941
0)
3.11
94
(1.0
336)
3.
3056
(.9
116)
3.
1698
(.9
707)
3.
3788
(.9
243)
3.
2109
(1
.052
9)
1.96
0 0.
048
15.
Vis
iting
new
pla
ces
3.75
20
(1.1
498)
4.
1680
(.8
302)
3.
7039
(1
.108
9)
3.77
11
(1.0
744)
3.
7164
(1
.094
2)
3.90
74
(1.1
401)
3.
8585
(1
.099
3)
4.36
36
(.796
9)
3.69
82
(1.1
991)
4.
637
0.00
0
16.
Bei
ng in
depe
nden
t 3.
9515
(.9
170)
3.
8320
(.9
816)
3.
8421
(.7
899)
3.
8916
(.9
241)
3.
8881
(.9
312)
3.
7778
(.9
406)
3.
6321
(1
.035
8)
3.86
36
(.857
3)
3.87
64
(.966
2)
1.40
5 0.
190
17.
Con
veni
ent a
nd c
omfo
rtabl
e fa
cilit
ies.
3.55
26
(.952
6)
3.69
60
(.844
6)
3.57
24
(.826
7)
3.68
67
(.825
3)
3.72
39
(.861
8)
3.41
67
(.887
4)
3.50
94
(.968
5)
3.34
85
(.794
1)
3.72
00
(.861
7)
2.77
0 0.
005
18.
Safe
ty
3.73
58
(.894
6)
3.83
20
(.759
2)
3.84
87
(.867
1)
3.84
34
(.876
3)
3.84
33
(.821
3)
3.62
04
(.861
6)
3.85
85
(.821
6)
3.77
27
(.740
0)
3.76
36
(.849
3)
1.06
3 0.
387
Rem
ark:
%
of V
aria
nce=
40.9
; Can
onic
al C
orre
latio
n=.3
45; S
ig.=
.000
Table 2: Result from Discriminant Analysis related to recreation motivation (n=1550).

Visitor Monitoring Methods, Modeling and Data Management
345
motivation for safety was there no significant dif-ference found, as presented in Table 2.
However, the overall correlation among each moti-vational item and type of recreation area was mod-erate (Canonical Correlation =.345; Sig. =.000). There was not much difference in the motivation of users who visited each type of nature-base rec-reation area. Recreation motivation or desired recreation experience in this study accounted for 40.9% of variance in the users of each type of rec-reation area.
Factor analysis was used to group motivation items into domains. It was found that the 18 items of rec-reation motivation could be grouped into 5 do-mains. The first motivation domain was motivation for physical development and self-reliance. The second motivation domain was motivation for re-laxing, escaping from crowds and noise, and find-ing solitude. The third domain was motivation for safety, comfort, and social bonding. The fourth do-main was motivation for nature experiencing and learning. The last domain was motivation for es-caping from routine and cultural learning. The cu-
Table 3: Factor loading of recreation motivation (n=1,550).

Visitor Monitoring Methods, Modeling and Data Management
346
mulative percent of variance for the 5 factors was 60.65%. Factor loading of each motivation item within each domain is presented in Table 3.
As for recreation activities, it was found that most visitors to nature-based recreation areas engaged in more than one type of recreation activity. The av-erage number of activities engaged in by each in-dividual was 3.89. The type of recreation area with highest average number of engaged recreation ac-tivities was islands (5.01) while the lowest num-ber was caves (3.03). The top 5 activities in which visitors engaged were sight seeing, relaxing, tak-ing photos, picnicking, and playing in waterfalls. The percentage distribution of visitors to each type of recreation area, classified by engaged recreation activities, is presented in Table 4. Most activities were general recreational activities that did not re-quire the individual characteristics or the particu-lar resources available at the particular site of rec-reation. The recreation activity pattern found in Thailand’s nature-based recreation areas differed from the pattern found in Western countries (Gart-ner & Lime, 2000; Haas, 2001).
Findings from this study led to the development of Recreation Opportunity Spectrum of Thailand’s nature-based recreation areas. They also contrib-uted to the country’s policies related to recreation management. Maintaining recreation diversity be-comes a new task to be achieved in the near future. More in-depth research on recreation diversity is also required.
References
Gartner, W.C. & D.W. Lime. (2000). Trends in Outdoor Recreation, Leisure and Tourism. New York.
Haas, G. (2001). Conserving Recreation Diversity: Collab-orating Across Boundaries.
http://www.georgewright.org.
Tanakanjana, N., Arunpraparut, W., Pongpattananurak, N., Nuampukdee, R., & Chumsangsri, T. (2006). A Final Report of the Project “Decision Support System for Sustainable Management Planning of Nature-based Recreation Areas”. A Report Submitted to Thailand Research Fund. Kasetsart University. Bangkok.

Siegrist, D., Clivaz, C., Hunziker, M. & Iten, S. (eds.) (2006). Exploring the Nature of Management. Proceedings of the Third International Conference on Monitoring and Management of Visitor Flows in Recreational and Protected Areas.
University of Applied Sciences Rapperswil, Switzerland, 13-17 September 2006. Rapperswil.
347
MASOOR: The Power to Know – A Story About the Development of an Intelligent and Flexible Monitoring Instrument
Rene Jochem, Rogier Pouwels & Peter A.M. Visschedijk
Alterra Green World Research, The Netherlands
[email protected]@wur.nl
Keywords: Agent based modelling, MASOOR, recreation, visitor, nature management.
Introduction
Dutch managers of nature areas follow the policy of open nature areas (Ministerie van LNV 2005). In this way they allow people to experience, ben-efit from and develop an interest in wildlife and geology. This will benefit people‘s health and al-low visitors to experience other valued aspects of visiting the countryside such as tranquillity, open space, fresh air, unpolluted waters and scenery. The last decades the managers are confronted with an increasing amount of visitors. The policy of open nature areas for recreation can conflict with the policy of protecting species in these areas. De-cision makers and managers need tools to plan and manage lands to accommodate increasing human use while at the same time, maintaining the eco-logical integrity of the landscape (Gimblett 2005). The tool should be able to analyze and evaluate biodiversity and recreation integratively (Pouwels et al. 2006). In this paper we focus on the recre-ation modelling as part of this tool. More specifi-cally, we describe the MASOOR model, an intel-ligent and flexible model that has been developed for front country situations.
Recreation models: the need for an intelligent and flexible model
In general, a recreation model should:
1. analyze and integrate monitoring data
2. evaluate future plans
3. transfer model results to different spatial scales
4. be flexible to different sites
5. be able to use local knowledge and data
6. be meaningful for stakeholders
Simulation models such as RBSim 2 (Itami et al. 2000, Lawson et al. 2002), Wilderness area Simu-lation Model (Wagtendonk 2004), Extend (Lawson et al. 2003) and GCRTSim (Roberts et al. 2002) have been developed, specifically to establish the optimum level of use of a wilderness area with regard to crowding. These models have been ap-plied to back country areas in Australia and USA that have an extensive or moderate path density. As a result, they often use ‘typical travel itiner-aries’ (Arrowsmith & Chhetri 2003). However, in urban societies like the Netherlands, nature areas have a large recreational accessibility and a high path density. Although some visitors will follow ‘typical trips’, a large percentage will choose their route on other aspects like landscape characteris-tics (vegetation, diversity), path characteristics, and crowding (Hull & Stewart 1995, Tahvanain-en et al. 2001). This raised the need for an intelli-gent and flexible model in which agents are able to make a lot of choices (Elands & Marwijk 2005).
Spatial-agent based models linked directly to geo-graphical information systems hold great promise for studying complex systems such a wildlife pop-ulation dynamics, human behaviour, traffic flows and other phenomena (Gimblett 2005, Itami & Za-non 2003). We explored several types of simula-tions in ecological applications in population dy-namics and dispersion models (Verboom 1996; Vos et al. 2002) before developing a recreation-al model. Pedestrian movement models have been

Visitor Monitoring Methods, Modeling and Data Management
348
The world model
We treat the environment or natural area as a fixed and closed system with a limited number of fixed entry points. Typical gates are car parks, village centres and railway stations. These gates are pro-jected on the nodes of a track network. Recreational agents are arriving in the modelled area at the gates. Each gate can contain one or more sources that re-lease the different agent types, with their own ar-rival distributions, simultaneously into the simula-tion (see figure 2).
The individual tracks in the network are used by the agents to ‘walk’ along, and are attributed for their surface type, attraction and other character-istics. These attributes make it possible to select paths that specific types of agents prefer. In some phases agents choose an attraction as a distant goal. These attractions can be presented as the nodes of the network, like a pub or tea room, or in the form of a grid, representing an attractive area.
Agent movement behaviour
The logic of the movement control module is based on a Hierarchical control system com-monly used in robotics and intelligent agents (e.g. Kronreif & Furst 2001). This system is di-vided in three sub modules: planner-navigator-pilot.
1. The planner in MASOOR selects attractions and other global goals to achieve. It also keeps track of the time spent, and will change the phase1 if re-quired.
1 The modular framework provides a flexible way to implement different types of agents. The simplest implementations use three phases in the agent’s visit to the recreational area. In the first phase the agent is entering the area and leaving the entrance. In the second phase the agent has a more exploratory behavioral characteristics, it is browsing around in the more attractive areas. In the last phase the agents is making its way back to the entrance.
Figure 2: Graphic representation of a network.
developed since the 1970s. Recent developments in modelling techniques, and especially advanc-es in agent based simulation, artificial intelligence and robotics, open up the possibility of developing integrated and complex models.
MASOOR
The MASOOR (Multi-Agent Simulation Of Out-door Recreation) model is an agent-based model that focuses on the simulation of the behavioural aspects of recreational movement in natural areas.
In the model, we adopt a holistic, agent based ap-proach to the individual movement of recreation-al users. An agent is an identifiable object in the computer‘s memory, which is autonomous, and goal-directed (Hayes 1999). Agents are autono-mous in that they are capable of effective indepen-dent action, and their activity is directed towards the achievement of a defined task or goal. In our case the agent is spatially located and aware of its location. The main task for our agents is to navi-gate through a network of paths and to achieve one or more recreational goals (such as visiting a cer-tain attraction, or walking for 2 hours).
The navigational implementation of the agents is adopted from artificial intelligence robotics, in the form of a Nested Hierarchical Controller. This al-lows us to build a modular framework that sim-ulates behaviour on different geographical scales. The framework consists of a movement con-trol module and a ‘world model’ (see figure 1). The world model is spatially explicit and directly linked to a GIS.
'World model'
Agent Movement Behavior
Planner
Pilot
Navigator
Figure 1: The framework of MASOOR.

Visitor Monitoring Methods, Modeling and Data Management
349
2. The navigator converts the results of planning to an increased level of resolution by adding ad-ditional information and setting the limits for the pilot.
3. The pilot implements the results of navigation and transforms the abstract commands of the nav-igator into actual movement selections. The navi-gator leaves a number of alternatives for the pilot. The pilot is able to make a choice between the dif-ferent alternatives by using a composite of simple rules. The results of those rules are evaluated by using multiple criteria analysis and by applying a fuzzy selection algorithm.
Each of these systems is operating on its own geo-graphical scale. In the dynamic operation of the model, agents use the three levels of behaviour to navigate and find their way around the network. We assume one or more phases in the agent‘s vis-it. In each of those phases the goals and behaviour are adjusted.
Applications and future develop-ments
MASOOR is still being in development. The appli-cation of MASOOR in a number of case studies:
Wadden Sea Area (2003)Pilot study, goal: development of behavioural rules
Veluwe (Grobben 2004)Pilot study, goal: stakeholder acceptance
Dwingelderveld (Elands et al. 2005)Academic study, goal: developing parameters recreation and nature quality)
PROGRESS (Henkens et al. 2006)Implementation study in New Forest and Fon-tainebleau, goal: planning, future scenarios and visitor management.
Future developments of MASOOR include:
Calibration of the model using GPS data
Establishing links to regional and national scale models such as FORVISITS (Henkens et al. 2005)
Developing rules of thumb for national models
References
Arrowsmith, C. & Chhetri, P. (2003). Port Campbell Na-tional Park: Patterns of Use. A report for the develop-ment of a visitor typology as input to a generic model of visitor movements and patterns of use. Melbourne.
Elands, B. & Marwijk, R. v. (2005). Expressing recreation quality through simulation models: useful manage-ment tool or wishful thinking? (Paper presented at the 11th International Symposium on Society and Natural Resource Management, June 16-19, Östersund , Swe-den ed.). Wageningen.
Elands, B., Marwijk, R. v., Jochem, R., Pouwels, R. & Boer, T. A. d. (2005). Natuur in Nederland: recreatie en bio-diversiteit in balans. Een modelstudie naar recreatie-kwaliteit. Wageningen.
Gimblett, H. R. (2005). Modelling Human-Landscape In-teractions in Spatially Complex Settings: Where are we and where are we going? Paper presented at the MODSIM 2005 International Congress on Modelling and Simulation, Modelling and Simulation Society of Australia and New Zealand, December 2005.
Grobben, M. S. (2004). Networks in the heart of the Veluwe: A participative scientific method for balanced function combination of nature and recreation in and around na-ture areas (Alterra-rapport 997). Wageningen.
Hayes, C. C. (1999). Agents in a nutshell—A Very Brief In-troduction. In: IEEE Transactions on Knowledge and Data Engineering (11/1), p 127-132.
Henkens, R. J. H. G., Jochem, R., Pouwels, R. & Visschedijk, P. A. M. (2006). Development of a zoning instrument for visitor management in protected areas. In: Siegrist, D., Clivaz, C., Hunziker, M. & Iten, S. (eds.) (2006). Explor-ing the Nature of Management. Proceedings of the ThirdInternational Conference on Monitoring and Manage-ment of Visitor Flows in Recreational and Protect-ed Areas. University of Applied Sciences Rapperswil, Switzerland, 13-17 September 2006. Rapperswil.
Henkens, R. J. H. G., Vries, S. d., Jochem, R., Pouwels, R., & Reijnen, M. J. S. M. (2005). Effect van recreatie op broedvogels op landelijk niveau : ontwikkeling van het recreatiemodel FORVISITS 2.0 en koppeling met LARCH 4.1. Wageningen.
Hull, R. B. & Stewart, W. P. (1995). The landscape encoun-tered and experienced while hiking. In: Environment and behavior (27/3), p 404-426.
Itami, R. M., MacLaren, G. S., Hirst, K. M., Raulings, R. J. & Gimblett, H. R. (2000). RBSIM 2: Simulating hu-man behavior in National Parks in Australia. Integrat-ing GIS and Intelligent Agents to predict recreation conflicts in high use natural environments. Paper pre-sented at the 4th International Conference on Integrat-

Visitor Monitoring Methods, Modeling and Data Management
350
ing GIS and Environmental Modeling (GIS/EM4): Problems, Prospects and Research Needs, Banff, Al-berta, Canada, September 2 - 8, 2000.
Itami, R. M. & Zanon, D. (2003). Visitor Management Mod-el for Port Campbell National Park and Bay of Islands Coastal Reserve: Phase 2 Simulation. Brunswick, Vic-toria Australia: GeoDimensions Pty Ltd.
Kronreif, G. & Furst, M. (2001). TCP-based communica-tion for task oriented programming and control of het-erogenous multi-robot-systems. Paper presented at the International Symposium on Robotics, Seoul/Korea.
Lawson, S. R., Itami, B., Gimblett, R. & Manning, R. E. (2002). Monitoring and Managing Recreational Use in Backcountry Landscapes Using Computer-Based Sim-ulation Modeling. Paper presented at the Workshop: Travel Simulation Modeling for Recreation Planning, Rovaniemi, Finland.
Lawson, S. R., Manning, R. E., Valliere, W. A. & Wang, B. (2003). Proactive monitoring and adaptive man-agement of social carrying capacity in Arches Nation-al Park: an application of computer simulation model-ing. In: Journal of Environmental Management (68), p 305-313.
Pouwels, R., Elands, B. & Opdam, P. F. M. (2006). Inte-grating Recreation and Biodiversity in Urban Soci-eties: Goals, monitoring and modelling approach-es at different scales. In: Siegrist, D., Clivaz, C., Hunziker, M. & Iten, S. (eds.) (2006). Exploring the Nature of Management. Proceedings of the ThirdInternational Conference on Monitoring and Manage-ment of Visitor Flows in Recreational and Protect-ed Areas. University of Applied Sciences Rapperswil, Switzerland, 13-17 September 2006. Rapperswil.
Roberts, C. A., Stallman, D. & Bieri, J. A. (2002). Modeling complex human–environment interactions: the Grand Canyon river trip simulator. In: Ecological Modelling (153), p 181–196.
Tahvanainen, L., Tyrvainen, L., Ihalainen, M., Vueorela, N. & Kolehmainen, O. (2001). Forest management and public perceptions: visual versus verbal information. In: Landscape and Urban Planning (53), p 53-70.
Verboom, J. (1996). Modelling fragmented populations: be-tween theory and application in landscape planning (PhD thesis) (Vol. 3). Wageningen, The Netherlands: Forestry and Nature Research (IBN–DLO).
Vos, C. C., Baveco, H., Chardon, P. & Goedhart, P. (2002). The role of habitat heterogeneity on dispersal in agri-cultural landscapes. In: Landscape Ecology (submit-ted).
Wagtendonk, J. W. v. (2004). Simulation modeling of visitor flows: where have we been and where are we going? In: Sievänen, T. et al. (2004)(eds.). Policies, Methods and Tools for Visitor Management – Proceedings of
the Second International Conference on Monitoring and Management of Visitor Flows in Recreational and Protected Areas, June 16-20, 2004, Rovaniemi, Fin-land. Rovaniemi.

Siegrist, D., Clivaz, C., Hunziker, M. & Iten, S. (eds.) (2006). Exploring the Nature of Management. Proceedings of the Third International Conference on Monitoring and Management of Visitor Flows in Recreational and Protected Areas.
University of Applied Sciences Rapperswil, Switzerland, 13-17 September 2006. Rapperswil.
351
Monitoring Commercial Operators’ Movements in Terrestrial and Marine Protected Areas in Australia: A Review of
Challenges for Emerging Technologies
Jan Warnken
Griffith University Gold Coast, Australia
Keywords: Commercial operators, monitoring, vehicle tracking, GPS, issues.
Introduction
Recent work by Wardell and Moore (2004) on visi-tor monitoring systems for national parks found that most Australian park agencies relied on traditional, unsophisticated yet robust sampling technology for capturing visitor data in the field. These technol-ogies included mechanical (and occasionally dig-ital) car counters, walking trail registration log-books, localised surveys and visitor questionnaires, entrance fee records, and web-based surveys. Re-cently, some park agencies (e.g. CALM WA) start-ed to introduce a limited number of GPS-based ve-hicle tracking systems for marine operators (Shark Bay NP).
The majority of these technologies provide only spatially or temporally limited information about visitor movements within protected areas. With-out more detailed and long-term data, management planning decisions are based on managers’ percep-tions and influenced by external and financial and political pressures (Pitts and Smith 1993). Plan-ning based on predominantly subjective observa-tions can become problematic when trying to find the most efficient solution for striking a balance be-tween conservation and visitor recreation.
The advent of inexpensive, mass-produced IT-based tracking and communication devices has opened a range of opportunities for developing solutions that would allow ongoing, automatic and remote col-lection of visitor movements in protected areas. In Australia, the initial focus for such technology is on commercial tour operators. Currently, the vast majority of commercial tour providers legally op-
erating in National Parks and other relevant pro-tected areas have to apply for a time-limited permit under relevant nature conservation statutes (Buck-ley et al. 2001). In some areas, they also have to collect and pay entrance fees (e.g. Kosciusko Na-tional Park, Snowy Mountains) or an environmen-tal management charge (EMC, Great Barrier Reef) for their clients on a per capita and day basis. This provides mostly reliable information about the gen-eral commercial use of these areas, but very little data in terms of individual sites targeted by these operators. Some national or international icon sites or sites with special recreational infrastructure (e.g. diving pontoons) are firmly incorporated on itiner-aries of larger companies (e.g. Quicksilver, Aries (glow worm tours – Natural Bridge, CERRA)) and are visited daily, unless weather conditions impose such risks to call for a cancellation of the entire trip. In these cases, visitor fees would provide a good in-dication about some aspects of commercial usage of sites within protected areas.
Australia, however, has many protected areas that provide visitors with self-drive or smaller guided tours and, therefore, opportunities to select from a number of sites for their visits’ itineraries. Fraser Is-land, the bareboat charter industry in the Whitsun-day Islands and most national parks in the Austra-lian Outback are typical examples. Many of these tours also encompass overnight stays (camping, an-choring) which tend to have greater localised im-pacts than short sight-seeing visits. Other types of operators without any site-specific itinerary in-clude megafauna viewing charters, dive charters, and estuary and deep sea fishing tours.

Visitor Monitoring Methods, Modeling and Data Management
352
The majority of these operators rely on vehicles which can be tracked by a range of technologies, in-cluding magnetically or electrically coupled RFID tags, E-tags (microwave transponders) and their rel-evant readers linked to a central database for cross referencing, mobile phone field strength readings, fleet management systems, recently developed GPS-based highway toll collect systems, and even military battlefield combat ID systems (BCIS). The successful application of any of these systems is determined by their costs, which include
production and installation of the transponder and ‘interrogator’ devices (incl. development or adaptation, applicability),
supply of power to various system elements,
reliability of position information and spatial resolution under problematical field conditions (dense canopies, deep gorges, etc.),
the object to be monitored,
transmission of collected information to a data processing centre, and
maintenance and ‘half-life’ of all equipment un-der field conditions in remote areas.
Methods
This paper tries to determine a range of robust, cost-effective and adaptable systems for monitor-ing commercial tour vehicles in protected areas in Australia based on the above criteria, a review of functional and technical (hardware, data capture and transfer, wireless communication) aspects of current object (vehicle) tracking technology, and spatial aspects of tour operations in Australia (e.g. the location of national parks in Australia in re-lation to major tourism nodes and mobile phone networks (coverage of existing and emerging sys-tems: CDMA, GSM, 3G)). Additional feedback from consultations with a range of PAMs, oper-
Technological principle Basic requirements Examples Objects
A) location restricted/dependent 1.) sensing of signals
emitted by object (movement/ optical)
a ‘natural’ signal emitted by the object of interest strong enough to allow detection against background signal / ‘noise’ (and natural variations in background signal)
track counters (digital, ground vibration), wireless sensor networks (WSN) with motion detection motes, vis-video surveillance, infrared image analyses, . . . .
Visitors on foot, vehicles (engine heat)
2.) detecting reflection of signals emitted from a base station (pinging)
detection of a reflection of a unique (strong) signal (often coupled with information from transponder)
military or commercial radar (commercial aircraft and vessel traffic surveillance systems, speed radar), sonar (U-boat or mine detection, fish finder, etc.)
Vehicles
3.) detection of specifictransponder signal (tagging)
some type of unique ID tag (actively or passively transmitting object info) to be fixed to object of interest, and one or several local receivers (beacons or base stations) to detect presence / position of ID tag
RFID tags, swipe cards, toll bridge systems, mobile phone / PDA tracking, vehicle location systems, aircraft transponder . . . .
Visitors and vehicles supplied / fitted with tags
B) location unrestricted/independent GPS-based access to GPS signal
(satellites) and mechanisms for data storing and/or data transmission to central processing unit.
fleet (vehicle, trailer, container) management systems, fishing vessel tracking (QFS BNE), truck toll system for German highways . . . .
Visitors and vehicles supplied / fitted with GPS receivers and data logging and/or data transmission devices
Table 1: Vehicle tracking concepts and examples of existing technology.

Visitor Monitoring Methods, Modeling and Data Management
353
ators and vehicle tracking system managers (e.g. the Vessel Monitoring System (VMS)), was used to further identify some of the challenging legal and data management aspects and constraints of such visitor monitoring systems.
Results
From a VMS point of view, commercial opera-tions in PAs can be subdivided into guided tours and self drive tours using hired vehicles. Both com-monly require a license issued by PAMs under rele-vant nature conservation legislation, which, in the-ory, enables managers to require implementation of a VMS. The range of vehicles used by commercial operators for providing access to PAs in Australia include cars, 4WDs, minibuses, campervans, bus-es and trucks and also any type of vessel (aircraft are not included as they are already closely moni-tored through air traffic control systems). In theory, there are three principal concepts of vehicle track-ing technology (table 1).
Technologies listed under A1 – A3 were not con-sidered further as candidates for widespread imple-mentation: they were either expensive (A2), limit-ed to short distances (A3, passive ID tags), heavily service-reliant (A3, energy supply and maintenance to tag readers), not capable of identifying individu-al (unique) objects (A1, track counters), or consid-ered too intrusive (A1, video surveillance – object tracking).
In the Australian context, GPS-based vehicle track-ing systems were regarded as the most promising solution for collecting more detailed information about visitor movements in terrestrial as well as marine PAs in Australia:
most of its vegetated areas are eucalypt dominat-ed, dry sclerophyll communities with open can-opies and good GPS reception;
all areas have mostly good GPS satellite cover-age;
most tourism hotspots in PAs are isolated (even data subject to a GPS error of 100m would still allow identification of the actual route(s) tak-en);
independent of local sensor equipment, the same technology can be used for terrestrial as well as marine areas;
well proven and developed technology (trans-port and logistics industry);
ongoing reduction in costs for system hardware (on board units) and data transfer (via mobile phone network).
GPS-based VMS can be implemented using a va-riety of already existing hardware modules. These range from portable, handheld GPS-assisted PDAs to hardwired specialised onboard tracking units (Figure 1). All systems will require some post-event processing on one or several servers using special ‘back-end’ software for producing a range of rele-vant reports depending on the specific information needs of each end user. Whether these systems can provide real-time location and status information or only post-event data depends on cellular phone net-work coverage (data transfer via satellite, e.g. In-marsat C, is generally cost prohibitive). Online real time vehicle tracking systems (VTS) are already in use for public transport providers (municipal bus company, Perth) and large mining and truck com-panies. A visual analysis of GIS overlay data (see maps in Appendix) of mobile phone coverage in Australia, however, suggests that the majority of VTS for PAs, if implemented, will only provide post-event data collection systems.
Another key element of most VTSs is their capabil-ity of accepting additional data input (usually relat-ing to vehicle performance), which can be extended to record the number and type of visitors or clients carried on each trip, possibly even by tapping into the operators’ business system via a Bluetooth con-nection. Another alternative would be post-hoc processing of data packages with trip details and a unique ID number at the backend VTS server and its data processing software. A simple GIS overlay analysis with areas or nodes attracting fees in indi-vidual parks can then be employed to automatical-ly generate charges on a per visitor and per site ba-sis. The backend system can be further extended to link with automatic pay systems so that payments for charges created by the VTS can be electronical-ly transferred to the relevant conservation manage-ment agencies (similar to already existing road toll collect systems in Europe and Australia).
A further encouraging aspect for developing VTS-based visitor monitoring systems in Australia is the recent implementation of industry-wide stan-

Visitor Monitoring Methods, Modeling and Data Management
354
dards for data collection, management and securi-ty by VTS providers under the Transport Certifica-tion Authority’s (TCA) Intelligent Access Program (IAP) in 20051. In other terms, most technical is-sues with VTSs are already largely solved or can be solved by using off-the-shelf hardware and soft-ware available for other applications, mostly in the transport sector. There are, however, a number of constraints for implementing a VTS-based tour operator moni-toring system in Australian PAs. These are linked in the first instance to data ownership, existing li-cence and entry fee structures (reflecting the vari-ety of philosophies of PAMs about user pays sys-tems), and the general mindset about the so-called ‘big brother’ syndrome of the system’s key stake-holders: PAMs, operators, visitors and the gener-al public. The first and foremost issue relates to ownership of the positional data that would be generated by the VTSs. In the first instance, operators should be en-titled to receive data about their own movements on a per trip or per week, month or year basis as
1 National Transport Commission (Model Legislation – Intelligent Access Pro-gram) Regulations 2005 (Cth).
part of the lease agreement with their VTS service provider. Where implementation of a VTS is pre-scribed as part of an operational condition of a li-cense or permit required and issued by PAMs, the license provider should also be enabled to extract all data relating to its licencees free of charge, espe-cially for compliance monitoring. In this case, oper-ators would be required to agree to such data trans-fer as part of their licence conditions. The set of questions associated with data ownership becomes more complex when management agencies (e.g. road transport authorities or state tourism manage-ment and marketing agencies ) interested in traffic and visitor flows wish to access VTS data:
whether and to what extend can these data be re-leased (and in what format) with or without per-mission of the operator, whether fees can be charged, and if, how should such payments be distributed between the VTS service provider and the PAM agency,who will be held responsible for insuring that such data are safely stored and not being re-leased for wrongful purposes?
Based on feedback from current operations, these things have not been fully considered in the Austra-lian VTS landscape.
Figure 1: Hardware and server components for vehicle tracking systems.

Visitor Monitoring Methods, Modeling and Data Management
355
Another aspect of PA management in Australia complicates matters further: each State and Terri-tory has passed its own jurisdiction for setting li-cence and entry fees under nature conservation legislation2, or for road maintenance, use and man-agement under transport legislation. This requires more work and, more importantly, much more con-sultation to develop and implement a national data capture and data filter (backend) system to reduce costs and improve efficiency. Without such a na-tional system, other users of PAs (self-drive tourists using hire vehicles or private users) are less likely to adopt VTSs for automatic payment of park fees.
One of the key constraints for a VTS-based visitor monitoring system is the currently low or very low licence and park-entry fees. In Queensland, for ex-ample, use of National Parks by non-commercial visitors does not attract a fee at all. The EMC for visiting the Great Barrier Reef, on the other hand, has been set at AUD 4.50 per person per day for most operations. There are also no fee structures in the current systems that take into account the environmental sensitivity, managerial effort or op-erational expenses within individual parks. Costs for leasing a VTS (hardware, communication, and server support) are currently around AUD 100-150.- per vehicle and month. VTS not only provide visitor monitoring data and deliver fees, they also provide means for compliance monitoring (hard-wired systems only). A full cost benefit analysis in-cluding all these aspects has yet to be undertaken in the Australian context.
One of the biggest hurdles for implementing any visitor monitoring system in Australia is the na-tionwide objection against any form of govern-mental control, monitoring and surveillance. Typi-cal examples are common road safety enforcement technologies such as red light and speed cameras and even driver’s licence demerit point systems in different states. These were either introduced much later than for example in Europe or, in re-gard to demerit points, are not fully cross-linked between States. A driver with a Queensland licence who was caught speeding in NSW will have to pay his/her fine, yet the accompanying deduction in demerit points will not necessarily be recorded in
2 e.g. Environmental Protection (Biodiversity Conservation) Act 1999 (Cth), Nature Conservation Act 1992 (Qld), National Parks and Wildlife Act 1974 (NSW), National Parks and Wildlife Act 1972 (SA).
Queensland. Other examples include the slow up-take of remote sensing technologies for monitor-ing land clearing and other agricultural practic-es, despite Australia’s nearly ideal environmental conditions (e.g. generally low cloud cover and flat, sparsely vegetated terrain).
Conclusions
Australia’s vast and empty landscapes and, in most areas, its thin population base present an excel-lent case for introducing an efficient and effective GPS-assisted, VTS-based system for monitoring and surveying movements of visitors on commer-cial tours using PAs. Based on this first qualitative scoping study, the key impediments to introducing such sophisticated visitor monitoring technology are, in the first instance, legal aspects of data own-ership, the complex nature of Australian nature conservation legislation, and ultimately and most importantly, the general resistance of key stake-holders to anything related to the ‘big brother’ con-cept of ongoing, remote surveillance.
References
Wardell, M.J. & Moore, S.A. (2004). Collection, storage and application of visitor use data in protected areas (Guiding principle and case studies). Sustainable Tour-ism Collaborative Research Centre (STCRC) Techni-cal Report Series, STCRC, Gold Coast, Australia.
Pitts, D. & Smith, J. (1993). A visitor monitoring strategy for Kakadu National Park. Tracks to the Future: Man-aging Change in Parks and Recreation: Royal Austra-lian Institute of Parks and Recreation National Con-ference, Cairns, Queensland, Sept. 1993, RAIPR, Dickson, ACT, Australia.
Buckely, R.C., Witting, N. & Guest, M. (2001). Managing People in Australian National Parks Vol 2: Commer-cial Operations Management. Sustainable Tourism Collaborative Research Centre (STCRC) Technical Report Series, STCRC, Gold Coast, Australia.

Siegrist, D., Clivaz, C., Hunziker, M. & Iten, S. (eds.) (2006). Exploring the Nature of Management. Proceedings of the Third International Conference on Monitoring and Management of Visitor Flows in Recreational and Protected Areas.
University of Applied Sciences Rapperswil, Switzerland, 13-17 September 2006. Rapperswil.
356
Spatio-Temporal Variations of Visitors of Recreational Shellfish-Gathering at an Artificial Beach in Tokyo Bay
Ryoichi Yamanaka, Motohiko Murai, Yoshiyuki Inoue & Susumu Fujiwara
Yokohama National University, Japan
[email protected]@[email protected]
Keywords: Shellfish-gathering, Uminokouen, Ruditapes philippinarum, image analysis, video camera, visitor impact.
Introduction
The Uminokouen is an artificial sand beach lo-cated in Tokyo Bay, Japan. A significant number of the people visit this park for shellfish-gather-ing (seashell-digging) every spring. The present study focuses on the time variations of spatial structure of visitors of recreational shellfish-gathering in the Uminokouen. Field observa-tions using video cameras are conducted and an image analysis technique is applied to quantify the distribution of visitors and to clarify affec-tors of human procedure in the intertidal zone during the shellfish-gathering.
According to the image analysis, it is found that the people move to more shallow areas appear-ing in ebb tide as time goes on and it seems that the human procedure during the shellfish-gath-ering is mainly affected by the tidal condition and topographic features.
The Uminokouen is a shallow artificial sand beach located in Tokyo Bay, Japan, as shown in figure 1. The width of the ebb tide beach from the shore line is approximately 120 m. The dom-inant species in the intertidal zone is the short-necked clam (Ruditapes philippinarum). Peo-ple can enjoy shellfish-gathering freely in the beach. The high season of the shellfish-gather-ing is in consecutive national holidays around the beginning of May, as shown in figure 2. Due to this recreational shellfish-gathering, the clam resource is drastically decreased after this sea-son every year (Kudo 2002). Fortunately, the
clam resources have recovered naturally so far. However, there is a possibility that destruc-tion of natural clam resources will occur if such shellfish-gathering is continued. Therefore, it is necessary to quantify the visitor impact of the shellfish-gathering to the clam resources.
Figure 1 Observation site “Uminokouen”
500m
Uminokouen
Hakkeijima Island
Tokyo BayKanazawa Bay
Hiragata Bay
Uminokouen-minami station
Uminokouen-shibaguchi station Tokyo Bay
Tokyo
Yokohama
Point-A
Point-B
N
Figure 1: Observation site “Uminokouen”.
Figure 2: Photograph of the shellfish-gathering in the Uminok-ouen at 9:56 May 8, 2005, which was taken from point-B shown in Figure 1.
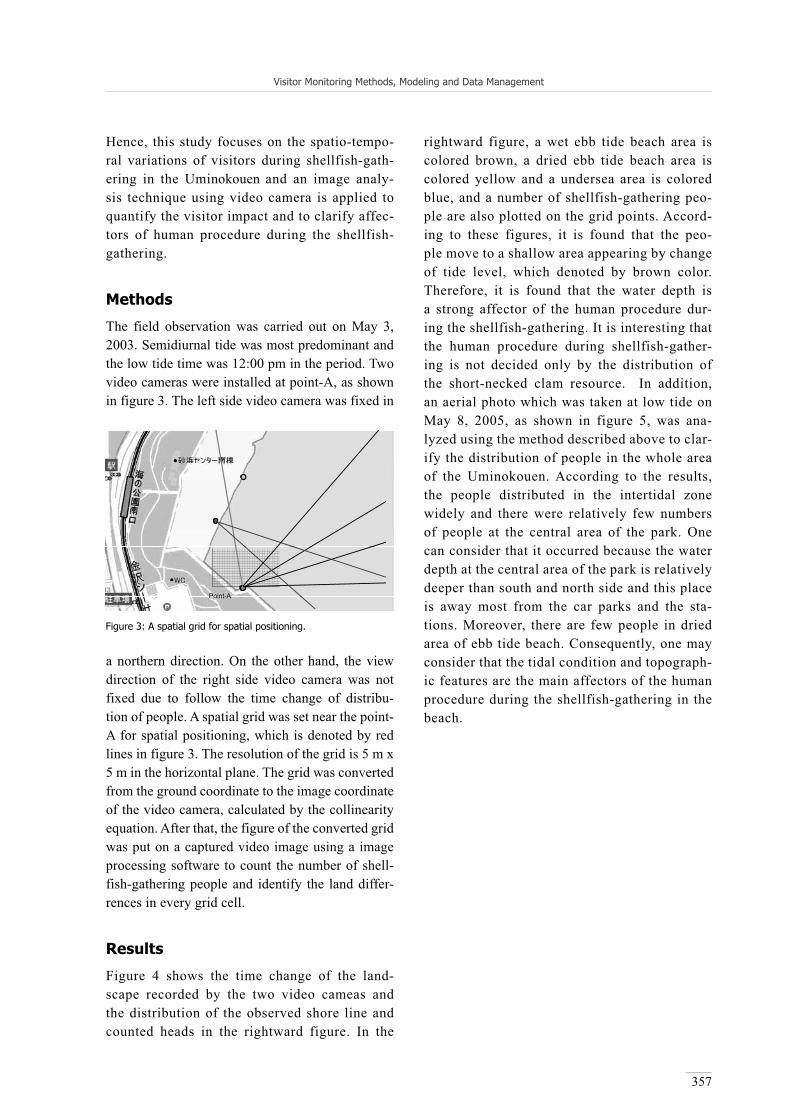
Visitor Monitoring Methods, Modeling and Data Management
357
Hence, this study focuses on the spatio-tempo-ral variations of visitors during shellfish-gath-ering in the Uminokouen and an image analy-sis technique using video camera is applied to quantify the visitor impact and to clarify affec-tors of human procedure during the shellfish-gathering.
Methods
The field observation was carried out on May 3, 2003. Semidiurnal tide was most predominant and the low tide time was 12:00 pm in the period. Two video cameras were installed at point-A, as shown in figure 3. The left side video camera was fixed in
a northern direction. On the other hand, the view direction of the right side video camera was not fixed due to follow the time change of distribu-tion of people. A spatial grid was set near the point-A for spatial positioning, which is denoted by red lines in figure 3. The resolution of the grid is 5 m x 5 m in the horizontal plane. The grid was converted from the ground coordinate to the image coordinate of the video camera, calculated by the collinearity equation. After that, the figure of the converted grid was put on a captured video image using a image processing software to count the number of shell-fish-gathering people and identify the land differ-rences in every grid cell.
Results
Figure 4 shows the time change of the land-scape recorded by the two video cameas and the distribution of the observed shore line and counted heads in the rightward figure. In the
rightward figure, a wet ebb tide beach area is colored brown, a dried ebb tide beach area is colored yellow and a undersea area is colored blue, and a number of shellfish-gathering peo-ple are also plotted on the grid points. Accord-ing to these figures, it is found that the peo-ple move to a shallow area appearing by change of tide level, which denoted by brown color. Therefore, it is found that the water depth is a strong affector of the human procedure dur-ing the shellfish-gathering. It is interesting that the human procedure during shellfish-gather-ing is not decided only by the distribution of the short-necked clam resource. In addition, an aerial photo which was taken at low tide on May 8, 2005, as shown in figure 5, was ana-lyzed using the method described above to clar-ify the distribution of people in the whole area of the Uminokouen. According to the results, the people distributed in the intertidal zone widely and there were relatively few numbers of people at the central area of the park. One can consider that it occurred because the water depth at the central area of the park is relatively deeper than south and north side and this place is away most from the car parks and the sta-tions. Moreover, there are few people in dried area of ebb tide beach. Consequently, one may consider that the tidal condition and topograph-ic features are the main affectors of the human procedure during the shellfish-gathering in the beach.
Figure 3: A spatial grid for spatial positioning.
Point-A

Visitor Monitoring Methods, Modeling and Data Management
358
(a) at 10:00
(b) at 12:00
(c) at 14:00
(d) at 15:00
Figure 4: Video pictures by two video cameras with the converted grid, and the diagram of counted heads and the observed shore line at every grid cell.

Visitor Monitoring Methods, Modeling and Data Management
359
References
Kudo, K. (2002). The comparison of biological productiv-ity between a natural beach and an artificial beach. Kouseisya-kouseikaku. Role of Fisheries in Environ-mental Management and Remediation, p 71-85. [in Japanese].
Figure 5: Aerial photo which was taken at low tide in May 8, 2005 provided by The Mainichi Newspapers Co., Ltd.
360
Visitor / User Conflicts and other Behavior Studies
Norman Backhaus (Chair)

Siegrist, D., Clivaz, C., Hunziker, M. & Iten, S. (eds.) (2006). Exploring the Nature of Management. Proceedings of the Third International Conference on Monitoring and Management of Visitor Flows in Recreational and Protected Areas.
University of Applied Sciences Rapperswil, Switzerland, 13-17 September 2006. Rapperswil.
361
Assessing User Conflicts in an Urban Forest by Long-Term Video Monitoring
Arne Arnberger & Renate Eder
University of Natural Resources and Applied Life Sciences, Austria
[email protected]@boku.ac.at
Keywords: Bicyclists, children, conflicts, urban forest, user behaviour, use levels, video monitoring, Vienna.
Introduction
Urban forests suffer from intense use and multi-use activities by fast and slow moving visitors such as bicyclists, joggers and walkers and are affected by inappropriate visitor behaviours such as releasing the dog from the leash. Therefore, user conflicts might be very likely to occur, in particular at heav-ily used main access points. Information about the kind and amount of user conflicts occurring during the year would assist area administration in forest management.
Methods
Long-term data on user conflicts were collected in an inner urban forest, which is situated in the south of Vienna, Austria. The inner urban forest of 120 hectares provides about 14 km of forest roads, gravel trails and many footpaths. Cycling is per-mitted only on two trails, and dogs are allowed, but must remain on a leash.
Video monitoring was undertaken at three main multi-use access points over a period of one entire year (2002-2003), daily from dawn to dusk (Arn-berger 2006). Each monitoring unit consisted of a weatherproof black-and-white video camera and a time-lapse video recorder. In order to avoid van-dalism and to allow for unobstructed observations, the cameras were hidden in nesting boxes. The cameras were installed on wood-poles about four meters above ground, or on roofs of buildings. The time-lapse video recorders captured single imag-es at fixed intervals of 1.6 seconds over the entire day. With the type of video camera installed and
its specific setting, it was impossible to iden-tify individuals in the video images, ensuring anonymity of the subjects. To reduce analysing costs, only 20 minutes of observations per each hour of the year were taken into account. The tapes were viewed on a television monitor by trained students. The following data were cap-tured from the video tapes: location, date and time of conflict, kind of conflict and activity type involved, and users’ reactions to conflict. In addition, on-site interviews with 952 visitors were conducted at access points on ten days.
Results
During the year of observation, 284 user con-flicts were recorded. This is a very small num-ber, compared to 239.000 visitors registered at the three access points. About half of the con-flicts were taped on workdays. While at week-ends, most conflicts occurred during the main visiting period in the afternoon; on workdays, conflicts occurred more often in the later hours of the day (Figure 1). Generally, the higher the use levels were, the more conflicts were re-corded, r = 0.240, p < 0.001. The decrease of user conflicts in autumn was obvious, while in March most of the conflicts (20% of all con-flicts) were recorded by video interpreters.
Most conflicts occurred between walkers and bicyclists (38% of all conflicts), followed by intra-activity conflicts of walkers (20%), con-flicts between walkers and joggers (18%) and walkers with maintenance cars (7%). Surpris-ingly low was the conflict potential between

Visitor / User Conflicts and other Behavior Studies
362
dogs and other users. Only 4% of conflicts were with dogs, although dogs were seen by forest visitors as the most annoying factor revealed by on-site interviews. Bigger groups were more likely to be involved in a conflict, in particular groups with children. While 17% of users in-volved in conflicts were children, the average share of children use was 8%. Some conflicts resulted in accidents, a fall from the bicycle; most often in displacement behaviour, stop of the activity, and alerting behaviour.
Highest shares of conflicts were videotaped at the entrance, where bicyclists could travel with high speed due to the paved surface of the main trail; and where maintenance cars for a local restaurant and many other user groups were present. Thus, mostly conflicts of walkers with fast moving users, i.e. bicyclists, joggers and cars, were recorded; more likely at high use times and over-proportionally involving children. Based on these results, forest man-agement should specifically target the conflict between bicyclists and walkers at the main ac-cess points.
Study limitations
Video recordings are an excellent source of in-formation about recreation use and therefore a useful management tool. This study provides information about user conflicts at three access points, however, not about the total amount of occurring conflicts. Such information would require a long-term monitoring of all trails within the forests. Due to precautions taken to ensure the anonymity of the subjects, result-ing in a relatively low image resolution of the black-and-white video images and a minimum distance between camera and visitor, video in-terpreters might have overlooked or misinter-preted some conflicts.
References
Arnberger, A. (2006). Recreation use of urban forests: An inter-area comparison. In: Urban Forestry & Urban Greening (4/3-4), p 135-144.
0%
5%
10%
15%
20%
25%
6 7 8 9 10 11 12 13 14 15 16 17 18 19 20
Time of day
Shar
es
Workday conflictsWeekend conflictsWorkday use levelsWeekend use levels
Figure 1: Daily progression of recreation use and user conflicts by weekends (including Saturdays and holidays) and workdays assessedby one-year video monitoring.

Siegrist, D., Clivaz, C., Hunziker, M. & Iten, S. (eds.) (2006). Exploring the Nature of Management. Proceedings of the Third International Conference on Monitoring and Management of Visitor Flows in Recreational and Protected Areas.
University of Applied Sciences Rapperswil, Switzerland, 13-17 September 2006. Rapperswil.
363
Sequence Effect on Satisfaction Regarding Perceived Crowding: Whitewater Rafters in Taiwan
Chih-Peng Fang1 & Yi-Chung Hsu2
1Taiwan Hospitality & Tourism College, [email protected]
2National Dong Hwa University, [email protected]
Keywords: Indicators, questionnaire design, recreational carrying capacity, standards.
Introduction
The correlation between perceived crowding and satisfaction tends to be weak (Manning, 1999). Questionnaire design, such as information provid-ed or the question sequence can affect respondents’ level of satisfaction (Manning et al., 2002; Schul & Schiff 1993). Most studies seldom indicated the se-quence of questions regarding perceived crowding and satisfaction. Thus, this study examined whether question sequence affected on satisfaction with re-gard to perceived crowding.
Methods
The study population comprised whitewater rafters on the HsiuKulan river in eastern Tai-wan between July 2001 and June 2002. Thir-ty-five sampling days were randomly selected. Questionnaires were distributed on-site. Re-spondents were aided by trained inteviewers. As a result, 2,402 valid questionnaires were ob-tained. The satisfaction qestion appeared first on the first page of the questionnaire. On the second page, directly following the quesion re-garding perceived crowding, the question re-garding satisfaction was asked again. A 5-point Likert scale was used for measuring satisfac-tion, ranging from 1 not at all satisfied to 5 very satisfied. Perceived crowding was measured by using a 9-point scale, ranging from 1 not at all crowded to 9 very crowded.
Results
The results were as follows:
(1) The level of satisfaction for the second measure was significantly lower than for the first measure (M = 3.75 vs. M = 4.06, p < .01).
(2) Of all subjects, 60% did not change their ans-wers, whereas 7% increased and 33% decreased their level of satisfaction.
(3) The education level of those whose answers for satisfaction did not change was significantly higher than that of subjcets whose answers changed.
(4) Table 1 shows that perceived crowding for those whose level of satisfaction decrease was highest, whereas perceived crowding for those whose level of satisfaction increase was the lowest. Thus a high degree of perceived crowding resulted in the de-creased satisfaction levels.
Conclusion
Two conclusions were drawn: First, the correlation between satisfaction and crowding is weak, con-sistent with literature. Second, respondents may over- or under-estimate their satisfaction level—the crowding question combined with the second satis-faction question gave respondents an opportunity to re-evaluate their satisfaction level. Analytical re-sults and conclusions have implications for outdoor recreation and satisfaction researchers, suggesting that two satisfaction questions and an intervening variable design deserve methodological attention in the future.

Visitor / User Conflicts and other Behavior Studies
364
References
Ajzen, I., Brown, T. C., & Rosenthal, L. H. (1996). Infor-mation bias in contingent valuation: Effects of person-al relevance, quality of information, and motivational orientation. In: Journal of Environmental Economics and Management (30), 43-57.
Dawson, C.P., & Watson, A.E. (2000). Measures of wilder-ness trip satisfaction and user perceptions of crowd-ing. In: USDA Forest Service Proceedings (RMRS-P-15-VOL-4), p 93-98.
Manning, R. E. (1999). Studies in outdoor recreation re-search and research for satisfaction. Oregon State University Press.
Manning, R. E., Lawson, S., Newman, P., Laven, D. & Val-liere, W. (1999). Methodological issues in measuring crowding-related norms in outdoor recreation. In: Lei-sure Sciences (24), p 339-348.
Moore, D. W. (2002). Measuring new types of question-or-der effects: Additive and subtractive. In: Public Opin-ion Quarterly (66), p 80-91.
Schul, Y. & Schiff, M. (1993). Measuring satisfaction with organizations: Predictions from information acces-sibility. In: Public Opinion Quarterly (57/4), p 536-551.
Satisfaction change
Satisfaction
Perceived crowding
Satisfaction decrease(M, n)
Satisfaction unchanged
(M, n)
Satisfactionincrease (M, n)
F P
Level of satisfaction (1st measure
4.58 (798) 3.90 (1432) 2.90 (172) 560.87 0.000***
Level of satisfaction (2nd measure)
3.44 (798) 3.90 (1432) 3.97 (172) 123.86 0.000***
Perceived crowding on boats 3.77 (798) 3.65 (1432) 3.36 (172) 3.44 0.032*
Perceived crowding on people 4.50 (798) 4.23 (1432) 4.14 (172) 4.91 0.007**
* p < 0.05, ** p < 0.01, ** * p < 0.001
Table 1: Effect on satisfaction based on satisfaction change type using ANOVA test.

Siegrist, D., Clivaz, C., Hunziker, M. & Iten, S. (eds.) (2006). Exploring the Nature of Management. Proceedings of the Third International Conference on Monitoring and Management of Visitor Flows in Recreational and Protected Areas.
University of Applied Sciences Rapperswil, Switzerland, 13-17 September 2006. Rapperswil.
365
Encounter and Behavioral Norms of Hikers: A Study of the Taroko Gorge National Park, Taiwan
Yi-Chung Hsu1 & Chih-Peng Fang2
1National Dong Hwa University, [email protected]
2Taiwan Hospitality & Tourism College, [email protected]
Keywords: Encounter norms, embarrassment, guilt, informal sanction, internal sanction, norm crystallization, obli-gation, shame.
Introduction
Due to the heavy use of mountain trails, national park policy makers are concerned about how to es-tablish social carrying capacity indicators. Devel-oping evaluative standards for judging the accept-ability of impacts caused by hikers is important. The normative approach was developed in North America as a useful method of conceptualizing, collecting, and organizing empirical value judg-ments regarding resource management issues. The study examined the personal and social encounter norms of hikers, as well as their behavioral norms on the Taroko Gorge national park trails, Taiwan - a non-North American setting.
Methods
The survey instrument’s content and format was based on the questionnaires developed by Vaske and Donnelly (2002), Heywood (2002) and Hey-wood and Murdock (2002). The survey gathered the following data: (a) hiking experience and level of specialization; (b) the number of hikers encoun-tered and their level of perceived crowding; (c) so-cial obligations and self-reports of sanctions for jamming trail traffic. In total, 475 questionnaires were obtained using an on-site survey in 2005.
Results
The survey results were as follows: (1) Most hik-ers (57.5%) had a personal encounter norm; (2) The consensus of the social encounter norm was high;
(3) The perceived encounters and perceived crowding for those with a norm were signifi-cantly higher than those without a norm; (4) When perceived number of encounters exceed-ed a hiker’s personal encounter norm, their per-ceived crowding level increased; (5) Over 90% of the hikers said they should always give way to other hikers; (6) The intensity of the behav-ioural norm was low, which was determined by summing subject responses to shame and guilt (internal sanctions) and embarrassment (infor-mal sanction); (7) The power and prevalence of the behavioral norm were low.
Conclusions
Three conclusions were drawn: (1) Encounter norms exist for most backcountry hikers, con-sistent with North American literature; (2) The encounter-norm-crowding relationship can be generalized as Vaske and Donnelly (2002) sug-gested; (3) The results of the behavioral norm suggested cross-cultural variations for sustain-ability and carrying capacity evaluations should be considered for future research. Suggestions were made for national park management. For instance, encounter norms, perceived encoun-ters, and perceived crowding should all be in-cluded as carrying capacity indicators for the Taroko Gorge national park trails. Since in-ternal and informal sanctions were low, either compulsory trail regulations or educational pro-grams should also be considered.

Visitor / User Conflicts and other Behavior Studies
366
AcknowledgementsThe authors would like to thank the National Sci-ence Council of Taiwan for financially supporting this research under contract NSC 94-2415-H-259-004.
References
Donnelly, M.P., Vaske, J.J., Whittaker, D., & Shelby, B. (2000). Toward an understanding of norm prevalence: A comparative analysis of 20 years of research. In: Environmental Management (25/4), p 403-414.
Heywood, J.L. (2002). The cognitive and emotional compo-nents of behavior norms in outdoor recreation. In: Lei-sure Sciences (24), p 271-281.
Heywood, J.L. & Murdock, W.E. (2002). Social norms in outdoor recreation: Searching for the behavior-condi-tion link. In: Leisure Sciences (24), p 283-295.
Kim, S.-O. & Shelby, B. (1998). Norms for behavior and conditions in two national park campgrounds in Ko-rea. In: Environmental Management (22/2), p 277-285.
Vaske, J.J. & Donnelly, M.P. (2002). Generalizing the en-counter-norm-crowding relationship. In: Leisure Sci-ences (24/3-4), p 255-269.

Siegrist, D., Clivaz, C., Hunziker, M. & Iten, S. (eds.) (2006). Exploring the Nature of Management. Proceedings of the Third International Conference on Monitoring and Management of Visitor Flows in Recreational and Protected Areas.
University of Applied Sciences Rapperswil, Switzerland, 13-17 September 2006. Rapperswil.
367
Monitoring of Mountain Bikers in a Sensitive Bird Area around the Tanzboden, Switzerland
Sophia Iten & Dominik Siegrist
University of Applied Sciences Rapperswil, Switzerland
[email protected]@hsr.ch
Keywords: Visitor monitoring, mountain biking, user conflicts, protected areas, sensitive wildlife habitats.
IntroductionDue to the high attractiveness of their landscape and the manifold topography, the adjacent regions Toggenburg and Linthregion in the Eastern part of Switzerland are increasingly visited by people searching for recreation. In the last few years es-pecially, the numbers of mountain bikers have in-creased. A large part of this area around the Tanz-boden (alt. 1449m) is under federal protection and that of the Canton of St. Gall. Among these endan-gered habitats are high moors, mire landscapes of especial beauty as well as landscapes and natural monuments of national importance. Particularly the mountain cock (Tetrao gallus) and the black grouse (Tetrao tetrix), which are sensitive to any nuisance and belong to the protected species on the red list, are dependent on these kinds of habitats.
At the moment, there exists no official connection crossing the protected area for cyclists between the two regions. Because of this conflict situation be-tween the mountain bikers and nature protection, the Canton of St. Gall has given consent to a pro-visional opening of one biking route over the Tan-zboden in order to canalize the bikers. But the offi-cial opening could result in an increase of cyclists on and off track and thus to an increased risk for the sensitive wildlife habitats. In order to prevent this, the Moutainbike Monitoring Tanzboden was initiated.
Methods
The monitoring consists of two phases: I: Deter-mining the actual state before the official opening of the biking trail
II: Evaluating the results after opening and signal-ling of the trail.
This paper describes the results of the first phase which has been conducted between June and Octo-ber 2005. Different monitoring methods had been applied at ten important junctions. One of the ob-jectives was to test the effectiveness of these meth-ods for this type of task. The applied methods were: manual counting (4 points, 8 days), interviews (4 points, 8 days), automatic cameras (2 points, con-tinuous) and radar surveillance (1 point, continu-ous).
The signalling and opening of the route was planned for 2006. The second phase of the monitoring will most probably take place between June and Octo-ber 2007 after people have adjusted to the new sit-uation.
Radar surveillance for example, of which we hoped for significant data, showed difficulties in uneven topography and therefore produced data which was difficult to interpret. Due to other technical prob-
Figure 1: Overview of the monitoring points in the region around the Tanzboden.

Visitor / User Conflicts and other Behavior Studies
368
lems, substantial data could not be obtained, nei-ther by photo cameras nor by radar surveillance. Although the need for time and manpower of in-terviews and manual counting exceeded by far the available budget, they still seem to be the most ap-propriate methods. Interviews allow the obtain-ing of a lot of valuable data, i.e. age, sex, favoured routes, how often they take this route, used orienta-tion guides (see table 1).
Results
A large majority of the bikers is male and takes the route once to twice a year. The majority of the bikers live within the adjacent communi-ties. The assumption that the inofficial Single-
trailmap (very popular among non local bikers, but not approved officially, therefore showing routes which cross protected areas) would be re-sponsible for an increase of bikers during the last years could not be confirmed.
Figure 2 shows the distribution of the bikers within the investigation area. The gray arrows will be affected by the canalization of the route and show the official hiking trail on which it is not allowed to bike anyway. Not unexpected is the fact that bikers seem to follow the restau-rants. Also the majority stays within their origi-nating region and doesn’t cross the peak of the Tanzboden.
Conclusion
Technical complex monitoring systems are often not suitable for an outdoor monitoring in remote areas (maintenance, power supply). Only a moni-toring within a relatively small area will provide reliable data since the frequencies of visitors may differ greatly within the area of investigation. Each local position and problem requires a specific mo-nitoring setting.
Figure 2: Distribution of the bikers.
g
Method Tec
hnic
alha
ndlin
g
Tim
e ne
eds
Man
pow
erre
quir
emen
ts
Rel
iabi
lity
Dat
eSi
gnifi
canc
e
Tot
alE
valu
atio
n
Interviews + -- -- + ++ +Manual counting ++ -- -- + + +Photo cameras - + ++ -- - -Radar - + ++ - -- -
Table 1: Evaluation of Monitoring Methods.
Visitor / User Conflicts and other Behavior Studies
369
Acknowledgments
Special thanks go to the 66 helpers – hunters, conservationists and youth groups as well as the Office for Spatial Development of the Kanton of St. Gall who made this monitoring possible.
References
Bundesamt für Umwelt, Wald und Landschaft – BUW-AL. (2001). Praxishilfe Auerhuhn und Haselhuhn: ihr Schutz in der regionalen Waldplanung. Bern.
Gilomen, M.P.. (2005). Die Zielgruppe «Mountainbiker» - eine statistische Erhebung im soziodemografischen, wirtschaftlichen und touristischen Bereich. Bern.
Muhar, A., Arnberger, A., Brandenburg, C. (2002). Methods for Visitor Monitoring in Recreational and Protected Areas: An Overview. In: Arnberger, A., Brandenburg, C., Muhar, A. (Eds.) (2002). Monitoring and Manage-ment of Visitor Flows in Recreational and Protected Areas. Conference Proceedings. Bodenkultur Univer-sity Vienna, Austria, January 30-February 02, 2002. Vienna, p 1-6.
Schroff, U., Ammann, S. & Bernasconi, A. (2005). Biker-waldpass Rheinfelden – Grundlagen und Umsetzung eines innovativen Finanzierungsmodells. Bern.

Siegrist, D., Clivaz, C., Hunziker, M. & Iten, S. (eds.) (2006). Exploring the Nature of Management. Proceedings of the Third International Conference on Monitoring and Management of Visitor Flows in Recreational and Protected Areas.
University of Applied Sciences Rapperswil, Switzerland, 13-17 September 2006. Rapperswil.
370
Perceived Crowding and Satisfaction among Overnight and Day Visitors on Hallig Hooge – A Visitor Survey in the Wadden Sea
National Park, Schleswig-Holstein, Germany
Dennis Kalisch & Axel Klaphake
Technical University Berlin, Germany
[email protected]@imup.tu-berlin.de
Keywords: Perceived crowding, visitor conflicts, satisfaction, survey, expectations, motivations.
Introduction
Although use level in German National Parks increases, there are only a few research activ-ities into social effects of tourism on outdoor recreation. The objective of this survey is the re-lationship between social effects like perceived crowding and expectations and visitor satisfac-tion in this special background.
As an example of high use recreation areas there is the Wadden Sea National Park in the north of Germany. It is a very important recreation area with more than 4 million day trips and 17 million overnight stays a year. During the sum-mer months there are several hot spots along the coast and on the islands where user density is very high and crowding occurs. One of the tour-ist hot spots are the “Nordfriesische Halligen” - small marsh islands in the Wadden Sea which are unique in the world.
The research area Hallig Hooge is a main tour-ist hot spot at the border of the National Park. Nearly 110 inhabitants live on the small Hal-lig (ca. 590 ha). It is an important destination for day visitors during summer and attracts up to 3.000 visitors a day. On the Hallig are two different types of day visitors: guided and non-guided visitors. Despite this, overnight stays of visitor groups have an important role. Day and overnight tourism is the main income for the lo-cal economy. The Hallig offers different activi-ties like walking, swimming, biking and enjoy-ing nature for the visitors.
Methods
A quantitative survey of 260 visitors of Hallig Hooge was carried out in August and September 2005 to examine crowding and visitor satisfac-tion on this stressed island located in the Nation-al Park.
The research determined crowding and differen-ces in motivation for the trip according to the three sample groups. It also compares perceived crowd-ing, motivations and expectations between guid-ed and non-guided daytrips. To measure crowd-ing a visual approach was used in the survey. A series of five photographs was handed to the vis-itors. On the picture was illustrated a path on one part of the island with different numbers of hik-ers. Visitors were asked to evaluate the acceptabil-ity of visitor density, perceived visitor density and their expectations before the trip. Several regres-sion methods were used to identify variables which influence the perception of crowding and expecta-tions of the visitors.
Results
Results of the statistical evaluation suggest that there are differences between the visitor groups in terms of their satisfaction of the visit, their eval-uation of the different activities, their perception of crowding and their motivations for the trip. In general the study shows that low or moderate lev-els of crowding and conflicts were reported. 20 percent of the visitors reported some degree of perceived crowding. The survey shows that non-
Visitor / User Conflicts and other Behavior Studies
371
guided day visitors are the most sensitive visitors (nearly 30 percent report some degree of perceived crowding). In the study, aspects of the perception of crowding and intervisitor conflicts will be dis-cussed in detail. Study data can be used to help lo-cal tourist management improve conditions for the different visitor groups on Hallig Hooge.
References
Fredman, P. & Hörnsten, L. (2003). Social Capacity and Visitor Satisfaction in National Park Tourism. In: Pro-ceedings from the 12th Nordic Symposium in Tourism and Hospitality Research. Stavanger.
Klug, A. (1999). Bewertung der Erholungseignung und tourismusbedingten Naturraumbelastungen an der Nordseeküste Schleswig-Holsteins mit GIS – Grund-lagen für Planung und Küstenmanagement. In: Beri-chte, Forschungs- und Technologiezentrum Westküste der Universität Kiel.
Manning, R.E. (1999). Studies in Outdoor Recreation. Or-egon State University Press.
McCool, S.F. & Lime, D.W. (2001). Tourism Carrying Ca-pacity: Tempting Fantasy or Useful Reality? In: Jour-nal of Sustainable Tourism (5/29), p 372-388.
Shelby, B., Vaske, J.J. & Heberlein, T.A. (1988). Compara-tive Analysis of Crowding in Multiple Locations: Re-sults from fifteen Years of Research. In: Leisure Sci-ences (1), p 269-291.

Siegrist, D., Clivaz, C., Hunziker, M. & Iten, S. (eds.) (2006). Exploring the Nature of Management. Proceedings of the Third International Conference on Monitoring and Management of Visitor Flows in Recreational and Protected Areas.
University of Applied Sciences Rapperswil, Switzerland, 13-17 September 2006. Rapperswil.
372
Measuring Public Interest and the New Environmental Paradigm in the Transformation of a Public Park into a
Protected Area “Los Colomos” Forest, Guadalajara, Mexico
Ana-I. Ramírez-Quintana-Carr & Hermila Brito-Palacios
University of Guadalajara, México
[email protected]@cucba.udg.mx
Keywords: Mexico, Los Colomos, new environmental paradigm, survey.
Introduction
Los Colomos forest is a public city park with 92 hectares (230 acres) administered by the county administration in Guadalajara City (UdeG, 2003). Los Colomos Park is unique as a park due to its ex-tension inside a city with almost 4 million people, and is surrounded by a high to very-high income neighbourhood. This is a resource that attracts tourists to visit the city, and provides enjoyment for the locals. The county administration is considering the need to transform this park into a natural protected area because of the water resources in the park which must be preserved and are important to satisfy the needs of Guadalajara. This issue of the legal pro-tection has been under discussion since 2004. The studies to support the legal proposal were funded and conducted between September 2005 and Feb-ruary 2006. Part of the studies conducted include among others: flora and fauna, hydrology, soils, and social issues. In this paper issues related to so-cial studies regarding perceptions of people of the park within the scope of this transition towards a natural protected area are reported. It is consid-ered that public opinion provides a close idea of the participation processes that may arise in this transition. In depth interviews and two general sur-veys were conducted. The results of this research should give insight into the management program and zoning.
Methods
This report is based on two general surveys. These surveys were conducted during two week-long pe-riods (December 2005 and February 2006). The difference between these two was stated by the changes regarding weather and school vacation periods. The total number of interviews conduct-ed with statistical representation was 330 for both cases. The questionnaire includes closed and open questions. The closed questions were analyzed us-ing SPSS, and the open questions under the tech-nique of content analysis. The analyzed issues in this sequential survey regard: (1) the hours the park is open; (2) what aspects visitors liked most/didn’t like about the park; (3) suggestions for manage-ment; (4) personal perspectives about changes; (5) problems in the park which the visitor perceives; (6) visitor’s knowledge regarding management, and activities or services provided by the park ad-ministration; (7) entrance fee; (8) better services for people with different capabilities; (9) areas of interest for more information, and (10) informa-tion seeking behavior.
Results
Among the findings it is relevant that 52% of the visitors first visited the park 10 years ago or more, or as long as they can remember; 18% first visited the park less than 10 years ago, and 17% first vis-ited the park 5 years ago or less.
In general, visitors are confident regarding the fu-ture of this park.

Visitor / User Conflicts and other Behavior Studies
373
Considering the next 5 years, 81% of the respon-dents believe that the quality of the park will re-main “the same” to will be “much higher”. This drops to 71% considering the next 10 years, and then drops to 63% considering the next 15 years. Some of the reasons for low confidence report-ed are encroachment, erosion, and deforestation. One of the reasons supporting the confidence in the higher quality is because they think the park will be protected. Almost all the visitors (91%) are in favor of the legal protection of the park. In general, people present low level of knowl-edge regarding the management, but on the other hand, a good proportion (63%) reports recogni-tion of the official norms in the park. Regard-ing the New Environmental Paradigm, visitors show mostly adherence to the NEP vs. the Dom-inant Social Paradigm (Dunlap, Van Liere, Mer-tig & Jones, 2000). Most of the visitors (78%) indicate that it is important to allocate space for wild plants and animals, 53% consider that hu-manity should not govern nature, and 87% indi-cate that humanity is part of nature and wildlife and not apart. With the stated above and oth-er indicators documented in this study it can be stated that the proposal to protect this park le-gally counts with a good base of public support. Efforts should be directed into zoning that war-rants the permanence and improvement of the quality that ensures the preservation of the park as a water resource. The challenge is to meet the visitor’s needs, but the hydrological vocation of the area should be considered of paramount im-portance above all other human needs.
References
Dunlap, R. E, Van Liere, K. D., Mertig, A. G. & Jones, R. E. (2000). Measuring Endorsement of the New Ecologi-cal Paradigm: A Revised NEP Scale. In: Journal of So-cial Issues (56/3), p 425-442.
Ramírez-Q.-C., A.I & Anaya-C., M. (2003). Guadalaja-ra City Parks. Universidad de Guadalajara, Mexico. http://www.guadalajaraparks.udg.mx/colomos/indexi.html.

Siegrist, D., Clivaz, C., Hunziker, M. & Iten, S. (eds.) (2006). Exploring the Nature of Management. Proceedings of the Third International Conference on Monitoring and Management of Visitor Flows in Recreational and Protected Areas.
University of Applied Sciences Rapperswil, Switzerland, 13-17 September 2006. Rapperswil.
374
Shaping Culture in Nature: Human Use Management in Canada’s Mountain National Parks
Kathy Rettie
Parks Canada, Canada
Keywords: National park management, visitor experience, culture and nature.
Introduction
Located in the Rocky Mountains on the border between Alberta and British Columbia, Banff, Yoho, Jasper and Kootenay National Parks com-prise the majority of the Canadian Rocky Moun-tain Parks World Heritage Site. The area draws more than 5 million visitors per year. Manage-ment decisions are directed by a dual mandate (protection versus use) and the recently amend-ed Canada National Parks Act (2000) which puts maintenance of ecological integrity as the first priority for all national parks managers. More specific direction is provided in individual park management plans approved by Canadian Parlia-ment. These plans were recently amended to re-flect significant changes in the human use man-agement, based upon a prediction that visitation and associated environmental impacts will in-crease significantly. For their part, scientists have been using an indicator species, the grizzly bear, to measure changes in ecological integrity. Sub-sequently, the human use management strategy is built upon a framework for the conservation of grizzly bears. Put into effect to protect the wild-life from human caused mortality and from habit-uation to humans, trail and area closures through-out the park have increased dramatically over the past ten years. Critics of this bio-centric approach to management ask whether the park is for bears or humans (Cooper et al 2002). How one expe-riences the mountain national parks is, to a large degree, dictated by infrastructure. A network of hardened trails leads visitors to popular destina-tions; trail closures have an immediate and deci-sive effect upon one’s national park experience.
Realizing the predicaments created by relying solely on biology and other natural sciences, Parks Canada’s latest corporate orientation documents prepare for an important shift, one that recogniz-es that ecological integrity cannot be achieved without ‘people’. There is an emphasis upon hu-man relations and interactions with nature and the involvement of Canadians as partners and advo-cates for National Park Policy. One aim is to ‘con-vert’ visitors who presently have low awareness and understanding of ecological integrity (Parks Canada 2005). Parks Canada set a target that 50% of park visitors will have a learning experience. Using first hand experience as a key to personal awareness and understanding, it was decided that the learning experiences would be: guided walks or hikes, interpretive programs and interpretive ex-hibits. Focus on the visitor requires a shift, from emphasizing the provision of services, facilities and programs in a way that meets only Parks Can-ada’s goals and objectives, to one where the visi-tor‘s needs and expectations becomes the focus (Parks Canada 2005).
Methods & Results
Methodology to learn more about the people using national parks includes on-line surveys, traffic and trail counters, and site-specific projects employing triangulated methods. The value of social science research is already being recognized. A 2003 sur-vey of Banff, Jasper, Kootenay and Yoho Nation-al Parks revealed visitor’s most popular activities. The human use of remote and fragile natural areas is far less than previously assumed. As well, an-nual visitation was over-estimated by nearly 2 mil-
Visitor / User Conflicts and other Behavior Studies
375
lion visits. From this and other research, the Agen-cy hopes to develop “products, services and events to reach specific audiences and produce both short and longer-term changes” (Parks Canada Agency 2005: ii) and tools for predicting and measuring those changes. Human use simulation modelling is such a tool being developed for integrating hu-man activities with wildlife movements, predict-ing impacts of displacing use and monitoring hu-man use.
Conclusion
There are inherent complications with adopting this new approach to national parks. The contradictions in reducing human use while at the same time en-couraging more visitors to experience the park first hand suggests that neither approach has been con-sidered from the park managers perspective, many of whom will ponder the values of ecological in-tegrity versus visitor experience. Discourse on ex-periential tourism touts individuality and person-al experience, yet there is an underlying theme in support of a homogenous and conditioned visitor/tourist population. Political realities are such that, due to the popularity of these national parks, mak-ing obvious, positive progress is imperative. As neither the necessary tools nor content have been developed, much work lies ahead.
References
Cooper, B., Hayes, J., & LeRoy, S. (2002). Science fic-tion or science fact? The grizzly biology behind Parks Canada management models. Fraser.
Parks Canada Agency (2005). National performance and evaluation framework for Engaging Canadians: Ex-ternal Communications at Parks Canada. Unpub-lished. Produced by the Performance, Audit and Re-view Group, February 2005. Government of Canada. Canada.
Parks Canada Agency (2003). Visitor Survey of Banff, Jas-per, Kootenay and Yoho National Parks. Unpublished. Sponsored by Parks Canada, the Mountain Parks Visi-tor Survey Partnership and Alberta Economic Devel-opment. Canada.

Siegrist, D., Clivaz, C., Hunziker, M. & Iten, S. (eds.) (2006). Exploring the Nature of Management. Proceedings of the Third International Conference on Monitoring and Management of Visitor Flows in Recreational and Protected Areas.
University of Applied Sciences Rapperswil, Switzerland, 13-17 September 2006. Rapperswil.
376
Coping With Recreation Conflict: How User Group and Value Conflicts Predict Recreation Coping and Satisfaction
Sue Schroeder1 & David Fulton2
1University of Minnesota, [email protected]
2Minnesota Cooperative Fish and Wildlife Research Unit, [email protected]
Keywords: Angling, conflict, coping, recreation, satisfaction, structural equation modeling.
Introduction
Previous research has examined recreation con-flict, coping and satisfaction (Manning 1999). Our research goals were to: (a) examine conflicts ex-perienced by Minnesota anglers, (b) explore cop-ing actions used by Minnesota anglers, and (c) test how conflict and adoption of coping mechanisms related to angler satisfaction.
Recreation research has documented substantial conflict in outdoor recreation (Manning, 1999). The research has generally focused on explicit con-flict by comparing normative beliefs about accept-able and unacceptable behaviors. Most research on recreation conflict has examined interpersonal con-flict, but some has explored social values conflict (Manning 1999). Much conflict in outdoor recre-ation arises between participants in different activ-ities, and often it is asymmetric (i.e. cross-country skiers object to snowmobilers but not vice versa) (Manning 1999). However, intra-group conflict has also been documented (Manning 1999).
Coping is described as “an adaptive reaction to a perceived is-ought discrepancy” (Greve & Stro-bl 2004, p 194). Psychology researchers have de-scribed three types of coping: (a) problem-cen-tered, which is the modification of the is-state that causes the problem, (b) reaction-centered, which is the modification of the ought-state or the inter-nal perception of the problem, and (c) avoidance of the problem (Greve & Strobl 2004). Recreation re-searchers have identified behavioral and cognitive coping strategies, which parallel the problem-cen-tered and reaction-centered types of coping (Man-
ning 1999): Displacement, rationalization, and product shift are the three primary coping strat-egies employed by recreationists who maintain participation in an activity (Manning & Valliere 2001).Recent research has examined the relationship be-tween coping and satisfaction (Johnson & Dawson 2004) and the relationship between recreation con-flicts and outcomes (Schuster, Hammitt & Moore 2006). Much work is left to be done to improve measures of user outcomes and to examine how conflict and coping influence user satisfaction.
Methods
Results were derived from a 2003 study of anglers in Minnesota, U.S.A. We used structural equation modeling to examine how (a) intergroup conflict, (b) intragroup conflict, (c) social values conflict, and (d) environmental values conflict predicted behavioral and cognitive coping. We tested three models to examine (a) the direct effects of conflict on recreation satisfaction, (b) the effects of conflict on satisfaction fully mediated by coping, and (c) the effects of conflict on satisfaction partially me-diated by coping.
Results
In our conflict and coping only model, we found that direct intergroup conflict and environmental values conflicts were related to both behavioral and cognitive coping. Direct intragroup conflict and so-cial values were not related to either behavioral or cognitive coping.
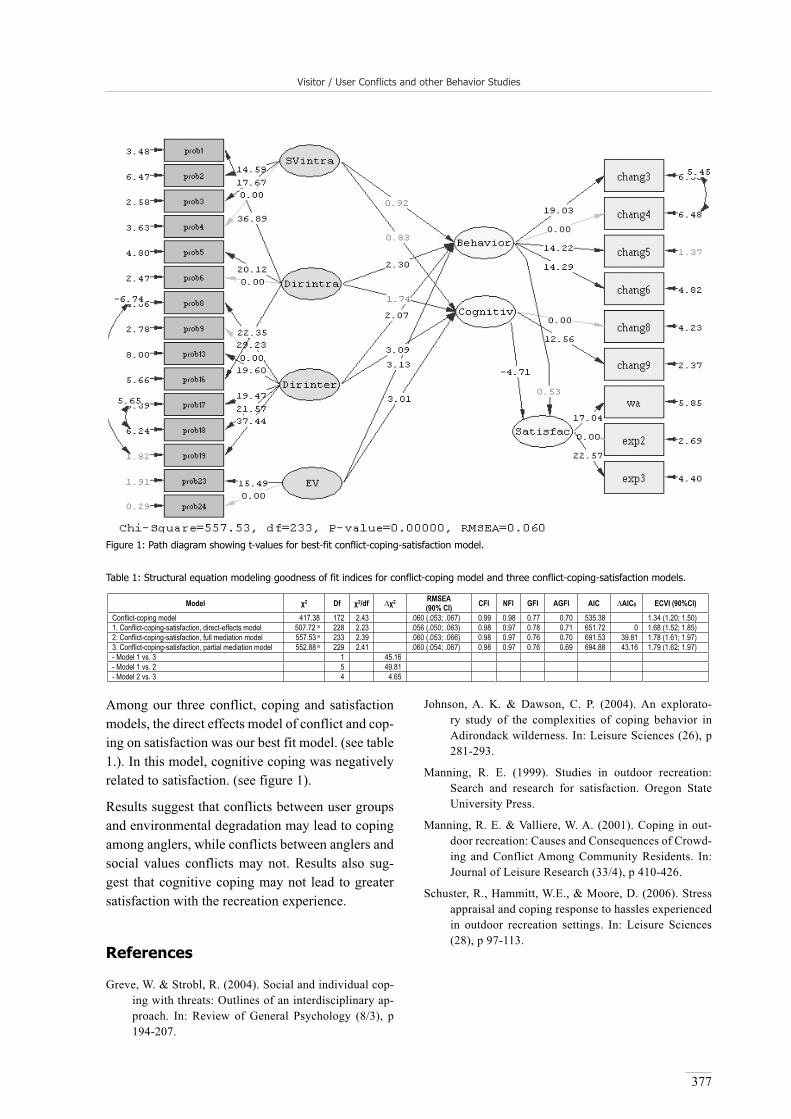
Visitor / User Conflicts and other Behavior Studies
377
Among our three conflict, coping and satisfaction models, the direct effects model of conflict and cop-ing on satisfaction was our best fit model. (see table 1.). In this model, cognitive coping was negatively related to satisfaction. (see figure 1).
Results suggest that conflicts between user groups and environmental degradation may lead to coping among anglers, while conflicts between anglers and social values conflicts may not. Results also sug-gest that cognitive coping may not lead to greater satisfaction with the recreation experience.
References
Greve, W. & Strobl, R. (2004). Social and individual cop-ing with threats: Outlines of an interdisciplinary ap-proach. In: Review of General Psychology (8/3), p 194-207.
Johnson, A. K. & Dawson, C. P. (2004). An explorato-ry study of the complexities of coping behavior in Adirondack wilderness. In: Leisure Sciences (26), p 281-293.
Manning, R. E. (1999). Studies in outdoor recreation: Search and research for satisfaction. Oregon State University Press.
Manning, R. E. & Valliere, W. A. (2001). Coping in out-door recreation: Causes and Consequences of Crowd-ing and Conflict Among Community Residents. In: Journal of Leisure Research (33/4), p 410-426.
Schuster, R., Hammitt, W.E., & Moore, D. (2006). Stress appraisal and coping response to hassles experienced in outdoor recreation settings. In: Leisure Sciences (28), p 97-113.
Model 2 Df 2/df 2 RMSEA(90% CI) CFI NFI GFI AGFI AIC AIC0 ECVI (90%CI)
Conflict-coping model 417.38 172 2.43 .060 (.053; .067) 0.99 0.98 0.77 0.70 535.38 1.34 (1.20; 1.50) 1. Conflict-coping-satisfaction, direct-effects model 507.72 a 228 2.23 .056 (.050; .063) 0.98 0.97 0.78 0.71 651.72 0 1.68 (1.52; 1.85) 2. Conflict-coping-satisfaction, full mediation model 557.53 a 233 2.39 .060 (.053; .066) 0.98 0.97 0.76 0.70 691.53 39.81 1.78 (1.61; 1.97) 3. Conflict-coping-satisfaction, partial mediation model 552.88 a 229 2.41 .060 (.054; .067) 0.98 0.97 0.76 0.69 694.88 43.16 1.79 (1.62; 1.97) - Model 1 vs. 3 1 45.16 - Model 1 vs. 2 5 49.81 - Model 2 vs. 3 4 4.65
Table 1: Structural equation modeling goodness of fit indices for conflict-coping model and three conflict-coping-satisfaction models.
Figure 1: Path diagram showing t-values for best-fit conflict-coping-satisfaction model.

Siegrist, D., Clivaz, C., Hunziker, M. & Iten, S. (eds.) (2006). Exploring the Nature of Management. Proceedings of the Third International Conference on Monitoring and Management of Visitor Flows in Recreational and Protected Areas.
University of Applied Sciences Rapperswil, Switzerland, 13-17 September 2006. Rapperswil.
378
Crowding in Danish Forests – a Nonexistent Problem?
Frank S. Jensen
Danish Centre for Forest, Landscape and Planning, Denmark
Keywords: Recreation, carrying capacity, social dimension, crowding, preference, forest, Denmark.
Introduction
An overview of the research on the social dimen-sion of carrying capacity has been compiled by e.g. Stankey & Manning (1986) from which an excerpt is cited below:
“... It is important to distinguish the concept of crowding from the more simple concept of amount of use. Many recreational areas are used inten-sively, but this does not necessarily mean they are crowded.
… Crowding norms are a function of more than just the number of other users. A variety of use charac-teristics as well as situational variables affect per-sonal judgments about crowding….
…Problems such as crowding can only be assessed with specific measures addressing these prob-lems.”
A relatively large proportion of the research on crowding is based on experiences in wilderness or other remote areas in North America. In this paper, the topic is discussed in a very different setting: Danish forests – A setting characterized with a rel-atively high number of inhabitants on a relatively small and intensively exploited land area (5.4 mill. inhabitants on 43,000 km2 of which 11% is forest and 10% are other nature areas).
Preferences for meeting other forest visitors
The general Danish population‘s assessment of encountering different numbers of various types of forest visitors has been studied by Jensen & Koch (1997)1 .
1 Representing the Danish population (15-77 years old), a postal questionnaire survey accomplished in 1977-78 (n: 2826, response-percentage 89.4%) as well as in 1993-94 (n: 2916, response-percentage 83.7%).
Seven types of forest visitors were studied: fam-ilies in the woods, horse-riders, joggers, bicy-clists, hunters, car- and moped-riders; each type in the numbers: 1, 2, 5 and 10. It was not asserted unexpectedly that the fewer forest visitors were encountered, the higher was the perceived qual-ity of the forest visit.
Also differences in the assessment of encounter-ing different types of forest visitors are found. The types of forest visitors studied can be split into three groups: (1) highest ranked: families in the woods, horse-riders and joggers; (2) an in-termediate group: bicyclists and hunters; and (3) lowest ranked: car drivers and moped-riders.
Research on perceived crowding
Questions about the social dimension of outdoor recreation are included in a study of the recre-ational use of 592 forest and other nature areas, carried out in 1996-1997 (Jensen 20032). This material provides the first general background for analyses of the notion crowding in a Dan-ish context.
In the questionnaire a number of questions are included, all of which have proven their value in a number of other studies in relation to crowd-ing (e.g. Shelby et al. 1989).
The core question is:
2 A total of 592 areas took part in the survey. 20 data collections were car-ried out representatively over 12 months in 1996-97 (stratified sampling). The questionnaire was delivered to all parked cars at the sampling times. 85,673 questionnaires were delivered. The response-percentage was 46.7% (due to the nature of this data-collection it has not been possible to use reminders to mini-mize non-response).
How did you perceive the area here today regarding the number of other visitors? (tick one box on the scale from 1 to 9)
1 2 3 4 5 6 7 8 9
Not crowded at all Slightly crowded Moderately crowded Extremely crowded

Visitor / User Conflicts and other Behavior Studies
379
From the responses it can be ascertained that on average, 13% of the visitors indicate the area at least as “slightly crowded”; 3% at least as “mod-erately crowded”; and less than 1% found the area “extremely crowded” – indicating more than 85% of the visitors do not perceive the area as crowded at all.
Conclusion
Although preference studies show that the Dan-ish general population does not prefer to see many other visitors in the forests, on-site surveys (where e.g. more than 40 of the areas have a visi-tation higher than 2,000 visitor hours per hectare per year) indicate that crowding and conflicts be-tween different user groups, in general, is not a major problem in Danish outdoor recreation.
So far, the sustainability of the social dimension of the carrying capacity does not seem to be ex-ceeded in the Danish forests. But of course, for those relatively few visitors that experience a concrete exceeding, this is not a negligible prob-lem for the visitor as well as the manager.
References
Jensen, F.S. (2003). Friluftsliv i 592 skove og andre na-turområder. In: Skovbrugsserien (32), Forskningscen-tret for Skov & Landskab, København.
Jensen, F. S. & Koch, N. E. (1997). Friluftsliv i skovene 1976/77 - 1993/94. Forskningsserien (20), Forskning-scentret for Skov & Landskab, København.
Shelby, B., Vaske, J.J., & Heberlein, T.A. (1989). Compar-ative analysis of crowding in multiple locations: re-sults from fifteen years of research. In: Leisure Sci-ences (11), p 269-291.

380
Economic and Social Effects of Recreationand Nature Tourism
Christophe Clivaz & Andréa Finger-Stich (Chairs)

Siegrist, D., Clivaz, C., Hunziker, M. & Iten, S. (eds.) (2006). Exploring the Nature of Management. Proceedings of the Third International Conference on Monitoring and Management of Visitor Flows in Recreational and Protected Areas.
University of Applied Sciences Rapperswil, Switzerland, 13-17 September 2006. Rapperswil.
381
Sample Selection Bias in Visitor Surveys: Comparative Results of an On-Site and an Off-Site Survey Assessing Recreational
Benefits of Forests
Katrin Bernath & Anna Roschewitz
Swiss Federal Institute for Forest, Snow and Landscape Research, Switzerland
[email protected]@wsl.ch
Keywords: Economic valuation, forest recreation, on-site sample, sample selection bias, off-site random sample, weighting, forest visitors.
Introduction
Information about visitors of recreational ar-eas establishes an important basis for the man-agement of these areas. Frequently, the data on visitor characteristics, their behaviour and re-quirements is collected in on-site surveys. This approach is efficient because the target popula-tion can be addressed directly. However, the se-lection probabilities of visitors depend on ex-ternal factors and so they differ, for example, according to visit frequencies. Therefore, results of on-site surveys have to be interpreted care-fully and generalisations from on-site samples to the population of all visitors have to take into ac-count unequal selection probabilities. In partic-ular, the sampling strategy affects estimates of recreational benefits in economic valuation stud-ies.
Differences between on-site and off-site sam-ples were examined in our study on recreational benefits of the forests in the city of Zurich. Fur-thermore, we analyzed the impact of weighting and other methods to correct for selection bias in on-site samples and tested them empirically by comparing the corrected on-site results with esti-mates from an off-site random sample.
Methods and Data
Recreational benefits can be assessed in monetary terms either with revealed preference methods as for example the travel cost method (e.g. Parsons
2003) or with stated preference methods (Bate-man et al. 2002). In our study, we estimated rec-reational benefits of Zurich’s city forests with the contingent valuation method and assessed visi-tors’ willingness to pay (WTP) for an annual per-mit allowing them to visit the forests within the city area. As these valuation methods rely on sur-vey data, sample selection and data collection are crucial steps of the valuation process. Approaches to adjust mean sample estimates include the cal-culation of weighted averages (Morrison 2000).
Sample weights are commonly calculated by ad-justing distributions of sample characteristics to the respective distributions within the popula-tion. This approach assumes that these charac-teristics are correlated with the target variable, which is ‘individuals’ WTP’ in contingent valu-ation studies. Alternatively, sample weights can be determined according to the probability of an individual being sampled. A framework incorpo-rating different aspects of sample selection prob-ability in on-site surveys was proposed by Elsas-ser (2001). We adopted this approach to derive weighting factors for our on-site sample.
The data in this study came from two surveys carried out in September 2004. In an on-site sur-vey, visitors were interviewed at ten different sites within the forested area of Zurich. An off-site mail survey was carried out among random-ly chosen residents of Zurich. The questionnaires were almost identical and both surveys evaluated WTP for a visitor permit in order to derive rec-

Economic and Social Effects of Recreation and Nature Tourism
382
reational values of the forest with the contingent valuation method. Furthermore, we assessed vis-it frequencies for the urban forests and other green spaces within the city area, forest visiting behav-iour and socio-economic characteristics.
Results and Conclusions
According to the mail survey, 88% of the city res-idents have visited the urban forests at least once during the past 12 months. Comparing these for-est visitors in the off-site sample with the on-site sample revealed substantial differences. Visit fre-quencies for all urban green spaces were higher among on-site sampled visitors than in the popula-tion sample. Furthermore, average WTP for an an-nual visitor permit varied significantly. The on-site value exceeded the off-site value because WTP in-creased with the number of visits and frequent vis-itors were more likely to be sampled in the forests. Moreover, the two samples differed regarding sev-eral variables describing forest visiting behaviour and socio-economic characteristics. For example, the respondents in the on-site sample were older, educated to a higher level and were more likely to live in a city-district adjoining a forest.
The results of the different methods to correct on-site estimates for sample selection bias showed that the weighted mean of visitors’ WTP correspond-ed to the residents’ mean WTP. Similar findings were observed regarding other variables. Our re-sults suggest that weighting on-site data according to individual selection probabilities approximates off-site estimates and therefore provides a valid approach to estimate population values with on-site sample values. However, weighting the data increases the variance of the estimates. Therefore, on-site surveys have to be based on larger samples than off-site random surveys to achieve the same confidence level.
References
Bateman, I. J. et al. (2002). Economic Valuation with Stat-ed Preference Techniques: A Manual. Cheltenham.
Elsasser, P. (2001). Probleme der Stichprobenauswahl und der Repräsentativität bei KBM-Umfragen. In: Elsasser, P. & Meyerhoff, J. Ökonomische Bewer-
tung von Umweltgütern. Methodenfragen zur kontin-genten Bewertung und praktische Erfahrungen im deutschsprachigen Raum. p 17-36. Marburg.
Morrison, M. (2000). Aggregation Biases in Stated Prefer-ence Studies. In: Australian Economic Papers (39/2), p 215-230.
Parsons, G. R. (2003). The travel cost model. In: P. A. Champ. A primer on nonmarket valuation, p 269-329. Dordrecht.

Siegrist, D., Clivaz, C., Hunziker, M. & Iten, S. (eds.) (2006). Exploring the Nature of Management. Proceedings of the Third International Conference on Monitoring and Management of Visitor Flows in Recreational and Protected Areas.
University of Applied Sciences Rapperswil, Switzerland, 13-17 September 2006. Rapperswil.
383
Economic and Social Effects of the Development of Recreation and Environmentally Sound Tourism through the Example of a
Hungarian National Park
Réka Bodnár
University of Debrecen, Hungary
Keywords: National parks, ecotourism, recreation, economic and social effects, sustainable development.
Introduction
The Aggtelek National Park, fourth in Hungary, was established in 1985. Its extension is 20 170 ha, the main part of which is nominated as Bio-sphere Reserve. The caves of the Aggtelek and Slovak Karst were designated as a world heri-tage site by the World Heritage Committee of the UNESCO in 1995 becoming the first such site among the Hungarian natural values. The World Heritage Status, the outstanding natural values, the landscape and climatic conditions and the tra-ditional culture together provide excellent con-ditions for the complex tourism developments of the region.
The geographical position of the Aggtelek Na-tional Park is favourable regarding both domes-tic and international tourism. This is due to the fact that large international traffic is present on the M26 and E71 routs – that encircle the nation-al park – because of the presence of the Slovakian border. However, protected areas are found dis-tant enough from these routes – considering dis-
turbance and air pollution (figure 1.) The na-tional park is found in the vicinity of the former heavy industrial triangle marked by the towns Miskolc-Kazincbarcika-Ózd having a total pop-ulation of around 252 thousand people. The Ag-gtelek National Park is a favourite recreation destiny for people living here but numerous visitors arrive from other points of the country – around 200 thousand people a year (Domán 1998).
The economic restructuring in Hungary after 1989-90 found the heavy industry in drastic re-cession. Its negative effects affect this region in multiple ways, considering both the environ-ment and the community. The social effects of the economic structure’s change are even more highlighted. Mass dismissals generated a sig-nificant unemployment rate, leading to the in-crease of the so-called “living crimes”. This process is unfavourable from the aspect of both environmental protection (e.g. wood stealing) and coming visitors. Besides unemployment, the poor infrastructure (e.g. lack and poor pro-vision of roads, railway) together with poverty give reasons of the transmigration of the young-er generation resulting the accelerated ageing of the population (Statistics Handbook of B-A-Z County 2004).
Undeveloped infrastructure and the difficult ac-cessibility prevent the development of tourism. However, this isolation assists the preserva-tion of the motives of folk architecture and the craftsmanship traditions presenting opportuni-ties for the development of country tourism. Figure 1: Geographical position of the Aggtelek National Park.

Economic and Social Effects of Recreation and Nature Tourism
384
Village housing would provide a solution to the poor standard of commercial accommodation that is the result of the general poverty in the region and to the weakness of the entrepreneurs.
The direct consequences of the transit character of tourism are the low number of visitors and the low level of revealing of tourist values, so the guaran-tee for a return of investments is relatively low. Thus the senescent resident population shows dis-trust in relation with tourist developments. The re-cently performed GEF program is trying to solve these problems.
Methods
The necessity of the program is proven by the fact that, though there are several unfavourable effects on the natural environments of Central Europe, not less than 30 % of it is still rich in natural values. In the frame of the GEF program we perform a di-rect analysis on the support capacity of a defined research area, determining the loadability of the landscape. We developed a system of aspects es-sential in the course of planning the tourist utiliza-tion of a given object.
The contentment of attendants (as customers) and inhabitants (relating their disturbance) is measured by questionnaires, while to detect the contribution of the tourism to the local economy we also made a data collection among tourist service companies, especially focusing on the effects of tourism on employment conditions, on living standard and on general price level.
Results
In the researched area, significant, but recently idle cultural and natural capacities – related to the sus-tainable development of environmentally sound tourism – are available, the development of which can improve the competitive power of the tourist sector, decreasing at the same time the undesired concentrations in space and time. However, the de-velopment of capacity for acceptance of tourism and the establishment of services of high quality promoting the raising of resident times and spend-ing are essential. From the development of tour-ism, the region can primarily expect the rising of
employment level, the spatial equalization of eco-nomic development, the advancement of the im-age, and an acquittal from the stereotype of the “citadel of heavy industry”.
References
Edit, D. et al. (1998). The region and the tourism develop-ment plan of the ANP. Jósvaf .
Statistics Handbook of B-A-Z County. (2004). Miskolc.
Siegrist, D., Clivaz, C., Hunziker, M. & Iten, S. (eds.) (2006). Exploring the Nature of Management. Proceedings of the Third International Conference on Monitoring and Management of Visitor Flows in Recreational and Protected Areas.
University of Applied Sciences Rapperswil, Switzerland, 13-17 September 2006. Rapperswil.
385
The Pfyn-Finges Park (Valais/Switzerland): What Repercussions on the Regional Economy?
Christophe Clivaz
University of Applied Sciences Western Switzerland, Switzerland
Keywords: Regional nature park, economic impacts, regional development, nature tourism, visitor behaviours.
Introduction
Following the emergence of several park projects at the end of the 1990s, the Swiss Government has assigned the Swiss Agency for the Environment, Forests and Landscape (SAEFL) to prepare a re-vision of the Federal nature and landscape protec-tion law to enable the creation of different types of parks (national park, regional nature park, peri-urban nature park). For the SAEFL, “the region-al nature park is a development tool for regions, and especially for rural areas” (Oppizzi 2003, 5). It is especially by the means of the development of tourism that one hopes to improve the economy of these areas. The study by Siegrist et al. (2002) on the potential of nature tourism shows indeed that Swiss tourists who stay in their country demand protected areas in their holiday region. The inten-tion to enhance the value of regions with high qual-ity natural or cultural heritage for tourism is also due to the fact that on an international level, eco-tourism is a constantly growing market (Arnberger & al. 2002, Epler Wood 2002, Eagles 1999).
Does the creation of a regional nature park really contribute anything from the point of view of the regional economy? Even if the Pfyn-Finges park was created recently, we propose to analyse it in order to see what the current economic repercus-sions of this park are and what the future challeng-es are.
Presentation of the Pfyn-Finges park
Pfyn-Finges is crossed by the wild Rhone River and comprises pine groves, ponds, hills and an al-luvial zone. The combination of natural and cul-
tural values and the Mediterranean climatic condi-tions of the Pfyn-Finges region constitute the ideal basis for the development of nature tourism, which aims at conserving the landscapes and the richness of fauna and flora.
In March 2000, the “Pfyn-Finges Association” was founded. Its members are the administrative bodies concerned (municipalities, socio-econom-ic regions, canton), tourist offices, environmental associations, various private persons and public in-stitutions. The objective of this association is the creation of a nature park and the development of innovative tourist activities in the fields of nature and culture. Concretely, various activities were set up these last five years (exposures, accompanied excursions, hiking paths, catering, etc.)
The Pfyn-Finges park: good for the regional economy?
To answer this question a survey by questionnaire was performed out in the summer 2004 on the visi-tors of Pfyn-Finges (Clivaz & Richard 2006). This survey shows that a great part of the current visi-tors are people of the area using this territory for their leisure activities (walking, jogging, bicycle, etc.). Thus, these people come several tens of times per year to Pfyn-Finges to practise these activities. Only a quarter of the questioned visitors live in a distance of more than 80 km of Pfyn-Finges.
As one could expect it, Pfyn-Finges is especial-ly frequented during the weekend. For 71% of the visitors, Pfyn-Finges constitutes the prin-cipal goal of their transit. In regard to behav-

Economic and Social Effects of Recreation and Nature Tourism
386
iour in the site, 15% of the visitors do not follow the marked out paths, which can involve a distur-bance of fauna and flora. Nevertheless, these same paths constitute, along with information on fauna and flora and the communication of the rules to be respected on the site, the most important elements for the questioned visitors. The visitors also wish more directional and didactic signs, more places for picnicing as well as a better maintenance of the infrastructure (paths, ponds, etc.).
Approximately half of the questioned visitors do not make any expenditure on the site of Finges. 85% of the visitors who spent something spent less than 30 Swiss Francs. To finish this short overview of the results of the survey, we can mention that three-quarters of the visitors reject the idea to have to pay to enter the Pfyn-Finges Park. The visitors who do agree with this idea are ready to pay on av-erage 5,4 Swiss Francs.
Conclusion
The survey carried out by the visitors of the park of Pfyn-Finges shows that the direct economic im-pacts remain still relatively limited today. Three factors can explain this result. Firstly, the tour-ist offer of Pfyn-Finges still remains unknown to many potential visitors (excursionists and tour-ists). Secondly, at the moment Pfyn-Finges only offers a limited range of tourist products and ser-vices for the visitors who do not have many op-portunities to spend their money. Thirdly, a great part of the current visitors are people of the area practicing leisure activities that generate almost no economic repercussions.
In this context, the challenges will be in the fu-ture to improve marketing and to develop the tour-ist offer in order to increase the repercussions of the park on the regional economy. Various projects under development, like the inauguration in 2007 of the park interpretation centre, let us think that these challenges should be taken up.
References
Arnberger A. et al. (2002). Monitoring and Management of Visitor Flows in Recreational and Protected Areas. Institute for Landscape Architecture and Landscape Management. Conference Proceedings Jan 30 – Feb 02, 2002. Vienna.
Clivaz C. & Richard S. (2006). Excursionnisme et parcs na-turels – Résultats de l’enquête auprès des visiteurs du Bois de Finges. Sierre.
Eagles P. F. J. (1999). International Trends in Park Tourism and Ecotourism. Gland.
Epler Wood, M. (2002). Ecotourism: Principles, Practices & Policies for Sustainability. UNEP.
Oppizzi D. (2003). Critères provisoires pour la réalisation des Parcs naturels régionaux. Bern.
Siegrist D. et al. (2002). Naturnaher Tourismus in der Sch-weiz. Angebot, Nachfrage und Erfolgsfaktoren. Bern.
Siegrist, D., Clivaz, C., Hunziker, M. & Iten, S. (eds.) (2006). Exploring the Nature of Management. Proceedings of the Third International Conference on Monitoring and Management of Visitor Flows in Recreational and Protected Areas.
University of Applied Sciences Rapperswil, Switzerland, 13-17 September 2006. Rapperswil.
387
Economic Analysis of Recreation by Tourists on Protected Coastal Zones: A French Case
Jeoffrey Dehez & Mbolatiana Rambonilaza
Cemagref-Bordeaux, France
[email protected]@bordeaux.cemagref.fr
Keywords: Economics, recreation, tourism, attribute-based method, non-market goods valuation, management costs, coastal zones.
Introduction
Recreation is a major use of protected coast-al zones and demand derives both from local and tourist populations. Economic impacts of such policies are hard to handle for many reasons. First, recreation is a non-market service and the lack of price is often associated with a lack of benefits. This situation is well known by economists who have elaborated various techniques for giving an economic value to many environmental functions. The Travel Costs Method (TCM) is one of the most used techniques for recreation but unfortu-nately tourists are generally dropped out the sam-ple on the basis that they do not fit the standard economic hypothesis well. Secondly, supply side is frequently neglected. This is partly because in-formation on inputs, costs and outputs is scattered between public agencies or managers. Thus, com-plete analysis of recreation is also relatively rare.
We offer here an integrated economic analysis of recreation activities in the Gironde area, a portion of coastal zone located in the South West of France. It’s famous for its natural character and tourist at-tractiveness. Natural spaces are composed by san-dy beaches, dunes and three large pine forests.
Methods
In many occasions, recreation activities fit the the-ory of Lancaster (1966) well, whereby individuals get satisfaction from certain characteristics (scen-ery, trails density, water quality) in addition to the total number of trips and prices (McConnel 1977).
For this reason, we develop an analytical frame-work based on this kind of approach, as it seems to offer better opportunities for connecting supply and demand (compared to global valuation).
Regarding the lack of literature, we propose a simple analytical framework for describing the production costs of recreational attributes. It’s based on standard microeconomics of produc-tion and designed to include both direct and res-toration costs. For the demand, we show how to adapt the standard Travel Cost Method by using a 3 stage decision process and a random utili-ty model. This comes from an early work made by Bell and Leeworthy (1990), recently adapt-ed by Riera Font (2000) in the Balearic islands. Under the new hypothesis, this type of mod-el allows for the application of the TCM with tourists. Here, we focused on the third step and the relevant “on-site costs”. The definition of the latter is discussed in the paper.
Results
Based on the previous models, we empirically estimate cost functions for various attributes. We make separated estimations for the three spaces (beach, dune and forest) and specific management actions. Total number of visits F, as well as beach lengths LN, Ld, and Lf, rec-reation area size (in forests) SZA and cycling paths’ length LPC appear to be the dominant factors. Each functional form is linear. This al-lows a matrix of marginal (or average) costs (table 1).

Economic and Social Effects of Recreation and Nature Tourism
388
Functional forms are estimated using OLS and panel data techniques (depending on the data-base). Turning to the tourists demand, a con-ditional logit is estimated where on-site costs, squared on-site costs, beach length, recreation areas and cycling paths are all significant. By doing so, we find some of the variables used in the supply analysis again. We derive measures of consumer surplus for households and indi-viduals related to each of the three previous at-tributes (table 2).
In the last part of the paper, we balance costs and benefits. Each attribute appears to have a significant economic value as a relatively small number of visits (between 690 and 8451 de-pending on the attribute) offer a positive net value. These figures are quite low compared to the total number of tourists’ day-visits (around 5 million) given by regional statistics. This tends to suggest the actual management con-forms to economic optimality and invites us to think of related policies such as funding. On that particular point, our work also offers indi-cations. For instance, peak pricing is relevant for at last three reasons: seasonality of de-mand and costs, and capacity costs (through variable SZA).
ConclusionTo conclude, we discuss the overall contribution of the attribute based approach for economic val-uation of recreation management. The presented one is very appealing for the identification of key variables (recreational characteristics) but still suffers from limitations in the evaluation of glob-al costs and benefits. For these reason, it must be completed with techniques rather than focusing on the total number of visits such as count data models.
References
Bell F.W. & Leeworthy V.R. (1990). “Recreational Demand by Tourists for Saltwater Beach Days“, In: Journal of Environmental Economics and Management (18), p 198-205.
Hanley N., Shaw W. D. & R.E W. (2003). The New Eco-nomics of Outdoor Recreation. Cheltenham, U.K - Northampton, USA.
Lancaster K. J. (1966). “A new approach to consumer theo-ry”. In: Journal of Political Economy (74), p 132-157.
McConnell K. E. (1977). “Congestion and Willingness to pay: A Study of Beach Use”. In: Land Economics (53/2), p 185-195.
Management actions Constant LN(km)
Ld(km)
Lf(km)
SZA(Ha)
Config (dum)
Fest(visits)
F(visits)
Lpc(Km)
Life guarding 0,049 Beach cleaning 13.992
Dune management 3.100 Cycling paths (investment) 2.682,98
Cycling paths (operating) 626,19
Recreation areas (investment) 7.603 917 20.972
Recreation areas (operating) 8.138,42 1.197,81 0,016
Forest management 589,75 589,75 Total 13.992 3.100 8.138,42 2.713,56 20.972 0,049 0,016 3.898,92
Table 1: Marginal costs of producing recreational attributes (Euros 2002).
Attributes Unit Marginal benefit (day/household/€)
Marginal benefit (day/individual/€)
Cycling paths (LPC) 1km 22,60 5,65 Recreation areas (SZA) 1ha 1,26 0,32
Beach Length (L) 100m 8,67 2,17
Table 2: Marginal benefits for recreational attributes (Euros 2002).

Siegrist, D., Clivaz, C., Hunziker, M. & Iten, S. (eds.) (2006). Exploring the Nature of Management. Proceedings of the Third International Conference on Monitoring and Management of Visitor Flows in Recreational and Protected Areas.
University of Applied Sciences Rapperswil, Switzerland, 13-17 September 2006. Rapperswil.
389
Estimating Recreation Market Share for National Forests
Donald B.K. English, Susan M. Kocis, H. Ken Cordell & Gary Green
USDA Forest Service, USA
[email protected]@fs.fed.us
[email protected]@fs.fed.us
Keywords: Land management, land use, recreation activity, recreation resources, market share.
Introduction
Public land managers are often faced with decid-ing among several alternatives for how to allocate limited funding for the maintenance, improve-ment, or development of recreation resources and opportunities. Often those decisions are linked to resources that support particular recreation activi-ties, and a goal is to ensure that local residents are well served. One key piece of information is iden-tifying what activities occur often on those lands. More important is identifying for which activities the agency lands are a primary resource. This pa-per documents a method for determining the rela-tive importance of a specific public lands base for supporting a set of recreation activities for a de-fined population. In essence, the analysis estimates the share of a regional recreation activity market captured by a particular resource base. Specific examples of results are provided from several Na-tional Forests in the U.S.
Methods
This method combines information from two ma-jor recreation surveys for the US. Information about the amount of recreation activity occur-ring on a particular national forest comes from the Forest Service’s National Visitor Use Monitoring (NVUM) data. These data provide the numera-tor for the market share analysis. Total recreation activity is estimated through results from the Na-tional Survey on Recreation and the Environment (NSRE). Key elements that enable computation of a market share are consistent definitions of the set of recreation activities, the metric for activity vol-
ume, and the bounds for the geographic area of the origin market. In this case the activity volume met-ric was days of participation in an actvitiy.
The first step in the analysis is to define a geograph-ic area that serves as the control region. From the NVUM data, a cumulative distribution function (CDF) of distances traveled for onsite visits is con-structed. The CDF determines the distances from the forest that generate a target percentage of to-tal visits. It is not unusual for a high percentage of National Forest visits to be generated from a small area. By mapping the origin counties of survey re-spondents who live in the targeted regions, a gener-al picture of the primary market zones can be real-ized. For this analysis, market zones that generate half and three-fourths of the visits to a national for-est are defined. Activity volume occurring on the forest and generated by the target origin zone is computed by a weighted analysis of the percent of visits from the target origin zone engaging in each recreation activity, and multiplying by the number of total visits emanating from that zone. Visits are converted to activity days by multiplying by aver-age visit length in days. NSRE data describes the total volume of recreation that is generated by the population in the same geographic area, regardless of destination. The process is to first determine the percent of the population engaging in an activity, and multiply by the average annual days of partici-pation per participant.
NVUM data provide an estimate of the amount of recreation activity days originating from a given area and ending on a national forest. NSRE data provide an estimate of activity days originating from the same area and ending anywhere.

Economic and Social Effects of Recreation and Nature Tourism
390
The ratio provides an estimate of the market share of recreation days form that origin that are captured by the national forest.
Results
Results of the market area zone analysis for the White River NF(WRNF) in Colorado are displayed in Figure 1. Geographic resolution was limited to counties. Counties in red are ones that had surveyed respondents and lay within the 50% distance zone.
Counties shown in blue were ones that had survey respondents and lay in the 50 to 75% zone. While the 50 percent zone is a fairly tight geographic area, the draw of a number of major ski areas and sum-mer resorts causes the 75% zone to cover a large portion of the country. Market share analysis was limited to the 50% zone. Table 1 shows the market share results for that origin zone.
The WRNF is a primary provider for winter recre-ation opportunities for the market zone. This esti-mate is that over half of the downhill skiing days, and nearly one-quarter of cross-country skiing days generated by the origin zone population have a des-tination on this forest. As well, over 13 percent of snowmobiling days occur there. In addition to those activities, the forest is an important resource for big game hunting (market share of about 7%), and developed camping (over 4 % market share). Although the market area population generates over 2 million activity days of viewing scenery and over 1.4 million days of hiking, and 1.5 million days of viewing wildlife on the forest, the WRNF market share for each of those activities is less than 1.5%.
ActivityNSRE annual activity days
Total (1000’s)
NVUM annual activity days onWRNF (1000’s)
Market share (%)
Picnicking 16,704 246 1.47 Driving for pleasure 31,491 371 1.18 Hiking 114,299 1,424 1.25 Developed camping 7,751 330 4.26 Primitive camping 7,804 194 2.49 Off- road driving 16,328 243 1.49 Backpacking 6,050 164 2.71 Snowmobiling 1,105 147 13.29 Downhill skiing 5,275 2,991 56.7 Cross-country skiing 2,172 516 24.88 Gathering forest products 11,047 79 0.72 Viewing natural scenery 161,919 2,092 1.29 Visiting nature centers 59,225 187 0.32 Horseback riding 3,311 46 1.4 Hunting big game 2,543 173 6.79 Fishing, cold water 19,011 301 1.58 Biking / Mtn. biking 113,080 482 0.43 Viewing wildlife, etc 124,341 1,559 0.74
Table 1: Market share analysis for 50% visit zone around White River National Forest.
Figure 1: 50% and 75% market share for White River NF.

Siegrist, D., Clivaz, C., Hunziker, M. & Iten, S. (eds.) (2006). Exploring the Nature of Management. Proceedings of the Third International Conference on Monitoring and Management of Visitor Flows in Recreational and Protected Areas.
University of Applied Sciences Rapperswil, Switzerland, 13-17 September 2006. Rapperswil.
391
Modelling Visitor Expenditures at Fulufjället National Park, Sweden
Peter Fredman
Mid-Sweden University, Sweden
Keywords: Expenditures, economic impact, national park, protected areas, visitor studies.
Introduction
Protected areas should not be regarded as geo-graphically isolated entities and it is essential to adopt a perspective that extends beyond park boundaries. A national park is in itself a sight of-ten worth seeing which attracts visitors, but in many cases it is associated with a larger com-plex including transportation, lodging, food ser-vice, outdoor recreation opportunities and other attractions. This presentation reports analyses of expenditure data at different geographical levels from visitor surveys at Fulufjället National Park in Sweden. The region directly surrounding the park is referred to as a ‘gateway’ area, and many of the tourism businesses providing services for visitors to Fulufjället are located there.
The volume and type of non-resident visitor ex-penditures is the primary economic force behind regional tourism impacts and represents an influx of new money to the economy. Studies of expen-diture patterns help to describe the size of each travel market in economic terms and destinations
can better benefit from marketing efforts. It also leads to the identification of attributes influenc-ing travel expenditure characteristics among mar-ket segments. Numerous studies of household travel and expenditures are available on a macro level, but less is known about socioeconomic fac-tors that affect this pattern and the effects of un-derlying demographic characteristics on visitors’ expenditures (Cannon & Ford 2002; Fish & Wag-gle 1996).
Fulufjället National Park represents an important trend in current Swedish environmental policy as this is the first national park where the planning strategy explicitly builds on visitor data in order to develop recreational opportunities and tourism (Wallsten, 2003). In the year before and the year after designation, extensive visitor surveys were conducted to guide the park management plan and further development, as well as to monitor chang-es in visitor characteristics, activities and impacts (Fredman et al. 2005). According to visitor sur-veys, park visitation increased by 40% following its designation (Fredman et al. 2006).
Methods
Visitor surveys were undertaken at Fulufjället National Park in the summers of 2001 and 2003 by means of automatic trail counters and self-reg-istration boxes (Fredman et al. 2005). A sample of 980 Swedish and 520 German visitors that reg-istered at the self-registration boxes received a mailed questionnaire sent to their home address some weeks after the visit (response rate >80%). Besides several attitude questions about outdoor recreation and park management, the survey in-
Figure 1: Fulufjället National Park with surroundings.

Economic and Social Effects of Recreation and Nature Tourism
392
cluded items concerning travel patterns, demo-graphic background and visitor expenditures. In the 2003 survey respondents reported their expen-ditures on lodging, food, shopping, activities, trans-portation etc. in Fulufjället National Park, the gate-way area and the region outside the gateway area.
Results
Data analyses show several significant differenc-es in expenditure patterns between the geographi-cal regions and the two nationalities studied (table 1). Among Swedish visitors, 46% reported at least one expenditure item in the National Park, 31% re-ported expenditures in the gateway area and 55% in the region. The equivalent figures for the Ger-man visitors are somewhat lower in the National Park and Fulufjället region, while almost 40% re-ported expenditures in the gateway area. Looking at the average expenditures among those who re-ported at least one expenditure item in each geo-graphical area respectively, there are considerable higher numbers among German visitors compared to Swedish. Given the efforts to develop tourism in the Fulufjället Gateway area, it is surprising to find that only about one third of the visitors report ex-penditures in this area.
Combining the data of the two nationalities, a lo-gistic regression was used to analyze determinants of expenditure frequencies (i.e. whether or not a visitor reported any expenditure), and determinants of expenditure average levels were analyzed us-ing a log-linear regression model. Preliminary re-sults show that the quality of the recreational expe-rience, previous visits, nationality, gender, income, wilderness purism, and length of stay are associ-ated with expenditure frequencies, while income, and length of stay are associated with expendi-tures levels.
References
Cannon, T.F. & Ford, J. (2002). Relationship of demograph-ic and trip characteristics to visitor spending: an anal-ysis of sports travel visitors across time. In: Tourism Economics (8/3), p 263-271.
Fish, M. & Waggle, D. (1996). Current Income versus Total Expenditure Measures in Regression Models of Va-cation and Pleasure Travel. In: Journal of Travel Re-search (fall), p 70-74.
Fredman, P., Hörnsten Friberg, L. & Emmelin, L. (2005). Friluftsliv och turism i Fulufjället. Före - efter nation-alparksbildningen. Naturvårdsverket, rapport 5467. Dokumentation av de svenska nationalparkerna, nr 18.
Fredman, P., Hörnsten Friberg, L. & Emmelin, L. (forth-coming) Increased Visitation from National Park Des-ignation. In: Current Issues in Tourism.
Wallsten, P. (2003). The ”Inside-Out” Process. A Key Ap-proach for Establishing Fulufjället National Park in Sweden. In: Mountain Research and Development (23/3), p 227-229.
FulufjälletNational Park (NP)
FulufjälletGateway area
(outside the NP)
Fulufjället region (outside gateway area)
Swedish visitors 46.1%
178.6 SEK (155.2 – 202.1)
30.7%777.5 SEK
(615.4 – 939.5)
55.5%1702.6 SEK
(1552.6 – 1852.6)
German visitors 42.4%
349.2 SEK (119.2 – 579.2)
39.7%1859.2 SEK
(1054.7 – 2663.8)
48.3%3402.2 SEK
(2577.6 – 4226.8)
Table 1: Proportion of visitors who reported an expenditure and average expenditures in each geographical region (95% c.i. in brackets).

Siegrist, D., Clivaz, C., Hunziker, M. & Iten, S. (eds.) (2006). Exploring the Nature of Management. Proceedings of the Third International Conference on Monitoring and Management of Visitor Flows in Recreational and Protected Areas.
University of Applied Sciences Rapperswil, Switzerland, 13-17 September 2006. Rapperswil.
393
Assessment of Local Economic Impacts of Recreation: The Case of Pallas-Ounastunturi National Park
Maija T. Huhtala
University of Helsinki, Finland
Keywords: Economic impacts, recreation, visitor expenditure, input-output analysis.
IntroductionIn many rural areas the number of inhabitants is rapidly decreasing as people move into cities. This leads to fewer jobs and services in the coun-tryside, which further precipitates migration from the villages. In Finland nature-based tourism has been suggested as a key to break this vicious cir-cle. However, it is still unclear how much income and employment nature tourism actually generates in the host area and how these effects should be measured.
This study is part of a process which aims at creat-ing a regional economic impact assessment system for Metsähallitus (Finnish Forest and Park Ser-vice) which needs economic impact information to justify investments and maintenance of nature protection areas. The assessment system will be based on visitor survey data collected regularly by Metsähallitus in all recreation areas under its ad-ministration. In this case study a U.S. Visitor sur-vey / input–output-model (Stynes et al. 2000) is modified and tested in Pallas-Ounastunturi Nation-al Park in northern Finland. The model includes three components: annual number of visitors, their average spending in the area and multipliers de-rived from the local input–output table.
MethodsTo test the reliability of the spending estimates re-ceived from regular visitor surveys, an expendi-ture survey was conducted applying a diary meth-od in the national park and its sur-roundings in 2004. The survey revealed the average spending and segmentation of the spending in eight expen-diture categories. The annual number of non-local
visitors (95,200) in Pallas-Ounastunturi was mul-tiplied with the average spending in each category to achieve total spending.
The local input–output table was constructed from the province-level table by aggregating industries and using a number of companies in each indus-try aggregate as a location quotient (e.g. McCann 2001 170). Before entering the total spending into the input–output model, the leakages and value-added tax were subtracted. The leakages from the local economy occur because enterprises buy ma-terials and services outside the region. The remain-ing sum, the change in final demand, was then en-tered into the input-output model and as a result the direct and indirect impacts of national park vis-itors’ spending on the local income became known. The number of jobs, salaries and communal taxes were counted, utilising the information from Sta-tistics Finland.
ResultsAs table 1 shows, the results indicated that the vis-itor survey spending estimates are slight underes-timations, compared to the estimates from the di-ary method. The difference between the methods was statistically significant in winter but not quite in summer. The average length of visit was seven days in winter and five days in summer. Tourists spent the most money on lodgings, restaurants and retail shops.
Impacts on the local income, jobs, salaries and taxes are shown in table 2. The local input-output analysis indicated that due to a multiplication ef-fect, one euro of travel income produces on aver-age 1,27 euro for the local economy.

Economic and Social Effects of Recreation and Nature Tourism
394
This case study showed that recreation tourism may notably affect the local economy of the area. As the results, as well as the multipliers derived from the local input-output model, were in line with previous studies, it can be concluded that a U.S. model is applicable also in Finland. Howev-er, in order to establish the economic impact as-sessment system, the study should be repeated in different types of recreation areas. Considering the accuracy and effort required, it should also be con-templated whether counting the indirect effects is worthwhile in less popular areas where the indirect effects tend to be much smaller.
References
McCann, Philip. (2001). Urban and Regional Economics. New York.
Stynes, D.J., Propst, D.P., Chang, W-H. & Sun, Y.Y. (2000). Estimating National Park Visi-tor Spending and Eco-nomic Impacts; The MGM2 Model. Michigan State University. http://www.prr.msu.edu/MGM2/MGM2.pdf.
Summer Winter Expenditure diary 156 € 306 € Visitor survey 128 € 257 € p-value 0,084 0,000
Table 1: Mean visitor spending in the research area per trip.
Winter Direct
Summer Direct
Winter + Summer Indirect
Total
Net income, 1000€ 5 450 4 118 2 559 12 127 Number of jobs 81 64 18 163 Salaries, 1000 € 1 556 1 184 367 3 107 Communal taxes, 1000€ 297 225 70 591
Table 2: Local direct and indirect economic impacts.

Siegrist, D., Clivaz, C., Hunziker, M. & Iten, S. (eds.) (2006). Exploring the Nature of Management. Proceedings of the Third International Conference on Monitoring and Management of Visitor Flows in Recreational and Protected Areas.
University of Applied Sciences Rapperswil, Switzerland, 13-17 September 2006. Rapperswil.
395
Are Admission Fees for Large Urban Historic Parks Feasible and Fair? Empirical Results from a Survey in the Prussian Palace
Gardens in Berlin and Potsdam
Axel Klaphake
Berlin University of Technology, Germany
Keywords: Admission fees, visitors’ acceptance, recreation areas, historic parks, willingness-to-pay, contingent valuation, survey, iterative bid design.
Introduction
The question of how large urban recreation areas can be financed in a sustainable manner is cur-rently intensively debated in Germany. In view of decreasing local public budgets, the introduc-tion of admission fees receives increasing atten-tion among policy makers. Since many urban parks in Germany have a historic character and often are protected as horticultural monuments, assuring a proper and sustainable maintenance is of particular importance. In Berlin and its sur-roundings, there are several huge public recre-ation areas in urban areas where admission fees are already obligatory and constitute an impor-tant financial source. Recently, the foundation that is in charge of the management of the large Prussian palace gardens in Berlin and Potsdam announced it would consider the introduction of admission fees even for those Parks that are lo-cated in densely populated areas. Clearly, the Parks concerned show an enormous social im-portance in terms of size, visit numbers and the variety of possible recreation activities.
Admission fees are potentially at odds with rec-reation objectives and social and equity concerns wherefore citizens’ and users’ acceptance can not be taken for granted. In this context, the per-ception of fairness of first-time admission fees might play a crucial role in determining visitor responses to fees. Obviously, charging the ac-cess to public parks would imply that the open access policy, which is still pursued in the major-
ity of German urban parks, could not be retained. There is little doubt that the introduction of pric-es reduces use rates, depending on the elastici-ty of demand. Consequently, we can expect that obligatory admission charges will result in a drop of visitor numbers. In particular, local people liv-ing closest to the Parks are likely to be particu-larly indignant at the thought of paying a fee for an area they are used to enter without any restric-tions. Furthermore, admission fees might par-ticularly exclude low-income people from rec-reation in the historic gardens. The expectable decrease of visit numbers might not only point to unintended social effects but also question the economic feasibility of admission fees because we can not take for granted that revenues will ex-ceed the costs associated with admission charg-es. However, the magnitude of the reduction of the overall use level is an empirical issue just as the acceptance of fees, the expectable use rates of different user groups and their average will-ingness-to-pay.
Methods
Against this background, we present the results of a visitor survey (N = 1550) that was under-taken in two well known historic parks in the Berlin-Potsdam Region in Germany: the Palace Garden Sanssouci and the Palace Garden Char-lottenburg. Both palace gardens rank among the most frequented urban parks in the region and at-tract more than 1,5 million visits per annum each.

Economic and Social Effects of Recreation and Nature Tourism
396
However, the palace gardens do not only attract local people seeking recreation but internation-al and national tourists in parallel. The objective of the empirical analysis was to assess the ac-ceptance of admission fees and to elicit visitors’ willingness-to-pay. Apart from expectable reve-nues, we analyzed the potential effects of differ-ent price strategies on the visit numbers and the perceived fairness. We also assessed the impact of admission fees on different types of visitors (tourists, local people etc.) and income-groups. In particular, we aimed to show whether, and if so to what extent, low income users may show to be more responsive to the introduction of admis-sion fees than high-income visitors.
Results
We will show that both the income of the respon-dents and the type of visitor determine signifi-cantly visitors’ willingness-to-pay. Furthermore, we used the survey to analyze the visit motives, the planned activities during the visit and visi-tors’ attitudes regarding various issues (e.g. fair-ness of admission fees, alternative fund rising options, importance of horticulture monument preservation). In the presentation we will focus explicitly on the interrelationship between the motives and attitudes and the measured willing-ness-to-pay. Finally, we will show that proxim-ity to the historic Parks does not only influence the frequency of visits and the reported length of the stay at the site but also the perceived fairness of access fees. To assess the willingness-to-pay, we implemented the Contingent Valuation Meth-od, an iterative bid design was used to assess use rates associated with different fees and pricing strategies.

Siegrist, D., Clivaz, C., Hunziker, M. & Iten, S. (eds.) (2006). Exploring the Nature of Management. Proceedings of the Third International Conference on Monitoring and Management of Visitor Flows in Recreational and Protected Areas.
University of Applied Sciences Rapperswil, Switzerland, 13-17 September 2006. Rapperswil.
397
How Involvement and Economical Benefits can Change Local Residents’ Attitudes of Nature Conservation and Tourism:
Karula National Park, Estonia
Mart Reimann1 & Mari-Liis Lamp2
1,2Tallinn University, [email protected]
2University of Tartu, [email protected]
Keywords: Community-based tourism, public involvement, national park development, attitudes, perceptions, im-pacts.
Introduction
In case of tourism development in protected ar-eas, local community involvement and benefits from tourism are important issues. Income from tourism has potential to raise local awareness and satisfaction of national parks. Consequently, crowds and traffic can cause negative impacts on the local community (Andereck et al 2005, To-sun 2006). Public involvement in decision mak-ing processes in park management and participa-tion in tourism are important aspects to increase resident satisfaction (Fennell 2003). This paper presents an overview of local resident satisfac-tion of tourism and nature conservation in Karu-la National Park.
Karula National Park was established in 1993 to protect diverse post-glacial and cultural land-scapes in Southern Estonia. Seventy percent of the park is covered by natural landscapes includ-
ing eskers, cupolas, lakes and forests. Cultural landscapes of Karula formed as a result of human activities during hundreds of years and covering 30% of the park’s territory. The national park’s territory is 111 km2 and population is 178.
Methods
In 1998 and 2005 studies were carried out among local residents of their perceptions and satisfaction about the national park’s regulation and tourism development. Seventy-seven households live per-manently in the area; sixty-six were interviewed in 1998 and 62 in 2005. The working group visit-ed each home and interviewed one representative of each household. The sample was compiled con-sidering equality of gender and proportionality of age. Onsite structured survey was used with a brief follow-up interview. In 2005 also 14 summer resi-dents were investigated.
True (%) 1998 2005
Not true (%) 1998 2005
Cannot say (%) 1998 2005
Thanks to the existence of Karula national park I have gained economic benefits
16,7 31,6 72,7 60,5 10,6 7,9
I hope to gain economic benefits in the future due to the national park
31,8 44,7 39,4 36,8 28,8 17,1
I am glad to live in Karula national park 53 75,0 4,5 10,5 42,4 13,2
The existence of Karula national park disturbs my daily life
21,2 11,8 75,8 81,6 3 3,9
Table 1: Respondents’ assessments of the statements.

Economic and Social Effects of Recreation and Nature Tourism
398
Results
In both years respondents thought that nature in the national park was worth protection. During the second investigation when the national park was already in existence more respondents hoped to gain economic benefits than during the first study and less people said that the national park disturbs their daily life (table 1). In both studies the main problems were related to forest cutting and build-ing restrictions.
The number of tourism enterprises has grown from 4 in 1998 to 12 in 2005. Entrepreneurs who were operating before the establishment of the nation-al park did not find so much help of the national park’s promotion for their businesses as those en-trepreneurs who started later.
As residents’ attitudes towards the national park got more positive towards visitors their attitudes became more negative (table 2).
There are several reasons for attitude changes in the national park during the two investigations. In the beginning of the establishment of the nation-al park people were sceptical of the national park regulations which were new and caused misun-derstanding. After 1998 the national park admin-istration made an effort to inform and involve lo-cals more in the management process. The national park administration helped to clean up some locals’ favourite recreation places and provided financial support for maintenance of cultural landscape.
Conclusion
Each year with the increase of visitors, locals have perceived more disturbances by visitors. The study showed that locals who were more involved in tourism were more positive about the national park and less critical towards visitors than those residents who benefited less from tourism. Sum-mer residents were much more negative about vis-
itors than locals because they are mostly in the na-tional park at the same time than visitors and they do not benefit from tourism like many locals do. Despite more negative attitudes towards visitors in 2005 the majority of respondents were positive about tourism development in general and thought that this was an important tool to improve life qual-ity of a local community. Due to involvement and informing process by the national park administra-tion locals’ attitudes about national park have be-come more positive during 7 years; many of them found that the national park does not only mean re-strictions but also support for their activities.
References
Andereck, K.L., Valentine, K.M., Knopf, R. C. & Vogt, C.A. (2005). Residents perceptions of community tourism impacts. In: Annals of Tourism Research (32), p 1056-1076.
Fennel, D. (2003). Ecotourism. An Introduction. Rout-ledge.
Tosun, C. (2006). Expected nature of community partici-pation in tourism development. In: Tourism Manage-ment (27), p 493-504.
True (%) 1998 2005
Not true (%) 1998 2005
Cannot say (%) 1998 2005
Thanks to the existence of Karula national park I have gained economic benefits
16,7 31,6 72,7 60,5 10,6 7,9
I hope to gain economic benefits in the future due to the national park
31,8 44,7 39,4 36,8 28,8 17,1
I am glad to live in Karula national park 53 75,0 4,5 10,5 42,4 13,2
The existence of Karula national park disturbs my daily life
21,2 11,8 75,8 81,6 3 3,9
Table 2: Is a large amount of visitors a danger to Karula area?

Siegrist, D., Clivaz, C., Hunziker, M. & Iten, S. (eds.) (2006). Exploring the Nature of Management. Proceedings of the Third International Conference on Monitoring and Management of Visitor Flows in Recreational and Protected Areas.
University of Applied Sciences Rapperswil, Switzerland, 13-17 September 2006. Rapperswil.
399
Winter Sport Tourism – Victim under Conditions of Climate Change?!?
Wiebke Unbehaun1, Ulrike Pröbstl1 & Wolfgang Haider2
1University of Natural Resources and Applied Life Sciences, [email protected]
2Simon Fraser University, [email protected]
Keywords: Winter sport tourism, climate change, destination choice, discrete choice experiment.
Introduction
In many Austrian regions winter tourism is an im-portant source of income. Therefore they are high-ly dependent on sufficient snow conditions. In the past, some winters’ lack of snow gave the alpine ski destinations a first idea of the impacts of cli-mate change. The question arises: how do different types of winter sportsmen react to changing skiing conditions caused by climate change and how sen-sitive are they to snow independent substitutes? To follow this question an inquiry of 1000 Vien-nese skiers and boarders was conducted using an online questionnaire. The application of a Discrete Choice Experiment secures an individual oriented approach that takes the various preferences of ski-ers and boarders into account and helps to identify destination choice determining attributes. The re-sult of the inquiry aims to show future options for winter (sport) tourism management.
Methods
There are some studies dealing with climate change impact assessment and the adaptation strategies of winter sport destinations, but only a few consid-er the adaptation strategies of winter sport tourists and their impacts on their activity and destination choice. This survey follows an individual orient-ed approach to survey the adaptation processes of winter sport tourists under conditions of climate change. The inquiry of active skiers and boarders com-prises the following topics:
skiing biographies and reasons for changes in the destination choice;
travel motives and the preferences in winter sport;
destination choice determining attributes and the potentials of snow independent substitutes (part of the DCE);
expectations according to climate change.
The inquiry centres on a discrete choice experi-ment (DCE). Hypothetical profiles of ski desti-nations are combined to choice sets of two. Each profile is described by eight attributes concerning the performance of ski destinations with two to four levels. Four of these choice sets are offered to the respondents. From each of these choice sets the respondents have to choose the most preferred alternative (Louviere & Woodworth 1983, Louvi-ere et al. 2000).
The DCE has three sequences aiming to survey the trade offs (see figure. 1):
between profiles of ski destinations to learn about the preferences concerning the ski relat-ed performance of winter sport destinations (1st
Sequence);
between snow sureness and other ski related as-pects of the destination to learn about the sig-nificance of snow sureness(2nd Sequence);
between snow sureness and additional free and snow independent attractions, to learn about the acceptance of substitutes(3rd Sequence).

Economic and Social Effects of Recreation and Nature Tourism
400
The DCE takes the multi-attributive nature of des-tination choice into account and allows also an exploration of non-existing alternatives that sup-ports the scenario conduction (Haider 2002, Tim-mermans 1984, Timmermans & Golledge 1990). Thereby attributes are considered in the context of each other. But the analysis allows estimating the part worth utility for each attribute level and there-fore its relevance for the decision. Because of its decompositional character the DCM allows to gen-erate every possible profile out of the eight attri-butes and to calculate the probably of every possi-ble profile to be chosen. This information will be used in a decision support system (DSS) that helps estimate further development potentials of winter sport destinations and supports the trade off of fur-ther development goals and investments.
Results
The survey shows that skiers develop their own ad-aptation strategies to deal with changed skiing con-ditions. These strategies are as various as the types of winter sportsmen are. In winters, lack of snow destinations in high altitudes become more impor-tant and travel distances lose relevance. Obvious-ly compensation measures of the destinations also influence the destination choice. Especially in con-text with this year’s strong winter the survey shows that there are other requirements besides snow
sureness concerning the quality of the destinations’ performance. The DCE proved to be a qualified method to cover the complexity of the activity and destination choice of winter sport tourists.
References
Bürki, R. & Elsasser, H. (2003). Auswirkungen von Um-weltveränderungen auf den Tourismus – dargestellt am Beispiel der Klimaänderung im Alpenraum. In: Becker, Ch. et al. (ed.). Geographie der Freizeit und des Tourismus. München.
Haider, W. (2002). Stated Preference & Choice Models – A Versatile Alternative to Traditional Recreation Re-search. In Arnberger, A. et al. (ed.). Monitoring and Management of Visitor Flows in Recreational and Protected Areas. Conference Proceedings, p 115-121. Vienna.
Louviere, J., Hensher, D.A. & Swait, J. (2000). Stated Choice Methods. Cambridge.
Louviere, J. & Woodworth, G. (1983). Design and analy-sis of simulated consumer choice or allocation experi-ments: An approach based on aggregate data. In: Jour-nal of Marketing Research (20/4), p 350-366.
Timmermanns, H. (1984). Decompositional multiattrib-ute preference models in spatial choice analysis : A review of some recent developments. In: Progress in Human Geography (8/2), p 189-212.
Timmermanns, H. & Golledge, R.G. (1990). Application of behavioural research on spatial problems II: Pref-erence and choice. In: Progress in Human Geography (14/3), p 311-334.
Profile of destination A
Attribute 1Attribute 2
etc.
Profile of destination B
Attribute 1Attribute 2
etc.Decision
Destination A/B
Destination Chigher snow sureness
BUTHigher costs and longer
travel timeDecision
Destination A/B
next choice Set
Destination C Destination A/Bwith free additional
attractions
1. Sequence
2. Sequence
3. SequenceDecision
next choice Set
Figure 1: DCE’s three sequences.

401
402
Exploring the Foundation of Human-Wildlife Conflictin Parks and Protected Areas
Frank Jensen Sondergaard & Jerry Vaske (Chairs)

Siegrist, D., Clivaz, C., Hunziker, M. & Iten, S. (eds.) (2006). Exploring the Nature of Management. Proceedings of the Third International Conference on Monitoring and Management of Visitor Flows in Recreational and Protected Areas.
University of Applied Sciences Rapperswil, Switzerland, 13-17 September 2006. Rapperswil.
403
Conflict Strategies as a Task for the Management of Protected Areas – Shown at the National Park Donau-Auen
Christiane Brandenburg1 & Karen Ziener2
1University of Natural Resources and Applied Life Sciences, [email protected]
2University of Klagenfurt, [email protected]
Keywords: Conflict, conflict potential, conflict strategy, conflict analysis, visitor monitoring, management of protect-ed areas.
Introduction
The establishment and management of a protect-ed area can rarely be put into practice without con-flicts. As early as in the planning phase, conflicts with individual user groups, owners, residents, communities and regional businesses become ap-parent. Protected area management is confronted with a number of conflicts concerning interests, tar-gets and spatial use, which interact with each other, last for a long period of time, and can create com-plex conflict situations. The targeted and farsight-ed handling of conflicts is a basic task of protected area managements. This includes taking an active position in conflict processes, as well as avoiding unnecessary confrontations, and canalising con-flicts with the aim of fulfilling the duties and goals of a protected area. In this case, conflict strategy means taking a complex approach to a complex problem. This conflict strategy should focus on a complex regional view of conflict, including poten-tial conflicts and their effects on planning and man-agement and, at the same time, making it possible to act flexibly in conflict situations.
From the viewpoint of social sciences, a conflict is regarded as a confrontation between at least two parties (conflict as process of interaction). Before this, only a potential for conflict exists, consisting of the conflict subject and the, still peaceful, con-flicting parties (Berkel 1997). Unlike a problem, there can not be a one-sided solution to a conflict, as it is often thought by management. Besides in-formation and communication deficits, conflicts in protected areas result from spatio-structural con-
flict potentials. From the ecological viewpoint, this means that an unfortunate relationship exists be-tween the sensitivity of a landscape and the inten-sity of its use (e.g. visitor frequencies, overlapping of various uses like agriculture, forestry, leisure and recreation use, settlement activities). Resultant en-vironmental protection derives measures to limit use and to set legally binding restrictions and regu-lations. Their implementation is usually accompa-nied by conflicts. From the point of view of the us-ers, a potential for conflict exists when their own demands are hindered by restrictions from environ-mental protection and regulations in the protected area. This users’ perspective was underestimated by the management of protected areas for a long time (Ziener 2003).
Methods
In the Lobau, the Viennese part of Danube Flood-plains National Park, the authors accomplished a comprehensive analysis of conflict potentials and conflicts, as well as the conflict management strate-gy of the park management. Diverse methods were used like video monitoring, interviews of visitors, in-depth interviews with local experts as well as structure and process analysis.
Results
In the Upper Lobau a conflict potential exists due to the high level of fragmentation of the wild-life’s habitat through a dense network of paths as

Exploring the Foundation of Human-Wildlife Conflict in Parks and Protected Areas
404
well as the high intensity of use by various user groups. The conflict potential in the Lower Lo-bau is characterized by a large number of very sensitive phytotypes. In reaction to this situation the park management provided maps of bike and hiking paths in the Lobau which did not show the entire network of paths. However, the hoped for (gentle) steering effect did not occur. The man-agement was forced to realize that, in the recre-ational area, to a large extent, by people living nearby (Arnberger et al. 2001), all paths contin-ued to be used and that, therefore, that kind of method would not lead to easing the situation in sensitive areas. There is another conflict with dog owners who, in spite of the regulation that dogs be kept on the leash in National Parks, let their animals run free. Of the estimated 50,000 dogs, per annum, in the entire Lobau, only 34% are leashed (Arnberger et al. 2005). A conflict not only exists with the park management be-cause the wildlife is unsettled, but also with vis-itors without dogs who feel disturbed and endan-gered. In both conflicts it is necessary to deal with certain user groups and individual users. The conflict strategy combines steering mea-sures and land use concepts with a broad spec-trum of communicative, cooperative and con-sensus-oriented activities.
Conclusion
A conflict solution is made up of two compo-nents linked with each other. On one hand, a broad spectrum of communicative, cooperative and consensus-oriented activities relies on the immediate settlement of the conflict. On the oth-er hand, a reduction of the conflict potential be-tween sensitivity and intensity of use requires seeking a solution within the framework of steer-ing measures, sustainability approaches and in-tegrated use concepts.
References
Arnberger, A., Brandenburg, C., Muhar, A. & Eder, R. (2005). Hunde als Herausforderung für das Schutzge-bietsmanagement. In: Pröbstl, U., Sterl, P. & Wirth, V.: Tourismus und Schutzgebiete - Hemmschuh oder Partner? 24.11.-25.11.2005. Vienna.
Arnberger, A. & Brandenburg, C. (2001). Der Nationalpark als Wohnumfeld und Naherholungsgebiet - Ergebnisse der Besucherstromanalyse im Wiener Anteil des Na-tionalpark Donau-Auen. In: Naturschutz und Land-schaftsplanung (33/5), p 157-161.
Berkel, K. (1997). Konflikttraining. Konflikte verstehen, analysieren, bewältigen. In: Arbeitshefte für Füh-rungspsychologie (15). Heidelberg.
Ziener, K. (2003). Das Konfliktfeld Erholungsnutzung – Naturschutz in Nationalparken und Biosphärenreser-vaten. Aachen.
Siegrist, D., Clivaz, C., Hunziker, M. & Iten, S. (eds.) (2006). Exploring the Nature of Management. Proceedings of the Third International Conference on Monitoring and Management of Visitor Flows in Recreational and Protected Areas.
University of Applied Sciences Rapperswil, Switzerland, 13-17 September 2006. Rapperswil.
405
Reported Conflict between Pastoralists and Wildlife around the Ruaha National Park, Tanzania
Amy J. Dickman
Zoological Society of London, UK
Keywords: Human-wildlife conflict, pastoralists, Ruaha, large carnivores, Tanzania.
Introduction
Protected areas are vital for conservation, but are often of insufficient size to contain viable popula-tions of very wide-ranging species, such as chee-tahs (Acinonyx jubatus), African wild dogs (Lyca-on pictus) and other large carnivores (Woodroffe & Ginsberg, 1998). Consequently, these animals of-ten stray outside reserve boundaries onto adjacent unprotected land, where they frequently cause in-tense conflict with people. They can impose sig-nificant costs on reserve-adjacent communities in a variety of ways, such as by killing livestock, and these costs are felt particularly acutely in poor com-munities, where even relatively small numbers of stock losses can represent a significant proportion of a household’s annual income (Oli et al. 1994). Moreover, the presence of large carnivores can re-sult in ‘opportunity costs’ for local people, where they have to invest time and money in guarding livestock rather than working or attending school.
The intensity of such conflict often results in lo-cal communities attempting to control the numbers of animals viewed as problematic, and this is fre-quently done using lethal means, such as poison-ing or shooting. This can have a serious impact on the population of the species concerned: human-wildlife conflict has played a significant role in the range contractions and population crashes of various species, and has even been implicated in the global extinctions of some species (Woodrof-fe et al. 2005). In Africa, conflict with humans has played a key role in the decline of cheetahs, lions (Panthera leo) and African wild dogs, and it has been identified as one of the most pressing con-servation issues facing large African carnivores to-
day (Ray et al. 2005). Addressing such conflict is therefore clearly important both for conservation and for the livelihoods of people living close to re-serves, but developing effective resolution strate-gies hinges upon a detailed understanding of the real causes of conflict, so this is a vital step to-wards successful conflict mitigation.
Methods
This study investigated attitudes of 60 Maasai and Barabaig pastoralists towards wildlife in areas close to the Ruaha National Park, Tanzania, with particular emphasis on five focal carnivore spe-cies, namely cheetahs, African wild dogs, lions, leopards (Panthera pardus) and spotted hyaenas (Crocuta crocuta). Attitudes were examined us-ing a semi-structured questionnaire administered by the author and/or a Tanzanian research assistant at the respondent’s household. Levels of conflict were assessed by showing respondents pictures of various species and asking them to rank them as posing a big problem, a small problem or no prob-lem in the area around their household. Respons-es were then assessed in relation to various socio-economic factors and reported depredation levels.
Results
Pastoralists reported significant problems with wild animals, particularly large carnivores, main-ly because of the threat they posed to cattle. Re-spondents reported a low level of retaliatory kill-ing, but a closer examination of the reasons behind this suggested it was predominantly due to circum-stantial constraints rather than innate tolerance.

Exploring the Foundation of Human-Wildlife Conflict in Parks and Protected Areas
406
Wealth (measured through stock holdings) and the proportion of cattle losses attributed to predators emerged as the most important determinants of conflict examined: respondents were more tolerant if they were wealthier and had suffered less depre-dation. There was some inter-tribal variation in tol-erance, with the Barabaig apparently more tolerant of large carnivores than the Maasai, but this was probably due to the greater wealth of the Barabaig interviewees. Despite their close proximity to it, people knew little of the Ruaha National Park, had received little outreach from Park personnel and received few benefits from its presence.
As greater wealth and lower depredation rates were both important factors affecting attitudes to-wards carnivores, improved livestock husbandry could be an important aspect of conflict resolution, as it would address both issues. However, success-ful conflict mitigation will not only depend upon reducing depredation, but also by improving the cost-benefit ratio of wildlife presence and provid-ing direct, relevant benefits from conservation. Im-plementing effective conflict resolution schemes which address these factors should have signifi-cant benefits for both human and wildlife popula-tions on the edges of protected areas.
References
Oli, M.K., Taylor, I.R. & Rogers, M.E. (1994). Snow leop-ard Panthera uncia predation of livestock: An assess-ment of local perceptions in the Annapurna Conser-vation Area, Nepal. In: Biological Conservation (68), p 63-68.
Ray, J., Hunter, L. & Zigouris, J. (2005). Setting Conserva-tion and Research Priorities for Larger African Carni-vores. In: WCS Working Paper (24).
Woodroffe, R. & Ginsberg, J.R. (1998). Edge effects and the extinction of populations inside protected areas. In: Science (280), p 2126-2128.
Woodroffe, R., Thirgood, S. & Rabinowitz, A. (2005). The impact of human-wildlife conflict on natural sys-tems. In: Woodroffe, R., Thirgood, S. & Rabinow-itz, A.(Eds.), People and Wildlife: Conflict or Coexis-tence? p 1-12. Cambridge.

Siegrist, D., Clivaz, C., Hunziker, M. & Iten, S. (eds.) (2006). Exploring the Nature of Management. Proceedings of the Third International Conference on Monitoring and Management of Visitor Flows in Recreational and Protected Areas.
University of Applied Sciences Rapperswil, Switzerland, 13-17 September 2006. Rapperswil.
407
Images of Nature as Sources of Conflict
Maarten H. Jacobs
Wageningen University, The Netherlands
Keywords: Images of nature, nature policy, nature management, perception of nature.
One of the problems nature policy and manage-ment agents, like national governments or natu-ral park managers, have to deal with, is that dif-ferent stakeholders may have different images of nature, and therefore, give different meanings to the same natural place. Hence, even if general goals, for example nature conservation, are em-braced by all stakeholders, conflicts on a more practical level may arise, due to different opin-ions about what real nature is, how to treat na-ture, et cetera. An image of nature is understood here as a relatively stable network of meanings and ideas that people attach to nature. Thus, an image of nature is a property of the mind-struc-ture of an individual subject. It is a frame of reference guiding and organising the way peo-ple perceive and value nature, and it gives di-rection to opinions about nature policy. Several Dutch scholars have been studying people’s im-ages of nature (Born et al. 2001, Buijs & Filius 1998, Buijs & Volker 1997, Groot & Born 2003, Jacobs et al. 2002, Keulartz et al. 2004). Their findings show some remarkable convergences. The aim of this presentation is to provide a brief overview of Dutch studies of images of nature, stressing the major theoretical underpinnings as well as empirical findings of these studies.
The mentioned studies reveal a similar range of dominant images of nature amongst Dutch cit-izens. Typically, the range consists of three to five different images of nature, with a wild im-age on one extreme side, to a functional image on the other extreme side. For example, the dif-ferent images as formulated below are found by Buijs & Filius (1998), in a qualitative study, and confirmed by Jacobs et al. (2002), in a survey study:
1. Image of wild nature (29% of subjects): only natural sites totally untouched by man are consid-ered real nature (such as deserts, oceans, the South Pole); ‘hands-off’ is the ideal nature policy.
2. Image of autonomous nature (22%): nature is everything that is not made by humans (e.g. weed spontaneously growing in built areas is also natu-ral); nature-policy should be directed towards na-ture itself, not to human ends.
3. Image of broad nature (23%): everything that grows is nature, whether or not influenced by man (e.g. a tree in a garden is real nature too); man is al-lowed to influence nature, with respect for nature, coexistence is the ideal.
4. Image of decorative nature (11%): the question what nature exactly is, is not very relevant within this image, it is an excellent place for recreation and enjoyment in the first place; nature should be made beautiful and accessible for humans.
5. Image of functional nature (15%): nature con-trolled by man is real nature too (e.g. agricultur-al areas are natural); nature should be used for the benefit of man.
The number of people in the Netherlands having an image of nature towards the wild side of the range is much bigger than the number of people having an image towards the functional side. While the images found in other studies differ slightly in details, the range from wild to functional is found over and over again.
Interestingly, the studies reveal that images of na-ture consist of three different dimensions: the cog-nitive dimension (what is real nature), the norma-tive dimension (how should we treat nature) and the expressive dimension (what are the values re-

Exploring the Foundation of Human-Wildlife Conflict in Parks and Protected Areas
408
lated to nature). Important differences between im-ages of nature are found to reside in opinions about what degree of spontaneity is essential for nature (for the cognitive dimension), to what degree na-ture may be used for the benefit of man (norma-tive) and the degree of challenge versus safety na-ture offers (expressive). Several authors (e.g. Buijs & Volker 1997, Groot & Born 2003) have argued that the foundation of differences in images of na-ture may lay in the fundamental view people have on the relation between man and nature. Jacobs et al. (2002) found indeed that the ecocentric view (nature stands above man) correlates significantly with a wild image of nature, and that an anthropo-centric view (man stands above nature) correlates with a functional image of nature.
While the existence of a spectrum of images of na-ture from wild to functional is confirmed by all mentioned studies, and a method for investigation is established, the same studies leave many ques-tions open for debate and research. It is unknown whether this spectrum is typical Dutch, typical Western or universal. Moreover, it is hypothesized, but hardly tested, that someone’s image of nature highly affects his opinion s in specific conflicts.
References
Born et al. (2001). The new biophilia: an exploration of vi-sions of nature in Western countries. In: Environmen-tal Conservation (28/1), p 65-75.
Buijs & Filius (1998). Natuurbeelden in de praktijk. De in-vloed van natuurbeelden en natuurvisies op gedrag en mening over het beleid. Wageningen.
Buijs & Volker (1997). Publiek draagvlak voor natuur en natuurbeleid. Wageningen.
Groot & Born (2003). Visions of nature and landscape type preferences: an exploration in the Netherlands. In: Landscape and Urban Planning (63), p 127-138.
Jacobs et al. (2002). Waterbeelden: een studie naar de beelden van waternatuur onder medewerkers van Ri-jkswaterstaat. Wageningen.
Keulartz et al. (2004). Concepts of nature as communica-tive devices: the case of Dutch nature policy. In: Envi-ronmental Values (13), p 81-99.
409
Siegrist, D., Clivaz, C., Hunziker, M. & Iten, S. (eds.) (2006). Exploring the Nature of Management. Proceedings of the Third International Conference on Monitoring and Management of Visitor Flows in Recreational and Protected Areas.
University of Applied Sciences Rapperswil, Switzerland, 13-17 September 2006. Rapperswil.
Visitor and Resident Acceptability Norms towards Wolf Management Actions
Jerry J. Vaske1 & Jonathan G. Taylor2
1Colorado State University, [email protected]
2U.S. Geological Survey, [email protected]
Keywords: Wolf management, gray wolf, norm theory, local residents, visitors.
Introduction
The management of wildlife, a publicly-owned resource in the United States, depends ultimately on public acceptance of management actions and policies. The lack of public acceptance has led to specific wildlife ballot initiatives in several states and more generally, stimulated long-term policy changes that have redefined the options available to managers. Widespread public involvement in wildlife management issues appears to be a prod-uct of changing demographics and the rise of polit-ically-effective interest groups. These broad social changes have not been matched in wildlife man-agement agencies, where a traditional reliance on only biological information and professional judg-ment still predominate. A paradigm for evaluating information about the publics’ views of the accept-ability of wildlife management policies is needed to help bridge the gap between changing public ex-pectations and traditional professional (biological) judgment.
Norm theory offers one such paradigm for iden-tifying publicly acceptable policies and helps ex-plain why management actions are judged accept-able or unacceptable. Using the structural norm approach, a technique to represent social norms graphically, researchers have described the preva-lence, range of tolerable conditions, intensity and crystallization (group agreement) for a wide range of natural resource topics. Although the technique has proven useful, crystallization is typically not visually presented. To overcome this limitation, this paper incorporates the Potential for Conflict
Index (PCI) into the structural norm methodolo-gy. The PCI provides a means to visually display group agreement and the other structural charac-teristics of norms.
The objectives of this study were to: (a) demon-strate the utility of combining the structural norm approach with the Potential for Conflict Index to collect and organize information about the publics’ norms for managing wolves in the Grand Teton Na-tional Park (GRTE), (b) monitor changes in these norms across human-wolf interactions of varying severity, and (c) compare the norms reported by lo-cal residents and visitors to GRTE.
Methods
Gray wolves (Canis lupus) appeared in Grand Teton National Park northern boundary in October of 1998, two years after being reintroduced to Yel-lowstone National Park. Over 300 wolves are cur-rently estimated to reside in the Greater Yellow-stone Area (GYA). Human populations in the area have also increased in recent years. The popula-tion of Teton County, Wyoming, for example, in-creased 73% from 1990 to 2005. Park visitation for GRTE now averages 2.5 million visitors annual-ly. In addition, unlike other national parks, grazing rights in the GRTE are protected, and livestock and wolf conflicts have increased. Livestock depreda-tions by wolves within the Greater Yellowstone Area resulted in the deaths of approximately 150 cattle, sheep, and goats during 2003. Two thirds of these depredations occurred on public grazing al-
Exploring the Foundation of Human-Wildlife Conflict in Parks and Protected Areas
410
lotments and 34% on private property. The U.S. Fish and Wildlife Service responded to these dep-redations by killing 38 wolves in 2003.
To understand the acceptability of alternative man-agement actions for addressing human-wolf con-flict, we sampled local resident (n = 604, response rate = 51%) and park visitor (n = 596, response rate = 81%) populations during 2003. The local res-ident sample included individuals who live within a 100-mile radius of Jackson, Wyoming. Park visi-tors were initially surveyed on-site to collect basic information and addresses for the follow-up mail survey. A total of 1,200 mail surveys were used in our analyses. A telephone non-response check for the resident sample did not identify any statistical differences between respondents and non-respon-dents to the mail survey.
The survey described six different hypothetical sit-uations depicting possible human-wolf encoun-ters. Respondents evaluated the acceptability of several management options designed to remedy or prevent the conflict in the hypothetical situation (e.g., monitor the situation, frighten the wolves away, capture and relocate the wolves, destroy the wolves). Acceptance of management actions were coded on a 7-point Likert-type scale ranging from “highly unacceptable” (-3) to “highly acceptable” (+3).
Results
For all scenarios, park visitors rated “monitor the situation” more favorably than local residents (t = 7.46, p .001). For those situations where wolves had not caused any loss of cattle or pets, local residents rated management options aimed at prevention of human-wolf interaction (i.e. trail closure or cattle removal from federal grazing al-lotments) as significantly less acceptable than park visitors (t = 5.31, p .001). In scenarios where wolves caused loss of pets or cattle, local residents rated non-lethal management options (i.e., capture and relocate, or frighten the wolves away) signifi-cantly less acceptable than park visitors (t = 2.67, p = .008). In these latter scenarios, local residents rated “destroy the wolves involved” as acceptable, whereas park visitors rated this management op-tion as unacceptable (t = 12.32, p .001). As the
severity of human-wolf interaction scenarios in-creased, the potential for conflict index values in-creased substantially for both local residents and park visitors. These findings highlight the contro-versial nature of lethal management actions and suggest situations where agency caution should be exercised.
Siegrist, D., Clivaz, C., Hunziker, M. & Iten, S. (eds.) (2006). Exploring the Nature of Management. Proceedings of the Third International Conference on Monitoring and Management of Visitor Flows in Recreational and Protected Areas.
University of Applied Sciences Rapperswil, Switzerland, 13-17 September 2006. Rapperswil.
411
Human Responses to Wildlife: Stakeholder Acceptance Capacity and Human Learning
Harry C. Zinn & Sharon X. Shen
The Pennsylvania State University, USA
[email protected]@psu.edu
Keywords: Human learning, human-wildlife interaction, park and protected area management, stakeholder accep-tance capacity.
Introduction
Interactions with wildlife in parks and protected areas often elicit conflicting human responses, e.g. visitors and indigenous residents may dis-agree about population levels of species such as elephants, lions, brown bears, or wolves. Both visitors and indigenous residents sometimes benefit from interaction with wildlife, but the benefits are not without costs, such as direct at-tacks; disease transmission; and consumption or damage to crops, timber, and fish. Because ben-efits and costs of human-wildlife interaction fall disproportionately on different people, stake-holders often disagree about managing wildlife. Thus, human responses to wildlife are often as important as biological carrying capacity in de-termining and attaining optimum wildlife popu-lation levels in parks and protected areas.
Methods
Our goal in this paper is to outline current knowl-edge about human responses to wildlife and the learning processes influencing those responses. Our method is to review and synthesize existing research about stakeholder acceptance capacity (SAC) for wildlife and human learning.
SAC for wildlife varies among those with dif-ferent stakes in wildlife. In Norway, for exam-ple, farmers and tourists hold different stakes in wolf management and prefer different pop-ulation levels (Kaltenborn and Bjerke 2002). SAC determinants include: (a) internal, psy-
chological variables, such as wildlife value ori-entations, attitudes and beliefs; (b) experiential variables, such as occupation and past experi-ence with wildlife; and (c) situational specifics, such as wildlife species and encounter type or frequency (Zinn et al. 2000).
Results
Colorado studies provide examples of each de-terminant. First, individuals with utilitarian wildlife value orientations were nearly three times more likely than those with protectionist wildlife value orientations to accept controlling the mountain lion population with increased hunting. Second, individuals whose had lived near colonies of black-tailed prairie dogs five years or longer were nearly twice as likely as those who had lived near colonies less than five years to accept destroying all prairie dogs in the area. Third, responses to beavers and coy-otes found in residential areas illustrate the im-portance of situational specifics. Destroying a beaver or coyote was widely opposed unless it carried a disease harmful to humans. In that situation, destroying the animal was widely ac-cepted.
Wildlife value orientations, attitudes, beliefs, and perceptions are not learned reflexively. They depend on pre-existing knowledge, skills, values and beliefs; the social context in which the stimulus is received; and emotional ties ac-tivated by the stimulus (Bandura 1986). There-
Exploring the Foundation of Human-Wildlife Conflict in Parks and Protected Areas
412
fore, individuals respond differently to the same stimulus. Four aspects of human learning—en-active learning, behavior modeling, expectancy, and tutelage—can help park and protected area managers anticipate, understand, and respond to visitors’ and indigenous residents’ acceptance capacity for wildlife (Zinn et al. 2006).
Enactive learning occurs during direct interac-tion with the environment and depends on the specifics of the interaction (Bandura 1986). For example, a small mammal might flee from one person but bite another, causing the two individ-uals to learn different lessons about the species. Behavior modeling occurs when one person models or imitates another’s behavior (Bandu-ra 1986). This can be seen in parks and pro-tected areas when a tour group member models the behavior of his or her guide. What the be-havior modeler learns about wildlife depends in part on the behavior he or she imitates. What one learns in a given situation also is influ-enced by expectancy, or expectations (Kowal-ski & Westen 2005). Often an individual with realistic expectations about wildlife will behave more appropriately and have a more successful experience than someone with unrealistic ex-pectations. Finally, much human learning oc-curs through tutelage or instruction (Kowalski & Westen 2005). In tutelage, learning is influ-enced by the knowledge, skills, and motivation of both instructor and learner.
Conclusion
In conclusion, humans’ responses to wildlife are influenced by wildlife value orientations, atti-tudes, beliefs, and perceptions learned through complex cognitive and social processes. What we learn about wildlife depends largely on what we already know, what we expect, and who we are with. Unsurprisingly, some humans per-ceive a particular species primarily as a material resource, others perceive the same species pri-marily as a competitor or threat, and still others perceive it primarily as a fellow-creature. Un-derstanding how these contrasting perceptions originate can help park and protected area man-agers respond appropriately to them.
References
Bandura, A. (1986). Social foundations of thought and ac-tion: A social cognitive theory. New Jersey.
Kaltenborn, B.P. & Bjerke, T. (2002). The Relationship of General Life Values to Attitudes Toward Large Carni-vores. In: Human Ecology Review (9/1), p 55-61.
Kowalski, R. & Westen, D. (2005). Psychology. New York.
Zinn, H.C., Manfredo, M.J. & Decker, D.J. (2006). Habi-tuation of humans to wildlife: A different perspective. Manuscript in review.
Zinn, H.C., Manfredo, M.J. & Vaske, J.J. (2000). Social psychological bases for stakeholder acceptance capac-ity. In: Human Dimensions of Wildlife (5/3), p 20-33.

413

414
Bridging the Ecological and Social Science Dividein Visitor Impact Monitoring and Management
Wolfgang Haider (Chair)

Siegrist, D., Clivaz, C., Hunziker, M. & Iten, S. (eds.) (2006). Exploring the Nature of Management. Proceedings of the Third International Conference on Monitoring and Management of Visitor Flows in Recreational and Protected Areas.
University of Applied Sciences Rapperswil, Switzerland, 13-17 September 2006. Rapperswil.
415
The Ecological and Human Benefits of the Nature-Based Recreational Area
Chun-Yen Chang
National Taiwan University, Taiwan
Keywords: Attention restorative effect, perceived restorative scale, landscape ecology, benefit.
Introduction
Psychophysiological researches have emphasized the influences of environment on individuals’ stress (Ulrich 1981, Parson et al. 1998; Honeyman 1992) and the influences of landscapes on restorative at-tention (Kaplan & Kaplan 1989). Parsons (1998) indicated that, compared to cities, Nature is able to relieve one’s tension and anxiety effectively. Keep-ing the benefits of landscape ecology structure in mind, the present research pursues the influences of landscape structures on one’s psychological as well as physiological responses.
The research purposes of this study are to realize the effect of landscape structures on participants’ physiological reactions (Electroencephalography, EEG; Electromyography, EMG; and Heart Rate, HR) and to realize the effect of landscape struc-tures on participants’ psychological reactions (Per-ceived Restoration Scale, PRS) in a natural based recreational area.
Methods
In order to measure visitors’ benefits in the na-ture-based recreational areas, this study adopt-ed the items of the Perceived Restoration Scales (PRS) as the index of respondents’ psychological responses. Furthermore, the physical respons-es of the right and left hemisphere brain wave (EEG), the Electromyography (EMG) value of respondents’ forehead muscle were also includ-ed as indicators.
From a conceptual perspective of psychophysi-ological benefits resulting from landscapes, it is found that both Kaplan and Ulrich proposed
the aesthetic theory of environmental evolution. While Kaplan highlighted the cognitive process, Ulrich proposed a combined analysis of emotion-al, physical, and cognitive reactions. The pres-ent study examines the influence of landscapes on both the physiological reactions and the psy-chological reactions.
The relationship between landscape and species are emerging issues that have been depicted in many articles. Landscape structures are helpful to model the distribution of birds and also useful on the land policy. Studies assert birds are partic-ularly sensitive to the landscape patch size. Birds are good subjects to test the relationship between species and landscape elements, while landscape scale is a suitable scale to test the relationship between species and land use. Different studies have categorized land uses into different types. The main categories include constructed areas, farms, man-made grassland, man-made woods, un-worked areas, grassland, natural woods, wa-ter bodies, and waterside areas.
Categories in this study were learnt from previ-ous studies and interviews with experts of related fields to select the most representative landscape structure indices of the testing sites. The land-scape structures selected in this study include vegetated lands, un-worked areas, woods, grass-lands, and farms.
The eCognition ver. 4.0 was used to digitize the aerial photographic maps with the scale of 1/5000, followed by the calculation of indices of the landscape’s ecological structures with Frag-Stats for Arc View. The relationships among the landscape ecological structure indices, bird di-

Bridging the Ecological and Social Science Divide in Visitor Impact Monitoring and Management
416
versity, and the respondents’ responses indices were tested. Respondents’ perceptions of each rec-reational area were recorded with their oral state-ment for a further qualitative analysis.
Results
The result is consistent with previous studies on the relationship between bird capita and frag-mented built areas, since the fragmented, high density and high built areas represented a space with many grain sites, which allow birds to find food and shelter. The water body shows a simi-lar effect on the relationship between the land-scape’s ecological structures and bird capita es-pecially on the 250 meters radius level of the landscape ecological map. While most of the grass and woods show an opposite effect, the higher the fragmentation of the grass and woods, the more negative the effect on the bird species and capita. The analysis results show the effect of the landscape’s ecological pattern on the wild-life species.
Most of the landscape’s ecological structure in-dices have a positive effect on the respondents’ rEEG, lEEG, and PRS responses. All of the built land indicators have a positive effect on the EMG and HR responses, while all the indicators of the built landscape have a negative effect on the lEEG, EMG and a very (all of them) negative ef-fect on the psychological PRS responses.
The woods show a positive effect on respon-dents’ lEEG and PRS responses, the water body has a positive effect on the rEEG and HR only on the 250 meters radius landscape map. All the landscape’s ecological indicators have a negative effect on the PRS responses on the 250 and 500 meters radius map.
References
Honeyman, M.K. (1992). Vegetation and stress: a compar-ison study of varying amounts of vegetation in coun-tryside and urban scenes. In Relf, D.(ed.). The Role of Horticulture in Human Well-Being and Social Devel-opment, p 143-145. Portland.
Kaplan, R. & Kaplan, S. (1989). The experience of nature: a psychological perspective, p 177-201. Cambridge.
Parsons, R., Tassinary, L.G., Ulrich, R.S., Hebl, M.R. & Al-exander, M.G. (1998). The view from the road: impli-cations for stress recovery and immunization. In: Jour-nal of Environmental Psychology (18), p 113-139.
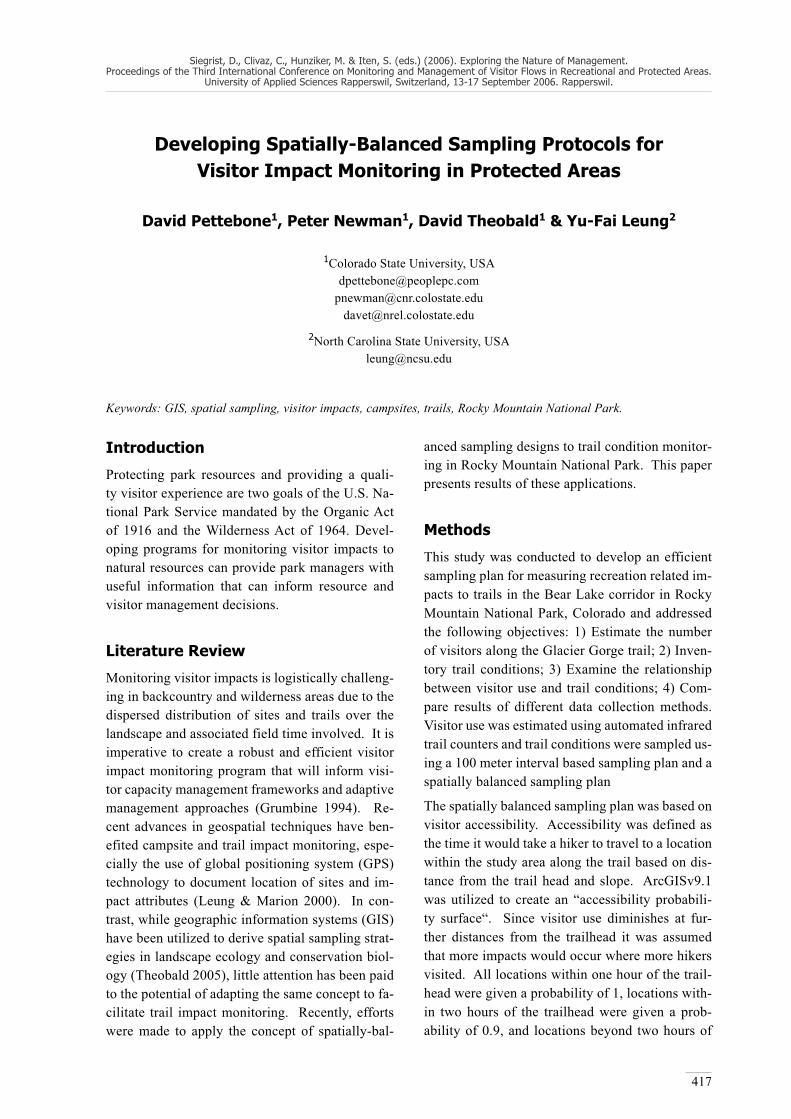
Siegrist, D., Clivaz, C., Hunziker, M. & Iten, S. (eds.) (2006). Exploring the Nature of Management. Proceedings of the Third International Conference on Monitoring and Management of Visitor Flows in Recreational and Protected Areas.
University of Applied Sciences Rapperswil, Switzerland, 13-17 September 2006. Rapperswil.
417
Developing Spatially-Balanced Sampling Protocols for Visitor Impact Monitoring in Protected Areas
David Pettebone1, Peter Newman1, David Theobald1 & Yu-Fai Leung2
1Colorado State University, [email protected]
[email protected]@nrel.colostate.edu
2North Carolina State University, [email protected]
Keywords: GIS, spatial sampling, visitor impacts, campsites, trails, Rocky Mountain National Park.
Introduction
Protecting park resources and providing a quali-ty visitor experience are two goals of the U.S. Na-tional Park Service mandated by the Organic Act of 1916 and the Wilderness Act of 1964. Devel-oping programs for monitoring visitor impacts to natural resources can provide park managers with useful information that can inform resource and visitor management decisions.
Literature Review
Monitoring visitor impacts is logistically challeng-ing in backcountry and wilderness areas due to the dispersed distribution of sites and trails over the landscape and associated field time involved. It is imperative to create a robust and efficient visitor impact monitoring program that will inform visi-tor capacity management frameworks and adaptive management approaches (Grumbine 1994). Re-cent advances in geospatial techniques have ben-efited campsite and trail impact monitoring, espe-cially the use of global positioning system (GPS) technology to document location of sites and im-pact attributes (Leung & Marion 2000). In con-trast, while geographic information systems (GIS) have been utilized to derive spatial sampling strat-egies in landscape ecology and conservation biol-ogy (Theobald 2005), little attention has been paid to the potential of adapting the same concept to fa-cilitate trail impact monitoring. Recently, efforts were made to apply the concept of spatially-bal-
anced sampling designs to trail condition monitor-ing in Rocky Mountain National Park. This paper presents results of these applications.
Methods
This study was conducted to develop an efficient sampling plan for measuring recreation related im-pacts to trails in the Bear Lake corridor in Rocky Mountain National Park, Colorado and addressed the following objectives: 1) Estimate the number of visitors along the Glacier Gorge trail; 2) Inven-tory trail conditions; 3) Examine the relationship between visitor use and trail conditions; 4) Com-pare results of different data collection methods. Visitor use was estimated using automated infrared trail counters and trail conditions were sampled us-ing a 100 meter interval based sampling plan and a spatially balanced sampling plan
The spatially balanced sampling plan was based on visitor accessibility. Accessibility was defined as the time it would take a hiker to travel to a location within the study area along the trail based on dis-tance from the trail head and slope. ArcGISv9.1 was utilized to create an “accessibility probabili-ty surface“. Since visitor use diminishes at fur-ther distances from the trailhead it was assumed that more impacts would occur where more hikers visited. All locations within one hour of the trail-head were given a probability of 1, locations with-in two hours of the trailhead were given a prob-ability of 0.9, and locations beyond two hours of

Bridging the Ecological and Social Science Divide in Visitor Impact Monitoring and Management
418
the trailhead were given a probability of 0.8. All locations outside of the trail corridor were given a probability of 0. For each point, Universal Trans-verse Mercator (UTM) coordinates were provided that allowed navigation to the sample point. Nine-ty-nine prioritized points were visited.
Results
Results estimate that 474 visitors per day hiked to Alberta Falls, 157 visitors per day hiked to Mills Lake, and 46 visitors per day hiked to Black Lake. The average trail width for the entire trail was ap-proximately 4.5 feet and the average maximum trail depth was approximately 2.75 inches. Be-cause trail condition samples were drawn from a population using an unequal inclusion probability, we weighted the importance of each sample based on the inverse of their inclusion probability. That is, the more likely that a location was sampled (e.g. approaching 1.0), the smaller the weight – and the less likely that a location was sampled (e.g. 0.1), the larger the weight (1/0.1 = 10). The strength of using a probability-based sample is that a statis-tically reliable estimate of the population can be made. Furthermore, no statistically significant dif-ference was found between the results of the spa-tially balanced dataset and the 100 meter interval dataset for trail width and depth. Regression anal-ysis revealed a strong relationship between visitor use and trail width.
Conclusion
Protecting both resources and visitor experience can be very challenging for parks and related ar-eas experienceing increasing visitation and di-verse types of activities and managers often rely on management by objectives planning framworks such as Limits of Acceptable Change (LAC) and Visitor Experience Resource Protection (VERP). At the heart of management by objectives plan-ning frameworks are setting appropriate manage-ment objectives, the development of associated in-dicators and standards of quality and a strong and consistent monitoring program that signals when management action should be taken. Over the last several years, there has been much discussion about the efficacy of such planning frameworks.
Moreover, budget constraints have forced many parks to do more work with fewer people and of-ten let monitoring and analysis of data fall by the wayside. For all of these reasons, researchers and managers must work together to develop creative approaches to collecting data that balances effi-ciency and precision and acknowledges the con-straints of managers in the field. The above ap-proaches are a step in this direction and use the latest spatial technology, knowledge from current literature, and spatial statistics to accomplish these tasks hence strengthen management by objectives planning frameworks.
References
Grumbine, E. R. (1994). What is ecosystem management? In: Conservation Biology (8), p 27-38.
Leung, Y.-F. & Marion, J. L. (2000). Recreation impacts and management in wilderness: A state-of-knowledge review. In: Cole, D.N. et al. (eds.), Proceedings: Wil-derness Science in a Time of Change; Vol. 5: Wilder-ness ecosystems, threats, and management, May 23-27, 1999. p 23-48. Missoula.
Theobald, D.M. (2005). GIS Concepts and ArcGIS Meth-ods. Conservation Planning Technologies. Fort Col-lins.

Siegrist, D., Clivaz, C., Hunziker, M. & Iten, S. (eds.) (2006). Exploring the Nature of Management. Proceedings of the Third International Conference on Monitoring and Management of Visitor Flows in Recreational and Protected Areas.
University of Applied Sciences Rapperswil, Switzerland, 13-17 September 2006. Rapperswil.
419
Managing Visitor Impacts along Australia’s Remote Kimberley Coast – The Forgotten Dimension of Balancing Country
Pascal Scherrer1, Amanda J. Smith2 & Ross K. Dowling1
1Edith Cowan University, [email protected]@ecu.edu.au
2Murdoch University, Australia [email protected]
Keywords: Expedition cruise, Aboriginal, visitor impacts, spiritual connection, tour operator.
Introduction
The expectations on tourism as a stimulator for economic opportunities can be high for communi-ties with limited economic activities, particularly in areas with attractive natural values such as spec-tacular scenery, wildlife, flora and tranquillity. Sus-tainability has become a buzz word in recent years, particularly with the concept of the triple-bottom-line which implies that to build a sustainable indus-try for the long term, activities need to be balanced not only in terms of their economic impacts, but also on the environmental impacts on the area and the social and cultural impacts on the local commu-nity. In a current project looking at the expedition cruise ship industry along the remote Kimberley Coast in Australia’s North West, we are encounter-ing an additional dimension that has been largely lost in western culture, the impacts on the spiritu-al and cultural connection to country by Aboriginal Australians. Country refers to the area to which a particular group of people are born and spiritually connected. Country is multi-dimensional including people and Dreamings and areas of land and/or sea including all living and non-living things, the sub-surface, underground and the sky above.
The Kimberley Coast extends for 3000 km between Broome and Wyndham in Western Australia. It is accessible almost only by sea or air and has gained increasing popularity in recent years because of its spectacular scenery, pristine nature, Aboriginal rock art and remoteness, giving visitors the impres-sion of exploring an ‘untouched’ world. Over re-
cent years, there has been an exponential increase in expedition cruise operators offering luxury expe-riences along the Kimberley Coast and visiting nat-ural, cultural and historic on-shore sites along the way. Vessel capacity is also on the increase with vessels operating in 2006 ranging from 8 (+4) to 106 (+68) passengers (+staff). Interest by the new operators and visitors is continuing to grow, as does the size of vessels visiting the area.
Much of the Kimberley Coast is Aboriginal Lands Trust (ALT) land with two areas declared as Na-tional Parks/Nature Reserves. Visitation to the area has been largely unmanaged because of its vastness and lack of resources. The rapid increase in the number of operators and some recent incidences have lead to increasing concerns about visitor safe-ty, environmental impacts (e.g. trail erosion, litter-ing), economic benefits and social and cultural im-pacts (e.g. souveniring at cultural and historic sites, inappropriate cultural behaviour). In the absence of an effective management structure and with unclear and limited jurisdiction and responsibilities by gov-ernment agencies, there is a clear need for a joint approach and strong communication to provide a management framework with a view to making the Kimberley Coastal tourism industry sustainable for the long term.
Methods
This paper presents on a project set up to provide a baseline of current activities, visitation hotspots, environmental impacts and cultural issues and to

Bridging the Ecological and Social Science Divide in Visitor Impact Monitoring and Management
420
provide recommendations on potentially suitable management frameworks for the area. Data was gathered through desktop research, workshops and meetings with Aboriginal custodians and non-Ab-original stakeholders, field trips to country with Traditional Owners, monitoring of the biophysical environment where expeditions cruise ships land on-shore to conduct excursions and field trips on a number and range of expedition cruise ships to ob-serve activities, impact and visitor behaviour while visiting on-shore sites.
Results
We found that in 2006, 32 operators were offering expedition cruises from between 4 to 18 days. The trip ‘experience’ was advertised using terms such as ‘the trip of a lifetime’, ‘wild and remote’, but also ‘special indulgence’ and ‘unparalleled com-fort and luxury’. Their key shore-based attractions advertised were visiting key natural features such as waterfalls and swimming holes; cultural fea-tures such as Aboriginal rock art sites; and histor-ic sites. There are a number of key sites between Broome and Wyndham that are visited by most op-erators. Current environmental impacts such as ex-tensive trail formation and trail erosion or littering appear to be minimal with recovery of damaged vegetation occurring during the wet season from November to March, during which tours are not of-fered. Cultural impacts are more difficult to mea-sure, but there is anecdotal evidence of vandalism, souveniring, site degradation and culturally inap-propriate behaviour.
Conclusions
Appropriate visitor management on-site appears to be crucial for both visitor experience and impact minimisation, requiring a low visitor to guide ra-tio and a high level of education and interpretation. We also found that one of the key issues for the management of activities in the area is the igno-rance of the spiritual connection and significance of country to the Aboriginal custodians of the land by stakeholders such as land managers and opera-tors. Their lack of knowledge and understanding of the spiritual connection to country by the Tradi-tional Owners, often combined with a lack of ap-
propriate consultation has in the past resulted in mistrust, uncertainty and fear between the parties involved. A workable management framework will need to include appropriate protocols for consulta-tion, means for exchange of cultural and historical information as well as measures to ensure environ-mentally and culturally appropriate visitor man-agement on-site.

421

422
Visitor Information and Visitor Management
Reto Rupf (Chair)

Siegrist, D., Clivaz, C., Hunziker, M. & Iten, S. (eds.) (2006). Exploring the Nature of Management. Proceedings of the Third International Conference on Monitoring and Management of Visitor Flows in Recreational and Protected Areas.
University of Applied Sciences Rapperswil, Switzerland, 13-17 September 2006. Rapperswil.
423
Visitor Conflicts and their Resolution for Forest and Park Management in Jozankei National forest, Japan
Masayoshi Takahashi & Kazushige Yamaki
Hokkaido Research Center, Forestry and Forest Products Research Institute, Japan
[email protected]@ffpri.affrc.go.jp
Keywords: Forest and Park management, visitor conflict, Jozankei National Forest, questionnaire survey.
IntroductionDuring the past decade, demand for recreational use in the national forests is a major concern for forest management, especially in protected forests. In Japan, it has been difficult for forest managers to satisfy these demands because they lack the data on recreational use in the forest, social scientif-ic knowledge to analyze the conflict between visi-tors and managers; as well as discussions to solve the conflict. Furthermore, in recent years, accidents during outdoor activities are increasing steadily. Thus, it is also a matter for the managers and pub-lic sectors to avoid or reduce every type of accident in the forest.
This paper seeks to illustrate the present situation and the conflicts between the visitors and the for-est managers and to discuss how to solve the con-flicts in the Jozankei National Forest, Japan, as an example.
MethodJozankei National Forest is a part of the Shikot-su Toya National Parks and many citizens venture into the forest for recreational use. According to the leading survey, at least 10,000 people come into the forest per year. Concurrently, it is vital as the wa-ter source for the 1.8 million population of Sappo-ro city. The forest manager has to satisfy these de-mands and produce timber simultaneously.
We conducted two questionnaire surveys: 1) For visitors at the Jozankei National Forest, we distrib-uted the questionnaire sheets on the windshield of the parked cars along the forest roads with enve-lopes to send it back after filling out the responses in June 2005.
2) For foresters belonging to the Ishikari forestry management office which is responsible for main-taining the forest, we directly distributed and re-covered the questionnaire sheets in 2002.
Results
We distributed 207 questionnaire sheets for visitors during 5 days in June 2005 and received 118. Thus, response rate was 57.0%. The main age brackets were 50’s and 40’s, and the ratios were 41.4% and 33.4% respectively. About three-forth of the visi-tors were male. The major pattern during the visit was: 1) to go into the forest around 8 o’clock in the morning 2) to stay at least 4 to 6 hours while doing various activities, 3) to go back to their own place around sunset. These findings well followed the re-sult of mechanical monitoring at the control gate (Takahasi 2002). Most of visitors lived in Sappo-ro city, which is one of the major urban areas sur-rounding the forest, and no one visited who lived outside the one-hour drive vicinity. The objectives of the visit were mostly to cultivate bamboo shoots and wild edible plants. Most of them were collect-ed for self-consumption or gifts for relatives and neighbours, not for merchandise. 86.2% of the re-spondents visited with family, neighbours and col-leagues as a group. The average number of persons per group was 2.8; only 13.6% of them visited sole-ly.
While in the forest, they rarely feel at risk of an ac-cident, but 53.4% of them took measures for pre-venting accidents. 63.6% of the respondents ac-cepted to share the cost if effective measures for accidents in the forest would be in place. On the other hand, they were not satisfied with control of

Visitor Information and Visitor Management
424
the gate at the entrance of the forest. Acceptable ideas for gate control were varied depending on the respondent’s opinion from full control to free ac-cess.
We also proposed the survey to 16 foresters be-longing to the Ishikari forestry management office in June 2002. As a result, four-fifths of them con-sidered that visitors have at least some sort of ef-fect on management activities such as additional maintenance of the forest roads and other facili-ties, illegal cutting and dumping of waste. They also pointed out that the current method of gate control at the entrance of the forest for controlling the visitors was not effective. The ideas for visitor control were varied from free access to strict con-trol, same as the results from visitors.
These results indicate that Jozankei National For-est gives unique recreational opportunities for the neighbouring citizens, especially for the middle- and senior-aged. But, many gaps exist between the visitors and the managers, and both sectors are not satisfied at the current moment. On the other hand, visitors could accept to pay the cost in return for valuable services, and both sectors had various ideas for filling the gaps. Thus as a next step, we will emphasize integrating harmonizing visitor use into the forest and recreational management plan.
References
Takahashi, M. (2002). Actual condition and problem of vis-itor use in Jozankei National Forest, Japan. In: Arn-berger, A., Brandenburg, C., Muhar, A. (2002) (Eds.). Monitoring and Management of Visitor Flows in Rec-reational and Protected Areas. Conference Proceed-ings. Bodenkultur University Vienna, Austria, January 30 – February 02, 2002. Vienna., p 65-68.

Siegrist, D., Clivaz, C., Hunziker, M. & Iten, S. (eds.) (2006). Exploring the Nature of Management. Proceedings of the Third International Conference on Monitoring and Management of Visitor Flows in Recreational and Protected Areas.
University of Applied Sciences Rapperswil, Switzerland, 13-17 September 2006. Rapperswil.
425
MASOOR in the Alpine Areas: Agent-based Modelling as a Tool for the Management Planning in Natura 2000 Sites
Peter Visschedijk1, Ulrike Pröbstl2 & René Henkens1
1Alterra Green World Research, The Netherlands [email protected]
2University of Natural Resources and Applied Life Sciences, [email protected]
Keywords: Agent-based modelling, cost effective planning, Natura 2000, participation, Alps.
Introduction
The European Commission is establishing a net-work of biotopes and habitats – called Natura 2000 – by decree of two directives, which all member states must comply with. Once established, ad-equate management shall ensure a favourable conservation status. Two research programmes founded by EU-grants, one in the Netherlands, Great Britain and France (called PROGRESS) and one in Austria, Slovenia, Germany and Italy (called AlpNaTour) are designing and assessing management plans in intensively used recreation and tourism areas. Both projects try to find cost efficient tools for data collection, analysis and management in different ecological environments (see Pröbstl et al. 2005, Elmauer et al. 2005).
In PROGRESS the research team used the agent-based modelling very successfully to show and to predict further deterioration in the protected sites. There the applicability of GPS, aerial photos, and agent-based modelling with the MASOOR pro-gram have been tested (Visschedijk & Henkens 2002). Against this background, the question was whether the use of the agent-based modelling could also be adapted to an alpine environment.
The alpine space is characterised by its close as-sociation with nature, several rare species and natural habitats of European significance, and a high proportion of conservation areas. It also hosts more than 120 million tourists a year, mak-ing it one of the most important leisure and recre-ation areas in Europe. Many leisure activities can
be pursued, and the economic potential is high. The sensitivity of alpine habitats and biotopes as well as the susceptibility of many species to dis-turbances, may lead to the potential for conflicts between the various land uses, especially tour-ism and conservation. The division of large, high quality habitats by regional and national borders adds further challenges to the planning process-es and their implementation. Furthermore the al-pine area is characterized by different activities like hiking, rock climbing, cross country skiing and others. Often, access to the mountainous ar-eas is facilitated by cable car.
The management plan is the adequate and re-quired instrument to protect Natura 2000 sites in the alpine environment. It should integrate eco-logical, social and economic interests. Progress on these issues requires a solid data base about ecological, local social, and visitor information, as well as analytical tools that integrate these data effectively into the planning process. Therefore we tested whether agent-based modelling could be a suitable tool for the management planning process in the alpine area.
Methods
To test agent based modelling in an alpine envi-ronment two test sites were chosen. The model-ling was adapted for hiking in high mountainous areas at the Schneeberg and for crosscountry ski-ing at the Ötscher both located in the last foothills of the Alps about 150 kilometres southwards from

Visitor Information and Visitor Management
426
Vienna in Lower Austria. In both cases the model is based on GIS-mapping, an inquiry via question-naire and GPS- information.
Results
Basically the combination of GPS and agent-based modelling is a suitable and helpful tool in several different locations and for different activities. The main advantages can be described as follows:
The operating expense for the data collection for the management planning process can be reduced. Furthermore agent-based modelling also contrib-utes positively to a participatory planning process, because the use and the distribution of different user groups in the site can be visualized. Com-pared to a simple GIS based mapping, the distur-bance and the regional distribution during the day or the season can be shown.
On the other hand there was a need to adapt the MASOOR program to the different ecological conditions and sites in the alpine area. An adapta-tion of the database for the model was necessary concerning
the attributes of the paths,
the different user groups,
the access to the area (for ex. by cable car),
the influence on the protected habitat types,
the types of possible deterioration.
In summary, these new technologies offer promis-ing directions, but significant amounts of further research will be needed to support the planning process in various protected sites all over Europe.
The use of agent-based modelling makes a re-markable contribution to reduce costs of the plan-ning process.
References
Elmauer, T., Knoll, T., Pröbstl U. & Suske, W. (2005). Man-agementplanungen für Natura 2000 in Österreich. In: Naturschutz und Biologische Vielfalt (26), p 269-286.
Pröbstl, U., Sterl, P. & Wirth, V. (ed.). (2005). Tourismus und Schutzgebiete - Hemmschuh oder Partner? Vien-na.
Visschedijk, P. & Henkens, R. (2002). Recreation moni-toring at the Dutch Forest Service. In: Arnberger, A., Brandenburg, C., Muhar, A. (2002) (Eds.). Monitoring and Management of Visitor Flows in Recreational and Protected Areas. Conference Proceedings. Bodenkul-tur University Vienna, Austria, January 30 – February 02, 2002. Vienna.

Siegrist, D., Clivaz, C., Hunziker, M. & Iten, S. (eds.) (2006). Exploring the Nature of Management. Proceedings of the Third International Conference on Monitoring and Management of Visitor Flows in Recreational and Protected Areas.
University of Applied Sciences Rapperswil, Switzerland, 13-17 September 2006. Rapperswil.
427
Comparison of the Use of Communication Channels between Amateur and Serious Hikers in Fulfilling Information Needs
Yu-Lan Yuan & Chi-Chuan Lue
National Dong Hwa University, Taiwan
[email protected]@mail.ndhu.edu.tw
Keywords: Information searching behavior, external information source, information needs, hikers, recreational ex-perience, visitor management, forestry areas.
Introduction
Hiking/backpacking has been among the top five favorite leisure pursuits in Taiwan for the past 20 years. In responding the increased number of vis-itors, provision of information has been used as management tool in managing recreational use of forestry areas to guide and control users’ activities and behaviors. Information is provided to insure a joyful experience to the public while also is needed to persuade users to assume low-impact behaviors to minimize the damage of recreational use.
Hiking in wilderness circumscribes a unique con-text, in that trail conditions, weather, and wildlife are constantly changing. Information, thus, is cru-cial to hikers/backpackers. Unlike tourist destina-tions, information is well-provided, information of wildness areas is often insufficient, hard to obtain, or even no information could be found. Lack of information, in extreme, might lead to dangerous and life threatening situations. How to make infor-mation available is a complex task. Accordingly, to deepen the understanding of information needs, seeking, and uses of communication channels will enable forestry managers to distribute information effectively.
In the long line of information searching behav-ior research, numerous evidence was found indi-cating that tourists search information before they take trips (Fesenmaier 1994, Fodness & Murray 1999). External information was needed to solve problems (Lovelock & Weinberg 1984) and over-come constraints (Anderson 1987, Coble & Selin 2003) in response to information needs. A variety
of sources of information was selectively used with a variety of search strategies in planning a recre-ational trip (Fodness & Murray 1999), the usage of information sources also varied by the experience (Krumpe & Brown 1982).
Compared to information searching studies of oth-er recreational and tourism areas, research on in-formation use and network of hikers/backpackers has been scarce. This study fills the gap. The objec-tive of this study was, therefore, to understand the communication channels used by amateur and se-rious hikers to acquire information and knowledge in fulfilling hiking-related information needs.
Methods
Study SettingThis study was conducted at the Da Wu Mountain Hiking Trails (DMHT) in cooperation with the Re-public of China Forest Bureau. DMHT is located adjacent to the Da Wu Natural Reservation Area in southern Taiwan and is one of the most popular hiking trails in southern Taiwan.
SamplingThe rainy season and typhoon have great influ-ence on the number of visitors and the DMHT’s management. Heavy rain often leads to the close of DMHT. The time frame, thus, for on-site sam-pling was June 19, 2004 to March 31, 2005. Hikers were approached as they were exiting or entering. Interviewers identified themselves as members of a research team who, in cooperation with the For-est Bureau, were conducting a user study relat-

Visitor Information and Visitor Management
428
ed to the hiking trail system. They were asked to leave contact information (i.e. names, addresses, and cell phone numbers) and invited to participate the study. Data was collected on 42 different days, including 11 days on raining season (26.2%), and 31 days on dry season (73.8%). Of these, 16 days were on weekend (38.1%) and 26 days on week-day (61.9%). Sampling time started from 7:30 in the morning and ended at 15:00 in the afternoon. In total 1728 hikers were recorded, 39 of them re-fused to give contact information (2.3%), 164 of them were repeat visitors (9.5%), 117 of them were rangers and forestry workers (6.8%). Thus, 1408 contact information were collected and dou-ble checked for the duplicates, and then produced a list of 1354 contact information that constituted the sampling frame for data collection.
The contact information was collected over nine months; for instance, questionnaires were mailed out at three periods of time to avoid the willing-ness of participating this study dying down over time. The first mail-out was from Sep. 1 to Oct. 30, 2003. The second mail-out was from Nov. 1, 2004 to Jan, 15, 2005. The third mail-out time was from Jan 16, 2005 to March 31, 2005. 737 surveys were mailed out. Of these, 557 surveys were returned (76.6%) and, of these, 549 were usable for the pur-poses of this study (98.6%).
Data CollectionThe survey instrument was a self-administered questionnaire consisting of three sections, two of which were referenced in this study. The sec-ond section focused on the use of communication channels. To assess the usefulness of communi-cation channels in response to a specific type of information needs eight categories of communi-cation channels were included: organized groups/clubs, sports shops/specialized stores, friends/fam-ily members, mountaineer/hiker magazines, out-door books, travel magazines, and Internet. Re-spondents were asked to identify the best or the most useful communication channel in regard to each type of information need. These communica-tion channels are essential when obtaining hiking/backpacking related information, such as choos-ing hiking routes, gaining new knowledge about equipment, weather condition.
The third section of the questionnaire included questions on individuals’ sociodemographic char-acteristics including, gender, age, education, hik-ing style, and memberships in hiking/backpacking organized groups/clubs. The level of expertise was assessed through the following questions: “Days spent hiking for the past one year,” “Years in pur-suing hiking,” “Role taken during a hike”, and “The perceived importance of hiking in their dai-ly life”.
Data AnalysisThe Statistical Package for the Social Sciences (SPSS Inc. 2004) was used to analyze the data ob-tained from they survey. First, descriptive statistics were computed to profile respondents. Then, Chi-square statistics were employed, on amateur and serious hikers to examine differences in the use of communication channels.
Result and Discussion
Table 1 provides basic descriptive information about the respondents. Among the respondents, there were 76.1 per cent living in southern regions. A big proportion of respondents (32.3 per cent) spend 20 to 50 days hiking in a year, followed by more than 50 days (19.4). The majority of respon-dents (60 per cent) took a role as a follower during hiking. About 49 per cent pursued hiking between 4 to 10 years; and 22.7 per cent pursued hiking for more than 11 years. More than half of the respon-dents did not have any membership (57.4 percent). 15.1 per cent with membership in local organized groups/clubs, 15.1 per cent with membership in company and college outing groups, and anoth-er 12.4 percent with membership in national orga-nized groups/clubs.
Table 2 lists the usage of eight communication channels. Information obtained from friends/rela-tives was the primary information channel for all respondents for the most types of the information needs, except on “acquaintance of companions” and “weather information”. The second most use-ful communication channel was organized groups/clubs, especially in finding information on “gener-al hiking information”, “seeking companion dur-ing planning a hiking trip”, and “acquaintance of companion”, as well as using it as “the primary

Visitor Information and Visitor Management
429
source of hiking knowledge and skill”. Over 45 percent of respondents indicated that the Internet was the best communication channel for weather information. It was also identified as the second most useful communication channel for obtaining information on “hiking route related information” and “general hiking information”. Surprisingly, many respondents identified that sports shops were the second most useful source for gaining knowl-edge and hand-on experience on hiking gear and gadgets. Table 2 also reveals that the best place to make acquaintances was during a hike.
Respondents who acted as hiking leaders and fol-lowers differed significantly on the use of com-munication channels in fulfilling their information needs, including general hiking information, opin-ion, hand-on experience, the newest hiking gear/gadgets, weather information, and hiking route-re-lated information. Respondents acting as hiking leaders were more likely to use the Internet for ob-taining general hiking information, weather infor-mation, and hiking route-related information than those acting as followers. They also were more
likely to use organized groups/clubs as their pri-mary information source of hiking knowledge and skill, and as the major opinion source for planning hiking trip than others. In addition, they were more likely to gain hand-on experience and the newest information about hiking gear/gadgets in using sports shops/specialized stores. Overall, those who acted as followers were more inclined to rely on friends/relatives in fulfilling their various informa-tion needs, except weather information. Many re-spondents from both groups agreed that the best place of making the acquaintance of companions was during hiking.
Respondents living in southern and non-southern regions were different significantly in using com-munication channels to fulfill every aspect of their hiking-related information needs, as indicated on table 4. Generally, respondents living in southern regions were more likely to fulfill all their hik-ing-related information needs by asking friends/relatives than respondents lived in non-southern regions. Respondents living in non-southern re-gions were more likely to use organized groups/
pVariables N % Variables N % Gender Hiking style
Male 406 74.0 Solo 49 8.9 Female 143 26.0 With friends/Family members 326 59.5
Age Participated hiking organized via organized groups/clubs 115 21.0
Under 18 6 1.2 Participated hiking via commercial travel organizers 58 10.6
19-30 85 17.3 Role taken during hiking31-45 156 31.8 Leader/Assistant 216 49.8 46-60 229 46.6 Follower 327 60.2 61 and Over 15 3.1
Residence The Attendance of outdoor skill training camps/seminars
Southern region 418 76.1 No 313 57.5 None southern region 131 23.9 Yes 231 42.5
Hiking days in a year (days) Years in pursuing hiking activity (year)0-10 157 29.5 0-3 200 37.5 11-20 100 18.8 4-10 212 39.8 21-50 172 32.3 11-40 121 22.7 51 and Over 103 19.4
Education MembershipsSenior high 73 13.4 None 315 57.4 Junior high 143 26.3 Company or college outing groups 83 15.1 Technique school 122 22.4 Local organized groups/clubs 83 15.1 College and beyond 206 37.9 National organized groups/clubs 68 12.4
Table 1: Respondents’ Profile.

Visitor Information and Visitor Management
430
clubs to seek companions, meet companions, ex-tend hiking experience, and share knowledge and skill than those lived in southern regions. Many of them also identified that this communication chan-nel was used as the primary information source of hiking knowledge and skill. Over fifty percent of them even considered it as the most useful opin-ion source in planning hiking trip. In addition, they were more inclined to use sports shops/specialized stores to gain knowledge and hand-on experience on hiking gear and gadgets and the newest informa-tion on hiking gear/gadgets. Moreover, Internet was used for obtaining information on weather and hik-ing route by the many of respondents from both re-gions, however, respondents lived in none southern region were more likely to obtain these two types of information from the Internet.
Respondents with different levels of expertise also differed significantly in the use of communication channels. In general, respondents with a lower lev-el of expertise were highly likely to ask friends/relatives for general hiking information, seeking companions, extending and sharing hiking experi-ence and knowledge, gaining hands-on experience on hiking gear/gadgets, and route-related informa-tion. Over sixty-five percent of them also greatly depended on it as the primary information source of
hiking knowledge and skill, and indicated it was the most useful opinion source in planning a hiking trip (table 5). While respondents with higher levels of expertise were more likely to use organized groups/clubs for above mentioned information needs. Again, Internet was used for weather information. Interestingly, respondents with higher levels of ex-pertise were less likely to use Internet in fulfilling their various information needs. Moreover, respon-dents with lower levels of expertise were more in-clined to use sports shops/specialized stores to gain hands-on experience on hiking gear/gadgets.
Conclusion and Implications
This research discloses that there were signifi-cant differences in the utilization of communi-cation channels between serious hikers and am-ateurs in fulfilling various types of information needs. Serious hikers were more likely to use orga-nized groups/clubs as the primary communication channel of hiking knowledge and skill, and to per-ceive it as useful communication channel for plan-ning a hiking trip. While amateurs largely relied on friends/relatives as the primary communication channel in fulfilling various types of information needs.
General Personal Specific Information Social Communication Channel A B C D E F G H I J K Organized groups/Clubs 22.1 24.6 21.3 28.8 14.4 12.2 10.5 18.9 31.0 26.9 18.
5Sports shops 2.8 1.4 3.0 _ 18.1 21.4 2.3 1.9 0.9 2.8 1.2During a hike _ _ _ _ _ 15.6 7.6 7.2 38.8 _ 28.
8Friends/Relatives 45.0 66.5 51.7 48.9 48.9 32.7 25.2 37.6 24.9 54.5 47.
6Internet 22.1 4.6 9.5 9.5 8.3 12.2 46.3 27.4 0.7 8.1 3.2Mountaineer/Hiker magazines
3.7 2.0 4.9 4.2 4.9 5.1 1.4 4.9 0.0 4.7 0.0
Travel Books/Magazines 2.3 0.6 4.8 0.4 4.8 _ _ _ _ _ _Others 1.9 0.4 1.8 1.6 0.5 0.7 6.7 1.9 3.7 1.9 0.4A: General hiking informationB: Seeking companion in planning stageC: The primary information source
of hiking knowledge and skill D: Opinion sources for planning a
hiking trip
E: Gaining knowledge and hand-on experience on hiking equipment and gadget
F: Hiking gear and gadgetG: Weather information H: Hiking route related information (trail
condition, hiking distance/direction, and water source)
I: Acquaintance of companionJ: Extending hiking experienceK: Sharing hiking
knowledge and skill
Table 2: The Use of Communication Channels in Fulfilling Information Needs.
Visitor Information and Visitor Management
431
Communication Channel Leader (%) Follower (%) DF Chi-square P-valueGeneral hiking information
Organized groups/clubs 24.7 24.6 2 23.409 .000** Friends/family members 38.9 57.3 Internet 36.3 18.1
Seeking companions as planning hiking trips Organized groups/clubs 29.0 23.4 2 2.060 .357 Friends/family members 66.4 71.6 Internet 4.7 5.0
The primary information source of hiking knowledge and skill
Organized groups/clubs 32.8 21.4 2 11.025 .004* Friends/family members 53.1 68.4 Internet 14.1 10.2
Opinion sources for planning a hiking trip Organized groups/clubs 39.7 29.6 2 11.505 .003* Friends/family members 46.0 61.5 Internet 14.3 9.0
Acquaintance of companion Organized groups/clubs 35.9 30.7 2 3.631 .163 Friends/family members 22.0 29.2 Hiking 42.1 40.1
Extending hiking experience Organized groups/clubs 34.0 27.8 2 3.857 .145 Friends/family members 55.3 64.1 Internet 10.7 8.2
Sharing hiking knowledge and skills Organized groups/clubs 22.4 16.4 3 7.216 .065 Friends/family members 42.2 53.5 Hiking 31.8 27.1 Internet 3.6 3.0
Gaining knowledge and hand-on experience on hiking gear and gadget
Organized groups/clubs 19.1 14.5 3 8.948 .030* Sports shops/specialized stores 24.2 17.7 Friends/family members 45.9 59.5 Internet 10.8 8.4
Obtaining newest info about hiking gear and gadget
Organized groups/clubs 13.9 12.3 4 12.298 .015* Sports shops/specialized stores 26.9 19.8 Friends/family members 26.9 39.9 Hiking 20.2 14.2 Internet 12.0 13.8
Weather information Organized groups/clubs 15.3 11.4 2 7.366 .025* Friends/family members 23.5 35.2 Internet 61.2 53.5
Hiking route related information Organized groups/clubs 23.4 22.4 2 11.720 .003** Friends/family members 35.6 50.2 Internet 41.0 27.4
Table 3: The Use of Communication Channels Used by Respondents Taking Different Hiking Status in Fulfilling Information Needs.

Visitor Information and Visitor Management
432
Communication Channel None Southern Region (%)
Southern Region (%)
DF Chi-square P-value
General hiking information Organized groups/Clubs 33.3 22.0 2 23.462 .000** Friends/Relatives 31.7 56.6 Internet 34.9 21.4
Seeking companions planning hiking trips
Organized groups/Clubs 41.4 20.6 2 25.947 .000** Friends/family members 51.9 75.2 Internet 6.8 4.2 .
The primary information source of hiking knowledge and skill
Organized groups/clubs 35.7 22.7 2 12.609 .002* Friends/family members 48.7 67.1 Internet 15.7 10.2
Opinion sources for planning a hiking trip (11)
Organized groups/clubs 52.1 26.9 2 32.974 .000** Friends/family members 33.9 63.2 Internet 14.0 9.9
Acquaintance of companion Organized groups/clubs 47.3 28.3 2 25.992 .000** Friends/family members 10.9 31.0 Hiking 41.9 40.8
Extending hiking experience Organized groups/clubs 41.3 26.5 2 12.787 .002* Friends/family members 47.1 65.2 Internet 11.6 8.2
Sharing hiking knowledge and skills Organized groups/clubs 27.6 16.0 3 15.969 .001* Friends/family members 37.3 52.1 Hiking 29.1 29.5 Internet 6.0 2.4
Gaining knowledge and hand-on experience on hiking equipment and gadget
Organized groups/clubs 24.8 13.2 3 35.517 .000** Sports shops/specialized stores 27.2 17.9 Friends/family members 32.0 61.8 Internet 16.0 7.0
Obtaining newest info about hiking equipment and gadget
Organized groups/clubs 14.8 12.4 4 27.282 .000** Sports shops/specialized stores 33.6 19.3 Friends/family members 20.3 39.4 Hiking 11.7 18.1 Internet 19.5 10.9
Weather information Organized groups/clubs 14.9 12.1 2 22.142 .000** Friends/family members 13.2 36.5 Internet 71.9 51.4
Hiking route related information Organized groups/clubs 26.5 22.5 2 38.262 .000** Friends/family members 21.4 44.8 Internet 52.1 32.6
Table 4: Communication Channels Used by Respondents Living in Different Regions in Fulfilling Information Needs.

Visitor Information and Visitor Management
433
Regardless of hiking status, regions, and the lev-el of expertise, the Internet was identified the most useful communication channel for weather infor-mation. This study only analyzed 8 communica-tion channels used by amateurs and serious hik-ers in fulfilling information needs. Other potential communication channels should be included in fu-ture studies. More follow-up studies will be need-ed to understand the reason in making the choice of communication channels to help forestry man-agers better deploy effective and durable informa-tion strategies.
References
Anderson, R.B. (1987). Reassessing the odds against find-ing meaningful behavioral change in mass media health promotion campaigns. Paper presented to the Conference on Communication Theory and Public Relations, Illinois State University, Normal.
Coble, T.G. & Selin, S.W. (2003). Hiking alone: Under-standing fear, negotiation strategies and leisure expe-rience. In: Journal of Leisure Research (35/1), p 1-22.
Cole, D.N., Hammond, T.P. & McCool, S.F. (1997). Infor-mation quantity and communication effectiveness: Low-impact messages on wilderness trailside bulletin boards. In: Leisure Sciences (19), p 59-72.
Fesenmaier, D.R. (1994). Traveller use of visitor informa-tion centers: Implication for development in Illinois, In: Journal of Travel Research (33/1), p 44-50.
Fodness, D. & Murray, B. (1997). Tourist information search, In: Annals of Tourism Research (24/3), p 503-523.
Fodness, D. & Murray, B. (1999). A model of tourist in-formation search behavior, In: Journal of Travel Re-search,(37/3), p 220-230.
Krumpe, E. & Brown, P.J. (1982). Redistributing backcoun-try use through information related to recreation expe-riences. In: Journal of Forestry, (June), p 360-364.
Lovelock C.H., & Weinberg, C.B. (1984). Marketing for Public and Nonprofit Managers. New York.

435
Poster Session

Siegrist, D., Clivaz, C., Hunziker, M. & Iten, S. (eds.) (2006). Exploring the Nature of Management. Proceedings of the Third International Conference on Monitoring and Management of Visitor Flows in Recreational and Protected Areas.
University of Applied Sciences Rapperswil, Switzerland, 13-17 September 2006. Rapperswil.
436
Monitoring Trampling Impacts in the Disposal of Human Waste at Campsites and Visitors’ Attitudes to a Carry-out System
Tetsuya Aikoh
Hokkaido University, Japan
Keywords: Trampling, campsite, aerial photograph, pack-out, plastic bag, attitude, visitor.
Introduction
Several camping impacts have been reported on campgrounds in natural settings (Hammit & Cole 1998). These impacts include trampling of vegeta-tion, soil erosion, littering, growth of social trails, damage to trees and creation of fire sites. One study showed the enlargement of a campsite and increased vegetation loss around some designat-ed campgrounds in Daisetsuzan National Park, Ja-pan (Aikoh et al. 1995). This provoked the neces-sity of further monitoring and the establishment of a campground management strategy by park man-agers. Also, the number of visitors and managers who cared about the impact of feces and toilet pa-per around the campgrounds increased.
Recently, the lack of toilet facilities in mountain huts and campgrounds has become an urgent man-agement issue in national parks in Japan. Most mountain huts have only latrines; therefore, there is concern about the potential contamination of drinking water. Feces and toilet paper are found around designated mountain campgrounds without toilet facilities. The Ministry of Environment and some municipality governments have provided fi-nancial support to the private owners of mountain huts, and promoted new sanitary technology de-velopments in remote areas. However, replacing or installing toilet facilities in remote areas, and the maintenance of such facilities, is very costly. Due to a lack of finances, some municipalities are pro-moting the carry-out system, which involves the distribution of free plastic bags to hikers, and the collection of the carried-out bags. The key to the success of this system is the compliance of visi-tors.
The purposes of this study are to monitor the im-pact of feces on campgrounds without toilets, and investigate the compliance of visitors to the human waste carry-out system procedures.
Methods
There are nine shelters and 12 designated camp-grounds in Daisetsuzan National Park. Two shelters and seven campgrounds have no toi-let facilities. The popular campgrounds, Min-aminuma and Bieifuji, were investigated us-ing aerial photographs. Photographs taken in 1977, 1982 1987, 1992 and 1997 by the Forest-ry Agency were scanned using a flatbed scan-ner. Digitized bare grounds and paths around campgrounds were traced and mapped. Length of paths and the size of bare ground were calcu-lated. In 1999, we conducted an on-site survey to verify the maps, and assessed the existence of feces and toilet paper around the campsites.
Visitors’ attitudes to the carry-out system were investigated in 2001 and 2005 at the trailhead of Mt. Rishirisan, in Hokkaido. The towns of Rishirifuji and Rishiri, near Mt. Rishirisan and its trailheads, have been promoting a trial of the carry-out system since 2000. Before this pro-motion, much feces and toilet paper were found around the summit, huts and lookout points. The promotion consisted of distributing free plas-tic bags at trailheads and hotels, and collecting used plastic bags at trailheads. Most Japanese hikers are not accustomed to such a system, therefore the managers and town officials are now concentrating on the attitude and compli-ance of hikers. In 2001, 218 hikers and in 2005,

Poster Session
437
125 hikers were asked to answer a questionnaire on their recognition of camping impacts and their attitude to the carry-out system.
Results
Minaminuma campground is close to popular Mt. Tomurausi (altitude 1,960 m). It takes about five hours on foot from the nearest trailhead to reach it. There are eight bare campsites, and many so-cial trails stretching radially from them. We found much feces and toilet paper at the end of each so-cial trail. Aerial photographs showed that the num-ber of bare sites increased from three to eight, the area of bare ground increased from 120 to 1066 m2,and the length of paths increased from 876 to 2409 m in the last two decades (figure 1). The same trends were found in the Bieifuji campground.
The visitors who complained about encountering feces and toilet paper in Mt. Rishirisan decreased during the past five years, from 23% to 6%. Vis-itors who recognized and approved of the carry-out system increased from 51% to 78%. How ever, the reported willingness to pay for the carry-out system was insufficient to cover the actual cost of plastic bags.
Conclusion
Enlargement of campsites and growing social trails are indicative of the disordered conditions of the campgrounds. It is necessary to restrict tents to
designated sites, and to educate visitors about low-impact camping practices. Visitors to Rishiri Island appear to be aware of the carry-out system. How-ever, cost sharing of distribution and collection of plastic bags is becoming a controversial subject.
References
Aikoh, T., Nakajima, Y. & Asakawa, S. (1995). Enlarge-ment of Bare Grounds at Campsites in Daisetsuzan National Park. In: Papers on Environmental Informa-tion Science (9), p 63-68.
Hammitt, W.E. & Cole, D.N. (1998). Wildland Recreation: Ecology and Management. New York.
Figure 1: Change of campsites and social trails around Minaminuma campground.

Siegrist, D., Clivaz, C., Hunziker, M. & Iten, S. (eds.) (2006). Exploring the Nature of Management. Proceedings of the Third International Conference on Monitoring and Management of Visitor Flows in Recreational and Protected Areas.
University of Applied Sciences Rapperswil, Switzerland, 13-17 September 2006. Rapperswil.
438
Tourism in Biosphere Reserves: Genesis of a Territorial IssueCase of Ida-ou-tanane, in the High Atlas Mountain (South-West
of Morocco)
Lahoucine Amzil & Mohamed Berriane
Mohammed-V University, Morocco
[email protected]@menara.ma
Keywords: Biosphere Reserve Arganeraie, genesis, tourism attitudes, monitoring, High Atlas Mountain, Morocco.
Introduction
The expansion of tourism in protected spaces, in particular the biosphere reserves, draws more and more attention because of its social and ter-ritorial repercussions: tourism fits into the land-scape strongly and penetrates through extremely different environments. No more space can es-cape from the geographical extension of tourism. And its territorial impact starts to be measured with those of other activities.
Methods
The tourist practices and territory will be the subject of investigations for this work within a socio-spatial approach. Being near the greatest tourist station of Morocco (Agadir), for a long time Ida-ou-tanane territory became an attrac-tion for international tourists as well as for na-tional hikers. Great numbers of tourists prefer to take refuge in the gorges of this mountain than to remain in the seaside resort of Agadir. The re-sult is the emergence of a new tourism system, of which territory is the basis and the local soci-ety is the reflection. However, this country con-stitutes the example of a specific and fragile eco-system. Its localization in the Biosphere Reserve Arganeraie (MAB-Morocco), gives it even more fragility. The tourist activity starts to become a determining economic element in this area. And the efforts devoted lately to the development of rural tourism in Morocco, encourage this orienta-tion more and more.
Results and conclusion
Two Monitoring forms are to be questioned (fig-ure 1) : Monitoring of space or Monitoring of the tourists?
To answer this question, three reports are proposed in this contribution:
1. Tourism transforms the areasAs tourism develops in the villages, it is spread and organized in specific places. Its spatial radi-ation can reach all the places. Tourism transforms existing places, but it also creates new locations. A geographical phenomenon which “upsets the order established in the hierarchies and the functioning of concerned space”.
2. Interactions: a socio-space genesisThe profile of rural tourism is very difficult to de-fine. With a precise and limited offer, the demand is characterized by high diversity. The result is a great diversity in the attitude of the tourists about respect to territory and society. However the rela-tion between tourism and the social context of the inhabitants is difficult to approach in the policies of management. However, the needs of the tourists in the excursion places become increasingly large.
3. The attitudes and the spatial forms of tourismThe development of a tourist area in Ida-ou-tanane resulted in the constitution of privileged sites asso-ciated to a specific tourist practice (bivouacs, spe-leology, excursion). During the 15 last years, the

Poster Session
439
development of tourist territory does not cease to increase the number of sites with tourist interest. The result is the evolution of tourist practices and the intensification of the rate of tourist function-ing.
References
Amzil, L. (2006). Touristification d’une zone rural montag-neuse. (PhD in progress). Mohammed-V University, Rabat.
Amzil, L. (2005). Haut Atlas occidental: une zone de mon-tagne en déséquilibre? Cas d’Ida-ou-tanane, es-sai géographique sur une communauté et un espace. In: pour une nouvelle perception des montagnes ma-rocaines. Actes du 7ème colloque maroco-allemand, Rabat 2004, p 81-88.
Amzil, L. (2004). Crisis of environment or crisis of commu-nity? Geographical analysis of a community in the ru-ral western High Atlas Mountains. In: Eco-complexity and dynamics of the cultural landscape. 34th Annual Conference of the Ecological Society in Giessen GFÖ. Germany.
Development phase of tourism (Intensification of the sites)
Tourists practical Types of places
Tourist Monitoring SpaceMonitoring
0 10 20 30 40 50 60 70 80 90 100
Baignade dans des points d'eau
Pique nique
Randonnée pédestre
Spéléologie
Découv erte de la l’architecture locale
Visite des souks et des moussems
Découv erte de la culture locale (v ie quotidienne)
Découv erte des sites naturels et climatiques
Spiritualité et découv erte des anciennes mosquées
touristes internationauxtoursites nationaux
T
P
T
P
Q
P = population locale T = Pratiques touristique Q = zone d’observation et de thématique
Point de départ
Schéma d’un transect à l’échelle locale
1. Zone expérimentale (le point le plus sensible à la dégradation)
2. Zone d’interface et d’impact Homme (population s locales / touristes) / Nature
3. Zone d’interface et d’impact Population locale / Touristes
Figure 1: Two Monitoring forms.

Siegrist, D., Clivaz, C., Hunziker, M. & Iten, S. (eds.) (2006). Exploring the Nature of Management. Proceedings of the Third International Conference on Monitoring and Management of Visitor Flows in Recreational and Protected Areas.
University of Applied Sciences Rapperswil, Switzerland, 13-17 September 2006. Rapperswil.
440
Recreational Impacts on Nature-Based Recreational Areas
Chun-Yen Chang1 & Hsing-Fen Tang2
1National Taiwan University, [email protected]
2Asia University, [email protected]
Keywords: Recreational impacts, natural based, landscape ecology, activities.
In order to depict the impacts of the recreational activities on the natural based recreational areas of Taiwan. This study analyzed the landscape ecological indicators (LEI), the environment im-pact (EI), and the bird’s indices (BI), followed with the on-site visitor’s perceptions (VP) of the environmental impacts due to the recreational activities (RA). The relationship between land-scape ecological structures and natural environ-mental impact in the natural based recreational areas were examined and analyzed.
For the on-site works, the first step is the on-site investigation of the natural environmental im-pacts, which includes the bird species, and rec-reational noise. The second section was the visi-tors’ interview, the questionnaire items includes the cognitions of environmental impacts, their recreational purpose, satisfaction and accept-able management programs. The third section tests the relationships among landscape ecolog-ical structures, recreational impacts, and eco-logical function indicators of bird species.
The period of this study was performed in the past two years. The work for the first year in-cludes the establishment of the evaluation mod-el of the natural environmental impacts in the ecotourism areas. The model was tested at the MeiFong area, which is located in the moun-tain area of the middle part of Taiwan. The work for the second year was to refine the evalua-tion model by monitoring the conditions of the MeiFong areas and tests the evaluation mod-el with the proposed indicators at 2 new eco-tourism areas. Finally, this study tries to com-
pare the selected three testing areas to propose the management strategies and the programs for the ecotourism development.
The findings of the first year from the on-site in-vestigations of soil compactness, vegetation cov-er, and roots exposures were compared with the results of the other 2 sites. The survey of the bird investigation shows the Steer’s Liocichla (Lio-cichla steerii) has the highest frequency obser-vation rate in the MeiFong area. From the visi-tors’ reported perceptions, visitors’ cognition of crowding, too much traffic, over-development, few wildlife observed, and the bad landscapes of power lines and pipelines. All the findings show the recreational impacts were serious due to de-velopment in past few years.The woods were the largest area in the landscape’s ecological struc-ture of the MeiFong area, while the water bodies were the fewest.
The relationships between landscape ecologi-cal structures were tested. Under the hierarchy of 100 meters investigation radius, farmland, wasteland, and the built area were found to have significant relationship with the bird ecological indicators. Under the 50 meter investigation ra-dius, only grassland and wasteland have a signif-icant relationship with the bird ecological indica-tors. However, under the 500 meter investigation radius, there was no relationship between land-scape ecological structures and the bird ecolog-ical indicators. The Mean Patch Fragmental Di-mension (MPFD) shows more than 2 significant relationships with the bird ecological indicators,

Poster Session
441
and plays a role as a good indicator in regard to the farm and grassland. For wasteland and the built areas, the Mean Shape Index (MSI) is a better pre-dictor for the birds.
References
Antrop M. (2001). The language of landscape ecologist and planners 3. A comparative content analysis of con-cepts used in landscape ecology. In: Landscape and Urban Planning (55), p 163-173.
Arrowsmith, C. & Inbakaran, R. (2002). Estimating envi-ronmental resiliency for the Grampians national park, Victoria, Australia: A quantitative approach. In: Tour-ism Management (23), p 295-309.
Farina, A. (1998). Principles and Methods in Landscape Ecology. New York.
Forman, R. T. T. & Deblinger, R. D. (2000). The ecological road-effect zone of a Massachusetts (U.S.A) suburban highway. In: Conservation Biology (14), p 36-46.
Forman, R.T.T., Reineking, B. & Hersperger, A. M. (2002). Road Traffic and Nearby Grassland Bird Patterns in Suburbanizing Landscape. In: Environmental Man-agement (29/6), p 782-800.
Forman, R. T. T. (1995). Land mosaics. Cambridge.
Grenier, D., Kaae, B. C., Miller, M. L. & Mobley, R. W. (1993). Ecotourism, landscape architecture and ur-ban planning. In: Landscape and Urban Planning (25), p 1-16.
Hammitt, W. & Cole, D. (1998). Wildland recreation — Ecology and management. John Wiley & Sons, Inc.
Hansson, L. (2000). Edge structures and edge effects on plants and birds in ancient oak-hazel woodlands. In: Landscape and Urban Planning (46), p 203-207.
Knight, R. L. & Cole, D. N. (1991). Effects of recreation-al activity on wildlife in wildlands. North American Wildl. Nat. Res. Conf. (56), p 238-247.
Roggenbuck, J. W., Williams, D. R. & Watson, A. E. (1993). Defining accept-able conditions in wilderness. In: En-vironmental Management (17/2), p 187-197.
Wall, G. & Wright, C. (1977). The environmental impact of outdoor recreation. Dept. of Geography Publication Series, No. 11. Waterloo.

Siegrist, D., Clivaz, C., Hunziker, M. & Iten, S. (eds.) (2006). Exploring the Nature of Management. Proceedings of the Third International Conference on Monitoring and Management of Visitor Flows in Recreational and Protected Areas.
University of Applied Sciences Rapperswil, Switzerland, 13-17 September 2006. Rapperswil.
442
Alternative Index of Carrying Capacity in Nature Tourism: The Relationships between Stakeholders’ Emotional Labor and
Carrying Capacity of Community-Based Nature Tourism inAtayal Smangus Tribe, Taiwan.
Chih-Liang Chao1, Hsin-Hang Wang2
Providence University, Taiwan
[email protected]@yahoo.com.tw
Keywords: Recreational Carrying Capacity, Emotional Labor, System simulation, visitor management.
The demands of increasingly affluent consumers for ‘remote’, ‘natural’ and ‘exotic’ environments have created an upsurge in ecotourism ventures (Scheyvens 1999). As many governments have en-couraged public investment and made econom-ic development programs more dependent on eco-nomic viability, nature tourism has been seen as a major element in the economic redevelopment of many aboriginal tribes located in recreational and protected area in Taiwan. Training in hospitality, servicing in meal and accommodation, has became the majority skill for indigenous tourism and con-sistent with the emphasis, the terms ecotourism and indigenous cultural tourism often being used mere-ly as marketing tools (Thomlinson & Getz 1996, Butler & Hinch 1996). Moreover, with the growth of such efforts, lack of production capacity makes the locals more dependent upon the tourism eco-nomic system and turns away the resource-based philosophy from ecotourism. Many ecotourism re-searches have raised the similar problems; the lo-cals become more dependent upon tourists, em-phasize service and are merchandise oriented and gradually turn to high impact tourism.
The major concerns related to sustainable develop-ment is that of limits to numbers of tourists. How-ever, the issue of carrying capacity of destinations, in both human and environmental terms, has re-ceived little consistent attention in the tourism field (Butler 1999). Much excellent research has been conducted on carrying capacity in wilderness areas in which few or no people live, but relatively
little has been done in popular tourist destinations, where large numbers of permanent residents live and mix with large numbers of tourists, especially for the development of indigenous tourism. There-fore, application of carrying capacity in nature tourism ultimately requires more judgments from the interdisciplinary managers, based on natural resource, social and managerial considerations. Moreover, from the empowerment perspective in the indigenous community-based nature tourism, it seems by nature to make the stakeholders be part of the managers.
As noted above, this paper considers ways in de-scribing a framework which has been designed for an explorative study of the female stakeholders’ social psychological value, emotional labor, as the index of carrying capacity toward the tribe-based nature tourism (Stankey 1973, Shelby & Heber-lein 1984, Hochschild 1993, Vincent & Thompson 2002). For the research site, an Atayal Smangus Tribe, famous for nature resources tourism and the first co-management example in indigenous com-munities of Taiwan, was chosen. As for the nature of the communities’ co-management, they coop-erate in all the responsibility of tourism resourc-es management and share all the economic gen-eration from nature tourism. However, the only tourism service is the meal provided in the tribe chophouse. Therefore, survey data will be drawn from 120 sections during lunch and dinner prepar-ing for tourist flow in May and June, 2006. Inter-viewing and observations will be involved in the

Poster Session
443
variables, including female stakeholders’ emotion-al labor, service performance, tourists’ satisfac-tions, the number of visitors per days.
The purpose of this study includes
1. To examine the relationships between aboriginal women’s emotional labor and service-performance in community-based indigenous tourism.
2. To probe aboriginal women’s emotional labor toward the impact of tourist satisfaction.
3. To establish the relationships between carrying capacity and tourist satisfaction.
The analysis in this research will apply computer system simulation to compute the number of vis-itor and waiting time about the meal services by Arena 3.0 program (Kelton et al 1999). Queuing theory will be deal with the relationship between female stakeholders’ social psychological value and nature tourists or reservationists’ experiences. Pearson-Correlation analysis, ANOVA, and multi-ple regression analysis will be applied to test the statistical hypothesis. Research implications and management applications are discussed for com-munity development in nature and recreational tourism resources.
References
Butler, R. (1999). Understanding Tourism. In: E. L. Jackson and T. L. Burton (Eds.) Leisure Studies: Prospects for the Twenty-First Century, p 235-251. State College.
Butler, R. & Hinch, T. (1996). Tourism and Indigenous Peo-ples. International Thompson Business Press, UK.
Hochschild, A. R. (1983). The managed heart. Berkeley.
Kelton, W.D., Sadowski, R.P. & Sadowki, D.A.. (1998). Simulation with Arena. McGraw-Hill, U.S.
Scheyvens, R. (1999). Ecotourism and the empowerment of local communities. In: Tourism Management (20), p 245-249.
Shelby, B. & Heberlein, T. A. (1984). A Conceptual Frame-work for Carrying Capacity Determination. In: Lei-sure Sciences (6/1), p 433-451.
Stankey, G.H. (1973). Visitor Perception of Wilderness Recreation Carrying Capacity. USDA For. Serv. Res, Pap. INT-142.
Thomlinson, E. & Getz, D. (1996). The Question of Scale in Ecotourism: Case Study of Two Small Ecotour Oper-ators in the Mundo Maya Region of Central America. In: Journal of Sustainable Tourism (4), p 183-200.
Vincent, V. C. & Thompson, W. (2002). Assessing commu-nity support and sustainability for ecotourism devel-opment. Journal of Travel Research (41), p 153-160.

Siegrist, D., Clivaz, C., Hunziker, M. & Iten, S. (eds.) (2006). Exploring the Nature of Management. Proceedings of the Third International Conference on Monitoring and Management of Visitor Flows in Recreational and Protected Areas.
University of Applied Sciences Rapperswil, Switzerland, 13-17 September 2006. Rapperswil.
444
“La Semaine du Goût”, The Beginning for a Sustainable Tourism?
Laetitia Estève, Christophe Le Nédic & Catherine Strehler Perrin
Groupe d’étude et de gestion de la Grande Cariçaie, Switzerland
[email protected]@[email protected]
Keywords: Tourism, sustainable, Switzerland, natural reserve, participation, stakeholders, heritage, fish.
The “Grande Cariçaie” is a great marshland, about 3000 hectares of area, situated along the south shore of the Lake of Neuchâtel, in the oc-cidental part of Switzerland. This string of sev-en natural reserves with a strict protection is al-terning with intensive touristic zones (harbours, camping places and secondary homes). Since 1982, the “groupe d’étude et de gestion” (GEG, Studying and managing group), commisionned by the autorities of Fribourg and Vaud cantons, manage this area. One of the main mission of the GEG, out of keeping the marshland up and do-ing scientific studies on the site, is planning how to receive and informing people in this protected area. A working group, named “sous-commision d’information” (SCI, committee for planning in-formation), was created in 1992 to help the GEG in this function.
At the beginning, the information strategy was limited to the natural reserves but, since 2002, managers want to extend this way of thinking by associating several south shore’s stakeholders. Lake leisures represents an important part of lo-cal economy and protected areas are often con-sidered as pulling the country’s development up short. Thus, protected area users and tourism representatives were invited to join the SCI. The idea of the protected area managers is to devel-op a sustainable tourism concept. This alterna-tive form of tourism, in opposition with massive tourism, would cover conservation and enhance-ment of the environment and heritage, economic and social development and preservation and im-
provement of the quality of life of local residents. Within the SCI, the different stakeholders, brought together in a participative process, could elaborate actions in this way.
To put this concept in concrete form, the GEG has organized, in association with the local tourism of-fice, and in partnership with the SCI, a manifes-tation for the “Semaine du Goût” (Week of Taste) with the South Shore as a full-scale “festive coun-try”. This Swiss event upholds taste diversity and produce quality, in a sustainable development way. The goal of the manifestation was to illustrate the link between consumers and natural resources, and to show that preserving natural heritage was impor-tant for local economy too. So, as a central theme, the SCI decided to use the lake’s fishes: a natural resource which take part of the local heritage and brings income for restaurants and fishermen in the country. Moreover, to follow as much as possible a sustainable process, organizers watched over all restaurants and all fishermen were invited to join the event, and to express themselves in a meeting. It was important to communicate about sustainabil-ity which is a foreign concept in the country too.
For ten days, several types of activities were pro-posed. Thirteen restaurants proposed a special menu with fishes from the lake and caught by a lo-cal fishermen; five fishermen opened their door to the public and proposed to bring people on their boat during the fishing; three centers for grow-ing public awareness of nature and history, locat-ed on the South Shore, proposed activities, and a pisciculture showed several of the lake’s live fish-

Poster Session
445
es. Each of these stakeholders received documents about fisher trade, lake’s fishes, protected areas for them and the public. The results are: 721 special menus were sold, 25 persons joined the fishermen and about 150-200 persons were present for all of the activities proposed.
The organisation of this event was interesting to measure difficulties but also potentialities for put-ting into practice a theoretical concept such as sus-tainable tourism. The country is not sensitive to this idea and it was impossible to make a real “sustain-able event”, because many independant stakehold-ers were involved. Another difficulty was to mobi-lize fishermen and restaurant owners which are not used to be requested for events and to work togeth-er. More than that, the message about sustainabil-ity was difficult to explain because each one was thinking according to his personal interest. Finally, public participation was not as important as hoped for, perhaps in part because of a bad weather and a geographic dispersion of activities proposed.
However, this event succeeded in joining togeth-er stakeholders from economic, environmental and cultural worlds around a same subject which en-
hances the countryside, which was an innovation. Speaking about enhancing natural and cultural her-itage was very new for this countryside where mas-sive tourism is the only form known and this ap-proach was appreciated by all the stakeholders questioned at the end of the event. At last, this man-ifestation permitted to speak about sustainable tour-ism and to sensitize people about this notion.
This impulse was only a beginning on the long way of sustainability tourism, but it could be a basis of new collaborations in the future.
Figure 1: Brochure of the “Semaine du Gout” on the South Shore of Lake Neuchatel.

Siegrist, D., Clivaz, C., Hunziker, M. & Iten, S. (eds.) (2006). Exploring the Nature of Management. Proceedings of the Third International Conference on Monitoring and Management of Visitor Flows in Recreational and Protected Areas.
University of Applied Sciences Rapperswil, Switzerland, 13-17 September 2006. Rapperswil.
446
Participatory Planning of Recreational Areas – Landscape Development Concepts in Switzerland
Corina Höppner
Swiss Federal Institute for Forest, Snow and Landscape Research, Switzerland
Keywords: Landscape development, participation, involvement, recreation.
In recent years, Landscape Development Concepts (LDC) have emerged as an instrument for land-scape planning on municipal and regional level in Switzerland. By the end of the 1990s it attained an official meaning in the course of the Swiss sustain-ability policy (BfR 1996, BUWAL 1998). LDCs are to be regarded as a response to the current state of landscape planning in Switzerland. In contrast to housing zones, there is no official planning instru-ment that coordinates the development of the land-scape (in sense of green space) of the whole mu-nicipal area, including recreation areas. An LDC is planed to include all functions and uses of a land-scape (e.g. recreation, agriculture, forestry, flora, fauna, housing), treating them comprehensively rather then separately. As the LDC is a not legal-ly binding planning instrument, wide acceptance and support for the project implementation are cru-cial for its success. Thus, an LDC has to be devel-oped successively, bringing together stakeholders, authorities, experts, directly affected people and a wider public, assessing and considering their inter-ests and needs (Bolliger et al. 2002, Winter 2000).
However, it is still unclear is how the concept of LDC has been adapted in practice and which ex-periences have been made with this new planning instrument. This paper addresses the above stated gap in existing research, specifically regarding the potential of LDCs for the development of munici-pal recreation areas. The evaluation is based on our research in several Swiss municipalities during the past two years. In the first part of our study, a semi-standardized questionnaire was mailed to local ex-perts of all German-speaking municipalities that had finished the elaboration of an LDC (n = 17). In the second part of our research, we selected a com-
munity in the peri-urban region of Zurich that had recently started the elaboration of an LDC. In this case study, we applied multiple research methods. The results presented here are based on the quali-tative analysis of meetings held by the LDC com-mittee and interviews with participants.
In the survey among all LDCs in Switzerland, we explored how recreational needs and demands are considered in the elaboration of LDCs. In a first step, we show which participatory techniques were used to assess recreational interests and needs. Or-ganized interest groups, i.e. leisure, sport or nature protection associations were mainly involved by communicative interaction techniques like round tables, field inspections, workshops and informal discussions. In contrast, non-organized persons were merely informed by information letters, in-ternet and newspaper articles. The implications of these results for the acceptance and the reputation of the LDC in the municipality are discussed. Ac-cording to the survey results, recreation was, to-gether with agriculture, forestry and the conser-vation of flora and fauna, an issue in most LDCs. However, only few representatives from the fields of leisure and recreation were involved in the LDC planning phase. This is rather surprising, because these fields are regarded to be essential issues in LDCs. Possible reasons for this underrepresenta-tion are discussed. From the qualitative analysis of interviews and the LDC committee meetings, we identified problems that typically arise during the participatory planning process of an LDC. For ex-ample, participants were often confronted with the scepticism of other persons regarding the results of the LDC. Specifically, for persons responsible for the LDC, doubts regarding the appropriateness

Poster Session
447
of their work and a weak interest shown by stake-holders and the local population became consider-able obstacles for them. Finally we outline the po-tential of the LDC as a concept for participatory planning of municipal recreation areas as well as recommendations for further projects of participa-tory landscape planning.
References
Bolliger, P., Charollais, M. & Condrau, V. (2002). Werkzeug-kasten LEK [Tool kit LDC]. Rapperswil, Lausanne.
Bundesamt für Raumplanung (BfR) (1996). Grundzüge der Raumordnung Schweiz [Principles of spatial planning in Switzerland]. Bern.
Bundesamt für Umwelt, Wald und Landschaft (BUWAL) (1998). Landschaftskonzept Schweiz [Landscape Concept Switzerland]. Bern.
Winter, D. (2000). Landschaftsentwicklungskonzept (LEK) – ein neuer Stern am Planungshimmel [The Landscape Development Concept (LDC) – a new star on the plan-ning horizon]. In: DISP (143), p 39-45.

Siegrist, D., Clivaz, C., Hunziker, M. & Iten, S. (eds.) (2006). Exploring the Nature of Management. Proceedings of the Third International Conference on Monitoring and Management of Visitor Flows in Recreational and Protected Areas.
University of Applied Sciences Rapperswil, Switzerland, 13-17 September 2006. Rapperswil.
448
Researches on the Visitor’s Activities and the Barrier Status around Kairakuen Park
Teppei Ishiuchi, Takekazu Koyanagi & Yuji Kuwahara
Ibaraki University, Japan
[email protected]@[email protected]
Keywords: Tourism, visitor’s activities, Kairakuen Park, barrier-free.
Introduction
The Ministry of Land, Infrastructure and Trans-port developed a model project in 2003 to help community-based people work together to cre-ate advanced space for sightseeing and exchang-es with the help of measures and companies in-volved in the hardware and software business. The model project that was named “Creating Space for Sightseeing and Exchanges” designat-ed eight regions as the place to put the project into operation as part of its activities. In one of the eight designated areas, “Conference to pro-mote the collaborative project for Hitachi and Fusa” that covers an extensive area astride Ibara-ki and Chiba Prefectures made a step forward to promote the tourism business. The conference conducted survey on sightseeing resources in the middle and north parts of Ibaraki Prefecture and found that Kairakuen Park is the core of the sightseeing resources and an important sightsee-ing spot of the region. That is, improved charm of space in Kairakuen Park will result in activat-ing tourism that is closely related to the region-al resources.
At the same time, Agency of Cultural Affairs has been focusing on measures to utilize cultural as-sets in present-day Japan since it implemented a special project for the utilization of historical sites in 1989. The public in general strongly re-quires measures for a barrier-free environment in the move to construct a welfare society. Cultural assets are not an exception, and the move to uti-lize historical sites also needs barrier-free mea-
sures. In June 1994, the law to facilitate the con-struction of specific buildings easily accessible by elderly and physically handicapped people (Heart Building Law) was put into effect. This law is designed to promote quality of buildings and enhance public welfare for the purpose of fa-cilitating the construction of buildings that the elderly people who have some limit on their daily and social life, the physically-handicapped peo-ple and those who have some limit on their daily and social life can use without difficulty. In No-vember 2000, the Heart Building Law was fol-lowed by Barrier-Free Transportation Law that is a law to facilitate the movement of elderly and physically handicapped people by public means of transport without difficulty.
Barrier-free measures are not necessarily enacted well at historical sites and sightseeing spots de-spite the implementation of the above laws and other ordinances. In these social circumstances, Okamoto et al. drew a map of the barrier-free sta-tus in Kairakuen Park in “Research on Barrier-Evaluation Method for Wheelchair Users around Kairakuen Park.”
In this research, we conducted a questionnaire survey on the utilization at Kairakuen Park and clarified the routes frequently used by visitors to know well about characteristics and value of Kai-rakuen Park. Besides being an important sight-seeing resource in Ibaraki Prefecture, many peo-ple visit Kairakuen Park in occasions other than during the Plum Festival as a recreational space. It is our belief that this research will contribute

Poster Session
449
to the effective improvement of barrier-free mea-sures in Kairakuen Park and reduce barriers that handicapped people feel with the limited budget.
Methods
This research aims to clarify the current status of Kairakuen Park in Mito in Ibaraki Prefecture that is one of the three most famous Japanese gardens across the country and the place of recreation and relaxation for Mito citizens, and to explore the way to have it used equally by healthy people and wheelchair users.
We first conducted a survey on how Kairakuen Park is used by healthy people and found that it is used not only at the time of event but also on ordinary holidays. We also realized that it is used by people of various generations and from various places, loved by people regardless of age and sex, and attractive enough to induce people living out-side Ibaraki Prefecture to visit. Kairakuen Park is used by people for various objectives, and we con-cluded that it can satisfy lots of needs that people have in their minds.
Next, we conducted a survey on how visitors wan-der inside Kairakuen Park to know how it is used by them. Following this survey, we conducted a questionnaire survey for handicapped people to know whether or not they have visited a sightsee-ing spot so far and what they are concerned about during their visit to Kairakuen Park. This survey leads to our understanding that they are concerned most about the current barrier status.
In the last stage, we merged the barrier-free map drawn by Ibaraki University and data we obtained through the survey on the wandering behavior,
and drew the priority route map for barrier-free improvement. This map gives priority for elimi-nating barriers within the spots in Kairakuen Park where many people are wandering.
Figure 1 shows the methodology of our research.
About Kairakuen Park
Kairakuen is a Japanese garden located in Mito city of Ibaraki Prefecture. It is as famous as Korakuen in Okayama city and Kenrokuen in Kanazawa city, and these three Japanese gardens are called the three most famous Japanese gardens across the country. Kairakuen was constructed by the ninth generation in Mito clan of feudal lord Nariakira Tokugawa in July 1842. Nariakira crumbled Mt. Shichimen that faced Lake Senba and created a place where samu-rai who trained themselves at the Koudoukan hall to become both a good worrier and a good schol-ar could take a rest and mingle with people of the domain. He named this place Kairakuen. It was re-named Kairakuen Park when Kairakuen acquired the neighboring Senba Park in July 1999. Now it has a total area of 300 hectares, and it is world’s second largest park adjacent to the urban district, following the Central Park in New York.
Kairakuen main-park itself is about 13 hectares in area where 3,000 plum trees of 100 kinds are im-planted. It holds the Plum Festival from late Feb-ruary to late March every year and has about 1.3 million visitors annually. Besides being famous for plum trees, Kairakuen has lots of places of inter-est of each season. Visitors can enjoy cherry trees in spring, crimson Kirishima azaleas in early sum-mer, brilliant green mousou bamboos and Japanese cedar trees in midsummer, and lovely bush clovers and maple trees in autumn. They are moved by the impressive scenery that overlooks Lake Senba through these seasonal attractions. Moreover, plum trees of various kinds, such as “Tazunaki”, “Shou-jyou” and “Youchou” are implanted in the new park that expanded below Kairakuen Park. In ad-dition, the new park is studded with lawn fields of the four seasons and ponds where waterfowls play. Visitors can enjoy this vast area in a relaxed man-ner, and people of Mito city use it as a recreational place in their daily life without reservation.
Survey of utilization by healthy people
Questionnaire survey of handicapped people
Drawing the priority route map for barrier-free improvement
Survey of wandering behavior by healthy people
Figure 1: Research methodology.
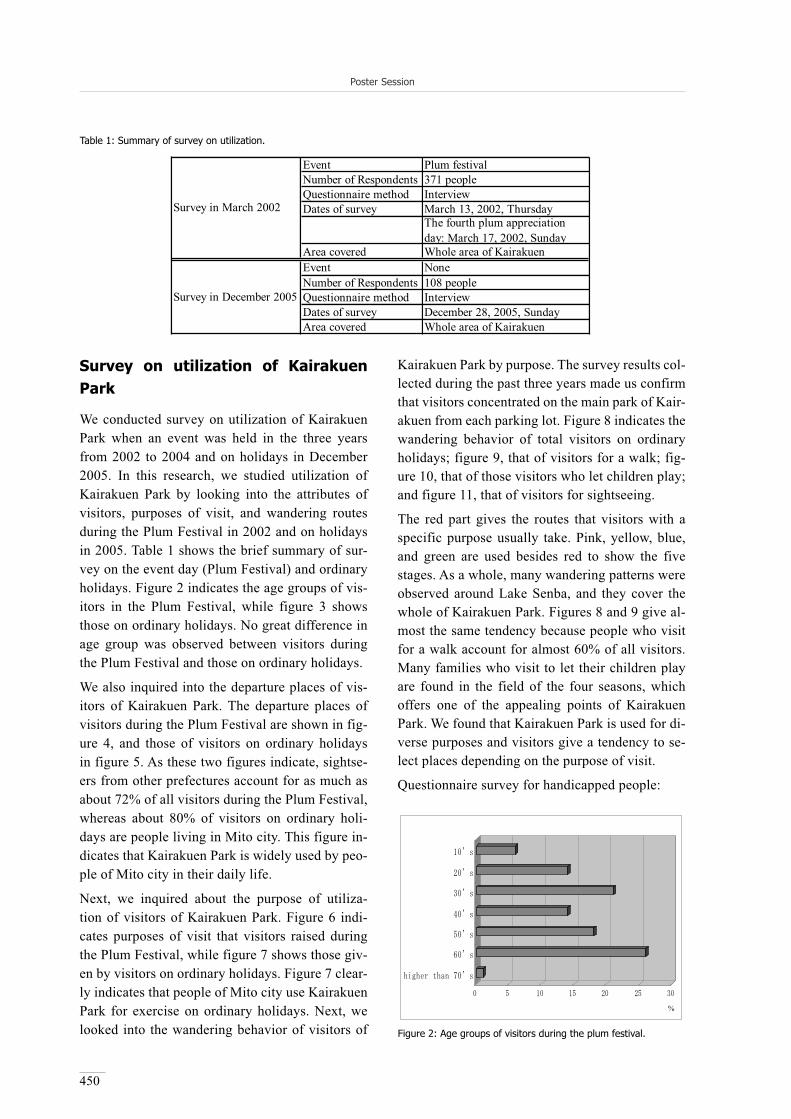
Poster Session
450
Survey on utilization of Kairakuen Park
We conducted survey on utilization of Kairakuen Park when an event was held in the three years from 2002 to 2004 and on holidays in December 2005. In this research, we studied utilization of Kairakuen Park by looking into the attributes of visitors, purposes of visit, and wandering routes during the Plum Festival in 2002 and on holidays in 2005. Table 1 shows the brief summary of sur-vey on the event day (Plum Festival) and ordinary holidays. Figure 2 indicates the age groups of vis-itors in the Plum Festival, while figure 3 shows those on ordinary holidays. No great difference in age group was observed between visitors during the Plum Festival and those on ordinary holidays.
We also inquired into the departure places of vis-itors of Kairakuen Park. The departure places of visitors during the Plum Festival are shown in fig-ure 4, and those of visitors on ordinary holidays in figure 5. As these two figures indicate, sightse-ers from other prefectures account for as much as about 72% of all visitors during the Plum Festival, whereas about 80% of visitors on ordinary holi-days are people living in Mito city. This figure in-dicates that Kairakuen Park is widely used by peo-ple of Mito city in their daily life.
Next, we inquired about the purpose of utiliza-tion of visitors of Kairakuen Park. Figure 6 indi-cates purposes of visit that visitors raised during the Plum Festival, while figure 7 shows those giv-en by visitors on ordinary holidays. Figure 7 clear-ly indicates that people of Mito city use Kairakuen Park for exercise on ordinary holidays. Next, we looked into the wandering behavior of visitors of
Kairakuen Park by purpose. The survey results col-lected during the past three years made us confirm that visitors concentrated on the main park of Kair-akuen from each parking lot. Figure 8 indicates the wandering behavior of total visitors on ordinary holidays; figure 9, that of visitors for a walk; fig-ure 10, that of those visitors who let children play; and figure 11, that of visitors for sightseeing.
The red part gives the routes that visitors with a specific purpose usually take. Pink, yellow, blue, and green are used besides red to show the five stages. As a whole, many wandering patterns were observed around Lake Senba, and they cover the whole of Kairakuen Park. Figures 8 and 9 give al-most the same tendency because people who visit for a walk account for almost 60% of all visitors. Many families who visit to let their children play are found in the field of the four seasons, which offers one of the appealing points of Kairakuen Park. We found that Kairakuen Park is used for di-verse purposes and visitors give a tendency to se-lect places depending on the purpose of visit.
Questionnaire survey for handicapped people:
%
Figure 2: Age groups of visitors during the plum festival.
Event Plum festivalNumber of Respondents 371 peopleQuestionnaire method InterviewDates of survey March 13, 2002, Thursday
The fourth plum appreciationday: March 17, 2002, Sunday
Area covered Whole area of KairakuenEvent NoneNumber of Respondents 108 peopleQuestionnaire method InterviewDates of survey December 28, 2005, SundayArea covered Whole area of Kairakuen
Survey in March 2002
Survey in December 2005
Table 1: Summary of survey on utilization.

Poster Session
451
%
Figure 7: Purposes of visit on ordinary holidays.
%
Figure 3: Age groups of visitors in ordinary holidays.
%
Figure 4: Hometowns of visitors during the Plum Festival.
%
Figure 5: Hometowns of visitors on ordinary holidays.
%
Figure 6: Purposes of visit during the Plum Festival.

Poster Session
452
45.8%. In terms of attributes of handicap, about 59.5% of respondents were wheelchair users. Ev-ery respondent was orthopedically impaired.
Figure 12 shows the results of the question about whether or not they visited a sightseeing spot, and figure 13 indicates the interest that they got in the sightseeing spot they visited. We learned that 55% of handicapped people had never visited a sight-seeing spot. This is presumably because they have limited field of activities and because measures for
We conducted a questionnaire survey for people suffering from handicaps in orthopedics, hearing, or vision to know whether they had been to sight-seeing spots and what they required of the sight-seeing spots they visited. People subject to the survey were those who are active in handicapped facilities. We sent the questionnaire survey to them through the facility managers and got the survey back to us. Because we received 55 copies out of 120 copies that were sent, the collection rate was
Lake Senba
Kairakuen
Shiki-no-hara
Figure 8: Wandering behavior (total).
Lake Senba
Kairakuen
Shiki-no-hara
Figure 9: Wandering behavior (for walking).
Shiki-no-hara
Lake Senba
Kairakuen
Figure 10: Wandering behavior (to let children play).
Lake Senba
Kairakuen
Shiki-no-hara
Figure 11: Wandering behavior (for sightseeing).
Figure 12: Existence of experience which visited the tourist resort.
Figure 13: The item of interest of a tourist resort.

Poster Session
453
barrier-free are not adequately enacted. We also learned that handicapped people who had ever vis-ited a sightseeing spot gave higher priority to the current barrier status than to the history and scen-ery of the sightseeing spot they visit, showing they are interested in barrier-free most.
Barrier survey in Kairakuen ParkIn this research, we refer to the barrier map of Kai-rakuen Park drawn through the research by Oka-moto et al. Table 2 shows the brief summary of the barrier survey.Kairakuen Park developed its own “Method to judge the difficulty level of routes of the Ibaraki University type” with reference to the difficulty levels set up by Tokyo Metropolis (table 3). Figure 14 shows the barrier map of Kairakuen Park that it drew using the above method. This bar-rier map is put on the website of department of park administration of civil engineering division of Ibaraki Prefecture. (http://www.pref.ibaraki.jp/bu-kyoku/doboku/01class/class11/index.html.)
Figure 14 indicates that there are various difficul-ty levels of barriers inside Kairakuen Park. More-over, lots of barriers exist in Kairakuen main-park that makes rather hard for handicapped people to
wander. When we examined the entire Kairakuen Park, we found that most barriers are in the diffi-culty levels of A and B (filled in blue and green). In addition, there seem lots of routes that allow hand-icapped people walk without support, and only a few barriers exist. In reality, however, there are lots of small-scale barriers that prevent walking without support. This prevents handicapped peo-ple from wandering in Kairakuen Park.
Proposal for improvement of the bar-rier-free status in Kairakuen ParkIn this research, we wish to propose that an order of priority should be established for the improvement of the barrier-free status inside Kairakuen Park to organize a barrier-free environment efficiently with the limited budget. The priority of each route was decided with reference to the wandering behavior on ordinary holidays (figure 8) that was drawn on the basis of the utilization survey and the barrier-free map (figure 14). We gave the highest priority to the red points in figure 8 that are equivalent to the points with the difficulty levels from C to F in figure 14, and gave the next highest priority to the points in pink that are equivalent to the points with the difficulty levels from C to F in figure 14. Table 4 shows the level of importance of each route, on which the order of priority of barrier-free improve-ment in Kairakuen Park is based as indicated in fig-ure 15.
Date of survey October 29,2003Place of survey Inside Kairakuen Park
No. of researchers3 wheelchair users, 3 caretakers, 20students of Ibaraki University, 2 Ibarakiprefectural staffs, 1 park administrative
Method of survey Field survey using questionnaire sheets
Table 2: Brief summary of barrier survey.
DifficultyLevel Life Support Mito and Ibaraki University
A No difficultyB Possible to get around by oneself
CPossible to get around either if able to
control a wheel-chair well or if have ahelper with oneself in case of a senior
D
Must have a helper with oneself ( theheight of a step being within 10-15cm, inwhich case the front wheels can go beyondit while the back wheels can't)
E
Impossible to get around (possible whenhaving two helpers to lift the wheel-chair)Stairs having a few steps or step being
more than 15cm high
F
Impossible to get around (possible whenhaving more than three helpers, or totallyimpossible)Stairs having more than three steps
Table 3: The Difficulty Level Evaluation Method for Route ‘pass’ ability (created by Ibaraki University).
Barrier-free map of Kairakuen Park
Figure 14: Barrier-free map of Kairakuen Park.
Wanderingbehavior
Difficulty level inbarrier map (C-F)
Priority ofimprovemen
Map ofimprovement
Red Not-appliedPink Not-appliedYellow AppliedBlue AppliedGreen Applied
Table 4: Order of priority of barrier-free improvement.

Poster Session
454
It is most effective to improve the barrier-free sit-uation according to the order from red, blue, and to green to allow handicapped people to enjoy the same wandering behavior as healthy people do on ordinary holidays. The priority to improve barrier-free status in Kairakuen main-park is low because the number of healthy visitors is small from the point of view that it is used on ordinary holidays. Moreover, none of the red and pink routes that pro-vide lots of wandering behavior in figure 8 prevents handicapped people from wandering without sup-port. In addition, the red route has two points that need improvement, and the blue route has three such points. It is necessary to work out a method of improvement, but we think that this situation can be improved without delay.
Results
In this research, we studied the utilization status, purposes of usage, and wandering behavior of vis-itors of Kairakuen Park in association with the im-provement of sightseeing resources. From the ques-tionnaire survey given to handicapped people, we
learned what interested them in sightseeing spots. And we drew a map to show the order of priority to improve the barrier-free status using the wan-dering routes made clear by the utilization survey and the barrier-free map of Kairakuen Park. In the future, effective improvement is strongly sought in light of the current situation that requires improve-ment with the limited budget.
For public relations of sightseeing in the future, demand grows stronger for transmission of infor-mation that goes particulars and satisfies the needs of Internet users because the Internet will be used more frequently. Everyone can download the bar-rier-free map drawn by Ibaraki University freely and share it with others without any restriction. We participated in the walking tour of Kairakuen Park with wheelchair users in March 2006. We en-joyed the tour following the route that we select-ed according to the barrier-free map published by Ibaraki University we carried in our hands. Judg-ing from the reality that information truly required by users is invariably used, we think that detailed information on route by purpose of visit and by uti-lization of visitors is in great demand.
Figure 15: Route map of priority of barrier-free improvement.

Poster Session
455
In this research, the priority of improvement of the barrier-free status is based on the data obtained from wandering behavior on ordinary holidays. This is because Kairakuen Park aims to be a park that enables handicapped people to enjoy through-out the year by placing emphasis on its charac-teristics that offer visitors opportunities to enjoy scenery of the four seasons. We are planning to re-spond to the requirements of handicapped sightse-ers from a long distance by drawing a route map with the improvement priority of the barrier-free status drawn on the basis of the wandering behav-ior when an event is held like the Plum Festival that symbolizes Kairakuen Park most.
It is our belief that the priority map to improve the barrier-free status drawn in the course of this re-search will be used to improve Kairakuen Park and promote the utilization of handicapped peo-ple. This promotes the tourism business and acti-vates the regional industry, and ultimately makes Kairakuen Park loved more by local residents and sightseers whether or not they are handicapped.
References
Akira, O. (2004). Research on the Barrier-Evaluation meth-od for wheelchair users around Kairakuen Park. 25th Asian Conference on Remote Sensing, p 1626-1631. Ibaraki.

Siegrist, D., Clivaz, C., Hunziker, M. & Iten, S. (eds.) (2006). Exploring the Nature of Management. Proceedings of the Third International Conference on Monitoring and Management of Visitor Flows in Recreational and Protected Areas.
University of Applied Sciences Rapperswil, Switzerland, 13-17 September 2006. Rapperswil.
456
Visitor Monitoring of Eight Recreational and Protected Areas
Tomm Jensen
Nordland County Council, Norway
Keywords: Outdoor recreational activities, national parks and protected areas, monitoring movements.
Introduction
The primary objective of the project is to pro-vide answers on if, where applicable, and how the use of an area changes when it is award-ed national park status, increased focus and at-tention. The project can also, as a side effect, provide knowledge and understanding of how various information, administrative and organi-sational strategies affect the use of, and level of attention paid to, our national parks.
The project can quantify the use of differing types of open-air recreational areas and help to clarify the usefulness of organisational initia-tives in relation to the number of users.
The project is part of a more comprehensive co-operation with The Nordland Research Insti-tute.
Four new national parks are under establishment in Nordland. One of the objections to the estab-lishment of the parks is that public use of the ar-eas will increase and thus threaten that which one wishes to preserve. This claim has not been verified. The main of objective of the project is thus to increase our level of knowledge on how the establishment of national parks affects the use of these national park areas (and organised and adapted leisure areas) in thinly populated counties such as Nordland.
Methods
Pressure pads that were developed in Scotland are employed. The pressure pads are buried at a depth of 6-7 cm in pathways and covered with earth/gravel from the area immediately adja-cent. The pressure pads are connected to a con-
cealed data pod. Both the pad and the pod are concealed under the surface. Data is transferred to a computer once per year. Each footstep on the pad results in a registration or “hit”. The date and time of the hit is registered simultane-ously. The registration period is from June 1st to October 31st.
The pressure pads are laid in recreational ar-eas in the vicinity of populated areas, previous-ly established national parks, newly established national parks and national parks under estab-lishment. This pattern is designed to allow us to isolate the impact of national park status on the use of walking/hiking areas, and any changes in the impact of national park status over time.
Any increase in the level of interest in the area is monitored via Internet searches, searches in news media and similar. Registrations will cov-er a period of between 4 and 7 years in order to negate any incidental seasonal variations.
Expected results
On the basis of our general experience, we expect to see an increase in recreational use of areas that are established as national parks. The methodical layout will also illustrate the impact of any change in status, changes due to improved organisation/physical changes, and increased focus on the area.
The results are affected by a number of change fac-tors simultaneously. Time series are entered in ad-vance of the establishment and a three to four year period subsequent to this. This provides, togeth-er with the choice of areas studied, the possibility to make corrections for the impact of the various change factors.
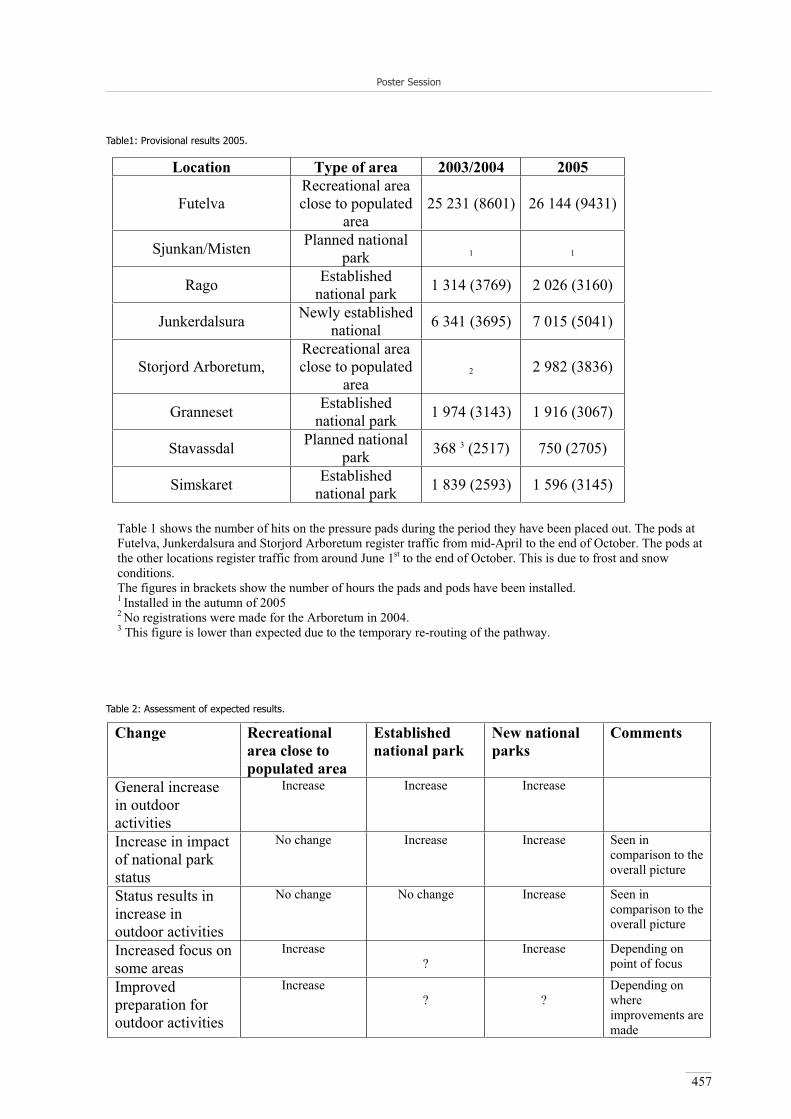
Poster Session
457
Location Type of area 2003/2004 2005
FutelvaRecreational area close to populated
area25 231 (8601) 26 144 (9431)
Sjunkan/Misten Planned national park 1 1
Rago Establishednational park 1 314 (3769) 2 026 (3160)
Junkerdalsura Newly established national 6 341 (3695) 7 015 (5041)
Storjord Arboretum, Recreational area close to populated
area2 2 982 (3836)
Granneset Establishednational park 1 974 (3143) 1 916 (3067)
Stavassdal Planned national park 368 3 (2517) 750 (2705)
Simskaret Establishednational park 1 839 (2593) 1 596 (3145)
Table 1 shows the number of hits on the pressure pads during the period they have been placed out. The pods at Futelva, Junkerdalsura and Storjord Arboretum register traffic from mid-April to the end of October. The pods at the other locations register traffic from around June 1st to the end of October. This is due to frost and snow conditions.The figures in brackets show the number of hours the pads and pods have been installed. 1 Installed in the autumn of 2005 2 No registrations were made for the Arboretum in 2004. 3 This figure is lower than expected due to the temporary re-routing of the pathway.
Table1: Provisional results 2005.
pChange Recreational
area close to populated area
Established national park
New national parks
Comments
General increase in outdoor activities
Increase Increase Increase
Increase in impact of national park status
No change Increase Increase Seen in comparison to the overall picture
Status results in increase in outdoor activities
No change No change Increase Seen in comparison to the overall picture
Increased focus on some areas
Increase ?
Increase Depending on point of focus
Improved preparation for outdoor activities
Increase ? ?
Depending on where improvements are made
Table 2: Assessment of expected results.

Siegrist, D., Clivaz, C., Hunziker, M. & Iten, S. (eds.) (2006). Exploring the Nature of Management. Proceedings of the Third International Conference on Monitoring and Management of Visitor Flows in Recreational and Protected Areas.
University of Applied Sciences Rapperswil, Switzerland, 13-17 September 2006. Rapperswil.
458
Are There Too Many Visitors in National Parks? A Campsite Analysis in Two Finnish National Parks
Katja Kangas1, Pirkko Siikamäki2, Pilvi Koivuniemi3, Pekka Sulkava4,Anne Tolvanen5 & Yrjö Norokorpi4
1University of Oulu, Finland [email protected]
2Oulanka Research Station, [email protected]
3University of Jyväskylä, [email protected]
4Metsähallitus, [email protected]@metsa.fi
5Finnish Forest Research Institute, [email protected]
Keywords: Tourism, campsite, trampling, vegetation change, national park.
Introduction
Nature-tourism is one of the fastest growing indus-tries and often concentrates on pristine environ-ments like national parks. As the amount of visi-tors increase, nature is exposed to more extensive wear, which may threaten the conservational val-ue, as well as the recreational value of these areas if the change is not under control.
The major and visible impact of recreation is me-chanical trampling of vegetation. Ecological changes are inevitable even after short-term tram-pling (Tolvanen et al. 2001, 2004). Due to tram-pling the original species are often replaced by more tolerant species and moreover, alien species can be carried along by visitors and pose a threat to native vegetation. In Finland many National Parks are concentrated in north, where environmental factors set limitations to the recovery of the veg-etation after disturbance. It is important to identify sensitive environments and species when planning new trails and campsites. Monitoring techniques for campsites have been developed particularly in North America (Cole 1989, Hammit & Cole 1998).
Also in Finland a few studies have been made con-cerning the impacts of recreation on vegetation in campsites (e.g. Rautio et al. 2001). Yet, there is a need for more detailed studies in a variety of envi-ronments for developing a reliable and cost-effec-tive technique for campsite monitoring in Finnish National Parks.
We studied the effects of increasing tourism on the vegetation at campsites in two National Parks in Northern Finland; Pallas-Ylläs NP (summer 2003) and Oulanka NP (summers 2005-2006). The main focus was in the following questions: What is the size of the areas with visible changes in vegeta-tion? How do the number of visitors, campsites age, vegetation type, number of trails in the camp-site and distance between campsite structures af-fect quantity of changes?
Methods
We surveyed 39 campsites with varying structures. Wilderness huts, campfire sites, lean-to shelters and Lapp pole tents situated along trails were con-sidered as campsites. From campsites areas with

Poster Session
459
visible changes in vegetation were measured and separated into two zones; (I) zone with destroyed vegetation cover and (II) zone with continuous vegetation cover but clearly affected by trampling. From each campsite two main structures (e.g. campfire site, wilderness hut) were chosen as mid-points. From each point transect lines were direct-ed to each cardinal and half-cardinal points. From transects the species composition and percentage of vegetation coverage was estimated in different zones with 50x50 cm square frames and compared to undisturbed areas. Visitor numbers were esti-mated with electronic counters, guest books and questionnaires.
Results
The visitor number and vegetation type had a sig-nificant impact on the size of the area disturbed. Moreover, the size was relative to distance between wilderness huts and campfire sites. The most sen-sitive vegetation types were mountain heaths and dry pine forests. Trampling tolerance of vegetation types was mainly explained by vegetation compo-sition. Dwarf shrubs were sensitive to trampling and disappeared quickly from the intensively used areas, whereas graminoids were more tolerant. Among mosses and herbs there were both sensi-tive forest species and tolerant secondary species. In all campsites there were species, which have been carried along by hikers and were alien to the original biotope.
In future, the areas affected by trampling in camp-sites of national parks should be measured regu-larly. Also the alien species in campsites should be monitored and removal of aggressive invasive species should be considered. When planning new campsites the most sensitive biotopes should be avoided. The size of the disturbed area can be af-fected by careful planning of the locations of struc-tures. The buildings should be constructed closer to each other or campsites can be established on al-ready trampled areas like hiking trails.
References
Cole, D.N. (1989). Area of vegetation loss: a new index of campsite impact. In: Research note INT-389 US De-partment of agriculture. Ogden.
Hammit, W.E. & Cole, D.H. (1998). Wildlife recreation: ecology and management. New York.
Rautio, J., Helenius, M. & Saarinen, J. (2001). Urho Kek-kosen Kansallispuiston kuluneisuus:
luontomatkailun ympäristövaikutusten seuranta ja mitta-aminen. In: Järviluoma, J. &
Saarinen, J. (toim.) Luonnon matkailu- ja virkistykäyttö tut-kimuskohteena. Metsäntutkimuslaitoksen tiedonanto-ja (796) p 111-124.
Tolvanen, A., Forbes, B., Rytkönen, K. & Laine, K. (2001). Regeneration of dominant plants after short-term pe-destrian trampling in sub-arctic plant communities. In: Man and the biosphere series: Nordic mountain birch ecosystems, p 361-370.
Tolvanen, A., Rämet, J., Siikamäki, P., Törn, A. & Orell, M. (2004). Research on ecological and social sustainabil-ity of nature tourism in northern Finland. In: Sievän-en, T., Erkkonen, J.,Jokimäki, J., Saarinen, J., Tuulen-tie, S. & Virtanen, E. (ed.) (2004). Policies, Methods and Tools for Visitor Management. Proceedings of the Second International Conference on Monitoring and Management of Visitor Flows in Recreational and Protected Areas, June 16- 20, 2004, Rovaniemi, Fin-land.

Siegrist, D., Clivaz, C., Hunziker, M. & Iten, S. (eds.) (2006). Exploring the Nature of Management. Proceedings of the Third International Conference on Monitoring and Management of Visitor Flows in Recreational and Protected Areas.
University of Applied Sciences Rapperswil, Switzerland, 13-17 September 2006. Rapperswil.
460
Linking Forestry and People in an Urban Landscape, a Participatory Approach - Case Studies from West London
Rekha Kharel-Sharma
Brunel University, UK
Keywords: Sustainable urban forestry, ethnic minorities, environmental justice, participatory approach.
The role of high quality green spaces has won a significant place in the London sustainable de-velopment agenda as to ensure all Londoners are within the walking distance of a quality nature. To achieve the goal of sustainable living, each and every part of the society needs to be aware about their role, rights and responsibilities and come for-ward to take partnership with an increased sense of ownership in the development and enhancement of urban-green space. That also includes the involve-ment of ethnic minorities, poor and disadvantaged groups. However, ensuring environmental partici-pation of a range of social group including ethnic minorities into the use and enhancement of green space is always challenging to fulfil. The impor-tance of ethnic minorities’ participation to acquire a quality of life has long since been forgotten and neglected. The main goal of the research is to ex-plore issues related with Urban Forestry (UF) in all the parts of local life including environment, eco-nomic & social issues in LB of Hounslow (LBH). The study also aims to examine the inequality is-sues that may be deeply embedded in the society in the use of urban green space. It also address-es ethnic minorities’ environmental participa-tion with regards to their involvement in the use and enhancement of urban green space exploring new challenge and demand using participatory ap-proach. Both qualitative such as focus group dis-cussion (FGD), key informants surveys (KIS) & direct observation (DO); and quantitative research methods including GIS interpretation tools will be used to identify any gaps and to recommend for the future UF strategy with an achievable and quantifi-able programs to the benefit of all kind of residents
in LBH. This will then form a basis for examin-ing and improving upon existing policy and iden-tifying key area to develop a just and sustainable UF models in the future. The paper is an attempt to present an overview of participatory action re-search (PAR) which is on-going at this stage.
References
Collonson, N. (2005). Space for People: Targeting Action for Woodland Access. In: Quarterly Journal of Forest-ry (99/4), p 296-302.
Department of the Environment, Transport and the Regions. (2000). Our Towns and Cities; the Future, Delivering an Urban Renaissance.
Sustainable Development Resource network (SDRN)/DE-FRA). (2004). Environment and Social Justice: Rapid Resource and Evidence Review.
United Nations Environment Program. (1992). The Con-vention on Biological Diversity (CBD).
Greater London Authority. (2002). The Mayer’s Biodiver-sity Strategy, Connecting with London’s Nature.

Siegrist, D., Clivaz, C., Hunziker, M. & Iten, S. (eds.) (2006). Exploring the Nature of Management. Proceedings of the Third International Conference on Monitoring and Management of Visitor Flows in Recreational and Protected Areas.
University of Applied Sciences Rapperswil, Switzerland, 13-17 September 2006. Rapperswil.
461
Visitor Management in a Floodplain Area near Zurich
Tobias J. Liechti, Thomas R. Burger & Stefan A. Zantop
creato, Switzerland
[email protected]@[email protected]
Keywords: Visitor information, visitor management, floodplain.
IntroductionWe present our approach to visitor flow manage-ment and visitor information in a newly recreat-ed floodplain area in Geroldswil and Dietikon near Zurich.
The area was recreated in 2004 as an ecological compensation for the renovation of the hydroelec-tric power plant Wettingen, operated by the Electric Power Company of the City of Zurich (ewz). The floodplain measures 900 m2 and is situated close to an old 2’000 m2 nature reserve area across the river Limmat. One year after construction, some sensitive bird species like the Little Ringed Plover (Charadrius dubius) have already bred in the new alluvial plain area. The floodplain has become a natural reserve. In 2005, the opposite riverside was recreated. New gravel isles and coves were built to revitalize the borderline.
However, on weekends, the number of visitors on the trails bordering the area rises to approximately 70/h, many of them walking their unleashed dogs. Although prohibited, people tend to enter the area
in summer, to go for a swim in the river or to have a picnic at the riverbank. Authorities had to take measures to manage the visitor flow and to protect the area from trespassing.
MethodsWe identified potential problems related to visitors and established protecting measures.
To manage visitor flow and inform the public about regulations for protection of the area the following actions were taken:
Structural measures (fencing off trails)
Placement of information boards
Informative articles in the local press
Surveillance service by student rangers
During surveillance, rangers journalized misdeeds and recorded and evaluated discussions with visi-tors and other observations.
ResultsThe mean number of visitors is 21/h on weekdays and 67/h on weekends. On weekends, 66% of all visitors are walkers. On weekdays 43% of all visi-tors are dog walkers. In summer, swimmers are nu-merous. Birdwatchers are infrequent.
Identified problems are (decreasing rel-evance)
Trespassing on the isle and gravel banks
Swimming in forbidden areas of the river
Free running dogs in protected zones
Entering protected zones.Figure 1: Investigation area near Zurich. Paths are marked in red, viewing platforms and hide as yellow points. The protected area is hatched.
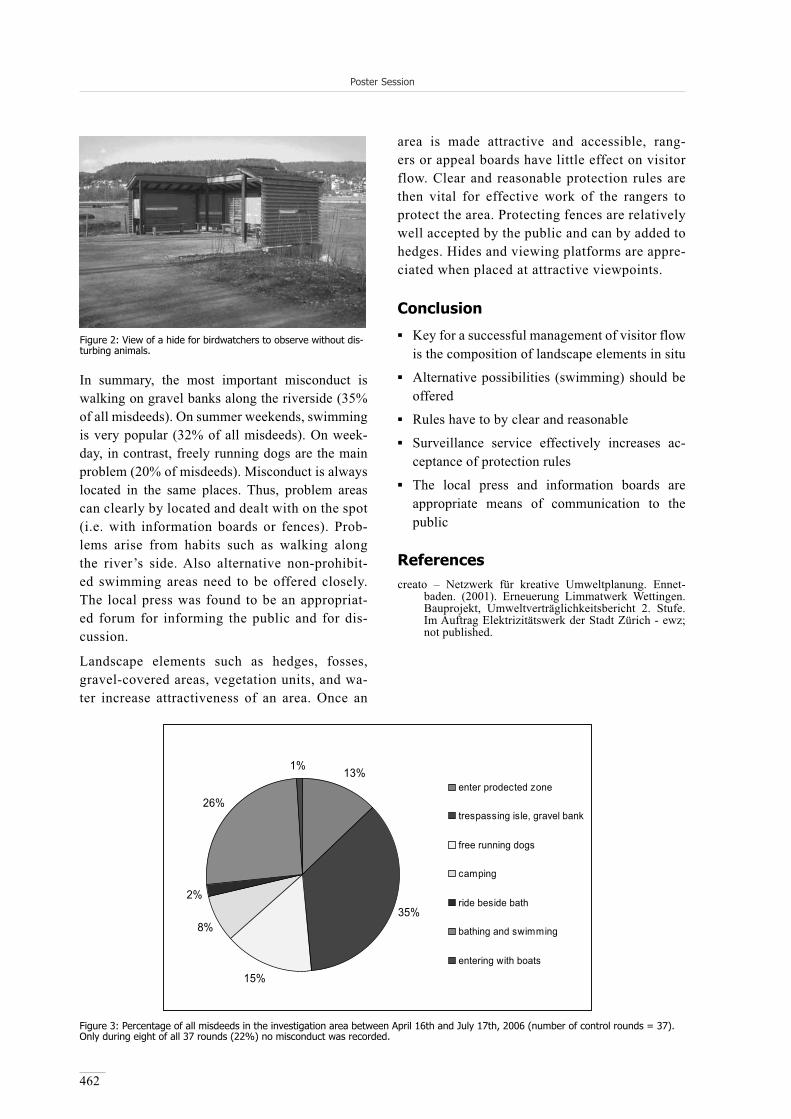
Poster Session
462
In summary, the most important misconduct is walking on gravel banks along the riverside (35% of all misdeeds). On summer weekends, swimming is very popular (32% of all misdeeds). On week-day, in contrast, freely running dogs are the main problem (20% of misdeeds). Misconduct is always located in the same places. Thus, problem areas can clearly by located and dealt with on the spot (i.e. with information boards or fences). Prob-lems arise from habits such as walking along the river’s side. Also alternative non-prohibit-ed swimming areas need to be offered closely. The local press was found to be an appropriat-ed forum for informing the public and for dis-cussion.
Landscape elements such as hedges, fosses, gravel-covered areas, vegetation units, and wa-ter increase attractiveness of an area. Once an
area is made attractive and accessible, rang-ers or appeal boards have little effect on visitor flow. Clear and reasonable protection rules are then vital for effective work of the rangers to protect the area. Protecting fences are relatively well accepted by the public and can by added to hedges. Hides and viewing platforms are appre-ciated when placed at attractive viewpoints.
Conclusion
Key for a successful management of visitor flow is the composition of landscape elements in situ
Alternative possibilities (swimming) should be offered
Rules have to by clear and reasonable
Surveillance service effectively increases ac-ceptance of protection rules
The local press and information boards are appropriate means of communication to the public
Referencescreato – Netzwerk für kreative Umweltplanung. Ennet-
baden. (2001). Erneuerung Limmatwerk Wettingen. Bauprojekt, Umweltverträglichkeitsbericht 2. Stufe. Im Auftrag Elektrizitätswerk der Stadt Zürich - ewz; not published.
Figure 2: View of a hide for birdwatchers to observe without dis-turbing animals.
13%
35%
15%
8%
2%
26%
1%
enter prodected zone
trespassing isle, gravel bank
free running dogs
camping
ride beside bath
bathing and swimming
entering with boats
Figure 3: Percentage of all misdeeds in the investigation area between April 16th and July 17th, 2006 (number of control rounds = 37). Only during eight of all 37 rounds (22%) no misconduct was recorded.

Siegrist, D., Clivaz, C., Hunziker, M. & Iten, S. (eds.) (2006). Exploring the Nature of Management. Proceedings of the Third International Conference on Monitoring and Management of Visitor Flows in Recreational and Protected Areas.
University of Applied Sciences Rapperswil, Switzerland, 13-17 September 2006. Rapperswil.
463
Prognosis on the Expected Landscape Changes in Mueritz National Park (Germany) and Landscape Perception of both
Residents and Tourists
Gerd Lupp
Albert Ludwigs-University Freiburg, Germany
Key words: National Park, landscape perception, predicting landscape changes.
Introduction
Mueritz National Park is situated in the north east of Germany, half way between the cities of Ber-lin and Rostock. At present, over 70% of the area is covered by trees, with a large number of lakes located scattered throughout the huge forests. The national park also hosts peatlands, meadows, fields and a couple of small villages.
The national park authorities plan a variety of ac-tions that will have effects on the landscape. Cur-rently it is dominated by vast pine forests shaped by intensive silviculture. Agriculture and forestry will be reduced, drainage measures and water pumps will be shut down and the peatlands restored. In the surrounding areas, socio-economic changes are on the way. Employment in traditional sectors dimin-ishes, while tourism is set to increase and become one of the main economic factors in the region.
Given these management plans, changes to the landscape in the coming years are unavoidable. However, impacts of these plans on the scenery have not yet been analysed in any detail. Nor has any study of the preferences of either visitors or residents for a certain type of scenery ever been undertaken.
Research questions
Which sceneries in Mueritz National Park are considered the most attractive by tourists and residents?
What changes in landscape can be expected in the coming years?
Aims
The objective is to determine the kinds of scenery with which the visitor will be confronted in the fu-ture. The analysis of both the tourists’ and the res-idents’ perception of the landscape will provide a framework for the park authority to identify scenic attractiveness of the National Park. By bringing to-gether these two steps, the national park authorities will be able to identify potential conflict areas and initiate dialogue with the stakeholders.
Methods
Different steps will be employed, each adapted to meeting the needs of the various aspects contained within the study. These include:
1. Present state and management objectives de-scribed in the national park plan (Nationalparkplan 2003)
using Forest Inventory data from 1999,
analysing agricultural land based on the method described in Strobel and Pulkenat (1995).
2. Prognosis
using Delphi-method for the agricultural land
simulating forest growth with “SILVA 2.2”, de-veloped at the Institute for Forest Growth at Munich University
3. Analysis of scenic preferences and their percep-tion by interviewing passing persons at 5 different spots inside the park. Landscape preferences are identified in three different ways:
general impression

Poster Session
464
on-site scenery
using photographs
First results
Over 70% of the national park area is covered by forests. Such large proportions of woodland are of-ten sceptically perceived (e.g. Arbeitskreis Forst-liche Landespflege 1991). The few existing open spaces inside the park often represent a richly structured, traditionally maintained cultural land-scape with a great deal of local variation. Although this type of scenery does not really fit in with the goals of a national park, landscape planning theory claims these open places to be ‘very precious’ and an important component of landscape aesthetics.
According to an analysis carried out in 1993 and 1994 (Strobel & Pulkenat 1995), many of the open spaces within the national park still exist and are kept open.
The research work carried out in the summer of 2005 focused on landscape perception. People en-countered on the hiking and bicycle trails were in-terviewed, as were tourists canoeing on the Riv-er Havel. First results indicate visitors’ preferences for lakes. Peatland is also favoured by many, but is also disliked by some. The most unpopular fea-ture are the man-made pine forests. The visitors’ means of discovering nature are also interesting. The majority want to discover nature by bike. Ca-noeing, on the other hand, is most popular amongst the well educated, young visitors.
First conclusions and Outlook
The first results of the comparison of the landscape analysis of 2004 with that of 1993/1994 reveal that the maintained meadows play an important role from an aesthetics perspective. Apart from their own intrinsic aesthetic value they also facilitate open views of the lakes, which are the most pre-ferred landscape feature. Peatland may also play a more important role, as those who have seen it of-ten found it very attractive.
Broadleaf forests with beech are considered quite interesting, much more so than the pine stands.
In 2006, research work will focus on simulation with SILVA 2.2 and Delphi interviews.
Acknowledgments
The author would like to thank Jost Reinhold Foun-dation for their financial support and the Institute for Forest Growth at Munich University for SIL-VA 2.2.
References
Arbeitskreis Forstliche Landespflege. (1991). Waldland-schaftspflege. Ecomed. Landsberg
Nationalparkamt Mueritz. (2003). Nationalparkplan
Strobel & Pulkenat. (1995). Landschaftsbild im Müritz-Na-tionalpark – Gutachten des Nationalparkamtes Meck-lenburg-Vorpommern (unpublished).

Siegrist, D., Clivaz, C., Hunziker, M. & Iten, S. (eds.) (2006). Exploring the Nature of Management. Proceedings of the Third International Conference on Monitoring and Management of Visitor Flows in Recreational and Protected Areas.
University of Applied Sciences Rapperswil, Switzerland, 13-17 September 2006. Rapperswil.
465
Does Survey Mode Affect Study Results? A Comparison of Internet-Based and Onsite Surveys of Visitors to Prince William
Forest Park, USA
Aurora Moldovanyi, Brett C. Kiser & Steven R. Lawson
Virginia Polytechnic Institute and State University, USA
[email protected]@vt.edu
Keywords: Internet-based surveys; survey methodology; visitor use management; national parks; Prince William Forest Park.
Introduction
Survey research is a primary tool for national parks and related protected areas to collect information about park visitation patterns, visitor and trip char-acteristics, and visitor attitudes concerning park management. Traditionally, these studies are ad-ministered using onsite and/or mail surveys to col-lect information from visitors. With the increasing availability to the public of the internet and the rel-atively low cost of administering internet-based questionnaires, it is possible that internet surveys could play an important role in conducting future visitor use studies. The purpose of this study is to assess the utility of internet-based survey meth-ods for studies of visitors to national parks. To do this, a study was conducted at Prince William For-est Park to test whether independent samples of in-ternet and onsite survey respondents from the same visitor population yield similar study results.
Methods
Sampling was conducted on six weekend days during October, 2005. Visitors were intercepted as they were exiting the park and asked screening questions to determine whether they were eligible for the study. Eligible visitors who were willing to participate in the study were randomly assigned to complete a questionnaire onsite or an identical questionnaire on the internet at a later time. Con-tact information, including an email address was collected from individuals participating in the in-
ternet-based survey. The internet-based survey was administered using a modified Dillman approach, including an initial email and three follow-up emails containing a link to the online survey. Study participants assigned to the onsite survey complet-ed the questionnaire at a pullout near the entrance/exit station where they had been intercepted.
Results
Response rates for the onsite and internet surveys were 71.4% and 75.2%, respectively. Results of statistical tests suggest that there are no significant differences between the internet and onsite sam-ples with respect to age, sex, race, education, and state of residence. These results suggest that the in-ternet and onsite survey participants represent two independent samples from the same population of Prince William Forest Park visitors.
For the most part, there were no statistically sig-nificant differences in the distribution and cen-tral tendency of responses to questions concerning visitors’ trip characteristics, attitudes toward park management, and preferences for facilities, ser-vices and programs between the internet and on-site samples. Nonetheless, some differences were observed. For instance, internet respondents were more likely than onsite respondents to report be-ing a day use visitor and having visited an unpaved road in the park, while onsite respondents were more likely to report camping in an RV and driv-ing for pleasure in the park. Significant differenc-
Poster Session
466
es between internet and onsite results were also observed for some questions concerning the im-portance of trip motivations. Significant differ-ences were also observed on the importance of some aspects of park programs, facilities and services; however, there were no differences in reported satisfaction associated with any of the park programs, facilities and services included in the questionnaire. In questions where it was an option, onsite respondents were more likely to choose a ‘don’t know/not sure’ response than in-ternet respondents.
Discussion
While internet-based surveys may not be inter-changeable with onsite survey methods for visi-tor use studies, the results of this study suggest that they may produce similar results. Differ-ences between the results of the internet and on-site surveys observed in this study may be due to question formatting limitations within current in-ternet survey software that prevented the use of identical layout for some questions. Differences observed in this study might also be due, at least in part, to the fact that internet and onsite survey respondents completed their questionnaires dur-ing different temporal phases of their park expe-rience. If so, this would suggest that decisions about whether to use internet-based survey meth-ods should consider whether the “post-trip phase” is the appropriate point in the recreation expe-rience to collect the information sought. Lastly, differences observed between onsite and internet survey results may be due to chance, given that a large number of statistical tests (140 separate tests) were performed to compare the two sam-ples.
Conclusion
When administered properly, this study suggests internet surveys provide a potentially cost-effec-tive and time-efficient method to collect infor-mation about visitor use and users. However, ad-ditional research is needed to further assess the comparability of internet-based surveys to onsite and mail surveys, and to explore reasons for differ-ences when they are observed.

Siegrist, D., Clivaz, C., Hunziker, M. & Iten, S. (eds.) (2006). Exploring the Nature of Management. Proceedings of the Third International Conference on Monitoring and Management of Visitor Flows in Recreational and Protected Areas.
University of Applied Sciences Rapperswil, Switzerland, 13-17 September 2006. Rapperswil.
467
3D Computer Visualizations to Incorporate Recreational Use and Values into Forest Management Planning for Ontario
Crown Lands
Jeff Moore1, Norm McIntyre1, Mark Robson1, R. Harvey Lemelin1
& Len M. Hunt2
1Lakehead University, [email protected]
[email protected]@lakeheadu.ca
2Ontario Ministry of Natural Resources, [email protected]
Keywords: 3D visualization, public participation, recreation management, forest management planning, computer simulation, Geographic Information Systems, landscape images.
Introduction
The forests on public (Crown) lands play a ma-jor role in the lifestyle of northern Ontario resi-dents, both as a source of jobs and raw materials and as a setting for recreation activities. Many out-door recreation opportunities rely upon and/or are affected by the access created by resource extrac-tion activities (primarily forestry) on Crown lands. While this recreational access is a significant ben-efit associated with forestry activities, recreational use is not formally included in forest management planning. Currently there is no formal recreation-al land-use planning in Ontario, leaving recreation management as a de facto component of forest management planning, largely dealt with through input from public open houses and from Local Cit-izens Committees (LCCs) selected to represent a range of public views. This situation is problem-atic as the limited understanding of forestry and recreation interactions, and the reactive rather than proactive role of public involvement, have hin-dered the effective inclusion of recreation in forest management planning (Lachapelle et al. 2003).
Research on LCCs suggests that the communica-tion methods used to facilitate the exchange of in-formation between managers and the public can form a barrier to effective communication (Robson
2004). Traditionally, public involvement in forest management planning has relied on maps, tables, and graphs to communicate information about fu-ture forest conditions under proposed management strategies. Critics of this process suggest that the volume and complexity of the information present-ed to the public, combined with the lack of time available for interested individuals to acquire a sufficient level of expertise to understand the in-formation, limits the effectiveness of public in-volvement (Meitner et al. 2003).
Meaningful participation in forest management planning requires tools and techniques that will foster a more thorough comprehension of what forest management alternatives will mean to peo-ple who value the land being managed. Three-di-mensional computerized visualization is a means of representing complex data and ideas that sim-plifies the communication of information to peo-ple who may not otherwise be able to perceive the implications of particular management actions or understand the concepts involved (Meitner et al. 2003). However, despite considerable anecdotal evidence of the benefits of visualization, there has been limited experimental research comparing the effectiveness of traditional media and computer-ized visualizations (Lewis & Sheppard 2005).

Poster Session
468
Methods
This project involves an experimental comparison of the effectiveness of computerized visualizations versus communication media traditionally used in forest management planning (i.e. maps, tables). The ability of people to interact with computerized visualizations is limited by the time and comput-er resources required to create visualizations for all parts of the land-base. In essence, the optimal trade off between the level of detail shown in visu-alizations and the time required to create the visu-alizations needs to be established through extensive testing of visualization tools with various audienc-es. The first phase of the project includes the de-velopment of automated visualization processes, coupled with the identification of specific valued places which are the highest priority areas for vi-sualizations. The visualizations used in the project are refined in a two-stage process involving input from: a) a panel of experts in forest management and visualizations to provide guidance on technical aspects such accurately representing forest invento-ry data; and b) LCC members who comment on the usefulness of different viewpoints, animations, etc. The outcome of the first phase of the project is a process to develop visualizations which can effec-tively communicate information about forest man-agement planning to members of the public.
The latter phase of the project is an experimental comparison between visualizations and traditional communication media in the two public involve-ment contexts used in forest management planning in Ontario: public open houses and Local Citizens Committees. Experiments will be conducted sepa-rately for each group, as the LCC members have a much greater familiarity with the types of informa-tion used in forest management planning than do most lay people attending open houses. The LCC members will be randomly assigned to either the experimental or control group. Each group will work through a hypothetical forest management scenario, using either visualizations (experimen-tal) or traditional communication media (control). Similarly, participants from the general public will be randomly assigned to experimental and control groups and will be presented with a hypothetical open house session involving either visualizations or traditional communication media.
Results
The effectiveness of the visualizations versus the traditional communication media will be com-pared by several methods. During the experimen-tal sessions, participant observation will examine the way in which participants interact with the me-dia and with each other. Following the sessions, interviews will be conducted with each participant to determine his or her satisfaction with the com-munication media. Participants will also be asked which specific aspects of the communication me-dia helped and/or hindered their understanding of the information presented. Finally, the usefulness of the resulting public input will be evaluated by forest managers. Conclusions will then be drawn about the effectiveness of visualizations versus tra-ditional communication media.
References
Lachapelle, P.R., McCool, S. F., & Patterson, M.E. (2003). Barriers to Effective Natural Resource Planning in a „Messy“ World. In: Society and Natural Resources (16), p 473-490.
Lewis, J.L. & Sheppard, S.R.J. (2005). Culture and commu-nication: Can landscape visualization improve forest management consultation with indigenous communi-ties? In: Landscape and Urban Planning (in press).
Meitner, M., Gandy, R., & Sheppard, S.R.J. (2003). Explor-ing, forecasting and visualizing alternative ecosystem management scenarios. In Proceedings, ESRI Users Conference, July 2001, San Diego, California.
Robson, M. (2004). Social Capital, Context, Consensus-building and Cooperation in Community-based Forest Management. Unpublished Ph.D. dissertation. Uni-versity of Toronto.
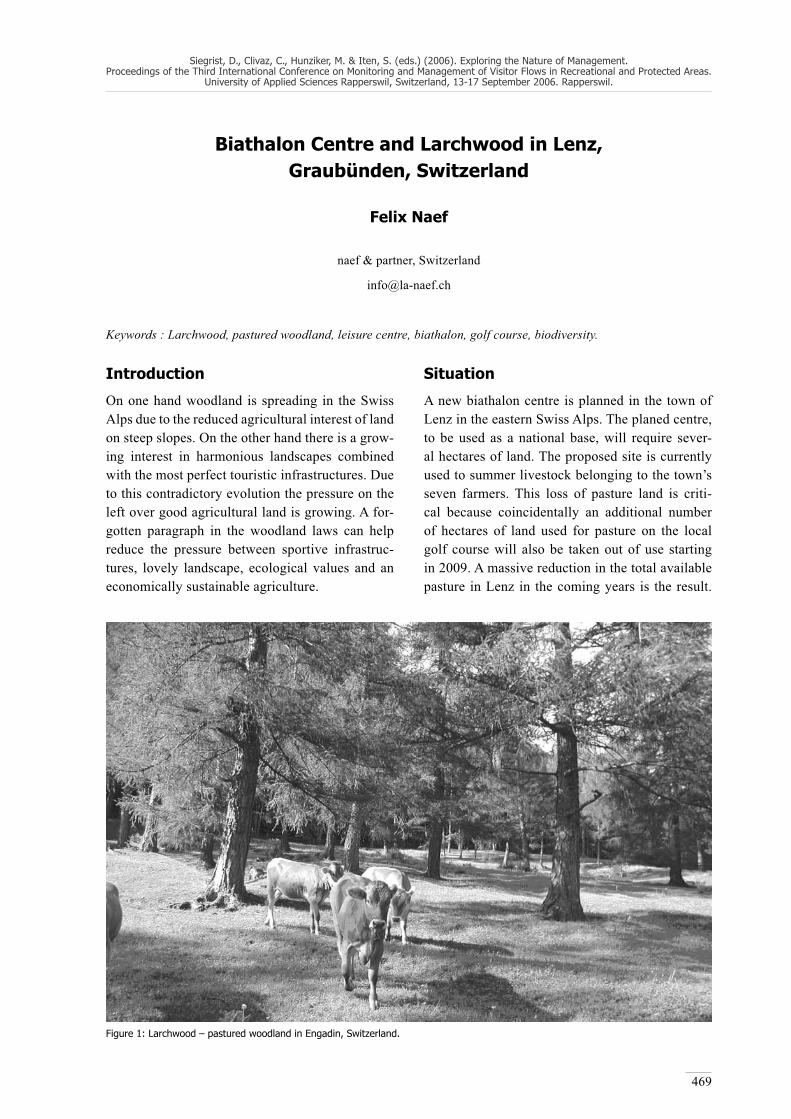
Siegrist, D., Clivaz, C., Hunziker, M. & Iten, S. (eds.) (2006). Exploring the Nature of Management. Proceedings of the Third International Conference on Monitoring and Management of Visitor Flows in Recreational and Protected Areas.
University of Applied Sciences Rapperswil, Switzerland, 13-17 September 2006. Rapperswil.
469
Biathalon Centre and Larchwood in Lenz, Graubünden, Switzerland
Felix Naef
naef & partner, Switzerland
Keywords : Larchwood, pastured woodland, leisure centre, biathalon, golf course, biodiversity.
Introduction
On one hand woodland is spreading in the Swiss Alps due to the reduced agricultural interest of land on steep slopes. On the other hand there is a grow-ing interest in harmonious landscapes combined with the most perfect touristic infrastructures. Due to this contradictory evolution the pressure on the left over good agricultural land is growing. A for-gotten paragraph in the woodland laws can help reduce the pressure between sportive infrastruc-tures, lovely landscape, ecological values and an economically sustainable agriculture.
Situation
A new biathalon centre is planned in the town of Lenz in the eastern Swiss Alps. The planed centre, to be used as a national base, will require sever-al hectares of land. The proposed site is currently used to summer livestock belonging to the town’s seven farmers. This loss of pasture land is criti-cal because coincidentally an additional number of hectares of land used for pasture on the local golf course will also be taken out of use starting in 2009. A massive reduction in the total available pasture in Lenz in the coming years is the result.
Figure 1: Larchwood – pastured woodland in Engadin, Switzerland.

Poster Session
470
A primary objective of this project is to provide the farmers with replacement land within the community as far as this is possible. A second objective is to provide ecological compensation for the proposed centre.
Larchwood pastures in the old daysThe whole region around Lenz is touristically interesting because of its lovely landscape. The attractiveness is largely due to the old larch-wood pastures. They build the framework for a park-like landscape. Unfortunately farmers us-ing modern agricultural techniques have lost in-terest in the larchwood pastures. As a result the park like, half open woodland is growing into much denser, much less attractive wood, which is at the same time much less valuable ecologi-cally.
The point of questions
Basically compensation is required for the farm-ers’ losses of land and the ensuing losses of in-come. Additionally, it will be necessary to pro-vide ecological compensation for the planned buildings. Ideally measures can be found which will serve both purposes. The most important income of Lenz is tourism. It is based on the natural beauty and diversity as well as on the sports infrastructure. Out of this the following questions arise:
How does the new centre have to be integrat-ed without losing aesthetic qualities of the landscape?
How could the aesthetic quality of the landscape be improved in spite of the new infrastructure? Could it even be possible to regain lost values, such as the pastured larchwood?
Which measures have to be taken to ameliorate the soft (landscape) and the hard (buildings) touristic infrastructures in the same time?
Methods
For the comprehensive analysis a landscape devel-opment concept (LEK) over the entire town area below the forest boundary was carried out. It differ-entiated between ecological values, deficits and po-tentials. Detailed floristic or faunistic field surveys were not carried out but all existing material, such as regional and national inventories, were gathered, analysed and incorporated into the LEK.
Additionally the landscape was surveyed in the field and all relevant agricultural structures were evalu-ated. All the information was brought to a plan in the scale of 1:5000. A spatial analysis of values and deficits in the plan, combined with other relevant criteria, led to the location of optimal areas for eco-logical or aesthetic improvements, as well as po-tential new pasture. On this basis a proposal for the necessary land exchanges was worked out.
Different scenarios were developed showing where and by which measures pasture land could be gained. The provision of new pasture land will be combined with ecological compensation because semi open pastured woodland is a very valuable biotop. In this way “new” pasture land for the farmers and
Figure 2: Forest-pasture – woodland-pasture: amount of fireplaces as an indication of the spontaneous recreational use of land.

Poster Session
471
ecological compensation for the planned build-ings are one and the same. The focus of this proj-ect was set on the woodland aspect. With an ordi-nary LEK all the elements of the landscape would be analysed equally. This LEK focused mainly on the potential of woodland pastures as well as on the ecological and aesthetic improvement of the woods. Additionally the protective functions of the woods against avalanches and rockslides had to be incorporated.
Conclusions
1. The national and the county woodland law fors-ee the possibility of using woodland as pasture – a forgotten aspect, which helped to “find” new land for the different needs.
2. Pastured woodland is part of a dwindling, valu-able, cultural heritage. With a new approach these values can be revitalised.
3. The creative interpretation of the woodland law combined with ecological compensation could help saving the touristically important pastured wood-land in many places all across Switzerland.
References
Naef, F. (2000). Neue Waldweiden anstelle von Ersatzauf-forstungen. UVB Golfplatz Zuoz.
Naef, F. (2004). Waldweiden. In: Der Gartenbau (24/04).
Naef, F. 2005). Bäume – Begleiter des Menschen. In: Der Gartenbau (Sonderdruck).

Siegrist, D., Clivaz, C., Hunziker, M. & Iten, S. (eds.) (2006). Exploring the Nature of Management. Proceedings of the Third International Conference on Monitoring and Management of Visitor Flows in Recreational and Protected Areas.
University of Applied Sciences Rapperswil, Switzerland, 13-17 September 2006. Rapperswil.
472
Visitor Use and Impact Monitoring: An Adaptive Design Model
Jessica A. Robinson & Yu-Fai Leung
North Carolina State University, USA
[email protected]@ncsu.edu
Keywords: Adaptive management, adaptive monitoring, monitoring design, decision making process, protected ar-eas, visitor impacts, visitor monitoring, impact monitoring, recreation ecology.
Visitor use and impacts are a significant manage-ment concern in many protected areas. Command of visitor use and behavior is vital to sustaining the ecological health of protected area resources and the quality of visitor experiences; through communica-tion of visitor issues protected areas garner fund-ing and administrative support. While visitor use and impact monitoring has been recognized as an integral part of adaptive management strategy and an essential component in management planning frameworks such as Limits of Acceptable Change (LAC) and Visitor Experience and Resource Pro-tection (VERP), there has been insufficient guid-ance for establishing and sustaining such programs. As a result limited progress has been made to devel-op long-term effective monitoring programs to in-form management decisions (Cole & Wright 2004, Warnken & Buckley 2000). Change in budget, per-sonnel and even catastrophic environmental events uproot monitoring programs.
Because of the drastic differences in impact con-cerns, environmental attributes, availability of park personnel and volunteers, and changing informa-tion needs, protected-area impact monitoring pro-grams, if they are to be efficient and sustainable, must be adaptive to these constraints while main-taining integrity and utility in yielding useful infor-mation (Ringold et al. 1996, Smit 2003). This pre-sentation posits a conceptual model that illustrates essential elements, considerations and process of an adaptive design for visitor use and impact moni-toring. Examples of elements include multiple-tier monitoring triggered by anticipated or unexpected change, adaptive sampling design, prioritization of indicators, and refined indicator measures based on monitoring results.
Figure 1 illustrates the key components of an adap-tive monitoring program. Protected areas must de-velop monitoring programs out of environmental and institutional history. A small protected area is made up of soils, climate, flora, and fauna all be-fore facilities, programs, infrastructure and people are added to the equation. The background and un-derstanding of these systems is the foundation of any monitoring program. Once there is a general understanding of the physical and cultural location the real work on a monitoring program can begin. The protected area goals and resources are then tak-en into account to determine priority of indicators, sampling, and methods to be considered in the mon-itoring program. These elements of the monitoring program priorities can be analysed in preliminary sampling research to determine the effectiveness of proposed techniques.
Origins of a monitoring plan should not be consid-ered the only way in which monitoring can be car-ried our at this location. From current resources and goals the initial plan should optimize the priorities and available resources and resource conditions of the protected area. A multi tiered program should be drafted to anticipate change in the environment (i.e. anticipated nautral disaster such as hurricane or earthquake in prone areas or flooding in low lying study areas) and resources (budget or staffing cuts) which may influence the monitoring program neg-atively. The tiered system should also provide for positive changes which allow for expansion and en-richment of monitoring programs.
The resulting original monitoring program is more comprehensive and ready to adapt to the changes that are known in advance or happen overnight. The compressing and expanding style of monitoring al-

Poster Session
473
lows for programs to continue montoring during and after times of social or environmental crisis. The new adaptive plan is already primarily drafted be-fore a disaster strikes. The lessons learned through that change from initial monitoring to adapted mon-itoring can be used to inform how well the plan could be adapted and what the original protected area can do to refine and use the knowledge learned to inform other planners, managers, and stakehold-ers. Examples from protected areas of the United States and Australia will be provided in this presen-tation to illustrate the adaptive design model.
Ecosystems and political systems suffer constant change there is a need to have relatively uniform monitoring for longitudinal understanding. Build-ing an adaptive monitoring plan that is designed to change, yet emphasize ecological priorities and con-sistent methods the understanding of those protect-ed areas can truly begin. The reactivity of the natu-ral environments must be understood if visitors are to be given the best possible experiences when vis-iting protected areas. Constancy built into an adap-tive plan will foster this much needed area of learn-ing about our treasured protected places.
References
Cole, D. N., & Wright, V. (2003). Wilderness Visitors and Recreation Impacts: Baseline Data Available for Twen-tieth Century Conditions (Gen. Tech. Rep. RMRS-GTR-117). Ogden.
Holling, C. S., (ed.) (1978). Adaptive Environmental As-sessment and Management. New York.
Ringold, P. L., Alegria, J., Czaplewski, R. L., Mulder, B. S., Tolle, T. & Burnett, K. (1996). Adaptive monitoring design for ecosystem management. In: Ecological Ap-plications (6/3), p 745-747.
Schelhas, J., Buck, L. E. & Geisler, C. C. (2001). Introduc-tion: The challenge of adaptive collaborative manage-ment. In: Buck, L.E., Geisler, C.C., Schelhas, J., & Wollenberg, E. (eds.). Biological Diversity: Balanc-ing Interests Through Adaptive Collaborative Man-agement. New York.
Smit, A.-M. (2003). Adaptive Monitoring: An Overview (DOC Science Internal Series 138). Wellington.
Warnken, J. & Buckley, R. (2000). Monitoring diffuse im-pacts: Australian tourism developments. In: Environ-mental Management (25/4), p 453-461.
Protected Area Backgroundnatural habitat and resources institutional history
Goalspurpose mission orientation
ResourcesHuman – staff/ volunteers FinancialEquiptment
Monitoring PlanIndicators Methods Sampling Results
CHANGE
Probable ChangeFunding / Staffing
UnknownChangeNatural Disaster
Adapted Monitoring PlanManagement Decisions
Outcomes Inform New Adaptive Plans & Strategies
Feedback
Figure 1: Adaptive Monitoring conceptual model.

Siegrist, D., Clivaz, C., Hunziker, M. & Iten, S. (eds.) (2006). Exploring the Nature of Management. Proceedings of the Third International Conference on Monitoring and Management of Visitor Flows in Recreational and Protected Areas.
University of Applied Sciences Rapperswil, Switzerland, 13-17 September 2006. Rapperswil.
474
How to Achieve Nature Protection Involving Local People
Engelbert Ruoss1 & Catherine Strehler Perrin2
1Swiss Commission for UNESCO, [email protected]
2Groupe d’étude et de gestion de la Grande [email protected]
Keywords: UNESCO, MAB, participation, conservation, development, added value, INNOREF, visitors management, Biosphere Reserves, Entlebuch.
Introduction
The UNESCO MAB strategy established in Sevil-la 1995 aims to create models for sustainable de-velopment, enhancing benefit and added value for local population and conserving natural and cul-tural heritage. The Section Natural Sciences of the Swiss Commission for UNESCO has started to disseminate and support projects implementing the MAB philosophy and methods. The targets are:
Respecting needs and local knowledge of the in-habitants
Taking into consideration ecological cycles, lo-cal resources, production and service chains
Involving people into the whole decision and implementation processes
Creating public private partnerships
Building up a management system responsible for the integrated development
Developing participatory research and educa-tion
Implementing a Quality Economy strategy, e.g. by creating new offers and services for a sus-tainable tourism and labelling schemes for lo-cal products.
Methods
The implementation of a sustainable regional de-velopment will be reached through participatory processes and bottom-up network structures. Par-ticipatory processes ask the contribution of inter-ested participants and a permanent learning pro-
cess. Therefore a Biosphere Reserve is focusing on creating stakeholder and public involvement, corporate citizenship, management structures and capacity building within regional networks. The bottom-up approach is including the stakehold-ers from the beginning into the decision and im-plementation process. In fact the bottom-up pro-cess will not be successful without the top-down support by politics and the side-in effect due to support from research, national and international organisations, increasing know how and compe-tences within the region.
The Interreg IIIC project INNOREF (2004 – 2007) derives from the MAB philosophy and the Entle-buch methodology. In INNOREF the target process is initiated by networks, assisted and moderated by a Professional Service Centre (PSC), which define goals relating to the regional strategy and topics of sub-projects, according to needs having emerged in the area and defined through a SWOT analysis. Networking is essential already in the decision pro-cess in order to create acceptance, synergies, inno-vation and to improve co-operation and resource efficiency. Capacity building is improved through training of PSC and stakeholder networks.
Results
The Entlebuch Biosphere Reserve (CH) has achieved increasing added values and a well es-tablished participatory culture. The main achieve-ments are: a new tourist destination strategy, high authenticity and stakeholders involvement, diver-sification of the tourism offers linked to agri-tour-

Poster Session
475
ism, packages for seminars connected to research, education, nature and recreation, the Biosphere Re-serve school, increased overnights during summer season (3.5 - 5 %), increased income for produc-ers of local products, improved guest flow in the core area through excursion offers and formation of guides. The project’s website, media, presentations and excursions are most effective means of com-munication and multiplication to make a process visible and to obtain feedback: in 2005, 104500 vis-its to the website, 900 articles, 8000 participants at excursions and presentations.
In INNOREF the four regions Friuli Venezia Giuli, Umbria (Italy), Western Greece (GR) and Hranicko (CZ) are creating successfully new opportunities through innovation and resource efficiency in eight sub-projects e.g. sustainable tourism services, la-belling of agri-tourism offers, biomass energy, en-vironmental management system, restructuring his-torical buildings, ICT medicine, participative spatial planning. Through creation of bottom-up structures with stakeholders networks, capacity building of local authorities, professional service centres and an impact oriented communication strategy, the re-gions have initiated a participatory long-term pro-cess in order to protect natural and cultural sites and to develop marginal areas.
The Swiss Commission for UNESCO has initiated with the Task Force Quality Economies of UNES-CO MAB a labelling scheme for commercial goods and services and a pilot project in order to achieve benefit for local people, to improve visibility and recognition of the activities of the Biosphere Re-serves.
Furthermore the Swiss Commission is involved in the coordination of the “Decade of education and sustainable development” and has started cooper-ation with other countries, implementing concepts based on the program MAB, e.g. with the MAB Committee of the Czech Republic, disseminating the experiences and methods from Switzerland and INNOREF in their Biosphere Reserves.
Conclusion
The process of the Entlebuch Biosphere Reserve has been made possible through the private-pub-lic partnership, giving the needed flexibility and
freedom to the management. The cooperation pro-cess allows sustainable growth and prosperity in the region. The experiences from the Entlebuch process, the ‘I-method’ may enable the adaptation and application of the model in other regions as well. The ‘I-method’ as a concept can therefore be used in regions with different historical, political, cultural backgrounds because it is based on local human and natural resources and knowledge and aims to benefit the local population. The method-ical course of action allows for an acceleration of all processes, which additionally enhances the de-velopment of added values in the region. There-fore, a secure economic perspective is prerequisite for the conservation of a natural and cultural land-scape and of intact social structures.
References
INNOREF Interreg IIIC. (2006). I-Method. www.innoref.net.
UNESCO Biosphäre Entlebuch. (2006). www.biosphaere.ch.
UNESCO MAB: Task Force Quality Economy. www.unes-co.org/mab.

Siegrist, D., Clivaz, C., Hunziker, M. & Iten, S. (eds.) (2006). Exploring the Nature of Management. Proceedings of the Third International Conference on Monitoring and Management of Visitor Flows in Recreational and Protected Areas.
University of Applied Sciences Rapperswil, Switzerland, 13-17 September 2006. Rapperswil.
476
Conflict between Local Villagers and Elephants (Elephasmaximus) at Kuiburi National Park, Thailand
Saowanee Saranet1 & Noppawan Tanakanjana2
1WWF Greater Mekong, [email protected]
2Kasetsart University, [email protected]
Keywords: Human-wildlife conflict, local residents, Kuiburi National Park, Thailand.
Introduction
Kuiburi National Park is a biodiversity-rich pro-tected area of Thailand. It provides critical habi-tat for the Asian elephant (Elephas maximus) and other endangered species. It is estimated that ap-proximately 140 elephants reside within the park boundaries. Within 5 km of the park’s boundar-ies, there are 34 villages where most local vil-lagers have agriculture as their major occupa-tion. Over 39,000 hectares are planted pineapple farms which are a strong attractant for elephants. The disturbance on pineapple farms by elephants has caused serious conflict between local vil-lagers and elephants, and has subsequently ex-tended to a conflict between local villages and the national park authority. This conflict has oc-curred since 1995 but was elevated by an inci-dent in 1997 during which a herd of 70 elephants destroyed a large pineapple farm, resulting in the death of 2 elephants at the hands of the farm owners. Several measures were employed by na-tional park authorities and local villagers in or-der to avoid confrontation and to reduce damage on the farm land. This included the construction of electric fences, posting local guards during the night, setting fire to drive the elephant back to the forest etc. The conflict situation, however, re-mains problematic.
MethodsIn 2004, the WWF Greater Mekong, Thailand Country Programme initiated the project entitled “Strengthening Management for a Key Population
of Elephants at Kuiburi National Park in the Te-nasserim Range”. The expected end-result of the project was a management plan that can be used as a tool to resolve conflict between local villag-ers and the elephants while strengthening conser-vation of elephants in the long run. The project activities included scientific studies to provide necessary information for management planning and employing of several techniques such as pub-lic meeting, focus group meeting, key contact, etc. to involve local people in a planning process. The objectives of scientific studies were: 1) To deter-mine territory and home-range of elephants and their behavior; 2) To determine the area impacted by elephant movement and to assess the severity of damage on agricultural land; 3) To determine factor(s) stimulating movement and destructive behavior of elephants on the farms; and 4) To con-duct socio-economic studies of local villagers, in-cluding a study on their attitudes toward the situa-tion and conflict resolving measures.
Results
The study found that in the past year, some ele-phants walked across park boundaries to agricul-tural lands 905 times or about 2.5 times per day. The disturbance on agricultural lands was more frequent in dry season than in rainy season due to inadequacy of food in natural forest during the dry season. The elephant movement tracks were mapped by WWF’s research team in cooperation with staff of the national park and local villagers in order to allocate intensive patrolling zones.

Poster Session
477
The socio-economic study included 309 house-holds from 10 villages completed. The study found that the majority of villagers or about 92% did not want to move from their current residence despite the high rate of conflict. About 75% of villagers re-ported impacts from elephant disturbance to some degree and 45% rated the damage as high or mod-erate. About 64% of villagers believed they had sufficient knowledge about wild elephants. Most people viewed the elephant as a symbol of the area and felt it needed to be conserved. However, al-most all villagers said that permanent measures to stop movement of those elephants into farm lands must be intensively implemented and monitored.
Four focus group meetings were completed in 2005. The meeting participants were staff of Kui-buri National Park, staff from the central office in Bangkok of National Park, Plant, and Wild-life Conservation Department (NPWC), staff of WWF-Thailand, local government officers, and local villagers. All parties positively responded to the meetings. The discussion came up with a set of mitigations designed to push the elephants back to the forest and to reduce possibility for human-ele-phant confrontation. Activities that stimulated ag-gressive behavior of the elephant such as setting fires were also prohibited. Rehabilitating elephant habitat and food source in natural forest was ini-tiated along with the negotiation with some local villagers to sell their agricultural land to the gov-ernment for buffer zone development. An environ-mental education program was initiated to enhance knowledge and build positive attitudes toward the elephant.

Siegrist, D., Clivaz, C., Hunziker, M. & Iten, S. (eds.) (2006). Exploring the Nature of Management. Proceedings of the Third International Conference on Monitoring and Management of Visitor Flows in Recreational and Protected Areas.
University of Applied Sciences Rapperswil, Switzerland, 13-17 September 2006. Rapperswil.
478
The Current Problems with the Historical Existence of Chalets in the Core Zone of the Krkonose Mts. National Park,
Czech Republic
Petra Stastna
Krkonose Mts. National Park, Czech Republic
Keywords: Core zone, conflict, mountain chalets, nature protection, farming period.
Introduction
The farming period of the 17th to 18th century plays an important role in the history and in the present appearance of the Krkonose Mts. The first importance of these mountains had been mainly in sources for mining of ores, ironstone and for timber mining. At the end of the 16th century these activ-ities went down because the sources were running out, The Thirty Years War ended and the historical conflicts of the land’s border were finally solved. The local people were then forced to look for a new “daily bread” and the farming became the most important way of living. Settlers started to graze cattle, founded meadows and made hay. First shelters for animals, for people working in forest openings and close the timberline were built dur-ing that time. First shelters were later rebuilt into seasonal dwellings or year-round chalets; this way of colonizing land was supported by the owners of noble origin too. Important changes in agricultural usage of this land have happened. The grazing be-came later very intensive, but typical and valuable florid meadows of Krkonose have arisen in that pe-riod (Stursa 2003, Sykora et al. 1983).
The first visitors were coming to the Krkonose Mts. since the end of 16th century. They were mostly scientists, priests or notable people around the monarch. Later, at the end of the 18th centu-ry, more and more people came to visit the moun-tains following the ideas of J.J. Rousseau declar-ing a comeback to nature. Locals quickly reacted to the new situation by supplying hospitality to pil-grims. The majority of mountain chalets were re-built to tourist lodging houses, villages in valleys
changed into tourist centers during the 19th cen-tury. The visit rate was quickly increasing: at the beginning of 19th century ca. 2,000 visitors/year, 20th century ca. 0,5 million visitors/year (Stur-sa 2003) and at the beginning of 21st century ca. 5,4-6 million visitors/year (Kolpron 2003) are re-ported. Many of the mentioned historical chalets are furthermore run as hotels or pensions today and are very valuable from the historical view. The Lucni chalet (since 1623) is also considered to be the oldest in the Krkonose Mts.
To save this unique place, the National Park of Krkonose Mts. was founded in 1963. Soon, how-ever, the ideology of the Communist politics gave higher priority to the demands of working peo-ple’s leisure time than to the protection of nature phenomena. Several new monumental objects de-signed for the mass recreation of “working people” were built within that time – luckily in the current core zone only the Labska chalet arose. The exis-tence of other bulk objects in the most valuable parts comes from the beginning of the era of tour-ism; the objects were also often rebuilt to e.g. bar-racks or a meteorology station according to situa-tion of certain era. After the change of the political regime in 1989, the park area was divided into zones with a specified extent of protection. The core zone is mostly made up of the upper parts of the mountains due to the existence of the tundra-al-pine biotope. These problematic chalets very soon became private. Without any previous experience nobody could have foreseen their future develop-ment at the beginning of the new age. For exam-ple, the Labska chalet (a typical Communist monu-

Poster Session
479
ment) was even closed for a certain time, the object dilapidated and its demolition was considered. But after several years almost all chalets found their investors and owners. The chalets set in the core zone show a huge conflict between nature protec-tion and money making today. The administration of the national park cannot reduce the capacity and functioning of these chalets because the ob-jects are private and our law system doesn’t allow it. Their existence facilitates a safe tourist flow in these upper areas, tourists can refresh or spend a night there (Stursa 2002, Stursa 2003). The big-gest actual problems are: 1) historical chalets are often very monumental and their running is very expensive, while the state system stopped support-ing them financially, 2) chalets can hardly earn a living themselves today, much of the money must be reinvested into restoration or improving of the comfort, 3) current owners are not locals but often people who come with the idea of fast enrichment, 4) the status of the national park has its strict rules of the nature protection hindering the commercial development.
Methods
The core zone has many restrictions but the ad-ministration of the national park made certain ex-ceptions for the owners: e.g. possibility to use park roads for logistic transport and collective transit of accommodated visitors provided by owners – the upper parts are connected by non-primary routes at several places and the traffic there is prohibited except for several subjects. The administration of the national park runs a grant program enhancing the management of the neighboring parcels of several chalets, makes publicity for the site and so on. The localities in the core zone have generally one disadvan-tage: there is no other kind of entertainment (ex-cept beautiful nature). The demands of the pres-ent visitors have changed very much – the unique nature is not enough? Current visitors thus prefer accommodation in the lower parts of the moun-tains. There they have the possibility to come all the way by their own car and it is easy to visit various kinds of entertainment. Owners of cha-lets set in virgin nature feel harmed and raise de-mands for the release of strict park restriction.
The ways of attracting people to spend their money in chalets situated high are various. The most problematic for us is the Lucni chalet to-day. Its last owner tried to rebuild the object into apartment flats for sale. This change would not have meant just several owners of one property but mainly more cars going through the nation-al park and their parking in the core zone. Such situation was luckily stopped at its beginning. In these days the same owner organizes evening concerts in her chalet (see www.lucnibouda.cz). The concerts themselves would not present any problem, but the offered private transport by a snow mobile or a car becomes a big problem. The use of chalet owners’ vehicles has also some re-strictions and the transport of 300 evening guests at one time up and after two hours back every two weeks is not acceptable. Moreover the snow vehicle used does not correspond with the width of the road and damages the neighboring shrub pines. Such a thing does not correspond with the idea of a national park. This conflict is be-ing solved in an administrative way during these days and no more concerts are permitted till the conflict has been solved.
The actual situation is very difficult for both sides. The administration of the national park tries to enable the existence of these objects (of-ten in accord with the nature) but on the other hand there are some rules set. The administra-tion of the national park also organizes meet-ings for chalet owners and park people (twice a year), where they can present their demands for change. The park staff can also notice a concern of particular owners to course of events. A true fear is that during some time these areas could change to places with mild nature protection. It is a real apprehension because the current political and social climate is alien to nature protection more than a few years ago. Currently some peo-ple have become rich quickly and they want to invest their money. The easy solution doesn’t ex-ist in these days. From the view of nature protec-tion the best vision would be tops of the moun-tains without any large objects; just some small refreshment places could stay there, but cancel-ing such historical buildings would bring down the major displeasure of the Czech society.

Poster Session
480
Results
In these days the employees of the national park try to achieve some compromise and support own-ers who respect the rules. Some of the rules are not popular and their following is not yet common in this country. The observance of given rules or even changing people’s priorities will certainly take a very long time in this country.
References
Kolpron, CZ (s.r.o.) (2003). Stanoveni aktualni navstevnos-ti biosfericke rezervace Krkonose a jeji celorocni dy-namiky (final report). Deposited in the Administration of the Krkonose National Park. Vrchlabi.
Stursa, J. (2003). Encyclopedia Corcontica. The Adminis-tration of the Krkonose National Park. Vrchlabi.
Stursa, J. (2002). Impacts of Tourism Load on the Moun-tain Environment (A Case Study of the Krkonoše Mountains NP - the Czech Republic). In: Arnberg-er C., Brandenburg C. & Muhar A. (ed.), Monitoring and Management of Visitor Flows in Recreational and Protected Areas, Conference Proceedings, Institute for Landscape Architecture and Landscape Management (IFL), Bodenkultur University, Vienna.
Sykora et al. (1983). Krkonossky narodni park. The Admin-istration of the Krknose National Park. Vrchlabi.

Siegrist, D., Clivaz, C., Hunziker, M. & Iten, S. (eds.) (2006). Exploring the Nature of Management. Proceedings of the Third International Conference on Monitoring and Management of Visitor Flows in Recreational and Protected Areas.
University of Applied Sciences Rapperswil, Switzerland, 13-17 September 2006. Rapperswil.
481
“Naturschutzdienst BL”: Experiences from a New Project in the Canton of Basel-Landschaft, Switzerland
Yvonne Steiner Ly & Matthias Plattner
Naturschutzdienst BL, Switzerland
[email protected]@hintermannweber.ch
Keywords: Rangers, management project, visitor information, protected areas, nature reserves, Switzerland.
Introduction
As many other nature reserves the protected areas in the canton of Basel-Landschaft are visited very frequently. Accordingly, the pressure on nature is high, especially since violations of the nature re-serve rules by the visitors occur quite often. To avoid damages of protected organisms and areas the department «Nature and Landscape» of the «Amt für Raumplanung», the agency responsi-ble for the regional development planning in the canton of Basel-Landschaft, established a rang-er service in the three nature reserves, where the pressure is highest.
The cantonal office hired two agencies – Hinter-mann & Weber AG in Reinach/BL and Locher, Schmill, Van Wezemael & Partner AG, Basel – to organise this ranger service for a first period of three years.
The aim of the ranger service, which is called «Naturschutzdienst BL», is to better protect the nature reserves by informing visitors about the existing nature reserve rules. Additionally, the rangers patrol the areas regularly. Besides this, the rangers maintain and monitor selected spe-cies in the three areas.
Methods
To begin, a team of twelve persons had to be formed and trained. Instructions in taxonomy and ecology, as well as communication skills were part of the training program. While the ranger team was trained, the means of communication were created: a logo and uniform that identify
the Naturschutzdienst-Rangers; a website (www.naturschutzdienst-bl.ch) as an information plat-form; a brochure, which is handed out to visi-tors; information panels to inform about the new service.
To inform the public about the management project, a media conference was organised at the launch of «Naturschutzdienst BL». During the whole pilot phase, the media regularly in-formed the public to improve the acceptance of the «Naturschutzdienst BL».
The ranger-team roams the area about 1700 hours per year. That is about one day per week. Nor-mally, there is always a team of two in action.
Results
The main problem faced during the last three years was people who walked dogs into nature reserves, where dogs are not allowed, or let them walk un-leashed, where a leash is required. Other problems included people who left the trails or people who didn’t respect the driving ban. At the end of the pi-lot period the new management project has reached a lot of its aims:
Violations of the rules became a lot less fre-quent.
The «Naturschutzdienst BL» is well accepted by the visitors.
No severe destruction was observed during the last three years
17 species were monitored. The annual develop-ment of the populations is observed.

Poster Session
482
But, as an evaluation by the University of Basle (see references) shows, there are still improvements to make. Three students of the program MGU (peo-ple – society – environment) surveyed the ranger service. During the summer of 2005 they asked 185 visitors of the nature reserves about their opinion of the ranger service, the acceptance of the nature re-serve rules and what they would like to improve in the areas.
Surprisingly 90 % of the persons questioned, accept-ed the nature reserve rules well. Improvements that were mentioned quite often were «more informa-tion» or «better control of the nature reserve rules». But most of the persons want to change nothing.
Yet, only 15 % of the persons questioned know about the ranger service. The knowledge of what the rangers do and who they work for is very vague. Often the «Naturschutzdienst BL» was confused with other Swiss nature organisations. But those who have already met the rangers have a good opin-ion about them.
ConclusionThe canton of Basel-Landschaft decided to contin-ue the ranger service for the next three years. In this period we have to make the «Naturschutzdi-
enst BL» more widely known by even better in-forming the public, but also by optimizing the ac-tion periods in the nature reserves thus increasing the efficiency of the rangers work.
References
Plattner, M. & Steiner Ly, Y. (2005). Naturschutzdienst BL – Rechenschaftsbericht über die Betriebsphase 2005. unpublished. Reinach/Basel.
Jäggli, C., Marti, C. & Samuel, R. (2005). Evaluation der Pilotphase des Naturschutzdienstes Baselland 2002-2005. Unpublished. Programm MGU, Universität Ba-sel.
0.0
5.0
10.0
15.0
20.0
25.0
30.0
Mär 0
3
Apr 03
Mai 0
3
Jun 03
Jul 0
3
Aug 03
Sept
03
Okt03
Nov 03
Dez03
Jan 04
Feb04
Mär04
Apr 04
Mai04
Jun04
Jul 0
4
Aug 04
Sept
04
Okt04
Nov 04
Dez04
Jan 05
Feb05
Mär 05
Apr 0
5
Mai 05
Jun05
Jul 0
5
%
Reinacher Heide
Wildenstein
Talweiher
Figure 1: The percentage of visitors who did not respect the nature reserve rules declined in all three nature reserves.

Siegrist, D., Clivaz, C., Hunziker, M. & Iten, S. (eds.) (2006). Exploring the Nature of Management. Proceedings of the Third International Conference on Monitoring and Management of Visitor Flows in Recreational and Protected Areas.
University of Applied Sciences Rapperswil, Switzerland, 13-17 September 2006. Rapperswil.
483
Quantitative and Qualitative Monitoring of Public Attendance in Natural Preserves on the Southern Shore of Lake Neuchâtel
(CH): A Necessary Tool to Manage Public Information and Prevent Infractions.
Catherine Strehler Perrin1, Philippe Gmür2, Marius Achermann2 & Pierre Alfter1
1Groupe d’étude et de gestion de la Grande [email protected]@grande-caricaie.ch
2Office of nature [email protected]@fr.ch
Keywords: Eco-meter, tourism, attendance, natural preserve, bicycle paths, infractions, information, public.
IntroductionThe Southern shore of Lake Neuchâtel (CH) is well known for the beauty of its landscape of wetlands and natural surroundings of nation-al and international importance, but also for its shallows, much appreciated for pleasure sail-ing, which are fueling an increasing touristic in-terest since 50 years. Some 5100 docking plac-es, 3500 camping sites and 1000 second homes contribute in summer to a tenfold population in-crease for some communes. The creation of sev-en type IV (IUCN) preserves was planned for long time. However, nearly 20 years were need-ed for implementation, owing to oppositions by local collectivities and populations. Human ac-tivities are since regulated and, in most sensi-tive places, public access is limited to foot- and cycle paths.
Forecasting conflicts, the Group for Study and Management has initiated since 1995 a series of qualitative and quantitative surveys to better understand the profile of potential visitors, their awareness of rules to adopt in a protected areas, as well as their expected impact.
MethodsA large-scale survey allowed interviewing 456 persons between May 15 and October 20, 2002. Counts were also performed to quantify the flow
and time distribution of visitors on different paths. Three counting devices were tested between 2001 and 2004, two of which automated and one manual, requiring staff presence in the field.
Between 2001 and the end of 2005, 73 days of man-ual counting were carried out on four different sites. Furthermore, pedestrian automatic counting instal-lations were installed in four sites, adding up nearly 1300 days of uninterrupted counting. A test of au-tomatic counting of bicycle traffic on one site was also achieved during 11 days.
ResultsFrom our surveys, the majority of the people us-ing pathways were regular customers from the re-gion or neighboring cantons (>75% had already been there “more than once”). A little more than half were here only for a day (53%), a third (30%) were staying from a few days to more than 2 weeks, the remaining being residents. Visitors were equal-ly distributed among loners, couples, families and groups. Half the people came by car. The option chosen for hosting was camping for 37%, while 14% possessed a second home in the vicinity. Fi-nally, 77% were between 30 and 70 years old, while 5% only were below 20.
Automatic counts realized on pathways have shown that preserves are mainly visited by day, from late morning to late afternoon, up to late evening dur-
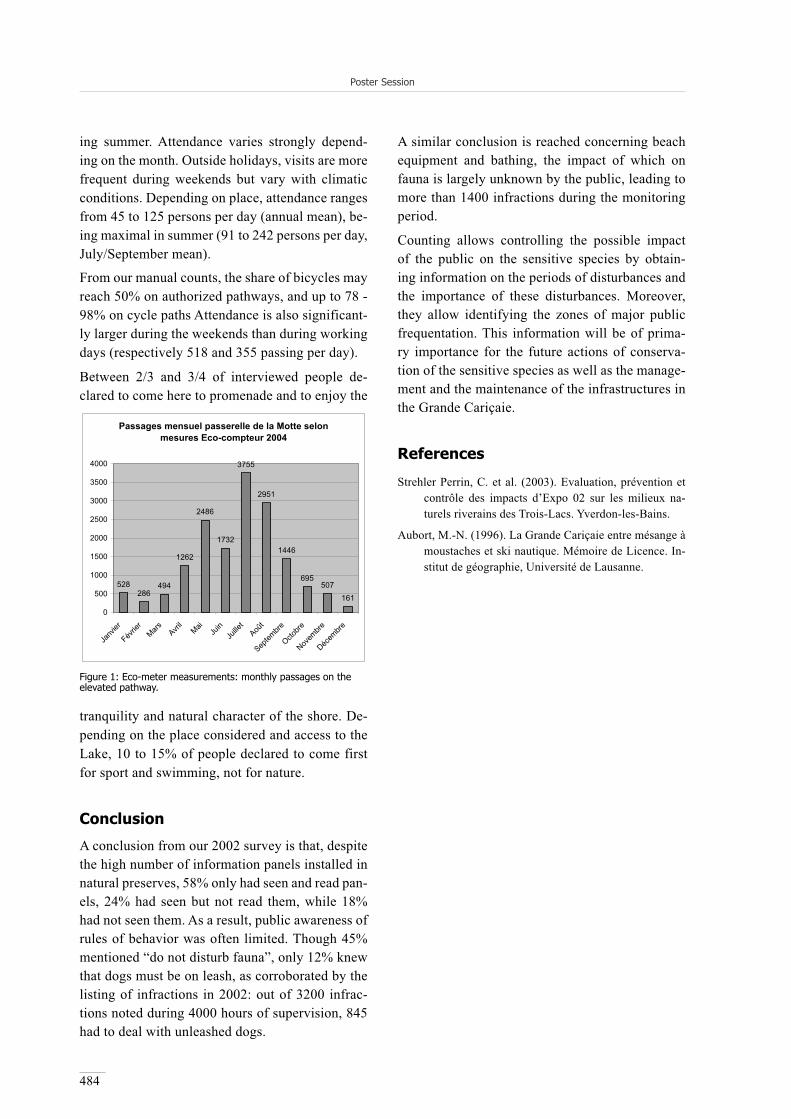
Poster Session
484
ing summer. Attendance varies strongly depend-ing on the month. Outside holidays, visits are more frequent during weekends but vary with climatic conditions. Depending on place, attendance ranges from 45 to 125 persons per day (annual mean), be-ing maximal in summer (91 to 242 persons per day, July/September mean).
From our manual counts, the share of bicycles may reach 50% on authorized pathways, and up to 78 - 98% on cycle paths Attendance is also significant-ly larger during the weekends than during working days (respectively 518 and 355 passing per day).
Between 2/3 and 3/4 of interviewed people de-clared to come here to promenade and to enjoy the
tranquility and natural character of the shore. De-pending on the place considered and access to the Lake, 10 to 15% of people declared to come first for sport and swimming, not for nature.
Conclusion
A conclusion from our 2002 survey is that, despite the high number of information panels installed in natural preserves, 58% only had seen and read pan-els, 24% had seen but not read them, while 18% had not seen them. As a result, public awareness of rules of behavior was often limited. Though 45% mentioned “do not disturb fauna”, only 12% knew that dogs must be on leash, as corroborated by the listing of infractions in 2002: out of 3200 infrac-tions noted during 4000 hours of supervision, 845 had to deal with unleashed dogs.
A similar conclusion is reached concerning beach equipment and bathing, the impact of which on fauna is largely unknown by the public, leading to more than 1400 infractions during the monitoring period.
Counting allows controlling the possible impact of the public on the sensitive species by obtain-ing information on the periods of disturbances and the importance of these disturbances. Moreover, they allow identifying the zones of major public frequentation. This information will be of prima-ry importance for the future actions of conserva-tion of the sensitive species as well as the manage-ment and the maintenance of the infrastructures in the Grande Cariçaie.
References
Strehler Perrin, C. et al. (2003). Evaluation, prévention et contrôle des impacts d’Expo 02 sur les milieux na-turels riverains des Trois-Lacs. Yverdon-les-Bains.
Aubort, M.-N. (1996). La Grande Cariçaie entre mésange à moustaches et ski nautique. Mémoire de Licence. In-stitut de géographie, Université de Lausanne.
Passages mensuel passerelle de la Motte selon mesures Eco-compteur 2004
528286
494
1262
2486
2951
1446
695507
161
3755
1732
0
500
1000
1500
2000
2500
3000
3500
4000
Janv
ier
Févrie
rMars Avri
lMai
Juin
Juille
tAoû
t
Septem
bre
Octobre
Novem
bre
Décem
bre
Figure 1: Eco-meter measurements: monthly passages on the elevated pathway.
Siegrist, D., Clivaz, C., Hunziker, M. & Iten, S. (eds.) (2006). Exploring the Nature of Management. Proceedings of the Third International Conference on Monitoring and Management of Visitor Flows in Recreational and Protected Areas.
University of Applied Sciences Rapperswil, Switzerland, 13-17 September 2006. Rapperswil.
485
Visitor Monitoring in Tatra National Park
Juraj Svajda
Tatra National Park Administration & Biosphere Reserve, Slovakia
Keywords: Tatra National Park, High Tatras, monitoring of visitors, research inquiry, motoring charge.
Introduction
The main objective of the paper is an analysis and comparison between density of visitors on both sides of the Tatra mountains (on Slovak and Polish side). Manual monitoring of visitors was realized for the first time in history of both national parks on August 5–7, 2004 by recording of visitor’s fre-quency on the whole mountain chain and com-paring the sizes of tourist’s charge on both sides of border. Objects of monitoring were actual data about numbers, detailed structure of visitors, time and spatial dynamic. The monitoring serves for the need of nature conservation, science, research e.g. by providing regulation of tourist activities, by planning maintenance of tourist trails and their fa-cilities, intensifying of ranger services, as well as for tourism experts.
Methods
Detailed counting of visitors in the national park, including bottom entries to Tatra, was realized in a project of the Tatra National Park Adminis-tration and town High Tatras in 1981. Thencefor-ward since 2004 similar monitoring has not been realised. Monitoring of motoring charge was per-formed on 12 positions, where number of vehicles, number and nationality of visitors were recorded. Monitoring of visitors in high mountain environ-ment was realised on 33 positions. One of the fac-tors, which has been monitored for a long-time, are the weather conditions and their influence on visi-tors. A research inquiry on the territory of TANAP was created by set of questions detecting the vis-itor’s opinion on the state of the natural environ-ment, nature conservation in the visitor’s mind,
services for people as well as the visitor’s view-point on rangers. In total, more than one thousand inquiry leaflets were given away there.
Results
Total input of 108845 visitors using 37387 vehi-cles was recorded during monitoring of motoring charge. Personal motor-cars created 90% of vehi-cles; the most charged sector was the road II/534 and time between 10:00 and 11:00. 17988 visi-tors used railway transport with the highest peak between 11.00 and 12.00. It means, that totally 126833 visitors came to HT area during the three sampling days, which means the average 12457 vehicles and 42278 visitors per day. The compari-son with the year 1981 is interesting, the increase of visitor numbers and vehicles can be observed, but also the decrease of shared transportation by railway and the efficiency of vehicles’ utilization. An important fact telling us about reason of vis-its is that 62% of visitors remain below the moun-tains and 38% of them consecutively enter to the high mountain environment. Monitoring of visi-tors in high mountain environment showed us, that 17651 visitors entered the high mountain environ-ment on Slovakian side of Tatry on the 6th of Au-gust, 2004. For comparison, 25282 visitors were on the Polish side in the same date. Traditional-ly the most visited parts on Slovak side were e.g. Strbske Pleso - Popradske Pleso and Morskie Oko on the Polish side. For comparison on the Slovak side of Tatras 661 km and on the Polish side 245 km marked tourist’s footpaths are registered; the density of networks of tourist’s footpaths is higher in Poland (1,19 km/km2). In high mountain envi-ronment there were about 40% visitors from Czech

Poster Session
486
Republic, 30% from Slovakia and 19% from Po-land. From the interesting results of the research inquiry it could be mentioned, that 79% of the people have visited territory of Tatra national park several times and 75% are satisfied with state and number of tourist’s footpaths. Inquiry confirmed the trend on the Polish territory of the Tatras - higher visiting of the third high moun-tain zone, which presents at the same time the most significant natural values and special sen-sitive environment.
Conclusion
Visitor monitoring realized simultaneously on both side of High Tatras allows to record fre-quency of visitors in the whole Tatras and com-pare visiting on both sides of the border. Results of monitoring are part of the management plan with limits based on indicators of environment quality. In history, thanks to data from monitor-ing, free movement of visitors in the national park was limited, the visitor’s charter got regula-tions about moving only on marked tourist trails, some areas were closed because of non-respect-able visiting, as well as the maximum quota of visitors who can ride mountain transport facilities were determined. The main goal of the question-naire was to find out the sociological character-istics of tourists, which are very important from the viewpoint of safety, information and tourist infrastructure. On the Slovak side inquiry under-lined finding the tourist opinion on the status of the environment and services related to tourism. In contrast to the Slovak side, the number of vis-itors in Zakopane (Poland) and surrounding com-munes doesn’t directly correlate with visiting of the Tatra mountains, which is especially the re-
sult of the fact that residential centres are found outside of the park. Therefore, monitoring of mo-toring charge was provided only on Slovak side.
References
Ladygin Z. & Chovancova B. (ed.) (2005).Visitor’s mon-itoring in the Tatra mountains 5th-7th August 2004. Zakopane.
25%
25%6%
36%
6%1%1% Slovak CzechMagyarPolishGermanEnglishFrench
Figure 1: Identifying of visitor’s nationality in high mountain envi-ronment (Zdiar - Monkova dolina, 5.8.2004, 5.00-20.00).
0
5000
10000
15000
20000
25000
30000
VII.
72
VII.
74
VII.
76
VII.
78
VII.
80
VII.
82
VII.
84
VII.
86
VII.
88
VII.
90
VII.
92
VII.
94
VII.
96
VII.
98
VII.
00
VII.
02
VII.
04
date
num
ber o
f vis
itors
Figure 2: Number of visitors in high mountain environment on a specific day during the period of 1972 – 2004.

Siegrist, D., Clivaz, C., Hunziker, M. & Iten, S. (eds.) (2006). Exploring the Nature of Management. Proceedings of the Third International Conference on Monitoring and Management of Visitor Flows in Recreational and Protected Areas. University of Applied
Sciences Rapperswil, Switzerland, 13-17 September 2006. Rapperswil.
487
Decision Support System for Sustainable Management Planning of Nature-Based Recreation Areas in Thailand
Noppawan Tanakanjana, Wanchai Arunpraparut, Nantachai Pongpattananurak, Ratikorn Nuampukdee & Theerapong Chumsangsri
Kasetsart University, Thailand
[email protected]@[email protected]
[email protected]@ku.ac.th
Keywords: Decision Support System (DSS), Recreation Resource Potential, Recreation Opportunity Spectrum, na-ture-based recreation area, Thailand.
Introduction
The project “Decision Support System for Sus-tainable Management Planning of Nature-based Recreation Areas” was a 5-year project funded by Thailand Research Fund aimed at developing standard protocol and models to assess recre-ation resource potential, recreation opportunity spectrum, and the acceptable limit of change of resource-base from uses, and to develop a rec-reation monitoring system for the nature-based recreation areas in Thailand. The project was divided into two phases. The first phase of the project covered a two-year period beginning from October 2003 to September 2005. The sec-ond phase began in October 2005 will contin-ue until September 2008. This paper presents a summary of results from phase one of the proj-ect, which had 2 specific objectives. The first objective was to develop a recreation resource potential assessment system. The second one was to classify the recreation opportunity spec-trum of nature-based recreation areas that are compatible with site characteristics and use pat-terns within the country. The end results of the project included a full technical report and com-puter software developed to enable recreation area managers to easily assess resource poten-tial and define opportunity classes for the recre-ation sites under their supervision.
Methods
Nature-based recreation areas in this project were classified into 9 types based on ecosystem differ-ences. The 9 types of recreation areas were water-falls, rivers and lakes, caves, hot springs, geo-mor-phological sites, scenic areas, nature trails, islands, and beaches. The study began with compiling ex-isting databases on nature-based recreation areas in Thailand. The total number of individual rec-reation sites recorded was 1,504 sites. 119 sites around the country were selected as the study sam-ples, based on their distribution and their diversity in size and use patterns. The sample sites included 27 waterfalls, 10 rivers and lakes, 14 caves, 10 hot springs, 10 geo-morphological sites, 10 scenic ar-eas, 13 nature trails, 10 islands, and 15 beaches.
Indicators for recreation resource potential and the recreation opportunity spectrum were devel-oped primarily based on related literatures (Claw-son, 1968; Clark & Stankey, 1979; Chubb & Chubb,1981; Eagles & McCool, 2002) and empir-ical data from within the country. A focus group meeting of in-country academics and practitioners was conducted to obtain opinions on those indica-tors. The final set of indicators was composed of 10 groups for recreation resource potential indica-tor and 7 groups for recreation opportunity spec-trum indicator. Each indicator had multiple indi-ces. Number of indices was different from one type

Poster Session
488
Indicator Index / Measurement detail Recreation Resource Potential 1. Distinctiveness of the plant community
1) quantity of trees with 100 cm. girth at breast height 2) completed tree structure 3) crown cover
2. Opportunity for wildlife sighting 1) amount of bird species 2) amount of small and medium sized animals 3) amount of large mammals
3. Physical uniqueness of key resource 1) width of waterfall base 2) number of waterfall level 3) number of months waterfall contains at least half water quantity 4) average width of river/lake 5) width of the largest room within a cave 6) accessible cave depth 7) presence of stalagmite and stalactite within a cave 8) size of overall area of hot spring 9) size of overall area of geo-morphological site 10) height of view point 11) diversity of trail topographic characteristics 12) reef size 13) assessable beaches at an island 14) width of beaches 15) length of beaches 16) beach type
4. Scenic quality of landscape 1) Overall quality of natural landscape within the recreation site evaluated in 5-point rating scale
5. Significance for resource interpretation
1) Overall distinctiveness of natural resources within the recreation site that can be use to develop interpretive themes and sub-themes evaluated in 5-point rating scale
6. Suitability for certain types of recreation activity
1) size of accessible swimming area at a waterfalls 2) water turbidity 3) river length 4) depth of rivers/lakes 5) amount of rapids in a river 6) number of months with sufficient water for recreation 7) slope of cave floor 8) ventilation within a cave 9) wetness of cave floor 10) size of activity area at a hot springs 11) sulfurous stink at a hot springs 12) size of activity area at a geo-morphological sites 13) size of overlook area 14) trail slope 15) trail loop 16) length of trail (short/long hiking trail) 17) percentage of live coral 18) diversity of coral species 19) diversity of living things at reef 20) water transparency 21) slope of beaches 22) size of tree shed at beaches
7. Site resistance 1) resistance of soil to trampling 2) soil shear strength 3) type of plant community 4) slope of the area 5) presence of endangered species 6) reef location compared to wind direction 7) presence of endangered sea animals
8. Proximity of the site to others 1) distance to next nearest recreation area 2) number of recreation areas within 80 km.
9. Safety 1) likelihood of touching toxic plants 2) likelihood of encountering dangerous animal 3) likelihood of natural disaster (landslide, flash flooding, etc.)
10. Suitability of climate 1) temperature 2) relative humidity 3) number of rainy days Recreation Opportunity Spectrum 1. Access 1) road/trail access conditions 2) distance from mainland to the
site (island) 3) number of months site is accessible 2. Remoteness 1) distance of the site from motorized area 2) visitors’ perception
of the remoteness of the site 3. Naturalness 1) percentage of areas left in their natural state 4. Opportunity for social encounter 1) number of other visiting parties encountered within the site 5. Evidence of human impact 1) amount of litter 2) amount of broken tree branches along the
trail 3) percentage of broken stalagmites and stalactites within a cave 4) amount of scars on trees 5) visibility of soil erosion on trails 6) length of trail with exposed tree roots
6. Site management 1) quantity and size of facilities within the site 7. User management 1) direct surveillance and control by staff 2) indirect control by
interpretive programs
Table 1: List of indicators and indices used for the assessment of na-ture-based recreation resource potential and the classification of the
of recreation area to another. The total number of

Poster Session
489
indices for resource potential was 63 and for the opportunity spectrum, 16 indices. A list of all indi-cators and indices is presented in Table 1.
Biophysical resource inventories and visitor sur-veys were conducted at each site, based on the developed indicators and indices. GPS and asso-ciated forest engineering tools were used in site in-ventories. Questionnaires were used for the visitor surveys. The number of site visitors who partici-pated in the survey was 1,550 persons. Descrip-tions of each indicator were provided in the ques-tionnaire. The survey participants then were asked to subjectively evaluate recreation resource poten-tial and recreation opportunity classes based on the given indicator descriptions. Descriptive statistics as well Ordinal Regression Analysis and Logis-tic Regression Analysis were used in the process. Opinions on resource potential and the opportuni-ty class of each site of visitors with post-gradu-ate education were put together with the opinions of the research teams and used to develop initial equations to assess recreation resource potential and recreation opportunity spectrum for the sam-ple sites.
Results
Biophysical resource inventories and analysis found that most recreation areas had moderate lev-els of distinctiveness of plant communities, while the opportunity for wildlife sighting was low. The majority of recreation sites had moderate levels of physical uniqueness of key resources, scenic qual-ity of landscape and significance for resource in-terpretation. The suitability for certain types of recreation activity and site resistance were mostly moderate to high. The potential for connection of the site to others, safety, and climate were high.
In assessing recreation resource potential, the re-search team separated the analysis into 2 parts. In the first part, ordinal regression analyses were em-ployed to develop equations to assess “Basic recre-ation resource potential (Brrp)”. “Site Resistance” (SR) was separately evaluated. The research as-sumption was:
Overall Recreation Resource Potential (ORRP) = f (Brrp + SR)
Different Brrp equations were used for different types of recreation area due to the differences in number of indicators and indices used to assess the resource potential of each type of recreation area. The total number of equations developed was three, as follows:
The factors strongly influencing basic resource potential for most types of recreation areas, taken from the equations, were physical uniqueness of resource-base and scenic quality of landscape.
In the second part, the results from Brrp and SR analysis were used to develop a matrix of man-agement alternatives, yielding five different man-agement alternatives. Different management al-ternatives recommend different solutions for site management and impact prevention. Different management recommendations were made for each group of recreation areas. The final assess-ment found that the majority of recreation areas was in group 2 as presented in Table 2. As for the classification of the recreation opportunity spec-
Equation 1: To be used for waterfalls, caves, hot springs, geo-morphological sites,scenic areas, and nature trails
Y = 4.716 + 0.515X1 + 0.187X2 + 0.868X3 + 0.837X4 + 0.541X5 + 0.044X6 + 0.146X7 + 0.070X8 + 0.471X9 (R2 = 0.610)
Where Y = Basic resource potentialX1 = richness of plant community X2 = opportunity for wildlife sighting X3 = physical uniqueness of resource-baseX4 = scenic quality of landscapeX5 = significance for resource interpretation X6 = suitability for certain types of recreation activityX7 = proximity of the site to others X8 = safetyX9 = climate
Equation 2: To be used for rivers/lakes and beaches
Y = 4.320 + 0.356X1 + 0.903X2 + 0.911X3 + 0.724X4 + 0.031X5 + 0.143X6 + 0.032X7 + 0.455X8 (R2 = 0.599)
Where Y = Basic resource potentialX1 = opportunity for wildlife sightingX2 = physical uniqueness of resource-baseX3 = scenic quality of landscapeX4 = significance for resource interpretation X5 = suitability for certain types of recreation activityX6 = proximity of the site to others X7 = safetyX8 = climate
Equation 3: To be used for islands
Y = 4.241 + 0.955X1 + 0.976X2 + 0.817X3 + 0.032X4 + 0.169X5 + 0.011X6 + 0.469X7 (R2 = 0.596)
Where Y = Basic resource potentialX1 = physical uniqueness of resource-baseX2 = scenic quality of landscapeX3 = significance for resource interpretation X4 = suitability for certain types of recreation activityX5 = proximity of the site to others X6 = safetyX7 = climate

Poster Session
490
trum, seven recreational setting indicators were in-cluded in the inventories and analysis. It was found that access to most recreation areas was by dirt road that could be easily used during the dry sea-son. The majority of the sites had a low level of re-moteness. They were left, to a moderate degree, in their natural state and had a moderate to high level of opportunity for social encounters. The evidence of human impact found in most sites was moder-ate. Most recreation sites had moderate to high physical development and visitor control.
Logistic regression analysis was employed in or-der to develop the recreation opportunity spectrum classification equation. The same equation was used for every type of recreation area. The final ROS equation was:
Y = 3.762 + 0.462X1 + 0.677X2 + 1.073X3 + 0.483X4 – 0.162X5 +
0.308X6 + 0.189X7 (R2 = 0.631)
Where Y = sum of recreation experience to be gained from visiting recreation area in each ROS
X1 = access
X2 = remoteness
X3 = naturalness
Site Resistance: SR
Very high High Moderate Low Very low
Very High Group 1 Group 1 Group 2 Group 3 Group 3
High Group 1 Group 1 Group 2 Group 3 Group 3
Moderate Group 2 Group 2 Group 2 Group 3 Group 3
Low Group 4 Group 4 Group 4 Group 5 Group 5 Bas
ic re
crea
tion
reso
urce
po
tent
ial:
Brr
p
Very low Group 4 Group 4 Group 4 Group 5 Group 5
Figure 1: Matrix to group recreation sites based on their basic recreation resource potential and site resistance.
pGrouping Number of site %
Group 1: Very high to high basic recreation resource potential and site resistance
18 15.13
Group 2: Very high to moderate basic recreation resource potential and moderate site resistance
59 49.58
Group 3: Very high to moderate basic recreation resource potential with low to very low site resistance
29 24.37
Group 4: Very low to low basic recreation resource potential with very high to moderate site resistance
11 9.24
Group 5: Very low to low basic recreation resource potential and very low to low site resistance
2 1.68
Total 119 100.0
Table 2: The results from final recreation resource potential assessment.
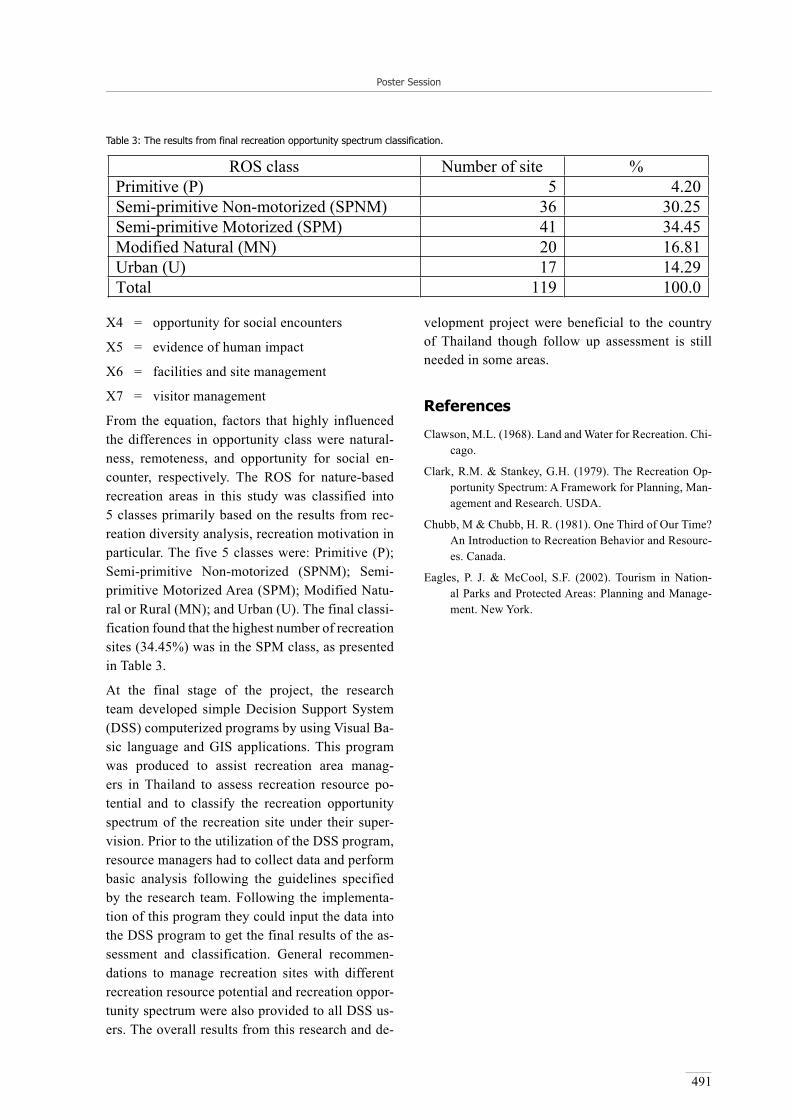
Poster Session
491
X4 = opportunity for social encounters
X5 = evidence of human impact
X6 = facilities and site management
X7 = visitor management
From the equation, factors that highly influenced the differences in opportunity class were natural-ness, remoteness, and opportunity for social en-counter, respectively. The ROS for nature-based recreation areas in this study was classified into 5 classes primarily based on the results from rec-reation diversity analysis, recreation motivation in particular. The five 5 classes were: Primitive (P); Semi-primitive Non-motorized (SPNM); Semi-primitive Motorized Area (SPM); Modified Natu-ral or Rural (MN); and Urban (U). The final classi-fication found that the highest number of recreation sites (34.45%) was in the SPM class, as presented in Table 3.
At the final stage of the project, the research team developed simple Decision Support System (DSS) computerized programs by using Visual Ba-sic language and GIS applications. This program was produced to assist recreation area manag-ers in Thailand to assess recreation resource po-tential and to classify the recreation opportunity spectrum of the recreation site under their super-vision. Prior to the utilization of the DSS program, resource managers had to collect data and perform basic analysis following the guidelines specified by the research team. Following the implementa-tion of this program they could input the data into the DSS program to get the final results of the as-sessment and classification. General recommen-dations to manage recreation sites with different recreation resource potential and recreation oppor-tunity spectrum were also provided to all DSS us-ers. The overall results from this research and de-
velopment project were beneficial to the country of Thailand though follow up assessment is still needed in some areas.
References
Clawson, M.L. (1968). Land and Water for Recreation. Chi-cago.
Clark, R.M. & Stankey, G.H. (1979). The Recreation Op-portunity Spectrum: A Framework for Planning, Man-agement and Research. USDA.
Chubb, M & Chubb, H. R. (1981). One Third of Our Time? An Introduction to Recreation Behavior and Resourc-es. Canada.
Eagles, P. J. & McCool, S.F. (2002). Tourism in Nation-al Parks and Protected Areas: Planning and Manage-ment. New York.
ROS class Number of site % Primitive (P) 5 4.20Semi-primitive Non-motorized (SPNM) 36 30.25Semi-primitive Motorized (SPM) 41 34.45Modified Natural (MN) 20 16.81Urban (U) 17 14.29Total 119 100.0
Table 3: The results from final recreation opportunity spectrum classification.

Siegrist, D., Clivaz, C., Hunziker, M. & Iten, S. (eds.) (2006). Exploring the Nature of Management. Proceedings of the Third International Conference on Monitoring and Management of Visitor Flows in Recreational and Protected Areas.
University of Applied Sciences Rapperswil, Switzerland, 13-17 September 2006. Rapperswil.
492
Is Maritime Antarctic Ready for the Impacts of Commercial Tourism?
Pablo Tejedo1 & Javier Benayas2
1Universidad SEK, [email protected]
2Universidad Autónoma de Madrid, [email protected]
Keywords: Antarctica, tourism impact, environmental change indicators, monitoring program, indicator species.
Abstract: Antarctica has been turned into a tourist destination and this situation requires understanding how tourism activities and increased visitor numbers affect to wildlife. Some areas, as Maritime Antarctic, present higher sensitivi-ty to this threat and that is the reason why many researchers have focused their studies on this area. Our paper reviews their work and proposes some discussion points.
Antarctic tourism trends
Currently, tourists can visit Antarctica as easi-ly as any other part of the world, though visitors are not everyday vacationers. Scenery, wildlife, adventure and a unique sense of remoteness are strong attractions to thousands of tourists. From small beginnings, around the 1920s, a substan-tial tourist industry has grown handling by ship 30232 visitors in 2004-05 season (IAATO 2006). Tourists, who pay large amounts of money to ex-perience Antarctica, are exceedingly motivated to
preserve what they have come to see, but their numbers are becoming worrying (ASOC 2000, 2002).
State of the art: assessment of environmental impacts of Antarctic tourism
Antarctica symbolizes the last great wilderness-es, so it is understandable that much research has focused on the effects of tourism activity.
Figure 1: 1965-2005 Antarctic shipborne tourists trends. Chart doesn’t include flight passengers (Bauer 2001, IAATO 2006).

Poster Session
493
But the assessment of environmental impacts of tourists and their activities in this region is still at its first stages. Potential negative impacts are often highlighted in the literature (table 1), and even though there are many descriptive surveys, very little quantitative data are provided. The main obstacle has been the absence of an ini-tial environmental reference state. Some base-line data on specific visited sites are beginning to be compiled through initiatives as the Ant-arctic Site Inventory Project, operated and man-aged from 1989 to 2004 by the nongovernmen-tal organization Oceanites, Inc. At 570 visited sites, the Inventory routinely collects (Naveen 2005):
Basic Site Information, which includes de-scriptions of key physical and topographical characteristics: latitude and longitude, distri-bution of flora, seal haul-out and wallow lo-cations, and discrete groups of breeding pen-guins and flying birds.
Variable Site Information and Data, which includes weather and other environmen-tal conditions (sea ice extent, cloud cov-er, snow cover, temperature, wind direction and speed), biological variables (number of occupied nests, number of chicks per occu-pied nest, ages of chicks), and the nature and
extent of any observed visitor impacts (foot-prints or paths, cigarette butts, film canisters, and litter).
Maps and Photodocumentation, which portrays the main features of each site, particularly the locations of colonies and assemblages of resi-dent fauna and flora.
Positive impacts: Conservation of important natural areas and archaeological and historic sites. Improvement and monitoring of environmental quality. Increasing environmental enhancement; visitors gain a great enhanced appreciation of Antarctica’s global importance and they act as an Ambassador to Antarctica.Scientific activities may also benefit since tourist visits can provide a useful link with the outside world and strengthen political support for Antarctic Science.Tourists are taxpayers and as such are the funding source of the research that is carried in Antarctica.
Negative impacts: Pollution: water, air, noise, visual. Waste disposal. Ecological disturbance at wildlife breeding sites. Trampling of vegetation (e.g. moss takes over 200 years to regenerate). Introduction of non-native species: microbes, plants and animals. These organisms could turn into invasive species because of the global climate change. Environmental hazards of accident with an elevated cost of cleanup operations. Damage to historic sites. Land use problems: disruption of routines at stations and of scientific programs. Non scientific collection.
Table 1: Antarctic tourism impacts (IUCN 1991, Inskeep 1991, Mason & Legg 1999, Kriwoken & Rootes 2000, Bauer 2001, Hofman & Jatko 2001).
Policy & Management
issues
Global Climate
Change & implications for tourism
Future development
Tourism impacts on
theenvironment
Tourism & Antarctic Science
Tourist experience
Activities & Services
Destinations
Operating models
ANTARCTIC TOURISM
Figure 2: Conceptual framework of Antarctic tourism compo-nents. It is essential to have a correct understanding of these components before discussing the effects of tourism activity. We recommend as a first report the particularly noteworthy Bauer’s (2001) Tourism in the Antarctic: Opportunities, Constraints and Future Prospects.
Poster Session
494
This initiative has allowed to establish potential in-dicator species of environmental change, including seals, penguins, seabirds and flora, although the In-ventory has focused on taking a census of four pen-guin species (gentoo, Adélie, chinstrap, and mac-aroni) and five species of flying birds (blue-eyed shag, southern giant petrel, kelp gull, and Antarctic brown and south polar skuas). There are great steps forward after more than ten years of Antarctic Site Inventory data collection (Naveen 2003): estab-lishment of a methodology for a coordinated Ant-arctic monitoring program; the selection of indica-tor species to monitor; and the baseline to ascertain whether populations of these indicator species are being impacted directly or cumulatively. Never-theless, even counting on these improvements, it is very unlikely to find a direct causal link between tourism activities and impacts in the ecosystem as a whole. If changes are detected, complex ques-tions related to prey availability, reproduction, cli-mate change and breeding territory make compli-cated to distinguish if it is human presence or other factors the ones behind these fluctuations.
An often-mentioned example could illustrate these difficulties: the research focused on the Adélie penguin rookery at Cape Royds, Ross Island. This population had a relatively constant bird number between its discovery in 1904 by Scott and Wilson and 1956. By 1962, the penguin population was al-most halved. Many researchers attributed this de-cline to helicopter operations and other disturbanc-es to birds by visitors. Overflight of the colony was prohibited and restrictions were placed on the number of visitors allowed in the area and their ac-tivities. As a result, the colony returned to its for-mer size. Nevertheless, a strict cause-effect rela-tionship has not been established: increases since 1968 have been in accordance to trends in colonies throughout the region.
It is possible to find other similar examples, as the study designed to examine tourism impacts on Adé-lie penguins near Palmer Station, western Antarc-tic Peninsula (Fraser & Patterson 1997). Within the context of a regional decrease in Adélie penguin populations, researchers considered the next ques-tion: are colonies in the Palmer Station area vis-ited by tourists decreasing faster than non-visited colonies? After sampling for nine seasons, signif-
icant differences based on disturbances produced by visitors were not obtained. It seems that colony-specific differences in population trends are based on interactions between breeding habitat geomor-phology and the effects of increasing snow accu-mulations during winter and spring due to climate warming in the Antarctic Peninsula (this region is one of the fastest warming places on the Earth with ~2.5º C rise in temperature over the past 50 years). Detecting the effects of human activity on Antarc-tic wildlife populations is beyond our current abil-ities to quantify and understand the natural vari-ability in spatial and temporal scales manifested by these populations.
Is commercial tourism the principal threat over Antarctica?
It is necessary to put Antarctic tourism activities into perspective before befall into pessimism. It needs to be reminded that the effect of this industry on the Antarctica may be considered insignificant if we compare it to the damage produced by the construction of permanent bases and summer sta-tions. Headland (1994) estimated that, on the basis of presence days, less than 1% of human impacts can be attributed to tourism. The rest comes from scientists and government staff. Some research-ers suggest to increases this percentage due to the large increases in tourist numbers. Moreover, hu-man activities use less than 0.005% of the Antarc-tica area (the size of this continent is 14.2 million square kilometres, or nearly twice the size of Aus-tralia). First conclusion could be that most parts of Antarctica are never visited by tourists, but this is an excessively simplistic reasoning. Coastal areas are more vulnerable since they are free of perma-nent ice cover and these are the sites used by wild-life (penguins, seals and seabirds) for daily and seasonal activities (Stewart 2005). Antarctic tour-ist activity is concentrated in the austral summer (November to February), during the period of ice thaw, which corresponds to the breeding seasons of a large number of indigenous species (Mason & Legg 1999).
Other considerable problems such as the Antarc-tic ozone hole, the climate warming, or the intro-duction of exotic species are threatening the con-

Poster Session
495
servation of the Antarctica. Unfortunately, there is a clear association between some of these threats and tourism: the increase in temperature en-tails more ice free areas during the summer sea-son, which could be visited for a longer period of time. Therefore, exotic organisms carried by vis-itors could establish permanent populations, or even turn into invasive species, disturbing the ac-tual food web; the risk of transmitting important pathogens among wildlife sites by tourists would become greater, and so on.
Why do we have to give priority to Maritime Antarctic?Commercial tourism’s risks might be aggravated in the Maritime Antarctic region, where the high-est accessibility to coastal wildlife is found. First and second tourist destinations in 2004/05 for the entire Antarctic continent were located in this bio-geographic region (Whalers Bay and Half Moon Island, IAATO 2006), since it is the easiest access to Antarctica from ports as Ushuaia and Punta Are-nas. All tourism products (ship based, land based
(a) (b)
(c) (d) Figure 3: (a) South Shetland Islands, Antarctica. (b) Total collembolan abundance versus number of walks in an experimental area (2004/ 05 summer campaign). Under experimental conditions, human presence generates an immediate impact on the first centimetres of sur-face soil, which causes a progressive reduction of collembolans. (c,d) Box-plots by levels of use for resistance to compression and appar-ent density in the 2003/04 summer campaign. Data show that a minimum human presence is able to disturb physical characteristics of Byers Peninsula soils; nevertheless, a certain level of use is necessary to obtain substantial changes.

Poster Session
496
with air support, and overflights without landings) are not only present in this area, but they have an upward trend.
In view of it, our research team has developed a pilot scheme into edaphic, physical and biological characteristics as bioindicators for human impact on Byers Peninsula (figure 3). This is the largest ice-free area in the South Shetland Islands (Mari-time Antarctic), with approximately 60 Km2 in ex-
tent (one of the largest in the Antarctic Peninsula region). Currently, Byers forms the Antarctic Spe-cially Protected Area Nº126, Livingston Island, due to its paleontological, geomorphologic and bi-ological interest (SCAR 2003). In addition, Byers holds the greatest concentration of historical sites in Antarctica, such as remains of refuges and ship-wrecks of early nineteenth century sealing expedi-tions. Currently, this place has not been subjected
Concerning the monitoring: Environmental monitoring is only useful when it is firmly tied to an environmental management strategy.Monitoring is not the measurement of everything in a haphazard approach to detect change. Monitoring should be the precisely targeted measurement of a few key species, processes or other indicators, carefully selected on the basis of scientifically-sound, predetermined criteria. A generic hypothesis to cover all environmental monitoring would be “the activity of concern causes unacceptable deterioration of values or resources”. Specific hypotheses appropriate to particular locations, the activities occurring at the location, and the values that might be impacted must be generated on a case-by-case basis.
Concerning the design of monitoring programs: Have a clear question: the thought process should have a question, suggest a hypothesis, select indicators and parameters, create a model, apply statistics and tests of hypothesis, and finally make interpretation.Have controls, both spatial and temporal where appropriate. Have a balanced design (e.g. similar sampling efforts at each impact level and time). Have replicates randomly allocated. Conduct preliminary sampling (pilot study) in order to assess the sampling methods used to ensure that they are efficient, don’t introduce bias into the study, estimate error variability, include appropriate sampling effort to achieve the desired power, and determine natural environmental patterns to be incorporated into the study design (e.g. stratification). If statistical analysis assumptions are not satisfied (they probably will not be) then transform the variables before analysis, use nonparametric methods or use simulation or randomisation methods. Accept the results (and do not try to find statistical methods that give you the result you want).
Concerning the variables, these must: Exhibit changes beyond limits of detection. Be directly related to a testable hypothesis. Be known or measurable above natural variability (i.e. background levels). Give information from which management decisions can be made. Be able to sustain the monitoring activity. Be able to be sampled within logistical and time constraints. Be measurable on samples that can be transported without deterioration or be measurable on-site. Be amenable to quality assurance procedures including demonstrable precision, accuracy and repeated measures.
It is also desirable that the parameters are: Measurable by cost effective, simple and standard procedures. Strongly related by what is believed to be a causal link to a particular activity or process. A direct measure of change in a value of concern. Permit generalisations about causative agents. Definable in terms of limits beyond which changes are judged to be deleterious. Measurable without conflicting with scientific activities.
Table 2: The two last decades of research have made possible to produce a series of basic tenets for environmental monitoring (SCAR1996).

Poster Session
497
to significant levels of human disturbance, being investigation carried out through the installation of temporary camps or punctual visits the princi-pal activity at Byers. These circumstances made of Byers a privileged observatory to analyse poten-tial indicators of human impacts on a small scale before translating the methodologies to Maritime Antarctic visited sites.
Figure 3: (a) South Shetland Islands, Antarctica. (b) Total collembolan abundance versus number of walks in an experimental area (2004/05 sum-mer campaign). Under experimental conditions, human presence generates an immediate impact on the first centimetres of surface soil, which causes a progressive reduction of collembolans. (c, d) Box-plots by levels of use for resistance to compression and apparent density in the 2003/04 summer cam-paign. Data show that a minimum human presence is able to disturb physical characteristics of Byers Peninsula soils; nevertheless, a certain level of use is necessary to obtain substantial changes.
Which should be the future of Antarctic tourism assesment?
It is necessary to develop as soon as possible mon-itoring programs for tourist activities capable to detect cumulative adverse effects before these ac-tivities reach significant levels and generate irre-versible disturbances in the Maritime Antarctic (Roura & Hemmings 2002). Initiatives as the Ant-arctic Site Inventory Project or the CCAMLR Eco-system Monitoring Programme (Convention for the Conservation of Antarctic Marine Living Re-sources) have showed the correct guidelines for fu-ture research, but there is still a long way to cov-er.
Table 2: The two last decades of research have made possible to produce a series of basic tenets for environmental monitoring.
We need to identify potential stressors for breeding species and record responses to environmental dis-turbances due to tourists. A population response in terms of reproductive success or colony size (pa-rameters used in current monitoring programs), doesn’t allow us to identify the effect of human dis-turbance. Walker et al. (2005) found that breeding
adult Magellanic penguins (Spheniscus magallani-cus) in Patagonia appear to habituate well to tour-ists and breed in an area where about 70000 people visit during the season. In their study, baseline lev-els of corticosterone returned to normal after ex-posure of birds to humans. But they also observed that penguin chicks appeared to show a heightened adrenocortical response to handling stress in nests exposed to tourists compared to chicks living in ar-eas isolated from human intrusions. Walker states: “given that developmental exposure to stress can have profound influences on how individuals cope with stress as adults, this potential effect of tour-ists on chicks could have long-term consequenc-es”. About this possibility, Regel and Putz (1997) pointed out that in Emperor penguins (Aptenodytes forsteri), human disturbance can result in an ener-getically costly increase in body temperature that accounts for up to 10% of the daily energy bud-get during molt. In any case, monitoring behaviour alone is insufficient to identify stressor factors.
As regards to field work, it is desirable to carry out non-invasive techniques to monitor wildlife popu-lations. Remote sampling by aircraft or satellite is possible, but there are other options. For example, conservation physiology can assess the stress re-sponses of animals resulting from apparently be-nign human activities such as ecotourism. Nimon et al. (1996) used data loggers located in artificial eggs to measure heart rate in nesting gentoo pen-guins (Pygoscelis papua) and determined that hu-man presence as well as behaviours such as move-ment by humans caused an increased heart rate.
Conclusions
International Polar Year 2007-2009 could be a great opportunity to start answering to some ques-tions presented by the scientific community about long-term environmental monitoring in Maritime Antarctica (SCAR 1996): Which activities may have unacceptable effects? Which components of the ecosystem may be affected? Which indicator variables need to be monitored? Which values or resources should not deteriorate by tourist activi-ties? The risks caused by all human activities in the Antarctica are greater than anywhere else, and commercial tourism is already coming. We have

Poster Session
498
to be ready to provide a suitable scientific support from which environmental management decisions can be made.
References
Bauer, T.G. (2001). Tourism in the Antarctic: Opportunities, constraints and future prospects. New York.
Fraser, W.R. & Patterson, D.L. (1997). Human disturbance and long-term changes in Adélie penguin populations: a natural experiment at Palmer Station, Antarctic Pen-insula. In: B. Battaglia, J. Valencia, and D.W.H. Wal-ton (eds), Antarctic Communities: Species, Structure and Survival, p 445-452. Scientific Committee for Antarctic Research (SCAR), Sixth Biological Sympo-sium. New York.
Naveen, R. (2003). Compendium of Antarctic Peninsu-la Visitor Sites, 2d edition: A Report To The United States Environmental Protection Agency. US Environ-mental Protection Agency.
SCAR (1996). Monitoring of Environmental Impacts from Science and Operations in Antarctica. Cambridge.
Tejedo, P. et al. (2005). “Measuring impacts on soils by hu-man activity in an antarctic special protected area”. In: Terra Antarctica Reports (12), p 57-62.

Siegrist, D., Clivaz, C., Hunziker, M. & Iten, S. (eds.) (2006). Exploring the Nature of Management. Proceedings of the Third International Conference on Monitoring and Management of Visitor Flows in Recreational and Protected Areas.
University of Applied Sciences Rapperswil, Switzerland, 13-17 September 2006. Rapperswil.
499
Types of Typologies - From Recreationists & Tourists to Artificial Agents
Ramona van Marwijk1 & Karolina Taczanowska2
1Wageningen University, The [email protected]
2University of Natural Resources and Applied Life Sciences in Vienna, [email protected]
Keywords: Tourist typology, artificial agents, recreation, spatial behaviour, recreational behaviour, wilderness expe-rience, landscape preference.
Why do we actually group visitors? What for?
In order to successfully manage natural recre-ational sites, it is fundamental to have a com-prehensive understanding of recreational use in the outdoors. Depending on the research ques-tion or a management problem to solve, scien-tists try to identify groups that respond to a cer-tain situation in a similar way. Such knowledge seems to be useful while trying to satisfy visi-tors’ needs and to assure the conservation goals. It is argued that focusing on the visitors them-selves and their typological forms helps explain why people are attracted to specific destinations (Jafari 1989, 26–27 in Wickens 2002).
The concept of a type
Every typology is the result of a grouping pro-cess. Lazarsfeld (1937) and Barton (1955) (in Kluge 2000) developed the concept of ev-ery type that can be defined as the combina-tion of its attributes. Given objects are divided into some groups or types with the help of one or more attributes. The elements within a type have to be as similar as possible and the differ-ences between the types have to be as strong as possible. In case of artificial agents – individu-als, which belong to a certain type share same beliefs, desires and intentions and interact with the surrounding environment according to the identical set of predefined rules.
What characteristics are usually included to de-scribe visitor types?
There are in general three bases for developing ty-pologies: demographic, socioeconomic and psy-chographic (Johns & Gyimothy 2002). Demo-graphic and socioeconomic characteristics proved to be a poor predictor of tourist behaviour, and at-tention has turned to psychographic variables. Psy-chographic variables include attitude, motivation, beliefs, values, attitudes, motives, needs, desires, commitments and so on (Blamey & Braithwaite 1997). Which variables are included in a study, de-pends very much on the goal of the study. Often studies aim to compare measures of behavioural preferences and other attitudes with socio-demo-graphic characteristics (Johns & Gyimothy 2002). Or, as Saarinen (1998, p 9) states that ‚tourists can be conceptualised through the dimensions of ex-perience and activity’. Recently, researchers have started to make visitor behaviour more explicit, such as Farías Torbidoni et al. (2005) who relat-ed visitor types to trail typology. O’Connor at al. (2005) state that factors such as a velocity of tour-ist travel, human way finding logic, crowd avoid-ance, and other spatially explicit behaviour are not yet well understood and need further exploration.
What are examples of typologies used in leisure research?
For purposes of this paper, following distinction between typologies is proposed: (1) theoretical-ly driven (and might be empirically tested after-

Poster Session
500
wards), (2) typologies that are derived from em-pirical studies, and (3) typologies that are used in modelling studies. Table 1 presents an overview of the three groups of typologies, without aiming to be exhaustive, rather to inspire further discussion.
What characteristics are relevant while designing artificial agents in modelling studies?
We claim that aspects of recreational activity, expe-rience and the spatial dimension of both are of high relevance for agent-based models. Two approaches of building typologies considering the spatial con-text of recreational behaviour are possible:
Finding generic visitor profiles1 and linking them afterwards to e.g. trail preferences (e.g. Farías Torbidoni et al. 2005)
Use spatial behaviour as additional feature for defining visitor profiles (e.g. Gimblett 1998, 2000, O’Connor et al. 2005, Taczanowska et al. 2006)
1 * visitor characteristics (age, sex, professional status, level of education) * characteristics of the area (accessibility, lodging facilities) * time spent in the park * visit frequency * type of visitor group (couple, family, or friends) * main motivation for visiting the area
Theoretical typologies Who Tourist types Based on Cohen (1979) drifter, explorer,
individual mass, organized mass Degree of institutionalization of the tourist
Plog (1973) Allocentric, near-allocentric, mid-centric, near psychocentric, psychocentric
Individuals; relative focus on their own culture and the one they are visiting
ETOUR(Ankre, 2005; Fredman & Hörnsten, 2004)
Purist, neutralist, urbanist visitors’ attitudes towards management, social factors and physical environment
Lengkeek (2000) Amusement, change, interest, rapture, dedication
Degree of out-there-ness
Empirical typologies (selected examples)Who Tourist types Based on Arnberger & Brandenburg (2001)
Regular visitor, occasional visitor, National Park visitor
Demographic characteristics
Arnberger and Haider (2005)
Crowding-tolerant, crowding-indifferent, crowding-averse
Crowding perception of the urban forest visitors
Sterl et al. (2006) Family & friends, sports, nature, recreation Visiting motives Taczanowska etal. (2006)
Classical visitor, speedy visitor, explorer, shortcut user
Spatial behaviour (route geometry, physical characteristics of path, signage, infrastructure)
Frochot (2005) Actives, relaxers, gazers, rurals Sought benefits Galloway (2002) Sensation seekers, escape stress, active
enjoyment of nature Degree of sensation sought
Palacio & McCool (1997)
Nature escapists, ecotourists, comfortable naturalists, passive players
Expected benefits
Farias Torbidoni et al. (2005)
Conservationists, casuals, contemplators, active-adventurers
Motivation, reasons for trail choice, environmental perception, demographic data, time spend, knowledge of the park, park access, visiting group, frequency and accommodation
Typologies in modelling studies Who Tourist types Based on Elands & Marwijk (2005)
Social & nature hiker Goal of visit
Gimblett et al.(2000) Landscape & social recreationist Desired benefits (landscape appeal, social
interaction, physical challenge) O’Connor et al.(2003)
Visitor types with diverse spatial behaviour (type 1 to type 4)
Sequences of movement
Table: 1 Overview of typologies.

Poster Session
501
In any case, following demographical, psychologi-cal and physiological elements would be desirable to consider when designing artificial agents:
Socio-demographic variables (age, distance to area, mode of transport, etc.)
Knowledge about the area (first time visitor vs repeater)
Type of activity (speed, basic spatial require-ments)
Preferences related to activity (use value: type of paths/attractions…)
Recreational experience (wilderness experience: type of nature / solitude, social conflicts: crowd-ing /user-conflicts)
Spatial distribution of visitor types (e.g. entrance choice: main entrance vs smaller one)
• ...
The list of attributes remains open. We aim to en-courage further discussion.
ReferencesAnkre, R. (2005). Visitor activities and attitudes in coastal
areas: A Case Study of the Luleå archipelago, Sweden (Working paper ). Östersund: ETOUR.
Arnberger, A. & Brandenburg, C. (2001). Der National-park als Wohnumfeld und Naherholungsgebiet. Natur-schutz und Landschaftsplanung 33(5), 157-160.
Arnberger, A. & Haider, W. (2005). Social effects on crowd-ing preferences of urban forest visitors. In: Urban For-estry & Urban Greening (3), p 125-136.
Blamey, R. K. & Braithwaite, V. A. (1997). A Social Values Segmentation of the Potential Ecotourism Market. In: Journal of Sustainable Tourism (5/1), p 29-45.
Cohen, E. (1979). Rethinking the sociology of tourism. In: Annals of Tourism Research (Jan/Mar), p 18-35.
Farías Torbidoni, E. I., Grau, H. R. & Camps, A. (2005). Trail Preferences and Visitor Characteristics in Aigüestortes i Estany de Sant Maurici National Park, Spain. In: Mountain Research and Development (25/1), p 51–59.
Fredman, P. & Hörnsten, L. (2004). Social Capacity and Visitor Satisfaction in National Park Tourism. Re-print from „Proceedings 12th Nordic Symposium in Tourism and Hospitality Research, October 2nd - 5th 2003“.
Frochot, I. (2005). A benefit segmentation of tourists in ru-ral areas: a Scottish perspective. In: Tourism Manage-ment (26), p 335-346.
Galloway, G. (2002). Psychographic segmentation of park visitor markets: evidence for the utility of sensation seeking. In: Tourism Management (23), p 581-596.
Gimblett, R., Daniel, T. & Meitner, M. J. (2000). An Indi-vidual-Based Modeling Approach to simulating Rec-reation Use in Wilderness Settings. In D. Cole & S. F. McCool (Eds.), USDA Forest Service Proceedings RMRS-P-15-VOL-4 (pp. 99-106). Ogden. UT: U.S. Department of Agriculture, Forest Science, Rocky Mountain Research Station, USDA Forest Service.
Johns, N. & Gyimothy, S. (2002). Market Segmentation and the Prediction of Tourist Behavior: The Case of Born-holm, Denmark. In: Journal of Travel Research (40), p 316-327.
Kluge, S. (2000). Empirically Grounded Construction of Types and Typologies in Qualitative Social Research [Electronic Version]. Forum: Qualitative Social Re-search (1). http://72.14.207.104/search?q=cache:1xFxJ0gb6G0J:www.qualitative-research.net/fqs-texte/1-00/1-00kluge-e.htm+Lazarsfeld+(1937)+and+Barton+(1955&hl=en&gl=nl&ct=clnk&cd=1.
O’Connor, A., Zerger, A. & Itami, B. (2003). Building Bet-ter Agents: Statistical and Spatial Analysis of Tourist Movement Data. University of Melbourne.
O’Connor, A., Zerger, A. & Itami, B. (2005). Geo-temporal tracking and analysis of tourist movement. In: Mathe-matics and Computers in Simulation (69), p 135-150.
Palacio, V. & McCool, S. F. (1997). Identifying ecotourists in Belize through benefit segmentation: a preliminary analysis. In: Journal of Sustainable Tourism (5/3), p 234-243.
Saarinen, J. (1998). Tourist destinations and attractions - in-terpretations of the spatiality of tourist motives. http://www.geo.ruc.dk/NST/NST26/Saarinen26.html.
Sterl, P., Wagner, S. & Arnberger, A. (2006). Kanufahrer und ihre Präferenzen für Besucherzahlen - Unter-suchungen zur Erholungsqualität im Nationalpark Donau-Auen, Österreich. In: Naturschutz und Land-schaftsplanung (38/3), p 75-80.
Taczanowska, K., Arnberger, A. & Muhar, A. (2006). Ex-ploring spatial behaviour of visitors in peri-urban rec-reational areas: multi-attribute analysis of individu-al route profiles. Paper presented at the CORP 2006: 11th International Conference on Urban Planning & Regional Development in the Information Society. February 13th - 16th 2006, Vienna, Austria.
Wickens, E. (2002). The sacred and the profane: a tourist ty-pology. In: Annals of Tourism Research (29/3), p 834–851.

Siegrist, D., Clivaz, C., Hunziker, M. & Iten, S. (eds.) (2006). Exploring the Nature of Management. Proceedings of the Third International Conference on Monitoring and Management of Visitor Flows in Recreational and Protected Areas.
University of Applied Sciences Rapperswil, Switzerland, 13-17 September 2006. Rapperswil.
502
Estimating Anchor Site Usage and Potential Pollution Loads for Recreational Vessels in Moreton Bay Marine Park Using
Aerial Surveys
Jan Warnken & Matthew Leon
Griffith University Gold Coast, Australia
[email protected]@cemaust.com.au
Keywords: Recreational vessels, marine protected area, use, model.
Introduction
Impacts from recreational and tourist vessels in marine protected areas are of major concern to all major stakeholders including tour oper-ators, local communities and regulators. Until recently, very little quantitative monitoring in-formation was available about the use of popu-lar anchorage sites in marine national parks near major urban and tourism centres and the annu-al (and peak and off-peak) pollution loads asso-ciated with this use. This study presents results for a popular marine protected area, the Moreton Bay Marine Park, near Australia’s fastest grow-ing urban centre – the Brisbane to Gold Coast growth corridor in south-east Queensland, with an estimated population of more than 2 Million people in 2001 (ABS census) and 95 000 reg-istered recreational vessels (2006). The objec-tives of this study included:
To develop an empirical model for predicting the number of vessels (by type) staying over-night at popular anchorages in Eastern Moreton Bay (EMB) and
To calculate load estimates (seasonal, annual) for N,P and total faecal matter, and Cu associ-ated with recreational and tourist vessels using EMB.
Methods
A survey protocol was developed to photograph and, later, count recreational and tourism vessels at 20 anchor sites in EMB by aerial surveys from
a light aircraft flown at ~100 knots at 500 ft, and to assign each vessel to one of 9 original cate-gories.
An analysis of preliminary data (49 surveys) were conducted to investigate counts for each anchor site, to develop indices for leisure time availability and boating forecast weather sce-narios, and to investigate relationships between independent variables. Based on the preliminary analyses, regression models were developed for interpolating the number of vessels in each cate-gory for each day in EMB in 2005 and pollution loads and errors for Cu, N, human faecal matter and urine were calculated using the predicted vessel numbers and data from the literature.
Results
Over 3600 individual high resolution digital images from more than 55 aerial surveys of 20 different anchor sites and nine classes of vessels were processed (enhanced) and anal-ysed to document vessel usage and to discrimi-nate between visitors and permanently moored craft. Results from this study based on an over-all count of more than 18 000 vessels provid-ed governmental regulators, tour operators and members of the local community with the first quantitative figures about the type of vessels and the time of the year for vessel use of pop-ular anchor sites, and of Eastern Moreton Bay (EMB) as a whole. The empirical models de-veloped from vessel counts also allowed esti-
Poster Session
503
mation of sewage and Cu loads associated with recreational and tourist vessels between Tanga-looma and Tipplers in EMB.
The key predictor of boating activity was lei-sure time availability (lti), which was in line with results from similar work by Widmer and Underwood (2004) in Sydney Harbour and oth-er locations elsewhere (Crompton & Kim 2004, Samdahl & Jekubovich 1997, Dwyer 1988). For weather variables, however, only some aspects were found to influence vessel numbers, and only for certain boat categories. Overall, an es-timated 59,000 vessels used the 20 anchor sites investigated during 2005, emitting an estimat-ed 0.6 +/- 0.4 t of Cu from antifouled hulls. Al-most 14% of all vessels and their associated pol-lution loads were estimated to occur during the 2 major peak seasons, Christmas/New Year (~10 days) and the Easter weekend (~3 days). The total load of N released from all vessels using Moreton Bay were likely to be in the order of 5 t per annum, or equivalent to a modern sewage treatment plant (partial N removal) with an aver-age flow of 2.5 106 l/d.
Conclusion
Findings from this study provided clear evi-dence for the benefits of ongoing monitoring for efficient management of the potential conflicts associated with such a large number of vessels kept in such close proximity to a marine protect-ed area. Changes to marine pollution regulations limiting the discharge of untreated and partly treated sewage have been implemented and are now being policed by relevant authorities in all pollution hot spots in Eastern Moreton Bay.
References
Crompton, J. L. & Kim, S-S. (2004). Temporal changes in perceived constraints to visiting state parks. In: Jour-nal of Leisure Research (36), p 160-183.
Dwyer, J.F. (1988). Predicting daily use of urban forest rec-reation sites. In: Landscape and Urban Planning (15), p 127-138.
Samdahl, D.M. & Jekubovich, N.J. (1997). A critique of leisure constraints: Comparative analyses and under-standings. In: Journal of Leisure Research (29), p 430-453.
Widmer, W.M. & Underwood, A.J. (2004). Factors affect-ing traffic and anchoring patterns of recreational boats in Sydney Harbour, Australia. In: Landscape and Ur-ban Planning (66), p 173-183.

Siegrist, D., Clivaz, C., Hunziker, M. & Iten, S. (eds.) (2006). Exploring the Nature of Management. Proceedings of the Third International Conference on Monitoring and Management of Visitor Flows in Recreational and Protected Areas.
University of Applied Sciences Rapperswil, Switzerland, 13-17 September 2006. Rapperswil.
504
Nature Park Project “Toggenburg-Werdenberg” in Eastern Switzerland – Common Chance for a Regional
Sustainable Development
Ulf Zimmermann
Regional Nature Park Toggenburg Werdenberg
Keywords: Protected areas, regional nature park, sustainable regional development, feasibility study.
Abstract: In the context of the current discussion about the protection of nature, government as well as non-govern-mental-organisations (NGO) consider introducing a new system of protected areas in Switzerland. New National Parks, Regional Nature Parks and Nature Experience Parks shall complete the Swiss nature and landscape protection management. Depending on local initiatives there should arise one or two new national parks, about ten nature parks and three to five nature experience parks in Switzerland. Different types of park examples of the neighbouring coun-tries as Germany, Austria, Italy and France are holded up as a model. The experience within these areas shows that parks are an important force in sustainable regional development. The process and first results of the actual regional nature park project Toggenburg - Werdenberg (Switzerland) will be discussed in the following paragraphs. A feasibil-ity study has been carried out and several projects could be implemented.
Introduction
Regional nature parks are areas of high value in nature, landscape and culture, where a lot of efforts were made to protect those throughout the years. With the help of the regional nature park the attrac-tive landscape shall be embedded in the regional economic cycle and of use for the inhabitants and tourism. At the same time it should facilitate an added value for nature and landscape and therefore support initiatives for example in forestry, agricul-ture or tourism. Existing deficits could be leveled out, landscape preserved and culture as well as tra-dition supported. The label is a chance for a bet-ter marketing and a positive image - for the region itself and its products. In the end the sensibilisa-tion of the population for a sustainable way of us-ing environment and the preservation of landscape should be managed.
At the moment more than 30 projects are in pro-cess to fulfill the Swiss national standards and to enjoy the label and the financial assistance by the state. With the help of this instrument the Govern-ment wants to sustain rural areas and nature pro-tection at the same time.
One of these projects is the regional nature park Toggenburg - Werdenberg. By the help of Regio Plus (comparable to Leader+) both regions started a developing process in the year 2001 and 2002. As soon as the government of the departement of St. Gallen declared to support only one regional na-ture park in their area of responsibility, both proj-ects started to work together. The organisation is built up in the way of a private association with a committee, working groups and members out of different interests as for example administration, forestry, agriculture, tourism, economy, education, policy, nature protection etc.
Figure 1: Lovely landscape and vivid tradition in Toggenburg.

Poster Session
505
The Situation
The project area is situated in the north eastern part of Switzerland next to the border of Liech-tenstein and Austria. The two regions are very heterogenous. Nature and landscape are affect-ed by a mild climate in the Rhine valley with an altitude of about 450 m up to the typical condi-tions of a mountainous valley with an altitude of about 1‘000 m in the Toggenburg valley sur-rounded by mountains up to 2‘500 m.
The region of Toggenburg is confronted with a typical scenario of a rural area: jobs in agricul-ture get lost, a lot of companies fight to survive and the booking of overnight accomodations in tourism decrease. Therefore most of the young people migrate from the region into the big cit-ies. To put up resistance to this development, re-gion, community and economy want to improve the regional value added. In doing so resources such as intact nature and landscape are very im-portant.
In the region of Werdenberg nature and land-scape have a high potential too. In contrast to Toggenburg one can find an increasing popula-tion growth and an economic strength in trade and service. The situation in agriculture is get-ting worse too. The more competition the more extensively gainless land is used and the more intensive production on the remaining agricul-tural land becomes. Because of recreation and tourism the pressure on nature and landscape in-crease at the same time. The utilization of land rise and the high biodiversity is threatened.
That is the reason why both regions started to build up a nature park. For a start different projects have been realised. For example the “Klangwelt” - a world of culture, tradition and natural music, the “sagenhafte Familienland” - a special offer for family holidays, the “Werdenberger Apéro” - a ca-tering service of local products by farmer women, the education of park rangers, the construction of several nature trails etc.
Besides the realisation of several projects we need-ed detailed information about the possible park-perimeter. Therefore a feasibility study was was worked out.
Methods
The study was worked out by the University of Ap-plied Sciences in Rapperswil in co-operation with the local project leaders and working groups. The objective of the feasibility study is to show the chances for a realisation of the nature park. That means in detail: Does the area fulfill the standards? What is the park contribution to the local econom-ical, ecological and social development? What are the strengths, weaknesses, options and threats? What about the participation and the acceptance of the inhabitants? Are there any additional limi-tations for forestry, agriculture, economy or tour-ism? How much will it cost?
Working steps1. Definition of a maximum area of exploration.
2. Accumulation and evaluation of the natural, cul-tural and economical values, for example high-moor, areas of high landscape and natural monu-ments, floodplains, game reserve, forest reserve, protected view of place, preserved castle and ru-ins, inhabitants, demographical aspects,
3. Combination of the different information in a plan and classification of the whole perimeter into different areas – natural, cultural and settlement.
4. SWOT-Analysis of both regions
5. Analysis of the acceptance and participation of inhabitants via interview of stakeholder and feed-back of the steering committee
6. Work out of different scenarios and perimeter al-ternatives
Figure 2: View from Werdenberg up to the Kreuzberge.

Poster Session
506
7. Evaluation of the financial facilities and need of resources
Results
Value of nature and landscapeBoth regions have a high level of nature and land-scape value and biodiversity. You will find sever-al protected areas of national, cantonal and regio-al interest as well as important bird areas, which will be accommodated be the European emerald network. The actual study of the WWF concerning the priority conservation areas of the Alps men-tions this area as very important too. Nearly 2/3 of the region is part of a landscape inventory or pro-tection area.
Chances and risksThe most important thing is that the regional na-ture park is a possibility for the region to both plan and develop the future together with the communi-ties, the different stakeholders and the population. Special chances are:
sustainable regional development with at the same time increasing value added
possibility to reach a better position in the mar-ket with the help of the label, for example agro-tourism and regional products
cooperation between the two regions, communi-ties, private companies and producer may offer new perspectives and products
information and communication platform as well as regional, national and international net-work
strenghtening of the regional identification
Typical further nature parc products could be of-fers in natural experience, culture and music, en-vironmental education and excursions, nature park information center, new products in the field of wood and woodenergy, new products in the field of agrotourism, new products around typical cul-tivation as for example goats, ecological network projects, etc.
Risks could be
overestimation of the benefits of the park
need of professional, efficient and locally ac-cepted park management
impairement of nature and landscape without ef-fective monitoring systems
fears of further limitations
Participation and acceptance Interviews of key personalities and workshops with stakeholders show a high interest in the nature park. The acceptance in the population is difficult
Figure 3: Map of natural and landscape values.

Poster Session
507
to estimate. There are only little public relations yet. A wide information campaign about the issues of a regional nature park is missing. Nevertheless it would be very important to erase false ideas and fears. An intensive participation and information is necessary to sustain the bottom up process.
The right dimension of the nature park areaTo discuss the right dimension of the region-al nature park a kind of evaluation of the dif-ferent aspects and landforms is necessary. So quality and quantity of nature and landscape, man-made environment, villages and potential conflicts were evaluated. Basic requirements are the land use planning of the departement St. Gallen and the minimum standards for regional nature parks:
minimum area of 100 km2
extraordinary value of nature and landscape
high ecological and sustainable standards in cultivation and economy
preservation of cultural buildings and a viv-id tradition
natural and socio-economical basis of the re-gion
The evaluation forms five models of different extension and content. Besides the different na-ture values one can say that the bigger the park the more coordination and costs, and the small-er the park the less marketing and label effect it causes. The outcome of the poll at the com-
munities is a perimeter, which is in accordance to the most probable variant of the feasibility studie
15 villages out of 23 want to be part of the re-gional nature park. That means a perimeter about 510 km2 and 58000 inhabitants, a great variety of landscape and nature protection areas, a high economical capability, important cultural and touristic values and an acceptable balance be-tween effort and gain. Furthermore the existing infrastructure can be easily complemented by additional touristic offers and various regional products.
Special situationAs the national standard specifies not to dissect the area of a village, it should be provided to fac-tor out special sectors - as far as reasonable and possible. In the following three topics special so-lutions must be found.
Agglomeration area
Buchs is the biggest village in the perimeter with about 10000 inhabitants. With all of the indus-trial establishments and the growing housing es-tates it is declared as an agglomeration area. The typical rural and traditional architecture and even structure of the village is missing. The space be-tween Ebnat-Kappel and Bütschwil has more or less the same problem. By the demand of the state the majority of the villages have to be out-side from agglomeration areas to guarantee the rural character of a regional nature park. On the other hand even the bigger villages try to develop in a sustainable way. Buchs for example has got the label of “Energiestadt Schweiz” since 2001, has got a high engagement on ecological archi-tecture and realise ecological revaluation proj-ects in the town every year. Together with com-munity, government and state a special solution should be found.
Intensive cultivation of the Rhine valley
The land of the Rhine valley is highly productive, which is caused by land improvement, intensive dewatering and drainage in the last 50 years. The value of nature and landscape in that area is very small as a lot of natural structure got lost. The potential of revaluation is very high. A few proj-Figure 4: Actual map of the nature park-perimeter.

Poster Session
508
ects, for example renaturation of turf moor, cre-ation of wetland, extensive grazing with Scottish highland cattle or the construction of dry stone walls, were started with great results. Threatened species found a new habitat or could enlarge their incidence. The nature park represents in coopera-tion with the agriculture a chance to carry on and to net these revaluationprojects.
Ski-tourism in the upper Toggenburg
The mountain railways are the engine for the Toggenburg and an important partner for the na-ture park. Especially the winter tourism attracts a lot of daytourists within a radius of about 150 km (Zürich, Bodensee, Süddeutschland, Vorarlberg). Beside ski-runs, ski lifts and other infrastructure one can find high natural values as moor, dryland and dolines.
A regional nature park doesn’t forbid ski tourism and necessary infrastructures in general. The ca-pacity of the skiarea should fit to impacts on the nature area. In this context the state excludes in-ternational well known skiareas as Davos, Arosa or St. Moritz. The approval for new projects of the mountain railways are still based on the exist-ing federal laws. One should be aware of that in the future renewing or extension of infrastructure has to be embedded in the landscape. For the on-going process it is very important to work out the goals and aims of the nature park together with representatives of the mountain railways and to define it in the park charta. An exclusion of the ski area should be avoided, as that would mean a division of the park into two parts and a lost of a main force in the region who wouldn‘t partic-ipate in the sustainable developping process of the region.
Financial situationThe amount of cost depends mainly on the size and the scope of projects. According to the re-gional experience and a perimeter of about 400 - 500 km2 the expenses for the set-up of the park can be estimated at more or less the same lev-el as the actual regio plus projects. Taking into account that the state is going to pay half of the costs it would mean about five CHF/inhabitant/year. Participation by the departement would re-duce the regional financial investment too. The
running of the park may cause additional costs. The state calculates with a total amount of 1.5 Mio CHF/year/park.
Conclusion - A Regional Nature Park is Possible in the Area of Toggenburg Werdenberg
The result of the feasibility study is positive. The project meets with general approval by the inter-view partners and stakeholders of the region. The acceptance in the wide population depends on a transparent communication and information. The question of the perimeter and the solution for the difficult areas has to be answered during the pro-cess.
Added value for the region: the regional nature park can make a contribution to the strengthening process of both regions as natural relaxing areas and attractive settlements. Further effects of value added can be expected by the local economy, agri-culture, forestry and tourism. That could be more than the grant which has to be invested. This aspect is proven by new value added studies in national and nature park areas of Switzerland and neigh-bouring countries.
Contribution to nature and landscape: many objects with considerable natural and cultural value exist in both regions. There are several nature protection areas of national interest as for example moor, dry-land, flood plain forests or river breeding areas of greyling (Salmo thymallus) and nase (Chondrosto-ma nasus). The riverside and banks of gravel of the Rhine are eminent as breeding areas for rare birds. The upper Toggenburg and the Säntis is part of the European network for important bird areas (Emer-ald Network). International studies for example the World Wildlife Fund (WWF) point out that the re-gion of Werdenberg and Toggenburg is one of the priority areas in the alpine space of very high bio-diversity, which could be preserved and supported with the help of a nature park. Renaturation espe-cially of the canalised streams and brooks means a high potential for nature revaluation. The wildlife conservation programme for the capercaillie (Te-trao urugallus) or the resettlement programme of the lynx (Lynx lynx) could be assisted.

Poster Session
509
Organisation and management: the existing organi-sation in the way of a private association is suitable to the regional nature park too. Representatives of the different interest groups as well as inhabitants should be members. The steering committee will be dominated by the communities, as they have to agree with the regional development and the pay-ment of the region. The main interest groups may be engaged too. Professional management and ex-ecution has to be developed.
Next Steps
Based on the results of the feasibility study 15 communities have decided to follow up the proj-ect. Therefore a public workshop was organised in May 2006 where stakeholders and citizens were invited, the results presented and new working group for the different topics founded. At the mo-ment more than 100 people work out the goals, contents, projects, organisation and management, which should be build up in the following three years. In the beginning of 2007 the motion for fi-nancial support has to be finished and should be delivered to the state.
The important part of the project and the manage-ment plan is the charter. This charter is an official agreement about the objectives of the park, which is ratified by the communities and the main interest groups. Provided that state, government and region agree to the nature park it is the aim to get the of-ficial label of a regional nature park of national in-terest in 2010. This label is available for 10 years. Afterwards the project will be reevaluated by the state and the park organisation has to point out if and how the intentions of the park and the charter are fulfilled. In case of non achievement of the ob-jectives the state has the possibility to remove the label.
References
Mörschel, F. (2004). Die Alpen: das einzigartige Naturerbe. Eine gemeinsame Vision für die Erhaltung ihrer biolo-gischen Vielfalt. Frankfurt am Main.
Siegrist, D., Zimmermann, U. & Scherrer, H. (2006). Regio-naler Naturpark Toggenburg-Werdenberg, Schlussb-ericht der Machbarkeitsstudie. Neu St. Johann/Buchs.
Zimmermann, U. (2004). Neue Schutzgebiete in der Sch-weiz. Das Modell Naturpark als Chance für die Re-gion, vorgestellt am Beispiel Werdenberg. Masterar-beit Studiengang Sustainable Resource Management Technische Universität München.
Siegrist, D.; Hohl, U.; Aufdereggen, M.; Lintzmeyer, F. & Spiess, H. (2006). Ökonomische Analyse von regio-nalen Naturpark-Projekten im Kanton Bern. Bern.
Mose I. & Weixlbaumer N. (2002). Naturschutz: Grosss-chutzgebiete und Regionalentwicklung. Sankt Augus-tin.
Broggi, M., Staub R. & Ruffini F. F. (1999). Grossflächige Schutzgebiete im Alpenraum: Daten, Fakten, Hinter-gründe. Berlin / Wien.
Dieterich C., Subotsch N. & Morino S. (2002). Typolo-gie der alpinen Schutzgebiete. Netzwerk Alpiner Schutzgebiete. In: Die Dossiers des Alpinen Netz-werks (8). Gap.
Job H., Metzler D. & Vogt L. (2003). Inwertsetzung Alpiner Nationalparks. In: Münchner Studien zur Sozial- und Wirtschaftsgeographie (43). München.
Hammer T. (2003). Grosschutzgebiete – Instrumente nach-haltiger Entwicklung. München.

Arne ArnbergerUniversity of Natural Resources and Applied Life Sciences, Austria
David ColeAldo Leopold Wilderness Research Institute, USA
Terry DanielUniversity of Arizona, USA
Don EnglishUnited States Department of Agriculture – Forest Service, USA
Wolfgang HaiderSimon Fraser University, Canada
Robert E. ManningSchool of Natural Resources, University of Vermont, USA
Andreas MuharUniversity of Natural Resources and Applied Life Sciences, Austria
Ulrike PröbstlUniversity of Natural Resources and Applied Life Sciences, Austria
Dominik SiegristUniversity of Applied Sciences Rapperswil, Switzerland
Tuija SievänenFinnish Forest Research Institute, Finland
Seija TuulentieFinnish Forest Research Institute, Finland
International Steering Committee
Dominik Siegrist (chair) University of Applied Sciences,Rapperswil/St. Gall
Christophe Clivaz (co-chair)University of Applied SciencesWestern Switzerland, Siders/Valais
Marcel Hunziker (co-chair)Swiss Federal Institute of Forest, Snow and Landscape Research,Birmensdorf/Zurich
Norman BackhausDepartment of Geography,University of Zurich
Andreas BernasconiPAN Bern, Berne
Patricia BernetGreifensee-Foundation,Uster/Zurich
Andréa Finger-StichUniversity of Applied SciencesWestern Switzerland, Lullier/Geneva
Yves HausserUniversity of Applied SciencesWestern Switzerland, Lullier/Geneva
Sophia ItenUniversity of Applied Sciences, Rapperswil/St. Gall
Reto RupfUniversity of Applied Sciences, Wädenswil/Zurich
Thomas ScheurerResearch Council of the Swiss National Park, Berne
Alfred Wittwersanu – Partner for Environmental Training and Sustainability, Biel/Berne
National Organizing Committee Partners & Sponsors
Swiss Federal ResearchInstitute WSL

On the occasion of the “Third International Conference on Monitoring
and Management of Visitor Flows in Recreational and Protected Areas”
scientists and park managers from the four corners of the world
exchanged the latest research results and discussed how they can
be carried out in action. The conference proceedings are concerned
with the impacts of tourism use on recreational and protected areas
as well as the implications of regional development and nature-based
tourism. They address the image of landscape, nature and wilderness,
which is the basis of land use and the management of such areas.
ISBN 3-033-00935-2