exploring the digital nation: home broadband internet adoption
TRANSCRIPT

EXPLORING THE DIGITAL NATION:HOME BROADBAND INTERNETADOPTION IN THE UNITED STATESPrepared byECONOMICS AND STATISTICS ADMINISTRATIONandNATIONAL TELECOMMUNICATIONS AND INFORMATION ADMINISTRATIONin theU.S. DEPARTMENT OF COMMERCE
NOVEMBER 2010
NATIONAL TELECOMMUNICATIONS ANDINFORMATION ADMINISTRATION
www.ntia.doc.gov
ECONOMICS AND STATISTICSADMINISTRATION
www.esa.doc.gov
final cover 1 and 4.qxd 10/25/10 2:43 PM Page 1

EXPLORING THE DIGITAL NATION:Home Broadband Internet Adoption
in the United States
Prepared by
ECONOMICS AND STATISTICS ADMINISTRATION
and
NATIONAL TELECOMMUNICATIONS AND INFORMATION ADMINISTRATION
in the
U.S. DEPARTMENT OF COMMERCE
November 2010


U.S. Department of Commerce � Economics and Statistics Administration � National Telecommunications and Information Administration i
EXPLORING THE DIGITAL NATION:Home Broadband Internet Adoptionin the United States
FOREWORD
The Internet Age is here. The effective use of this technology and all that it can provide is a key tosuccess for businesses and individuals. Knowing this, the Obama Administration seeks to ensure thatall Americans have affordable access to broadband Internet services. Accomplishing that goal,however, requires a set of facts about Internet use that can underpin and guide this policy objective.
In Exploring the Digital Nation: Home Broadband Internet Adoption in the United States, the CommerceDepartment fulfills its promise to provide authoritative, nationally-comprehensive data on access tothe Internet throughout the United States. This new study follows the February 2010 NTIA researchpreview, Digital Nation: 21st Century America’s Progress Toward Universal Broadband Internet Access.Both studies draw on the Census Bureau’s Current Population Survey Internet Use Supplement, asurvey of approximately 54,000 households conducted over one week in October 2009. The Censusdata show increases in adoption of broadband services at home over time for virtually all demographicgroups. The data also reveal that demographic disparities among groups have tended to persist.Persons with high incomes, those who are younger, Asians and Whites, the more highly-educated,married couples, and the employed tend to have higher rates of broadband use at home. Conversely,persons with low incomes, seniors, minorities, the less-educated, non-family households, and the non-employed tend to lag behind other groups in home broadband use. The new study takes the analysisto another level.
This report presents the most accurate statistical profile of U.S. broadband Internet adoptioncurrently available. The report features new analysis of “adoption gaps,” i.e., the differences in averagebroadband Internet adoption at home among different groups after controlling for demographic andgeographic factors. There are certain groups in the population that have lower adoption rates evenafter taking account of differences that typically affect broadband usage. For example, the homebroadband adoption gap between the lowest-income households and higher income brackets rangesfrom 16 to 34 percentage points, even after controlling for differences in education, age, race,ethnicity, household size, urban-rural location, foreign-born status, disability status and state ofresidence. The gaps between Whites and Blacks registered at 10 percentage points and between

EXPLORING THE DIGITAL NATION: HOME BROADBAND INTERNET ADOPTION IN THE UNITED STATES
U.S. Department of Commerce � Economics and Statistics Administration � National Telecommunications and Information Administration ii
Whites and Hispanics at 14 percentage points, even after controlling for household characteristics. Asimilar analysis found the urban-rural gap to be 7 percentage points. A special section presents ourfindings on users with disabilities, who tend to be older and part of lower-income groups.
We look forward to continuing our study of this important subject in the future. Most of all, we hopethat the data we make available to the public will be of use to the research community and policy-makers around the United States in their quest to understand the nature of Internet access. Throughtheir research and ours, we hope to learn how to continue to make the benefits of this extraordinarynew platform available more widely throughout the country.
Rebecca M. BlankUnder Secretary for Economic AffairsEconomics and Statistics Administration
Lawrence E. Strickling Assistant Secretary and AdministratorNational Telecommunications and Information Administration

EXPLORING THE DIGITAL NATION:Home Broadband Internet Adoptionin the United States
Economics &Statistics National Telecommunications Administration and Information Administration
Rebecca M. Blank Lawrence E. StricklingUnder Secretary for Assistant Secretary for Economic Affairs Communications & Information
Joint Project Team:
ESA NTIABeethika Khan, Economist Daniel Weitzner, Associate Administrator,
Office of Policy Analysis & Development
James McConnaughey, Chief Economist Office of Policy Analysis & Development
U.S. Census Bureau� Demographic Surveys Division
� Technologies Management Office
� Demographic Statistical Methods Division
� Housing and Household Economic Statistics Division: Population Division
ACKNOWLEDGMENTS
The Project Team would like to thank Mark Doms, Jane Molloy, Jane Callen, George McKittrick, RebeccaLehrman, and Sabrina Montes of the Economics and Statistics Administration; Anna Gomez, Tom Power,Deena Shetler, Rochelle Cohen, Larry Atlas, Milton Brown, Dennis Amari, and Bart Forbes of NTIA;David Johnson of the Census Bureau; Marc Berejka and Patricia Buckley of the Office of the Secretary;Philip Weiser from the White House National Economic Council; Andrew McLaughlin and ScottDeutchman of the White House Office of Science and Technology Policy; Peter Stenberg and ChristopherChapman of the U.S. Departments of Agriculture and Education, respectively; Ceci Rouse and MatthewMagura of the Council of Economic Advisers; and John Horrigan of the Federal CommunicationsCommission, for their contributions to this report.
U.S. Department of Commerce � Economics and Statistics Administration � National Telecommunications and Information Administration iii


EXPLORING THE DIGITAL NATION:Home Broadband Internet Adoptionin the United States
EXECUTIVE SUMMARY
Household use of broadband Internet service has risen dramatically during the first decade of the 21stcentury as the Internet has become integral to the lives of most Americans. Nonetheless, not everyoneuses broadband Internet – either by choice or because they lack access. This report, prepared jointlyby the Commerce Department’s Economics and Statistics Administration (ESA) and NationalTelecommunications and Information Administration (NTIA), explores differences in broadbandInternet use among households.
Earlier studies by NTIA and others have shown that broadband Internet use varies significantly acrosshouseholds of different socio-economic backgrounds and in different geographic locations. Thisreport builds on the findings of an NTIA report published earlier in 2010 showing that whilebroadband Internet access rose between 2007 and 2009 for most demographic groups and geographicareas, persistent differences in levels and growth rates remained (NTIA, 2010). That report foundhighest rates of home broadband Internet use among Asians and Whites, married couples, youngerpeople, urban residents, people with higher incomes, and people with more education. This reportexpands the analysis presented in the earlier NTIA report to examine these differences in broadbandInternet use in greater detail.
This report and the earlier NTIA report used data from a special 2009 supplement to the CensusBureau’s Current Population Survey (CPS), which asked questions about broadband Internet use ofmore than 50,000 households.
The principal findings of this report are as follows:
General Broadband Internet Access� Seven out of ten American households used the Internet in 2009. The majority of these
households used broadband services to access the Internet at home. Almost one-fourth of allhouseholds, however, did not have an Internet user. (Section 3, Figure 1)
Determinants of Household Adoption of Broadband Internet� Income and education are strongly associated with broadband Internet use at home but are not
the sole determinants. (Section 4.1, Table 1; Section 4.2, Table 6)
� Broadband Internet adoption was higher among White households than among Black andHispanic households in 2009. Differences in socio-economic attributes do not explain the entiregap in broadband Internet adoption associated with race and ethnicity. (Section 4.2, Figure 2)
U.S. Department of Commerce � Economics and Statistics Administration � National Telecommunications and Information Administration v

� A similar pattern holds for urban and rural locations. Urban residents were more likely thantheir rural counterparts to adopt broadband Internet, even after accounting for socio-economicdifferences. (Section 4.2, Figures 3 and 4)
� Home broadband Internet use by people with disabilities lagged adoption by those with nodisability. Differences in socio-economic and geographic characteristics explain a substantialportion of the adoption gap associated with disability. (Section 4.2, Figure 5)
Main Reasons for Non-Adoption of Home Broadband Internet � Lack of need or interest, lack of affordability, lack of an adequate computer, and lack of
availability were all stated as the main reason for not having home broadband Internet access.The significance of these factors, however, varied across non-users, with affordability anddemand generally dominating. (Section 5, Figure 6)
� Internet non-users reported lack of need or interest as their primary reason for not having homebroadband Internet access (Section 5.1, Figure 7). This group accounted for two-thirds of non-users of home broadband Internet.
� In contrast, households that did not use the Internet specifically at home but reported using theInternet elsewhere ranked affordability as the primary deterrent to home broadband Internet use(Section 5.2, Figure 8). This group represented almost one-fourth of non-users of broadbandat home.
� Affordability was also reported as the major impediment to adopting broadband Internetservices in households that used dial-up services (Section 5.3, Figure 9). This group representedabout one-eighth of non-users of home broadband Internet services. Lack of broadbandavailability was reported to be a significant factor for rural residents (Section 5.3, Table 13).
� The use of dial-up Internet service is shrinking among households that connect to the Internetfrom home. Dial-up users, on average, were older, had lower levels of family income andeducation, and were more likely to reside in rural areas. (Section 6, Tables 16 and 17)
Long-term Trends in Broadband Internet Use� Between 2001 and 2009, broadband Internet use among households rose sevenfold, from 9%
to 64% of American households utilizing broadband Internet. (Section 8.1, Table 23)
� Some of the demographic groups that had lower-than-average adoption rates in 2001 have sinceexhibited impressive gains. However, sizeable adoption gaps still remain in broadband Internetaccess among demographic groups defined by income, education, race, and ethnicity. (Section8.1, Table 23)
� Geographic areas such as states, as well as urban and rural locations, have experienced significantgrowth in home broadband Internet use between 2001 and 2009. Significant gaps in adoptionstill persist among the states, some regions, and between urban and rural locations. (Section 8.2,Table 24; Section 8.3, Table 25)
EXPLORING THE DIGITAL NATION: HOME BROADBAND INTERNET ADOPTION IN THE UNITED STATES
U.S. Department of Commerce � Economics and Statistics Administration � National Telecommunications and Information Administration vi

EXPLORING THE DIGITAL NATION:Home Broadband Internet Adoptionin the United States
TABLE OF CONTENTS
1. Introduction . . . . . . . . . . . . . . . . . . . . . . . . . . . . . . . . . . . . . . . . . . . . . . . . . . . . . . . . . . . . . . . 1
2. Data and Methodology . . . . . . . . . . . . . . . . . . . . . . . . . . . . . . . . . . . . . . . . . . . . . . . . . . . . . . . 3
3. Broadband Internet Use in 2007 and 2009 . . . . . . . . . . . . . . . . . . . . . . . . . . . . . . . . . . . . . . . 5
4. Broadband Internet Use in 2009: Demographic and Geographic Characteristics . . . . . . . . 7
4.1 Broadband Internet Use by Household Characteristics . . . . . . . . . . . . . . . . . . . . . . . . . . . 7
4.2 Marginal Effects of Demographic and Geographic Characteristics on theLikelihood that a Household Uses Broadband Internet at Home . . . . . . . . . . . . . . . . . . 10
5. Main Reason for Non-Adoption of Home Broadband Internet . . . . . . . . . . . . . . . . . . . . . . 17
5.1 Among Internet Non-Users . . . . . . . . . . . . . . . . . . . . . . . . . . . . . . . . . . . . . . . . . . . . . . . 18
5.2 Among Households Using the Internet Outside of Home . . . . . . . . . . . . . . . . . . . . . . . 20
5.3 Among Households with Dial-up Internet Access . . . . . . . . . . . . . . . . . . . . . . . . . . . . . . 23
6. Demographic and Geographic Characteristics of Broadband versusDial-up Internet Users . . . . . . . . . . . . . . . . . . . . . . . . . . . . . . . . . . . . . . . . . . . . . . . . . . . . . . 27
7. Disability and Broadband Internet Use . . . . . . . . . . . . . . . . . . . . . . . . . . . . . . . . . . . . . . . . . 30
7.1 Profile of People with Disabilities . . . . . . . . . . . . . . . . . . . . . . . . . . . . . . . . . . . . . . . . . . 30
7.2 Internet Use by People with Disabilities . . . . . . . . . . . . . . . . . . . . . . . . . . . . . . . . . . . . . 31
7.3 Main Reason for Non-Adoption by People with Disabilities . . . . . . . . . . . . . . . . . . . . . . 32
8. Long-Term Comparisons: 2001 versus 2009 . . . . . . . . . . . . . . . . . . . . . . . . . . . . . . . . . . . . . 35
8.1 Broadband Internet Use by Demographic Characteristics: 2001 versus 2009 . . . . . . . . . 35
8.2 Broadband Internet Use by Geographic Region, and Urban and Rural Locations: 2001 versus 2009 . . . . . . . . . . . . . . . . . . . . . . . . . . . . . . . . . . . . . 37
8.3 Broadband Internet Use by State: 2001 versus 2009 . . . . . . . . . . . . . . . . . . . . . . . . . . . . 37
8.4 Marginal Effects of Demographic and GeographicCharacteristics on Adoption over Time . . . . . . . . . . . . . . . . . . . . . . . . . . . . . . . . . . . . . . 39
8.4.1 Marginal Effects of Demographic and Geographic Characteristicson the Likelihood of Home Internet Use, 2001 versus 2009 . . . . . . . . . . . . . 39
8.4.2 Marginal Effects of Demographic and Geographic Characteristicson the Likelihood of Home Broadband Internet Use, 2007 versus 2009 . . . . 41
9. Conclusion . . . . . . . . . . . . . . . . . . . . . . . . . . . . . . . . . . . . . . . . . . . . . . . . . . . . . . . . . . . . . . . 42
References . . . . . . . . . . . . . . . . . . . . . . . . . . . . . . . . . . . . . . . . . . . . . . . . . . . . . . . . . . . . . . . . . . 44
U.S. Department of Commerce � Economics and Statistics Administration � National Telecommunications and Information Administration vii

Appendix
A1: Data . . . . . . . . . . . . . . . . . . . . . . . . . . . . . . . . . . . . . . . . . . . . . . . . . . . . . . . . . . . . . . . . 46
A2: Broadband Internet Use at the Individual Level, 2009 . . . . . . . . . . . . . . . . . . . . . . . . . . 47
A3: Marginal Effects of Demographic and Geographic Characteristicson the Likelihood that a Household UsesBroadband Internet at Home, 2009 . . . . . . . . . . . . . . . . . . . . . . . . . . . . . . . . . . . . . . . . 48
A4: Marginal Effects of Demographic and Geographic Characteristicson the Likelihood that a Household Uses Broadband Internet atHome, by Household Type, 2009 . . . . . . . . . . . . . . . . . . . . . . . . . . . . . . . . . . . . . . . . . 49
A5: People with Disabilities: Profile and Internet Use, 2009 . . . . . . . . . . . . . . . . . . . . . . . . . 51
A6: Broadband Internet Use by State, 2001 versus 2009 . . . . . . . . . . . . . . . . . . . . . . . . . . . . 52
A7: Marginal Effects of Demographic and Geographic Characteristicson the Likelihood that a Household Uses Internet at Home,2001 versus 2009 . . . . . . . . . . . . . . . . . . . . . . . . . . . . . . . . . . . . . . . . . . . . . . . . . . . . . . 54
A8: Marginal Effects of Demographic and Geographic Characteristicson the Likelihood that a Household Uses BroadbandInternet at Home, 2007 versus 2009 . . . . . . . . . . . . . . . . . . . . . . . . . . . . . . . . . . . . . . . 55
EXPLORING THE DIGITAL NATION: HOME BROADBAND INTERNET ADOPTION IN THE UNITED STATES
U.S. Department of Commerce � Economics and Statistics Administration � National Telecommunications and Information Administration viii

EXPLORING THE DIGITAL NATION:Home Broadband Internet Adoptionin the United States
Section 1: Introduction
The Internet has revolutionized the social and economic environment in which we live by providingan alternative or supplemental channel for communication, gathering and disseminating information,entertainment, commerce, and education. Household use of high-speed, or broadband, Internetservices has risen dramatically during this decade which demonstrates the key role the Internet playsin the everyday lives of many individuals. Nonetheless, not everyone either uses the Internet or hasaccess to it. This report, prepared jointly by the Commerce Department’s Economics and StatisticsAdministration (ESA) and National Telecommunications and Information Administration (NTIA),seeks to explain differences in broadband Internet use among households.
Despite dramatic growth in recent years, broadband Internet use varies significantly betweenhouseholds with different socio-economic, demographic, and geographic characteristics. A numberof recent studies, using data from different surveys, have shown this pattern. For example, a reportpublished by NTIA earlier in 2010 using Census data found that broadband Internet access rosebetween 2007 and 2009 for most demographic groups defined by income, education, age, race,employment status, household type, and gender. Despite these gains, the report found the highestrates of broadband Internet adoption in 2009 among Asians and Whites, married couples, youngerpeople, urban residents, people with higher incomes, and people with more education. The reportalso found that the primary reasons given by survey respondents for not having broadband Internetat home were related to affordability, demand, and availability. The Federal CommunicationsCommission (FCC), using data from an FCC survey conducted in 2009, found that people withmore education and higher income exhibit higher rates of broadband Internet use (Horrigan, 2010).They also found that Blacks and Hispanics, as well as senior citizens, lag behind in broadband Internetadoption. The Pew Internet Project, using data from a 2009 Pew survey, found that groups withhistorically lower broadband Internet use—including households with incomes less than $30,000,older people (50 and above), adults with only a high school degree, and rural Americans—exhibitedthe greatest growth in broadband Internet adoption between 2008 and 2009 (Horrigan, 2009). Themost recent 2010 data from the Pew Internet Project show that Blacks experienced impressive growthin broadband Internet adoption between 2009 and 2010, while most other demographic groupsexperienced either moderate or no growth (Smith, 2010).
This report builds on the findings of the NTIA report published earlier in 2010 in order to more fullyexplore the differences in broadband Internet use among households with different characteristics. Inaddition, this report analyzes the main reasons provided by households for non-adoption,characteristics associated with a lag in technology adoption, and long-term growth in home
U.S. Department of Commerce � Economics and Statistics Administration � National Telecommunications and Information Administration 1

broadband Internet use across population subgroups and geographic locations. The next sectiondescribes the data and methodology employed in this study. Section 3 looks at the pattern ofhousehold Internet use in 2007 and 2009. Section 4 shows how demographic characteristics andgeographic location of households are associated with home broadband Internet adoption. Section 5analyzes the main reasons provided by households for non-adoption. Section 6 analyzes who lags intechnology adoption by comparing users of dial-up Internet services with users of broadband Internetservices. Section 7 looks at broadband Internet adoption by people with disabilities. Finally, Section8 studies long-term changes in home broadband and Internet use by comparing the most recent datafrom 2009 with that from 2001, and Section 9 provides some concluding remarks.
EXPLORING THE DIGITAL NATION: HOME BROADBAND INTERNET ADOPTION IN THE UNITED STATES
U.S. Department of Commerce � Economics and Statistics Administration � National Telecommunications and Information Administration 2

Section 2: Data and Methodology
This report uses data from a special supplement to the Census Bureau’s Current Population Survey(CPS). The CPS is a monthly survey of a representative sample of the U.S. population, and providesdata on labor force participation, income, and demographic characteristics of households. The specialsupplement utilized in this report, the CPS Internet Use Supplement, periodically gathers informationon household Internet use. This report analyzes data from the most recent survey conducted inOctober 2009, the eighth such Internet survey conducted since the early 1990s. The October 2009CPS interviewed 54,324 households. For a more detailed description of the survey, see Section A1 ofthe Appendix.
The October 2009 Internet Use Supplement asked each household whether someone in thathousehold used the Internet and what kind of Internet connection technology was utilized at home(the respondent was asked to choose from three options: “dial-up” telephone service, “broadband,”1
or “something else”). The survey also asked households in which no one used the Internet or wherea “dial-up” telephone service was utilized, to state their main reason for not using broadband Internetservices. Using these data, one can therefore identify households and individuals who use broadbandInternet at home to connect to the Internet. This report focuses on broadband Internet use at thehousehold level, as opposed to individual level, since the decision to adopt a particular type of Internetservice technology at home likely occurs at the household level.2 One would expect a household toevaluate the cost of the technology relative to the collective benefit of the technology for all householdmembers. The outcome of this decision-making process, comparing the costs versus the collectivebenefits, is likely to vary across household types.
Our sample consists of all households where the age of the head of the household is 16 or above.There are 54,280 household records in our sample, representing 119 million American households.We analyze broadband Internet use at the household level and its association with household-levelcharacteristics. For characteristics like education, race, ethnicity, age, disability status, and foreign-born status, we use the information for the head of household. In this report we use the words“adoption,” “use,” “utilization,” and “connectivity” interchangeably in order to indicate that ahousehold reported using a broadband service at home to connect to the Internet.
As mentioned in the previous section, this report builds on the findings in NTIA (2010) which showsthat certain population subgroups, specifically people with higher incomes, those with moreeducation, Asians, Whites, married couples, those who are younger, and residents of urban areasexhibit the highest rates of broadband Internet use. These findings point to several areas of inquiry,particularly whether socio-economic differences among households explain the differences inbroadband Internet use. For instance, is the higher rate of broadband Internet use among urbanhouseholds explained by the differences in income and education between urban and rural
EXPLORING THE DIGITAL NATION: HOME BROADBAND INTERNET ADOPTION IN THE UNITED STATES
U.S. Department of Commerce � Economics and Statistics Administration � National Telecommunications and Information Administration 3
1 In the 2009 CPS Internet Use Supplement, a household with at least one of the following Internet services is considered to havebroadband: DSL, cable modem, fiber optics, satellite, wireless (such as Wi-Fi), mobile phone or PDA, or some other broadband Internetconnection (U.S. Census Bureau, 2009). It is not possible to identify in the survey which particular broadband service a household uses.2 Data on average broadband use at the individual level are presented in Appendix Section A2. The underlying trends do notsignificantly change if persons, instead of households, are the unit of analysis.

households? Or, stated another way, how much of an urban-rural difference in broadband Internetuse remains if we compare urban and rural households with similar income, education, and other keycharacteristics? Similarly, how much of a difference in broadband Internet use between White andHispanic households remains if we compare adoption between White and Hispanic households thathave similar income, education, geographic location, and other observed characteristics?
A simple tabulation of the data by household characteristics does not allow the researcher to answersuch questions. By utilizing a regression analysis framework, we can estimate the marginal or“isolated” association between broadband Internet use and a particular household attribute. Forexample, the marginal effect of income on broadband Internet use can be estimated by comparingbroadband Internet use among households that have different income levels but which are otherwisesimilar with respect to key attributes like education, race, ethnicity, age, geographic location, andother possible determinants of broadband Internet use. The regression will tell us how much thelikelihood of broadband Internet use would rise for a given increase in income, holding keydemographic and geographic characteristics constant.
The next section of this report (Section 3) looks at home broadband Internet usage patterns for 2007and 2009, and Section 4 employs a regression analysis framework to analyze how much of theobserved differences in broadband Internet use across households is explained by differences in socio-economic and geographic factors.
EXPLORING THE DIGITAL NATION: HOME BROADBAND INTERNET ADOPTION IN THE UNITED STATES
U.S. Department of Commerce � Economics and Statistics Administration � National Telecommunications and Information Administration 4

Section 3: Broadband Internet Use in 2007 and 2009
The top half of Figure 1 shows the pattern of Internet use among American households in 2009.Figure 1 shows that a significant portion of American households (64%) connected to the Internetfrom home utilizing a broadband Internet service. Another 5% used dialup services at home toconnect to the Internet. This means that almost seven out of ten American households (69%)connected to the Internet from home in 2009.3 Another 8% used the Internet at a location other thanhome, implying that more than three-fourths of all American households (77%) had at least oneperson who used the Internet in 2009. This was up from 71% in 2007 (the distribution for 2007 ispresented in the bottom half of Figure 1).
Broadband was by far the most frequently used technology for accessing the Internet from home. Theshare of households subscribing to broadband Internet services rose from 51% in 2007 to 64% in2009, implying that home broadband Internet use rose by one-fourth during the two year period.Households with a dial-up Internet service accounted for a shrinking share of Internet users – downfrom 11% in 2007 to 5% in 2009. The decline in dial-up users has been outweighed by the rise inbroadband users, resulting in a net increase in Internet use at home.
Despite this overall growth in Internet use, it is important to realize that a significant portion ofAmerican households (36%) did not have a broadband Internet service at home. Almost one-fourthof American households (23%) did not have any Internet user in 2009.
EXPLORING THE DIGITAL NATION: HOME BROADBAND INTERNET ADOPTION IN THE UNITED STATES
U.S. Department of Commerce � Economics and Statistics Administration � National Telecommunications and Information Administration 5
3 A negligible fraction of households (0.4% in 2009) reported using the Internet from home using “something else”, that is, somethingother than a dial-up telephone connection or broadband. As a result, the total share of households connecting to the Internet fromhome is 68.6% = 63.5% (using broadband) + 4.7% (using dial-up) + 0.4% (using “something else”).

EXPLORING THE DIGITAL NATION: HOME BROADBAND INTERNET ADOPTION IN THE UNITED STATES
U.S. Department of Commerce � Economics and Statistics Administration � National Telecommunications and Information Administration 6
Figure 1: Distribution of Internet Use by Households, 2007 and 2009
2009
2007
Use Internet at Home(Broadband)
64%
Use Internet at Home(Broadband)
51%
Use Internet at Home(Dial-up)
5%
Use Internet at Home(Dial-up)
11%
Use Internet,not at Home
8%
Use Internet,not at Home
9%
Don’t use Internet23%
Don’t use Internet29%
Source: U.S. Census Bureau, Current Population Survey (CPS) and CPS School Enrollment and Internet Use Supplement, October 2007 and October 2009, and ESA calculations.

Section 4: Broadband Internet Use in 2009:Demographic and Geographic Characteristics
This section will analyze how broadband Internet use varies across households of differentdemographic and socio-economic backgrounds and in different geographic locations. Section 4.1looks at average broadband Internet adoption rates by household characteristics and Section 4.2utilizes a regression analysis framework that enables us to isolate the impact of any one factor orcharacteristic on broadband Internet adoption. The results indicate that home broadband Internetuse is more prevalent among households with higher incomes and more education as well as amongWhites and urban households, and that the gaps in adoption between White and non-Whitehouseholds or between urban and rural households are not entirely explained by differences in socio-economic and demographic factors.
Section 4.1: Broadband Internet Use by Household Characteristics
Table 1 shows average broadband Internet usage rates by demographic characteristics. According toTable 1, home broadband Internet use is more prevalent among households with higher incomes,more education, Asians, and Whites. For example, slightly more than a third (36%) of householdswith annual family incomes less than $25,000 used broadband Internet at home in 2009, comparedto the majority of households with higher incomes. Slightly more than one-fourth (29%) ofhouseholds headed by someone with less than a high school degree used broadband Internet at home,compared to the vast majority (85%) of their counterparts with a college degree or more. Non-Hispanic Asian households (77%) had the highest rate of broadband Internet use in 2009, followedby non-Hispanic White households (68%). Hispanic (48%) and non-Hispanic Black (49%)households lagged behind with adoption rates that were about 20 percentage points lower than theirnon-Hispanic White counterparts.
Table 1 also shows that broadband Internet use is strongly correlated with age, household type, anddisability status. Seventy-one percent of households where the head of the household was between 16and 44 years of age had broadband Internet at home, compared to 40% of their counterparts aged 65years or more. The majority of married-couple families with children used broadband Internetservices at home (80%), compared to about two-thirds of family households without children (68%)and half of non-family households (51%). Households headed by someone with a disability werealmost half as likely as households headed by someone with no disability to have broadband Internet(38% compared to 68%).4 Finally, foreign-born non-U.S. citizens were less likely than Americancitizens to utilize broadband Internet at home (51% compared to 64%).5
EXPLORING THE DIGITAL NATION: HOME BROADBAND INTERNET ADOPTION IN THE UNITED STATES
U.S. Department of Commerce � Economics and Statistics Administration � National Telecommunications and Information Administration 7
4 In the CPS, a person with at least one of the following conditions is considered to have a disability: hearing impairment; blindness;impaired vision despite wearing glasses; physical, mental, or emotional condition that impairs the ability to concentrate, remember, ormake decisions; difficulty in walking or climbing stairs; difficulty in dressing or bathing; physical, mental, or emotional condition thatimpairs the ability to do errands alone such as visiting a doctor’s office or shopping (U.S. Census Bureau, 2009). 5 American citizens include both native-born American citizens as well as foreign-born persons who are naturalized U.S. citizens.

Table 2 shows average broadband Internetusage rates by geographic location ofhouseholds (by urban-rural status and by sizeof urban area). Note that this report uses theterms “urban” and “rural” to refer tometropolitan and nonmetropolitan areas,respectively.6 According to Table 2, broadbandInternet adoption, on average, was 15percentage points higher among urban dwellersthan among their rural-area counterparts (66%versus 51%). Urban areas with populationsbetween 2.5 million and 5 million displayedthe highest broadband Internet adoption ratewith 71% of households living in these areassubscribing to broadband Internet services.
EXPLORING THE DIGITAL NATION: HOME BROADBAND INTERNET ADOPTION IN THE UNITED STATES
U.S. Department of Commerce � Economics and Statistics Administration � National Telecommunications and Information Administration 8
Table 1: Household Broadband Internet Useby Demographic Characteristics, 2009
63.5
35.861.079.387.694.1
28.850.969.584.5
68.049.477.348.347.9
71.268.239.9
66.760.2
79.860.156.967.750.8
37.867.6
64.451.0
54,280119,267,400
Source: U.S. Census Bureau, Current Population Survey (CPS) and CPS School Enrollment and Internet Use Supplement, October 2009, and ESA calculations.
Note: *Sample includes all households with the head of the household at least 16 years of age. The information for the head of the household is used for education, race, ethnicity, age, gender, foreign-born status, and disability.
Household Broadband Internet Use: Percent of householdsconnecting to the Internet at home using broadband
All Households*Household Income Less than $25,000 $25,000-$50,000 $50,000-$75,000 $75,000-$100,000 More than $100,000Education Less than High School Degree High School Degree Some College College Degree or moreRace and Ethnicity White, Non-Hispanic Black, Non-Hispanic Asian, Non-Hispanic American Indian or Alaskan Native, Non-Hispanic HispanicAge 16 to 44 years 45 to 64 years 65 years and overGender Male FemaleHousehold Type Married-couple with children Single parent (male) Single parent (female) Family without children Non-family householdDisability Status Has a disability No disabilityForeign-Born Status Citizens (including foreign born) Non-Citizen Sample SizeEstimated Number of Households
Table 2: Household Broadband InternetUse by Geographic Characteristics, 2009
Source: U.S. Census Bureau, Current Population Survey (CPS) and CPS School Enrollment and Internet Use Supplement, October 2009, and ESA calculations.
Household Broadband Internet Use: Percent of householdsconnecting to the Internet at home using broadband
All HouseholdsUrban-Rural Status Urban (Metropolitan) Rural (Nonmetropolitan)Metropolitan Area (CBSA) Size Under 1,000,000 1,000,000-2,499,999 2,500,000-4,999,999 5,000,000 or more
Sample SizeEstimated Number of Households
63.5
65.951.0
63.166.170.566.9
54,280119,267,400
6 The geographic variable for identifying a household’s location asurban or rural is not available in the CPS public use files. Thisreport uses the terms “urban” and “rural” to refer to metropolitanand nonmetropolitan areas, respectively. The definition of ametropolitan area (effective since 2000) is based on “core basedstatistical area” (CBSA), which includes both metropolitan andmicropolitan statistical areas. According to the 2000 standards,each CBSA must have at least one urban area with at least 10,000inhabitants. Each metropolitan statistical area must contain atleast one urbanized area with population 50,000 or more. Eachmicropolitan statistical area must contain at least one urban clusterwith population between 10,000 and 50,000. As of June 6, 2003,there are 362 metropolitan statistical areas and 560 micropolitanstatistical areas in the U.S. For more information, see U.S. CensusBureau (2010a) and Office of Management and Budget (2010).

The next three tables dig deeper into the data bylooking at average broadband Internet usage ratesby race, ethnicity, income, and education withinurban and rural areas (Table 3) and then by crosstabulating broadband Internet usage data by raceand income, and by race and education for urbanand rural areas separately (Tables 4 and 5). Table 3shows that rural households with lower incomes,lower levels of education, and Black ruralhouseholds had particularly low broadband Internetadoption rates. Only about 28% of rural dwellerswith incomes less than $25,000 had broadbandInternet at home, compared to 38% of their urbancounterparts and 86% of their high-incomerural counterparts. A similar pattern holds fordemographic groups defined by race, ethnicity,and education.
Table 4 shows the cross-tabulated data on averagebroadband Internet usage rates by race and income,and by urban-rural location. The lowest rates ofbroadband Internet use (in this three-way urban-rural/race and ethnicity/income split) were amongthe lowest income Black and Hispanic householdsliving in rural areas (17% and 19%, respectively).Hispanic households in the lowest income category(less than $25,000) living in urban areas displayedthe next lowest level (27%) of home broadbandInternet utilization.
A similar pattern is displayed in Table 5, whichshows the cross-tabulated data on averagebroadband Internet use by race and educationalattainment, and by urban-rural location. Blackhouseholds headed by someone with less than ahigh school degree and living in rural areasexhibited the lowest level of broadband Internet use(11%). They were followed by White ruralhouseholds headed by someone with less than ahigh school degree (23%), Black rural householdsheaded by someone with a high school degree(24%), Hispanic households headed by someonewith less than a high school degree (both urban andrural) (26% and 25%, respectively), and Black
EXPLORING THE DIGITAL NATION: HOME BROADBAND INTERNET ADOPTION IN THE UNITED STATES
U.S. Department of Commerce � Economics and Statistics Administration � National Telecommunications and Information Administration 9
Table 3: Household BroadbandInternet Use by Metropolitan Status,
Race, and Income, 2009
Source: U.S. Census Bureau, Current Population Survey (CPS) and CPS School Enrollment and Internet Use Supplement, October 2009, and ESA calculations.
Household Broadband Internet Use: Percent of householdsconnecting to the Internet at home using broadband
All HouseholdsRace and Ethnicity Non-Hispanic White Non-Hispanic Black HispanicHousehold Income Less than $25,000 $25,000-$50,000 $50,000-$75,000 $75,000-$100,000 More than $100,000Education Less than High School Degree High School Degree Some College College Degree or more
Urban65.9
71.252.148.6
38.062.880.288.694.8
30.552.870.885.5
Rural51.0
54.228.736.9
28.052.473.681.386.1
21.743.662.074.7
Table 4: Household BroadbandInternet Use by Metropolitan Status,
Race, and Income, 2009
Source: U.S. Census Bureau, Current Population Survey (CPS) and CPS School Enrollment and Internet Use Supplement, October 2009, and ESA calculations.
Household Broadband Internet Use: Percent of householdsconnecting to the Internet at home using broadband
Race and IncomeNon-Hispanic White Household Income: Less than $25,000 Household Income: $25,000-$50,000 Household Income: $50,000-$75,000 Household Income: More than $75,000Non-Hispanic Black Household Income: Less than $25,000 Household Income: $25,000-$50,000 Household Income: $50,000-$75,000 Household Income: More than $75,000Hispanic Household Income: Less than $25,000 Household Income: $25,000-$50,000 Household Income: $50,000-$75,000 Household Income: More than $75,000
Urban
42.666.381.792.8
33.159.676.488.2
27.449.371.388.7
Rural
31.353.874.684.2
16.836.961.571.9
18.539.670.073.1

urban households headed by someone with lessthan a high school degree (27%).
Section 4.2: Marginal Effects ofDemographic and GeographicCharacteristics on the Likelihoodthat a Household Uses BroadbandInternet at Home
The finding that socio-economic characteristics, aswell as race, ethnicity, and geographic location arehighly correlated with adoption of home broadbandInternet services has important implications. Thesehousehold attributes are themselves correlated witheach other. For instance, income and education arelikely to be higher in urban areas if employmentopportunities requiring high levels of skills andspecialization are disproportionately located in urbanareas. As a result, it is not clear from the tabulations
we have seen so far how much of the urban-rural gap in adoption is driven by differences in incomeand education between urban and rural residents. The same issue applies for race and ethnicity, thatis, looking at average adoption levels by race and ethnicity does not tell us how much of the adoptiongap associated with race and ethnicity is explained by differences in socio-economic factors.
The rest of this section will utilize a regression analysis framework that estimates the impact ofmultiple factors together on the probability that a household adopts broadband Internet services athome. The results allow us to isolate or distinguish the effect of any one factor while holding all otherfactors constant. We refer to these results as the marginal effect of selected demographic andgeographic characteristics on household broadband Internet use. The factors that we control for inthis analysis include household income, education, age, race, ethnicity, foreign-born status, householdsize (total number of persons in household), disability status, and geographic location (urban-rurallocation and state). Note that the CPS data do not provide information on broadband Internetavailability and price in a household’s immediate location, which is why we are unable to directlycontrol for these factors. Both price and availability are important determinants of adoption. Theregression analysis, however, accounts for a household’s geographic location (urban versus rurallocation, the size of the urban area a household lives in, and state).7 As a result, these householdgeographic characteristics would capture some of the variation in broadband Internet price andavailability along these geographic dimensions.
EXPLORING THE DIGITAL NATION: HOME BROADBAND INTERNET ADOPTION IN THE UNITED STATES
U.S. Department of Commerce � Economics and Statistics Administration � National Telecommunications and Information Administration 10
Table 5: Household BroadbandInternet Use by Metropolitan Status,
Race, and Education, 2009
Source: U.S. Census Bureau, Current Population Survey (CPS) and CPS School Enrollment and Internet Use Supplement, October 2009, and ESA calculations.
Household Broadband Internet Use: Percent of householdsconnecting to the Internet at home using broadband
Race and EducationNon-Hispanic White Less than High School Degree High School Degree Some College College Degree or moreNon-Hispanic Black Less than High School Degree High School Degree Some College College Degree or moreHispanic Less than High School Degree High School Degree Some College College Degree or more
Urban
34.456.674.186.9
26.942.457.076.9
26.045.467.077.9
Rural
23.346.464.375.6
10.724.043.055.8
25.030.856.068.8
7 Table 6 and Figure 3 show the adoption gap between urban and rural households without controlling for urban area size. Figure 4and Appendix Table A3 (column 2) show the urban-rural gap by urban area size.

The full set of regression results from this analysis is presented in Section A3 of the Appendix. Table6 presents the estimated marginal effects of selected demographic and geographic factors on theprobability of broadband Internet adoption at home. The marginal effect of a particular householdcharacteristic, for instance, the impact of living in an urban location, is the isolated effect of an urbanlocation on the likelihood of broadband Internet use, after holding constant the above mentionedcharacteristics. In other words, the marginal effect of living in an urban location is the gap in averagebroadband Internet adoption between urban and rural households, after accounting for differencesbetween urban and rural households in income, education, age, race, ethnicity, household size,foreign-born status, disability status, and state of residence.
According to the results in Table 6, the likelihood of broadband Internet adoption among householdswith incomes between $25,000 and $50,000 is 16 percentage points higher than that amonghouseholds with incomes less than $25,000, after accounting for differences in other characteristics(education, age, race, ethnicity, household size, foreign-born status, disability status, urban-rural
EXPLORING THE DIGITAL NATION: HOME BROADBAND INTERNET ADOPTION IN THE UNITED STATES
U.S. Department of Commerce � Economics and Statistics Administration � National Telecommunications and Information Administration 11
Table 6: Marginal Effects of Selected Demographic and Geographic Characteristics onthe Likelihood that a Household Uses Broadband Internet at Home, 2009
Source: U.S. Census Bureau, Current Population Survey (CPS) and CPS School Enrollment and Internet Use Supplement, October 2009, and ESA calculations.
Note: Sample includes all households with the head of the household at least 16 years of age and with non-missing data on household income. The sample size declines from 54,280 for tabulations to 43,662 for regressions because of excluding observations with missing data on household income. Controls for age, household size and state of residence are included. See Appendix Table A3 (column 1) for the full set of regression results. *This category includes Native Americans, Hawaiian/Pacific Islanders, and those who report two or more races.
Adoption Gap: Difference in average broadband Internet adoption after controlling for demographic and geographic factors
Adoption Gap(Percentage point)
16273134
112329
101405
7
6
5
43,66294,963,684
Household Characteristic
Household Income Gap between households with incomes $25,000 to $50,000 and households with incomes less than $25,000 Gap between households with incomes $50,000 to $75,000 and households with incomes less than $25,000 Gap between households with incomes $75,000 to $100,000 and households with incomes less than $25,000 Gap between households with incomes more than $100,000 and households with incomes less than $25,000Education Gap between those with a high school degree and those with less than high school degree Gap between those with some college and those with less than high school degree Gap between those with college degree or more and those with less than high school degreeRace and Ethnicity Gap between Non-Hispanic White and Non-Hispanic Black Gap between Non-Hispanic White and Hispanic Gap between Non-Hispanic White and Non-Hispanic Asian Gap between Non-Hispanic White and Other*Urban-Rural Gap between urban and rural householdsForeign-born Status Gap between U.S. citizens and foreign-born non-citizensDisability Gap between those with no disability and with disability
Sample SizeEstimated Number of Households

status, and state of residence). Note that Table 1 showed average broadband Internet usage rates of61% and 36% for these two groups, implying an adoption gap of 25 percentage points beforecontrolling for these other factors. This means that differences in other characteristics like education,race, ethnicity, age, geographic location, household size, foreign-born status, and disability explainsome of the differences in broadband Internet adoption between these two groups. Therefore, theadoption gap declines from 25 percentage points to 16 percentage points once we account for theseattributes.
Relative to households in the lowest income category (less than $25,000), the increased likelihood ofadoption, or adoption gap, is 27 percentage points for households with family incomes between$50,000 and $75,000; 31 percentage points for households with family incomes between $75,000and $100,000; and 34 percentage points for households with family incomes exceeding $100,000.Two implications are apparent. First, income is strongly associated with broadband Internet use. Thepositive association between income and broadband connectivity persists even after accounting fordifferences in a large number of key characteristics including education, age race, ethnicity, andgeography. Second, the rising effect of income diminishes as income grows.
A similar phenomenon is apparent for education. According to Table 6, the likelihood of broadbandInternet use, on average, is 11 percentage points higher among households that are headed bysomeone with a high school degree compared to households that are headed by someone with less thana high school degree, again holding all other factors equal. The adoption gap is 23 percentage pointsbetween those with some college and those without a high school diploma, and 29 percentage pointsbetween those with at least a college degree and those without a high school diploma. As with income,this suggests that education is strongly associated with broadband Internet adoption, even afteraccounting for differences in income, age, race, ethnicity, and a number of other key characteristics.Households with higher levels of income and education are more likely to have the necessary resourcesand skills to obtain and use broadband Internet services at home.
Table 1 showed average broadband Internet usage rates of 68% for non-Hispanic White households,49% for non-Hispanic Black households, and 48% for Hispanic households, implying that the gapin average adoption was 19 percentage points between White and Black households, and20 percentage points between White and Hispanic households. Table 6 shows that, once we havecontrolled for socio-economic and geographic attributes, the White-Black adoption gap declines to 10percentage points and the White-Hispanic adoption gap declines to 14 percentage points. Figure 2plots these White-Black and White-Hispanic adoption gaps. Figure 2 uses two bars to display theadoption gap between any two groups of people. The bottom bar of each pair (which is also thelonger bar) shows the gap in average adoption from Table 1. The top bar of each pair (which is alsothe shorter bar) shows the remaining unexplained adoption gap after accounting for differences inhousehold demographic, socio-economic, and geographic characteristics (from Table 6). Theremaining gap suggests that the broadband Internet adoption gap associated with race and ethnicityis not entirely explained by differences in income or other non-income attributes. Income, education,age, foreign-born status, and other demographic and geographic characteristics explain about one-halfof the White-Black gap and one-fourth of the White-Hispanic gap in broadband Internet usage.As a result, a sizeable gap in adoption remains after controlling for socio-economic andgeographic factors.
EXPLORING THE DIGITAL NATION: HOME BROADBAND INTERNET ADOPTION IN THE UNITED STATES
U.S. Department of Commerce � Economics and Statistics Administration � National Telecommunications and Information Administration 12
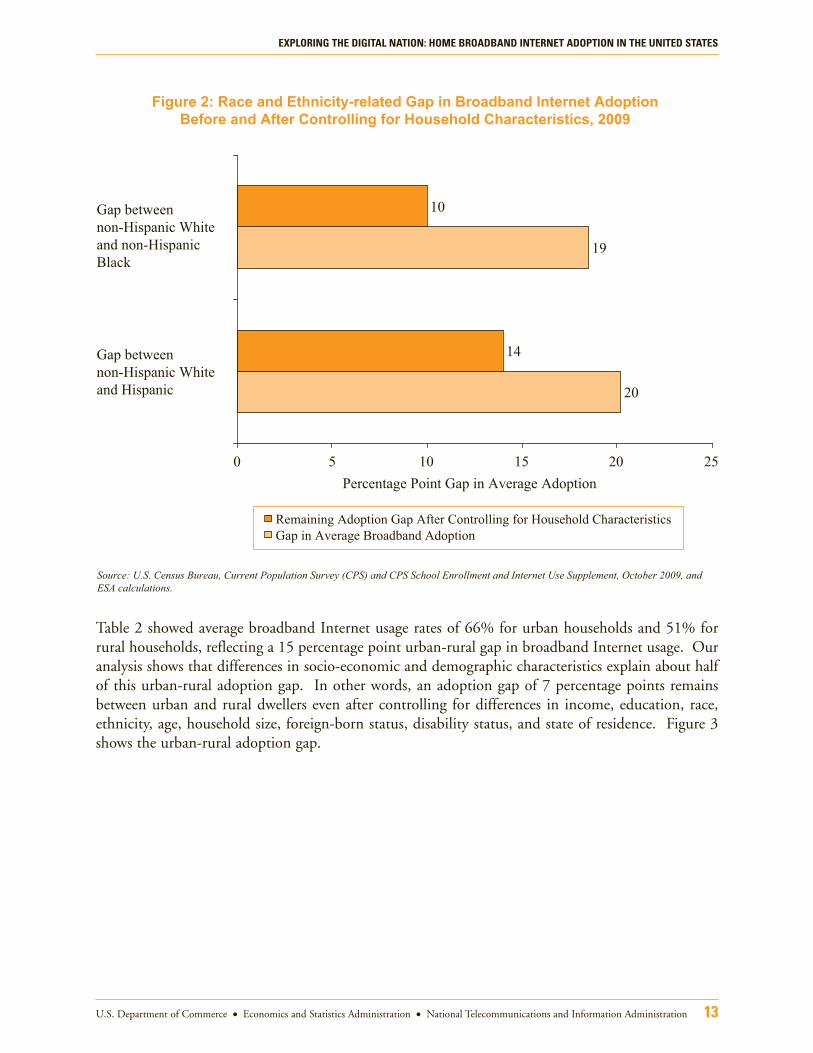
Table 2 showed average broadband Internet usage rates of 66% for urban households and 51% forrural households, reflecting a 15 percentage point urban-rural gap in broadband Internet usage. Ouranalysis shows that differences in socio-economic and demographic characteristics explain about halfof this urban-rural adoption gap. In other words, an adoption gap of 7 percentage points remainsbetween urban and rural dwellers even after controlling for differences in income, education, race,ethnicity, age, household size, foreign-born status, disability status, and state of residence. Figure 3shows the urban-rural adoption gap.
EXPLORING THE DIGITAL NATION: HOME BROADBAND INTERNET ADOPTION IN THE UNITED STATES
U.S. Department of Commerce � Economics and Statistics Administration � National Telecommunications and Information Administration 13
Figure 2: Race and Ethnicity-related Gap in Broadband Internet AdoptionBefore and After Controlling for Household Characteristics, 2009
Source: U.S. Census Bureau, Current Population Survey (CPS) and CPS School Enrollment and Internet Use Supplement, October 2009, and ESA calculations.
20
19
14
10
0 5 10 15 20 25Percentage Point Gap in Average Adoption
Remaining Adoption Gap After Controlling for Household Characteristics Gap in Average Broadband Adoption
Gap between non-Hispanic White and non-Hispanic Black
Gap between non-Hispanic White and Hispanic

Our analysis also shows that the urban-rural gap in broadband Internet adoption varies with the sizeof the urban area. Compared to rural residents, the likelihood of broadband Internet use is 9percentage points higher for households residing in urban areas with populations exceeding two andhalf million, and 6 to 7 percentage points higher for households living in urban areas with populationsless than two and half million (Appendix Table A3, Column 2). According to Table 2, the urban-ruralgap in adoption, before controlling for socio-economic factors and state of residence, ranged from 12percentage points to 20 percentage points depending on the size of the urban area. Figure 4 plotsthese adoption gaps by the size of the urban area. This again implies that socio-economic factorsexplain a substantial, but not the entire, urban-rural broadband Internet adoption gap. BroadbandInternet price and availability are likely to explain some of the remaining urban-rural gap—the higheradoption rates in larger urban areas may be driven by lower prices and more availability of broadbandInternet services in these areas.
Table 1 showed average broadband Internet adoption rates of 38% for households headed by someonewith a disability and 68% for households headed by someone with no disability, implying a 30percentage point adoption gap. The gap in adoption declines to 5 percentage points after controllingfor socio-economic and geographic characteristics (Table 6), implying that the vast majority of theadoption gap associated with disability is explained by differences in these factors. This was not thecase for race and ethnicity where a sizeable gap in adoption remained. Figure 5 shows the adoptiongap associated with disability.
Table 6 also shows that foreign-born non-citizen households were, on average, 6 percentage points lesslikely than their U.S. citizen counterparts to subscribe to broadband Internet. This means that income,education, race, ethnicity and other observed characteristics explain more than half of the initial 13percentage point gap in adoption between foreign-born non-citizens and American citizens (Table 1).
EXPLORING THE DIGITAL NATION: HOME BROADBAND INTERNET ADOPTION IN THE UNITED STATES
U.S. Department of Commerce � Economics and Statistics Administration � National Telecommunications and Information Administration 14
Figure 3: Urban-Rural Gap in Broadband Internet AdoptionBefore and After Controlling for Household Characteristics, 2009
Source: U.S. Census Bureau, Current Population Survey (CPS) and CPS School Enrollment and Internet Use Supplement, October 2009, and ESA calculations.
Remaining Adoption Gap After Controlling for Household Characteristics Gap in Average Broadband Adoption
15
7
0 2 4 6 8 10 12 14 16
Gap between Urbanand Rural
Percentage Point Gap in Average Adoption

EXPLORING THE DIGITAL NATION: HOME BROADBAND INTERNET ADOPTION IN THE UNITED STATES
U.S. Department of Commerce � Economics and Statistics Administration � National Telecommunications and Information Administration 15
Figure 4: Urban-Rural Gap in Broadband Internet Adoption Before and AfterControlling for Household Characteristics, by Urban Area Size, 2009
Source: U.S. Census Bureau, Current Population Survey (CPS) and CPS School Enrollment and Internet Use Supplement, October 2009, and ESA calculations.
Remaining Adoption Gap After Controlling for Household Characteristics Gap in Average Broadband Adoption
Percentage Point Gap in Average Adoption
16
20
15
12
9
9
7
6
0 5 10 15 20 25
Gap between Urban (with population less than 1 million) and Rural
Gap between Urban (with population between 1 and 2.5 million) and Rural
Gap between Urban (with population between 2.5 and 5 million) and Rural
Gap between Urban (with population more than 5 million) and Rural
Figure 5: Disability-related Gap in Broadband Internet AdoptionBefore and After Controlling for Household Characteristics, 2009
Source: U.S. Census Bureau, Current Population Survey (CPS) and CPS School Enrollment and Internet Use Supplement, October 2009, and ESA calculations.
Remaining Adoption Gap After Controlling for Household Characteristics Gap in Average Broadband Adoption
Percentage Point Gap in Average Adoption
30
5
0 5 10 15 20 25 30 35
Gap between People with no disability and with disability

In addition, our estimates show that the likelihood of broadband Internet use increases with age upto about age 30 to 35, after which it declines as age increases (not shown here). The state indicatorvariable accounts for a separate state-specific effect (these are not reported) and shows that significantdifferences exist in broadband Internet use across states, even after accounting for differences inincome, education, urban-rural status, and other household characteristics. Finally, our analysis showsthat the likelihood of home broadband Internet use increases with household size.
In summary, the regression results presented in this section suggest that income and education arestrongly associated with broadband Internet use at home but are not the sole determinants. Otherfactors, particularly race, ethnicity, and urban-rural location, are also independently associated withhome broadband Internet adoption. The adoption gaps associated with race and ethnicity, or urbanand rural locations, are not entirely explained by socio-economic characteristics, i.e., these gaps do notdisappear after accounting for differences in income, education, and a number of other key householdattributes. Socio-economic factors, however, explain a substantial portion of the adoption gapassociated with disability.
As mentioned previously, the decision to adopt broadband or any other type of Internet servicetechnology at home likely occurs at the household level after evaluating the cost of the technologyrelative to the collective benefit of the technology for all household members. This suggests that thedecision-making process is likely to vary across household types. We looked at the marginal effects ofsocio-economic and geographic attributes for four different household types—married couples withchildren, single parents with children, family households without children, and non-familyhouseholds. The association between broadband Internet use and socio-economic and geographicattributes was quite robust across different household types. A brief discussion of these results ispresented in Section A4 of the Appendix.
The CPS data do not provide information on price and availability of broadband Internet in ahousehold’s immediate location, which is why we are unable to account for these factors and thereforeunable to distinguish how much of the variation across socio-economic and geographic dimensions islikely driven by demand versus supply-related factors. Part of the non-adoption may result from lowerdemand for broadband Internet, related to affordability or cost. But some non-adoption may occurbecause of lack of supply or availability of broadband Internet services. For instance, are ruralresidents less likely to adopt because they have lower demand for broadband Internet or becausebroadband Internet availability is limited in their location?
The CPS Internet Use Supplement does ask households to state their main reason for not using homebroadband Internet services. The next section will analyze these reasons. We will see that factors likeaffordability, perceived need or interest, complementary equipment, and availability all playsignificant roles in a household’s adoption decision.
EXPLORING THE DIGITAL NATION: HOME BROADBAND INTERNET ADOPTION IN THE UNITED STATES
U.S. Department of Commerce � Economics and Statistics Administration � National Telecommunications and Information Administration 16

Section 5: Main Reason for Non-Adoptionof Home Broadband Internet
This section will analyze the principal reason for not having broadband Internet access at home. TheCPS asks three types of non-users to state their main reason for not using home broadband Internetservices—households that do not use the Internet generally, households that do not use the Internetspecifically at home but report using the Internet elsewhere, and households that use a dial-upInternet service at home. Figure 6 tabulates the responses from all households without broadbandInternet access, whereas Sections 5.1-5.3 separately analyze the responses from each group in order tounderstand whether adoption decisions of different groups are impacted by different factors. Notethat the reasons provided by households reflect their subjective opinion since a household may nothave full information on pricing, availability, or the benefit of using broadband Internet. For instance,a household may believe that broadband Internet is not available in its area, but be misinformed. Asa result, any comparison across households, while informative, needs to be done with caution.
Figure 6 shows that the most commonly cited reason for not having broadband Internet access athome was “don’t need” (38%), followed by “too expensive”(26%) and “inadequate computer” (18%).The next three sections, however, will show that the relative significance of these factors varies acrossdifferent types of non-users.
EXPLORING THE DIGITAL NATION: HOME BROADBAND INTERNET ADOPTION IN THE UNITED STATES
U.S. Department of Commerce � Economics and Statistics Administration � National Telecommunications and Information Administration 17
Figure 6: Main Reason for Non-Adoption of Home Broadband Internet, 2009
Don’t need it - not interested38%
Not available in area4%
Lack of confidence or skill3%
No computer orcomputer inadequate
18%
Source: U.S. Census Bureau, Current Population Survey (CPS) and CPS School Enrollment and Internet Use Supplement, October 2009, and ESA calculations.
Note: The figure does not include the categories that were reported as the main reason by less than 1% of non-users.
Other reasons6%
Can use it somewhere else4%
Too expensive26%

Section 5.1: Among Internet Non-Users
Figure 1 in Section 3 showed that almost one-fourth of American households (23%) in 2009 reportedthat no one in those households used the Internet at any location. This section will analyze the reasonsgiven by these households for not having broadband Internet access at home. This group accountsfor 65% of all those that do not access broadband Internet at home.
Lack of need or interest was the most commonly cited reason for not using broadband Internetservices at home. Figure 7 shows that 47% of households who did not use the Internet cited “don’tneed it—not interested” as their principal reason for not subscribing to home broadband Internetservices. Another 22% cited lack of an adequate computer. Only 19% cited affordability or cost.This means that a perceived lack of value or need was a more significant factor than affordability fornon-use of broadband Internet services.
Table 7 shows the results for the overall sample as well as for urban and rural households. The tworight columns of Table 7 show that the rankings are largely unchanged for urban and rural households.A larger share of rural households than their urban counterparts, however, stated lack of need as themajor reason (52% compared to 46%), while a smaller share of rural households stated affordabilityas the major deterrent (16% compared to 20%). Lack of availability was not a significant impedimentfor either group.
EXPLORING THE DIGITAL NATION: HOME BROADBAND INTERNET ADOPTION IN THE UNITED STATES
U.S. Department of Commerce � Economics and Statistics Administration � National Telecommunications and Information Administration 18
Figure 7: Main Reason Provided by Internet Non-Users, 2009
Don’t need it - not interested47%
Lack of confidenceor skill
4%No computer or
computer inadequate22%
Source: U.S. Census Bureau, Current Population Survey (CPS) and CPS School Enrollment and Internet Use Supplement, October 2009, and ESA calculations.
Note: The figure does not include the categories that were reported as the main reason by less than 1% of non-users. See column 1 of Table 7 for the full set of results.
Other reasons5%
Can use it somewhere else
1%Too expensive
19%

Table 8 shows the reasons by income categories. A lack of need or interest was the primary reason fornon-use in every income group. Affordability was much more important for low-income households,however. Lack of an adequate computer played an important role for all households.
Table 9 identifies the reasons for non-use by race and ethnicity. The most important factor for all groupswas need, although more White households than Black and Hispanic households gave this as the primaryreason. In addition, affordability was a more significant factor for Black and Hispanic households.
EXPLORING THE DIGITAL NATION: HOME BROADBAND INTERNET ADOPTION IN THE UNITED STATES
U.S. Department of Commerce � Economics and Statistics Administration � National Telecommunications and Information Administration 19
Distribution of main reason by households (%)
Table 7: Main Reason Provided by Internet Non-Users, by Metropolitan Status, 2009
Source: U.S. Census Bureau, Current Population Survey (CPS) and CPS School Enrollment and Internet Use Supplement, October 2009, and ESA calculations..
Note: The sample size for urban and rural households does not add up to the total sample size because metropolitan-nonmetropolitan status is not identified for a small number of households. The share of households not using the Internet in 2009 was 23% for all households, 22% for urban households, and 32% for rural households.
All
47.218.61.40.722.30.30.14.35.1
12,46727,821,275
Rural
51.515.60.71.123.00.30.13.74.1
3,4696,042,974
Urban
46.019.51.60.522.10.30.14.55.4
8,90221,585,515
Don’t need it – not interested Too expensive Can use it somewhere else Not available in area No computer or computer inadequate Privacy and security Concern for children’s access Lack of confidence or skill Other reasons
Sample sizeEstimated number of households
Distribution of main reason by households (%)
Table 8: Main Reason Provided by Internet Non-Users, by Income, 2009
Source: U.S. Census Bureau, Current Population Survey (CPS) and CPS School Enrollment and Internet Use Supplement, October 2009, and ESA calculations.
Note: The share of households not using the Internet in 2009 was 23% for all households, 47% for households with incomes less than $25,000, 22% for households with incomes between $25,000 and $50,000, 8% for households with incomes between $50,000 and $75,000, and 4% for households with incomes between $75,000 and $100,000. The highest income category (income exceeding $100,000) was omitted because only a small minority, 2%, of households in this category did not use the Internet.
Income$25,000-$50,000
48.317.92.20.821.00.40.23.65.6
2,6195,738,875
Income$75,000-$100,000
54.07.44.42.819.40.80.74.36.2
183399,577
Income$50,000-$75,000
47.714.82.51.422.61.10
4.55.3
6431,416,225
All
47.218.61.40.722.30.30.14.35.1
12,46727,821,275
Don’t need it – not interested Too expensive Can use it somewhere else Not available in area No computer or computer inadequate Privacy and security Concern for children’s access Lack of confidence or skill Other reasons
Sample sizeEstimated number of households
Income Lessthan $25,000
42.022.21.00.524.40.20
4.85.0
5,55012,410,004

Section 5.2: Among Households Using the Internet Outside of Home
Figure 1 showed that 8% of American households in 2009 did not access the Internet from home butused it elsewhere. This section will analyze the reasons given by these households for not subscribingto home broadband Internet services. This group represents 22% of those that do not use broadbandInternet at home.
Unlike the primary reason provided by Internet non-users (lack of need or interest), the mostcommonly cited reason by households that did not use the Internet specifically at home was relatedto affordability or cost. This is not surprising since these persons used the Internet, but not at home,demonstrating their perceived interest and need for high-speed Internet. Figure 8 shows that 40% ofhouseholds that used the Internet at a place other than home cited “too expensive” as the mainimpediment to using broadband Internet at home. Another 17% cited lack of need or interest, 17%cited lack of an adequate computer, and 15% cited the ability to use it somewhere else.
EXPLORING THE DIGITAL NATION: HOME BROADBAND INTERNET ADOPTION IN THE UNITED STATES
U.S. Department of Commerce � Economics and Statistics Administration � National Telecommunications and Information Administration 20
Distribution of main reason by households (%)
Table 9: Main Reason Provided by Internet Non-Users, by Race and Ethnicity, 2009
Source: U.S. Census Bureau, Current Population Survey (CPS) and CPS School Enrollment and Internet Use Supplement, October 2009, and ESA calculations..
Note: The share of households not using the Internet in 2009 was 23% for all households, 20% for White households, 32% for Black households, and 36% for Hispanic households.
Non-HispanicBlack
40.723.51.80.423.60.30.13.95.7
1,7784,774,134
Hispanic
35.029.41.90.526.00.10.23.23.7
1,8244,978,057
All
47.218.61.40.722.30.30.14.35.1
12,46727,821,275
Don’t need it – not interested Too expensive Can use it somewhere else Not available in area No computer or computer inadequate Privacy and security Concern for children’s access Lack of confidence or skill Other reasons
Sample sizeEstimated number of households
Non-HispanicWhite
53.014.11.10.721.10.30.14.35.3
8,25916,862,626

EXPLORING THE DIGITAL NATION: HOME BROADBAND INTERNET ADOPTION IN THE UNITED STATES
U.S. Department of Commerce � Economics and Statistics Administration � National Telecommunications and Information Administration 21
Figure 8: Main Reason Provided by Households Using the Internet Outside of Home, 2009
Too expensive40%
Not available in area3%Don’t need it - not interested
17%
Source: U.S. Census Bureau, Current Population Survey (CPS) and CPS School Enrollment and Internet Use Supplement, October 2009, and ESA calculations.
Note: The figure does not include the categories that were reported as the main reason by less than 1% of non-users. See column 1 of Table 10 for the full set of results.
No computer orcomputer inadequate
17%
Other reasons8%
Can use it somewhere else
15%
Distribution of main reason by households (%)
Table 10: Main Reason Provided by Households Using theInternet Outside of Home, by Metropolitan Status, 2009
Source: U.S. Census Bureau, Current Population Survey (CPS) and CPS School Enrollment and Internet Use Supplement, October 2009, and ESA calculations..
Note: The sample size for urban and rural households does not add up to the total sample size because metropolitan-nonmetropolitan status is not identified for a small number of households. The share of households using the Internet at a location other than home in 2009 was 8% for all households, 8% for urban households, and 10% for rural households.
All
16.739.714.82.716.90.30.40.48.2
4,2959,522,716
Rural
17.936.514.95.016.50.11.10.37.8
1,0971,851,736
Urban
16.540.614.72.116.90.30.20.58.3
3,1587,582,552
Don’t need it – not interested Too expensive Can use it somewhere else Not available in area No computer or computer inadequate Privacy and security Concern for children’s access Lack of confidence or skill Other reasons
Sample sizeEstimated number of households

Table 10 shows the results for the overall sample as well as for urban and rural households. The tworight columns of Table 10 show that urban and rural households rank these factors in a similarmanner. Lack of availability, cited by 5% of rural households and 2% of urban households, was nota major deterrent to home broadband Internet use. As we will see in the next section, this is not thecase for households using a dial-up Internet service.
Table 11 identifies the major reasons for not using broadband Internet at home by income categories.Affordability was the primary factor for households in the two lower income categories whereas otherfactors, like lack of demand, availability somewhere else, and lack of an adequate computer, were atleast as important as affordability for households with incomes between $75,000 and $100,000. Thissuggests that affordability was among the top issues for Internet users that did not purchase homebroadband Internet services, and this is true across a broad range of incomes.
Table 12 shows the primary reasons for not using broadband Internet at home by race and ethnicity.The most important reason was once again related to expense. However, a larger share of Black andHispanic households (46% and 47%, respectively) than White households (35%) cited expense as theprimary deterrent.
EXPLORING THE DIGITAL NATION: HOME BROADBAND INTERNET ADOPTION IN THE UNITED STATES
U.S. Department of Commerce � Economics and Statistics Administration � National Telecommunications and Information Administration 22
Distribution of main reason by households (%)
Table 11: Main Reason Provided by Households Usingthe Internet Outside of Home, by Income, 2009
Source: U.S. Census Bureau, Current Population Survey (CPS) and CPS School Enrollment and Internet Use Supplement, October 2009, and ESA calculations.
Note: The share of households using the Internet at a location other than home in 2009 was 8% for all households, 12% for households with incomes less than $25,000, 10% for households with incomes between $25,000 and $50,000, 6% for households with incomes between $50,000 and $75,000, and 4% for households with incomes between $75,000 and $100,000. The highest income category (income exceeding $100,000) was omitted because only a small minority, 2%, of households in this category used the Internet at a location other than home.
Income$25,000-$50,000
17.835.315.93.417.40.50.40.68.7
1,2292,675,640
Income$75,000-$100,000
26.217.621.68.615.6
00
0.110.4
193397,588
Income$50,000-$75,000
27.326.617.82.613.50.30.60.510.8
5351,119,851
All
16.739.714.82.716.90.30.40.48.2
4,2959,522,716
Don’t need it – not interested Too expensive Can use it somewhere else Not available in area No computer or computer inadequate Privacy and security Concern for children’s access Lack of confidence or skill Other reasons
Sample sizeEstimated number of households
Income Lessthan $25,000
8.553.610.31.019.2
00.40.46.5
1,4523,282,895

Section 5.3: Among Households with Dial-up Internet Access
Figure 1 showed that 5% of American households in 2009 used a dial-up telephone service to accessthe Internet from home. This group comprises the underlying sample for Figure 9 and Tables 13through 15 (representing 13% of those that do not access broadband Internet at home), and theirresponses for why they use a dial-up service, as opposed to a broadband Internet connection, aretabulated in these tables.
Figure 9 shows that the most commonly cited reason among dial-up users for not subscribing tobroadband Internet at home in 2009 was “too expensive” (41%), followed by “don’t need it – notinterested” (27%), and lack of availability (20%).
EXPLORING THE DIGITAL NATION: HOME BROADBAND INTERNET ADOPTION IN THE UNITED STATES
U.S. Department of Commerce � Economics and Statistics Administration � National Telecommunications and Information Administration 23
Distribution of main reason by households (%)
Table 12: Main Reason Provided by Households Usingthe Internet Outside of Home, by Race and Ethnicity, 2009
Source: U.S. Census Bureau, Current Population Survey (CPS) and CPS School Enrollment and Internet Use Supplement, October 2009, and ESA calculations.
Note: The share of households using the Internet at a location other than home in 2009 was 8.0% for all households, 7% for White households, 14% for Black households, and 11% for Hispanic households.
Non-HispanicBlack
13.645.512.31.220.60.20.50.35.7
7472,026,284
Hispanic
13.847.012.20.917.40.40.50.67.2
5791,533,738
All
16.739.714.82.716.90.30.40.48.2
4,2959,522,716
Don’t need it – not interested Too expensive Can use it somewhere else Not available in area No computer or computer inadequate Privacy and security Concern for children’s access Lack of confidence or skill Other reasons
Sample sizeEstimated number of households
Non-HispanicWhite
18.535.416.33.815.50.20.40.49.3
2,7145,500,807

EXPLORING THE DIGITAL NATION: HOME BROADBAND INTERNET ADOPTION IN THE UNITED STATES
U.S. Department of Commerce � Economics and Statistics Administration � National Telecommunications and Information Administration 24
Figure 9: Main Reason Provided by Households with Dial-up Internet Access, 2009
Too expensive41%
Can use it somewhere else2%
Don’t need it - not interested27%
Source: U.S. Census Bureau, Current Population Survey (CPS) and CPS School Enrollment and Internet Use Supplement, October 2009, and ESA calculations.
Note: The figure does not include the categories that were reported as the main reason by less than 1% of non-users. See column 1 of Table 13 for the full set of results.
No computer orcomputer inadequate
1%
Other reasons8%
Not available in area20%
Distribution of main reason by households (%)
Table 13: Main Reason Provided by Households withDial-up Internet Access, by Metropolitan Status, 2009
Source: U.S. Census Bureau, Current Population Survey (CPS) and CPS School Enrollment and Internet Use Supplement, October 2009, and ESA calculations.
Note: The sample size for urban and rural households does not add up to the total sample size because metropolitan-nonmetropolitan status is not identified for a small number of households.The share of households using a dial-up Internet access in 2009 was 5% for all households, 4% for urban households, and 7% for rural households.
All
27.341.31.619.91.10.30.10.87.6
2,6395,648,799
Rural
18.837.11.036.10.20.40
0.46.1
7991,341,764
Urban
29.942.71.814.71.40.20.20.98.2
18174,263,953
Don’t need it – not interested Too expensive Can use it somewhere else Not available in area No computer or computer inadequate Privacy and security Concern for children’s access Lack of confidence or skill Other reasons
Sample sizeEstimated number of households
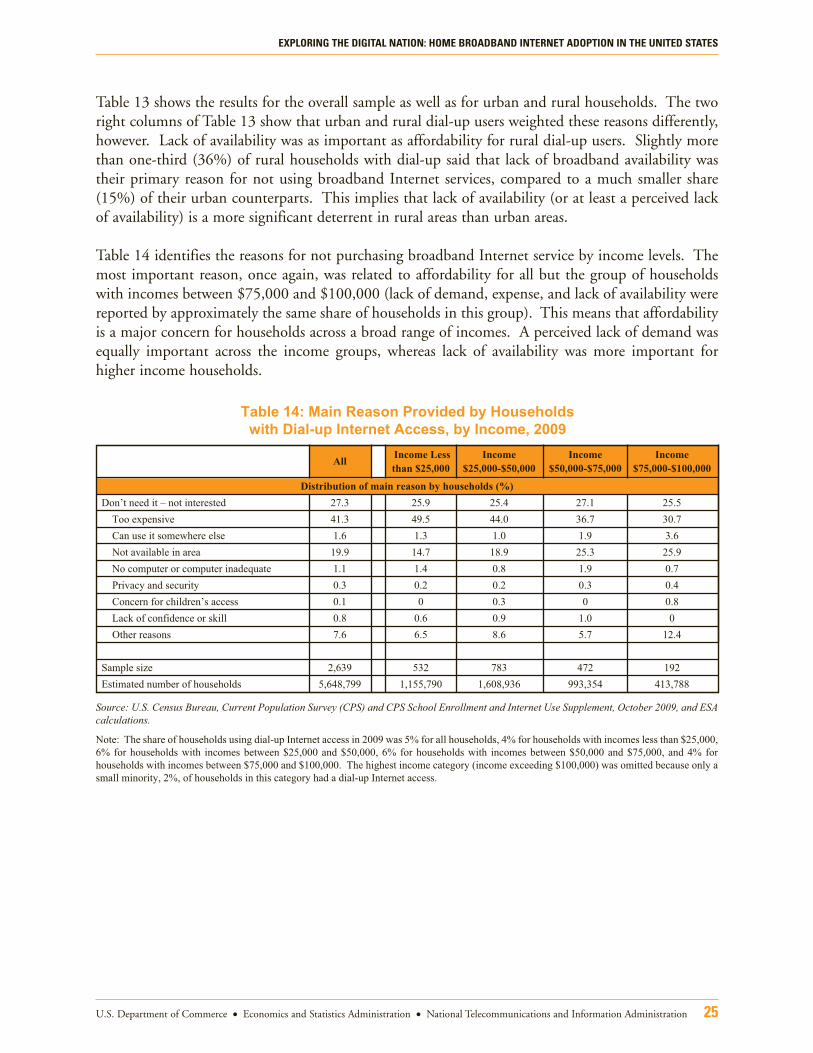
Table 13 shows the results for the overall sample as well as for urban and rural households. The tworight columns of Table 13 show that urban and rural dial-up users weighted these reasons differently,however. Lack of availability was as important as affordability for rural dial-up users. Slightly morethan one-third (36%) of rural households with dial-up said that lack of broadband availability wastheir primary reason for not using broadband Internet services, compared to a much smaller share(15%) of their urban counterparts. This implies that lack of availability (or at least a perceived lackof availability) is a more significant deterrent in rural areas than urban areas.
Table 14 identifies the reasons for not purchasing broadband Internet service by income levels. Themost important reason, once again, was related to affordability for all but the group of householdswith incomes between $75,000 and $100,000 (lack of demand, expense, and lack of availability werereported by approximately the same share of households in this group). This means that affordabilityis a major concern for households across a broad range of incomes. A perceived lack of demand wasequally important across the income groups, whereas lack of availability was more important forhigher income households.
EXPLORING THE DIGITAL NATION: HOME BROADBAND INTERNET ADOPTION IN THE UNITED STATES
U.S. Department of Commerce � Economics and Statistics Administration � National Telecommunications and Information Administration 25
Table 14: Main Reason Provided by Householdswith Dial-up Internet Access, by Income, 2009
Source: U.S. Census Bureau, Current Population Survey (CPS) and CPS School Enrollment and Internet Use Supplement, October 2009, and ESA calculations.
Note: The share of households using dial-up Internet access in 2009 was 5% for all households, 4% for households with incomes less than $25,000, 6% for households with incomes between $25,000 and $50,000, 6% for households with incomes between $50,000 and $75,000, and 4% for households with incomes between $75,000 and $100,000. The highest income category (income exceeding $100,000) was omitted because only a small minority, 2%, of households in this category had a dial-up Internet access.
Income$25,000-$50,000
25.444.01.018.90.80.20.30.98.6
7831,608,936
Income$75,000-$100,000
25.530.73.625.90.70.40.80
12.4
192413,788
Income$50,000-$75,000
27.136.71.925.31.90.30
1.05.7
472993,354
All
27.341.31.619.91.10.30.10.87.6
2,6395,648,799
Don’t need it – not interested Too expensive Can use it somewhere else Not available in area No computer or computer inadequate Privacy and security Concern for children’s access Lack of confidence or skill Other reasons
Sample sizeEstimated number of households
Income Lessthan $25,000
25.949.51.314.71.40.20
0.66.5
5321,155,790
Distribution of main reason by households (%)

Table 15 shows similar trends, looking at separate race and ethnic groups. The most important reasonfor not using broadband Internet was related to expense, although a larger share of Hispanic and Blackhouseholds (56% and 50%, respectively) than White households (38%) reported “too expensive” astheir primary impediment. Lack of availability was more important for White and Black householdsthan Hispanic households. This means a much smaller share of Hispanic households felt impactedby a perceived lack of availability than White and Black households.
EXPLORING THE DIGITAL NATION: HOME BROADBAND INTERNET ADOPTION IN THE UNITED STATES
U.S. Department of Commerce � Economics and Statistics Administration � National Telecommunications and Information Administration 26
Distribution of main reason by households (%)
Table 15: Main Reason Provided by Households withDial-up Internet Access, by Race and Ethnicity, 2009
Source: U.S. Census Bureau, Current Population Survey (CPS) and CPS School Enrollment and Internet Use Supplement, October 2009, and ESA calculations.
Note: The share of households using dial-up Internet access in 2009 was 5% for all households, 5% for White households, 4% for Black households, and 4% for Hispanic households.
Non-HispanicBlack
28.850.01.313.50.50.50
1.14.3
265653,916
Hispanic
22.055.54.76.21.100
0.79.8
229600,717
All
27.341.31.619.91.10.20.10.87.6
2,6395,648,799
Don’t need it – not interested Too expensive Can use it somewhere else Not available in area No computer or computer inadequate Privacy and security Concern for children’s access Lack of confidence or skill Other reasons
Sample sizeEstimated number of households
Non-HispanicWhite
27.537.81.323.31.20.30.20.77.8
2,0334,147,090

Section 6: Demographic and Geographic Characteristicsof Broadband versus Dial-up Internet Users
This section compares household-level attributes among broadband-using and dial-up-usinghouseholds. Households that utilized a dial-up Internet service in 2009 accounted for a smallminority (7%) of households using the Internet at home, whereas broadband users accounted for thevast majority (93%). The share of dial-up Internet users is shrinking, and the decline in dial-up usershas been more than offset by the expansion in broadband-Internet-using households. It is still usefulto analyze how dial-up-using households differ from their broadband-using counterparts because sucha comparison can help to explain lags in technology adoption.
Tables 16 and 17 show the distributions of income, education, and a number of other demographicand geographic characteristics by dial-up-using and broadband-using households. According to thesetables, dial-up users in 2009 were, on average, older, had lower levels of family income and education,and were more likely to reside in rural areas.
Dial-up Internet users were, on average, less affluent than broadband Internet users. Compared tohouseholds that subscribed to broadband Internet service, a larger share of dial-up users had familyincomes less than $25,000 and a smaller share had incomes exceeding $100,000 (Table 16). Dial-upInternet users also obtained less education than broadband Internet users. Compared to broadbandInternet users, a lower fraction of dial-up users had a college degree and a higher share had less thana high school degree.
Dial-up Internet users were older with an average age of 54, compared to 47 among broadbandInternet users. A larger share of dial-up-using households was headed by someone with a disability,16%, compared to half of that (8%) among their broadband-Internet-using counterparts.
Table 17 looks at geographic attributes and shows that households using dial-up Internet services weremore likely to be rural dwellers. Almost one in four (24%) dial-up Internet users lived in rural areas,compared to about one in eight broadband Internet users (13%). Compared to dial-up users,broadband Internet users were more likely to live in large urban areas with populations exceeding onemillion (57% of broadband users, compared to 43% of dial-up users, lived in urban areas withpopulations exceeding one million).
EXPLORING THE DIGITAL NATION: HOME BROADBAND INTERNET ADOPTION IN THE UNITED STATES
U.S. Department of Commerce � Economics and Statistics Administration � National Telecommunications and Information Administration 27

EXPLORING THE DIGITAL NATION: HOME BROADBAND INTERNET ADOPTION IN THE UNITED STATES
U.S. Department of Commerce � Economics and Statistics Administration � National Telecommunications and Information Administration 28
Table 16: Household Demographic Attributes:Dial-up versus Broadband Internet Users, 2009
Source: U.S. Census Bureau, Current Population Survey (CPS) and CPS School Enrollment and Internet Use Supplement, October 2009, and ESA calculations.
Note: The distributions across the income categories do not sum to 100% since income data are not reported by some households.
Percent of All HouseholdsPercent of Households connecting to the Internet from homeFamily Income Less than $25,000 $25,000-$50,000 $50,000-$75,000 $75,000-$100,000 More than $100,000Education Less than High School Degree High School Degree Some College College Degree or moreRace and Ethnicity White, Non-Hispanic Black, Non-Hispanic Asian, Non-Hispanic American Indian or Alaskan Native, Non-Hispanic HispanicForeign-Born Status Citizens (including foreign born) Non-CitizenAge (mean years)Gender Male FemaleHousehold Type Married-couple with children Single parents (male) Single parents (female) Family without children Non-family householdsDisability Status Has a disability No disability Sample SizeEstimated Number of Households
Distribution by Householdsusing Dial-up Internet (%)
4.76.9
20.528.517.67.34.7
10.836.429.723.1
73.411.62.40.610.6
93.96.154.441.449.350.7
20.02.17.141.629.3
15.784.2
2,6395,648,799
Distribution by Householdsusing Broadband Internet (%)
63.592.5
12.520.918.411.718.6
5.623.530.940.0
75.2 9.7 4.7 0.5 8.7
94.85.246.824.153.646.4
27.42.37.336.127.0
8.491.1
34,63375,776,370

EXPLORING THE DIGITAL NATION: HOME BROADBAND INTERNET ADOPTION IN THE UNITED STATES
U.S. Department of Commerce � Economics and Statistics Administration � National Telecommunications and Information Administration 29
Table 17: Household Geographic Attributes:Dial-up versus Broadband Internet Users, 2009
Source: U.S. Census Bureau, Current Population Survey (CPS) and CPS School Enrollment and Internet Use Supplement, October 2009, and ESA calculations.
Region Northeast Midwest South West Urban-Rural Status Urban RuralMetropolitan Area (CBSA) Size Under 1,000,000 1,000,000-2,499,999 2,500,000-4,999,999 5,000,000 or more
Sample SizeEstimated Number of Households
Distribution by Householdsusing Dial-up Internet (%)
17.124.635.822.5
75.523.8
28.014.612.416.2
2,6395,648,799
Distribution by Householdsusing Broadband Internet (%)
19.222.034.923.9
86.612.8
26.918.119.119.5
34,63375,776,370

Section 7: Disability and Broadband Internet Use
This section analyzes broadband Internet adoption by people with disabilities. The disabilitycommunity is a key population group that presents special challenges for adoption of broadbandInternet and other modes of communications. “Disability” is defined by the Americans withDisabilities Act as "a physical or mental impairment that substantially limits a major life activity"(U.S. Department of Justice, 2010).8 There were 36.1 million people with disabilities in 2008, orabout 12.1% of the population (U.S. Census Bureau, 2010(b)). More than half have severedisabilities (Lyle, 2010).
The analysis presented in Section 4 of this report showed that people with disabilities were less likelythan people with no disabilities to use broadband Internet at home, and that differences in socio-economic characteristics explain the majority of the adoption gap associated with disability. Thissection first looks at the profile of people with disabilities and their Internet and broadband Internetusage patterns. We then study their main reasons for non-use. In order to be consistent with the restof the report, this section looks at broadband Internet (or Internet) adoption at home and itsassociation with disability status of the head of household. Note that people with disabilities in thissection refer to household heads with disabilities.9
Section 7.1: Profile of People with Disabilities
Table 18 presents data on income, education, age, and geographic location for the entire population,and separately by disability status of the head of the household. Fourteen percent of household heads,representing almost 17 million people, had a disability in 2009.10 People with disabilities, on average,were older with an average age of 63, compared to 48 among householders with no disability. Peoplewith disabilities also had lower levels of household income and obtained less education. Almost halfof all householders with disabilities (45%) had family incomes less than $25,000, compared to a fifth(19%) of the population with no disability. One in four people with disabilities (25%) did not havea high school degree, compared to one in ten among people with no disability (10%). People withdisabilities were also more likely to live in rural areas—22% of households where the householder hada disability lived in rural areas, compared to 15% of those with no disability.
EXPLORING THE DIGITAL NATION: HOME BROADBAND INTERNET ADOPTION IN THE UNITED STATES
U.S. Department of Commerce � Economics and Statistics Administration � National Telecommunications and Information Administration 30
8 In the CPS, a person with at least one of the following conditions is considered to have a disability: hearing impairment; blindness;impaired vision despite wearing glasses; physical, mental, or emotional condition that impairs the ability to concentrate, remember, ormake decisions; difficulty in walking or climbing stairs; difficulty in dressing or bathing; physical, mental, or emotional condition thatimpairs the ability to do errands alone such as visiting a doctor’s office or shopping (U.S. Census Bureau, 2009).9 Changing the unit of analysis from household level to individual level does not change the underlying patterns (the person-level dataare presented in Section A5 of the Appendix).10 According to the October 2009 Current Population Survey, which collected information on disability only for adult civilian householdmembers, there were about 27 million adults with disabilities.

Section 7.2: Internet Use by People with Disabilities
Given that people with disabilities have lower levels of income and education, are older, and are morelikely to reside in rural areas, it is not surprising that they display lower broadband and Internet usagerates. Table 19 shows Internet and broadband Internet usage rates for the entire population, andseparately by disability status of the household head. Only half of all households (51%) headed bysomeone with a disability had an Internet user, compared to the majority of households (81%) headedby someone without a disability. Only four out of ten households (43%) headed by someone with adisability subscribed to Internet services at home, compared to seven out of ten households (73%)where the householder has no disability. Broadband Internet subscription at home showed a similarpattern (38% compared to 68%).
EXPLORING THE DIGITAL NATION: HOME BROADBAND INTERNET ADOPTION IN THE UNITED STATES
U.S. Department of Commerce � Economics and Statistics Administration � National Telecommunications and Information Administration 31
Table 18: Household Demographic and GeographicCharacteristics by Disability Status, 2009
Source: U.S. Census Bureau, Current Population Survey (CPS) and CPS School Enrollment and Internet Use Supplement, October 2009, and ESA calculations.
Note: The distributions across the income categories do not sum to 100% since income data are not reported by some households.
Percent of All HouseholdsFamily Income Less than $25,000 $25,000-$50,000 $50,000-$75,000 $75,000-$100,000 More than $100,000Education Less than High School Degree High School Degree Some College College Degree or moreAge (mean years)Geographic Location Urban Rural
Sample SizeEstimated Number of Households
AllHouseholds
100
22.121.814.78.512.5
12.329.328.330.149.7
83.415.9
54,280119,267,400
Distribution by Households/Householderwhere the householder has a disability (%)
14.1
44.919.38.63.43.6
24.734.425.515.463.0
77.222.1
7,93516,768,677
Distribution by Households/Householderwhere the Householder has no disability (%)
85.6
18.522.115.79.314.0
10.328.528.632.547.6
84.414.9
46,140102,062,153

Section 7.3: Main Reason for Non-Adoption by People with Disabilities
Section 4 of this report showed that socio-economic and geographic characteristics explained most ofthe adoption gap associated with disability. This report now looks at the main reason for non-adoption for people with disabilities. Tables 20, 21 and 22 analyze the main reasons for not havingbroadband Internet access at home for three types of non-users – households that do not use theInternet at any location, households that do not use the Internet specifically at home, and householdsthat use dial-up Internet at home. These tables show that the primary reasons for non-adoption arelargely similar for people with and without disabilities.
Table 20 shows that the main reason provided by Internet non-users was lack of demand, regardlessof disability status. Compared to people with no disabilities, a smaller share of people with disabilitiesgave cost as the major reason (14% compared to 21%) and a slightly larger share of people withdisabilities gave lack of confidence or skill as the major reason (6% compared to 4%).
Unlike Internet non-users, affordability was the biggest impediment to home broadband Internetaccess for households that did not use the Internet specifically at home (Table 21). A larger share ofhouseholds headed by someone with a disability provided affordability as the principal reason (47%compared to 39%).
Affordability was among the top concerns for households with dial-up Internet access and was selectedby the same share of such households, regardless of disability status.
EXPLORING THE DIGITAL NATION: HOME BROADBAND INTERNET ADOPTION IN THE UNITED STATES
U.S. Department of Commerce � Economics and Statistics Administration � National Telecommunications and Information Administration 32
Table 19: Average Internet Use by Disability Status, 2009
Source: U.S. Census Bureau, Current Population Survey (CPS) and CPS School Enrollment and Internet Use Supplement, October 2009, and ESA calculations.
Percent of All HouseholdsInternet Use (%) At any location At home Use broadband Internet at home Use dialup Internet at home
Sample SizeEstimated Number of Households
AllHouseholds
100
76.768.763.54.7
54,280119,267,400
Households where theHouseholder has a disability
14.1
50.643.437.85.3
7,93516,768,677
Households where theHouseholder has no disability
85.6
80.972.767.64.7
46,140102,062,153

EXPLORING THE DIGITAL NATION: HOME BROADBAND INTERNET ADOPTION IN THE UNITED STATES
U.S. Department of Commerce � Economics and Statistics Administration � National Telecommunications and Information Administration 33
Distribution of main reason by households (%)
Table 20: Main Reason Provided by Internet Non-Users, by Disability Status, 2009
Source: U.S. Census Bureau, Current Population Survey (CPS) and CPS School Enrollment and Internet Use Supplement, October 2009, and ESA calculations.
Note: The share of households not using the Internet in 2009 was 23% for all households, 49% for households headed by someone with a disability, and 19% for households headed by someone with no disability.
No Disability
46.620.71.80.821.60.30.13.64.6
8,54819,520,186
All
47.218.61.40.722.30.30.14.35.1
12,46727,821,275
Don’t need it – not interested Too expensive Can use it somewhere else Not available in area No computer or computer inadequate Privacy and security Concern for children’s access Lack of confidence or skill Other reasons
Sample sizeEstimated number of households
With Disability
48.813.60.50.424.00.40.06.06.4
3,9128,287,550
Distribution of main reason by households (%)
Table 21: Main Reason Provided by Households Usingthe Internet Outside of Home, by Disability Status, 2009
Source: U.S. Census Bureau, Current Population Survey (CPS) and CPS School Enrollment and Internet Use Supplement, October 2009, and ESA calculations.
Note: The share of households using the Internet at a location other than home in 2009 was 8% for all households, 7% for households headed by someone with a disability, and 8% for households headed by someone with no disability.
No Disability
17.038.615.42.716.80.20.40.58.4
3,7408,309,436
All
16.539.714.82.716.90.30.40.48.2
4,2959,522,716
Don’t need it – not interested Too expensive Can use it somewhere else Not available in area No computer or computer inadequate Privacy and security Concern for children’s access Lack of confidence or skill Other reasons
Sample sizeEstimated number of households
With Disability
14.647.410.32.717.50.50.40.36.4
5521,205,891

EXPLORING THE DIGITAL NATION: HOME BROADBAND INTERNET ADOPTION IN THE UNITED STATES
U.S. Department of Commerce � Economics and Statistics Administration � National Telecommunications and Information Administration 34
Table 22: Main Reason Provided by Households withDial-up Internet Access, by Disability Status, 2009
Source: U.S. Census Bureau, Current Population Survey (CPS) and CPS School Enrollment and Internet Use Supplement, October 2009, and ESA calculations.
Note: The share of households using dial-up Internet access in 2009 was 5% for all households, 5% for households headed by someone with a disability, and 5% for households headed by someone with no disability.
No Disability
27.341.61.719.71.00.30.20.77.6
2,2124,754,852
All
27.341.31.619.91.10.30.10.87.6
2,6395,648,799
Don’t need it – not interested Too expensive Can use it somewhere else Not available in area No computer or computer inadequate Privacy and security Concern for children’s access Lack of confidence or skill Other reasons
Sample sizeEstimated number of households
With Disability
27.439.61.521.01.500
1.27.8
425888,070
Distribution of main reason by households (%)

Section 8: Long-Term Comparisons: 2001 versus 2009
The last section of this report will analyze the change in home broadband Internet adoption over thisdecade by comparing the most recent data from 2009 with that collected in 2001.11 Sections 8.1, 8.2,and 8.3 analyze the growth in broadband Internet adoption over this decade by householddemographic and geographic characteristics. Section 8.4 compares the marginal effects over time ofselected demographic and geographic characteristics on the likelihood of home Internet use (Section8.4.1) and broadband Internet use (Section 8.4.2).
Section 8.1: Broadband Internet Use by Demographic Characteristics:2001 versus 2009
Table 23 presents data on average broadband Internet usage rates by demographic characteristics in2001 and 2009. Table 23 shows that the share of households with broadband Internet service hasrisen sevenfold between 2001 and 2009, from 9% to 64% of households using broadband Internetservices at home. Some of the groups which began with much lower adoption rates in 2001 have sinceexhibited significant gains. These impressive gains, however, have not eliminated the gaps withindemographic groups defined by income, education, race, ethnicity, and age. For example, householdsin the lowest income group, with annual incomes less than $25,000, exhibited a twelvefold rise inbroadband Internet adoption, from 3% to 36%, while households with incomes exceeding $75,000saw more than a fourfold rise, from 21% to 92%. Despite the faster rise in the share of lower-incomehouseholds with broadband Internet, a sizeable gap in average connectivity between these two groups,36% compared to 92%, still persisted in 2009.
A similar pattern holds for other demographic groups. For instance, households where thehouseholder had at least a college degree were much more likely in 2009 to have broadband Internetthan their counterparts with a high school degree or less, even though households headed by someonewith a high school degree or less experienced faster growth in broadband Internet use. Similarly,Hispanic households and non-Hispanic Black households had broadband Internet adoption rateswhich were half of non-Hispanic White adoption rates in 2001. Both Hispanic households and Blacknon-Hispanic households exhibited large gains in connectivity, but substantial gaps in adoptionpersisted across the race and ethnic groups in 2009. In 2001, the broadband Internet adoption ratefor seniors (3%) was about one-fourth of the average rate for those between 16 and 44 years of age(11%). In 2009, the average senior adoption rate was slightly more than half of that for the 16-44year old group (40% and 71%, respectively).
All groups have seen impressive growth during this decade in the use of home broadband Internetservices, which has resulted in a “catching-up” between low adopters and high adopters over time.However, significant adoption gaps persist along demographic and socio-economic dimensions.
EXPLORING THE DIGITAL NATION: HOME BROADBAND INTERNET ADOPTION IN THE UNITED STATES
U.S. Department of Commerce � Economics and Statistics Administration � National Telecommunications and Information Administration 35
11 Broadband refers to a Digital Subscriber Line (DSL) or a cable modem, the two dominant technologies of choice, in the 2001 CPSInternet Supplement data. In the 2009 CPS Supplement data, broadband refers to DSL, cable modem, fiber optics, satellite, wireless(such as Wi-Fi), mobile phone or PDA, or some other broadband Internet connection.

EXPLORING THE DIGITAL NATION: HOME BROADBAND INTERNET ADOPTION IN THE UNITED STATES
U.S. Department of Commerce � Economics and Statistics Administration � National Telecommunications and Information Administration 36
Table 23: Household Broadband Internet Useby Demographic Characteristics, 2001 and 2009
Source: U.S. Census Bureau, Current Population Survey (CPS) and CPS School Enrollment and Internet Use Supplement, October 2009, CPS and CPS Computer and Internet Use Supplement, September 2001, and ESA calculations.
Note: *Contrary to 2009, the race and ethnicity indicators in 2001 do not separately identify multi-race categories. As a result, the race and ethnicity categories are not strictly comparable between 2001 and 2009.
AllFamily Income Less than $25,000 $25,000-$50,000 $50,000-$75,000 More than $75,000Education Less than High School Degree High School Degree Some College College Degree or moreRace and Ethnicity* White, Non-Hispanic Black, Non-Hispanic Asian, Non-Hispanic American Indian or Alaskan Native, Non-Hispanic HispanicForeign-Born Status Citizens (including foreign born) Non-citizenAge 16 to 44 years 45 to 64 years 65 years and overGender Male FemaleHousehold Type Married-couple with Children Single parents (male) Single parents (female) Family without children Non-family households
Sample Size Estimated Number of Households
20019.2
3.17.312.220.8
2.45.710.316.3
10.24.715.17.65.3
9.37.7
11.310.13.1
10.77.6
13.97.25.69.17.0
56,573107,064,178
200963.5
35.861.079.391.5
28.850.969.584.5
68.049.477.348.347.9
64.451.0
71.268.239.9
66.760.2
79.860.156.967.750.8
54,280119,267,400
Percent of households connecting to the Internet at home using broadband

Section 8.2: Broadband Internet Use by Geographic Region, and Urbanand Rural Locations: 2001 versus 2009
Table 24 presents average broadband Internetusage rates by geographic location (region andurban-rural location) in 2001 and 2009. Table 24portrays a picture very similar to the one seen inthe previous section --- broadband Internet useamong households living in geographic areas withhistorically low adoption rates rose faster thanamong their counterparts in high adoption areasbut some differences, particularly between urbanand rural locations, were still present in 2009.According to Table 24, average broadbandInternet usage rates in the South and the Midwestwere about two-thirds of the average rates in theNortheast and the West in 2001. Households inall four regions have seen gains in broadbandInternet adoption, with those in the Midwest andthe South experiencing faster gains and thereforenarrowing the gap with their counterparts in theNortheast and the West. A similar pattern holdsfor urban and rural locations, although thereremained a 15 percentage point urban-rural gap inhome broadband Internet use in 2009.
Section 8.3: Broadband Internet Use by State: 2001 versus 2009
Table 25 ranks the states in descending order by their average broadband Internet adoption rates in2001 and 2009. The analysis from Section 4 of this report noted that broadband Internet usage variedsignificantly across states, even after controlling for household demographic characteristics and urbanand rural locations. It is therefore not surprising that average state-level broadband Internet adoptionrates varied from 42% to 73% in 2009 and from 2% to 18% in 2001. Table 25 shows that the statesin the Northeast and West regions generally exhibited higher broadband Internet access than those inthe South and the Midwest. The state rankings were relatively constant between 2001 and 2009. Forinstance, out of the top 15 broadband-Internet-using states in 2001, 11 were still among the top 15in 2009. The states in the bottom were somewhat unchanged also—out of the bottom 15 states in2001, 9 states were still among the bottom 15 in 2009.
According to the findings in Section 4, demographic and geographic characteristics - primarilyincome, education, race, ethnicity, and the extent of urbanization - explain some but not all of the
EXPLORING THE DIGITAL NATION: HOME BROADBAND INTERNET ADOPTION IN THE UNITED STATES
U.S. Department of Commerce � Economics and Statistics Administration � National Telecommunications and Information Administration 37
Table 24: Household Broadband InternetUse by Geographic Location, 2001 & 2009
Source: U.S. Census Bureau, Current Population Survey (CPS) and CPS School Enrollment and Internet Use Supplement, October 2009, CPS and CPS Computer and Internet Use Supplement, September 2001, and ESA calculations.
Note: The terms “urban” and “rural” refer to metropolitan and nonmetropolitan areas, respectively. Metropolitan area identifier in the 2001 CPS is based on Office of Management and Budget’s 1990/1993 standards. According to definitions adopted in 1990, the term “metropolitan area” collectively referred to metropolitan statistical areas (MSAs), consolidated metropolitan statistical areas (CMSAs), and primary metropolitan statistical areas (PMSAs). Metropolitan area identifier for 2009 is based on “core based statistical area” (CBSA) which refers collectively to metropolitan and micropolitan statistical areas.
Percent of households connecting to the Internet at homeusing broadband
All HouseholdsRegion Northeast Midwest South WestUrban-Rural Status Urban Rural
Sample SizeEstimated Number of Households
20019.2
11.37.27.911.7
10.53.8
56,573107,064,178
200963.5
67.062.260.068.0
65.951.0
54,280119,267,400

variation in broadband Internet adoption ratesacross states. This raises the followingquestion: how much of the variation inadoption across states is driven by variation inbroadband Internet availability? The CPS doesnot provide information on availability ofbroadband Internet services at the household’slocation. In order to compare adoption withavailability, we utilized state-level data from theFederal Communications Commission (FCC).
The FCC collects data on high-speed Internetaccess services – both on adoption (number ofhigh-speed Internet connections by type andspeed of technology and by state) andavailability (number of high-speed Internetservice providers, by census tract level andstate) (FCC, 2010). In order to compare theadoption measure used in this report with thatfrom the FCC, we compared average state-levelbroadband Internet adoption from the CPSwith FCC’s data on the number of high-speedresidential connections by state. We found thatthe two independent measures of adoptionwere highly positively correlated, validating thereliability of the home broadband Internetadoption measure from the CPS. In order tocompare adoption with availability, we utilizedthree measures of availability at the state levelfrom the FCC: total number of high-speedInternet service providers by state, percent ofresidences where the local telephone serviceproviders provide DSL, and percent ofresidences where cable TV service providersprovide cable modem Internet services. Wefound only a weak positive association betweenour estimated broadband Internet adoptionand the data on availability. This weakcorrelation between adoption and availabilityat the state level is not surprising. Section 5 onmain reasons for non-adoption showed thatlack of availability primarily impacted ruralhouseholds that did not subscribe to a high-speed broadband Internet service at home andused a slower dial-up service instead. This
EXPLORING THE DIGITAL NATION: HOME BROADBAND INTERNET ADOPTION IN THE UNITED STATES
U.S. Department of Commerce � Economics and Statistics Administration � National Telecommunications and Information Administration 38
Table 25: Ranking of States by Average HomeBroadband Internet Adoption, 2001 and 2009
Source: U.S. Census Bureau, Current Population Survey (CPS) and CPS School Enrollment and Internet Use Supplement, October 2009, CPS and CPS Computer and Internet Use Supplement, September 2001, and ESA calculations.
Note: The numbers in parentheses next to the 2009 data refer to the 2001 adoption rate for the state. Because of sampling variability, average adoption rates for two states may not be different from one another in a statistically significant way. Tables A7 and A8 in Appendix Section A6 provide the standard error and 90% confidence interval for each state.
Percent of HouseholdsUsing BroadbandInternet at Home
73 (12)73 (14)73 (13)73 (14)72 (12)72 (11)71 (11)70 (9)70 (18)70 (9)69 (11)69 (10)68 (7)68 (13)67 (6)67 (12)67 (6)67 (8)67 (10)67 (6)67 (10)66 (7)66 (12)66 (6)65 (8)64 (7)64 (10)63 (6)63 (5)62 (9)62 (9)62 (8)61 (8)61 (10)61 (8)60 (9)60 (9)59 (7)58 (3)57 (7)57 (5)56 (4)56 (8)55 (10)55 (2)54 (3)53 (8)52 (4)51 (4)48 (5)42 (6)
State
UTNHAKMANJ
WACTORHI
MDRICONVCAIDAZWIMNKSDEFLDCNYWYVAGANEIL
NDMIIAPAOHMEVTTXSDNCMTMOLAINOKTNNMKYSCWVARALMS
2009 RankingPercent of Households
Using BroadbandInternet at Home
181414131312121212111111101010101010999999888888877777666666555444332
State
HIMANHCAAKNJAZNYUTCTWARITNCOFLKSNEMEORTXMDMISDIASCPAVTMNOKVAOHDCMONVGANCIDILDEWIWYMSLAALNDWVARINMTKYNM
2001 Ranking

suggests that one is likely to find a stronger association between adoption and availability only whenusing more granular geographic data. State-level data are aggregated across urban and rural areas andare therefore likely to show little correlation between adoption and availability.
Section 8.4: Marginal Effects of Demographic and GeographicCharacteristics on Adoption Over Time
Given the results of this section, one must ask how the adoption gaps, after accounting for differencesin demographic and geographic characteristics, have changed over the decade. In other words, howrobust are the marginal effects of household characteristics on adoption? Section 4.2 of this reportutilized a regression analysis framework that estimated the impact of multiple factors together on theprobability that a household adopted broadband Internet services at home. The analysis allowed usto isolate the effect of any one factor, holding everything else constant. We referred to these results asthe marginal effects of selected demographic and geographic characteristics on household broadbandInternet use. The factors that we controlled for included family income, education, age, race,ethnicity, foreign-born status, household size (total number of persons in household), disability status,and geographic location (urban-rural location and state).
In this section we will apply a similar regression analysis framework to estimate the marginal effects ofdemographic and geographic factors on home Internet use in 2001 and 2009, and the marginal effectsof demographic and geographic factors on home broadband Internet use in 2007 and 2009. Why dowe focus on home Internet use generally in lieu of home broadband Internet use for the comparativeanalysis for 2001 and 2009? Broadband Internet was a relatively new technology in the early 2000s,which is why both availability and adoption levels at that time were low but both grew significantlyover the decade. In order to compare the impacts of household characteristics on adoption betweentwo time periods, it is useful to use a metric or indicator of adoption that is consistent over time. Thisis why we will first focus on Internet use at home to compare the adoption gaps or marginal effectsbetween 2001 and 2009 (Section 8.4.1). In order to compare the adoption gaps or marginal effects forhome broadband Internet use, we will use data for 2007 and 2009 (Section 8.4.2).
The full set of regression results from these analyses is presented in Sections A7 and A8 of theAppendix. The factors that we control for in these analyses include household income, education, age,race, ethnicity, foreign-born status, household size (total number of persons in household), andgeographic location (urban-rural location and state).12
Section 8.4.1: Marginal Effects of Demographic and Geographic Characteristicson the Likelihood of Home Internet Use, 2001 versus 2009
Between 2001 and 2009, Internet use at home rose by one-third, from 51% to 69% of Americanhouseholds connecting to the Internet from home. Table 26 presents the estimated marginal effects
EXPLORING THE DIGITAL NATION: HOME BROADBAND INTERNET ADOPTION IN THE UNITED STATES
U.S. Department of Commerce � Economics and Statistics Administration � National Telecommunications and Information Administration 39
12 Unlike the regression analysis for 2009 presented in Section 4.2, we are unable to control for disability status in this section sincesimilar data on disability are not available for 2001.

of selected socioeconomic (income, education, race, ethnicity), and geographic (urban-rural status)factors on the probability of Internet use at home. These marginal effects changed only slightlybetween 2001 and 2009. For example, after controlling for various non-income attributes, the gapbetween households with incomes exceeding $75,000 and households with incomes less than $25,000declined slightly, from 37 to 32 percentage points. Compared to households where the householderhas less than a high school degree, the relative gains associated with a high school degree and somecollege have risen but those associated with a college degree or more have not changed.
Table 26 also shows that the White-Black gap in home Internet use, after holding the other attributesconstant, has fallen from 16 percentage points in 2001 to 10 percentage points in 2009, whereas theWhite-Hispanic gap remained largely unchanged. This suggests that Internet use in Blackhouseholds, on average, has gotten closer to that in White households, after accounting for socio-economic and geographic characteristics, although the same pattern of convergence does not hold forHispanic households. The urban-rural gap in home Internet use stayed similar, implying that theincreased likelihood of home Internet use by urban dwellers relative to their rural-area counterpartshas not changed.
EXPLORING THE DIGITAL NATION: HOME BROADBAND INTERNET ADOPTION IN THE UNITED STATES
U.S. Department of Commerce � Economics and Statistics Administration � National Telecommunications and Information Administration 40
Table 26: Marginal Effects of Demographic and Geographic Characteristicson the Likelihood that a Household Uses Internet at Home, 2001 and 2009
Source: U.S. Census Bureau, Current Population Survey (CPS) and CPS School Enrollment and Internet Use Supplement, October 2009, CPS and CPS Computer and Internet Use Supplement, September 2001 and ESA calculations.
Note: Sample includes all households with the head of household aged 16 or more, and non-missing data on income.
Adoption Gap in 2009(percentage point)
18
30
32
13
25
30
10142
5
43,66294,963,684
Adoption Gap in 2001(percentage point)
16
30
37
10
21
29
1615-5
4
47,31088,963,933
Household Characteristics
Household Income Gap between households with incomes $25,000-$50,000 and households with incomes less than $25,000
Gap between households with incomes $50,000-$75,000 and households with incomes less than $25,000
Gap between households with incomes exceeding $75,000 and households with incomes less than $25,000
Education Gap between those with a high school degree and those with less than high school degree
Gap between those with some college and those with less than high school degree
Gap between those with a college degree or more and those with less than high school degree
Race and Ethnicity Gap between White, Non-Hispanic and Black, Non-Hispanic Gap between White, Non-Hispanic and Hispanic Gap between White, Non-Hispanic and AsianUrban-Rural Gap between urban and rural households
Sample Size Estimated Number of Households

Section 8.4.2: Marginal Effects of Demographic and Geographic Characteristicson the Likelihood of Home Broadband Internet Use, 2007 versus 2009
Between 2007 and 2009, broadband Internet use among households rose by one-fourth, from 51%to 64% of American households using broadband Internet services. Table 27 compares the marginaleffects of household characteristics on the likelihood of home broadband Internet use between 2007and 2009. The full set of these regression results is presented in Section A8 of the Appendix. Themarginal effects of household demographic and geographic factors on home broadband Internetadoption stayed largely unchanged between 2007 and 2009. For example, relative to households inthe lowest income group, the likelihood of adoption rose slightly (from 13 to 17 percentage points)for households with incomes between $25,000 and $50,000, while the likelihood of adoption fellslightly (from 39 to 35 percentage points) for households in the highest income group.
Table 27 also shows that the White-Black and the White-Hispanic gaps in home broadband Internetuse, as well as urban-rural gaps, did not change considerably between 2007 and 2009.
EXPLORING THE DIGITAL NATION: HOME BROADBAND INTERNET ADOPTION IN THE UNITED STATES
U.S. Department of Commerce � Economics and Statistics Administration � National Telecommunications and Information Administration 41
Table 27: Marginal Effects of Demographic and Geographic Characteristics on theLikelihood that a Household Uses Broadband Internet at Home, 2007 and 2009
Source: U.S. Census Bureau, Current Population Survey (CPS) and CPS School Enrollment and Internet Use Supplement, October 2007 and October 2009, and ESA calculations.
Note: Sample includes all households with the head of household aged 16 or more, and non-missing data on income.
Adoption Gap in 2009(percentage point)
17
28
32
35
11
23
29
10140
7
43,66294,963,684
Adoption Gap in 2007(percentage point)
13
26
33
39
8
21
30
1112-4
8
42,48191,153,697
Household Characteristics
Household Income Gap between households with incomes $25,000-$50,000 and households with incomes less than $25,000
Gap between households with incomes $50,000-$75,000 and households with incomes less than $25,000
Gap between households with incomes $75,000-$100,000 and households with incomes less than $25,000
Gap between households with incomes exceeding $100,000 and households with incomes less than $25,000
Education Gap between those with a high school degree and those with less than high school degree
Gap between those with some college and those with less than high school degree
Gap between those with a college degree or more and those with less than high school degree
Race and Ethnicity Gap between White, Non-Hispanic and Black, Non-Hispanic Gap between White, Non-Hispanic and Hispanic Gap between White, Non-Hispanic and AsianUrban-Rural Gap between urban and rural households
Sample Size Estimated Number of Households

Section 9: Conclusion
Household use of broadband Internet service has risen dramatically during this decade as the Internethas expanded to become an integral component of life for many American households. Nonetheless,not everyone uses the Internet or has access to it. This report attempts to analyze what factors areassociated with home broadband Internet adoption, using data from a special 2009 supplement to theCPS that asked questions about broadband Internet use of more than 50,000 households.
The analysis determines that some significant adoption gaps exist today, particularly by income andeducation levels. For example, controlling for various non-income household attributes, the gapbetween households with incomes greater than $100,000 and those with incomes less than $25,000totals 34 percentage points. Similarly, the controlled gap for those with at least college degrees versusthose with no high school diplomas tallies 29 percentage points.
However, this report also shows that income and education levels, although strongly associated withbroadband Internet use, are not the sole determinants of broadband Internet adoption by households.Even after accounting for differences in income and education (and a number of other key householdattributes), there remain significant differences in adoption rates across race and ethnicity, and acrossurban and rural areas. For example, the unexplained gaps between Whites and Blacks (10 percentagepoints) and Whites and Hispanics (14 percentage points) remain at double digits in 2009. Theadoption gap for rural versus urban is halved once controlled for household attributes, but stillregisters 7 percentage points.
This report also finds that lack of need or interest, lack of affordability, lack of an adequate computer,and lack of availability were all stated as main determinants of non-adoption of broadband Internetservices. The significance of these factors, however, varied across non-users, with affordability anddemand generally dominating. For instance, Internet non-users (representing almost two-thirds ofnon-users of broadband at home) reported lack of need or interest as the main reason for notsubscribing to home broadband Internet services, whereas affordability was the most importantdeterrent for those who either used the Internet at a location other than home or used a dial-upInternet service at home. This suggests that those who used the Internet had a higher estimation ofbroadband Internet’s value and need than those that did not. The significance of these factors differedsomewhat by income, race, and ethnicity, but affordability appeared to be a major concern forhouseholds even at relatively high income levels.
This report also finds that broadband Internet use among households rose sevenfold, from 9% to64%, between 2001 and 2009. Some of the groups that had lower than average adoption rates in2001 have since exhibited impressive gains. Substantial adoption gaps still persist in broadbandInternet access within demographic groups, as well as across states and between urban and rural areas.
Even though broadband Internet use has expanded significantly during this decade, not all groups areparticipating in the Internet revolution to the same extent. For a number of reasons, some groups lagbehind in adopting this technology that has altered the social and economic landscape of the country.For example, broadband Internet adoption is particularly low among rural low-income Black and
EXPLORING THE DIGITAL NATION: HOME BROADBAND INTERNET ADOPTION IN THE UNITED STATES
U.S. Department of Commerce � Economics and Statistics Administration � National Telecommunications and Information Administration 42

Hispanic households. This report enhances our understanding of the factors that are importantdrivers of – or impediments to – adoption. This information may contribute to the national effortsto ensure that everyone has an opportunity to be linked into the services and information availablethrough the Internet.
EXPLORING THE DIGITAL NATION: HOME BROADBAND INTERNET ADOPTION IN THE UNITED STATES
U.S. Department of Commerce � Economics and Statistics Administration � National Telecommunications and Information Administration 43
Reference
Lyle, Elizabeth. A Giant Leap and a Big Deal, OBI Working Paper Series No. 2, FederalCommunications Commission, Spring 2010.
http://download.broadband.gov/plan/fcc-omnibus-broadband-initiative-%28obi%29-working-report-giant-leap-big-deal-delivering-promise-of-equal-access-to-broadband-for-people-with-disabilities.pdf
Federal Communications Commission. High-Speed Services for Internet Access: Status as ofDecember 31, 2008, February 2010.
Horrigan, John. Home Broadband Adoption, Pew Internet and American Life Project, Pew ResearchCenter, June 2009.
Horrigan, John. Broadband Adoption and Use in America, OBI Working Paper Series No. 1, FederalCommunications Commission, February 2010.
Office of Management and Budget (OMB). OMB Bulletin No. 04-03, Update of Statistical AreaDefinitions and Additional Guidance on Their Uses. Accessed June 23, 2010.
http://www.whitehouse.gov/omb/bulletins_fy04_b04-03/
National Telecommunications and Information Administration (NTIA). Digital Nation: 21st CenturyAmerica’s Progress Toward Universal Broadband Internet Access, February 2010.
Smith, Aaron. Home Broadband 2010, Pew Internet and American Life Project, Pew Research Center,August 2010.
U.S. Census Bureau. Computer and Internet Use Supplement File Technical Documentation, CPS-02.Current Population Survey, September 2001.
http://www.census.gov/apsd/techdoc/cps/cpsoct01.pdf
U.S. Census Bureau. School Enrollment and Internet Use Supplement File Technical Documentation,CPS-09. Current Population Survey, October 2009.
http://www.census.gov/apsd/techdoc/cps/cpsoct09.pdf
U.S. Census Bureau. Metropolitan and Micropolitan Statistical Areas. Accessed June 23, 2010 (a). http://www.census.gov/population/www/metroareas/aboutmetro.html
U.S. Census Bureau. American Community Survey. “Table: Selected Social Characteristics in theUnited States: 2008.” Accessed July 15, 2010 (b).
http://factfinder.census.gov/servlet/ADPTable?_bm=y&-geo_id=01000US&-qr_name=ACS_2008_1YR_G00_DP2&-ds_name=ACS_2008_1YR_G00_&-_lang=en&-_caller=geoselect&-redoLog=true&-format
EXPLORING THE DIGITAL NATION: HOME BROADBAND INTERNET ADOPTION IN THE UNITED STATES
U.S. Department of Commerce � Economics and Statistics Administration � National Telecommunications and Information Administration 44

U.S. Department of Justice. Current text of the Americans with Disabilities Act of 1990 incorporatingthe changes made by the ADA Amendments Act of 2008, Americans with Disability Act of 1990.Accessed July 15, 2010.
http://www.ada.gov/pubs/adastatute08.htm
EXPLORING THE DIGITAL NATION: HOME BROADBAND INTERNET ADOPTION IN THE UNITED STATES
U.S. Department of Commerce � Economics and Statistics Administration � National Telecommunications and Information Administration 45

Appendix
Section A1: Data
This report utilizes data from the Department of Commerce’s U.S. Census Bureau, taken from theCensus Bureau’s October 2009 Current Population Survey (CPS) of 54,324 interviewed households.Data collection for the survey took place from October 18 through 26, 2009, and generated responserates of 92.1 percent for the basic CPS, with 93.8 percent of the CPS respondents answering theSchool Enrollment and Internet Use Supplement (i.e., 86.4 percent of the CPS sample answered thesupplement).
The households surveyed were selected from the 2000 Decennial Census with coverage in all 50 statesand the District of Columbia. The sample is continually updated to account for new residentialconstruction. The Census divided the United States into 2,025 geographic areas, each typicallycomprised of a county or several contiguous counties. A total of 824 geographic areas were selectedfor the 2009 CPS survey. For each household, Census Bureau interviewers spoke to a person (calledthe “respondent”) who was at least 15 years old and was considered knowledgeable about everyone inthe household. The survey collected data both at the household level and at the individual level. Forpurposes of collecting data at an individual level, the respondent provided responses for himself orherself and proxy responses for all other members of that household age 3 and older. The survey,therefore, provided information on more than 129,000 individuals (age 3 and older).
The procedure used in developing estimates for the entire civilian noninstitutional population for theCPS involves weighting sample results using independent estimates of the population by state, sex,age, race, and Hispanic/non-Hispanic categories. These independent estimates are developed by theCensus Bureau using civilian noninstitutional population counts from the last decennial census andprojecting them forward to current years using data on births, deaths, and net migration.
EXPLORING THE DIGITAL NATION: HOME BROADBAND INTERNET ADOPTION IN THE UNITED STATES
U.S. Department of Commerce � Economics and Statistics Administration � National Telecommunications and Information Administration 46

Section A2: Broadband InternetUse at the Individual Level, 2009
This section provides data on person-levelbroadband Internet use by demographic andgeographic characteristics. The report presentsand analyzes broadband Internet adoption dataat the household level. The underlying trendsdo not change if persons, as opposed tohouseholds and heads of households, are theunit of analysis.
EXPLORING THE DIGITAL NATION: HOME BROADBAND INTERNET ADOPTION IN THE UNITED STATES
U.S. Department of Commerce � Economics and Statistics Administration � National Telecommunications and Information Administration 47
Table A1: Individual Broadband InternetUse by Demographic Characteristics, 2009
Source: U.S. Census Bureau, Current Population Survey (CPS) and CPS School Enrollment and Internet Use Supplement, October 2009, and ESA calculations.
Note: People who report using the Internet at any location and live in a household that subscribes to a broadband Internet service are considered to use broadband Internet at home. Because of the way the CPS Internet Use Supplement questions are constructed, it is not possible to directly identify people who use broadband Internet at home. *Sample includes all people 3 years of age or older.
Individual Broadband Internet Use: Percent of persons connectingto the Internet at home using broadband
All Persons*Household Income Less than $25,000 $25,000-$50,000 $50,000-$75,000 $75,000-$100,000 More than $100,000Education Less than High School Degree High School Degree Some College College Degree or moreRace and Ethnicity White, Non-Hispanic Black, Non-Hispanic Asian, Non-Hispanic American Indian or Alaskan Native, Non-Hispanic HispanicAge 3 to 15 years 16 to 44 years 45 to 64 years 65 years and overGender Male FemaleHousehold Type Married-couple with children Single parent (male) Single parent (female) Family without children Non-family householdDisability Status Has a disability No disabilityForeign-Born Status Citizens (including foreign born) Non-Citizen Sample SizeEstimated Population
59.1
31.952.470.078.786.5
37.348.170.683.4
65.745.967.342.639.7
49.768.963.233.4
59.359.0
74.154.052.359.550.2
33.165.1
60.542.3
129,249289,420,157
Table A2: Individual Broadband InternetUse by Geographic Characteristics, 2009
Source: U.S. Census Bureau, Current Population Survey (CPS) and CPS School Enrollment and Internet Use Supplement, October 2009, and ESA calculations.
Note: *Sample includes all people 3 years of age or older.
Individual Broadband Internet Use: Percent of personsconnecting to the Internet at home using broadband
All Persons*Metropolitan Status Urban RuralMetropolitan Area (CBSA) Size Under 1,000,000 1,000,000-2,499,999 2,500,000-4,999,999 5,000,000 or more
Sample Size Estimated Population
59.1
61.148.5
59.361.665.660.1
129,249289,420,157

Section A3: Marginal Effects ofDemographic and GeographicCharacteristics on the Likelihoodthat a Household UsesBroadband Internet atHome, 2009
This section contains the underlying regressionresults for Table 6 in Section 4.2. Section 4.2indicates that we utilized a regression analysisframework to estimate the simultaneous impactof multiple factors on the probability that ahousehold adopts broadband Internet servicesat home. The results allow us to isolate theeffect of any one factor, holding all the otherfactors constant. We refer to these results as themarginal effects of selected demographic andgeographic characteristics on home broadbandInternet use.
EXPLORING THE DIGITAL NATION: HOME BROADBAND INTERNET ADOPTION IN THE UNITED STATES
U.S. Department of Commerce � Economics and Statistics Administration � National Telecommunications and Information Administration 48
Table A3: Marginal Effects:Regression of Broadband Internet Adoption
on Demographic and GeographicCharacteristics, 2009
Robust standard errors in parentheses*** p<0.01, ** p<0.05, * p<0.1
Source: U.S. Census Bureau, Current Population Survey (CPS) and CPS School Enrollment and Internet Use Supplement, October 2009, and ESA calculation
Note: The marginal effects reported on Table 6 in Section 4.2 are from the first column.
Column 1omitted
0.1597***(0.007)
0.2730*** (0.008)
0.3141*** (0.008)
0.3377*** (0.008)omitted
0.1066*** (0.008)
0.2282*** (0.009)
0.2887*** (0.009)
0.0067*** (0.001)
-0.0001*** (0.000)omitted
-0.1002*** (0.008)
-0.1407*** (0.009)-0.0043 (0.011)
-0.0486*** (0.017)
0.0689*** (0.007)omitted0.0463* (0.026)
-0.0525***(0.007)
0.0870*** (0.023)
-0.0564*** (0.011)
0.0255*** (0.002)
yes0.0867***
(0.029)
43,66294,963,684
0.308
Column 2omitted
0.1593*** (0.007)
0.2720*** (0.008)
0.3122*** (0.008)
0.3343*** (0.008)omitted
0.1065*** (0.008)
0.2279*** (0.009)
0.2872*** (0.009)
0.0068*** (0.001)
-0.0001*** (0.000)omitted
-0.1039*** (0.008)
-0.1429*** (0.009)-0.0079 (0.011)
-0.0492*** (0.017)
omitted
0.0636*** (0.007)
0.0727*** (0.008)
0.0908*** (0.009)
0.0855*** (0.010)
0.0302** (0.012)
-0.0520*** (0.007)
0.0924*** (0.024)
-0.0586*** (0.011)
0.0258*** (0.002)
yes0.0888***
(0.029)
43,66294,963,684
0.309
Linear Probability ModelFamily Income: Less than $25,000Family Income: $25,000-$50,000
Family Income: $50,000-$75,000
Family Income: $75,000-$100,000
Family Income: $100,000 or more
Education: Less than High School DegreeEducation: High School Degree
Education: Some College
Education: College Degree or more
Age
Age-squared
Non-Hispanic WhiteNon-Hispanic Black
Hispanic
Non-Hispanic Asian
Non-Hispanic, Other
Metropolitan (Urban)
Nonmetropolitan (Rural)Not-identified (as metropolitanor nonmetropolitan)Metropolitan size: Less than 1 million
Metropolitan size: 1 to 2.5 million
Metropolitan size: 2.5 to 5 million
Metropolitan size: 5 million or more
Metropolitan size - not identified
Disability
Disability-not identified
Foreign-born non-citizen
Total number of persons in household
State indicator variablesConstant
Sample SizeEstimated Number of Households
R-squared

Section A4: Marginal Effects of Demographic and GeographicCharacteristics on the Likelihood that a Household UsesBroadband Internet at Home, by Household Type, 2009
We performed our regression analysis separately for different household types in order to analyze howstable or robust the associations are between broadband Internet use and household attributes. TableA4 shows the marginal effects of demographic and geographic characteristics on the likelihood ofbroadband Internet use for four different household types: married-couple households with children,single-parent households with children, family households without children, and non-familyhouseholds.
In this section, we will briefly discuss the results for married-couple households with children andsingle-parent households with children. Married-couple families with children represent 22% of oursample and single-parent families with children represent another 11%. The first column of Table A4presents the results for the overall sample and the next two columns present the results for the twosub-groups.
The marginal effects of most of the characteristics are similar for our two family types, implying thatthe association between household attributes and broadband Internet use are rather robust amongthese two family types. For example, income has very similar effects on broadband Internet use forthese two groups. The likelihood of broadband Internet use rises with income, and the rising effectof income diminishes as income grows. The effect of education is similar, except that a college degree(or more) has a steeper impact on single-parent families than their married-couple counterparts.Relative to households where the householder has less than a high school degree, a single-parenthousehold headed by someone with a college degree is 31 percentage points more likely to usebroadband Internet at home (all else similar), compared to 24 percentage points for their married-couple counterparts.
The adoption gap between White and Black households is larger for single-parent (11 percentagepoints) families than among their married-couple counterparts (6 percentage points). The adoptiongaps between White and Hispanic households are similar for both married-couple and single-parenthouseholds.
The marginal effects of foreign-born status, disability status, metropolitan status, and household sizeare similar for the two groups.
EXPLORING THE DIGITAL NATION: HOME BROADBAND INTERNET ADOPTION IN THE UNITED STATES
U.S. Department of Commerce � Economics and Statistics Administration � National Telecommunications and Information Administration 49

EXPLORING THE DIGITAL NATION: HOME BROADBAND INTERNET ADOPTION IN THE UNITED STATES
U.S. Department of Commerce � Economics and Statistics Administration � National Telecommunications and Information Administration 50
Table A4: Marginal Effects: Regression of Broadband Internet Adoption onDemographic and Geographic Characteristics, by Household Type, 2009
Robust standard errors in parentheses*** p<0.01, ** p<0.05, * p<0.1
Source: U.S. Census Bureau, Current Population Survey (CPS) and CPS School Enrollment and Internet Use Supplement, October 2009, and ESA calculations.
All
omitted0.1597***
(0.007)
0.2730***(0.008)
0.3141***(0.008)
0.3377***(0.008)omitted
0.1066***(0.008)
0.2282***(0.009)
0.2887***(0.009)
0.0067***(0.001)
0.0001***(0.000)omitted
0.1002***(0.008)
0.1407***(0.009)
0.0043(0.011)
0.0486***(0.017)
0.0525***(0.007)
0.0870***(0.023)
0.0564***(0.011)
0.0255***(0.002)
0.0689***(0.007)omitted0.0463*(0.026)
0.0867***(0.029)
43,66294,963,684
0.308
Married-couplewith Children
omitted0.1552***
(0.019)
0.2524***(0.019)
0.2718***(0.020)
0.2963***(0.019)omitted
0.1429***(0.021)
0.2282***(0.021)
0.2425***(0.021)
0.0126***(0.003)
-0.0001***(0.000)omitted
-0.0568***(0.018)
-0.1051***(0.015)
0.0226(0.016)
-0.0943***(0.034)
-0.0453*(0.024)
0.0879***(0.031)
-0.0818***(0.019)
0.0001(0.004)
0.0704***(0.013)omitted
0.1082**(0.042)
0.0208(0.079)
9,85721,734,535
0.258
Single-parentswith Children
omitted0.1404***
(0.019)
0.2508***(0.024)
0.3195***(0.031)
0.3188***(0.026)omitted
0.1102***(0.024)
0.2331***(0.024)
0.3113***(0.028)
0.0055(0.003)
-0.0001(0.000)omitted
-0.1118***(0.021)
-0.1258***(0.025)
0.0255(0.055)
-0.0508(0.041)
-0.0952***(0.027)
-0.1961(0.165)
-0.1051***(0.029)
0.0084(0.006)
0.0901***(0.023)omitted-0.0189(0.099)
-0.0205(0.090)
4,55110,381,473
0.234
Family Householdswithout Children
omitted0.1405***
(0.014)
0.2414***(0.015)
0.2912***(0.016)
0.3258***(0.015)omitted
0.1094***(0.016)
0.2267***(0.016)
0.2683***(0.016)
0.0075***(0.002)
-0.0001***(0.000)omitted
-0.0868***(0.016)
-0.1423***(0.016)
-0.0326(0.020)
-0.0015(0.031)
-0.0185(0.012)
0.1368***(0.024)
-0.0521**(0.021)
0.0296***(0.006)
0.0703***(0.011)omitted0.0541(0.043)
0.1162**(0.053)
14,67330,977,040
0.256
Non-familyHouseholds
omitted0.1207***
(0.011)
0.2160***(0.013)
0.2695***(0.016)
0.2877***(0.015)omitted
0.0830***(0.012)
0.2348***(0.014)
0.3524***(0.014)
-0.0026**(0.001)
-0.0000***(0.000)omitted
-0.1051***(0.013)
-0.1790***(0.017)
-0.0291(0.023)
-0.0486*(0.028)
-0.0577***(0.011)
0.1282**(0.054)
-0.0119(0.020)
0.0430***(0.008)
0.0630***(0.012)omitted-0.0091(0.051)
0.3381***(0.051)
14,58131,870,635
0.343
Linear Probability Model
Family Income: Less than $25,000Family Income: $25,000-$50,000
Family Income: $50,000-$75,000
Family Income: $75,000-$100,000
Family Income: $100,000 or more
Education: Less than High School DegreeEducation: High School Degree
Education: Some College
Education: College Degree or more
Age
Age-squared
Non-Hispanic WhiteNon-Hispanic Black
Hispanic
Non-Hispanic Asian
Non-Hispanic Other
Disability
Disability - not identified
Foreign-born non-citizen
Total number of persons in household
Metropolitan (Urban)
Nonmetropolitan (Rural)Not-identified (as metropolitan or nonmetropolitan)
Constant
Sample SizeEstimated Number of HouseholdsR-squared

Section A5: People with Disabilities: Profile and Internet Use, 2009
This section provides data on demographic and geographic characteristics for individuals withdisabilities, and on Internet use by this group. The report presents and analyzes the data at thehousehold level. The underlying trends do not change if persons, as opposed to households and headsof households, are the unit of analysis.
EXPLORING THE DIGITAL NATION: HOME BROADBAND INTERNET ADOPTION IN THE UNITED STATES
U.S. Department of Commerce � Economics and Statistics Administration � National Telecommunications and Information Administration 51
Table A5: Person Demographic and Geographic Characteristics by Disability Status, 2009
Source: U.S. Census Bureau, Current Population Survey (CPS) and CPS School Enrollment and Internet Use Supplement, October 2009, and ESA calculations.
Note: The distributions across the income categories do not sum to 100% since income data are not reported by some households.
Percent of All PeopleFamily Income Less than $25,000 $25,000-$50,000 $50,000-$75,000 $75,000-$100,000 More than $100,000Education Less than High School Degree High School Degree Some College College Degree or moreAge (mean years)Geographic Location Urban Rural
Sample SizeEstimated Population
Distribution for People with disabilities (%)11.2
37.721.911.24.45.1
27.335.223.414.260.1
78.221.1
12,63827,024,985
Distribution for People with no disability (%)88.8
15.721.116.210.216.2
16.528.627.327.642.6
84.514.8
94,573213,523,194
Table A6: Internet Use byDisability Status, 2009
Source: U.S. Census Bureau, Current Population Survey (CPS) and CPS School Enrollment and Internet Use Supplement, October 2009, and ESA calculations.
Internet Use (%) At any location At home Use broadband Internet at home Use dial-up at home
Sample SizeEstimated Population
People withdisabilities
41.437.433.14.0
12,63827,024,985
People withno disability
74.869.365.13.9
94,573213,523,194

Section A6: Broadband InternetUse by State, 2001 versus 2009
This section presents average broadbandInternet usage rates by state, as well as thestandard errors and 90% confidence intervalsfor the estimated state-level average broadbandInternet adoption rates.
EXPLORING THE DIGITAL NATION: HOME BROADBAND INTERNET ADOPTION IN THE UNITED STATES
U.S. Department of Commerce � Economics and Statistics Administration � National Telecommunications and Information Administration 52
Table A7: Average BroadbandInternet Use by State, 2009
Source: U.S. Census Bureau, Current Population Survey (CPS) and CPS School Enrollment and Internet Use Supplement, October 2009, and ESA calculations.
Mean
487367516869716766676470676356626754576170736267425758646873725566596361567062695360556073616572526766
StandardError
222211122112212222211211222221121121221122212211212
Lower Bound457064486667696463656267646154606451535968706065385555616571705164576059536760675057525870586370496563
Upper Bound527670546971736969686673716559657057616472756569456062677075755867626664597364725662586176636775556968
State
ALAKAZARCACOCTDEDCFLGAHIIDILINIAKSKYLAMEMDMAMIMNMSMOMTNENVNHNJNMNYNCNDOHOKORPARISCSDTNTXUTVTVAWAWVWIWY
90% Confidence IntervalAdoption Rate (%)

EXPLORING THE DIGITAL NATION: HOME BROADBAND INTERNET ADOPTION IN THE UNITED STATES
U.S. Department of Commerce � Economics and Statistics Administration � National Telecommunications and Information Administration 53
Table A8: Average BroadbandInternet Use by State, 2001
Source: U.S. Census Bureau, Current Population Survey (CPS) and CPS Computer and Internet Use Supplement, September 2001, and ESA calculations.
Mean
513124131011671071866491035109149867310714122127588981189109128811466
StandardError
111111111112111111111111111111111111111111111111111
Lower Bound4111031291056961655378248713874628612111116366879778810769354
Upper Bound715145141213891192187510124711916109795128161431386991191210111210149912677
State
ALAKAZARCACOCTDEDCFLGAHIIDILINIAKSKYLAMEMDMAMIMNMSMOMTNENVNHNJNMNYNCNDOHOKORPARISCSDTNTXUTVTVAWAWVWIWY
90% Confidence IntervalAdoption Rate (%)

Section A7: Marginal Effects ofDemographic and GeographicCharacteristics on the Likelihoodthat a Household UsesInternet at Home,2001 versus 2009
This section contains the underlying regressionresults for Table 26 in Section 8.4.1. Theanalysis presented in Section 8.4.1 involvedperforming the regression analysis separately for2001 and 2009 in order to analyze whether themarginal effects of selected demographic andgeographic characteristics on householdInternet use have changed over time.
EXPLORING THE DIGITAL NATION: HOME BROADBAND INTERNET ADOPTION IN THE UNITED STATES
U.S. Department of Commerce � Economics and Statistics Administration � National Telecommunications and Information Administration 54
Table A9: Marginal Effects: Regression ofHome Internet Use on Demographic and
Geographic Characteristics, 2001 and 2009
Robust standard errors in parentheses*** p<0.01, ** p<0.05, * p<0.1
Source: U.S. Census Bureau, Current Population Survey (CPS), CPS School Enrollment and Internet Use Supplement, October 2009, CPS and CPS Computer and Internet Use Supplement, September 2001, and ESA calculations.
2001omitted
0.1550***(0.006)
0.2959***(0.008)
0.3730***(0.008)
omitted
0.0971***(0.007)
0.2142***(0.008)
0.2909***(0.008)
0.0074***(0.001)
-0.0001***(0.000)
omitted
-0.1631***(0.008)
-0.1487***(0.010)
0.0456***(0.014)
-0.1191***(0.027)
-0.0623***(0.011)
0.0358***(0.002)
0.0361***(0.006)
omitted
0.0212(0.034)
yes
-0.0414*(0.025)
47,31088,963,933
0.324
2009omitted
0.1843***(0.007)
0.2954***(0.007)
0.3200***(0.007)
omitted
0.1320***(0.009)
0.2503***(0.009)
0.3049***(0.009)
0.0103***(0.001)
-0.0001***(0.000)
omitted
-0.1027***(0.008)
-0.1396***(0.009)
-0.0205*(0.011)
-0.0538***(0.016)
-0.0383***(0.010)
0.0288***(0.002)
0.0500***(0.006)
omitted
0.0224(0.025)
yes
0.0402(0.028)
43,66294,963,684
0.315
Linear Probability ModelFamily Income: Less than $25,000Family Income: $25,000-$50,000
Family Income: $50,000-$75,000
Family Income: $75,000 or more
Education: Less than High School DegreeEducation: High School Degree
Education: Some College
Education: College Degree or more
Age
Age-squared
Non-Hispanic WhiteNon-Hispanic Black
Hispanic
Non-Hispanic Asian
Non-Hispanic, Other
Foreign-born non-citizen
Total number of persons in household
Metropolitan (Urban)
Nonmetropolitan (Rural)
Not-identified (as metropolitan or nonmetropolitan)
State indicator variablesConstant
Sample SizeEstimated Number of HouseholdsR-squared

Section A8: Marginal Effects ofDemographic and GeographicCharacteristics on the Likelihoodthat a Household UsesBroadband Internet at Home,2007 versus 2009
This section contains the underlying regressionresults for Table 27 in Section 8.4.2 forcomparing the marginal effects of selecteddemographic and geographic characteristics onhome broadband Internet use between 2007and 2009.
EXPLORING THE DIGITAL NATION: HOME BROADBAND INTERNET ADOPTION IN THE UNITED STATES
U.S. Department of Commerce � Economics and Statistics Administration � National Telecommunications and Information Administration 55
Table A10: Marginal Effects: Regressionof Home Broadband Internet Useon Demographic and Geographic
Characteristics, 2007 and 2009
Robust standard errors in parentheses*** p<0.01, ** p<0.05, * p<0.1
Source: U.S. Census Bureau, Current Population Survey (CPS) and CPS School Enrollment and Internet Use Supplement, October 2007 and October 2009, and ESA calculations.
2007omitted
0.1297***(0.007)
0.2619***(0.008)
0.3309***(0.009)
0.3851***(0.009)
omitted
0.0812***(0.008)
0.2137***(0.009)
0.2971***(0.009)
0.0026***(0.001)
-0.0001***(0.000)
omitted
-0.1058***(0.008)
-0.1198***(0.009)
0.0412***(0.013)
-0.0522***(0.017)
-0.0516***(0.011)
0.0180***(0.002)
0.0811***(0.007)
omitted
-0.0033(0.026)
0.0686**(0.030)
42,48191,153,697
0.298
2009omitted
0.1671***(0.007)
0.2818***(0.008)
0.3233***(0.008)
0.3474***(0.008)
omitted
0.1104***(0.008)
0.2321***(0.009)
0.2936***(0.009)
0.0068***(0.001)
-0.0001***(0.000)
omitted
-0.1004***(0.008)
-0.1396***(0.009)
-0.0036(0.011)
-0.0527***(0.016)
-0.0527***(0.011)
0.0259***(0.002)
0.0698***(0.007)
omitted
0.0472*(0.026)
0.0734**(0.029)
43,66294,963,684
0.307
Linear Probability ModelFamily Income: Less than $25,000Family Income: $25,000-$50,000
Family Income: $50,000-$75,000
Family Income: $75,000-$100,000
Family Income: $100,000 or more
Education: Less than High School DegreeEducation: High School Degree
Education: Some College
Education: College Degree or more
Age
Age-squared
Non-Hispanic WhiteNon-Hispanic Black
Hispanic
Non-Hispanic Asian
Non-Hispanic, Other
Foreign-born non-citizen
Total number of persons in household
Metropolitan (Urban)
Nonmetropolitan (Rural)Not-identified (as metropolitan or nonmetropolitan)Constant
Sample SizeEstimated Number of HouseholdsR-squared

EXPLORING THE DIGITAL NATION:HOME BROADBAND INTERNETADOPTION IN THE UNITED STATESPrepared byECONOMICS AND STATISTICS ADMINISTRATIONandNATIONAL TELECOMMUNICATIONS AND INFORMATION ADMINISTRATIONin theU.S. DEPARTMENT OF COMMERCE
NOVEMBER 2010
NATIONAL TELECOMMUNICATIONS ANDINFORMATION ADMINISTRATION
www.ntia.doc.gov
ECONOMICS AND STATISTICSADMINISTRATION
www.esa.doc.gov
final cover 1 and 4.qxd 10/25/10 2:43 PM Page 1