exploring the currency of spirometric predictive equations ...€¦ · caused by cigarette smoke...
TRANSCRIPT

Exploring the currency of spirometric predictive
equations from the viewpoint of the Lung Age
concept.
Wendy Lynne Newbury
Discipline of General Practice
School of Population Health
Faculty of Health Sciences
The University of Adelaide
Australia
A thesis submitted in fulfilment of the requirements for the degree
of Doctor of Philosophy at the University of Adelaide
June 2013

ii
Table of Contents
Abstract ............................................................................................................................. iv
Declaration ........................................................................................................................ vi
Acknowledgements ........................................................................................................... vii
Abbreviations ................................................................................................................... viii
Chapter 1: Introduction ..................................................................................................9
Chapter 2: Literature Review ........................................................................................ 11
Background on spirometry ...................................................................................................... 11
20th Century developments ................................................................................................. 16
Standardisation of spirometry ................................................................................................ 17
Predictive values .................................................................................................................. 18
Chronic Obstructive Pulmonary Disease ................................................................................. 21
Effects of smoking ................................................................................................................... 26
Spirometry in smoking cessation counselling ......................................................................... 30
Research where spirometry was part of the intervention .................................................. 34
Research where spirometry results were communicated using lung age .......................... 35
Conclusion ............................................................................................................................... 42
Research Question .................................................................................................................. 43
Chapter 3: Exploring the need to update lung age equations ......................................... 44
Background .............................................................................................................................. 44
Discussion relating to Paper One ............................................................................................ 45
Chapter 4: Newer equations better predict lung age in smokers: a retrospective analysis
using a cohort of randomly selected participants. .............................................................. 56
Introduction ............................................................................................................................. 56
Chapter 5: Investigating Delta Lung Age in independent datasets .................................. 67
Introduction ............................................................................................................................. 67
Methods .................................................................................................................................. 68
Results ..................................................................................................................................... 71
Discussion ................................................................................................................................ 84
Chapter 6: Discussion ................................................................................................... 89
Main results ............................................................................................................................. 89
Cohort and Period Effects ....................................................................................................... 90

iii
Cohort Effect ....................................................................................................................... 91
Period effect ........................................................................................................................ 91
Cohort and period effects in relation to LA research .......................................................... 93
Inconsistencies between comparisons ............................................................................... 95
Lung Age in Smoking cessation ............................................................................................... 96
Counselling: ......................................................................................................................... 96
Paradigms of smoking cessation counselling ...................................................................... 96
Subjective age versus chronological age ............................................................................. 97
In relation to other research ................................................................................................... 98
Japanese lung age ............................................................................................................... 98
Hansen ∆LA ......................................................................................................................... 99
Editorial comment to Papers One and Two ...................................................................... 100
Collated equations ................................................................................................................ 101
Global Lung Initiative (GLI) – a new type of predictive equation...................................... 101
Limitations ............................................................................................................................. 103
Recommendations ................................................................................................................ 105
Chapter 7: Summary .................................................................................................. 107
Chapter 8: Appendices ............................................................................................... 108
Appendix 1: A pilot study to evaluate Australian predictive equations for the Impulse
Oscillometry System.............................................................................................................. 109
Appendix 2: Should we use ‘lung age?’ ................................................................................. 116
Appendix 3: Measuring the lung age of smokers. ................................................................. 120
Appendix 4: Lung age is a useful concept and calculation .................................................... 123
Appendix 5: Paradoxes of spirometry results, and smoking cessation ................................. 126
Appendix 6: Lung Age Estimator, Primary Care Respiratory Toolkit ..................................... 129
Appendix 7: Dawning of a new lung age? ............................................................................. 133
Appendix 8: Changes in Predicted FEV1 across 40 years according to different predictive
equations .............................................................................................................................. 136
Appendix 9: Age distributions of samples. ............................................................................ 137
Chapter 9: Bibliography ............................................................................................. 143

iv
Abstract
Spirometry is used to diagnose respiratory disease, to monitor disease progression and
response to treatment, and in epidemiological surveys. As a large burden of disease is
caused by cigarette smoking, spirometry has been incorporated in smoking cessation
counselling in an attempt to improve quit rates. The concept of lung age (LA) was
developed in 1985 in an effort to make spirometry results more easily understood by
the lay person. Research results using LA to aid quitting remain inconclusive. This
thesis investigates the need to update LA equations, as predictive equations based on
old data may not be relevant for today’s populations, and contemporary equations
may result in a stronger message for smokers.
New LA equations were firstly developed using contemporary Australian data and four
further LA equations were derived from previously published FEV1 predictive
equations. A series of comparisons of LA equations in contemporary Australian
datasets followed.
The first project compared the original Morris LA equations with newly developed
Australian LA equations in an independent workplace dataset (males only).
The second project compared four extra LA equations derived from previously
published FEV1 equations from Europe, the United Kingdom, America and Australia
with the Morris and the new Australian equations. An independent dataset of
randomly-selected males and females was used to compare these equations with the
Morris LA equations and contemporary Australian LA equations.

v
Lastly, a different type of LA equation expressed as delta lung age (∆LA), the difference
between chronological age and lung age, based on the ratio of Forced Expiratory
Volume in one second/Forced Vital Capacity (FEV1/FVC), was compared with three
other LA equations based on FEV1 alone. This project used three independent datasets
(urban, rural and a workplace) for added strength.
All LA equations confirmed poorer lung function in smokers than in never smokers in
all 3 independent datasets. LA estimates were approximately 20 years lower using the
original Morris equations when compared with the newest LA equations. The
differences seen between estimated LA using all six equations were consistent in each
analysis. The ∆LA equation gave extreme LA estimates in both the community-based
datasets compared with the LA equations based on FEV1 alone.
These results show that the Morris LA equations need to be updated. However, there
appears to be no advantage in using the ∆LA equation. The differences between the
older and the newer LA equations are most likely a result of cohort and period effects.
This is also the case in the predictive equations themselves. Continuously updating
predictive equations using recently acquired data will result in LA equations that are
more relevant to contemporary populations.

vi
Declaration
I certify that this work contains no material which has been accepted for the award of
any other degree or diploma in any university or other tertiary institution and, to the
best of my knowledge and belief, contains no material previously published or written
by another person, except where due reference has been made in the text. In addition,
I certify that no part of this work will, in the future, be used in a submission for any
other degree or diploma in any university or other tertiary institution without the prior
approval of the University of Adelaide and where applicable, any partner institution
responsible for the joint-award of this degree.
I give consent to this copy of my thesis when deposited in the University Library, being
made available for loan and photocopying, subject to the provisions of the Copyright
Act 1968.
The author acknowledges that copyright of published works contained within this
thesis resides with the copyright holder(s) of those works.
I also give permission for the digital version of my thesis to be made available on the
web, via the University’s digital research repository, the Library catalogue and also
through web search engines, unless permission has been granted by the University to
restrict access for a period of time.
Signed: ___________________________________ Date: 25th June 2013
Wendy Newbury (candidate)

vii
Acknowledgements
I would like to thank the North West Adelaide Health Study team, the Whyalla
Intergenerational Study of Health team, and the Metropolitan Fire Service Study team
for generously providing access to their datasets. Obviously, this data would not exist
without the hard work of the research and clinic teams, and the subjects themselves. I
sincerely thank you all.
A special thank you is also due to the Port Lincoln subjects who kindly presented for
spirometry and IOS tests in 2007.
I would like to thank the Discipline of Rural Health, University of Adelaide, for
providing a workplace for me in Port Lincoln for the duration of my candidature. The
support provided by their IT team is gratefully acknowledged.
Special thanks are also due to Nancy Briggs, and Michelle Lorimer, for statistical
assistance and support.
To my supervisors, Alan Crockett and Richard Ruffin, I sincerely thank you both. In
particular, Alan has been incredibly supportive, happy to share his knowledge of all
things respiratory, and very generous with his time over the last six years. Thank you
Alan for introducing me to a respiratory world very different to the one I knew from
my nursing training many years ago.
To my husband Jonathan and our daughters, thank you all for helping me get through
these last 4 years – and for every distraction away from my computer. Thanks for your
belief that I could do this. Your encouragement helped me beyond belief.

viii
Abbreviations
ATS American Thoracic Society
COPD Chronic Obstructive Pulmonary Disease
CS Current Smokers
ECSC European Community for Steel and Coal
ERS European Respiratory Society
FEF50 Forced Expiratory Flow at 50%
FEV1 Forced expiratory volume in first second
FEV1/FVC ratio of FEV1 to FVC
FVC Forced Vital Capacity
IOS Impulse Oscillometry System
LA Lung Age
∆LA Delta Lung Age (Difference between LA and chronological age)
LLN Lower Limit of Normal
MFS Metropolitan Fire Service
NHANES III Third National Health and Nutrition Examination Survey
NWAHS North West Adelaide Health Study
PEF Peak Expiratory Flow
RCT Randomised Controlled Trial
SA South Australia
SDL-age Spirometry Derived Lung Age
UK United Kingdom
ULN Upper Limit of Normal
USA United States of America
WISH Whyalla Intergenerational Study of Health

9
Chapter 1: Introduction
This thesis investigates the currency of predictive equations for spirometry from the
viewpoint of the lung age (LA) concept. It comprises a Literature Review, two published
papers together with a third project of linked research where LA equations have been
compared in multiple independent Australian datasets, a discussion,
recommendations, a summary, Appendices and Bibliography.
The LA concept remains controversial with many claiming it has no scientific basis and
should not be used. Others see it as a simple method to show the damage to the lungs
caused by cigarette smoke which can be used in conjunction with smoking cessation
counselling. LA has inherent problems linked to the wide range of normal values for
the spirometric indices derived from the predictive equations. However LA is easily
understood by people with no medical or respiratory science background. Primary care
providers generally have little understanding of the complexity of the interpretation of
lung function tests, they seek something that is ready to use that will benefit their
patients. LA output is available on many modern spirometers and can be readily
incorporated into counselling sessions. It has also been made available through online
websites and mobile phone ‘applications’.
Research about the benefit of using lung age in smoking cessation counselling has
been inconclusive and this is investigated further in the Literature Review. Possible
explanations are discussed in the series of three projects that form the body of work
for this thesis, as well as the following Discussion (Chapter 6). All are linked to the
currency of the predictive equation on which LA is based. New LA equations have been

10
produced, based on newer data than that which informs the original LA equation.
These new equations now give several up to date options for Europe and the United
Kingdom, the USA, and Australia. Further research is needed to validate these new
equations in appropriate populations.
The bibliography in Chapter 9 contains the references for Chapters 1-8, except for the
published papers which contain their own references.
The LA equations developed as part of this thesis have already been translated to the
patient care environment. They have informed the Lung Age Estimator in the Primary
Care Respiratory Toolkit which appears on the Australian Lung Foundation website
(see Appendix 6). They have also been incorporated into the COPD-6 screening device
(Vitalograph) for use in Australian primary care settings.
This work has been presented at the 6th World Conference of the International Primary
Care Respiratory Group (IPCRG), 25-28th April 2012, Edinburgh, UK.

11
Chapter 2: Literature Review
Background on spirometry
Spirometry is a non-invasive test that assesses lung function by measuring the volume
of air that a person can fully exhale after maximal inhalation, as well as the rate of
flow. The spirometer has become the standard tool for measuring basic respiratory
function at a reasonable cost. It is used to assist in diagnosis of diseases that limit
ventilatory function, to determine the severity of disease and to monitor both the
response to treatment and progression of disease. It is also used in the monitoring of
workers in hazardous workplace environments, and in epidemiological surveys.1
E.A. Spriggs provides an excellent history of the discoveries that led to the
development of the spirometer2 and some are described here. Borelli (in 1681) may
have been the first to attempt to measure the volume of air inspired in one breath by
sucking liquid up a tube. About 40 years later, in 1718, Jurin measured the volume of
air exhaled into a bladder, by Archimedes’ principle.2 Others continued to add to
knowledge throughout the 18th Century but it was in the early 19th Century that
technology advanced in line with the Industrial Revolution.

12
Edward Kentish and Charles Turner Thackrah both worked in the United Kingdom (UK)
in the early 1800s. Kentish measured what is now termed vital capacity with a
‘pulmometer’, consisting of a glass jar inverted in a trough of water; he recommended
that this measurement would assist in the selection of recruits for the infantry, rather
than basing their selection only on their height.3 Thackrah also used a pulmometer to
link ill-health to environmental conditions of the workplace at a time when there was
no government control over exposures to occupational hazards. The increasingly
industrialised workforce experienced conditions that were extremely poor.4
While not the first to measure lung capacity, John Hutchinson (a British surgeon) is
credited with inventing, in the 1840s, what is considered to be the precursor to the
modern spirometer.5-8 This instrument consisted of a calibrated bell, suspended upside
Figure 1: Kentish’s pulmometer, 1814 From: Kentish, E. An account of a pulmometer, by which may be known the power and the capacity of the lungs to receive the atmospheric air. An account of Baths, and of a Madeira-House at Bristol. London: Longman, Hurst, Rees, Orme & Browne; 1814.

13
down in water to allow measurement of the volume of exhaled air from fully inflated
lungs, which he called the ‘vital capacity’ (VC).9
Hutchinson was part of a scientific group that believed there was a rule, or a reason, to
explain all aspects of human physiology. Using his analysis of over 4000
measurements, mostly of male subjects from a wide variety of occupations, he
“… was able to link clinical medicine, with experimental physiology,
the emerging field of statistics, and the social needs of
industrializing Britain.”10
Hutchinson’s careful analysis led him to determine that the main factors that influence
vital capacity are height, age, and disease and created the first table of predictive
Figure 2: Hutchinson's spirometer From: Hutchinson J. On the capacity of the lungs, and on the respiratory functions, with a view of establishing a precise and easy method of detecting disease by the spirometer. Medico-Chirurgical Transactions. 1846;29:137-252. Copyright 1846, Royal Society of Medicine Press, UK. (Used with permission)

14
values. He also demonstrated that a fall in vital capacity preceded detection of lung
disease by stethoscope (invented 30 years before), thus being possibly the first person
to apply spirometry to the diagnosis of disease11, 12 although some say that Kentish
preceded him in this.1, 13 Hutchinson claimed vital capacity was an indicator of
longevity that would be of interest to the medical profession, the life insurance
industry and could assist in determining the fitness of recruits for the army. He was
also interested in workplace health issues, of coal miners in particular.14
The spirometer did not gain immediate widespread acceptance clinically, despite a
more compact version being developed in 1852.15 Physiologists however continued to
work with the technology, and spirometry continued to be used in research in Europe
and America. Spirometry did however have some early proponents. In 1864, Beigel
expressed his opinion that spirometry deserved wider acceptance than it had thus far
received,16, 17 and that “…the spirometer promises to become one of the most
excellent diagnostic helps in diseases of the chest”17 as it allowed objectivity in
diagnosis as well as the ability to monitor response to treatment.

15
In 1865 a device known as a kymograph was added to the spirometer which enabled
the recording of time in relation to measurement of air volumes, thus producing
volume-time graphs.18 This answered an earlier criticism in a report in 1860 which
described use of the spirometer by the Grenadier Guards to assess the fitness of
recruits.19 It had been thought that it may be possible for unwilling recruits to avoid
enlistment by performing at levels below the maximum effort. The addition of the
kymograph meant that sub-maximal attempts could be detected.18
In 1870 Bain described the development of a spirometer using dry bellows which was
less complex, not requiring water or stopcocks.20
Figure 3: Salter's kymograph From: H. Salter, Lectures on Dyspnoea, Lecture 3. 1865. The Lancet, Volume 86 (2200), p475-78. (Reproduced with permission from Elsevier Limited.)

16
20th Century developments
Interest in the respiratory system burgeoned in the first half of the 20th Century,
stimulated among other things by investigations into the effects of toxic gases in World
War 1 (WW1) and the effects of altitude on pilots in World Wars 1 & 2.21 Asthma,
emphysema and diseases caused by industrial and environmental exposures had also
stimulated interest in lung function, as did the developing specialty of thoracic surgery.
Studies of ventilatory abnormalities had enabled recognition of ‘obstructive’ and
‘restrictive’ patterns while the effects of high cigarette use during WW1 were
beginning to be observed.1 One hundred years after Hutchinson measured what was
essentially the Slow Vital Capacity, concurrent but independent work in Europe and
America saw the development of the timed forced expiratory manoeuvre as published
by Tiffeneau and Pinelli in 1947,22 and Gaensler in 1951.23 This manoeuvre made
spirometry more applicable to clinical practice by providing a measurement that
related to airways disease as it was observed that in disease the volume of air exhaled
per unit of time was lower than in health.22
The spirometer itself has undergone frequent modification2, has become more
compact and easily portable and this has been accompanied by reduction in cost of
purchase. As early as 1969 and into the 1970s and 1980s, computerisation of
spirometry output increased accuracy and enabled more timely results to be available.
This has also enabled instant feedback on the quality of the manoeuvre.24-27 Office
spirometers are now miniature in comparison to earlier models, with different types of
transducers such as pneumotachographs, hot wire anemometers, ultra-sonic sensors
that detect and record flow from which volume is then electronically differentiated.28

17
The small office spirometers are designed for use in the doctor’s clinic rather than the
respiratory laboratory and also enable easy measurement during fieldwork for
epidemiological surveys or in the workplace.
The forced expiratory manoeuvre used in spirometry has 3 sequential components.
(1) a maximal inhalation
(2) maximal exhalation follows, where the air from the full lungs is exhaled
(blasted out) as hard and as fast as possible and
(3) prolonged exhalation, or continuing to blow out until all the air is expelled.29
The forced vital capacity (FVC) measures the total volume of air forcibly exhaled over a
minimum of 6 seconds or greater, following a maximal inhalation. The volume of air
exhaled forcefully in the first second (FEV1) relates to airway patency and lung
elasticity. It has become the most common of the timed forced expiratory measures.
The ratio of these two measures (FEV1/FVC) is considered a measure of the degree of
airflow obstruction when it is reduced below the current guidelines30 or the lower limit
of normal (LLN).31
Standardisation of spirometry
International guidelines published by the leading societies of respiratory medicine and
respiratory science have produced, and regularly updated, standard specifications for
spirometers
the manoeuvres necessary for successful tests, and
18
the interpretation of results.
Early guidelines attempted to clarify the terminology that had developed with regard
to the measuring of lung volumes, firstly by physiologists in the United States of
America (USA) in 195032, with the earliest British version dated 1957.33 A report in
1963 by the American College of Chest Physicians included a discussion of types of
instruments in use, a review of the standards applying to the prediction of normal
values and notes on interpretation of results.34 The American Thoracic Society (ATS)
has produced regular updates on the standardisation of spirometry since 1979.35-38
British39 and European36,37 statements have also been published. The most recent
update appeared in 2005, as a joint statement between the ATS and the European
Respiratory Society (ERS).40-42 These are recognised globally as the most up to date
recommendations for respiratory tests, for the respiratory laboratory as well as for
epidemiological studies. Guidelines with respect to spirometry in the primary care
setting have also been recently produced by the International Primary Care
Respiratory Group.43
Predictive values
It is important to know what is normal in order to recognise results that might indicate
presence of disease. Hutchinson himself produced a table of expected values for vital
capacity.8 He also reported measurements made on a particular person (a noteworthy
American of great height) while healthy, and then several years later as the health of
this person declined prior to his death due to tuberculosis.8 This reflects what is
considered to be the ideal situation, recognised soon after Hutchinson’s paper17,
where a baseline measurement is made before the onset of disease, which would

19
allow each individual to act as his/her own control.28, 44, 45 However, this is not usually
possible and symptoms such as breathlessness on exertion are frequently already
present when most people present to their physician for an assessment of their lung
function. Diagnosis of disease therefore requires comparison of a subject’s results with
population norms determined by predictive equations with a defined lower level of
normal, in combination with history of exposures and clinical examination.
Predictive equations define the range of normal values measured by spirometry based
on results from studies of a healthy population; recommendations regarding these
have also evolved with greater understanding of the effects of lung diseases and
exposures that are harmful to lung function. The main predictors of lung function in
adults are sex, height, and age, with weight contributing to a much lesser extent.37
Ethnicity has also been thought to contribute because of differences in dimensions of
the thorax and how this relates to standing height.10, 37, 42, 46, 47 Together, these
influences account for up to 70% of the value of FEV1 or FVC in healthy adults;
technical and other yet to be identified factors account for the remaining 30%.37, 44, 48
Lung function reaches a peak around early adulthood and then plateaus for several
more years before declining with age. Cigarette smoking influences all three of the
factors determining the level of FEV1 at any time in adulthood: the peak attained in
early adulthood, the length of the plateau phase and the rate of decline with age.49
Other factors that affect the peak achieved at 20-25 years of age include in utero
and/or early life exposure to cigarette smoke, premature birth, and low birth weight.50
There are also genetic factors related to lung development as well as disorders such as

20
asthma and chronic obstructive pulmonary disease (COPD).51 Early childhood
respiratory illnesses and socioeconomic aspects may also contribute.44, 52-54
Current ATS/ERS guidelines for normal values recommend that the reference
equations should be derived from a large representative sample of the general
population, which should be composed of healthy rather than abnormal subjects, i.e.
have no previously diagnosed respiratory disease or symptoms, be never-smokers, and
have no workplace or environmental exposures to dust or fumes.37, 42, 55 These
guidelines also recommend that predictive equations be updated regularly,
approximately every 10 years.42 This recommendation aims to reduce the impact of
the cohort effect and the period effect. The cohort effect describes how the lung
function of a 50 year old today would be different to that of a 50 year old either 30
years ago or in 30 years’ time due to changes in influences such as environment,
nutrition and prevalence of smoking.37, 49 The period effect describes advances in
technology that result in measurement differences, including differences in
recommended technique, improvements in equipment such as computerisation, and
interpretation differences.49
It has been suggested that the use of predictive equations alone to diagnose disease is
flawed. Subject exclusion criteria for developing normal values include a positive
respiratory disease status, respiratory symptoms, and current smoking status as well
as the inability to perform reproducible spirometry. Marks suggests that the selection
of only healthy subjects to generate predictive equations could result in bias and
compromise the generalisability of the sample.56 This has been addressed previously
with the ATS guidelines as early as 199137 recommending that abnormal subjects, with

21
abnormality defined by taking into account the smoking habits, environmental or
occupational exposures, disease status or respiratory symptoms, being excluded from
general population samples. This will make the remainder of the sample a ‘normal’ or
healthy population as opposed to a ‘general’ population.42, 55 Clinicians shouldn’t rely
solely on results of pulmonary function tests, but should also consider a patient’s
history, signs and symptoms before making a diagnosis.30, 57
New predictive equations for spirometry have been recently made available and have
been implemented on some spirometers.58 These have been developed from the
collating of different existing datasets from many centres around the world. Equations
compiled from different separate studies in different countries are not new, the
equations that have been long-used in Europe were compiled from data from different
projects spanning 20 years, and utilised varied equipment (European Community for
Steel and Coal (ECSC)/ERS).59 These however are now approximately 40 years old. The
new equations have been developed using new, complex statistical methods to enable
them to cover a single age-range of 3-95 years. However, the utility of this equation
has not yet been fully investigated.
Chronic Obstructive Pulmonary Disease
Chronic Obstructive Pulmonary Disease (COPD) is a preventable, chronic and
debilitating respiratory disease characterised by airflow limitation, including reduced
maximum expiratory flow and slow forced emptying of the lungs, which is not fully
reversible with bronchodilation.60, 61,62 It is usually diagnosed later in life as it has an
insidious onset with those affected often mistaking early symptoms for the assumed
22
decline in function associated with normal ageing. COPD usually goes undiagnosed
until symptoms worsen, in later stages of the disease.30 According to the Global
Initiative for Obstructive Lung Disease (GOLD) definition, limitation is
“…usually progressive and associated with an abnormal
inflammatory response of the lungs to noxious particles and
gases.”30
COPD covers chronic obstructive bronchitis, where remodelling of the airway walls and
mucus in the lumen obstruct the airways, and emphysema where airspaces become
enlarged because lung parenchyma is destroyed, and lung elasticity is lost resulting in
closure of the small airways. Mucus hypersecretion (which causes a productive cough
of more than 3 months duration for more than 2 consecutive years) is not always
associated with airflow limitation, however all 3 conditions tend to be seen together.63
Some childhood respiratory illnesses, including bronchopulmonary dysplasia and
bronchiolitis as well as untreated asthma, may also lead to COPD in later life in the
absence of a personal smoking history, although cigarette smoking has an added effect
on top of these conditions.
The FEV1 and the FEV1/FVC ratio are used to assess airflow limitation. There has been
ongoing debate for decades about the accepted method to define abnormal results.
This is not helped by different guidelines that are not consistent in their
recommendations, with the ATS/ERS statement on interpretation of lung function
tests39 differing from its statement on diagnosis/management of COPD.64 The use of a
fixed ratio of FEV1/FVC below 80% dates from around 1954.22 It was originally
conceived as a rough guide, and continues to be recommended as a simple method to

23
define abnormal results.56,58,59 The COPD guidelines by National Institute for Health
and Clinical Excellence (NICE) 62, the Global Initiative for Chronic Obstructive Lund
Disease (GOLD)59 and ATS/ERS Global Strategy for the Diagnosis, Management, and
Prevention of Chronic Obstructive Pulmonary Disease61 all use a FEV1/FVC ratio of 0.7
(or 70%) to establish airflow limitation, and <80% of the predicted value for FEV1 to
determine the degree of impairment. The COPD-X Plan, the Australian and New
Zealand Guidelines for the Management of Chronic Obstructive Pulmonary Disease65,
currently uses the guidelines from the GOLD initiative. As the FEV1/FVC normally
decreases with age, those with lower predicted values (e.g. shorter, older, females) will
be more likely to fall below the 70% cut off.66 This may result in asymptomatic older
people with no smoking history or exposure to noxious particles or gases being
erroneously determined to have airflow limitation, a false-positive diagnosis. At the
same time, young people who actually have airflow limitation are more likely to be
missed, creating false-negatives.
The opposing view is that values below the statistically derived 5th percentile should be
considered to be abnormal.42 The 5th percentile lower limit of normal (LLN) declines
with age and therefore the problems associated with using a fixed cut-off may be
avoided.66 Using the 5th percentile of measurements from a normally distributed
sample of a healthy population means that 5% of subjects without disease would be
misclassified, i.e. would be false positives.37 Modern computerised equipment is able
to promptly calculate and display a statistically derived LLN, as well as include it in the
printed report, which should negate the argument about the ease of use of the fixed
cut-off.66 The ATS/ERS Interpretive Strategies for Lung Function Tests (1991)
24
recommend that values below the 5th percentile should be considered to be outside
the range of normal and that using both 80% of the predicted value for FEV1 and 0.7 of
FEV1/FVC ratio will lead to errors including false-positives in both sexes, as well as
over-diagnosis of COPD in asymptomatic elderly never-smokers37 and this is repeated
in the 2005 ATS/ERS guidelines for Interpretative Strategies for Lung Function Tests.42
In response to the ongoing international debate, the latest GOLD guidelines
acknowledge that
“…use of the fixed FEV1/FVC ratio… will result in more frequent
diagnosis of COPD in the elderly and less frequent diagnosis in
adults younger than 45 years compared to using a cut-off based on
the lower limit of normal (LLN) values for FEV1/FVC.”30(p viii)
Both the fixed ratio and the statistically derived LLN depend on the use of appropriate
predictive equations for the local population as discussed in 2005 ATS/ERS guidelines
on Interpretative Strategies for Lung Function Tests.42 Important considerations in the
selection of appropriate predictive equations include matching age-range,
anthropometric measurements, ethnicity, even socio-economic and environmental
aspects. The type of instrument as well as the statistical model used to derive the
predictive equation should also be considered.42
A recent review of publications where FEV1/FVC below LLN was compared with
FEV1/FVC less than 70% concluded that the prevalence of COPD detected by
spirometry was greater when using the fixed cut-off of 70% FEV1/FVC than when using
the LLN.67 However, the authors note that one longitudinal study showed that subjects
who were defined as normal using LLN but abnormal using the fixed cut-off had higher

25
rates of mortality and COPD-related hospitalisation than healthy subjects, but lower
than those with values below the LLN during the 11 years of follow-up.68 This clearly
needs further investigation.
Historically, the 19th Century saw rapid industrialisation originally in the United
Kingdom (UK), which was followed by Europe and America. Power for the burgeoning
factories was supplied by coal-burning plants, while the burning of coal also provided
heating inside the home.62 Together these factors caused appalling pollution in the
cities which, combined with the workplace dust exposures in the mills and the mines,
contributed to the development of emphysema and chronic bronchitis, especially in
the UK. Improvements in both workplace dust exposures and outdoor pollution
coincided with the dramatic increase in the prevalence of cigarette consumption
around the times of the two World Wars.
Figure 4: Photograph of Widnes, Cheshire, UK, in the late 19th
century showing the effects of industrial pollution. From: Hardie, D. A history of the Chemical Industry in Widnes, Imperial Chemical Industries Limited, 1950. Source: Wikimedia Commons: http://commons.wikimedia.org/wiki/File:Widnes_Smoke.jpg

26
The major risk factor for COPD in the developed world is cigarette smoking. Other risk
factors include exposure to both indoor and outdoor air pollution (including from the
burning of biomass fuels), occupational and environmental exposures to toxic dust and
fumes, and exposure to second-hand smoke. Genetic risk factors, such as α-1 anti-
trypsin deficiency, are rare but recent studies of the human genome have identified
regions on chromosomes 4 and 15 that are associated with susceptibility to COPD.60
Effects of smoking
Smoking has long been thought to be deleterious to health, with the first published
anti-smoking comment in English possibly being that by King James I of England in
1604. ‘A Counter-blaste to Tobacco’69 followed the popularisation of tobacco smoking
in England by Sir Walter Raleigh, in the late 1500s.70 James I described smoking as:
“A custome loathsome to the eye, hatefull to the Nose, harmefull to the
braine, dangerous to the Lungs , and in the blacke stinking fume
thereof, nearest resembling the horrible Stigian smoke of the pit that is
bottomlesse.”69
Tobacco was originally smoked in pipes or used as snuff; cigars followed around the
end of the 18th Century. The 19th Century saw the introduction of the ready-made
cigarette with mass production starting around 1880.62, 70, 71 In males, the popularity of
cigarettes was greatly influenced by World War 1 when cigarettes were distributed to
soldiers to help them to cope with the stress of the battlefield. It is disappointing that
heavily subsidised cigarettes are still available to the armed forces in combat zones to
this day. By the end of World War 2, 80% of British men were regular smokers.70
Increased prevalence of smoking in females followed that of males, particularly during

27
and after World War 2 when women were increasingly earning their own money when
employed outside the home.
Around the time that it became apparent that poor air quality was linked with
respiratory deaths (the infamous London smog of 1952 caused at least 4000 deaths
due to cardiac or respiratory problems) research into causes of lung cancer deaths was
underway. Lung cancer had been an extremely rare disease around 1880, with
increased prevalence from the turn of the century and after World War 1, in women as
well as men.72 With the benefit of hindsight, this was related to the introduction and
rapid increase in popularity of the cigarette, although at the time other possibilities
such as increased air pollution from industrial sources as well as from domestic coal
fires, the sealing of roads with asphalt, the increase in use of motor vehicles were all
considered to be possible causes.71, 72 Research prior to 1950s consisted mostly of
case-control studies, and included work by Richard Doll and Bradford Hill which had
originated in London but had later expanded to include other cities around the UK,73
and in USA by Wynder and Graham.74 Together with results from large prospective
cohort studies that followed soon after, such as the British doctor cohort of Doll and
Hill75, these provided evidence that smoking not only caused lung cancer, but also was
associated with chronic bronchitis and coronary thrombosis. The British doctor cohort
was followed from 1951 for more than 50 years.76 This work is the keystone of all anti-
tobacco initiatives.
Cigarette contents can be readily manipulated by the manufacturers, and some
additives are known to dilate the airways, which facilitates increased smoke intake and
nicotine absorption.77, 78 Nicotine is a naturally occurring substance in tobacco; it is

28
highly addictive and is the reason that most smokers continue to smoke.79 Cigarette
smoke has a lower pH than that of pipes or cigars; this inhibits nicotine absorption via
the oral mucosa therefore a deeper inhalation is required to deliver the smoke to
where nicotine is readily absorbed, the lower airways and alveoli. This results in the
extremely large surface area of respiratory epithelium being exposed to the highly
toxic products of combustion.80, 81
Repeated, chronic exposure to the huge number of toxic chemicals and gases in
cigarette smoke causes damage to the airways at the cellular level as well as reducing
the effect of the body’s anti-aging defence mechanisms.82
After the nasal hairs, the next line of defence in healthy lungs is the mucociliary
escalator. This is severely compromised by exposure to cigarette smoke. Mucus
normally traps bacteria and particles which are then swept up the bronchial tree by
the regular beating action of the cilia; but mucus production is increased and the
action of the cilia is adversely affected due to damage caused by the toxicity of the
chemicals in cigarette smoke – the beat frequency of the cilia is reduced, the length of
the cilia is decreased and the number of cilia are all greatly reduced in regular
smokers.83-87
At the same time, damage occurs to the junctions between the cells in the epithelium,
allowing toxic particles to cross the membrane into the lung tissue. Lung inflammation
results via a very complex mechanism involving increased numbers of inflammatory
cells such as leucocytes (macrophages and neutrophils) and lymphocytes.
Inflammatory mediators secreted by these cells cause recruitment of further

29
inflammatory cells from the circulation, structural changes in the airways and
parenchyma with associated vascular changes, together with increased mucus
secretion.84, 88-90
Oxidative stress from cigarette smoke as well as from activated inflammatory cells
causes further inflammation as well as a protease-antiprotease imbalance. Matrix
metalloproteinase, from macrophages as well as the small airways, attacks the
complex matrix that forms the alveolar wall, as well as further increasing the
inflammatory response.84, 85, 88, 90-92
These mechanisms contribute to destruction of lung tissue and elastin leading to
emphysema. This cycle of further inflammation and tissue damage is self-perpetuating.
Results are seen as chronic bronchitis due to significant mucus production leading to
airway remodelling and obstruction of the small airways, and emphysema with
destruction of the lung parenchyma, reduction in the elasticity of the lung tissue, and
closure or collapse of the small airways.30, 63, 89-93 The associated decreasing lung
function is seen as an increase in the rate of age-related decline.60, 84, 93, 94
The damage caused to the lungs by chronic exposure to cigarette smoke has been
likened to an increased rate of biological ageing, where impaired defence and repair
systems result in a rate of cellular damage beyond that which normally occurs with
chronological ageing.93, 95 Smoking has also been found to contribute significantly to
premature ageing of the skin93, 96-98 and similar damage at the cellular level may be the
mechanism involved in other diseases such as cancers and atherosclerosis.95 As well as
being the major cause of COPD, smoking is recognised as causing cancer in many

30
different sites including the bladder, the cervix, the oesophagus, the kidney, the larynx,
the oral cavity and pharynx, the pancreas and the lungs, and causing acute myeloid
leukaemia.90, 99 Smoking also causes other potentially fatal diseases including
ischaemic heart disease, abdominal aortic aneurysm, stroke, and pneumonia.80, 82, 99, 100
Several large studies have shown that the rate of decline of lung function returns to
that of never-smokers following smoking cessation and this is demonstrated to be
more beneficial when quitting occurs earlier rather than later.76, 101-104 Risk of other
smoking-related illnesses also falls after smoking cessation.105
Spirometry in smoking cessation counselling
The best method of reducing the risk of developing COPD, or to slow down the
progression of the disease, is to stop smoking.106
In describing the normal course of disease progression in airflow obstruction, Fletcher
and Peto showed decline in lung function is greater in smokers who are susceptible to
the toxins in cigarette smoke (evidenced by greater rates of decline of FEV1) than in
non-susceptible smokers94, and that the rate of decline for susceptible smokers who
stop smoking reverts to that of never-smokers. This project followed working men in
London for approximately eight years. A more contemporary concept is to classify
patients with obstruction into different phenotypes based on whether they are fast or
slow decliners. Fletcher and Peto suggested that FEV1 could be used as a screening tool
to detect susceptible smokers in middle-age, and that the identification of a FEV1 that
is lower than expected could help to persuade smokers to quit by showing evidence of
lung damage caused by smoking.94

31
The Framingham Offspring study showed that the graph of expected decline in lung
function created by Fletcher & Peto94 could be extended to females.102 Two other
recent research projects indicate that the rate of decline in FEV1 in the early stages of
the disease could be greater than previously thought while at the same time being
slower in the later stages of disease. However these results come from subgroup
analyses that were originally unplanned.107
Researchers continued to investigate methods of using spirometry to promote
smoking cessation and reduce the prevalence of diseases caused by cigarette smoking.
In 1974, a respiratory questionnaire was combined with spirometry feedback at an
urban emphysema screening centre in USA. The significance of respiratory symptoms
was explained together with information about spirometry results; “lung age” was
included in their test results.108, 109 Follow-up of over 1,600 people occurred 18 to 36
Figure 5: Fletcher and Peto graph Adapted from the original by Fletcher and Peto showing the ‘normal’ age-related decline of lung function (FEV1) in healthy never-smokers (or those not susceptible to cigarette smoke) and the steeper rate of decline seen in susceptible smokers. A return to the normal rate of decline is seen in those smokers who quit early (at 45 years) and those who quit later (65 years). Used with permission from BMJ.

32
months after being screened, a quit rate of 20% was reported. There was no control
group and there is insufficient information to determine the methods used, including
the population being studied, the equipment used, how lung age was communicated,
or the method of follow-up. Having noted that smokers had lower pulmonary function
than non-smokers, the authors stated that the
“…experience suggested the value of using an estimated lung age
based on ventilatory function as a psychological tool to confront
the smokers with the apparent premature aging of their
lungs”.109
‘Premature ageing’ was used to explain the effect of damage caused to the lungs by
cigarette smoking where lung function at a particular age was lower than expected, or
was equivalent to what would be expected for a healthy never-smoker at a later stage
in life.
Similarly, Australian research published in 1979 also compared the mean chronological
age of smokers to average predicted ages given the mean lung function observed in
different categories of smoker who smoked greater than 10 cigarettes per day.110 Lung
function was significantly lower in cigarette smokers than in non-smokers, with greater
decline in lung function with age. The authors demonstrated this in FEV1, FVC and
FEV1/FVC (expressed as %); also that lung function declined at a greater rate in heavier
rather than lighter smokers. They concluded that showing the decline in lung function
related to chronological age may be useful in convincing smokers of the harmful
effects of smoking.

33
Morris and Temple published the concept of lung age six years later, in 1985.109 They
manipulated previously published predictive equations for several spirometric
parameters111 and re-solved them for age (Table 1). In doing this Age becomes the
dependent variable, and Height and the observed values (e.g. FEV1, FVC, FEV1/FVC)
become the independent variables (predictors).109 Higher lung age estimates reflect
poorer lung function, where the lungs seem to have ‘aged’ beyond the person’s actual
age. Linking a person’s observed lung function to the age where these results would be
considered to be normal produced a more easily understood method of
communicating spirometry results to smokers that illustrated the deterioration in lung
function caused by smoking.109
Males FEV1 = 0.092*H– 0.032*Age -1.260.
Lung age = 2.870*H – 31.25*Observed FEV1 -39.375
Females FEV1 = 0.089*H– 0.025*Age – 1.932
Lung age = 3.560*H – 40.000*Observed FEV1 – 77.280
Table 1: Morris and Temple lung age equations Predictive equations for FEV1 for males and females, from 1971
111, and the corresponding lung age
equation.109
In the lung age equation, predicted FEV1 is substituted with the observed FEV1 for that person. H = height (inches). FEV1 = Forced expiratory volume in first second.
Morris and Temple investigated components of the FVC manoeuvre (FVC, FEV1, FEF25-
75% (litres/second) and FEF200-1200 (litres/second)), that had previously been used to
develop predictive equations.111 They compared the Standard Error (SE) for each test
(or combination of tests) to determine which gave the most reliable result for
estimating lung age. They determined that FEV1 was the most appropriate by having
the smallest SE. They then applied all the lung age equations to an independent
dataset whose subjects had been previously classified normal/abnormal based on

34
responses in a respiratory health questionnaire, and on results of pulmonary function
tests. Again, lung age based on FEV1 produced results with the least number of
outliers. Results showed that lung age approximated chronological or actual age for
previously determined normal results, while lung age estimates were greater than
chronological age for abnormal results. It was hypothesised that providing results of
spirometry as lung age to smokers during smoking cessation counselling may provide
the impetus for them to quit their smoking habit. 109
Researchers have continued to attempt to find a way of increasing smoking cessation
rates by communicating spirometry results to smokers. Study design has varied, and
results have been mixed.
Research where spirometry was part of the intervention
Where spirometry was part of the intervention in RCTs, early studies from Australia in
a general practice setting112, and from the USA (in a health promotion setting for
Veterans113) reported much higher quit rates in the group receiving the intervention
than the control groups. The Australian study did not give details of method of
communication of spirometry results112, while the American study compared subject
results to expected values for a non-smoker.113
Another study, from Norway114, provided feedback by letter instead of face to face
with physician or health counsellor. The personalised feedback included linking
previous answers regarding smoking and asbestos exposures with FEV1 results (no
details were given of how spirometry results were communicated) with information

35
about increased risk with exposure to asbestos, low FEV1, or both. Results were similar
to the previous two studies but with less difference observed between groups.
In 1999, a further study from America gave spirometry results as %predicted, using
reference values by Crapo.115 Researchers found no difference between the
intervention/control groups, however this trial gave different levels of advice in both
groups depending on motivational stage.116
In 2006 a Swedish study investigated whether annual spirometry for three years would
improve quit rates. This was combined with brief smoking cessation advice (delivered
by a nurse) and a physician letter that detailed results and any changes from previous
tests. Smokers with COPD had significantly higher quit rates than those with normal
lung function after three years. In those with normal lung function, smoking cessation
rates were not increased with repeated spirometry. 117
In 2009, Kotz et al from the Netherlands, used confrontational counselling using
spirometry results together with nortriptyline, a tricyclic antidepressant sometimes
used to assist smoking cessation, but the study was underpowered to show any
significant difference in sustained quit rates after one year.118
Research where spirometry results were communicated using lung age
A detailed look at research where lung age was the method used to communicate
spirometry results in the intervention group is not definitive as the number of trials is
not large. Some papers report pilot studies which involve small numbers and therefore
lack power.119-121 Others report complex trials comparing several different
interventions of which only one was spirometry.118, 122-124 Difficulties in recruiting and

36
retaining participants can also result in trials being underpowered.118 The results
remain inconclusive.
Italian RCT, Segnan, 1991
An Italian RCT in a general practice setting122 compared
(1) minimal intervention (usual care) with
(2) repeated counselling only,
(3) repeated counselling plus nicotine gum, and
(4) repeated counselling with spirometry results presented as lung age.
Quit rates in all arms of the study that used repeated counselling were higher than the
minimal intervention group although none reached statistical significance. The
research team experienced multiple problems: fewer participants than anticipated
meant the study was underpowered, poor adherence to study protocol by the GPs
resulted in contamination between groups, and there was low compliance where less
than half of those in spirometry group actually had spirometry. Within the spirometry
group, those who actually had spirometry had a higher cessation rate than non-
compliers.
American Senior High School or Community College settings, Prokhorov et al,
1996-2008
Several studies in American Senior High School or Community College settings,
including two pilot studies, have shown inconclusive results.
(1) An early pilot study120 in a Senior High School had 26 students perform
spirometry. The mean age was 17.2 years. 95.5% of subjects had FEV1>80%
37
predicted regardless of smoking status, although current smokers experienced
more respiratory symptoms than did non-smokers.
(2) A pilot Randomised Controlled Trial (RCT)121 compared a control group with an
intervention group which completed a respiratory symptoms questionnaire and
performed spirometry. Both groups received a brochure about smoking
including the chemical content of cigarettes, diseases related to smoking
including mortality statistics, short term risks, and a description of lung age and
how it is measured. Spirometry results were expressed as lung age; these were
combined with feedback on reported respiratory symptoms. The research team
found no significant difference in worry and desire to quit between the control
and intervention groups. Increasing lung age resulted in participants being less
interested, and saying they had not expended full effort in the breathing
manoeuvres required for successful spirometry. The mean chronological age of
these participants was 20.5 years. A selection bias could have occurred as
payment was made to the 124 volunteer subjects for their participation.
(3) The “Look at Your Health” project123 trialled computer-assisted smoking
cessation counselling in community college students which gave personalised
feedback on health risks and readiness to alter smoking behaviour. The cluster
RCT involved 426 students in 15 pair-matched campuses. The standard care
group received brief counselling, were provided with a self-help manual and
were strongly advised to quit. The intervention group received a motivational
counselling intervention and feedback about lung function, with spirometry
results provided as LA. There was a higher quit rate in the intervention group at

38
ten month follow-up: reported cotinine-validated quit rates of those who
completed the program – 16.6% (experimental group), 10.1% (usual care
group), p = 0.07. When recalculated as intention to treat, where all who didn’t
complete the program were assumed to be continuing smokers, the quit rates
fell to 11.4% (intervention) and 8.2% (usual care). This sample had a mean age
of 22.8 years.
Possible problems in these projects may have arisen in using the Morris lung age
equations as 20-45% of the sample were not Caucasian. Also, the age of many of the
subjects in these studies may have been outside the range of the reference equation
informing the lung age equations (20-84 years).111 The age of the subjects could also
mean that the cumulative effects of smoking may not have been evident although
others have found that cigarette smoking has a deleterious effect on levels of lung
function and on the airways in both adolescent males and females despite low
cumulative levels of smoking.125, 126 The other factor in these studies is that the lungs
of such young participants are still growing.
Polish population studies, 2003, 2006
Two similar papers describe projects that followed-up subjects 12 months after large
voluntary national spirometry screening programs that included brief smoking
cessation counselling delivered by a physician in high-risk Polish populations.127, 128
Although these have no control groups, the reported quit rates are higher than what is
normally seen in ‘usual care situations’. In both these screening programs,
FEV1%predicted was superimposed on a simplified Fletcher and Peto graph, showing
the relationship between the actual result and the predicted value for age, and the

39
subsequent expected decline if smoking continued. In those with normal spirometry,
advice focussed on risk of developing COPD, lung cancer, coronary artery disease and
harmful effects of smoke to family members. Smoking status was validated by exhaled
carbon monoxide.
(1) In 2003 Gorecka et al reported a quit rate of 9.3%, and that subjects with
airflow limitation (AL) were more likely to have quit than those with normal
lung function and that those with more severe AL had higher quit rates.127
(2) Of almost 4,500 current smoking adults who were invited for follow-up after
screening in 2000-2001, 13.4% had quit at 12 months (assuming those not
attending follow-up appointments were all current smokers). Again, those with
AL were more likely to have quit than those with normal lung function.128
Get PHIT (Pro-active Health Intervention for Tobacco-users) RCT, McLure, 2010
All subjects enrolled in the Get PHIT (Pro-active Health Intervention for Tobacco-users)
RCT were advised to quit, given self-help materials, and access to free phone-
counselling program. The control group also received personalised feedback regarding
diet, physical activity and BMI. The intervention group received personally tailored
feedback on self-reported symptoms, and smoking-related medical conditions that
included carbon monoxide levels and results of their spirometry test using the Fletcher
and Peto graph. If FEV1were <80% predicted, lung age was used to communicate
results. Quit rates for people with impaired lung function were significantly greater
than those with normal lung function at 6 months (p=0.05) but not at 12 months
(p=0.26). Smoking status was not biochemically confirmed.124

40
Step2Quit trial, Parkes, 2008
The most positive result to date in any project where lung age was used to
communicate spirometry results is from the Step2Quit trial.129 This RCT, conducted in a
primary care setting in the UK, tested lung age as the intervention rather than
spirometry. All recruited subjects underwent spirometry and were told that their lung
function would be measured 12 months later to determine whether there had been
any deterioration. Randomisation to either control or intervention group was blinded,
and determined by computer generated random numbers. Intervention and control
groups were both advised of their results by personalised letter, approximately four
weeks after testing, were advised to quit, and offered referral to smoking cessation
counselling. The intervention group received their spirometry results as lung age which
was illustrated using a modified Fletcher and Peto graph (see Figure 5, page 23). If
their lung age was lower than chronological age they were told their results were
normal. Those in the control group had spirometry results communicated as the raw
value of FEV1 with no further explanation. At follow-up 12 months later, smoking
status in self-reported quitters was confirmed by exhaled carbon monoxide as well as
by salivary cotinine. All analyses were performed on the intention to treat basis, where
those for whom contact was lost were classified as continuing to smoke. Of the 561
subjects who participated, the verified quit rate was 6.4% in the control group, and
13.6% in the intervention group (p=0.005). Both groups also showed reduced average
consumption (self-reported).129, 130 Higher smoking cessation rates were seen in
patients with both increased and normal Lung Age.

41
In a pulmonary function laboratory
Lung age has been investigated most recently in another pilot study, in a pulmonary
function laboratory situation.119 The control group received a printed information
sheet on community-based smoking cessation resources after their pulmonary
function test. The intervention group received motivational interviewing lasting
approximately 15 minutes if their FEV1 was <80% predicted, with LA used to illustrate
the dangers of smoking. They also received a follow-up letter from the investigating
physician. At one month the difference between quit attempts in the intervention
group (n=32) was not statistically significant to the number of quit attempts in the
control group (n=24, p=0.59). When stratified by high versus normal lung age there
were twice as many reported quit attempts in those with high lung age in the
intervention group (n=39) as those with high lung age in the control group (n=17,
p=.089). Lung age was not communicated to the control group.
Qualitative study, Parker, 2008.
The lung age concept has also been investigated qualitatively in a focus group setting
of primary care patients who had been diagnosed with or at risk of COPD.131 This group
found the concept to be easily understood, and felt that they would be motivated to
quit smoking if their doctor told them their lung age was greater than their actual age.
Lung age research in ethnicities other than Caucasians
Japanese researchers have also investigated lung age in a series of papers specific to
those of Japanese ethnicity. Specific lung age equations for Japan were developed by
re-solving the Japanese Respiratory Society’s FEV1 predictive equation for age.132 Lung
age was then estimated using both a conventional spirometer and a FEV1/FEV6 meter
42
in 768 subjects in hospital settings132, and evaluated in the context of post-operative
complications in lung cancer patients133, and in obese males.134 Their results show that
lung age in Japanese subjects is greater in current smokers than in both ex- and non-
smokers, and this is also the case in healthy current smokers.132, 134 Researchers from
Tokyo have recently suggested a method to interpret lung age results which takes the
wide range of normal values into account.135 This group have also determined that
FEV1 is the most appropriate parameter for estimating lung age.135
Conclusion
Different phenotypes for COPD are recognised which can be classified as those with a
fast or slow rate of decline of lung function. This is similar to terminology coined by
Fletcher and Peto in 1977, where those with fast rates of decline were described as
“susceptible to cigarette smoke” and those with slow rates of decline were “not
susceptible”.94 Hutchinson hypothesised that reduced VC was a predictor of mortality8
and low FEV1 has also been associated with mortality.136-138 It is likely that predicted
mortality is related to fast decliners and it is therefore possible that lung age could be
a surrogate measure to identify fast decliners.
However, on reviewing the lung age literature a major concern is that the Morris and
Temple lung age equations from 1985109 are based on data collected in the mid to late
1960s.111 Despite recommendations from the leading associations of respiratory
medicine and respiratory science (ATS/ERS) that predictive equations should be
updated approximately every ten years, lung age equations for Caucasians have not
been updated. They rely on predictive equations that are over 40 years old, yet they

43
are expected to be applicable in today’s populations. This led to the hypothesis that
the use of lung age equations based on data gathered over 40 years ago may have a
negative impact on the results of research using lung age. Improving the estimation of
Lung Age to provide more accurate feedback to smokers is more likely to have a
positive effect on their motivation to quit.
Research Question
Can new lung age equations be constructed using recently collected data?139 Will these
be more valid than the Morris and Temple equations in current day samples?
44
Chapter 3: Exploring the need to update lung age equations
Primary Care Respiratory Journal (2010); 19(3): 242-247
Background
In 2007, a pilot study was conducted to determine preliminary Australian predictive
equations for the Impulse Oscillometry System (IOS) parameters – respiratory
impedance Z5, respiratory resistance R5 to R35 and respiratory reactance X5 to X35
(Masterscreen IOS®, Carefusion, Yorba Linda, California).139 Lung function was also
measured by spirometry using the same instrument. Subsequently, spirometric
predictive equations were also developed. These allowed comparison with existing
Australian spirometry predictive equations that were published in 1995140 to
determine if the sample could be considered normal. This pilot study has provided the
only published IOS predictive equations for Australian Caucasian adults.
Comparisons using dummy subjects illustrated differences between the German
equations for the above IOS parameters, and the preliminary Australian equations. The
spirometry predictive equations from this pilot were found to be similar to the earlier
equations, which gave the Australian preliminary equations for IOS added validity.
The main limitation to this study was the small sample size (n=126). The fact that it
was age & sex stratified gave it strength in that the equations are equally applicable for
older adults as for younger adults. The sample was structured to have approximately
10 males and 10 females in each 10-year age bracket, from 25-74 years. This pilot
study paper was submitted for the award of MPH by the first author. It is still

45
generating international interest and is provided as background information in
Appendix 1.
Discussion relating to Paper One
Following publication of the IOS pilot study, a further search of the literature regarding
predictive equations for spirometry identified the Step2quit RCT129 which provided a
stimulus to investigate spirometry predictive equations further, especially in relation to
the concept of lung age. To investigate the behaviour of LA equations in a
contemporary sample, the 1985 Morris & Temple lung age equations109 were initially
applied to the Port Lincoln sample described above, and produced rather low lung age
estimates across the whole sample (data not shown). At the same time, the
background to the Morris & Temple lung age equations was explored by looking into
the spirometric equations that informed the concept111 including the sample used, and
the method used to determine starting point of the test. Morris et al had used the
method developed by Kory et al (published in 1961)141, which involved measuring the
Figure 6: The Kory method of determining time zero Adapted from Kory et al, 1961. Am J Med, 30:243-58

46
FEV1 from when the forced expiratory curve crossed the 200ml line of the spirograph
(Figure 6). This was not commonly used142, and appears to underestimate FEV1 by up
to 179mls143, 144 compared with the back extrapolation technique currently
recommended by ATS/ERS (Figure 7).41
To investigate the performance of the Morris LA equations further, LA equations using
the spirometry equation for FEV1 from the Port Lincoln pilot study were created. LA
estimates using both LA equations were determined for current smokers and healthy
never smokers in an independent dataset. The mean LAs were compared using
Student’s t-test as described in the paper that follows.
The most important message of this analysis is that in this sample, the Morris &
Temple equation indicated a seemingly protective effect of smoking, by giving a mean
lung age for current smokers that was almost 13 years below chronological age. This
goes against all knowledge of the damage to the lungs caused by smoking, and could
adversely affect any quit smoking message if used in smoking cessation counselling.
Figure 7: Back-extrapolation method of determining the new time zero Adapted from Miller et al. 2005. Eur Respir J, 26:319-338
A NOTE:
This figure/table/image has been removed to comply with copyright regulations. It is included in the print copy of the thesis held by the University of Adelaide Library.

47
This result strongly suggests that the Morris equations are not suitable for use in
contemporary populations.
This paper generated international debate, as included in the Appendices
Editorial by renowned spirometry experts appeared in the same edition of the
PCRJ145 – Appendix 2
Letters to the Editor, both about this article, as well as responding to the
editorial comment
o The letter to the editor regarding my paper, from Dr J Hansen (California
USA) and includes the authors’ response to this146 - Appendix 3
o Hansen also wrote a response to the editorial147 – Appendix 4
o Parkes and Greenhaulgh wrote a response to the editorial148 – Appendix
5
other evidence of international interest was found in citations:
o Respiratory Care Year in Review 2010: Part 1. Asthma, COPD, Pulmonary
Function Testing, Ventilator-Associated Pneumonia149
o La notion d'âge pulmonaire peut-elle aider à arrêter le tabac? [Does the
concept of lung age help smokers to quit smoking?] 2011150
o Novel regression equations predicting lung age from varied spirometric
parameters, 2012151

48
These Australian LA equations have been used to inform LA estimates in the Primary
Care Respiratory Toolkit, a resource for health care professionals on the Australian
Lung Foundation website.152 – Appendix 6
Results of this study were presented as an oral paper at the Australian and New
Zealand Society of Respiratory Science (ANZSRS) Annual Scientific Meeting, Darwin
2009.153

49

50
A Newbury, W., Newbury, J., Briggs, N. & Crockett, A. (2010) Exploring the need to update lung age equations. Primary Care Respiratory Journal, v. 19(3), pp. 242-247
NOTE:
This publication is included on pages 50-55 in the print copy of the thesis held in the University of Adelaide Library.
It is also available online to authorised users at:
http://dx.doi.org/10.4104/pcrj.2010.00029

56
Chapter 4: Newer equations better predict lung age in smokers: a
retrospective analysis using a cohort of randomly selected
participants.
Primary Care Respiratory Journal (2012); 21(1): 78-84
Introduction
This chapter describes the second phase to this body of work. Having considered the
limitations of the previous paper a larger dataset was sourced for the next
comparisons. The North West Adelaide Health Study (NWAHS) Stage 2 dataset
comprised 3206 randomly selected male and female community dwelling adults who
attended the study clinic; data were collected from 2004 to 2006.154 Those who had
results for pre-bronchodilator spirometry, with a smoking status of “never smoker” or
“current smoker” (CS), and who were aged between 25 and 75 years at the time of the
clinic visit were selected for inclusion. The never smokers with a self-reported doctor
diagnosis of asthma, chronic bronchitis or emphysema were then excluded, giving a
subgroup of never smokers in apparently good respiratory health (HNS, n=980)
Paper One had described what was possible evidence of the cohort and/or period
effects. (See Chapter 6, page 90 for a full discussion of the period and cohort effects).
The second phase of research aimed to test this further by developing four other LA
equations from predictive equations for FEV1 where data was gathered between those
of Morris and Temple111 (late 1960s) and the newer ‘Newbury’ equations139 (2007).
These selected equations span 40 years of data collection. The final set of six equations
comprised:

57
Two equations from USA
o Morris & Temple109: USA; based on data collected in late 1960s111
o Hankinson et al46: USA; data collected 1988-94 (3rd National Health
and Nutrition Examination Survey, (NHANES III))
Two equations from Europe/UK
o Quanjer et al59: equations still in common use in the UK and Europe
– summary equations compiled from different published studies
conducted between 1950s-80s (European Community for Steel and
Coal (ECSC))
o Falaschetti et al155: data collected 1995-96 (Health Survey for
England) provide later equations from UK
Two equations from Australia
o Gore et al140: data collected 1990 (Pilot Survey of the Fitness of
Australians, Australia) provided equations from a larger sample from
Australia
o Newbury et al156: based on pilot study data gathered in 2007.139
The results from the analyses presented in this paper support the likelihood that
cohort and period effects exist and that these contribute to the large differences in
predicted values using these equations. This is evident in the older equation from
Europe (ECSC, Quanjer59) producing similar values to those of Morris111 from the same

58
era, while the three equations whose data were collected during the late 1980s to
early 1990s (Falaschetti155, Gore140, Hankinson46) were also similar to each other.
Similarly, the equations produced by the Port Lincoln pilot study139 (the most recently
collected data) produce the highest values; this is consistent with the above premise,
however the limitations that apply to pilot studies must be remembered – especially
those related to small numbers, and volunteer samples.
This paper was published in the Primary Care Respiratory Journal157, and also had a
linked Editorial.158 This has been included in Appendix 7.

59

60
NOTE:
This publication is included on pages 60-66 in the print copy of the thesis held in the University of Adelaide Library.
It is also available online to authorised users at:
http://dx.doi.org/10.4104/pcrj.2011.00094
A Newbury, W., Lorimer, M. & Crockett, A. (2012) Newer equations better predict lung age in smokers: a retrospective analysis using a cohort of randomly selected participants. Primary Care Respiratory Journal, v. 21(1), pp. 78-84
67
Chapter 5: Investigating Delta Lung Age in independent datasets
Introduction
In 2010 an alternative LA equation was published in the European Respiratory Journal.
This equation calculates the difference (in years) between estimated LA and the
chronological age – Delta Lung Age (∆LA).159 This communicates the same message
that cigarette smoking damages the lungs but in a different format:
∆LA – the difference between your chronological age and your lung age based
on your current lung function is 20 years.
LA – even though you are only 40 years old, your lung function is the same as a
60 year old’s.
There are several aspects that make this LA equation different to the others. LA
equations have traditionally been based on observed FEV1109, 156, however the ∆LA
equation was based on FEV1/FVC ratio.159 It was derived from a predictive equation for
FEV1/FVC previously developed using the NHANES III dataset160 and was designed as a
single equation to be suitable for the three main ethnicities in the USA, namely
American Caucasians, African-Americans, and Mexican-Americans. This single equation
was also designed to be applicable to both males and females. Traditionally, predictive
equations for lung function tests including spirometry are both sex- and ethnicity-
specific.
The authors claimed that this equation was superior to both the Morris LA equation109
and the Newbury LA equation156 as it best predicted a LA that matched chronological

68
age in healthy never smokers (HNS).146, 147, 159 On close investigation, it became
apparent that these comparisons were not carried out using independent datasets, but
in the same dataset used to generate the ∆LA equation. A predictive equation will
always give a good result when used with the same data from which it was derived.
The ∆LA equation has not been validated using an independent dataset therefore it
was felt that a further comparison was warranted.
This chapter describes the next phase of the lung age research, the aim of which was
to compare Hansen’s ∆LA equation with several LA equations based on FEV1, using
independent datasets comprised of Caucasian subjects. For added strength and
uniqueness, three independent datasets were used.
The null hypothesis was that LA estimates using the ∆LA equations would be no
different in terms of intercept and slope to those using LA equations based on FEV1
alone.
Methods
Four LA equations were selected for this comparison: the original Morris LA
equation109, the Newbury LA equation156, the ∆LA equations159, and finally the LA
equation based on Hankinson’s predictive equation (for Caucasians) for FEV1 from
199946 which had been part of the earlier comparison of lung age equations (Chapter 4
of this thesis).157 As the Hankinson equation was also developed using NHANES III data
this allowed a comparison of two equations from the same dataset. Three of the
selected equations were based on FEV1 alone (Morris, Hankinson, Newbury) while the
∆LA equation was based on the FEV1/FVC ratio. Another difference was that the
69
Morris, Newbury and Hansen predictive equations were derived using linear regression
techniques, whilst the Hankinson equation was quadratic in form. As the Hansen
equation calculated ∆LA, this was converted to LA for easier comparison, by adding
∆LA to chronological age. These four LA equations were then applied to three
independent datasets.
Ex-smokers were excluded from all datasets, as were subjects outside the ages of 25-
74 years. Subjects younger than 25 years were excluded as it has been well
documented that lungs continue to mature until early adulthood.59, 161 HNS and
current smokers (CS) were defined in each dataset. HNS were defined as having no
existing diagnosis of respiratory disease such as asthma, chronic bronchitis or
emphysema. Ethnicities other than Caucasian were excluded where this was known.
Subjects without valid FVC results according to the ATS/ERS 2005 criteria41 were
excluded in all three datasets.
Datasets
Three Australian datasets were selected to provide a wide range of subjects, and to
increase generalisability. They included an urban dataset of community based adults,
the North West Adelaide Health Study Stage 2 dataset (NWAHS, n=3566), a rural
dataset of community based adults, the Whyalla Intergenerational Study of Health
(WISH, n=701) and a workplace dataset from Adelaide, South Australia (the
Metropolitan Fire Service (MFS), n=553).
The NWAHS Stage 2 dataset is from a longitudinal study of a randomly selected sample
of the population aged over 18 years, from the northern and western suburbs of

70
Adelaide, South Australia.154, 162 The sample numbered 1505 after exclusion criteria
were applied. Data had been collected using the EasyOne® Spirometer (nnd
Medizintechnik AG, Zurich, Switzerland).
WISH is a population sample recruited by random selection of residential households
within the regional city confines of Whyalla, an industrial city in South Australia.163
Data had also been collected using the EasyOne® Spirometer. As the Quality Control
Grade (QC Grade – an indication of the quality and reproducibility of the result) was
available in this dataset, subjects with a QC Grade of D (tests not reproducible) or F (no
acceptable test) were excluded. This sample numbered 257 after all exclusion criteria
were applied.
The MFS workplace dataset had 553 subjects (Males 539). In this dataset, females
were excluded due to relatively small numbers (n=14). After applying the exclusion
criteria, the sample numbered 340. Spirometry data had been collected using the
Masterscreen Impulse Oscillometry System® instrument (Carefusion, Hoechberg,
Germany).
Statistical analysis
A lung age estimate was calculated using each of the four lung age equations for each
subject, based on their height and observed FEV1 or FEV1/FVC ratio. In order to
account for these repeated measures for each subject a linear mixed effects model
was used, with an unstructured covariance structure to account for the variability in
lung age equations.164 This approach is similar to a regression analysis, and has Lung
Age as the dependent variable, and Sex-Smoking Status (a variable which combined

71
both the Sex and Smoking Status categorical variables, for ease of interpretation),
Equation Group (a newly created variable with an indicator for each of the four
equations defined by first author i.e. Hankinson, Hansen, Morris or Newbury), and
Chronological Age included as independent variables. The initial model included all
independent variables as main effects, all two-way interactions and the three-way
interaction; the final model equation was determined by backward elimination.
Separate analyses for each dataset were performed in SAS version 9.3® and statistical
significance was set at p<0.01 to make allowance for multiple comparisons.
Approval to use each of these datasets was granted by the respective research groups
who owned the data. As this project used de-identified data, the University of
Adelaide’s Human Research Ethics Committee ruled that no further ethics approval
was required.
Results
The datasets that were used for these comparisons were initially explored for
descriptive purposes (see Table 2). In the two community-based datasets (NWAHS and
WISH), the mean age of CS was 3-6 years lower than that of HNS for males and
females. The males of the MFS dataset were taller than their counterparts in the
community based datasets, and had a higher mean FEV1 and FVC although the mean
FEV1/FVC ratio was lower. This probably reflects the very high level of physical fitness
required for members of the MFS workforce. Similar situations have been described in
the earlier 1991 ATS guidelines on Lung Function Testing.37
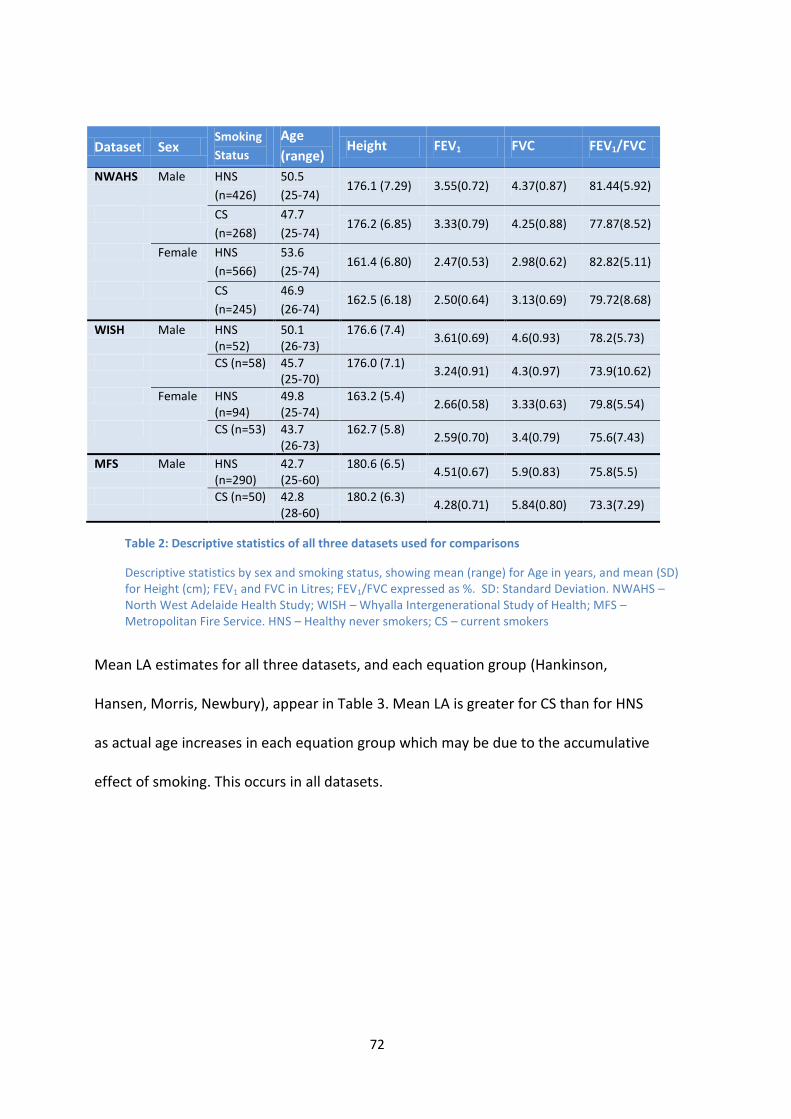
72
Mean LA estimates for all three datasets, and each equation group (Hankinson,
Hansen, Morris, Newbury), appear in Table 3. Mean LA is greater for CS than for HNS
as actual age increases in each equation group which may be due to the accumulative
effect of smoking. This occurs in all datasets.
Dataset Sex Smoking
Status
Age
(range) Height FEV1 FVC FEV1/FVC
NWAHS Male HNS
(n=426)
50.5
(25-74) 176.1 (7.29) 3.55(0.72) 4.37(0.87) 81.44(5.92)
CS
(n=268)
47.7
(25-74) 176.2 (6.85) 3.33(0.79) 4.25(0.88) 77.87(8.52)
Female HNS
(n=566)
53.6
(25-74) 161.4 (6.80) 2.47(0.53) 2.98(0.62) 82.82(5.11)
CS
(n=245)
46.9
(26-74) 162.5 (6.18) 2.50(0.64) 3.13(0.69) 79.72(8.68)
WISH Male HNS (n=52)
50.1 (26-73)
176.6 (7.4) 3.61(0.69) 4.6(0.93) 78.2(5.73)
CS (n=58) 45.7 (25-70)
176.0 (7.1) 3.24(0.91) 4.3(0.97) 73.9(10.62)
Female HNS (n=94)
49.8 (25-74)
163.2 (5.4) 2.66(0.58) 3.33(0.63) 79.8(5.54)
CS (n=53) 43.7 (26-73)
162.7 (5.8) 2.59(0.70) 3.4(0.79) 75.6(7.43)
MFS Male HNS (n=290)
42.7 (25-60)
180.6 (6.5) 4.51(0.67) 5.9(0.83) 75.8(5.5)
CS (n=50) 42.8 (28-60)
180.2 (6.3) 4.28(0.71) 5.84(0.80) 73.3(7.29)
Table 2: Descriptive statistics of all three datasets used for comparisons
Descriptive statistics by sex and smoking status, showing mean (range) for Age in years, and mean (SD) for Height (cm); FEV1 and FVC in Litres; FEV1/FVC expressed as %. SD: Standard Deviation. NWAHS – North West Adelaide Health Study; WISH – Whyalla Intergenerational Study of Health; MFS – Metropolitan Fire Service. HNS – Healthy never smokers; CS – current smokers

73
Dataset Sex Smoking
Status
Equation Group
Hankinson Hansen Morris Newbury
NWAHS Male HNS 57.7 (-24.2 to 105.9)
41.1 (-22.6 to 135.2)
48.6 (-11.5 to 109.8)
68.6 (8.6 to 133.1)
CS 64.2 (10.9 to 121.1)
51.9 (3.2 to 197.2)
55.8 (8.7 to 134.9)
76.4 (27.2 to 160.8)
Female HNS 60.4 (-1.91 to 96.8)
45.3 (-9.35 to 127.3)
49.9 (-7.8 to 98.7)
60.7 (16.2 to 99.6)
CS 59.6 (-0.5-113.6)
52.2 (1.3-226.0)
50.2 (7.3-128.6)
61.2 (27.0 to123.1)
WISH
Male HNS 56.6 (0.0 to 91.6)
49.5 (14.0 to 91.4)
47.4 (3.5 to 87.3)
67.5 (21.7 to 111.0)
CS 65.6 (-1.2 to 122.6)
62.8 (6.3 to 207.9)
58.1 (6.8 to 133.7)
78.9 (22.2 to 162.4)
Female HNS 53.9 (-0.4 to 89.1)
51.52 (10.6 to 97.8)
44.9 (2.5 to 86.0)
57.0(22.1 to 90.7)
CS 57.6 (24.2 to 102.3)
62.3(13.7 to 144.2)
47.2 (2.1 to 107.8)
58.8(24.1 to 107.1)
MFS Male HNS
34.5 (-32.3 to 81.9)
47.8 (6.4 to 109.2)
23.8 (-20.0 to 74.7)
43.5 (-0.9 to 97.1)
CS 41.6 (-14.9 to 93.5)
55.9 (21.8 to 128.7)
30.5 (-5.9 to 93.5)
50.5 (11.8 to 114.7)
Table 3: Mean lung age (range) for each equation group
Equation groups are defined by name of first author. Lung Age in years; HNS - Healthy Never Smokers; CS - Current Smokers; NWAHS – North West Adelaide Health Study; WISH – Whyalla Intergenerational Study of Health; MFS – Metropolitan Fire Service.
A LA value that is lower than chronological age reflects a higher than mean predicted
value for FEV1 (or FEV1/FVC ratio). Negative LA estimates (e.g. Table 3: NWAHS Males
HNS: Hankinson -24.2 years, Hansen -22.6 years, Morris -11.5 years) are biologically
impossible, but reflect how the equation deals with the high end of the range of FEV1
(or FEV1/FVC ratio) measurements. Negative LA values tend to occur in HNS, using the
equations that are based on earlier data (Morris, Hankinson, Hansen), and this is likely
to be due at least in part, to cohort and/or period effects. However, the main purpose
of LA is for use in CS where this is less likely to occur.
As seen in Table 3, the ∆LA (Hansen) equation gives widely varied and extremely high
LA estimates in all datasets, more so in CS than in HNS, although this is not necessarily

74
reflected in the mean values. This was explored by developing the boxplots of the LA
Residuals (the difference between the predicted and the observed values) for each of
the equation groups in each of the NWAHS subgroups (Figure 8). In the HNS in this
dataset, the Hansen equation group has the greatest range in females, while in males
the range with the Hansen equation was similar to the spread with the Morris
equations although the Hansen equation had a more positive tendency than did the
Morris equations. In CS, the range seen in the Hansen equation group in both females
and males is far greater than the other equation groups.
Figure 8: Boxplots of residuals: NWAHS Equation Groups – 1: Hankinson; 2: Hansen; 3: Morris; 4: Newbury The top and bottom of the boxes indicate the interquartile range (IQR). The line inside the box indicates the median value, while the marker inside the box indicates the mean value. The whiskers that extend from each box indicate the range of values that are outside the interquartile range - ≤1.5*IQR. The circles beyond the ends of the whiskers are considered to be outliers.

75
In the WISH dataset, the Hansen equation gives the widest spread for HNS in females
but not in males (Figure 9). In CS, the range is again greatest for the Hansen equation.
Figure 9: Boxplots of residuals – WISH. Equation Groups – 1: Hankinson; 2: Hansen; 3: Morris; 4: Newbury See note to Figure 8 for explanation of symbols.
The results of the linear mixed effects model indicated that the three-way interaction
between Equation Group, Sex-Smoking Status (or just Smoking Status in MFS) and Age
was statistically significant in each dataset (NWAHS: p <0.0001; WISH: p <0.0001; MFS:

76
p <0.0001). Therefore separate regression equations, with separate slopes and
intercepts, were defined from the data for each combination of Equation Group
(Hankinson, Hansen, Morris, Newbury) and Sex-Smoking Status (Male HNS, Male CS,
Female HNS, Female CS). The main effect of Equation Group, and the main effect of
Sex-Smoking Status, and the interactions of these define the intercept of the predictive
models; the terms that include age define the slope. All regression equations for each
dataset are provided in Table 4. It should be noted these are not predictive equations
used for estimating the LA in individuals, but rather they describe the regression lines
fitted from the scatter of data for each LA equation in each smoking subgroup (male
CS, male HNS, female CS, and female HNS) from each dataset. The regression
equations in Table 4 take the following form:
LA = Constant (reflecting the intercept) + coefficient*Age (defining
the slope of the regression line).

77
Table 4: Regression equations for Lung Age for each dataset Separate equations are provided for each equation group and sex-smoking status. LA = Lung Age; A = Age in years. NWAHS – North West Adelaide Health Study; WISH – Whyalla Intergenerational Study of Health; MFS – Metropolitan Fire Service.
To determine which equation fits chronological age best in HNS, both slope and
intercept are taken into account. In HNS a slope coefficient of 1 reflects the ideal
situation, with an increase of one year in LA for each year of chronological age. The
Morris and the Newbury equations consistently had slope coefficients closest to 1 in
the male HNS subgroups of each of these three datasets. In the NWAHS females, the
slope of the Morris and the Hankinson equations were both closest to 1. The ∆LA
equation had a slope coefficient that was less than the other equations in most HNS
subgroups. This gives a flatter slope than would be expected, and is particularly
marked in WISH males. The ∆LA equation had the slope coefficient closest to 1 only for
female HNS in the WISH dataset.
Dataset Sex Equation Group Current Smokers Healthy Never Smokers
NWAHS Male Hankinson LA = 13.08 + 1.07*A LA = 15.75 + 0.83*A
Hansen LA = -12.50 + 1.35*A LA = 2.04 + 0.78*A
Morris LA = -3.74 + 1.25*A LA = 3.59 + 0.90*A
Newbury LA = 14.39 + 1.30*A LA = 23.30 + 0.91*A
Female Hankinson LA = -4.57 + 1.34*A LA = 5.89 + 0.99*A
Hansen LA = -10.13 + 1.33*A LA = 5.47 + 0.74*A
Morris LA = -16.35 + 1.42*A LA = -3.07 + 0.99*A
Newbury LA = 9.46 + 1.10*A LA = 20.02 + 0.76*A
WISH Male Hankinson LA = 7.91 + 1.26*A LA = 13.31 + 0.86*A
Hansen LA = -7.15 + 1.53*A LA = 29.29 + 0.40*A
Morris LA = -9.55 + 1.48*A LA = 0.06 + 0.94*A
Newbury LA = 8.22 + 1.54*A LA = 20.78 + 0.93*A
Female Hankinson LA = -2.37 + 1.33*A LA = -5.18 + 1.18*A
Hansen LA = 10.43 + 1.18*A LA = 0.76 + 1.02*A
Morris LA = -17.15 + 1.47*A LA = -11.19+ 1.12*A
Newbury LA = 8.24 + 1.15*A LA = 13.21 + 0.88*A
MFS Male Hankinson LA = -27.69 + 1.55*A LA = -21.42 + 1.24*A Hansen LA = -9.02 + 1.51*A LA = 12.02 + 0.84*A Morris LA = -29.97 + 1.41*A LA = -19.54 + 1.01*A Newbury LA = -14.60 + 1.52*A LA = -0.73 + 1.03*A
78
There were no discernible patterns detected in intercept differences between the
Hansen results and the other equations.
Results of the linear mixed effects model using the NWAHS dataset are presented
graphically in Figure 10 (males) and Figure 11 (females). Differences that are probably
attributable to the cohort and/or period effects can be seen in the higher intercepts of
the newer equations that are based on FEV1 alone (Hankinson is greater than Morris,
Newbury is greater than Hankinson and Morris.) The Hansen equation appears to
under-predict LA compared to chronological age in HNS across the 25-74 year age
range in both males and females in this dataset.
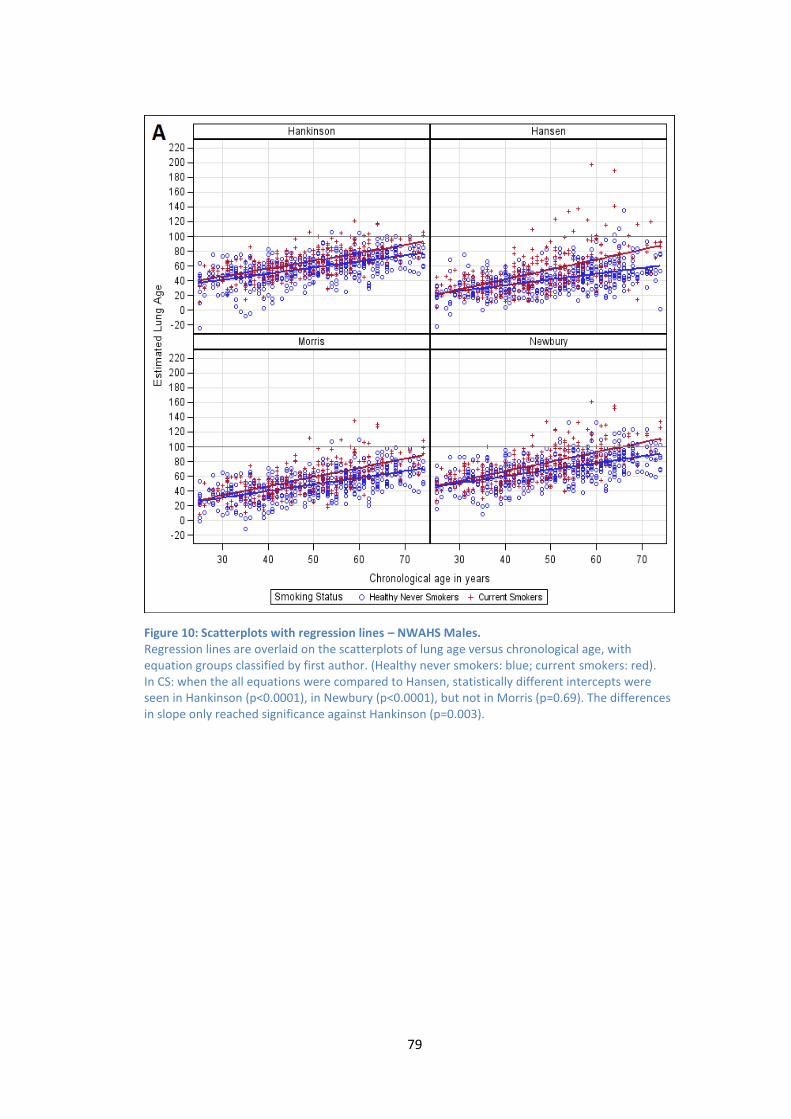
79
Figure 10: Scatterplots with regression lines – NWAHS Males. Regression lines are overlaid on the scatterplots of lung age versus chronological age, with equation groups classified by first author. (Healthy never smokers: blue; current smokers: red). In CS: when the all equations were compared to Hansen, statistically different intercepts were seen in Hankinson (p<0.0001), in Newbury (p<0.0001), but not in Morris (p=0.69). The differences in slope only reached significance against Hankinson (p=0.003).

80
Figure 11: Scatterplots with regression lines – NWAHS females. Regression lines are overlaid on the scatterplots of lung age versus chronological age, with equation groups classified by first author. (Healthy never smokers: blue; current smokers: red). In CS: significant differences in intercept were only seen when the Hansen equation was compared with Newbury (p<0.0001); differences in slope did not reach statistical significance against any of the 3 equations (Hankinson p=0.88; Morris p=0.37; Newbury p=0.018).

81
Results of the analysis using the WISH dataset of rural community-dwelling adults are
shown graphically in Figures 12 and 13.
Figure 12: Scatterplots with overlaid regression lines – WISH Males Regression lines are overlaid on the scatterplots of lung age versus chronological age, with equation groups classified by first author. (Healthy never smokers: blue; current smokers: red). In CS: when Hansen equation was compared with the other equations, neither intercept nor slope were found to be significantly different. Hankinson differences: p=0.87 (intercept), p=0.61 (slope). Morris differences: p=0.05 (intercept), p=0.18 (slope); Newbury differences: p=0.66 (intercept), p=0.09 (slope).

82
Figure 13: Scatterplots with overlaid regression lines – WISH females Regression lines are overlaid on the scatterplots of lung age versus chronological age, with equation groups classified by first author. (Healthy never smokers: blue; current smokers: red). In CS: when Hansen equation was compared with the other equations, intercept differences were statistically significant against Morris (p<0.0001) but not Hankinson (p=0.018) or Newbury (p=0.26). Differences in slope were significant against Morris (p=0.0009) but not Hankinson (p=0.03) or Newbury (p=0.26).

83
The MFS dataset results are seen in Figure 14. The Hansen equation again produces a
greater range than the Newbury or the Morris equation in CS, although this is not as
marked as in the community based samples. This could be due to a healthy worker
effect.
Figure 14: Scatterplots with overlaid regression lines – MFS (Males only) Regression lines are overlaid on the scatterplots of lung age versus chronological age, with equation groups classified by first author. (Healthy never smokers: blue; current smokers: red). In CS: when Hansen equation was compared with the other equations, neither intercept nor slope were significantly different in any equation. Hankinson p=0.13 (intercept), p=0.90 (slope); Morris p=0.04 (intercept), p=0.66 (slope); Newbury p=0.59 (intercept), p=0.99 (slope).

84
Discussion
Four different lung age equations have been evaluated using independent Australian
datasets. These results show that ∆LA does not give LA estimates that are consistently
statistically significantly different to those based on FEV1 in both HNS and CS in these
datasets. It can therefore be deduced that the null hypothesis has not been disproven.
Taken together with the bizarre LA estimates that ∆LA gives for some individuals, there
is no advantage to be gained in using ∆LA in current smokers.
The ∆LA equation was developed as a single equation for males and females of
multiple ethnicities – Caucasian, African-American, and Mexican-American as
represented in the NHANES III dataset. As people of Hispanic ethnicity are shorter than
their Caucasian counterparts165 and are over-represented in this sample compared
with the general population, this may produce a bias in this equation. With very low
numbers of African-Americans and Mexicans in the Australian population, the external
validity of the ∆LA equation in our setting is doubtful. Given that differences in lung
volumes between ethnicities are likely to be related to height, this may contribute to
the differences seen in this comparison, as the other LA equations (Morris, Hankinson,
Newbury) were defined separately for males and females, of Caucasian ethnicity.
Others however have found that the FEV1/FVC ratio is virtually independent of
ethnicity.58
The authors of the ∆LA equations state that the ratio of FEV1/FVC has “much less
variability than absolute measures of other spirometric volumes or flows”147 and
suggest that this is why LA using their equation best matches chronological age in HNS
in their comparisons146, 147, 159, however it is possible that the use of a ratio of two

85
measures masks the variability of both measures.166 (p36) A more likely explanation is
that the close match achieved by Hansen et al resulted from flawed methodology
when the same dataset was used to both generate the equations and to validate their
utility. The Hankinson LA equations (also derived from the same NHANES III dataset,
but developed specifically for males or females of Caucasian ethnicity) behave in a
similar fashion to the other equations based on FEV1 (Morris, Newbury). Therefore, the
differences seen with the ∆LA equation are probably due to either the use of the
FEV1/FVC ratio, or to the sample from which it was derived.
Interpretation based on the CS subgroups in each dataset is important as this is the
target group in the general population. The most striking difference between all
equation groups is seen in both datasets of randomly selected subjects, where the
Hansen ∆LA equation has the largest range in LA estimates. The extreme values for LA
generated by the Hansen ∆LA equation seen in some individuals have affected the
slope of the regression line for the CS groups in each dataset, resulting in a larger
difference between CS and HNS than that seen in the other equation groups (see
Figures 10-14).
The subjects with highest LA estimates in the Hankinson, Morris and Newbury
equation groups are not always the same as those with the highest LA estimates in the
Hansen equation group. As the same subjects/results have been used to give the four
LA estimates in each dataset, and all things pertaining to the measurement at the time
of recording the result are also the same (e.g. spirometer, guidelines used, interaction
between subject and technician) it is likely these differences occur because of the

86
difference in the structure of the LA equations, i.e. the use of the FEV1/FVC ratio rather
than FEV1 alone.
Strengths and Limitations
A considerable strength of this research is the use of several independent datasets,
both urban and rural, two of which were composed of randomly selected community-
dwelling adults. This makes the results of this research more generalisable to the wider
Australian communities.
A further strength is the use of a linear mixed effects model which uses each
individual’s result in the analysis and therefore gives more robust results than analyses
which report the mean and standard deviation.
Two of the datasets used for these comparisons had collected their spirometry data
using the EasyOne® spirometer, while the third had used the spirometry function on
the laboratory-standard Masterscreen IOS®. The EasyOne® spirometer has been found
to be accurate and suitable for use in primary care settings167, however other
researchers suggest results obtained with office spirometers (including the EasyOne®)
may not be interchangeable with results from laboratory standard devices, in
particular regarding the reproducibility of FVC.168, 169 This may offer some explanation
as to the different results seen in the analyses using the MFS and the community-
based datasets. The study that informed the Newbury LA equations139 used the same
equipment as the MFS dataset (Masterscreen IOS®) and the field workers for these
two projects had both been trained by the same person (AC). This may also help to
explain the goodness of fit between the Newbury LA equations and the MFS data.

87
Regarding the original datasets which informed the LA equations that were compared
in this project, the Port Lincoln data was sourced in a rural town with no heavy
industry; and the sample was age and sex stratified. This resulted in predictive
equations that were equally relevant across the age range (25-74 years).139 In contrast
both the Morris sample111 and the NHANES III sample had considerably fewer older
adults than younger which may have added bias to their prediction equations. A
limitation to using the Hankinson LA equations was that these were unable to estimate
LA in some subjects in all three datasets, due to the quadratic form of the equation (as
previously mentioned in Chapter 4).The MFS dataset also has some limitations: it is a
workplace dataset with many subjects being much fitter than the average person and
analysis using this dataset was limited to males.
Interpretation of findings in relation to previously published work
Hansen et al derived the ∆LA equations159 using FEV1/FVC from the NHANES III dataset
but compared them with the Morris LA equations using the same dataset. Not
surprisingly they concluded that the ∆LA equations were a better fit than the Morris
equations. A further comparison with both the Morris109 and the Newbury156
equations drew the same conclusion146 but again this used the NHANES III dataset. The
project described in this chapter has compared the FEV1/FVC ∆LA equation with three
other LA equations based on FEV1 alone, using several independent datasets. This is
the first comparison involving the ∆LA equation to do so in datasets comprised of
Caucasian subjects.
A recent conference abstract reported results from a longitudinal follow-up study in
Japan of patients attending a preventive medical centre for an annual health check.170

88
This analysis showed that locally derived LA equations132 were a better match for
annual rate of change than the Morris or the Hansen LA equations in a never-smoked
Japanese population, however the two equations from USA had less variation around
the regression line in HNS than the Japanese equation. The results seem to differ from
those presented in this chapter, but comparisons are difficult due to different study
designs and samples, and limited information being available in this abstract.
Conclusion
The results from these comparisons provide the first indication of how the ∆LA
equations behave in independent datasets of Caucasian subjects, and highlight the
need to use independent datasets when comparing or validating predictive equations.
If the original dataset is used to validate equations derived from it then this will lead to
erroneous interpretation as, by definition, predictive equations will fit the sample from
which they were derived.
The results reported in this chapter indicate that there is no advantage to be gained in
using the ∆LA equation over LA equations based on FEV1 alone. However there is a
need to develop current predictive equations for lung function that are relevant to the
Australian population. LA equations based on up-to-date data can then be investigated
to determine their effect on smoking cessation in the smoking population.

89
Chapter 6: Discussion
Main results
This thesis has generated a number of original contributions to the body of knowledge
regarding the estimates of lung age, and has demonstrated that it is possible to
estimate LA by converting other spirometric predictive equations for FEV1 to the LA
format. This gives further options to use LA in smoking cessation research/counselling
that may be more relevant/appropriate to particular populations than the original
equation published in 1985.
Three linked studies, using independent datasets, have shown that the older predictive
equations give lower predicted values for FEV1 than do newer equations. These
differences remain evident in the corresponding LA estimates. This concurs with both
the cohort effect where lung function appears to have increased due to increased
growth across successive birth cohorts and with the period effect where the accuracy
of measurement of lung function has increased due to the advances in equipment and
methods at the time of measurement.
While the first study used a workplace dataset for comparisons, the second and third
studies both used independent datasets of randomly selected community dwelling
adults for further comparisons. The differences between LA estimates between the
Morris and the other LA equations based on FEV1 are consistent in all three studies.
The match between mean Newbury LA and mean chronological age that had been
seen in the male HNS of the workplace dataset was not replicated in the HNS in the
community-based datasets. The third study reported that there is no advantage in
using the ∆LA equation to estimate LA.

90
All three studies confirmed that LA estimates are higher in current smokers (CS) than in
never smokers without previously diagnosed lung disease (HNS) as chronological age
increases. This is evident across all equation groups in all independent datasets and
reflects the poorer lung function in the CS groups. However, there is still an overlap
seen between CS and HNS that is due to the wide spread of results around the mean.
Smoking is not the sole cause of poor lung function, however smoking is recognised as
being the major cause of reduced lung function in western societies and is known to
have a negative influence on the maximum level attained, the length of the plateau in
early adulthood, and the rate of age-related decline of lung function.49, 53 It is not only
personal smoking habits which affect these in the individual – pre-natal and early
childhood exposure to cigarette smoke can impact negatively on a child’s lung
development; workplace and social exposures will also contribute. Many of these
exposures are interwoven with other aspects of socioeconomic status including level
of education, type of employment, physical activity, poor diet and long term exposure
to air pollution.53 People of lower socioeconomic status are also more likely to be
smokers.171
Cohort and Period Effects
The differences seen across the six selected equation groups are linked to the
populations used to generate the predictive equations as well as factors relevant to
the year of data collection.172 The confusion in the literature over what is a cohort
effect and what is a period effect deserves to be clarified.

91
Cohort Effect
The cohort effect is a term used to describe intrinsic differences seen between
generations which are related to early life experiences and exposures from an earlier
period that are not present in later generations. Improved nutrition and lifestyles, with
better access to improved medical care including vaccinations and antibiotics, changes
in level of air pollution can all contribute.172-174 Cohort effects are seen in cross-
sectional data, and relate to the year of birth or age at enrolment.172, 173, 175
Height and weight have generally been increasing in adults in many parts of the world
since mid-19th Century. Together with the rate of physical development and maturing
in children, this phenomenon is also termed ‘secular trend’ or ‘secular change’ and is
recognised as being affected by an interaction between nutrition and illness.176
Increased height is linked to greater chest size which over generations results in larger
lung volumes. The cohort effect has been quantified to be approximately 5ml/year in a
24-year longitudinal study174, and over a period of 25 years this would be
approximately 125mls.173, 174
Period effect
The period effect relates to the year of survey and can also influence results, although
this is more likely to occur with longitudinal data.175 Contributing factors include
advances in instruments, the associated software used, changes in guidelines, etc.173,
175 These are extrinsic factors that influence the actual measurement at the time of
testing rather than the person’s actual lung volume as would appear to occur with the
cohort effect. Some papers refer to war, famine, epidemics and natural disasters172 as
well as differences in air pollution, types of cigarettes and percentage of population

92
smoking, vaccinations etc. as period effects174 however these possibly better fit the
description of cohort effect referred to above as they would affect a person’s actual
lung volume.
A learned effect where subsequent results are higher than at the initial test is also
considered to be a period effect.175 This is due to the prior learning of the technique
leading to better performance of the manoeuvre at the later visits. As this relates more
to the repeated measures in longitudinal studies than to cross-sectional studies, it is
not considered to be relevant to the current analyses.
There were approximately 20-25 years between collection of the data that informed
the Morris et al predictive equations111 and the data that informed the Hankinson et
al46, the Falaschetti et al155, and the Gore et al140 predictive equations, and a further
10-15 years to when the Port Lincoln data were collected.139 Period effects including
advances in equipment and changes in techniques across a shorter timeframe
(covering 1973-78 and 1985-90) have been estimated to show an increase of 250ml in
men, and 219ml in women173, 174 but in the period between Morris and the present
day, 40 years, the expected difference would be much greater.
Instruments over this period of time have evolved from water-sealed volume-
displacement spirometers requiring manual calculation of results, to fully
computerised flow sensing instruments. Computerisation and advances in sensor
technology has meant greater instrument accuracy, with the software used for analysis
becoming so complex that results are now based on many samples per second.
Increased computer power means results are now available instantly, and in many

93
cases includes feedback on the quality of the test. These factors combine to result in
measurements made today being more accurate than those made 40 years ago.
Appendix 8 shows how FEV1 has increased over 40 years, using the predictive
equations that have been compared in Study Two. Others however report no evidence
of a cohort effect (secular trend) in data covering 30 years.177
Cohort and period effects in relation to LA research
In the first study, the mean LA using the Newbury equation was very similar to the
mean chronological age of HNS in the MFS dataset. This fits with both the cohort and
the period effects as explained above, as the data collection for the MFS and the PL
samples occurred in the same year with the same instrument used for data collection.
The differences between the equation groups seen in the second study are also
consistent with the cohort and period effects. Because the predictive equations
selected for comparisons included an older set and a more recent one from each
region, this analysis was able to show similar differences in the different
countries/regions:
for UK/Europe, the Quanjer equation’s predicted FEV1 (collected 1960-80) was
lower than that predicted by Falaschetti (collected 1995-96);
the same is seen in the USA equations, the Morris equation’s predicted FEV1
(collected pre-1971) was lower than that predicted by Hankinson (collected
1988-94);

94
in Australia, the Gore equation’s predicted FEV1 (collected 1991-92) was lower
than that predicted by the Newbury equation (collected 2007).
When the equations from the same era are examined (e.g. Gore, Hankinson, and
Falaschetti), the predicted FEV1 for males is very similar until after the age of 50 where
the Hankinson and Falaschetti values decrease at a greater rate than the Gore values,
this is probably due to the quadratic form of these two equations. The predicted
values for females do not follow the same pattern as closely, with the Hankinson
values falling less steeply than the Falaschetti or the Gore values. Again, this can be
seen in the table in Appendix 8.
The cohort effect suggests that the results of these three studies might be explained at
least in part by the increasing heights across generations, as increased height leads to
higher lung volumes. The mean heights for each sample (Morris, Hankinson,
Falaschetti, Gore, Newbury) are, however, remarkably similar as can be seen in Table 1
in the Study Two publication on page 64. (As the range only was provided for the
summary equations of Quanjer et al, it is not possible to determine the mean height.)
This provides a strong argument for these differences being due to period effects such
as advances in technology, or changes in guidelines.
The three studies in this thesis use cross-sectional data, all of which had been collected
at the same time (2006-08). Comparisons also involved predictive equations developed
over a period of time that spans 40 years. It is extremely likely that both the cohort
and the period effects will have influenced results.

95
Inconsistencies between comparisons
While the Newbury LA estimates closely matched the chronological age of HNS of the
MFS dataset, this was not the case in the later comparisons using the community-
based datasets. There are some possible explanations for this.
Sample differences of original equations
One possibility is related to the differences in the samples used to generate the
original predictive equations, prior to the mathematical re-solving to produce the LA
equations. The Morris sample111 was discussed in Study One156, and was thought to
not be representative of a current day population. The Quanjer sample from the same
era, was not a sample as such as these were summary equations from different
published equations; information on the actual subjects is limited.178 The samples
whose data informs the predictive equations (Morris111, Quanjer178, Hankinson46,
Falaschetti155, Gore140, Newbury139) have been examined further particularly in relation
to the age distribution and the equipment used, and details appear in Appendix 9.
Form of equation
The LA equations that were linear in form were found to be more reliable in estimating
LA than were the equations that were quadratic in form. The Hankinson and the
Falaschetti LA equations were not always able to determine a LA estimate for each
case due to their complex quadratic form.
The greater range seen in LA estimates that was seen in these datasets using the ∆LA
equation when compared with LA equations based on FEV1 alone has been discussed

96
in detail in Chapter 5. This greater range makes this form of LA equation less reliable
than those based on FEV1 alone.
Lung Age in Smoking cessation
Counselling:
Current Australian guidelines for health professionals for supporting smoking cessation
recommend counselling combined with pharmacotherapy for nicotine dependent
smokers.179 Nicotine is the addictive component found in cigarette smoke. When
inhaled, absorption into the bloodstream occurs quickly and it is rapidly transported to
the brain where it acts on the reward pathways which are normally associated with the
feelings of pleasure.179, 180 Some medications can increase success of smoking
cessation attempts. All pharmacological interventions appear to have some risk and
side effects, including the possibility of severe psychiatric and cardiovascular adverse
events.181-184
Smoking cessation counselling can involve: brief motivational advice, referral to
intensive treatment programs such as the Quit program, individual or group
counselling and be face-to-face or by telephone. Counselling can be individually
tailored and include relevant feedback such as spirometry results185; LA can be used to
communicate these results. As LA is a drug-free intervention, it is free of drug product
side effects.
Paradigms of smoking cessation counselling
The Transtheoretical model of change describes an individual’s movement backwards
and forwards through 5-6 stages of preparedness to quit at any one time (pre-

97
contemplation, contemplation, preparation, action, maintenance or relapse,
termination).186-188 The action stage is when a quit attempt is made. This model has
influenced smoking cessation advice for approximately 30 years, with different
smoking cessation advice offered depending on the stage to which a smoker belongs at
the time, however there appears to be little evidence that stage-based interventions
are successful in altering smoking behaviour.189
An alternative model has been suggested190, 191 where tailored interventions increase
motivational tension and contain triggers that prompt quit attempts –the 3 T’s model
(tension, trigger, treatment).64,65,192 Triggers that inspire a quit attempt can increase
the likelihood of success. Such triggers can include pregnancy, or an adverse health
event related to smoking (e.g. heart attack). Communicating individualised biomarkers
of the risk of future harm may also increase motivational tension. These can include
lung function tests by spirometry with results expressed as lung age estimates.
Lung age, as an intervention used in conjunction with smoking cessation counselling,
can fit into both paradigms. It can provide the trigger for smokers to quit in the 3T’s
model, or it can be used to assist smokers to move through different stages of change,
ultimately to making a quit attempt. The desired outcome in both instances is for the
smoker to successfully quit smoking.
Subjective age versus chronological age
Discrepancies are known to exist between chronological age (measured in years, and
counted from a person’s date of birth) and subjective age (the age a person would like
to be, or be thought to be – again measured in years, but not linked to the birth date).

98
Research indicates that young people prefer to be thought of as being a little
older/more ‘grown-up’ than they actually are. This could possibly be part of the
explanation as to why young people take up smoking – to appear to be older than they
are. Older adults (middle-aged and older) however often have a subjective age that is
lower than their chronological age, more so in women than in men.193 A younger
subjective age was found to be related to a fear of ageing linked in particular to both
physical and sexual decline.193
The cellular damage caused by the accumulation of toxins in cigarette smoke that is
seen in the lungs of smokers can also be seen in premature ageing of the skin.95, 194
Biological ageing beyond chronological age occurs in a dose-related manner where
greater facial wrinkling is seen in those who have smoked for longer lengths of time,
and with greater numbers of cigarettes smoked.96, 97, 195
There are therefore similarities in the concepts of chronological age/subjective age and
the fear of ageing, and chronological age/biological age where smokers’ lungs could be
described as ‘prematurely aged’ as a result of damage caused by repeated exposure to
cigarette smoke. This supports the concept of communicating lung age to smokers,
and may be the psychological mechanism that could provide the trigger for smokers to
commence the quit smoking process.
In relation to other research
Japanese lung age
As well as the Japanese LA equation derived by re-solving of the FEV1 equation132
which is of similar form to the Morris LA equation, novel Japanese LA equations

99
produced by regression of multiple spirometric parameters have been developed
recently.151 Spirometric parameters of 8000 healthy never smokers (25-87 years), who
attended a general health screening examination in south west Japan in 2009-10, were
used to inform the new Spirometry Derived LA equations (SDL-age). Predictors in these
equations, determined by multiple linear regression, for males were Height, FEV1,
FEV1/FVC, and Forced Expiratory Flow at 50% of the forced exhalation (FEF50); and for
females were Height, FEV1, FEV1/FVC, Peak Expiratory Flow (PEF) and FEF50. The
equations were validated using a group of 6400 subjects who attended the same clinic
during 2008-09, and were then tested on a group of 446 never-smoking subjects,
screened between April 2008 and March 2009 whose FEV1/FVC ratio was below the
LLN. Results indicate that the SDL-age equations detected differences in worsening
stages of airflow limitation based on FEV1%predicted. This interesting line of research
deserves further investigation in other ethnicities.
Hansen ∆LA
Originally, it was thought that it was the ∆LA equation was more likely to suit the US
population better than the Australian population, however the FEV1/FVC ratio has
been shown to be virtually independent of ethnicity.58 The Hansen equation was also
developed to be suitable for both males and females, despite females having greater
FEV1/FVC than males. It may be this factor rather than the effect of ethnicity that has
contributed to the differences in the third study.
The graph used by Hansen to illustrate that the ∆LA equation matched HNS in the
NHANES III sample better than did the Morris or the Newbury equations146 actually
mirrors the period/cohort effects as discussed in this thesis: the oldest equation

100
(Morris) predicts lowest, the Newbury equation predicts highest, and the intermediate
equation (Hansen) predicts between the two (See Appendix 3 for this letter to the
editor).
Editorial comment to Papers One and Two
Editorials by respected authorities on spirometry for both the first and second
publications are provided in Appendix 271 and 7.158 Both editorials were critical of the
concept of LA, but at the same time brought legitimate issues into the debate about
LA. Both declare it does not take account of the scatter of results around the mean.
Indeed, this is inherently linked to the wide range of normal in all spirometry
parameters as predictive equations cannot take into account all the influences on lung
function such as body build, fitness levels etc.145 A Japanese research team has
recently suggested a method of taking the range of normal (based on 95% confidence
intervals) into account when estimating lung age.135 They suggest that when FEV1 falls
between the upper level of normal (ULN) and the LLN then LA is consistent with the
chronological age; if FEV1 is below the LLN then LA is considered to be older than the
age at the LLN for that value. This warrants further investigation in the Australian
population.
While both editorials also suggest that the tracking of lung function in individuals each
decade would enable detection of accelerated decline, this practice is probably beyond
the ability of most health systems/governments to provide due to logistics (availability
of resources such as well-staffed respiratory laboratories) and the financial cost of
providing such a service, and in reality is not likely to occur.

101
Other issues raised include it being plausible to associate smoking with harm done to
the lungs only when FEV1 and FEV1/FVC fall below the LLN in people with a history of
20 or more years of smoking.145 With the damage to the lungs from cigarette smoking
being cumulative it would be better to detect any increased rate of decline at an
earlier stage. This could possibly be done by case-finding in primary care rather than by
proper screening processes.196, 197 Both editorials maintain that predictive equations
need to fit the population by having a representative and reliable reference population
and Cooper goes further to say that a single LA equation for the global population is
not rational.145, 158 This echoes the message in the second paper of this thesis (Chapter
4).
Collated equations
Global Lung Initiative (GLI) – a new type of predictive equation
A very recent development in the international debate on predictive equations has
been the combining of existing data from around the world which has resulted in the
release of all-age predictive equations meant to be suitable globally.58, 198 This project
used complex statistical methods to determine normal values for several spirometry
variables for people of Caucasian ethnicity in the first instance, who are aged from 3-
95 years of age. The development of essentially one ‘equation’ to cover this age range
addresses the main problem when moving from adolescent to adult equations, when
there were often discrepancies at the intersecting ages.
There are some concerns though with this approach. It appears that the largest
datasets came from only a few countries – the USA (NHANES III, Multi-Ethnic Study of
102
Atherosclerosis), Switzerland or England (HSE). It also would appear that the collated
data are already 20-40 years old.177, 199 Given that the ATS/ERS guidelines suggest
reference values be updated every 10 years42, the use of these equations for adults
may be no better than using the NHANES III equations, for example, that are now over
20 years old. The age distribution in the collated sample is also of concern and is
strongly skewed to the right, as there are many more subjects aged 8-10 years old than
any other age and this may impact on the equations.
Of the data relating to Caucasian ethnicity, the Australian data appears to account for
approximately 1.2% of the total sample (n=982 out of 80140, before exclusion due to
missing data or outliers).58 Such a small sample would have minimal (if any) impact on
final results. A further concern is that by making these equations more generalisable
for global use they are likely to be less specific to the Australian population. The
current ATS/ERS guidelines still call on equations to be selected on the basis of being
applicable to the community being studied.37, 42 As Australia is geographically isolated,
and not as densely populated as USA or Europe (with associated lower levels of
airborne pollution) the best way to get relevant equations may be to generate them
locally.
The suitability of these international equations for healthy Caucasian subjects from
Australia and New Zealand, is currently being researched with initial results suggesting
a reasonable fit despite detecting statistically significant differences.199 The all-age
equations are still under investigation in Australia and New Zealand.200, 201
103
These issues clearly need further investigation. Quanjer et al suggest that there was no
evidence found of ‘secular trends’ in the data collected from Caucasian subjects over
the last 30 years.177 This however is contrary to the findings in the three studies
investigating lung age that have been reported in this thesis.
Limitations
Of the three independent datasets that were used for these comparisons
unfortunately none are ideal. It is likely that some of these differences between these
samples have contributed to the differences in the results seen between datasets.
The MFS is a workplace dataset where exposures to smoke and fumes are
possible in normal day to day workplace situations. Protective respirators are
available for use, but may not have been used regularly in the past. However,
the effects of these exposures might be counterbalanced by the fact that many
of the subjects are extremely fit and have been described as occupational
athletes.
The NWAHS is randomly selected sample of an urban area which covers the
north and west regions of Adelaide. This area contains approximately half of
Adelaide’s population, and one quarter of the state’s population162 and is likely
to be affected by industrial and vehicular pollution (due to the location of
industrial areas and major roads). This region of Adelaide has areas of
significant industry including but not limited to large cement works, paint
manufacturing, ship building and ship maintenance.

104
Even though WISH is a rural dataset (Whyalla has a remoteness classification of
3: outer regional Australia202), Whyalla is the third largest city in South Australia
(SA). This industrial city has revolved around mining, processing and export of
iron ore, steel manufacturing (since 1930), and ship building (late 1930’s to
1978). There has been concern in recent years over the respiratory health of
Whyalla’s residents due in part to concerns over dust pollution from the
movement of iron ore through the city203, and Whyalla has been found to have
statistically significant higher rates of COPD and lung cancer than in Port Lincoln
and other comparison towns.204
A further limitation is that the Newbury LA equations, while developed using the most
recently collected data, have come from pilot study data. Despite the sample being
evenly age- and sex-stratified, and results being similar to the previously developed
Gore equations140, it still remains that this was a pilot study sample of limited
numbers.
The population-based samples which were used for these comparisons, NWAHS and
WISH, had higher prevalence of obese subjects in the HNS and CS subgroups than
occurred in the general Australian population at the time, the MFS sample and the
Port Lincoln sample whose results informed the newest LA equation.156 This may have
influenced the results in the studies using these datasets.

105
Recommendations
There are several recommendations and ideas for further research that come from this
body of work.
1. LA equations should be developed specifically for different regions/ethnicities
using a population-relevant FEV1 predictive equation derived from recently
collected data. Using old LA equations based on old data for contemporary
populations will effectively dilute the message of the extent that smoking
harms lung function.
2. As LA equations of quadratic form have been shown to be unable to estimate
LA for some subjects, further investigation into quadratic LA equations is
needed.
3. Further investigation needs to occur of taking into account the upper and lower
limits of normal as described by Yamaguchi et al.135 Even if LA is not greater
than chronological age it is important to convey the danger of continued
smoking and not to convey a possible ‘protective effect’ of smoking.
4. Newly-determined predictive equations for spirometry that are relevant across
Australia are needed. Ideally, such a project should be multi-centred, involve a
random urban and rural sample of healthy never smokers and cover the range
of different ethnicities that now make up the Australian population. There is a
real need to derive up to date predictive equations for indigenous Australians.
While this ideal project would not be inexpensive to do, the benefits would be
significant.

106
5. Establish whether lung age using Australian LA equations is useful in quit
smoking counselling, by firstly running a pilot study to determine effect and to
assist with sample size calculation, followed by a RCT.
o Hypothesis: spirometry results communicated as lung age associated with
smoking cessation counselling will lead to improved quit rates compared
with the control.
o Setting: multi-centred, primary care.
o Control group: spirometry with smoking cessation brochure
o Intervention group: 10 minute counselling session, spirometry
communicated as LA, smoking cessation brochure
o Follow-up after 12 months; smoking status verified by exhaled carbon
monoxide, salivary cotinine.
6. Disadvantaged groups: Smoking prevalence is higher in people of lower socio-
economic status.205 Certain subgroups of the population such as Indigenous
people, those with poor mental health, and also prisoners are also more likely
to be current smokers.205 As in the general population, smoking cessation
would benefit these people with improvements in health outcomes as well as
financial benefits.206 For those with mental illness, smoking cessation may lead
to lower doses of medication being needed.206 As lung age is an easily-
understood method of explaining spirometry results, it may prove successful as
an intervention in these groups and future research projects could investigate
this.

107
Chapter 7: Summary
This body of research has shown that the differences seen between predictive
equations for spirometric parameters are consistent with the period and cohort
effects. These are most evident between the oldest and the most recent equations
regardless of country of origin but are also seen between older and more recent
equations generated in the same country/region (UK/Europe; USA; Australia) 15-30
years apart.
Results of the comparison of LA equations and the ∆LA equation based on the
FEV1/FVC ratio showed that there was no advantage to using the ∆LA equation.
Lung age generated by the Morris equation is available in several types of spirometer
used in primary care, however this can estimate values for lung age that are 20 years
lower than that of the newer LA equations. This may lessen the impact of the message
in smoking cessation counselling, and may have contributed to the overall inconclusive
results seen in studies using LA as an intervention.
Sixteen percent of the adult Australian population are daily smokers.207 Although this
continues to decrease due to strong public health messages over many years there is
still scope for further options in smoking cessation counselling that may help those
who have been reluctant to quit or have ignored population-wide messages. LA is one
such option that is easily implemented in primary care, and may prompt an attempt to
quit smoking, but up-to-date equations based on FEV1 should be used. A RCT with LA
as the intervention is proposed.

108
Chapter 8: Appendices

109
Appendix 1: A pilot study to evaluate Australian predictive equations
for the Impulse Oscillometry System
Newbury, W, Crockett, A, Newbury, J. 2008. Respirology, vol 13, page 1070-75.
Background paper only (previously submitted for Master of Public Health).

110
A Newbury, W., Crockett, A. & Newbury, J. (2008) A pilot study to evaluate Australian predictive equations for the impulse oscillometry system. Respirology, v. 13(7), pp. 1070-1075
NOTE:
This publication is included on pages 110-115 in the print copy of the thesis held in the University of Adelaide Library.
It is also available online to authorised users at:
http://dx.doi.org/10.1111/j.1440-1843.2008.01375.x

116
Appendix 2: Should we use ‘lung age?’
Editorial: Primary Care Respiratory Journal, Volume 19(3): 197-99

117
NOTE:
This publication is included on pages 117-119 in the print copy of the thesis held in the University of Adelaide Library.
It is also available online to authorised users at:
http://dx.doi.org/10.4104/pcrj.2010.00045
A Quanjer, P.H. & Enright, P.L. (2010) Should we use lung age?. Primary Care Respiratory Journal, v. 19(3), pp. 197-199

120
Appendix 3: Measuring the lung age of smokers.
Primary Care Respiratory Journal. 2010, 19(3): 286-87
Letter to the editor, with Authors’ Reply

121
A Hansen, J. (2010) Measuring the lung age of smokers. Primary Care Respiratory Journal, v. 19(3), pp. 286-287
NOTE:
This publication is included on pages 121-122 in the print copy of the thesis held in the University of Adelaide Library.
It is also available online to authorised users at:
http://dx.doi.org/10.4104/pcrj.2010.00048

123
Appendix 4: Lung age is a useful concept and calculation
Letter to the Editor, Primary Care Respiratory Journal, 2010, 19(4): 400-401

124
NOTE:
This publication is included on pages 124-125 in the print copy of the thesis held in the University of Adelaide Library.
It is also available online to authorised users at:
http://dx.doi.org/10.4104/pcrj.2010.00074
A Hansen, J. (2010) Lung age is a useful concept and calculation. Primary Care Respiratory Journal, v. 19(4), pp. 400-401

126
Appendix 5: Paradoxes of spirometry results, and smoking cessation
Letter to the Editor, Primary Care Respiratory Journal, 2010, 19(3):295-96
A part of the debate regarding Lung Age, following publication of the article: “Exploring
the need to update lung age equations”.

127
A Parkes, G. & Greenhalgh, T. (2010) Paradoxes of spirometry results, and smoking cessation. Primary Care Respiratory Journal, v. 19(3), pp. 295-296
NOTE:
This publication is included on pages 127-128 in the print copy of the thesis held in the University of Adelaide Library.
It is also available online to authorised users at:
http://dx.doi.org/10.4104/pcrj.2010.00056

129
Appendix 6: Lung Age Estimator, Primary Care Respiratory Toolkit
URL: http://lungfoundation.com.au/professional-resources/1692-2/general-
practice/primary-care-respiratory-toolkit/
Date accessed: 18th April 2013
The Primary Care Respiratory Toolkit is found on the Australian Lung Foundation
website and includes a Lung Age Estimator that is based on the Newbury LA
equations.152 A qualitative evaluation of the resource performed by the Discipline of
General Practice at the University of Adelaide reports that:
“The generated chart was strongly praised as a useful tool to enhance
the patient consultation, encouraging better patient understanding,
demonstrating changes over time and potentially motivating improved
patient behaviour.” 208

130
NOTE: This appendix is included on pages 130-132 of the print copy of the thesis held in the University of Adelaide Library.

133
Appendix 7: Dawning of a new lung age?
Editorial, Primary Care Respiratory Journal; 2012, 21(1):15-16.

134
A Cooper, B. (2012) Dawning of a new lung age?. Primary Care respiratory Journal, v. 21(1), pp. 15-16
NOTE:
This publication is included on pages 134-135 in the print copy of the thesis held in the University of Adelaide Library.
It is also available online to authorised users at:
http://dx.doi.org/10.4104/pcrj.2012.00021

136
Appendix 8: Changes in Predicted FEV1 across 40 years according to
different predictive equations
Tables of Predicted FEV1 showing increases for both males and females across a 40
year time frame, using the predictive equations used for comparisons in Paper Two.
Predicted FEV1 for females (Height 168cm), across age range 25-75
age Morris Quanjer Falaschetti Hankinson Gore Newbury
25 3.27 3.41 3.49 3.47 3.57 3.87
30 3.15 3.29 3.42 3.39 3.44 3.71
35 3.02 3.16 3.33 3.31 3.30 3.55
40 2.90 3.04 3.22 3.22 3.17 3.40
45 2.77 2.91 3.08 3.12 3.04 3.24
50 2.65 2.79 2.93 3.01 2.91 3.08
55 2.52 2.66 2.77 2.89 2.77 2.93
60 2.40 2.54 2.59 2.76 2.64 2.77
65 2.27 2.41 2.41 2.62 2.51 2.62
70 2.15 2.29 2.22 2.47 2.38 2.46
75 2.02 2.16 2.04 2.32 2.25 2.30
Table 5: Differences in predicted FEV1 (females) in equations spanning 40 years
Predicted FEV1 for males (Height 178cm), across age range 25-75
age Morris Quanjer Falaschetti Hankinson Gore Newbury
25 4.33 4.44 4.60 4.59 4.67 4.93
30 4.17 4.29 4.50 4.47 4.52 4.79
35 4.01 4.15 4.38 4.35 4.38 4.64
40 3.85 4.00 4.24 4.22 4.24 4.49
45 3.69 3.86 4.09 4.09 4.10 4.34
50 3.53 3.71 3.93 3.94 3.95 4.19
55 3.37 3.57 3.73 3.78 3.81 4.04
60 3.21 3.42 3.53 3.62 3.67 3.90
65 3.05 3.28 3.33 3.45 3.53 3.75
70 2.89 3.13 3.12 3.27 3.39 3.60
75 2.73 2.99 2.91 3.08 3.24 3.45
Table 6: Differences in predicted FEV1 (males) in equations spanning 40 years

137
Appendix 9: Age distributions of samples.
The age distributions of the samples used to generate the predictive equations used in
these comparisons have also been explored.
Morris et al, 1971: Spirometric Standards for Healthy Nonsmoking Adults.111
The method of recruitment for this study was not described, and almost 80% of the
sample were members of two church groups. The setting was a rural area, of low
altitude, to the south of Portland, Oregon, USA. The sample would not be considered
to be representative of a ‘normal’ population by today’s standards as discussed in
Paper One156, although participants had been screened by questionnaire prior to
testing for smoking history, respiratory symptoms or diagnoses, and workplace
pollution. The age distribution of the sample used by Morris, Koski and Johnson for
their 1971 predictive equations111 was heavily skewed to the right with a majority of
younger subjects. The equipment used was a water-sealed Stead-Wells spirometer.
0
25
50
75
100
Nu
mb
er
Age
Males
Females
Figure 15: Age distribution of the Morris sample The Morris sample is strongly skewed to the right, more so in males than in females.

138
Quanjer et al, (ECSC) 1993: Lung volumes and forced ventilatory flows. Report
Working Party Standardization of Lung Function Tests. European Community for Steel
and Coal.59
The age distributions of the samples that contributed to the summary equations were
not provided although the age range for the summary equations is given as 18-70
years of age.
NHANES III
The third National Health and Nutrition Examination Survey (NHANES III) was
conducted between 1988 and 1994.209 The sample came from households across 81
counties across the USA, and was structured to comprise greater proportions of
children (aged 2 months to 5 years) and older adults (aged over 60 years). Also,
African-American and Mexican-American subjects each comprised 30% of the sample
despite comprising only 12 and 5% of the population respectively.209 The equipment
used was a modified Ohio Medical dry rolling seal spirometer. All participants were
remunerated.
Hankinson et al, 1999: Spirometric Reference Values from a Sample of the
General U.S. Population.46
Of the 20627 subjects who performed spirometry, only 7429 asymptomatic lifelong
non-smoking subjects were used to develop the reference values published in 1999. Of
the Caucasians aged over 21 years, 476 were males, and 926 were females. The age
distributions in this NHANES III sample of adult Caucasian males are also skewed to the

139
right, (less so in adult females). These are shown in Figure 16. All males, particularly
older males, are under-represented.
Figure 16: Age distribution of the Hankinson sample (Caucasians), from NHANES III
Hansen et al, 2010: Calculating Gambling Odds and Lung Ages for Smokers.159
Hansen’s ∆LA equation is based on his earlier work using the NHANES III dataset that
had defined a single equation for %FEV1/FVC using never-smoking males and females
of Caucasian, African-American and Mexican-American ethnicity (n=5907).160 The age-
distribution of the NHANES III sample defined by Hansen159 is also strongly skewed to
the right in all but female Caucasian Americans. In this sample, males (particularly
older males) are again under-represented; as are older females.
0
50
100
150
200
250
300
21–35 36–50 51–65 66–80
Nu
mb
er
Age
Males (n=476)
Females (n=927)
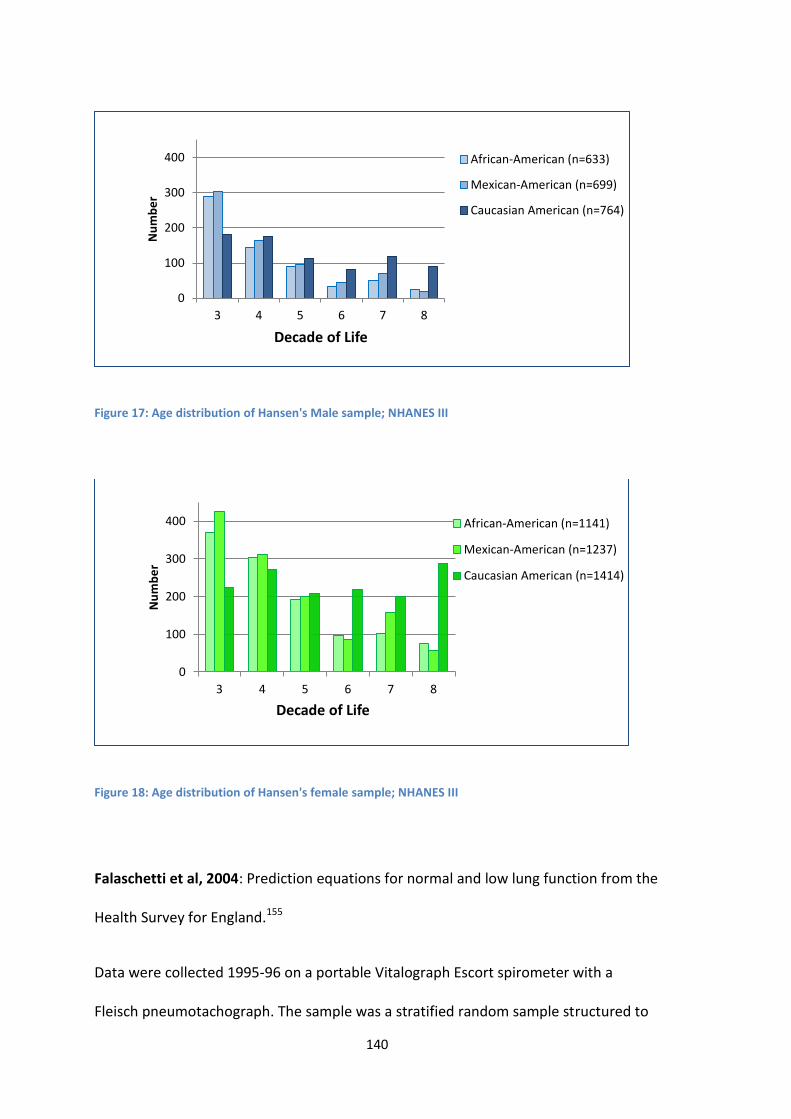
140
Figure 17: Age distribution of Hansen's Male sample; NHANES III
Figure 18: Age distribution of Hansen's female sample; NHANES III
Falaschetti et al, 2004: Prediction equations for normal and low lung function from the
Health Survey for England.155
Data were collected 1995-96 on a portable Vitalograph Escort spirometer with a
Fleisch pneumotachograph. The sample was a stratified random sample structured to
0
100
200
300
400
3 4 5 6 7 8
Nu
mb
er
Decade of Life
African-American (n=633)
Mexican-American (n=699)
Caucasian American (n=764)
0
100
200
300
400
3 4 5 6 7 8
Nu
mb
er
Decade of Life
African-American (n=1141)
Mexican-American (n=1237)
Caucasian American (n=1414)

141
be sociodemographically representative of the English population. The age distribution
of this healthy non-smoking sample was also skewed to the right. The equation for
adult males includes those aged ≥25, and is strongly skewed to the right. The equation
for adult females includes all ≥16 years.
Gore et al: 1995. Spirometric standards for healthy adult lifetime nonsmokers in
Australia.140
This was a sub-study of the 1990 Pilot Survey of the Fitness of Australians, whose 2,298
subjects had been randomly selected from the adult population of metropolitan
Adelaide, South Australia. A subgroup of 1,302 subjects underwent spirometry testing
with a Cybermedic pneumotachograph spirometer. Selection of only the asymptomatic
lifetime nonsmokers gave a sample size of 414.
0
100
200
300
400
500
600
700
800
900
16–24 25–34 35–44 45–54 55–64 65–74 75–84 85+
Nu
mb
er
Age range
males (n=2479)
females (n=3556)
Figure 19: Age distribution of the Falaschetti sample

142
Newbury et al, 2008: A pilot study to evaluate Australian predictive equations for the
impulse oscillometry system.139
This pilot study sample was designed to be evenly age- and sex stratified. Participants
were volunteers, from in and around Port Lincoln on the lower Eyre Peninsula, South
Australia. Smoking status was determined, and if participants had smoked >10
cigarettes per day for more than 5 years, they were excluded. This study used a
Masterscreen IOS, with a Lily-type heated pneumotachograph.
0
10
20
30
40
50
60
70
18–24 25–34 35–44 45–54 55–64 ≥65
Nu
mb
er
Age
Males (n=165)
Females (n=249)
Figure 20: Age distribution of the Gore et al sample Males and females are normally distributed; males were proportionally under-represented.
0
10
20
25-34 35-44 45-54 55-64 65-74
Nu
mb
er
Age
Males
Females
Figure 21: Age distribution of the Newbury sample Approximately equal numbers of males and females, with similar numbers in each decade.

143
Chapter 9: Bibliography
1. Gibson G. Spirometry: then and now. Breathe. 2005;1(3):207.
2. Spriggs E. The history of spirometry. Br J Dis Chest. 1978;72:165-80.
3. Kentish E. An account of a pulmometer, by which may be known the power and
capacity of the lungs to receive the atmospheric air. An Account of Baths, and of a
Madeira-House, at Bristol. London: Longman, Hurst, Rees, Orme, & Browne; 1814. p.
81-117.
4. Meiklejohn A, Thackrah C. The life, work and times of Charles Turner Thackrah,
surgeon and apothecary of Leeds (1795-1833) with The effects of arts, trades, and
professions, and of civic states and habits of living, on health and logevity: with
suggestions for the removal of many of the agents which produce disease, and shorten
the duration of life. 1957 ed. London: E & S Livingstone Ltd; 1857. Available from:
5. Hutchinson J. Society of Arts. Pneumatic apparatus for valuing the respiratory powers.
Lancet. 1844;43(1085):390-1. DOI: 10.1016/s0140-6736(02)71692-9.
6. Hutchinson J. Lecture on vital statistics, embracing an account of a new instrument for
detecting the presence of disease in the system. Lancet. 1844;43(1091):567-70. DOI:
10.1016/s0140-6736(02)73338-2.
7. Hutchinson J. Lecture on vital statistics, embracing an account of a new instrument for
detecting the presence of disease in the system. Concluded from p570. Lancet.
1844;43(1092):594-7. DOI: 10.1016/s0140-6736(02)34335-6.
8. Hutchinson J. On the capacity of the lungs, and on the respiratory functions, with a
view of establishing a precise and easy method of detecting disease by the spirometer.
Medico-Chirurgical Transactions. 1846;29:137-252.
9. Petty T. John Hutchinson's mysterious machine revisited. Chest. 2002;121:219S-23S.
DOI: 10.1378/chest.121.5_suppl.219S.
10. Braun L. Spirometry, measurement, and race in the nineteenth century. J Hist Med
Allied Sci. 2005;60(2):135-69. DOI: 10.1093/jhmas/jri021.
11. Warren P. The history of diagnostic technology for diseases of the lungs. CMAJ.
1999;161:1161-3.
12. Warren P, Warren F. Window on the breast: 19th century English developments in
pulmonary diagnosis. Lancet. 1997;349:798-801. DOI: 10.1016/S0140-6736(96)10510-
9.
144
13. Kellogg RH. Laws of Physics Pertaining to Gas Exchange. Comprehensive Physiology:
John Wiley & Sons, Inc.; 2011. p. 13-31.
14. Bishop P. A bibliography of John Hutchinson. Med Hist. 1977;21:384-96.
15. Speizer F. John Hutchinson, 1811-1861. The first respiratory disease epidemiologist.
Epidemiology. 2011;22:e1-e9. DOI: 10.1097/EDE.0b013e318209dedc.
16. Beigel H. On spirometry. Lancet. 1864;83(2111):180-81. DOI: 10.1016/S0140-
6736(02)59317-X.
17. Beigel H. On spirometry. Lancet. 1864;83(2109):119-20. DOI: 10.1016/S0140-
6736(02)59265-5.
18. Salter H. Lectures on dyspnoea. Lecture III (Concluded). Lancet. 1865 28 October
1865;86(2200):475-78. DOI: 10.1016/S0140-6736(02)58417-8.
19. Balfour T. Contribution to the study of spirometry. Medico-Chirurgical Transactions.
1860;43:263-69.
20. Bain W. On a portable spirometer. Br Med J. 1870;1(475):129. DOI:
10.1136/bmj.1.475.129.
21. Calverley P, Wedzicha J. Chronic obstructive pulmonary disease past, present and
future. Thorax. 2007;62:1026-27. DOI: 10.1136/thx.2007.092635.
22. Yernault J. The birth and development of the forced expiratory manoeuvre: a tribute
to Robert Tiffeneau (1910-1961). Eur Respir J. 1997;10:2704-10. DOI:
10.1183/09031936.97.10122704.
23. Gaensler E. Analysis of the ventilatory defect by timed capacity measurements. Am
Rev Tuberc. 1951;64:256-78.
24. Ayers W, Abraham S, Ward S, Weihrer A, Rosner S, Caceres C. Description of a
computer program for analysis of the forced expiratory spirogram. II Validation.
Comput Biomed Res. 1968;2:220-28.
25. Banks D, Wang M, McCabe L, Billie M, Hankinson J. Improvement in lung function
measurements using a flow spirometer that emphasizes computer assessment of test
quality. J Occup Environ Med. 1996;38(3):279-83.
26. Hoffer E, Kanarek D, Kazemi H, Barnett G. Computer interpretation of ventilatory
studies. Comput Biomed Res. 1973;6:347-54.
27. Krumpe P, Weigt G, Martinez N, Marcum R, Cummiskey J. Computerized rapid analysis
of pulmonary function test: use of a least mean squares correlation for interpretation
of data. Comput Biol Med. 1982;12(4):295-307.

145
28. Morris J. Spirometry in the evaluation of pulmonary function. West J Med.
1976;125:110-18.
29. Enright P, Skloot G, Cox-Ganser J, Udasin I, Herbert R. Quality of spirometry performed
by 13,599 participants in the World Trade Center worker and volunteer medical
screening program. Respir Care. 2010;55(3):303-09.
30. Global Initiative for Chronic Obstructive Lung Disease (GOLD). Global Strategy for the
Diagnosis, Management, and Prevention of Chronic Obstructive Pulmonary Disease
(Revised 2011): Global Initiative for Chronic Obstructive Lung Disease, Inc; 2011.
31. Van Schayck CP, D'Urzo A, Invernizzi G, Roman M, Stallberg B, Urbina C. Early detection
of chronic obstructive pulmonary disease (COPD): the role of spirometry as a
diagnostic tool in primary care. Prim Care Respir J. 2003;12:90-3.
32. Standardization of definitions and symbols in respiratory physiology. Fed Proc.
1950;9(3):602-5.
33. Gandevia B, Hugh-Jones P. Terminology for measurements of ventilatory capacity. A
report to the Thoracic Society. Thorax. 1957;12:290-93.
34. American College of Chest Physicians. Clinical Spirometry - Recommendations of the
Section on Pulmonary Function Testing Committee on Pulmonary Physiology. Chest.
1963;43:214-19. DOI: 10.1378/chest.43.2.214.
35. American Thoracic Society. ATS Statement - Snowbird workshop on standardization of
spirometry. Am Rev Respir Dis. 1979;119(5):831-8.
36. American Thoracic Society. Standardization of spirometry - 1987 update. Am Rev
Respir Dis. 1987;136(5):1285-98.
37. American Thoracic Society. Lung Function Testing: Selection of reference values and
interpretative strategies. Am Rev Respir Dis. 1991;144:1202-18.
38. American Thoracic Society. Standardization of spirometry - 1994 update. Am J Respir
Crit Care Med. 1995;152(3):1107-36.
39. Guidelines for the measurement of respiratory function. Recommendations of the
British Thoracic Society and the Association of Respiratory Technicians and
Physiologists. Respir Med. 1994;88:165-94.
40. Miller M, Crapo R, Hankinson J, Brusasco V, Burgos F, Casaburi R, et al. General
considerations for lung function testing. Eur Resp J. 2005;26:153-61. DOI:
10.1183/09031936.05.00034505.

146
41. Miller M, Hankinson J, Brusasco V, Burgos F, Casaburi R, Coates A, et al.
Standardisation of spirometry. Eur Resp J. 2005;26(2):319-38. DOI:
10.1183/09031936.05.00034805.
42. Pellegrino R, Viegi G, Brusasco V, Crapo R, Burgos F, Casaburi R, et al. Interpretive
strategies for lung function tests. Eur Resp J. 2005;26:948-68. DOI:
10.1183/09031936.05.00035205.
43. Levy M, Quanjer P, Booker R, Cooper B, Holmes S, Small I. Diagnostic spirometry in
primary care. Proposed standards for general practice compliant with American
Thoracic Society and European Respiratory Society recommendations. Prim Care
Respir J. 2009;18(3):130-47. DOI: 10.4104/pcrj.2009.00054.
44. Crapo R. The role of reference values in interpreting lung function tests. Eur Respir J.
2004;24:341-42. DOI: 10.1183/09031936.04.00063804.
45. Arnett J. Vital capacity of the lungs: changes occurring in health and disease. J Clin
Invest. 1935;14(5):543-49. DOI: 10.1172/JCI100704.
46. Hankinson J, Odencrantz J, Fedan K. Spirometric reference values from a sample of the
general U.S. population. Am J Respir Crit Care Med. 1999;159(1):179-87.
47. Ip M. Lung function testing in health and disease: Issues pertaining to Asia-Pacific
populations. Respirology. 2011;16:190-97. DOI: 10.1111/j.1440-1843.2010.01850.x.
48. Becklake M. Concepts of normality applied to the measurement of lung function. Am J
Med. 1986;80:1158-64.
49. Kerstjens H, Rijcken B, Schouten J, Postma D. Decline of FEV1 by age and smoking
status: facts, figures, and fallacies. Thorax. 1997;52:820-27. DOI: 10.1136/thx.52.9.820.
50. Postma D, Brusselle G, Bush A, Holloway J. I have taken my umbrella, so of course it
does not rain. Thorax. 2012;67:88-9. DOI: 10.1136/thoraxjnl-2011-200758.
51. Weiss S. Lung function and airway disease. Nat Genet. 2010;42(1):14-6. DOI:
10.1038/ng0110-14.
52. Van Sickle D, Magzamen S, Mullahy J. Understanding socioeconomoic and racial
differences in adult lung function. Am J Respir Crit Care Med. 2011;184:521-27. DOI:
10.1164/rccm.201012-2095OC.
53. Soto-Martinez M, Sly P. What goes around, comes around: childhood influences on
later lung health?: Relationship between environmental exposures in children and
adult lung disease: The case for outdoor exposures. Chron Respir Dis. 2010;7:173-86.
DOI: 10.1177/1479972309345929.

147
54. McFadden E, Luben R, Wareham N, Bingham S, Khaw K. How far can we explain the
social class differential in respiratory function? A cross-sectional population study of
21,991 men and women from EPIC-Norfolk. Eur J Epidemiol. 2009;24:193-201. DOI:
10.1007/s10654-009-9326-y.
55. Miller A, Thornton J. The interpretation of spirometric measurements in epidemiologic
surveys. Environ Res. 1980;23(2):444-68. DOI: 10.1016/0013-9351(80)90078-X
56. Marks G. Are reference equations for spirometry an appropriate criterion for
diagnosing disease and predicting prognosis? Thorax. 2012;67:85-7. DOI:
10.1136/thoraxjnl-2011-200584.
57. Quanjer P, Brazzale D, Boros P, Pretto J. Implications of adopting the Global Lungs
2012 all-age reference equations for spirometry. Eur Respir J. 2013;ePub ahead of
print. DOI: 10.1183/09031936.00195512.
58. Quanjer P, Stanojevic S, Cole T, Baur X, Hall G, Culver B, et al. Multi-ethnic reference
values for spirometry for the 3-95 year age range: the Global Lung Function 2012
equations. Eur Resp J. 2012;40 (6):1324-43. DOI: 10.1183/09031936.00080312.
59. Quanjer P, Tammeling G, Cotes J, Pedersen O, Peslin R, Yernault J-C. Lung volumes and
forced ventilatory flows. Report Working Party Standardization of Lung Function Tests,
European Community for Steel and Coal. Official Statement of the European
Respiratory Society. Eur Resp J. 1993;6:Suppl 16, 5-40.
60. Decramer M, Janssens W, Miravitlles M. Chronic obstructive pulmonary disease.
Lancet. 2012;379:13141-51. DOI: 10.1016/S0140-6736(11)60968-9.
61. Miller M. Chronic obstructive pulmonary disease and '150 years of blowing'. Hosp
Med. 1998;59:719-22.
62. Warren C. The nature and causes of chronic obstructive pulmonary disease: A
historical perspective. Can Respir J. 2009;16:13-20.
63. Barnes P. New concepts in Chronic Obstructive Pulmonary Disease. Annu Rev Med.
2003;54:113-29. DOI: 10.1146/annurev.med.54.101601.152209.
64. American Thoracic Society, European Respiratory Society. Standards for the diagnosis
and management of patients with COPD: American Thoracic Society and European
Respiratory Society; 2004.
65. McKenzie D, Abramson M, Crockett A, Dabscheck E, Glasgow N, Jenkins S, McDonald C,
et al. The COPDX Plan: Australian and New Zealand Guidelines for the management of
Chronic Obstructive Pulmonary Disease V2.30: The Australian Lung Foundation, and
The Thoracic Society of Australia & New Zealand; 2011.

148
66. Townsend M. Conflicting definitions of airways obstruction: drawing the line between
normal and abnormal. Chest. 2007;131:335-6. DOI: 10.1378/chest.06-2736.
67. Hoesein F, Zanen P, Lammers J-W. Lower limit of normal or FEV1/FVC <0.70 in
diagnosing COPD: an evidence-based review. Respir Med. 2011;105:907-15. DOI:
10.1016/j.rmed.2011.01.008.
68. Mannino D, Buist A, Vollmer W. Chronic obstructive pulmonary disease in the older
adult: what defines abnormal lung function? Thorax. 2007;62:237-41. DOI:
10.1136/thx.2006.068379.
69. King James I. A counter-blaste to tobacco. 1604 [7/10/2011]. Available from:
http://extra.shu.ac.uk/emls/iemls/resour/mirrors/rbear/james1.html
70. Doll R. Uncovering the effects of smoking: historical perspective. Stat Methods Med
Res. 1998;7:87-117. DOI: 10.1177/096228029800700202.
71. Witschi H. Profiles in toxicology. A short history of lung cancer. Toxicol Sci.
2001;64(1):4-6. DOI: 10.1093/toxsci/64.1.4.
72. White C. Research on smoking and lung cancer: a landmark in the history of chronic
disease epidemiology. Yale J Biol Med. 1990;63(1):29-46.
73. Doll R, Hill AB. A study of the aetiology of carcinoma of the lung. Br Med J.
1952;2(4797):1271-86. DOI: 10.1136/bmj.2.4797.1271.
74. Wynder E, Graham E. Tobacco smoking as a possible etiologic factor in bronchogenic
carcinoma. A study of six hundred and eighty-four proved cases. JAMA.
1985;253:2986-94.
75. Doll R, Hill AB. The mortality of doctors in relation to their smoking habits. Br Med J.
1954;1:1451. DOI: 10.1136/bmj.1.4877.1451.
76. Doll R, Peto R, Boreham J, Sutherland I. Mortality in relation to smoking: 50 years'
observations on male British doctors. Br Med J. 2004 June 2004;328:1519-28. DOI:
10.1136/bmj.38142.554479.AE.
77. Geiss O, Kotzias D. Tobacco, Cigarettes and Cigarette Smoke. An overview.
Luxembourg: Directorate-General Joint Research Centre, Institute for Health and
Consumer Protection, Centre JR; 2007. EUR 22783 EN.
78. Rabinoff M, Caskey N, Rissling A, Park C. Pharmacological and chemical effects of
cigarette additives. American Journal of Public Health. 2007;97:1981-91.
79. Tonnesen P, Carrozzi L, Fagerstrom K, Gratziou C, Jimenez-Ruiz C, Nardini S, et al.
Smoking cessation in patients with respiratory disease: a high priority, integral

149
component of therapy. Eur Resp J. [ERS taskforce]. 2007;29:390-417. DOI:
10.1183/09031936.00060806.
80. Musk A, de Klerk N. History of tobacco and health. Respirology. 2003;8:286-90.
81. Burns D. Cigarettes and cigarette smoking. Clin Chest Med. 1991;12:631-42.
82. Bernhard D, Moser C, Backovic A, Wick G. Cigarette smoke - an aging accelerator? Exp
Gerontol. 2007;42:160-65. DOI: 10.1016/j.exger.2006.09.016.
83. Gudis D, Cohen N. Cilia dysfunction. Otolaryngol Clin North Am. 2010;43:461-72. DOI:
10.1016/j.otc.2010.02.007.
84. Hogg J. Lung structure and function in COPD. Int J Tubercul Lung Dis. 2008;12:467-79.
85. Soltani A, Sohal S, Reid D, Wood Baker R, Walters E. Airway remodeling in chronic
obstructive pulmonary disease (COPD), a review. Annals of Respiratory Medicine.
2011.
86. Tamashiro E, Xiong G, Anselmo-Lima W, Kreindler J, Palmer J, Cohen N. Cigarette
smoke expousre impairs respiratory epithelial ciliogenesis. Am J Rhinol Allergy.
2009;23:117-22. DOI: 10.2500/ajra.2009.23.3280.
87. Fahy J, Dickey B. Airway mucus function and dysfunction. N Engl J Med.
2010;363:2233-47. DOI: 10.1056/NEJMra0910061.
88. Barnes P, Shapiro S, Pauwels R. Chronic obstructive pulmonary disease: molecular and
cellular mechanisms. Eur Respir J. 2003;22:672-88. DOI:
10.1183/09031936.03.00040703.
89. Hogg J. Pathophysiology of airflow limitation in chronic obstructive pulmonary disease.
Lancet. 2004;364:709-21. DOI: 10.1016/S0140-6736(04)16900-6.
90. U.S. Department of Health and Human Services. How Tobacco Smoke Causes Disease:
The Biology and Behavioral Basis for Smoking-Attributable Disease: A Report of the
Surgeon General. Atlanta, GA: U.S. Department of Health and Human Services, Centers
for Disease Control and Prevention, National Center for Chronic Disease Prevention
and Health Promotion, Office on Smoking and Health; 2010.
91. Barnes P. Mediators of Chronic Obstructive Pulmonary Disease. Pharmacol Rev.
2004;56:515-48. DOI: 10.1124/pr.56.4.2.
92. Churg A, Zhou S, Wright J. Matrix metalloproteinases in COPD. Eur Respir J.
2012;39:197-209. DOI: 10.1183/09031936.00121611.
93. MacNee W. Accelerated lung aging: a novel pathogenic mechanism of chronic
obstructive pulmonary disease (COPD). Biochem Soc Trans. 2009;37:819-23. DOI:
10.1042/BST0370819.

150
94. Fletcher C, Peto R. The natural history of chronic airflow obstruction. Br Med J.
1977;1:1645-48. DOI: 10.1136/bmj.1.6077.1645.
95. Adams J, White M. Biological ageing. Eur J Public Health. 2004;14:331-34. DOI:
10.1093/eurpub/14.3.331.
96. Dupati A, Helfrich Y. Effect of cigarette smoking on skin aging. Expert Rev Dermatol.
2009;4:371-78.
97. Morita A. Tobacco smoke causes premature skin aging. J Dermatol Sci. 2007;48:169-
75. DOI: 10.1016/j.jdermsci.2007.06.015.
98. Leung W-C, Harvey I. Is skin ageing in the elderly caused by sun exposure or smoking?
Br J Dermatol. 2002;147:1187-91. DOI: 0.1046/j.1365-2133.2002.04991.x.
99. U.S. Department of Health and Human Services. The Health Consequences of Smoking:
a Report of the Surgeon General. Atlanta, GA: U.S Department of Health and Human
SErvices, Centers for Disease Control and Prevention, National Center for Chronic
Disease Prevention and Health Promotion, Office on Smoking and Health; 2004.
100. Wald N, Hackshaw A. Cigarette smoking: an epidemiological overview. British Med
Bull. 1996;52:3-11.
101. Anthonisen N, Connett J, Murray R. Smoking and lung function of Lung Health Study
participants after 11 years. Am J Respir Crit Care Med. 2002;166:675-79. DOI:
10.1164/rccm.2112096.
102. Kohansal R, Martinez-Camblor P, Agusti A, Buist A, Mannino D, Soriano J. The natural
history of chronic airflow obstruction revisited. An analysis of the Framingham
Offspring Cohort. Am J Respir Crit Care Med. 2009;180:3-10. DOI:
10.1164/rccm.200901-0047OC
103. Peat J, Woolcock A, Cullen K. Decline of lung function and development of chronic
airflow limitation: a longitudinal study of non-smokers and smokers in Busselton,
Western Australia. Thorax. 1990;45:32-7. DOI: 10.1136/thx.45.1.32.
104. Scanlon P, Connett J, Waller L, Altose M, Bailey W, Buist A, et al. Smoking cessation
and lung function in mild-to-moderate chronic obstructive pulmonary disease. The
Lung Health Study. Am J Respir Crit Care Med. 2000;161(381-90). DOI:
10.1164/ajrccm.161.2.9901044.
105. U.S. Department of Health and Human Services. The health benefits of smoking
cessation: U.S. Department of Health and Human Services, Public Health Service,
Centers for Disease Control, Center for Chronic Disease Prevention and Health
Promotion, Office on Smoking and Health; 1990. DHHS Publication No. (CDC) 90-8416.

151
106. Siafakas N, Vermeire P, Pride N, Paoletti P, Gibson J, Howard P, et al. Optimal
assessment and management of chronic obstructive pulmonary disease (COPD). Eur
Respir J. 1995;8:1398-420. DOI: 10.1183/09031936.95.08081398.
107. Decramer M, Cooper C. Treatment of COPD: the sooner the better? Thorax.
2010;65:837-41. DOI: 10.1136/thx.2009.133355.
108. Morris J, Sturman W. Spirometry and Respiratory Questionnaire: value for screening
and smoking cessation (abstract). Am Rev Respir Dis. 1974;109:702.
109. Morris J, Temple W. Spirometric "lung age" estimation for motivating smoking
cessation. Prev Med. [Short report]. 1985;14(5):655-62.
110. Gibson J, Gallagher H, Johansen A, Webster I. Lung function in an Australian
population: 2. Spirometric performance and cigarette-smoking habits. Med J Aust.
1979 Apr 21;1(8):354-58.
111. Morris J, Koski A, Johnson L. Spirometric standards for healthy nonsmoking adults. Am
Rev Respir Dis. 1971;103(1):57-67.
112. Richmond R, Webster I. A smoking cessation programme for use in general practice.
Med J Aust. 1985;142:190-94.
113. Risser N, Belcher D. Adding spirometry, carbon monoxide, and pulmonary symptom
results to smoking cessation counseling: A randomized trial. J Gen Intern Med.
1990;5:16-22.
114. Humerfelt S, Eide G, Kvale G, Aaro L, Gulsvik A. Effectiveness of postal smoking
cessation advice: a randomized controlled trial in young men with reduced FEV1 and
asbestos exposure. Eur Respir J. 1998;11:284-90. DOI:
10.1183/09031936.98.11020284.
115. Crapo R, Morris A, Grardner R. Reference spirometric values using techniques and
equipment that meet ATS recommendations. Am Rev Respir Dis. 1981;123:659-64.
116. Sippel J, Osborne M, Bjornson W, Goldberg B, Buist A. Smoking cessation in primary
care clinics. J Gen Intern Med. 1999;14:670-76. DOI: 10.1046/j.1525-
1497.1999.11088.x.
117. Stratelis G, Molstad S, Jakobsson P, Zetterstrom O. The impact of repeated spirometry
and smoking cessation advice on smokers with mild COPD. Scand J Prim Health Care.
2006. DOI: 10.1080/02813430600819751.
118. Kotz D, Wesseling G, Huibers MJH, van Schayck OCP. Efficacy of confronting smokers
with airflow limitation for smoking cessation. Eur Resp J. 2009;33(4):754-62. DOI:
10.1183/09031936.00116308

152
119. Kaminsky D, Marcy T, Dorwaldt A, Pinckney R, DeSarno M, Solomon L, et al. Motivating
smokers in the hospital pulmonary function laboratory to quit smoking by use of the
lung age concept. Nicotine Tob Res. 2011;13 (11):1161-66. DOI: 10.1093/ntr/ntr096
120. Prokhorov A, Emmons K, Pallonen U, Tsoh J. Respiratory response to cigarette smoking
among adolescent smokers: a pilot study. Prev Med. 1996;25:633-40. DOI:
10.1006/pmed.1996.0099.
121. Lipkus I, Prokhorov A. The effects of providing lung age and respiratory symptoms
feedback on community college smokers' perceived smoking-related health risks,
worries and desire to quit. Addict Behav. 2007;32(3):516-32. DOI:
10.1016/j.addbeh.2006.05.018.
122. Segnan N, Ponti A, Battista R, Senore C, Rosso S, Shapiro S, et al. A randomized trial of
smoking cessation interventions in general practice in Italy. Cancer Causes Control.
1991;2(4):239-46.
123. Prokhorov A, Yost T, Mullin-Jones M, de Moor C, Fort K, Marani S, et al. "Look At Your
Health": Outcomes associated with a computer-assisted smoking cessation counseling
intervention for community college students. Addict Behav. 2008;33:757-71. DOI:
10.1016/j.addbeh.2007.12.005.
124. McClure J, Ludman E, Grothaus L, Pabiniak C, Richards J. Impact of spirometry
feedback and brief motivational counseling on long-term smoking outcomes: A
comparison of smokers with and without lung impairment. Patient Educ Couns.
2010;80:280-3. DOI: 10.1016/j.pec.2009.11.002.
125. Gold D, Wang X, Wypij D, Speizer F, Ware J, Dockery D. Effects of cigarette smoking on
lung function in adolescent boys and girls. N Engl J Med. 1996;335(13):931-7. DOI:
10.1056/NEJM199609263351304.
126. Van Miert E, Sardella A, Bernard A. Biomarkers of early respiratory effects in smoking
adolescents. Eur Respir J. 2011;38:1287-93. DOI: 10.1183/09031936.00000911.
127. Gorecka D, Bednarek M, Nowinski A, Puscinska E, Goljan-Geremek A, Zielinski J.
Diagnosis of airflow limitation combined with smoking cessation advice increases stop-
smoking rate. Chest. 2003;123:1916-23. DOI: 10.1378/chest.123.6.1916.
128. Bednarek M, Gorecka D, Wielgomas J, Czajkowska-Malinowska M, Regula J, Mieszko-
Filipczyk G, et al. Smokers with airway obstruction are more likely to quit smoking.
Thorax. 2006;61(10):869-73. DOI: 10.1136/thx.2006.059071

153
129. Parkes G, Greenhalgh T, Griffin M, Dent R. Effect on smoking quit rate of telling
patients their lung age: the Step2Quit randomised controlled trial. Br Med J.
2008;336(7644):598-600. DOI: 10.1136/bmj.39503.582396.25
130. Parkes G. Effect on smoking quit rate of telling patients their lung age. A randomised
controlled trial [Dissertation]. London: University College London; 2009.
131. Parker D, Goldman R, Eaton C. A qualitative study of individuals at risk for or who have
chronic obstructive pulmonary disease: What do they understand about their disease?
Lung. 2008;186(5):313-16. DOI: 10.1007/s00408-008-9091-9.
132. Toda R, Hoshino T, Kawayama T, Imaoka H, Sakazaki Y, Tsuda T, et al. Validation of
"Lung Age" measured by spirometry and handy electronic FEV1/FEV6 meter in
pulmonary diseases. Intern Med. 2009;48(7):513-21. DOI:
10.2169/internalmedicine.48.1781.
133. Haruki T, Nakamura H, Taniguchi Y, Miwa K, Adachi Y, Fujioka S. 'Lung age' predicts
post-operative complications and survival in lung cancer patients. Respirology.
2010;15:495-500. DOI: 10.1111/j.1440-1843.2010.01708.x.
134. Mitsumune T, Senoh E, Nishikawa H, Dachi M, Kajii E. The effect of obesity and
smoking status on lung age in Japanese men. Respirology. 2009;14(5):757-60. DOI:
10.1111/j.1440-1843.2009.01541.x.
135. Yamaguchi K, Onizawa S, Tsuji T, Aoshiba K, Nagai A. How to evaluate “Spirometric”
lung age – What method is approvable? Respir Physiol Neurobiol. 2011;178(2):349-51.
DOI: 10.1016/j.resp.2011.06.012.
136. Bang K, Gergen P, Kramer R, Cohen B. The effect of pulmonary impairment on all-
cause mortality in a national cohort. Chest. 1993;103:536-40.
137. Schunemann H, Dorn J, Grant B, Winkelstein W, Trevisan M. Pulmonary function is a
long-term predictor of mortality in the general population. 29-year follow-up of the
Buffalo Health Study. Chest. 2000;118:656-64.
138. Ryan G, Knuiman M, Divitini M, James A, Musk AW, Bartholomew H. Decline in lung
function and mortality: the Busselton Health Study. J Epidemiol Community Health.
1999;53:230-34. DOI: 10.1136/jech.53.4.230.
139. Newbury W, Crockett A, Newbury J. A pilot study to evaluate Australian predictive
equations for the Impulse Oscillometry System. Respirology. 2008;13(7):1070-75. DOI:
10.1111/j.1440-1843.2008.01375.x.

154
140. Gore C, Crockett A, Pederson D, Booth M, Bauman A, Owen N. Spirometric standards
for healthy adult lifetime nonsmokers in Australia. Eur Resp J. 1995 May 1,
1995;8(5):773-82. DOI: 10.1183/09031936.95.08050773.
141. Kory R, Callahan R, Boren H, Syner J. The Veterans Administration-Army cooperative
study of pulmonary function. 1. Clinical spirometry in normal men. Am J Med.
1961;30:243-58. DOI: 10.1016/0002-9343(61)90096-1.
142. Lebowitz M, Holberg C. Comparisons of spirometric reference values and the
proportions of abnormal subjects among males smokers and those symptomatic in a
community population. Am Rev Respir Dis. 1990;141(6):1491-96. DOI:
10.1164/ajrccm/141.6.1491.
143. Smith A, Gaensler E. Timing of forced expiratory volume in one second. Am Rev Respir
Dis. 1975;112:882-85.
144. Sood A, Dawson B, Henkle J, Hopkins-Price P, Qualls C. Effect of change of reference
standard to NHANES III on interpretation of spirometric 'abnormality'. Int J Chronic
Obstruct Pulmon Dis. 2007;2(3):361-67. DOI: 10.2147/COPD.S.
145. Quanjer P, Enright P. Should we use 'lung age'? Prim Care Respir J. 2010;19(4):197-99.
DOI: 10.4104/pcrj.2010.00045.
146. Hansen J. Measuring the lung age of smokers. Prim Care Respir J. 2010;19(3):286-87.
DOI: 10.4104/pcrj.2010.00048.
147. Hansen J. Lung age is a useful concept and calculation. Prim Care Respir J.
2010;19(4):400-1. DOI: 10.4104/pcrj.2010.00074.
148. Parkes G, Greenhalgh T. Paradoxes of spirometry results, and smoking cessation. Prim
Care Respir J. 2010;19(3):295-96. DOI: 10.4104/pcrj.2010.00056.
149. Rubin B, Dhand R, Ruppel G, Branson R, Hess D. Respiratory Care Year in Review 2010:
Part 1. Asthma, COPD, Pulmonary Function Testing, Ventilator-Associated Pneumonia.
Respir Care. 2010;56(4):488-502. DOI: doi: 10.4187/respcare.01286.
150. Housset B. La notion d'âge pulmonaire peut-elle aider à arrêter le tabac? [Does the
concept of lung age help smokers to quit smoking?]. Rev Prat. 2011;61:600-1.
151. Yamaguchi K, Omori H, Onoue A, Katoh T, Ogata Y, Kawashima H, et al. Novel
regression equations predicting lung age from varied spirometric papameters. Respir
Physiol Neurobiol. 2012;183:108-14. DOI: 10.1016/j.resp.2012.06.025.
152. Primary Care Respiratory Toolkit. Australian Lung Foundation; 2011 [16 April, 2013].
Available from: http://lungfoundation.com.au/professional-resources/1692-2/general-
practice/primary-care-respiratory-toolkit/

155
153. Newbury W, Crockett A, Newbury J. Australian predictive equations for the Impulse
Oscillometry System. Respirology. [Abstract]. 2008;13(Suppl 2):A67.
154. Grant J, Taylor A, Ruffin R, Wilson D, Phillips P, Adams R, et al. Cohort Profile: The
North West Adelaide Health Study (NWAHS). Int J Epidemiol. 2009 Dec;38(6):1497-86.
DOI: 10.1093/je/dyn262.
155. Falaschetti E, Laiho J, Primatesta P, Purdon S. Prediction equations for normal and low
lung function from the Health Survey for England. Eur Resp J. 2004;23:456-63. DOI:
10.1183/09031936.04.00055204.
156. Newbury W, Newbury J, Crockett A. Exploring the need to update lung age equations.
Prim Care Respir J. 2010;19(3):242-47. DOI: 10.4104/pcrj.2010.00029.
157. Newbury W, Lorimer M, Crockett A. Newer equations better predict lung age in
smokers: a retrospective analysis using a cohort of randomly selected participants.
Prim Care Respir J. 2012;21(1):78-84. DOI: 10.4104/pcrj.2011.00094.
158. Cooper B. Dawning of a new lung age? Prim Care Respir J. 2012;21(1):15-6. DOI:
10.4104/pcrj.2012.00021.
159. Hansen J, Sun X-G, Wasserman K. Calculating gambling odds and lung ages for
smokers. Eur Resp J. 2010;35(4):776-80. DOI: 10.1183/09031936.00107709.
160. Hansen J, Sun X-G, Wasserman K. Ethnic- and sex-free formulae for detection of airway
obstruction. Am J Respir Crit Care Med. 2006;174(5):493-98. DOI:
10.1164/rccm.200604-517OC.
161. Janssens J, Pache J, Nicold L. Physiological changes in respiratory function associated
with ageing. Eur Respir J. 1999;13:197-205.
162. Grant J, Chittleborough C, Taylor A, dal Grande E, Wilson D, Phillips P, et al. The North
West Adelaide Health Study: detailed methods and baseline segmentation of a cohort
for selected chronic diseases. Epidemiol Perspect Innov. 2006 12 April 2006;3(4). DOI:
10/1186/1742-5573-3-4.
163. Haren M, Misan G, Grant J, Buckley J, Howe P, Taylor A, et al. Proximal correlates of
metabolic phenotypes during 'at-risk' and 'case' stages of the metabolic disease
continuum. Nutr Diabetes. 2012;2(1):e24. DOI: 10.1038/nutd.2011.20.
164. Laird N, Ware J. Random-Effects models for longitudinal data. Biometrics.
1982;38(4):963-74.
165. Ogden C, Fryar C, Carrol M, Flegal K. Mean body weight, height, and body mass index,
United States 1960-2002. Advance data from vital and health statistics; no 347.
Hyattsville, Maryland: National Center for Health Statistics; 2004.

156
166. Dytham C. Choosing and Using Statistics: A Biologist's Guide. 3rd ed: John Wiley &
Sons; 2011. Available from:
http://sunsetridgemsbiology.wikispaces.com/file/view/Choosing+and+Using+Statistics
.pdf.
167. Walters J, Wood-Baker R, Walls J, Johns D. Stability of the EasyOne ultrasonic
spirometer for use in general practice. Respirology. 2006;11:306-10. DOI:
10.1111/j.1440-1843.2006.00842.x.
168. Barr R, Stemple K, Mesia-Vela S, Basner R, Derk S, Henneberger P, et al. Reproducibility
and validity of a handheld spirometer. Respir Care. 2008;53(4):433-41.
169. Liistro G, Vanwelde C, Vincken W, Vandevoorde J, Verleden G, Buffels J, et al. Technical
and functional assessment of 10 office spirometers. A multicenter comparative study.
Chest. 2006;130:657-65. DOI: 10.1378/chest.130.3.657.
170. Sato S, Muro S, Takahashi T, Hirai T, Mishima M, Sato A. Annual changes of "lung age".
Validation of lung age equation by 5-year follow up study in Japan. Am J Respir Crit
Care Med. [conference abstract]. 2012;185:2012:A5881.
171. Frith P, Cafarella P, Duffy J. Chronic obstructive pulmonary disease (COPD) is a major
personal and public health burden in Australia. Aust NZ J Pub Health. 2008;32(2):139-
41. DOI: 10/1111/j.1753-6405.2008.00190.x.
172. Lebowitz M. Age, period and cohort effects. Am J Respir Crit Care Med.
1996;154(6):S273-S7. DOI: 10.1164/ajrccm/154.6_Pt_2.S273.
173. Sharma G, Goodwin J. Effect of aging on respiratory system physiology and
immunology. Clin Interv Aging. 2006;1(3):253-60. DOI: 10.2147/CIA.S.
174. Xu X, Laird N, Dockery D, Schouten J, Rijcken B, Weiss S. Age, period and cohort effects
on pulmonary function in a 24-year longitudinal study. Am J Epidemiol.
1995;141(6):554-66.
175. Ware J, Dockery D, Louis T, Xu X, Ferris B, Speizer F. Longitudinal and cross-sectional
estimates of pulmonary function decline in never-smoking adults. Am J Epidemiol.
1990;132(4):685-700.
176. Cole T. The secular trend in human physical growth: a biological view. Econ Hum Biol.
2003;1:161-68. DOI: 10.1016/S1570-677X(02)00033-3.
177. Quanjer P, Stocks J, Cole T, Hall G, Stanojevic S. Influence of secular trends and sample
size on reference equations for lung function tests. Eur Resp J. 2011;37:658-64. DOI:
10.1183/09031936.00110010.
157
178. Quanjer P. Standardization of lung function tests. Bull Eur Physiopathol Respir.
1983;19(Suppl 5):1-95.
179. Zwar N, Richmond R, Borland R, Peters M, Litt J, Bell J, et al. Supporting smoking
cessation: a guide for health professionals. Melbourne: The Royal Australian College of
General Practitioners; 2011.
180. Tobacco Addiction: National Institute on Drug Abuse; 2012. 12-4342.
181. Singh S, Loke Y, Spangler J, Furberg C. Risk of serious adverse cardiovascular events
associated with varenicline: a systematic review and meta-analysis. CMAJ.
2011;183(12):1359-66. DOI: 10.1503/cmaj.110218.
182. Harrison-Woolrych M. Varenicline for smoking cessation. What can we learn from the
story so far? Br Med J. 2012;345:e7547. DOI: 10/1136/bmj.e7547.
183. Harrison-Woolrych M, Ashton J. Psychiatric adverse events associated with varenicline:
an intensive postmarketing prospective cohort study in New Zealand. Drug Saf.
2011;34:763-72. DOI: 10.2164/11594450-000000000-00000.
184. Hughes J, Stead L, Lancaster T. Antidepressants for smoking cessation. Cochrane
Database of Systematic Reviews. 2007. DOI: 10.1002/14651858.CD000031.pub3.
185. Tashkin D, Murray R. Smoking cessation in chronic obstructive pulmonary disease.
Respir Med. 2009;103(7):963-74. DOI: 10.1016/j.rmed.2009.02.013.
186. Prochaska J, DiClemente C. Stages and processes of self-change of smoking: toward an
integrative model of change. J Consult Clin Psychol. 1983;51(3):390-95.
187. Prochaska J, Velicer W. The Transtheoretical Model of Health Behavior Change. Am J
Health Promot. 1997;12(1):38-48.
188. Perz C, DiClemente C, Carbonari J. Doing the right thing at the right time? The
interaction of stages and processes of change in successful smoking cessation. Health
Psychol. 1996;15(6):462-68.
189. Riemsma R, Pattenden J, Bridle C, Sowden A, Mather L, Watt I, et al. Systematic review
of the effectiveness of stage based interventions to promote smoking cessation. Br
Med J. 2003;326:1175. DOI: 10.1136/bmj.326.7400.1175.
190. Sutton S. Back to the drawing board? A review of applications of the transtheoretical
model of substance use. Addiction. 2001;96:175-86. DOI:
10.1080/09652140020017049.
191. West R. Time for a change: putting the Transtheoretical (Stages of Change) Model to
rest. Addiction. 2005;100:1036-39. DOI: 10.1111/j.1360-0443.2005.01139.x.

158
192. West R, Sohal T. "Catastrophic" pathways to smoking cessation: findings from national
survey. Br Med J. 2006;332:458-60. DOI: 10.1136/bmj.38723.573866.
193. Montepare J, Lachman M. "You're only as old as you feel": Self-preceptions of age,
fears of aging, and life satisfaction from adolescence to old age. Psychol Aging.
1989;4:73-8.
194. Maciewicz R, Warburton D, Rennard S. Can increased understanding of the role of lung
development and aging drive new advances in chronic obstructive pulmonary disease?
Proc Am Thorac Soc. 2009;6:614-17. DOI: 10.1513/pats.200908-094RM.
195. Kennedy C, Bastiaens M, Bajdik C, Willemze R, Westendorp R, Bouwes Bavinck J. Effect
of smoking and sun on the aging skin. J Invest Dermatol. 2003;120:548-54.
196. Price D, Crockett A, Arne M, Garbe B, Jones R, Kaplan A, et al. Spirometry in primary
care case-identification, diagnosis and managment of COPD. Prim Care Respir J.
2009;18(3):216-23. DOI: 10.4104/pcrj.2009.00055.
197. Jordan R, Lam K, Cheng K, Miller M, Marsh J, Ayres J, et al. Case finding for chronic
obstructive pulmonary disease: a model for optimising a targeted approach. Thorax.
2010;65:492-98. DOI: 10.1136/thx.2009.129395.
198. Stanojevic S, Wade A, Stocks J, Hankinson J, Coates A, Pan H, et al. Reference ranges
for spirometry across all ages. A new approach. Am J Respir Crit Care Med.
2008;177:253-60. DOI: 10.1164/rccm.200708-12480C.
199. Thompson B, Stanojevic S, Abramson M, Beasley R, Coates A, Dent A, et al. The all-age
spirometry reference ranges reflect contemporary Australasian spirometry.
Respirology. 2011;16:912-17. DOI: 10.1111/j.1440-1843.2011.01970.x.
200. Brazzale D, Hall G, Pretto J, editors. The effect of adopting the new GLI reference
equations on the interpretation of spirometry. ANZSRS Annual Scientific Meeting;
2013; Darwin: Respirology.
201. Fingleton J, Williams M, Charles T, Beasley R, editors. Choice of reference range
markedly changes estimates of population disease prevalence and severity. TSANZ
Annual Scientific Meeting; 2013; Darwin: Respirology.
202. Australian Bureau of Statistics. Australian Standard Geographic Classification
Remoteness Structure. Australian Bureau of Statistics; [updated 1 February 2013].
Available from:
http://www.abs.gov.au/websitedbs/d3310114.nsf/home/remoteness+structure

159
203. Rivett K. Ambient air monitoring at Whyalla, South Australia. Monitoring campaign
2004-06: Air and Noise Branch, South Australian Environment Protection Authority.;
2007. ISBN 978-1-921125-50-8.
204. South Australia Department of Health. Whyalla Health Impact Study Report:
Department of Health; 2007. Available from:
http://www.health.sa.gov.au/pehs/whyalla/071203-Whyalla-report.pdf.
205. Scollo M, Winstanley M. Tobacco in Australia: Facts and issues. 4th ed. Melbourne:
Cancer Council Victoria; 2012. Available from: Available from
www.TobaccoInAustralia.org.au
206. Campion J, Checinski K, Nurse J. Review of smoking cessation treatments for people
with mental illness. Advances in psychiatric treatment. 2008;14:208-16. DOI:
10.1192/apt.bp.107.003483.
207. Profiles of Health, Australia, 2011-2013. Canberra: Australian Bureau of Statistics;
2012. 29/10/2012 4338.0.
208. Aylward P, Crockett A. Qualitative evaluation of the 'Primary Care Respiratory Toolkit':
Interviews with General Practitioners and Practice Nurses from GP practices in South
Australia. : Australian Lung Foundation; 2011.
209. Plan and operation of the third National Health and Nutrition Examination Survey,
1988-94.: National Center for Health Statistics; 1994.