exploring options for improving crop productivity within some farming zones of ghana using coupled...
TRANSCRIPT

Exploring options for improving crop productivity within some farming zones of Ghana using coupled
climatic-crop models
S.G.K Adiku1, F.K. Mawunya1, and J.W. Jones2
1. Department of Soil Science, University of Ghana, Legon, Accra, Ghana
2.Department of Agricultural and Biological Engineering,University of Florida, USA
Introduction
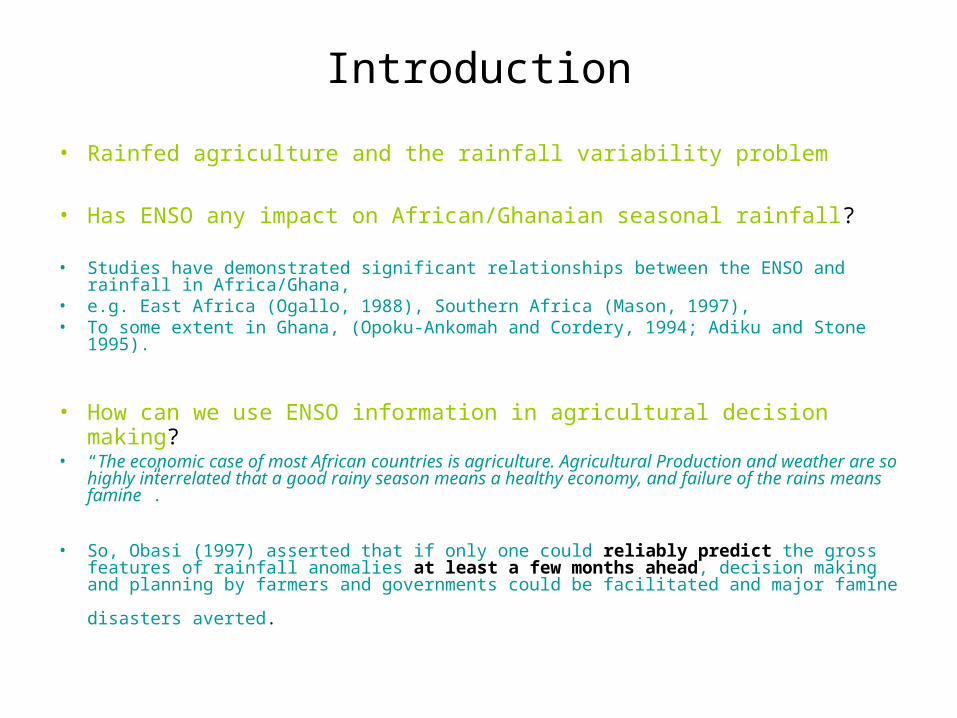
• Rainfed agriculture and the rainfall variability problem
• Has ENSO any impact on African/Ghanaian seasonal rainfall?
• Studies have demonstrated significant relationships between the ENSO and rainfall in Africa/Ghana,
• e.g. East Africa (Ogallo, 1988), Southern Africa (Mason, 1997), • To some extent in Ghana, (Opoku-Ankomah and Cordery, 1994; Adiku and Stone
1995).
• How can we use ENSO information in agricultural decision making? • “The economic case of most African countries is agriculture. Agricultural Production and
weather are so highly interrelated that a good rainy season means a healthy economy, and failure of the rains means famine”.
• So, Obasi (1997) asserted that if only one could reliably predict the gross features of rainfall anomalies at least a few months ahead, decision making and planning by
farmers and governments could be facilitated and major famine disasters averted.

What conditions are necessary for the use of ENSO-based seasonal rainfall forecast for Agricultural planning?
• 1. sufficient correlation must exist between ENSO and rainfall
• 2. demonstrate that indeed crop yields differ for different ENSO phases
• 3. ENSO-based forecast period must have sufficient lead time before cropping season commences,
• • 4. Ability to translate forecast into crop management decisions, and
• 5. Ability to pass the knowledge to end users (operationalize).

Objectives
• 1. Determine the extent to which ENSO affects seasonal rainfall in Ghana
• 2. Demonstrate the impact of ENSO on the yields of maize and groundnut in a selected farming zone in south-eastern Ghana:
• 3. Operationalize ENSO forecast for Agricultural planning– (i) Develop methodologies for disaggregating ENSO seasonal forecast
to appropriate from for use in crop yield forecasting (use of weather generators + crop modelling), and
– (ii) Develop a scheme for communicating and operationalizing ENSO-based forecast information among end stakeholdes/users.
•

Map of Ghana sowing sites
Wa
Yendi
Ada

Objective I: Does ENSO Phenomenon affect Ghanaian Rainfall?
A. Sites• For all nine sites selected (Fig. 1)• Growing seasons fall within ENSO year (October to September)
• Southern sites bimodal rainfall (major rains April to July)
• Unimodal rainfall pattern (May –Oct.) at northern sites
OND
LEAD Growing season
J-M
ENSO-phase
A - J
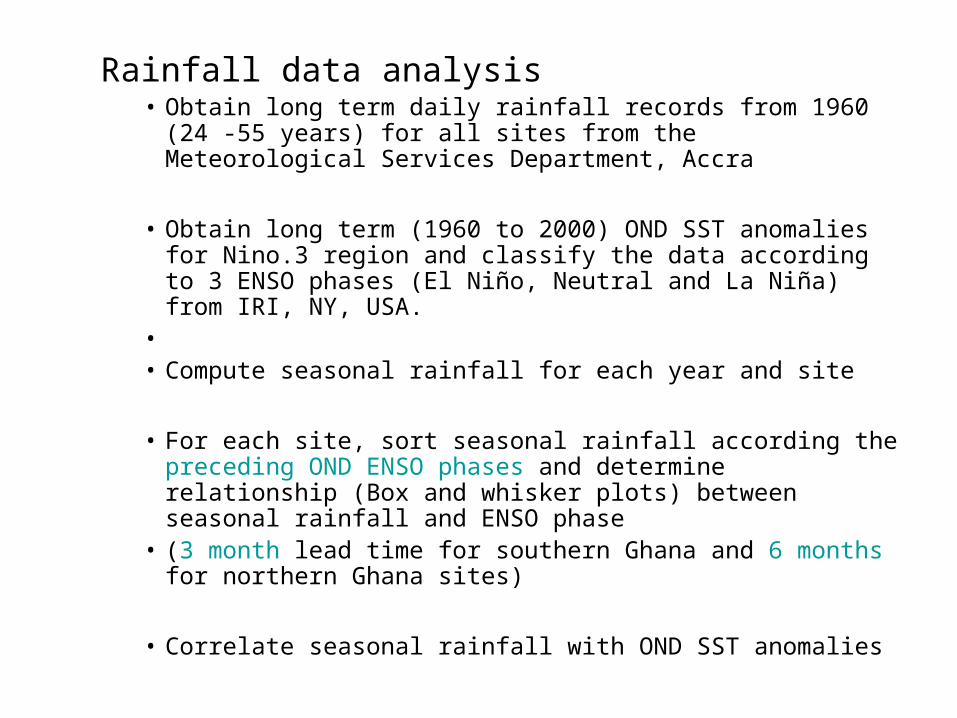
Rainfall data analysis• Obtain long term daily rainfall records from 1960 (24 -55
years) for all sites from the Meteorological Services Department, Accra
• Obtain long term (1960 to 2000) OND SST anomalies for Nino.3 region and classify the data according to 3 ENSO phases (El Niño, Neutral and La Niña) from IRI, NY, USA.
• • Compute seasonal rainfall for each year and site
• For each site, sort seasonal rainfall according the preceding OND ENSO phases and determine relationship (Box and whisker plots) between seasonal rainfall and ENSO phase
• (3 month lead time for southern Ghana and 6 months for northern Ghana sites)
• Correlate seasonal rainfall with OND SST anomalies

Fig. 1 Boxplot of Median seasonal rainfall amounts (mm) and ENSO Phase at four farming sites in Ghana
ENSO Phase
Seaso
nal R
ain
fall
am
ount(
mm
)
10-1
700
600
500
400
300
200
Akatsi
ENSO PHASE
MEA
N S
EASONAL
RF(
mm
)
10-1
1400
1300
1200
1100
1000
900
800
700
600
YENDI
ENSO PHASE
Seaso
nal R
ain
fall
am
ount
(mm
)
10-1
1400
1300
1200
1100
1000
900
800
700
600
500
WA
ENSO PHASE
Seaso
nal
rain
fall
am
ount
(mm
)
10-1
2250
2000
1750
1500
1250
1000
750
500
AXIM
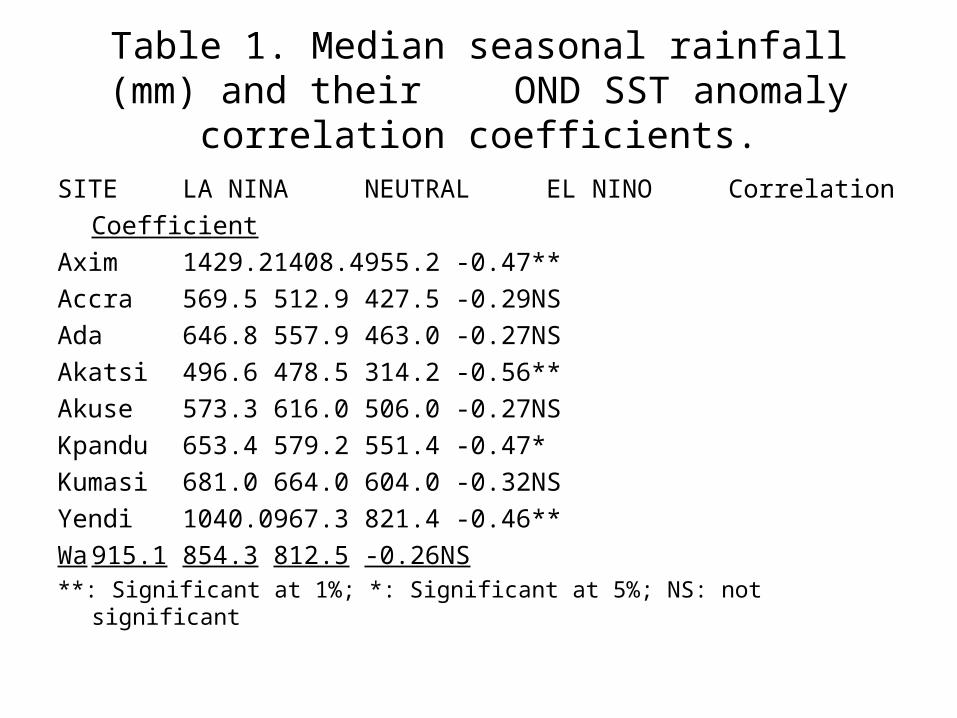
Table 1. Median seasonal rainfall (mm) and their OND SST anomaly correlation coefficients.
SITE LA NINA NEUTRAL EL NINO Correlation
Coefficient
Axim 1429.2 1408.4 955.2 -0.47**
Accra 569.5 512.9 427.5 -0.29NS
Ada 646.8 557.9 463.0 -0.27NS
Akatsi 496.6 478.5 314.2 -0.56**
Akuse 573.3 616.0 506.0 -0.27NS
Kpandu 653.4 579.2 551.4 -0.47*
Kumasi 681.0 664.0 604.0 -0.32NS
Yendi 1040.0 967.3 821.4 -0.46**
Wa 915.1 854.3 812.5 -0.26NS**: Significant at 1%; *: Significant at 5%; NS: not significant

• Yield simulation studies at Akatsi– Crops: peanut (two varieties: short and long) and maize
– Selected crop model DSSAT 3.5 for these crops (previously validated)
• Prepare long term historical weather file for Akatsi• Prepare soil file for Akatsi (Data from Adiku et al. 2001)
• Simulate long term yields for each crop under 3 planting dates • (Early = early April; Normal = mid April; and Late = end of April)
• In the case of maize, also vary nitrogen application rates (3 rates)
• Sort yields according to the 3 OND ENSO phases.
• Derive Cumulative frequency distributions (CDF) of yields for a given ENSO phase.
• Compare planting dates using Stochastic dominance (Anderson et al. 1977).
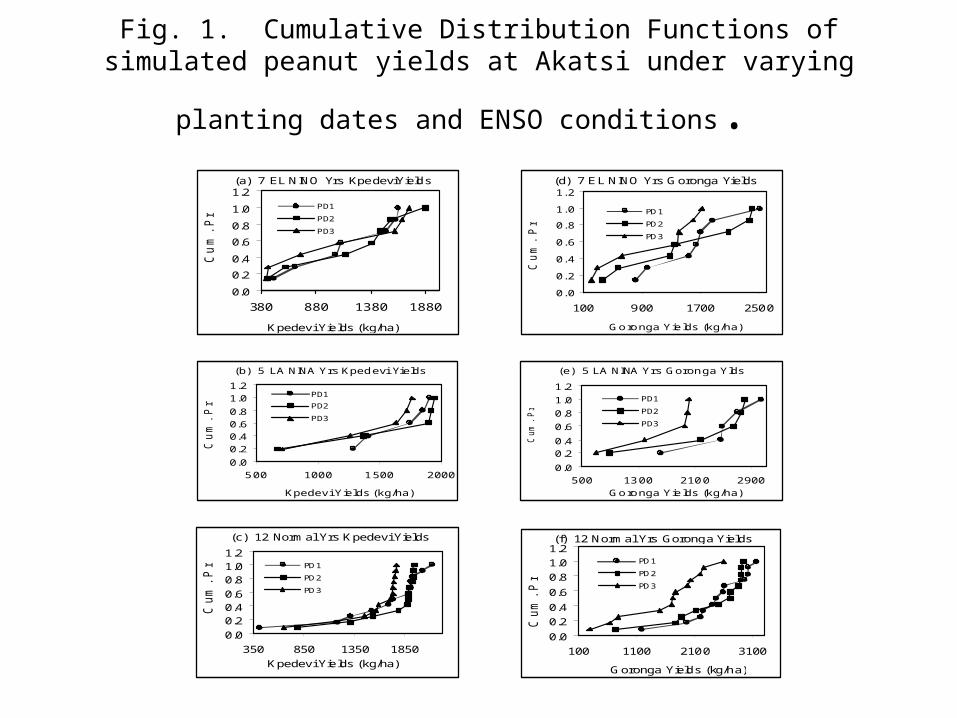
Fig. 1. Cumulative Distribution Functions of simulated peanut yields at
Akatsi under varying planting dates and ENSO conditions. (a) 7 EL NINO Yrs KpedeviYields
0.0
0.2
0.4
0.6
0.8
1.0
1.2
380 880 1380 1880
Kpedevi Yields (kg/ha)
Cu
m. P
rob
.PD1
PD2
PD3
(c) 12 Normal Yrs Kpedevi Yields
0.0
0.20.40.6
0.81.01.2
350 850 1350 1850
Kpedevi Yields (kg/ha)
Cum
. P
rob.
PD1
PD2
PD3
(d) 7 EL NINO Yrs Goronga Yields
0.0
0.2
0.4
0.6
0.8
1.0
1.2
100 900 1700 2500
Go ro nga Yie lds (kg/ha)
Cu
m.
Pro
b.
PD1
PD2
PD3
(f) 12 Normal Yrs Goronga Yields
0.0
0.2
0.4
0.6
0.8
1.0
1.2
100 1100 2100 3100
Goronga Yields (kg/ha)
Cum
. P
rob. PD1
PD2
PD3
(b) 5 LA NINA Yrs Kped evi Yields
0.0
0.2
0.4
0.6
0.8
1.0
1.2
5 00 1000 1 500 2000
Kpedevi Yields (kg/ha)
Cu
m.
Pro
b.
PD1
PD2
PD3
(e) 5 LA NINA Yrs Goron ga Ylds
0.0
0.2
0.4
0.6
0.8
1.0
1.2
500 13 00 210 0 2900
Go ro nga Yie lds (kg/ha)
Cum
. P
rob
.
PD1
PD2
PD3

Fig. 2 Mean Kpedevi (short duration) yields (kg/ha) at Akatsi for different ENSO phases and planting dates
0
200
400
600
800
1000
1200
1400
1600
1800
PD1 PD2 PD3
La Nina
Neutral
El Nino

Fig. 3 Mean Goronga (long duration) yields (kg/ha) at Akatsi for different ENSO phases and planting dates
0
500
1000
1500
2000
2500
PD1 PD2 PD3
La Nina
Neutral
El Nino
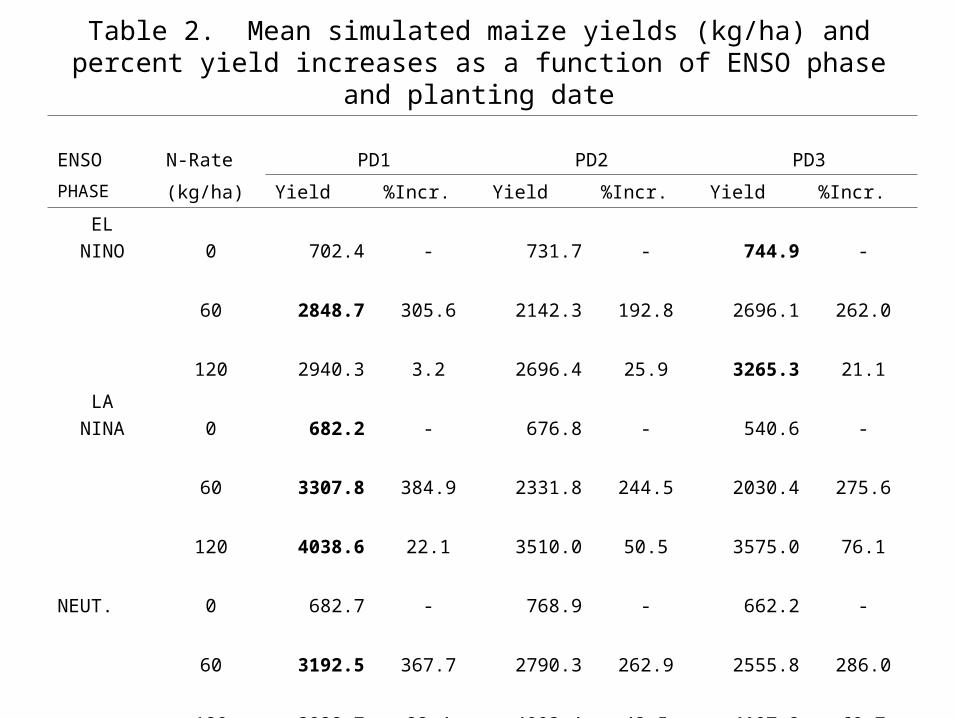
Table 2. Mean simulated maize yields (kg/ha) and percent yield increases as a function of ENSO phase and planting date
ENSO N-Rate PD1 PD2 PD3
PHASE (kg/ha) Yield %Incr. Yield %Incr. Yield %Incr.
EL
NINO 0 702.4 - 731.7 - 744.9 -
60 2848.7 305.6 2142.3 192.8 2696.1 262.0
120 2940.3 3.2 2696.4 25.9 3265.3 21.1
LA
NINA 0 682.2 - 676.8 - 540.6 -
60 3307.8 384.9 2331.8 244.5 2030.4 275.6
120 4038.6 22.1 3510.0 50.5 3575.0 76.1
NEUT. 0 682.7 - 768.9 - 662.2 -
60 3192.5 367.7 2790.3 262.9 2555.8 286.0
120 3938.7 23.4 4003.4 43.5 4107.8 60.7

Crop yield simulations
Peanut Yield simulations at Akatsi show that early planting is generally preferred for La Nina and Neutral, late planting is better for El Nino. In the case of maize, nitrogen application is beneficial for La Nina and neutral but not for El Nino
Operationalizing ENSO Forecast for Agricultural Planning
• 1. Improving forecasting skills
• OND ENSO correlates significantly with seasonal rainfall in 4 out of the 9 sites in Ghana
• 3 of these sites lie in the southern Ghana (near the southern coast. (Atlantic)
• • How do we improve the skills at the other sites?
Should we also consider Atlantic SST anomalies on Ghanaian rainfall?

Additional information required to improve forecasting
• What are the sources of moisture for rainfall in West Africa/Ghana?– Chad Basin? South Africa?
• What additional information do we need?
• Wind directions at 200 mb level (i.e. about 12 km above mean sea
level) Easterlies = good rainfall; Westerlies = poor rainfall
• Should we run GCMs for Ghana?
• Further research required!

Use of seasonal forecast in Agricultural planning.
• Currently, the Meteorological Services Agency in Ghana puts up forecasts (tercial) in April/May (below is forecast for 2005). What is the basis of this forecast? Does this include Atlantic effects?
•

Use of seasonal forecast for agricultural planning
• We can use a “coarse” yield model such as that of Dorembos and Kassam (FAO,1975)
• Ya is actual/expected yield,• ETa = actual/expected seasonal evapotranspiration (from water balance)• ETm = maximum evapotranspiration• Ky = yield response factor• Ym = maximum yield
• But we cannot assess management effects such as planting date, planting density, fertilizer application, etc. with such a model
m
ay
m
a
ET
ETk
Y
Y11
Need for a more detailed crop model running on say aily time scale?
• Dis-aggregation of ENSO Forecast for crop yield forecasting using rainfall generator
• A rainfall generator can be used to synthesis a daily sequence of rainfall, which in conjunction with crop models can simulate growth and yield.
• If Ghanaian seasonal rainfall is influenced by ENSO, then so will be the rainfall probability parameters which are required by rainfall generators:
• Of interest are: • (i) The state of the day and its transitional probabilities:
• P(D/D); P(W/W), P(D/W), P(W/D)
• (ii) Rainfall amount distribution parameters (shape and scale factors)
• This can be determined for each site and rainfall month and ENSO phase
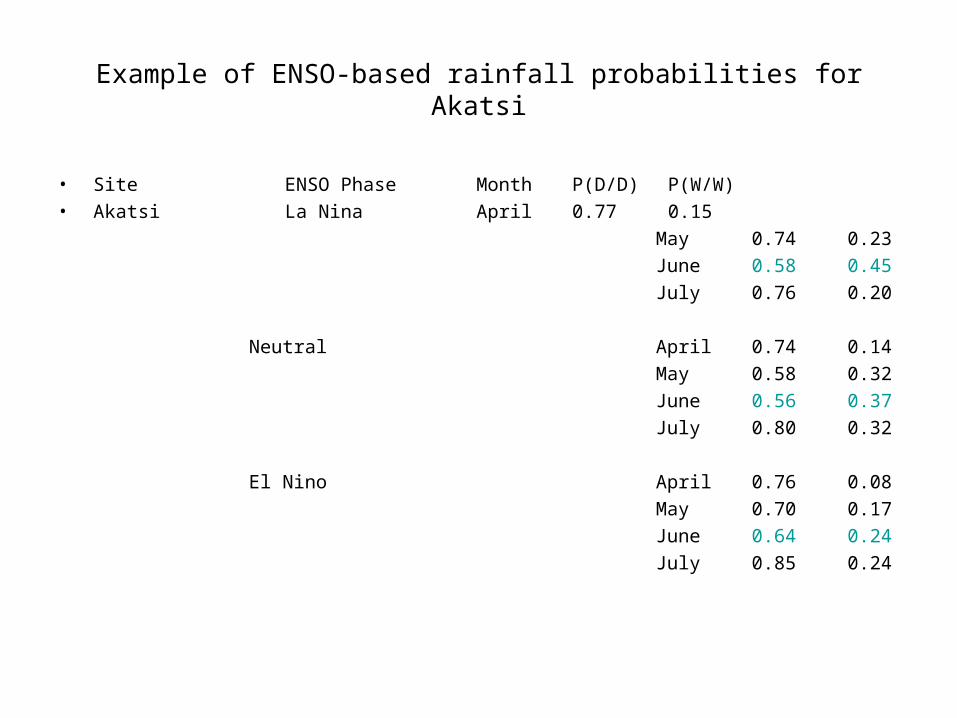
Example of ENSO-based rainfall probabilities for Akatsi
• Site ENSO Phase Month P(D/D) P(W/W)
• Akatsi La Nina April 0.77 0.15
May 0.74 0.23
June 0.58 0.45
July 0.76 0.20
Neutral April 0.74 0.14
May 0.58 0.32
June 0.56 0.37
July 0.80 0.32
El Nino April 0.76 0.08
May 0.70 0.17
June 0.64 0.24
July 0.85 0.24

• Given a forecast, e.g. El Nino, then we can select the appropriate probabilities and execute the rainfall generator
• Problems: Will a year declared as El Nino in OND remain so the whole year round? Not likely!
• Can a year begin as El Nino and end up as normal?
• If yes, how do we handle this in the generator?


TABLE - IRI Probabilistic ENSO Forecast for NINO3.4 Region - Made in February 2005
Season La Niña Neutral El Niño
FMA 2005 0% 35% 65%
MAM 2005 0% 35% 65%
AMJ 2005 5% 35% 60%
MJJ 2005 5% 40% 55%
JJA 2005 5% 45% 50%
JAS 2005 5% 50% 45%
ASO 2005 5% 55% 40%
SON 2005 5% 55% 40%
OND 2005 5% 55% 40%
NDJ 2006 5% 55% 40%
Additional Details about this Probabilistic ENSO forecast Probabilistic ENSO forecast archive
ENSO diagnostics & prediction info archive
• Since forecasts are made for 3-month averages and each 3-month is not “pure” i.e. can have mixture of phases, how do we estimate transition probabilities for mixed phase situations?
• • Can we assume that assume that the behaviour of Ghanaian
rainfall for a given 3-month will mimic exactly and simultaneously that of NINO.3 SST anomalies?
• Are there 3-month probabilities published for various regions in the world?
• These aspects still require research!

How do we communicate ENSO Forecasts to Stake holders/End Users?
Stakeholder Interviews:
• 14 Senior Staff of the Ministry of Food and Agriculture from Headquarters in Accra• 50 Field extension Officers• 124 Farmers drawn from six districts
• Main questions: 1. What is your knowledge of climate variability and ENSO phenomenon?
– 2. Do you use of climate information in planning of work?
– How would you respond to a seasonal climate forecast?

Results
• Ministry of Agriculture Staff:– All staff were aware of climate variability problem
– About 60% have heard of ENSO but do not know exactly what it is.
– Almost all do not use and do not “know” how they can incorporate seasonal climate forecast in planning their work and therefore cannot respond to climate forecast in any special manner
Field Extension Officers: Good knowledge of climate variability problem.
More than 90% have not heard of ENSO phenomenon
Most have good response options to climate forecasts and hence can respond in specific ways such as:
(i) change crop variety (ii) change planting date and (iii) change cropping system
• Farmers:– Good knowledge of climate variability problem
– Endowed with Indigenous knowledge
– All have not heard of ENSO phenomenon
– Most would not respond to seasonal forecast in any special way at this time since there are no field tested cases for reference.
– Most would do what is usually done.

• How should we operationalize seasonal forecast information for Agricultural planning?
• 1. Broadcast information and let each stakeholder respond as deems fit?
• 2. Develop an operational scheme detailing the role to be played by each stakeholder for a given forecast scenario?.

Design Operational Schemes
Stakeholder Meetings
Seasonal forecast presentation by Meteorologists and Climate Researchers
Crop yield forecasting using coupled climate-crop simulation modelsConsidering various management practices: crop and variety choice,
Planting date and density, etc.
MOARelease food from depots
Extend drought relief to farmers
Give relevant advice to farmers
FarmersPlant drought tolerant/short
season cropsPlant in depressions
Practice tied-ridging and water conservation
El Nino
MOA
Make inputs availablePrepare depots for
bumper harvest
FarmersPlant high yielding varieties
Plant earlyApply fertilizers
Plant on furrows to shed off excess water
La Nina

i) End users require education and training
ii) We must identify the education level of each stakeholder – e.g. Field Extension Officers
iii) We must develop appropriate training manual:Topics: • Review of Basic Statistics• Rainfall statistics in some zones of Ghana• The ENSO phenomenon, and • Estimation of yields from seasonal forecasts based on FAO (Dorembos and
Kassam, 1975).
Organize Weather Schools for Extension Staff

Weather School at Akatsi, Ghana, March 2003

Participants, some working in groups
Conclusion
• There is scope of using ENSO-based seasonal forecasting for Agricultural planning in Ghana.
• However, adequacy of ENSO only as basis for forecasting rainfall continues to be in doubt.
• Forecast skills are quite low and only few sites seem to capture the signal. Further research is required in this area!
• An operational scheme for using ENSO-based forecast in agricultural planning is proposed but not tested in the field.
• Two weather schools were successfully conducted for Extension staff.
• Appropriate training manuals need be developed for other stakeholders and workshops are necessary.
• Field demonstrations of ENSO-based agricultural decision making generally lacking!

Acknowledgements
• 1. Packard Foundation and START for funding this project
• 2. Prof. J.W. Jones for very useful comments and direction
• 3. My co-workers for their support

Thank You