exploring inclusive growth and poverty reduction...
TRANSCRIPT
IOSR Journal of Economics and Finance (IOSR-JEF)
e-ISSN: 2321-5933, p-ISSN: 2321-5925.Volume 5, Issue 6. Ver. I (Nov.-Dec. 2014), PP 54-68 www.iosrjournals.org
www.iosrjournals.org 54 | Page
Exploring Inclusive Growth and Poverty Reduction Strategies in
the BRICS Economies: A Multi-Country Study Of Brazil,
China and South Africa
Samuel A. Igbatayo* and Bosede Olanike Awoyemi ** *PhD in Agricultural Economics and Professor, Afe Babalola University, Nigeria.
**Department of Economics Afe Babalola University, Ado Ekiti
Corresponding author- [email protected]
Abstract: The acronym BRICS stands for Brazil, Russia, India, China and South Africa. A grouping of some of
the world’s most dynamic economies, the BRICS countries have emerged as an economic block, which has
shaped the direction of the global economy, particularly in the past decade. The positive trend has transformed
the development profile of the BRICS countries, lifting millions out of the vicious cycle of poverty. Inclusive
growth in China has spawned large-scale poverty reduction, with the head-count poverty ratio declining from
30.7 % or 250 million people in 1978 to 13.4% or 179.9 million in 2012. In the case of Brazil, which features one of the world’s most severe inequality ratios, the nation has improved the rate of impoverishment amongst its
population in the last decade, reinforced by sustained economic growth. While the nation’s poverty ratio
escalated from 17.4 % in 1990 to 22 % in 1998 and 31 % in 2005; it has reduced to 26 % in 2008 and 21.4% in
2013 (World factbook, 2013). South Africa presents a different scenario, with the obnoxious apartheid system
excluding the majority Black population from the nation’s wealth until its emergence as a multi-racial
democracy. While the nation continues to struggle against endemic poverty, particularly amongst the Black
population; strong economic performance in the last decade has led to poverty reduction. Therefore, the major
objective of this paper is to elaborate the nexus of inclusive growth and poverty reduction in the BRICS
countries, particularly in the last decade. The paper employs empirical data to analyze economic performance
in the countries and finds that inclusive growth has contributed to poverty reduction. Brazil, China and South
Africa were examined as case studies, revealing the positive effects of inclusive growth on poverty reduction.
The paper also presents a policy framework underpinned by macroeconomic policies, characterized by economic diversification, export-driven industrialization, foreign direct investment, as well as mainstreaming
poverty reduction strategies in development policy.
I. Introduction 1.1The Emergence of BRICS Economies
The acronym BRIC was coined in 2001 by analysts of Goldman Sachs, a New York-based investment
Bank, to describe some of the world‟s most dynamic emerging economies, comprising Brazil, Russia, India and
China. The initial report identified the four countries as an emergent economic players shaping the pace and
direction of the global economy (De Castro, 2010:1).
The emergence of BRIC economies is characterized by broad-based growth and rapid structural
transformation, prompting suggestions that their increased relevance merited their corporation to the G7 (O‟
Neill, 2001). The four countries began to meet as a group in 2006 to reinforce their positions in the global economy and foster economic cooperation, particularly in the developing world. However, South Africa was
admitted into its fold in 2010, transforming the group‟s a acronym to BRICS. While the South African economy
is considerably smaller in comparison with the other countries in the group, it features the largest economic
profile in Africa and has emerged as a dynamic market, with the abolition of apartheid in the early 1990s.
Demographically, BRICS comprises about 40% of the global population, with China and India
accounting for 20 % and 17.5%, respectively. While BRICS are located in relatively large territories – Russia‟s
17 Million Km2, India‟s 3.2 million Km2, China‟s 9.3 Million Km2, Brazil‟s 8.5 million Km2 and South Africa‟s
1.2million Km2 – the countries differ in terms of natural resource endowment, level of industrialization and
relative impact on the global economy.
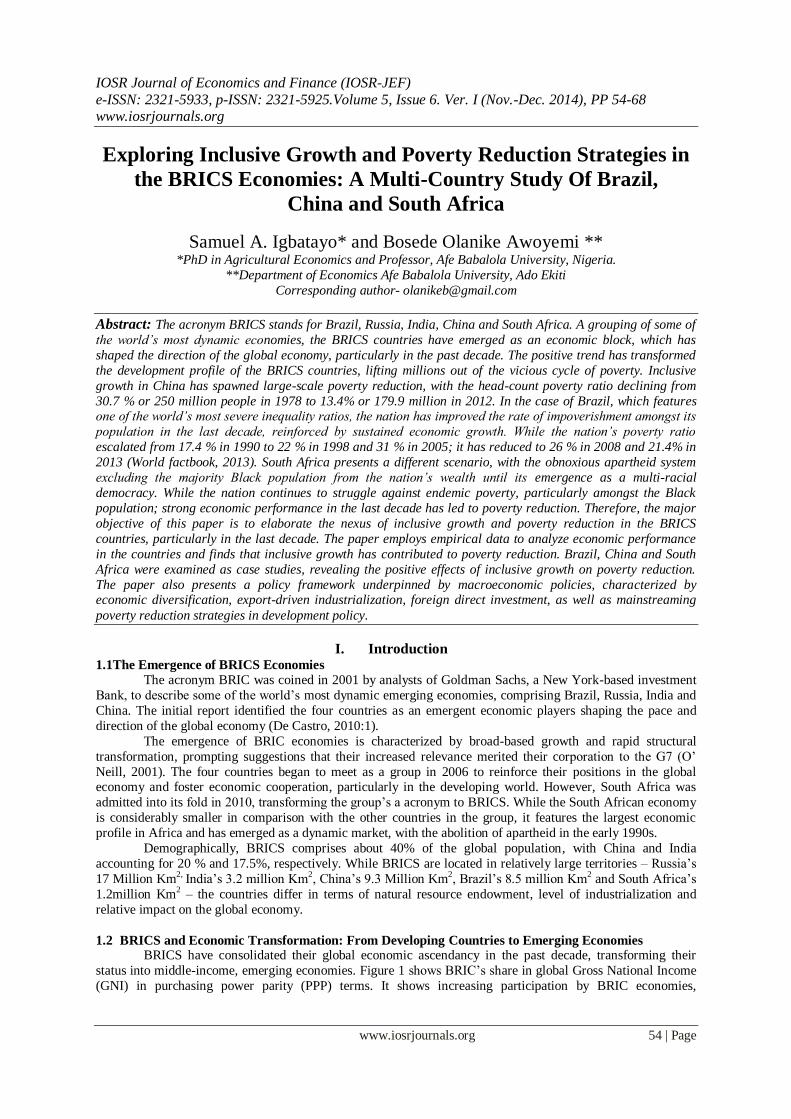
1.2 BRICS and Economic Transformation: From Developing Countries to Emerging Economies BRICS have consolidated their global economic ascendancy in the past decade, transforming their
status into middle-income, emerging economies. Figure 1 shows BRIC‟s share in global Gross National Income
(GNI) in purchasing power parity (PPP) terms. It shows increasing participation by BRIC economies,
Exploring Inclusive Growth and Poverty Reduction Strategies in the Brics Economies: A ….
www.iosrjournals.org 55 | Page
particularly China and India, as well other Middle Income Countries (MICs), with projection indicating further
expansion by 2015.
Figure 1: BRICS & Middle Income Countries in the Global Economy
Source: EP, 2012:8
The BRICS share in World Gross Domestic Product (GDP) has increased steadily in the last decade
from 16% in 2000 to nearly 25% in 2010 and projected to rise significantly in the near future. The five emerging
economies account for the lion share of global economic growth in recent times, contributing 55% during 2000-8 (Roberto de Almeida, 2009:1).
BRIC economies feature a dynamic profile, marked by a highly integrated framework in global trade.
Their trade with the world has risen phenomenally, increasing more than five times since 1999 and their share of
global trade has nearly doubled in the past decade alone, currently estimated at 16%. Also, BRIC to BRIC
annual growth rate has increased steadily and currently placed at 32%. Brazil‟s trade profile is identified as the
most geographically spread of all the BRIC countries across all continents, with the European Union (EU),
United States and China among its major trade partners (EC, 2010:5).
Since the 1990s, BRIC economies have more than doubled their share in global output, with the
group‟s GDP (based on market exchange rates) now ranked as the third largest in the world after the United
States and the Euro Area. And recent projections have shown that BRIC‟s GDP will surpass that of the Euro
Area before 2015. The increasingly robust position of BRICS economies has raised their profiles with low income
countries (LICs). With a combined labour force of more than one billion people BRICS economies have a huge
potential in the global economy. Table 1 shows the performance of BRIC economies in past couple of decades,
with projections to 2015, in a development that captures the transformation of the group as emerging economic
players.
Table 1: BRICS in the Global Economy 1991-20151
1991-94 2002-04 2005-09 2015
(In % of world total; period average)
Population
BRICs 44.7 43.6 42.8 41.7 Other EMEs2 23.1 23.3 23.6 23.9
United State 4.8 4.7 4.6 4.5
Euro Area 5.6 5.1 4.9 4.6
Labour Force
BRICs 47.0 45.8 45.4 44.0
Other EMEs2 20.0 21.0 21.6 21.9
United States 5.4 5.3 5.1 5.0
Euro Area 5.6 5.1 4.8 4.5
GDP3
Exploring Inclusive Growth and Poverty Reduction Strategies in the Brics Economies: A ….
www.iosrjournals.org 56 | Page
BRICs 5.8 8.5 13.1 20.7
Other EMEs 10.3 10.9 13.4 15.8
United States 26.3 30.6 25.6 21.1 Euro Area 24.9 21.2 22.0 16.9
Exports
BRICs 4.2 7.9 12.4 18.8
Other EMEs 13.0 15.8 18.6 18.8
United States 13.3 12.0 9.7 9.3
Euro Area 34.6 30.8 29.0 23.2
Imports BRICs 4.0 7.0 10.5 17.5
Other EMEs 14.4 14.8 17.7 18.1 United States 14.6 17.2 14.1 11.8
Euro Area 34.0 29.4 28.5 22.8
Notes: 1 WEO Projections for 2015
2 Emerging Market Economies, Excluding BRICs
3 At market exchange rates.
Sources: IMF and World Economic Outlook, 2011:8
In spite of the onslaught of the global economic crisis, which emerged in 2007, BRICS economies
continued to feature robust growth in 2010 and 2011. However, they have been undermined by recent slowing
demand, particularly in the Euro Area, raising concerns about their ability to support a weak global economy in
2012 (PWC, 2012:2)
1.3 The State of Poverty Reduction Strategies in BRICS Economies
Poverty, defined as extreme deprivation in human well-being, is a particularly controversial
development issue, often conveying different meanings to different people. There is hardly a universally
accepted concept of poverty, which is also acknowledged as a multi-dimensional issue, which varies over time
and space. The concept of poverty therefore embraces different dimensions of deprivation, describing the
inability of people to meet their basic needs, including food, clothing and shelter. The scourge undermines the
ability of people to meet economic, social and other standards of living. The multi-dimensionality of poverty is
now widely accepted, underpinned by major participatory studies of poor people‟s own perspectives on poverty.
It measures absolute poverty, which includes hunger, child and infant mortality; as well as relative poverty,
defined by the differing standards of poverty in each society (World Bank, 2000:25). The late 20th century may go down in history as a particularly challenging period for developing
economies, characterized by macroeconomic shocks, social turmoil, environmental degradation and political
instability. Wide-spread poverty, driven by poor economic performance in Africa, Asia and Latin America,
triggered a paradigm shift in development policy from structural adjustment to poverty reduction strategies
(PRS), a country-driven framework aimed at addressing the causes and consequences of poverty. Country-led
PRS emerged in the 1980 and 1990s, as a platform for low-income countries to develop poverty reduction
strategy papers (PRSPs) in the context of the Enhanced HIPC (Heavily Indebted Poor Countries) initiative and
in seeking concessional lending from the World Bank and the International Monetary Fund (IMF).
Poverty reduction strategies are development policy tools based on participatory processes,
comprehensive in scope, results – oriented and country-driven, which have been embraced in the developing
world, with a variety of outcomes. Successful countries have emerged with robust economic growth and
sustained poverty reduction, leading to the emergence of Newly Industrialized Economies (NICs), including South Korea, Taiwan and Singapore. BRICS have also been associated with sustained poverty reduction trends,
driven by robust economic growth. A model of middle income countries, featuring inclusive growth sustained in
the past couple of decades; BRICS Economies are also characterized by an emergent poverty reduction profile
that has contributed in the massive reduction of global poverty, particularly in the past decade (Hulme et al,
2010:6). Recent trends have revealed the successes in poverty reduction in three middle income economies –
China, India and Brazil – which provide useful lessons for developing economies. Between them, these
countries are home to almost one half the world‟s poor people, which have also embraced market-oriented
reforms, with a variety of social policy frameworks producing different combinations of growth, inequality and
poverty reduction trends that hold lessons for each other and for other developing countries that seek sustainable
paths out of poverty.
Exploring Inclusive Growth and Poverty Reduction Strategies in the Brics Economies: A ….
www.iosrjournals.org 57 | Page
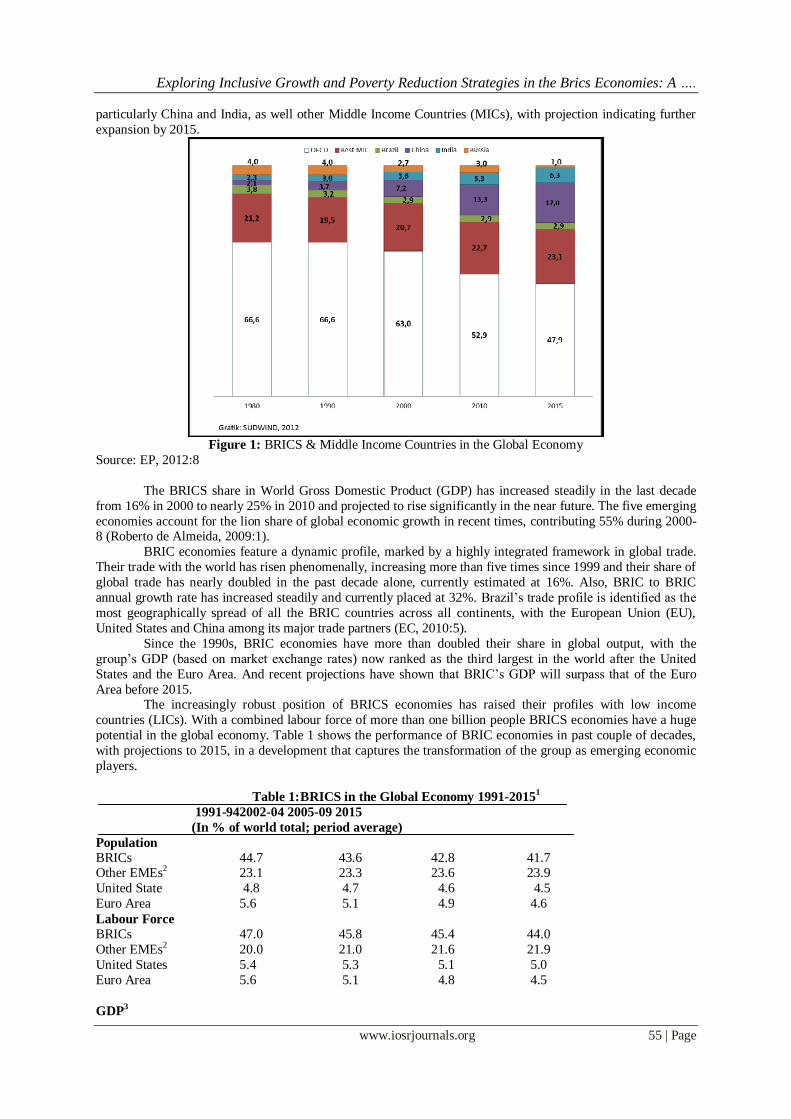
China, Brazil and India have emerged from sustained economic reform agendas. China has
transformed its economy from a system driven by collectivized agriculture to an emergent industrial economy,
which has been acknowledged as a phenomenal success story in modern times. This development has paved the way for China‟s market-led rapid growth. In the same manner, Brazil‟s recent economic transformation is driven
by market-oriented reforms, underpinned by progressive social policies, which have spawned poverty reduction
than India, although it has been less successful than the latter in terms of economic growth. Figure 2 shows
poverty trends in Brazil, China and India between 1980 and 2005. The trend shows a pattern of poverty
reduction in all three countries during the period under review, but with a more dramatic outcome in China.
Figure 2: Poverty Reduction Trends in Brazil, China and India, 1980-2005.
Source: EP, 2012:8
1.4 Contemporary Development Challenges in the BRICS Economies
In the past decade, the BRICS economies have been transformed into key economic players,
accounting for a large share of the world‟s annual economic output, export trade, as well as global finance and
investments, in the manifestation of an emergent global economic order. The recovery of the BRICS economies
from the global economic crisis has equally transformed the countries into dynamic, middle-income economies,
with a huge potential to become a dominant group in the competitive and increasingly inter-dependent global
economy. However, the success story of the BRICS economies is not without its challenges. The countries still
face a variety of economic and social challenges undermining growth and stability. Indeed, economic growth in
BRICS has slowed considerably, particularly in the past few years. For example, in 2010, the size-weighted
average of the real GDP growth in the BRICS was 8.1% before slipping to a respectable 6.5% in 2011, while the average growth for 2012 is projected to below 5% and remain there through 2013, before picking up again
(Azzarello and Putnam, 2012.1). The slowdown is attributed to the lingering impact of the global economic
crisis on the European economies, as well as lack of leadership and market confidence coming from the aging
industrial economies.
Another serious challenge confronting the BRICS economies stems from their own structural
constraints, which undermine the capacity to withstand external shocks. For example, accelerating inflation in
these states are particularly problematic, driven by food and commodity prices and running above comfort level
of policy makers. In 2013, the level of inflation was measured at 6.2% in Brazil, 6.8% in Russia and 9.6% in
India and 2.6% in China. Consequently, the Central Banks in these countries have responded with the tightening
of monetary policy, which has triggered a rise in interest rates and moderating the pace of manufacturing
growth. As a result of this development, growth in the manufacturing sector has slowed in India, while the sector has contracted in China, Russia and Brazil (PWC, 2011.2).
Apart from structural difficulties in the BRICS economies, there are other challenges, particularly
unemployment, poverty and inequality, which threaten socio-economic development in these countries.
Unemployment has remained a lingering problem in the BRICS‟ economies, especially in urban areas. With
increasing industrialization and rapid economic growth associated with urbanization in BRICS, the trend has
become an attraction for migrants from rural areas who flock to the cities in search for better livelihoods.
However, the onslaught of the emergent global economic crisis has undermined growth in the manufacturing
sector, with dire consequences for employment opportunities. Slower growth against the backdrop of a
demographic explosion in urban centers has spawned poverty in the BRICS economies. Also, rural areas across
the BRICS economies often feature a dearth of social and physical infrastructure, including roads and
Exploring Inclusive Growth and Poverty Reduction Strategies in the Brics Economies: A ….
www.iosrjournals.org 58 | Page
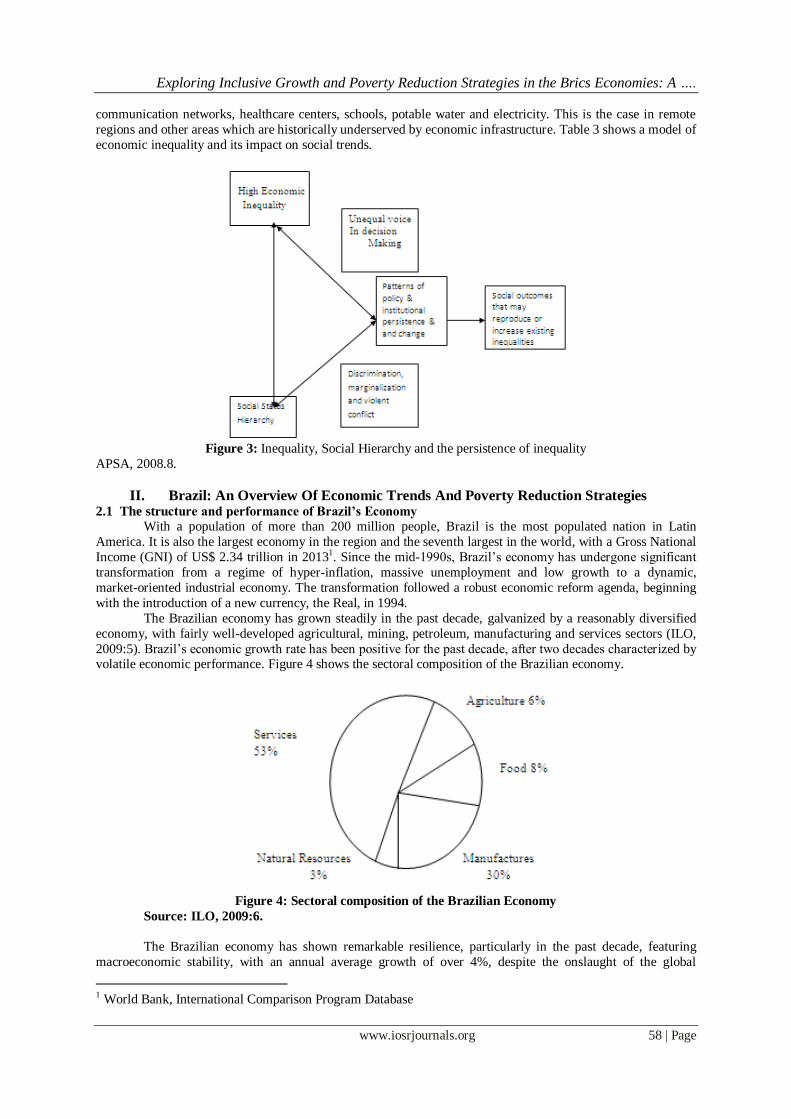
communication networks, healthcare centers, schools, potable water and electricity. This is the case in remote
regions and other areas which are historically underserved by economic infrastructure. Table 3 shows a model of
economic inequality and its impact on social trends.
Figure 3: Inequality, Social Hierarchy and the persistence of inequality
APSA, 2008.8.
II. Brazil: An Overview Of Economic Trends And Poverty Reduction Strategies 2.1 The structure and performance of Brazil’s Economy
With a population of more than 200 million people, Brazil is the most populated nation in Latin
America. It is also the largest economy in the region and the seventh largest in the world, with a Gross National
Income (GNI) of US$ 2.34 trillion in 20131. Since the mid-1990s, Brazil‟s economy has undergone significant
transformation from a regime of hyper-inflation, massive unemployment and low growth to a dynamic,
market-oriented industrial economy. The transformation followed a robust economic reform agenda, beginning
with the introduction of a new currency, the Real, in 1994.
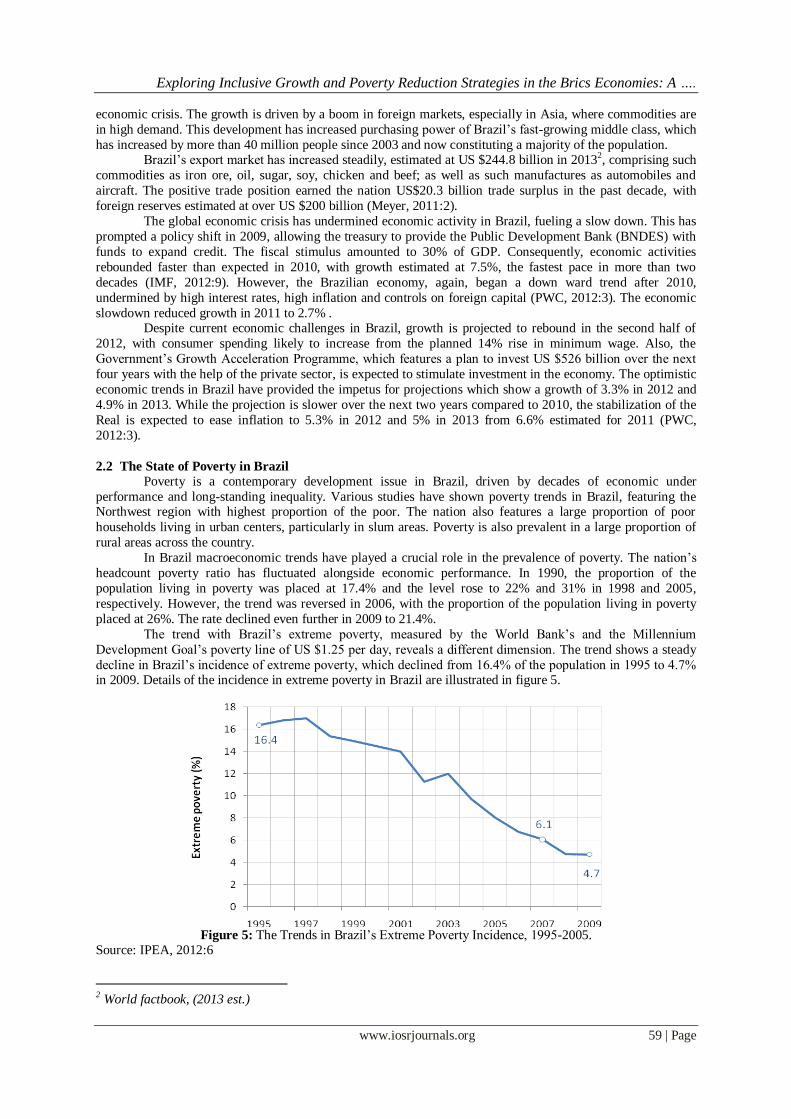
The Brazilian economy has grown steadily in the past decade, galvanized by a reasonably diversified
economy, with fairly well-developed agricultural, mining, petroleum, manufacturing and services sectors (ILO,
2009:5). Brazil‟s economic growth rate has been positive for the past decade, after two decades characterized by volatile economic performance. Figure 4 shows the sectoral composition of the Brazilian economy.
Figure 4: Sectoral composition of the Brazilian Economy
Source: ILO, 2009:6.
The Brazilian economy has shown remarkable resilience, particularly in the past decade, featuring
macroeconomic stability, with an annual average growth of over 4%, despite the onslaught of the global
1 World Bank, International Comparison Program Database
Exploring Inclusive Growth and Poverty Reduction Strategies in the Brics Economies: A ….
www.iosrjournals.org 59 | Page
economic crisis. The growth is driven by a boom in foreign markets, especially in Asia, where commodities are
in high demand. This development has increased purchasing power of Brazil‟s fast-growing middle class, which
has increased by more than 40 million people since 2003 and now constituting a majority of the population. Brazil‟s export market has increased steadily, estimated at US $244.8 billion in 20132, comprising such
commodities as iron ore, oil, sugar, soy, chicken and beef; as well as such manufactures as automobiles and
aircraft. The positive trade position earned the nation US$20.3 billion trade surplus in the past decade, with
foreign reserves estimated at over US $200 billion (Meyer, 2011:2).
The global economic crisis has undermined economic activity in Brazil, fueling a slow down. This has
prompted a policy shift in 2009, allowing the treasury to provide the Public Development Bank (BNDES) with
funds to expand credit. The fiscal stimulus amounted to 30% of GDP. Consequently, economic activities
rebounded faster than expected in 2010, with growth estimated at 7.5%, the fastest pace in more than two
decades (IMF, 2012:9). However, the Brazilian economy, again, began a down ward trend after 2010,
undermined by high interest rates, high inflation and controls on foreign capital (PWC, 2012:3). The economic
slowdown reduced growth in 2011 to 2.7% . Despite current economic challenges in Brazil, growth is projected to rebound in the second half of
2012, with consumer spending likely to increase from the planned 14% rise in minimum wage. Also, the
Government‟s Growth Acceleration Programme, which features a plan to invest US $526 billion over the next
four years with the help of the private sector, is expected to stimulate investment in the economy. The optimistic
economic trends in Brazil have provided the impetus for projections which show a growth of 3.3% in 2012 and
4.9% in 2013. While the projection is slower over the next two years compared to 2010, the stabilization of the
Real is expected to ease inflation to 5.3% in 2012 and 5% in 2013 from 6.6% estimated for 2011 (PWC,
2012:3).
2.2 The State of Poverty in Brazil
Poverty is a contemporary development issue in Brazil, driven by decades of economic under
performance and long-standing inequality. Various studies have shown poverty trends in Brazil, featuring the Northwest region with highest proportion of the poor. The nation also features a large proportion of poor
households living in urban centers, particularly in slum areas. Poverty is also prevalent in a large proportion of
rural areas across the country.
In Brazil macroeconomic trends have played a crucial role in the prevalence of poverty. The nation‟s
headcount poverty ratio has fluctuated alongside economic performance. In 1990, the proportion of the
population living in poverty was placed at 17.4% and the level rose to 22% and 31% in 1998 and 2005,
respectively. However, the trend was reversed in 2006, with the proportion of the population living in poverty
placed at 26%. The rate declined even further in 2009 to 21.4%.
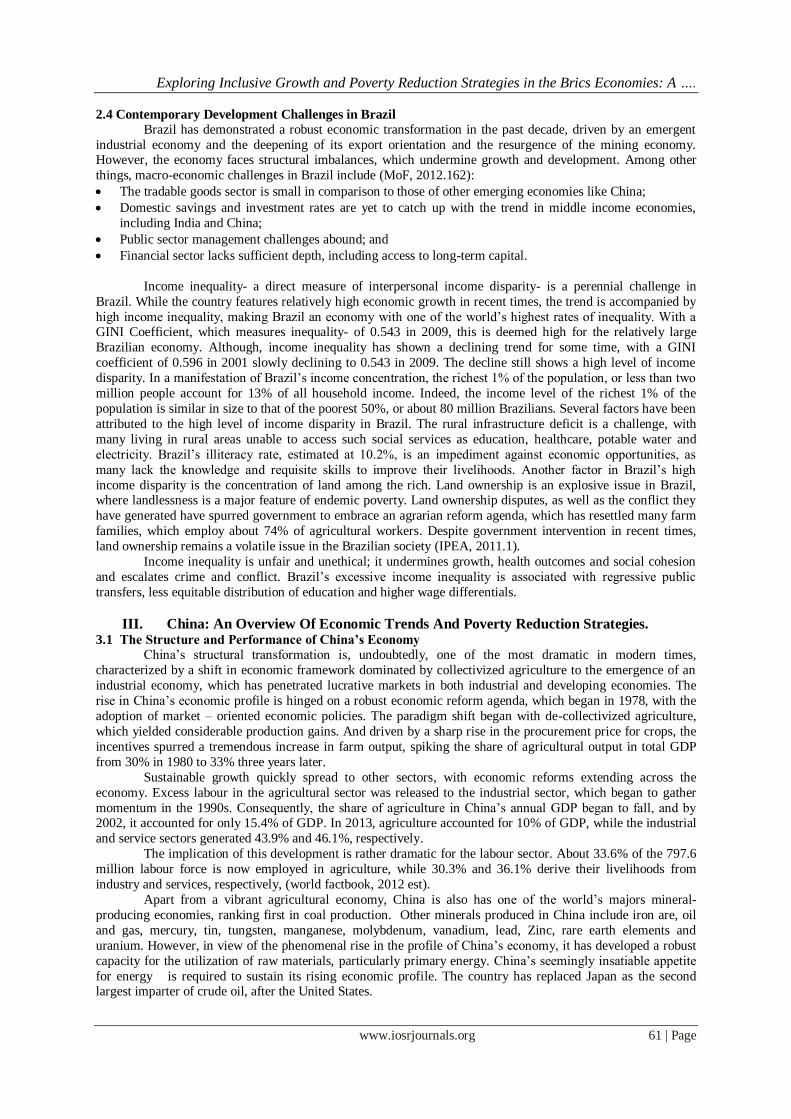
The trend with Brazil‟s extreme poverty, measured by the World Bank‟s and the Millennium
Development Goal‟s poverty line of US $1.25 per day, reveals a different dimension. The trend shows a steady
decline in Brazil‟s incidence of extreme poverty, which declined from 16.4% of the population in 1995 to 4.7% in 2009. Details of the incidence in extreme poverty in Brazil are illustrated in figure 5.
Figure 5: The Trends in Brazil‟s Extreme Poverty Incidence, 1995-2005.
Source: IPEA, 2012:6
2 World factbook, (2013 est.)

Exploring Inclusive Growth and Poverty Reduction Strategies in the Brics Economies: A ….
www.iosrjournals.org 60 | Page
Figure 4 shows a sustained decline in Brazil‟s extreme poverty incidence, which dates back to the mid-
1990s. The momentum surged by the mid-2000s as economic recovery combined with a decline in income
inequality. The development allowed Brazil to achieve its own Millennium Development Goal, which aims to reduce poverty to one quarter of its level in 1990 by 2015 (IPEA, 2012:6).
2.3 Poverty Reduction Strategies in Brazil The recent decline in Brazil‟s headcount poverty ratio is a manifestation of sustained poverty reduction
strategies targeting pertinent issues critical to poverty and inequality. Policy makers have targeted four
intervention areas: public education, minimum wage, social security pensions and social assistance transfers.
The intervention in these areas consumed 16% of GDP or almost 50% of total revenues in 2006, as depicted in
Table 2.
Table 2: Selected Government Expenditures (% of GDP) – Brazil, 2006.
Expenditures Share of GDP (%) Public education 3.8
Social security and pensions 11.1
Private sector 6.8
Civil servants 4.3
Social Assistance cash transfers 0.8
Beneficio de Prestacao Continuada 0.4
Programma Bolsa Familia (PBF) 0.4
Total 15.7
Total tax revenue 34.1
Source: IPEA, 2012:8.
Government intervention in the education sector was rather extensive, given the low level of education and an extremely uneven distribution of educational opportunities favouring the upper-middle class and the rich.
Indeed, the latter half of the 20th century in Brazil was characterized by very limited access to education,
particularly in the north and north east regions, while government was generous in the funding and provision of
free public post-secondary education. Government has also embraced considerable education reform with the
adoption of the 1988 constitution. This comprises an intensive funding of primary and secondary education.
Public expenditure on education, which accounted for only 2.7% of GDP in 1980, has increased significantly
since the mid-1990s, hovering around 4.5%. The result is dramatic, with school attendance for children between
7 and 14 years old-which is mandatory-becoming nearly universal by the late 1990s.
Government has viewed minimum wage as critical in addressing both poverty and inequality and
moved to provide regulatory mechanisms to enforce it. Although the Federal Minimum Wage law was first
enacted in the late 1930s and a unified national minimum wage established in 1984, there was no provision for effecting minimum wage adjustments , which were only granted at the President‟s discretion. Consequently, the
real value of minimum wage has fluctuated considerably. The emergent reform has brought the level of workers
who benefit from minimum wage to 9 million in 2009, adding up to about 11% to the employed lab our force.
Also, more than 13 million people, or 60% of all pensioners, had retirement benefits equal to the minimum
wage and another 1.5 million benefitted from social assistance paid to the poor over 65 years of age or with a
disability that is also tied to the minimum wage.
Brazil has a long history in the administration of social security, dating back to the 19th century. The
system however became a state-run initiative in 1960 and was separated from the health sector only after the
adoption of the 1988 constitution. The system comprises two main branches: one for private sector workers and
the other for civil servants. It features a mandatory „pay-as-you-go‟ mechanism that brings benefits to formal
workers. Since the adoption of the 1988 constitution, the private sector arm has expanded considerably. For
example, the so-called „Rural social security‟, which is almost non-contributory, comprises mostly farmers and poor rural workers. Participation in the scheme grew from 4 million monthly benefits in 1991 to 7 million in
2003, a 75% rise in the first 12 years. This development has assisted in reducing income inequality and rural
poverty. Also, social assistance is a major form of income redistribution in Brazil critical to poverty reduction.
The system of social assistance in Brazil consists of two elements: provision of service and targeted cash
transfers. While the former remains in an infancy stage, with little activity; the latter has developed into an
elaborate initiative, particularly since the mid-1990s. There are two Federal programmes: the continuous cash
benefit and family benefit programme. In the former, the unconditional cash transfer is targeted at families with
per capita income that is one quarter below the minimum wage and who belong to one of two groups:
individuals of any age with severe disabilities or the elderly aged 65 years or more. The family benefit
programme is not an entitlement, as the number of beneficiaries depends on budget constraints.
Exploring Inclusive Growth and Poverty Reduction Strategies in the Brics Economies: A ….
www.iosrjournals.org 61 | Page
2.4 Contemporary Development Challenges in Brazil
Brazil has demonstrated a robust economic transformation in the past decade, driven by an emergent
industrial economy and the deepening of its export orientation and the resurgence of the mining economy. However, the economy faces structural imbalances, which undermine growth and development. Among other
things, macro-economic challenges in Brazil include (MoF, 2012.162):
The tradable goods sector is small in comparison to those of other emerging economies like China;
Domestic savings and investment rates are yet to catch up with the trend in middle income economies,
including India and China;
Public sector management challenges abound; and
Financial sector lacks sufficient depth, including access to long-term capital.
Income inequality- a direct measure of interpersonal income disparity- is a perennial challenge in
Brazil. While the country features relatively high economic growth in recent times, the trend is accompanied by
high income inequality, making Brazil an economy with one of the world‟s highest rates of inequality. With a GINI Coefficient, which measures inequality- of 0.543 in 2009, this is deemed high for the relatively large
Brazilian economy. Although, income inequality has shown a declining trend for some time, with a GINI
coefficient of 0.596 in 2001 slowly declining to 0.543 in 2009. The decline still shows a high level of income
disparity. In a manifestation of Brazil‟s income concentration, the richest 1% of the population, or less than two
million people account for 13% of all household income. Indeed, the income level of the richest 1% of the
population is similar in size to that of the poorest 50%, or about 80 million Brazilians. Several factors have been
attributed to the high level of income disparity in Brazil. The rural infrastructure deficit is a challenge, with
many living in rural areas unable to access such social services as education, healthcare, potable water and
electricity. Brazil‟s illiteracy rate, estimated at 10.2%, is an impediment against economic opportunities, as
many lack the knowledge and requisite skills to improve their livelihoods. Another factor in Brazil‟s high
income disparity is the concentration of land among the rich. Land ownership is an explosive issue in Brazil, where landlessness is a major feature of endemic poverty. Land ownership disputes, as well as the conflict they
have generated have spurred government to embrace an agrarian reform agenda, which has resettled many farm
families, which employ about 74% of agricultural workers. Despite government intervention in recent times,
land ownership remains a volatile issue in the Brazilian society (IPEA, 2011.1).
Income inequality is unfair and unethical; it undermines growth, health outcomes and social cohesion
and escalates crime and conflict. Brazil‟s excessive income inequality is associated with regressive public
transfers, less equitable distribution of education and higher wage differentials.
III. China: An Overview Of Economic Trends And Poverty Reduction Strategies. 3.1 The Structure and Performance of China’s Economy
China‟s structural transformation is, undoubtedly, one of the most dramatic in modern times,
characterized by a shift in economic framework dominated by collectivized agriculture to the emergence of an
industrial economy, which has penetrated lucrative markets in both industrial and developing economies. The
rise in China‟s economic profile is hinged on a robust economic reform agenda, which began in 1978, with the
adoption of market – oriented economic policies. The paradigm shift began with de-collectivized agriculture,
which yielded considerable production gains. And driven by a sharp rise in the procurement price for crops, the
incentives spurred a tremendous increase in farm output, spiking the share of agricultural output in total GDP
from 30% in 1980 to 33% three years later.
Sustainable growth quickly spread to other sectors, with economic reforms extending across the
economy. Excess labour in the agricultural sector was released to the industrial sector, which began to gather
momentum in the 1990s. Consequently, the share of agriculture in China‟s annual GDP began to fall, and by 2002, it accounted for only 15.4% of GDP. In 2013, agriculture accounted for 10% of GDP, while the industrial
and service sectors generated 43.9% and 46.1%, respectively.
The implication of this development is rather dramatic for the labour sector. About 33.6% of the 797.6
million labour force is now employed in agriculture, while 30.3% and 36.1% derive their livelihoods from
industry and services, respectively, (world factbook, 2012 est).
Apart from a vibrant agricultural economy, China is also has one of the world‟s majors mineral-
producing economies, ranking first in coal production. Other minerals produced in China include iron are, oil
and gas, mercury, tin, tungsten, manganese, molybdenum, vanadium, lead, Zinc, rare earth elements and
uranium. However, in view of the phenomenal rise in the profile of China‟s economy, it has developed a robust
capacity for the utilization of raw materials, particularly primary energy. China‟s seemingly insatiable appetite
for energy is required to sustain its rising economic profile. The country has replaced Japan as the second largest imparter of crude oil, after the United States.
Exploring Inclusive Growth and Poverty Reduction Strategies in the Brics Economies: A ….
www.iosrjournals.org 62 | Page
China‟s contemporary economic profile features a rapidly expanding production output, averaging 10%
per annum over the past three decades. China‟s rapid growth has propelled its economy to become the second
largest in the world, after the United States. The nation‟s economic transformation was accompanied by a rapid increase in output in the 1990s, bringing average annual increase in GDP to 9.5%. While the Asian financial
crisis in the 1990s undermined China‟s economy at the margin, mainly through a reduction in foreign direct
investment, and a sharp drop in the growth of its export; the nation‟s huge reserves and capital inflows insulated
it from the regional crisis and provided the impetus for a resurgence.
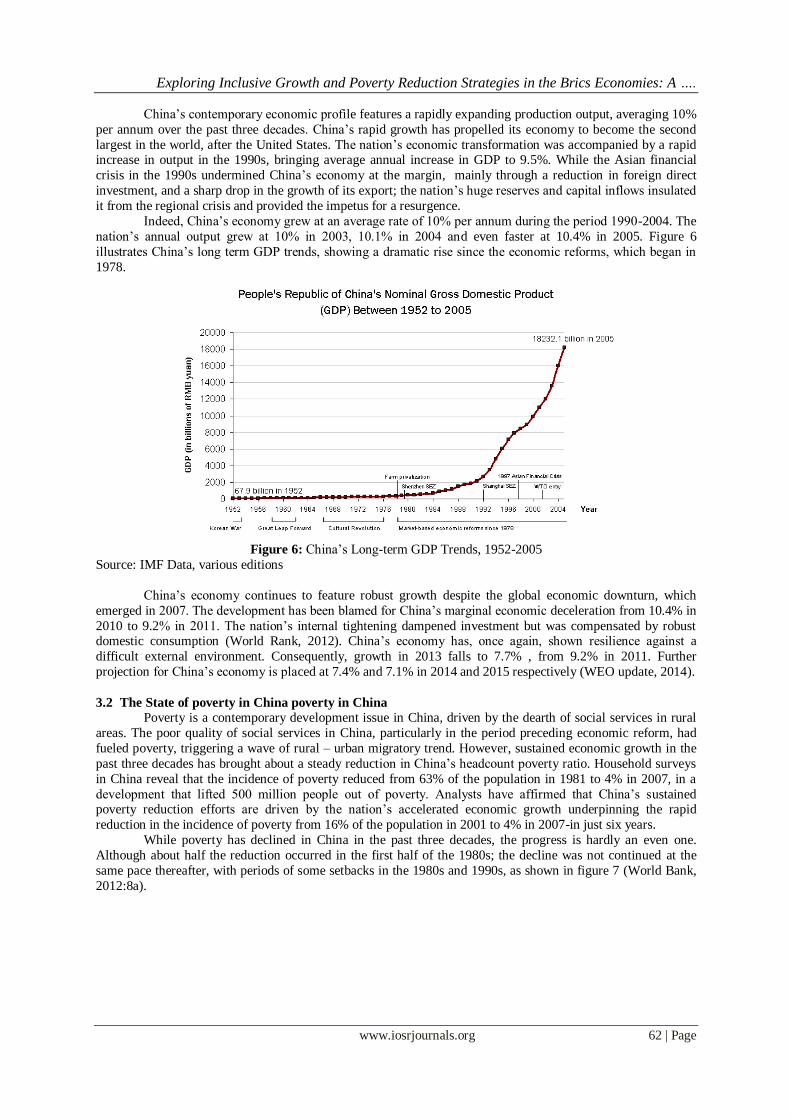
Indeed, China‟s economy grew at an average rate of 10% per annum during the period 1990-2004. The
nation‟s annual output grew at 10% in 2003, 10.1% in 2004 and even faster at 10.4% in 2005. Figure 6
illustrates China‟s long term GDP trends, showing a dramatic rise since the economic reforms, which began in
1978.
Figure 6: China‟s Long-term GDP Trends, 1952-2005
Source: IMF Data, various editions
China‟s economy continues to feature robust growth despite the global economic downturn, which
emerged in 2007. The development has been blamed for China‟s marginal economic deceleration from 10.4% in
2010 to 9.2% in 2011. The nation‟s internal tightening dampened investment but was compensated by robust domestic consumption (World Rank, 2012). China‟s economy has, once again, shown resilience against a
difficult external environment. Consequently, growth in 2013 falls to 7.7% , from 9.2% in 2011. Further
projection for China‟s economy is placed at 7.4% and 7.1% in 2014 and 2015 respectively (WEO update, 2014).
3.2 The State of poverty in China poverty in China
Poverty is a contemporary development issue in China, driven by the dearth of social services in rural
areas. The poor quality of social services in China, particularly in the period preceding economic reform, had
fueled poverty, triggering a wave of rural – urban migratory trend. However, sustained economic growth in the
past three decades has brought about a steady reduction in China‟s headcount poverty ratio. Household surveys
in China reveal that the incidence of poverty reduced from 63% of the population in 1981 to 4% in 2007, in a
development that lifted 500 million people out of poverty. Analysts have affirmed that China‟s sustained poverty reduction efforts are driven by the nation‟s accelerated economic growth underpinning the rapid
reduction in the incidence of poverty from 16% of the population in 2001 to 4% in 2007-in just six years.
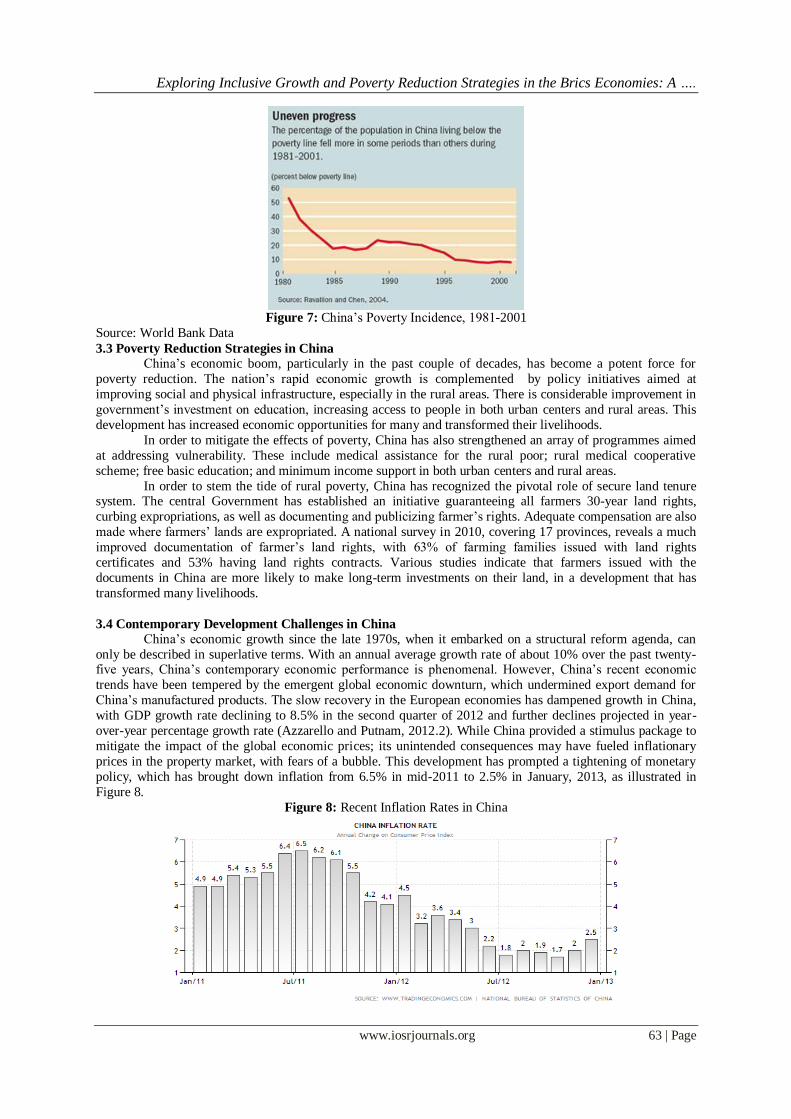
While poverty has declined in China in the past three decades, the progress is hardly an even one.
Although about half the reduction occurred in the first half of the 1980s; the decline was not continued at the
same pace thereafter, with periods of some setbacks in the 1980s and 1990s, as shown in figure 7 (World Bank,
2012:8a).
Exploring Inclusive Growth and Poverty Reduction Strategies in the Brics Economies: A ….
www.iosrjournals.org 63 | Page
Figure 7: China‟s Poverty Incidence, 1981-2001
Source: World Bank Data
3.3 Poverty Reduction Strategies in China
China‟s economic boom, particularly in the past couple of decades, has become a potent force for
poverty reduction. The nation‟s rapid economic growth is complemented by policy initiatives aimed at
improving social and physical infrastructure, especially in the rural areas. There is considerable improvement in
government‟s investment on education, increasing access to people in both urban centers and rural areas. This
development has increased economic opportunities for many and transformed their livelihoods.
In order to mitigate the effects of poverty, China has also strengthened an array of programmes aimed
at addressing vulnerability. These include medical assistance for the rural poor; rural medical cooperative
scheme; free basic education; and minimum income support in both urban centers and rural areas.
In order to stem the tide of rural poverty, China has recognized the pivotal role of secure land tenure system. The central Government has established an initiative guaranteeing all farmers 30-year land rights,
curbing expropriations, as well as documenting and publicizing farmer‟s rights. Adequate compensation are also
made where farmers‟ lands are expropriated. A national survey in 2010, covering 17 provinces, reveals a much
improved documentation of farmer‟s land rights, with 63% of farming families issued with land rights
certificates and 53% having land rights contracts. Various studies indicate that farmers issued with the
documents in China are more likely to make long-term investments on their land, in a development that has
transformed many livelihoods.
3.4 Contemporary Development Challenges in China
China‟s economic growth since the late 1970s, when it embarked on a structural reform agenda, can
only be described in superlative terms. With an annual average growth rate of about 10% over the past twenty-five years, China‟s contemporary economic performance is phenomenal. However, China‟s recent economic
trends have been tempered by the emergent global economic downturn, which undermined export demand for
China‟s manufactured products. The slow recovery in the European economies has dampened growth in China,
with GDP growth rate declining to 8.5% in the second quarter of 2012 and further declines projected in year-
over-year percentage growth rate (Azzarello and Putnam, 2012.2). While China provided a stimulus package to
mitigate the impact of the global economic prices; its unintended consequences may have fueled inflationary
prices in the property market, with fears of a bubble. This development has prompted a tightening of monetary
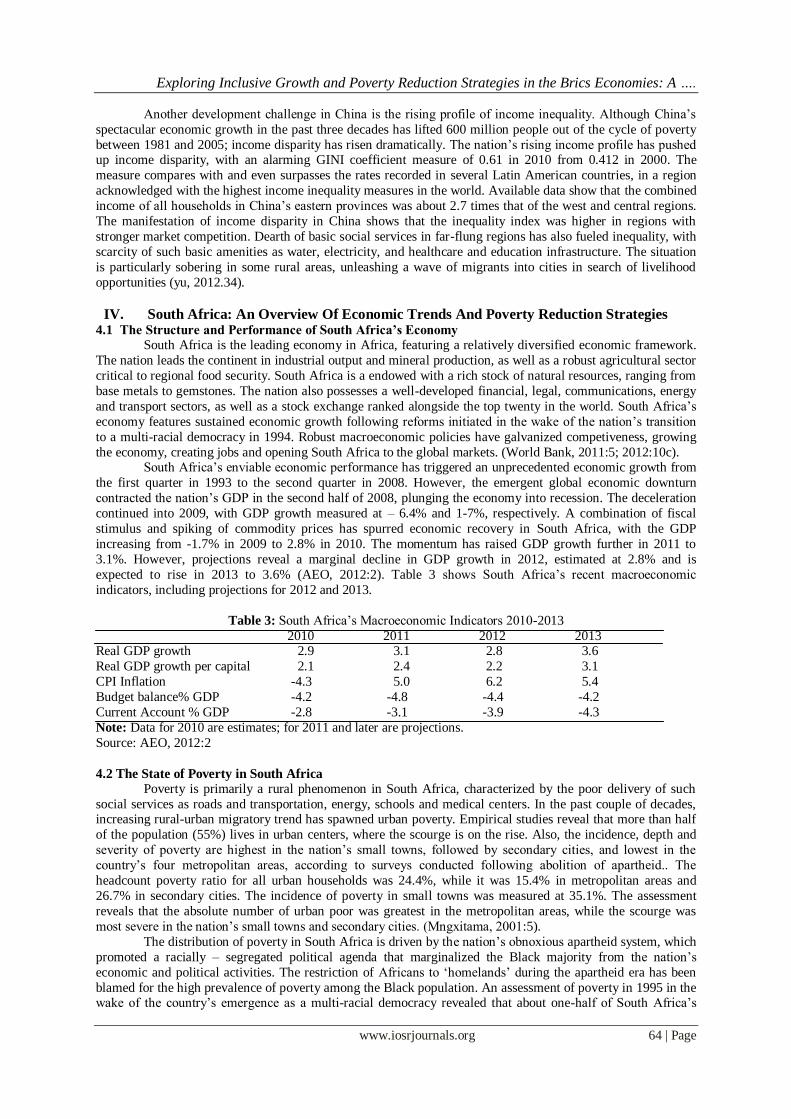
policy, which has brought down inflation from 6.5% in mid-2011 to 2.5% in January, 2013, as illustrated in
Figure 8.
Figure 8: Recent Inflation Rates in China
Exploring Inclusive Growth and Poverty Reduction Strategies in the Brics Economies: A ….
www.iosrjournals.org 64 | Page
Another development challenge in China is the rising profile of income inequality. Although China‟s
spectacular economic growth in the past three decades has lifted 600 million people out of the cycle of poverty
between 1981 and 2005; income disparity has risen dramatically. The nation‟s rising income profile has pushed up income disparity, with an alarming GINI coefficient measure of 0.61 in 2010 from 0.412 in 2000. The
measure compares with and even surpasses the rates recorded in several Latin American countries, in a region
acknowledged with the highest income inequality measures in the world. Available data show that the combined
income of all households in China‟s eastern provinces was about 2.7 times that of the west and central regions.
The manifestation of income disparity in China shows that the inequality index was higher in regions with
stronger market competition. Dearth of basic social services in far-flung regions has also fueled inequality, with
scarcity of such basic amenities as water, electricity, and healthcare and education infrastructure. The situation
is particularly sobering in some rural areas, unleashing a wave of migrants into cities in search of livelihood
opportunities (yu, 2012.34).
IV. South Africa: An Overview Of Economic Trends And Poverty Reduction Strategies 4.1 The Structure and Performance of South Africa’s Economy
South Africa is the leading economy in Africa, featuring a relatively diversified economic framework.
The nation leads the continent in industrial output and mineral production, as well as a robust agricultural sector
critical to regional food security. South Africa is a endowed with a rich stock of natural resources, ranging from
base metals to gemstones. The nation also possesses a well-developed financial, legal, communications, energy
and transport sectors, as well as a stock exchange ranked alongside the top twenty in the world. South Africa‟s
economy features sustained economic growth following reforms initiated in the wake of the nation‟s transition
to a multi-racial democracy in 1994. Robust macroeconomic policies have galvanized competiveness, growing
the economy, creating jobs and opening South Africa to the global markets. (World Bank, 2011:5; 2012:10c). South Africa‟s enviable economic performance has triggered an unprecedented economic growth from
the first quarter in 1993 to the second quarter in 2008. However, the emergent global economic downturn
contracted the nation‟s GDP in the second half of 2008, plunging the economy into recession. The deceleration
continued into 2009, with GDP growth measured at – 6.4% and 1-7%, respectively. A combination of fiscal
stimulus and spiking of commodity prices has spurred economic recovery in South Africa, with the GDP
increasing from -1.7% in 2009 to 2.8% in 2010. The momentum has raised GDP growth further in 2011 to
3.1%. However, projections reveal a marginal decline in GDP growth in 2012, estimated at 2.8% and is
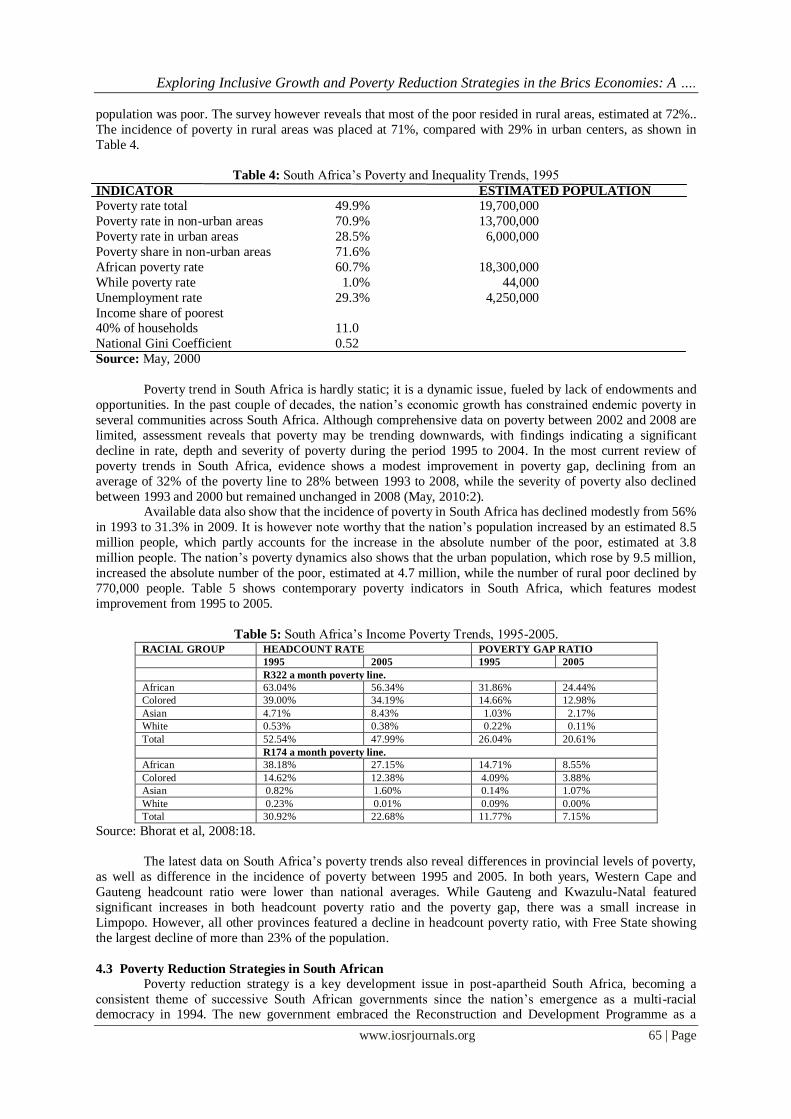
expected to rise in 2013 to 3.6% (AEO, 2012:2). Table 3 shows South Africa‟s recent macroeconomic
indicators, including projections for 2012 and 2013.
Table 3: South Africa‟s Macroeconomic Indicators 2010-2013
2010 2011 2012 2013 Real GDP growth 2.9 3.1 2.8 3.6
Real GDP growth per capital 2.1 2.4 2.2 3.1
CPI Inflation -4.3 5.0 6.2 5.4
Budget balance% GDP -4.2 -4.8 -4.4 -4.2
Current Account % GDP -2.8 -3.1 -3.9 -4.3
Note: Data for 2010 are estimates; for 2011 and later are projections.
Source: AEO, 2012:2
4.2 The State of Poverty in South Africa
Poverty is primarily a rural phenomenon in South Africa, characterized by the poor delivery of such
social services as roads and transportation, energy, schools and medical centers. In the past couple of decades, increasing rural-urban migratory trend has spawned urban poverty. Empirical studies reveal that more than half
of the population (55%) lives in urban centers, where the scourge is on the rise. Also, the incidence, depth and
severity of poverty are highest in the nation‟s small towns, followed by secondary cities, and lowest in the
country‟s four metropolitan areas, according to surveys conducted following abolition of apartheid.. The
headcount poverty ratio for all urban households was 24.4%, while it was 15.4% in metropolitan areas and
26.7% in secondary cities. The incidence of poverty in small towns was measured at 35.1%. The assessment
reveals that the absolute number of urban poor was greatest in the metropolitan areas, while the scourge was
most severe in the nation‟s small towns and secondary cities. (Mngxitama, 2001:5).
The distribution of poverty in South Africa is driven by the nation‟s obnoxious apartheid system, which
promoted a racially – segregated political agenda that marginalized the Black majority from the nation‟s
economic and political activities. The restriction of Africans to „homelands‟ during the apartheid era has been
blamed for the high prevalence of poverty among the Black population. An assessment of poverty in 1995 in the wake of the country‟s emergence as a multi-racial democracy revealed that about one-half of South Africa‟s
Exploring Inclusive Growth and Poverty Reduction Strategies in the Brics Economies: A ….
www.iosrjournals.org 65 | Page
population was poor. The survey however reveals that most of the poor resided in rural areas, estimated at 72%..
The incidence of poverty in rural areas was placed at 71%, compared with 29% in urban centers, as shown in
Table 4.
Table 4: South Africa‟s Poverty and Inequality Trends, 1995
INDICATOR ESTIMATED POPULATION
Poverty rate total 49.9% 19,700,000
Poverty rate in non-urban areas 70.9% 13,700,000
Poverty rate in urban areas 28.5% 6,000,000
Poverty share in non-urban areas 71.6%
African poverty rate 60.7% 18,300,000
While poverty rate 1.0% 44,000
Unemployment rate 29.3% 4,250,000
Income share of poorest 40% of households 11.0
National Gini Coefficient 0.52
Source: May, 2000
Poverty trend in South Africa is hardly static; it is a dynamic issue, fueled by lack of endowments and
opportunities. In the past couple of decades, the nation‟s economic growth has constrained endemic poverty in
several communities across South Africa. Although comprehensive data on poverty between 2002 and 2008 are
limited, assessment reveals that poverty may be trending downwards, with findings indicating a significant
decline in rate, depth and severity of poverty during the period 1995 to 2004. In the most current review of
poverty trends in South Africa, evidence shows a modest improvement in poverty gap, declining from an
average of 32% of the poverty line to 28% between 1993 to 2008, while the severity of poverty also declined
between 1993 and 2000 but remained unchanged in 2008 (May, 2010:2). Available data also show that the incidence of poverty in South Africa has declined modestly from 56%
in 1993 to 31.3% in 2009. It is however note worthy that the nation‟s population increased by an estimated 8.5
million people, which partly accounts for the increase in the absolute number of the poor, estimated at 3.8
million people. The nation‟s poverty dynamics also shows that the urban population, which rose by 9.5 million,
increased the absolute number of the poor, estimated at 4.7 million, while the number of rural poor declined by
770,000 people. Table 5 shows contemporary poverty indicators in South Africa, which features modest
improvement from 1995 to 2005.
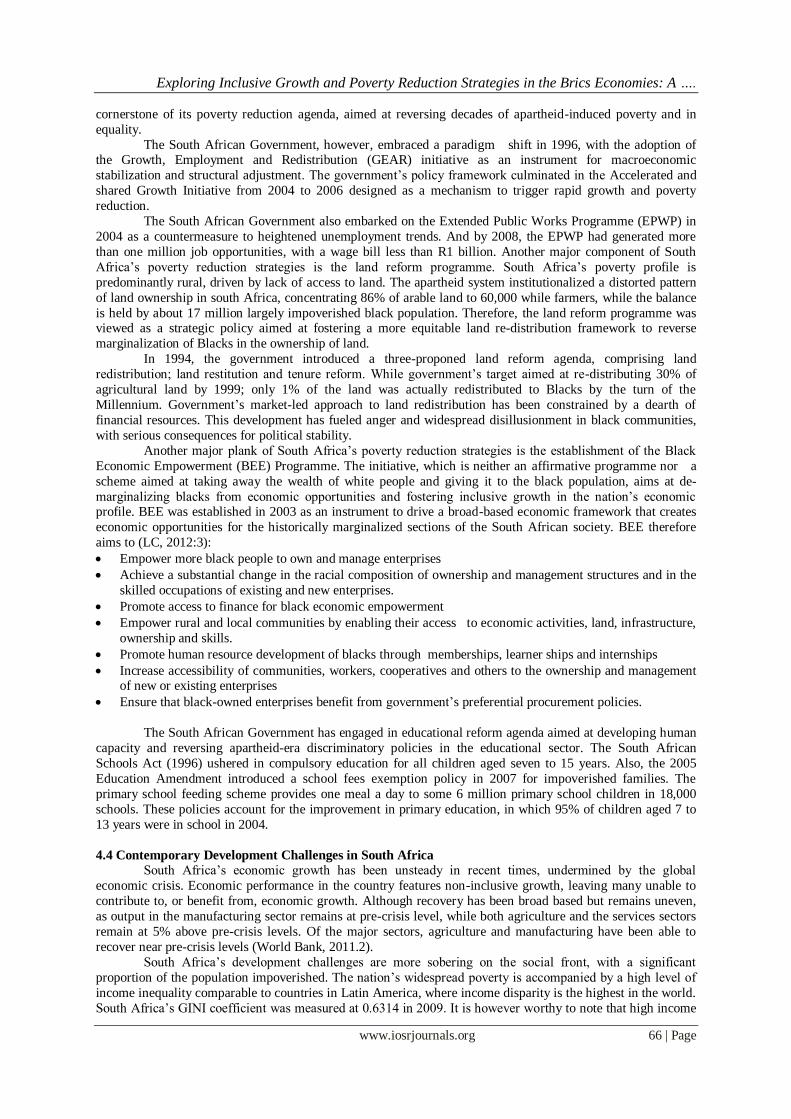
Table 5: South Africa‟s Income Poverty Trends, 1995-2005. RACIAL GROUP HEADCOUNT RATE POVERTY GAP RATIO
1995 2005 1995 2005
R322 a month poverty line.
African 63.04% 56.34% 31.86% 24.44%
Colored 39.00% 34.19% 14.66% 12.98%
Asian 4.71% 8.43% 1.03% 2.17%
White 0.53% 0.38% 0.22% 0.11%
Total 52.54% 47.99% 26.04% 20.61%
R174 a month poverty line.
African 38.18% 27.15% 14.71% 8.55%
Colored 14.62% 12.38% 4.09% 3.88%
Asian 0.82% 1.60% 0.14% 1.07%
White 0.23% 0.01% 0.09% 0.00%
Total 30.92% 22.68% 11.77% 7.15%
Source: Bhorat et al, 2008:18.
The latest data on South Africa‟s poverty trends also reveal differences in provincial levels of poverty,
as well as difference in the incidence of poverty between 1995 and 2005. In both years, Western Cape and
Gauteng headcount ratio were lower than national averages. While Gauteng and Kwazulu-Natal featured
significant increases in both headcount poverty ratio and the poverty gap, there was a small increase in
Limpopo. However, all other provinces featured a decline in headcount poverty ratio, with Free State showing
the largest decline of more than 23% of the population.
4.3 Poverty Reduction Strategies in South African
Poverty reduction strategy is a key development issue in post-apartheid South Africa, becoming a
consistent theme of successive South African governments since the nation‟s emergence as a multi-racial democracy in 1994. The new government embraced the Reconstruction and Development Programme as a
Exploring Inclusive Growth and Poverty Reduction Strategies in the Brics Economies: A ….
www.iosrjournals.org 66 | Page
cornerstone of its poverty reduction agenda, aimed at reversing decades of apartheid-induced poverty and in
equality.
The South African Government, however, embraced a paradigm shift in 1996, with the adoption of the Growth, Employment and Redistribution (GEAR) initiative as an instrument for macroeconomic
stabilization and structural adjustment. The government‟s policy framework culminated in the Accelerated and
shared Growth Initiative from 2004 to 2006 designed as a mechanism to trigger rapid growth and poverty
reduction.
The South African Government also embarked on the Extended Public Works Programme (EPWP) in
2004 as a countermeasure to heightened unemployment trends. And by 2008, the EPWP had generated more
than one million job opportunities, with a wage bill less than R1 billion. Another major component of South
Africa‟s poverty reduction strategies is the land reform programme. South Africa‟s poverty profile is
predominantly rural, driven by lack of access to land. The apartheid system institutionalized a distorted pattern
of land ownership in south Africa, concentrating 86% of arable land to 60,000 while farmers, while the balance
is held by about 17 million largely impoverished black population. Therefore, the land reform programme was viewed as a strategic policy aimed at fostering a more equitable land re-distribution framework to reverse
marginalization of Blacks in the ownership of land.
In 1994, the government introduced a three-proponed land reform agenda, comprising land
redistribution; land restitution and tenure reform. While government‟s target aimed at re-distributing 30% of
agricultural land by 1999; only 1% of the land was actually redistributed to Blacks by the turn of the
Millennium. Government‟s market-led approach to land redistribution has been constrained by a dearth of
financial resources. This development has fueled anger and widespread disillusionment in black communities,
with serious consequences for political stability.
Another major plank of South Africa‟s poverty reduction strategies is the establishment of the Black
Economic Empowerment (BEE) Programme. The initiative, which is neither an affirmative programme nor a
scheme aimed at taking away the wealth of white people and giving it to the black population, aims at de-
marginalizing blacks from economic opportunities and fostering inclusive growth in the nation‟s economic profile. BEE was established in 2003 as an instrument to drive a broad-based economic framework that creates
economic opportunities for the historically marginalized sections of the South African society. BEE therefore
aims to (LC, 2012:3):
Empower more black people to own and manage enterprises
Achieve a substantial change in the racial composition of ownership and management structures and in the
skilled occupations of existing and new enterprises.
Promote access to finance for black economic empowerment
Empower rural and local communities by enabling their access to economic activities, land, infrastructure,
ownership and skills.
Promote human resource development of blacks through memberships, learner ships and internships
Increase accessibility of communities, workers, cooperatives and others to the ownership and management of new or existing enterprises
Ensure that black-owned enterprises benefit from government‟s preferential procurement policies.
The South African Government has engaged in educational reform agenda aimed at developing human
capacity and reversing apartheid-era discriminatory policies in the educational sector. The South African
Schools Act (1996) ushered in compulsory education for all children aged seven to 15 years. Also, the 2005
Education Amendment introduced a school fees exemption policy in 2007 for impoverished families. The
primary school feeding scheme provides one meal a day to some 6 million primary school children in 18,000
schools. These policies account for the improvement in primary education, in which 95% of children aged 7 to
13 years were in school in 2004.
4.4 Contemporary Development Challenges in South Africa
South Africa‟s economic growth has been unsteady in recent times, undermined by the global
economic crisis. Economic performance in the country features non-inclusive growth, leaving many unable to
contribute to, or benefit from, economic growth. Although recovery has been broad based but remains uneven,
as output in the manufacturing sector remains at pre-crisis level, while both agriculture and the services sectors
remain at 5% above pre-crisis levels. Of the major sectors, agriculture and manufacturing have been able to
recover near pre-crisis levels (World Bank, 2011.2).
South Africa‟s development challenges are more sobering on the social front, with a significant
proportion of the population impoverished. The nation‟s widespread poverty is accompanied by a high level of
income inequality comparable to countries in Latin America, where income disparity is the highest in the world.
South Africa‟s GINI coefficient was measured at 0.6314 in 2009. It is however worthy to note that high income
Exploring Inclusive Growth and Poverty Reduction Strategies in the Brics Economies: A ….
www.iosrjournals.org 67 | Page
disparity is a feature of South African economy blamed on the twin legacy of colonialism and apartheid. The
perennial discrimination against Black people until the emergence of multi-racial democracy in the 1990s has
exerted a huge toll on the dignity of Black Africans, undermining their prospects for economic opportunities and better livelihoods. Inequality has also been spawned by the uneven distribution of social amenities between
rural and urban communities. The supply of such social services as potable water, electricity, roads, as well as
schools and health centers has been poor in rural areas, leaving many deeply impoverished and lacking in
opportunities to better their livelihoods. This development has caused high levels of illiteracy, mortality and
morbidity rates associated with such endemic diseases as HIV/AIDS, cholera, tuberculosis and typhoid. Income
inequality has also been exacerbated in South Africa by the concentration of land in the hands of a few
thousands white farmers, who own more than 80% of arable land. On the other hand, the Black majority are left
with mostly land with poor quality and generally unable to support their livelihoods. The land question remains
a divisive issue in South Africa, prompting government to embark upon a land reform agenda since the 1990s.
The initiative has largely stalled by lack of resources to transfer arable lands from rich white farmers to poor
Blacks, who are desperate for it.
V. Recommendation And Conclusion 5.1 Recommendations
This section provides pertinent recommendation critical to fostering inclusive growth and poverty reduction in
the developing world. The recommendations are relevant to the transformation of BRICS economies, as well as
other middle or low-income countries seeking a pathway to inclusive growth and sustainable poverty reduction.
They include the following:
Deepen Economies Reform: Economic reform agenda is critical to inclusive growth and poverty
reduction. Continuing reforms in BRICS and other emerging economies need to be deepened to allow benefits from economic re-structuring to facilitate a broad-based growth, accompanied by benefits to the
poor.
Attract foreign Direct Investment: Emerging economies need a robust inflow of foreign direct
investments (FDI) to galvanize economic growth and stimulate competitiveness, which are necessary to
foster integration into the global economy. Also, FDIs are usually accompanied by novel technologies and
management expertise that reinforce economic transformation.
Explore Lucrative Foreign Markets: The emergence of middle-income economies has been sustained by
economic re-orientation, characterized by increasing participation in the global economy. Policy makers in
the developing world should steer their economies on a pathway that can take advantage of lucrative
markets in both industrial and emerging economies to generate more national income and foreign exchange
earnings.
Diversify the Economy: In order to deepen economic transformation critical to inclusive growth and
poverty reduction, policy makers in middle-or low-income countries need to diversity their economies away
from reliance on primary commodities. These nations should fast-track an industrialization agenda that adds
value to commodities, creating manufactured products for both domestic and foreign markets
Develop social and physical Infrastructure: An elaborate physical and social infrastructure is critical to
sustaining economic growth and poverty reduction. Policy makers should endeavor to provide such social
services as education and health infrastructure, particularly in rural areas where most of the population live
in the developing world. These services should be complemented by an efficient and reliable
communication and transpiration infrastructure, as well as adequate power supply.
Integrate Poverty Reduction Strategies into Development Policy Framework: There is need to provide
institutional mechanisms that integrate poverty reduction strategies into national development policies
aimed at addressing the causes and consequences of poverty. The framework provides the pathway to lifting the people out of the vicious cycle of poverty.
5.2 Conclusion
One of the contemporary features of the global economy is the emergence of BRICS economies in the
past decade as dynamic economic force galvanizing economic growth and poverty reduction across the world.
The transformation of BRICS economies into emerging markets attracting foreign direct investments has
triggered broad-based growth and widespread poverty reduction. It has also provided an impetus for these
nations to become major players in the increasingly inter-dependent global economy. The success of BRICS
economies provides useful lessons, particularly for low-income countries undermined by decades of economic
stagnation and endemic poverty. The replication of the BRICS economic model in the developing world can
become the tonic needed to spur sustainable growth and poverty reduction.
Exploring Inclusive Growth and Poverty Reduction Strategies in the Brics Economies: A ….
www.iosrjournals.org 68 | Page
References [1]. African Economic Outlook (AEO) (2012): South Africa Country profile.
[2]. American Political Science Association (2008): The Persistent Problem: Inequality, Difference and the Challenge of Development.
Report on the Taskforce on Difference, Inequality and Developing Societies. Washington, D.C.
[3]. Azzarello, S.and B. Putnam (2012): BRIC Country Update: Slowing Growth in the Face of Internal and External Challenges. CME
Group. Market Insights. 25 July.
[4]. De Castro, T. (2010): Trade Cooperation Indicators: Development of BRICS Bilateral Trade flows. In: “Politics of the European
Union: Plans and changes in the Background o f the Lisbon Treating”.
[5]. European Commission (EC) (2007): EU-Brazil Trade in facts and figures. Available at;
http://trade.ec.europaen/docib/docs/2006/september/tradox113359 pdf. Accessed 26 June 2012
[6]. European Parliament (EP) ( 2012): The Role of BRICS in the Developing World. Directorate-General for External Policies. Policy
Department. Brussels.
[7]. Economy Watch (EW) (2010): Economic structure of cline – Chinese Economic Profile. 30th June.
[8]. Institute for Applied Economic Research (IPEA (2012): Poverty, Inequality and social policies in Brazil, 1995-2009. (Ferreira de
Souza, P. ed.). Working paper no. 87. February. Brasilia
[9]. International Labour Organization (ILO) (2009): Brazil in the Global Economy: Measuring the Gains from Trade (In association
with the Carnegie Endowment for International Peace). Rome.
[10]. International Monetary Fund (IMF) (2012): Brazil: Financial sector stability Assessment. Country Report No 12/206. July.
Washington, D.C.
[11]. ……… (2012a): China Economic outlook: February. Beijing Office.
[12]. Instituto de Pesquisa Economica Aplicada (IPEA) (2011): Statistics on the GINI Coefficient in Brazil.
[13]. Meyer, R. (2011): Brazil – U.S. Relations. Congressional Research Service Report for Congress Washington, D.C.
[14]. Library of congress (LC) (2012): A country study: South Africa. Federal Research Diversion. Washington, D.C.
[15]. May J. (2010); Poverty Eradication: The South African Experience. Proceedings of an Expert Group Meeting on Poverty
Eradication. 15-17 September, Addis Ababa
[16]. ………. (2000): The structure and composition of Rural poverty and Livelihoods in South Africa In: At the crossroads: land and
Agrarian Reform in South Africa into the 21st century.
[17]. Ministry of Finance (MoF) (2012): The BRICS Report: A Study of Brazil, Russia, India, China and South Africa with special focus
on Synergies and Complementarities. Government of India. Oxford University Press. New Delhi.
[18]. Mngxitama, A. (2001): South Africa: Country Report Social Watch, 2001.
[19]. O‟Neill, J. (2001): Building Better Economic BRICS. Goldman Sachs. Global Economic Paper No. 66.
[20]. Organization of Economic Cooperation and Development (OECD)(2001): The DAC Guidelines. Poverty Reduction. Paris Cedex.
[21]. Price Waterhouse coopers (PWS) (2012): Economic Views: BRICS. February.
[22]. ---------- (2011): Economic Views: BRICS. October, 2011.
[23]. Roberto de Almeida, P. (2009): The BRICS Role in the Global Economy. Trade and International Negotiations for Journalists. Rio
de Janeiro.
[24]. Scott, J., Von Hau, M. and D. Hulme (2010): Beyond BICs: Identifying the „emerging middle powers‟ and understanding their Role
in Global Poverty Reduction. Brooks World Poverty Institute. Working Paper 137 Manchester
[25]. World Bank (2012): China Quarterly update sustaining Growth April. Washington, D.C.
[26]. ……... (World Bank) (2012b): Fighting poverty: Findings and Lessons from China‟s success. Washington D.C.
[27]. ……… (2012c): South Africa Economic update. Focus on Inequality of opportunity. Africa Region Poverty Reduction and
Economic Management. Issue No. 3. July, Washington D.C.
[28]. ……… (2011): South Africa Economic update. Focus on savings, Investment and Inclusive Growth. Washington, D.C.
[29]. --------- (2000): Attacking Poverty. World Development Report, 2000/2001. Washington, D.C.
[30]. Yu, M. (2012): Industrial Structural Upgrading in China and Poverty Reduction in China. China Centre for Economic Research
(CCER). Peking University.