exploring failure transparency and the limits of generic recovery
DESCRIPTION
Exploring Failure Transparency and the Limits of Generic Recovery. Dave Lowell Compaq Western Research Lab xxx Subhachandra Chandra and Peter M. Chen, University of Michigan. Introduction. Failure transparency: abstraction of failure-free operation - PowerPoint PPT PresentationTRANSCRIPT
Exploring Failure Transparency and the Limits of Generic Recovery
Dave LowellCompaq Western Research Labxxx
Subhachandra Chandra andPeter M. Chen, University of Michigan
2
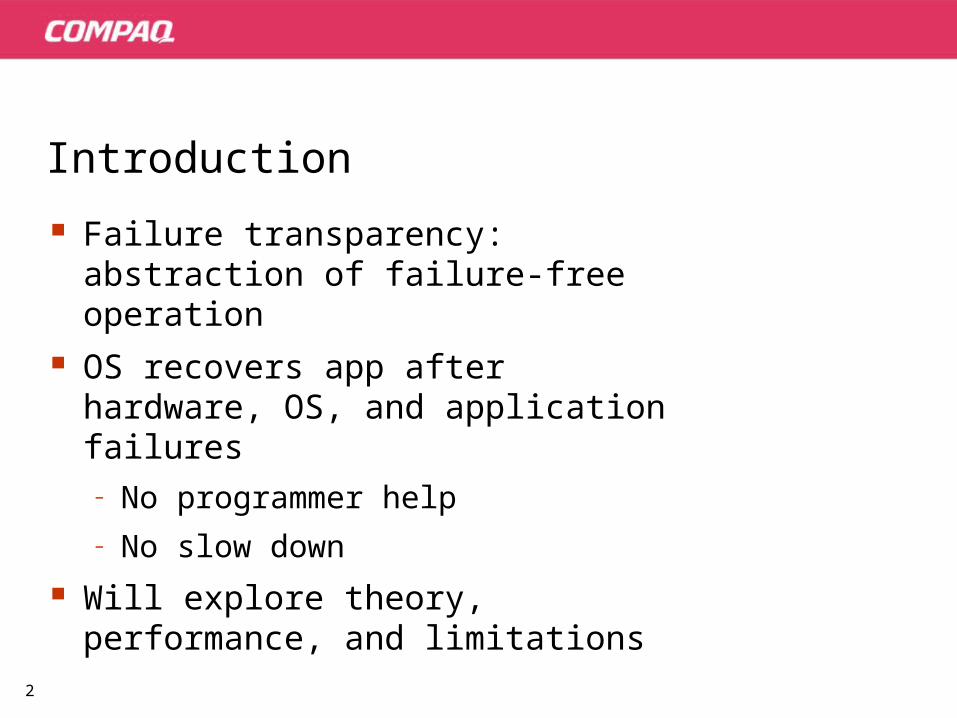
Introduction
Failure transparency: abstraction of failure-free operation
OS recovers app after hardware, OS, and application failures
– No programmer help– No slow down
Will explore theory, performance, and limitations
3
Consistent recovery
Visible output equivalent to failure-free run
– equivalence: allows duplicates– avoids “exactly once” problem
Failure transparency consistent recovery with generic techniques

4
Guaranteeing consistent recovery
Key players: non-deterministic events, visible events, commit events
Save-work invariant (simplified):– There’s a commit after each non-
deterministic event that happens-before a visible event.
– Full theorem handles liveness, distinguishes causality and ordering

5
Commit All CAND CAND-LOG
Effort to identify/convert ND events

6
CAND CAND-LOG
Effort to identify/convert ND events
CPVS
CPV-2PCE
ffort
to c
om
mit
onl
y vi
sib
le e
vent
s
CBNDVS
CBNDV-2PC
CBNDVS-LOG

7
CAND CAND-LOG
Effort to identify/convert ND events
CPVS
CPV-2PCE
ffort
to c
om
mit
onl
y vi
sib
le e
vent
s
CBNDVS
CBNDV-2PC
CBNDVS-LOG
Coord. CheckpointingManethoOptimistic Logging
Targon/32SBL Hypervisor
8
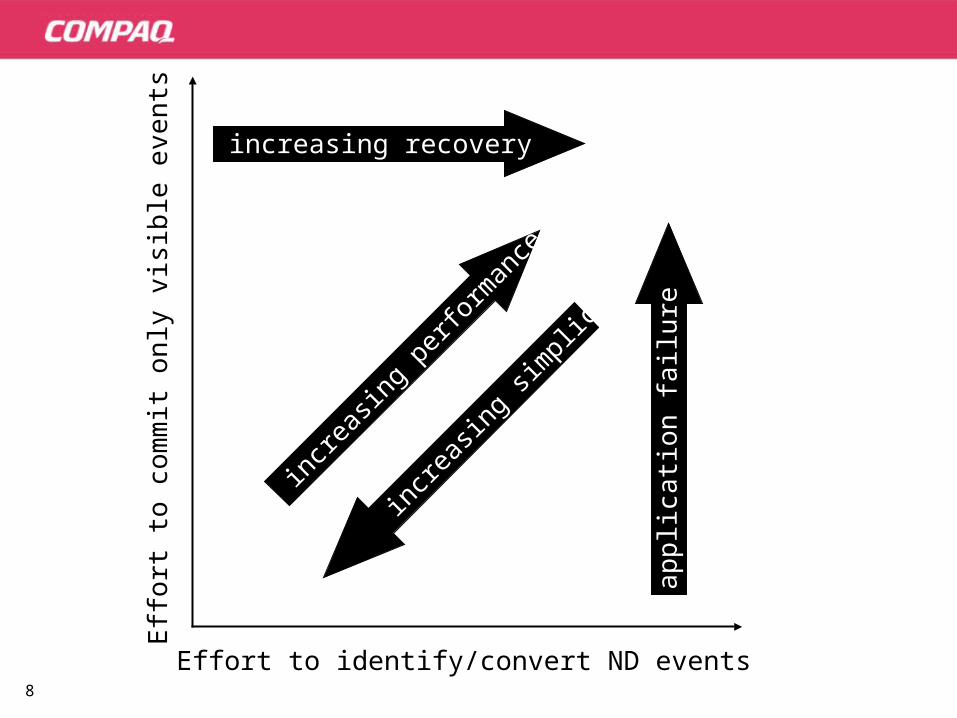
Effort to identify/convert ND events
Effo
rt to
co
mm
it o
nly
visi
ble
eve
nts increasing recovery time
app
lica
tion
failu
re r
eco
very
incre
asing
sim
plicit
y
incre
asing
per
form
ance
9
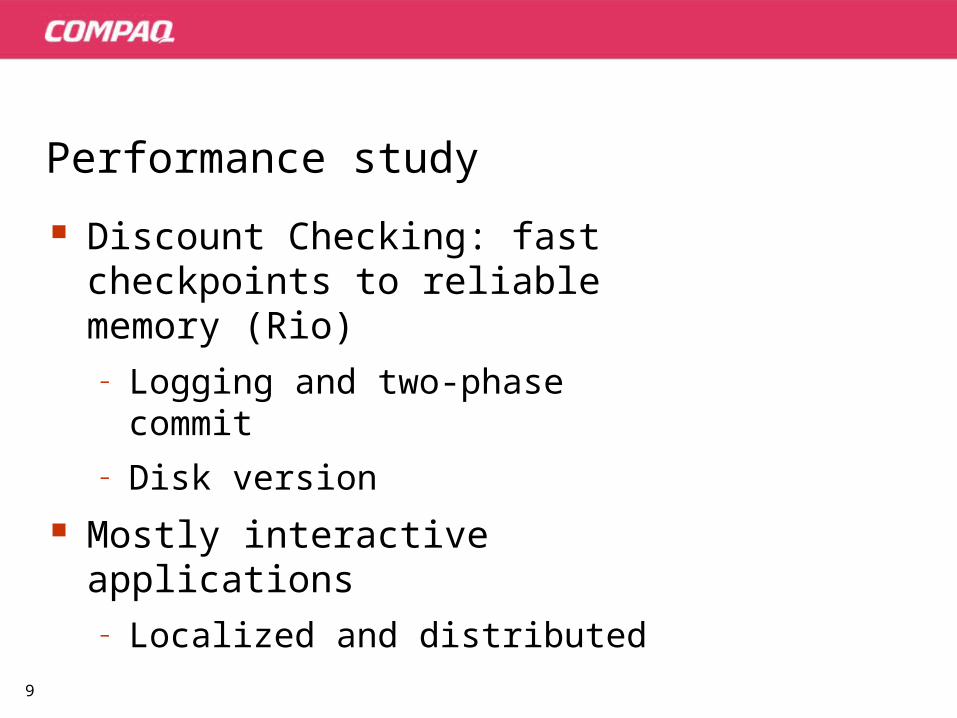
Performance study
Discount Checking: fast checkpoints to reliable memory (Rio)
– Logging and two-phase commit– Disk version
Mostly interactive applications– Localized and distributed
10
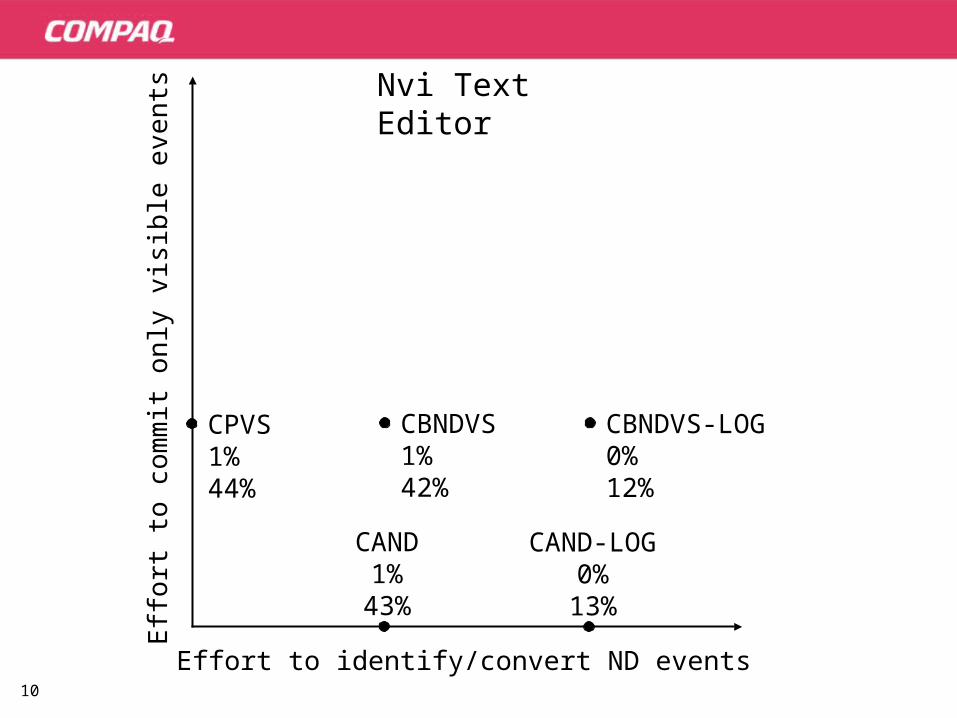
CAND1%
43%
CAND-LOG0%
13%
Effort to identify/convert ND events
CPVS1%44%
Effo
rt to
co
mm
it o
nly
visi
ble
eve
nts
CBNDVS1%42%
CBNDVS-LOG0%12%
Nvi Text Editor

11
CAND199%
11499%
CAND-LOG126%
7700%
Effort to identify/convert ND events
CPVS129%7346%
CPV-2PC12%319%
Effo
rt to
co
mm
it o
nly
visi
ble
eve
nts
CBNDVS101%5743%
CBNDV-2PC12% 252%
CBNDVS-LOG73%4973%
TreadMarks Barnes-Hut

12
Have only considered “stop” failures
Committing everything is okay– Save-work: when we must commit
Some failures affect application state– Can we commit too much?
13
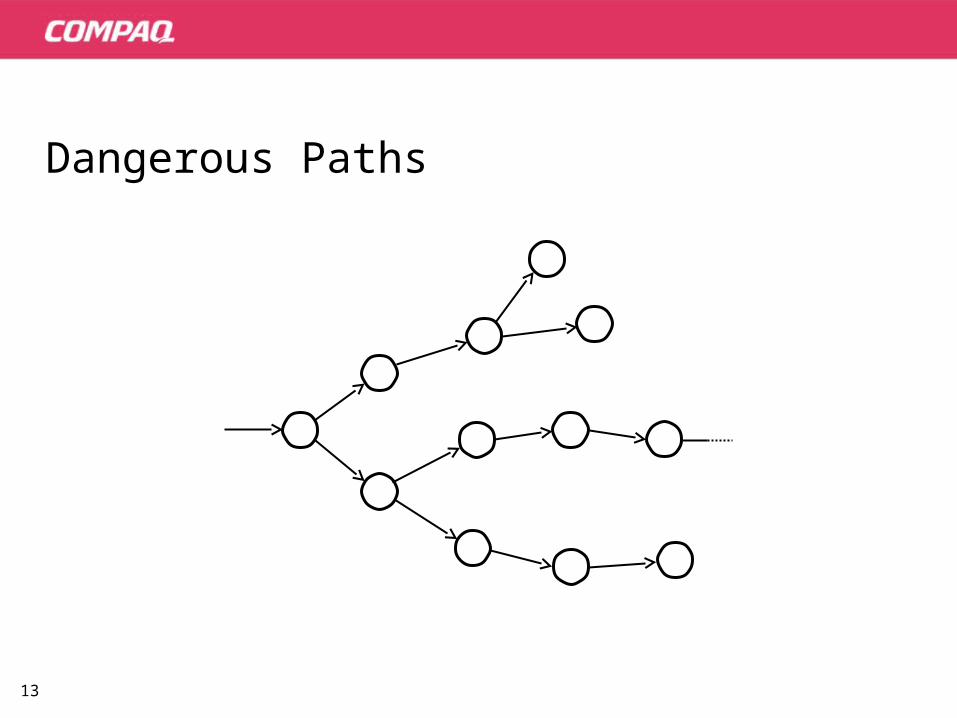
Dangerous Paths

14
Dangerous Paths
15
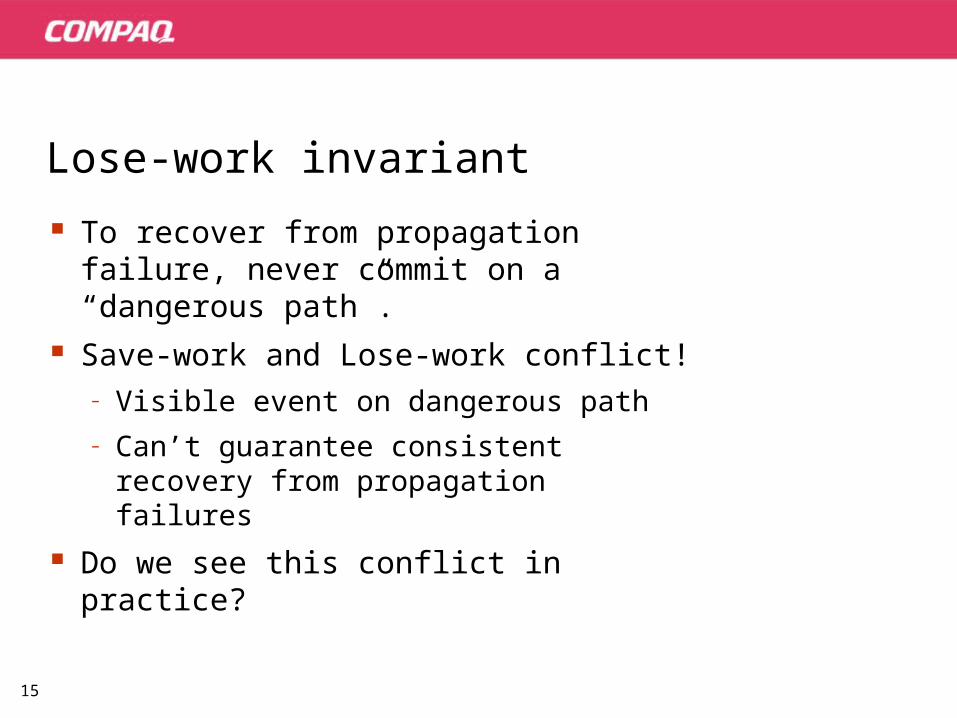
Lose-work invariant
To recover from propagation failure, never commit on a “dangerous path”.
Save-work and Lose-work conflict!– Visible event on dangerous path– Can’t guarantee consistent recovery
from propagation failures
Do we see this conflict in practice?

16
Measuring Lose-work violations
Fault-injection study : OS crashes– injected faults into running kernel– induced 350 OS crashes– recovered nvi and postgres using
Discount Checking
Results– nvi: 15% crashes violate Lose-work– postgres: 3% crashes violate Lose-work
17
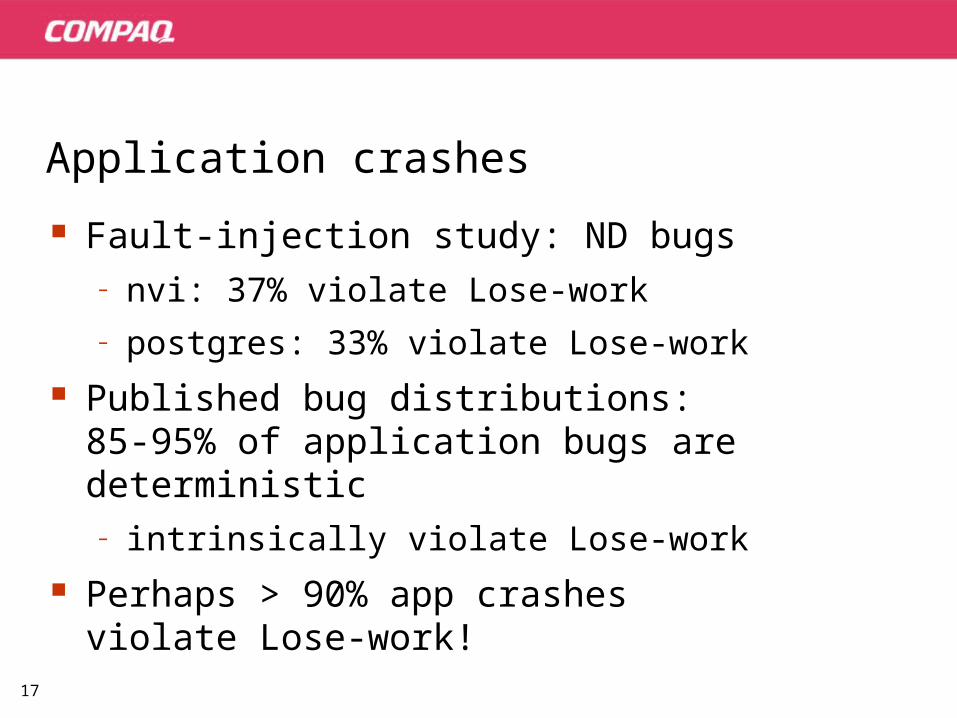
Application crashes
Fault-injection study: ND bugs– nvi: 37% violate Lose-work– postgres: 33% violate Lose-work
Published bug distributions: 85-95% of application bugs are deterministic
– intrinsically violate Lose-work
Perhaps > 90% app crashes violate Lose-work!
18
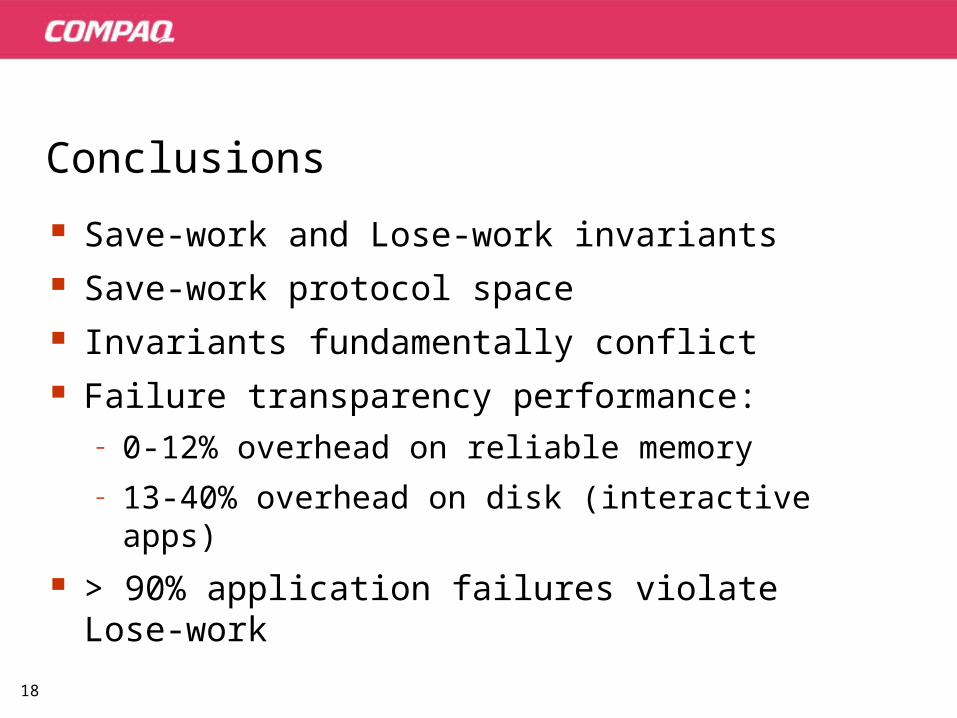
Conclusions
Save-work and Lose-work invariants Save-work protocol space Invariants fundamentally conflict Failure transparency performance:
– 0-12% overhead on reliable memory– 13-40% overhead on disk (interactive apps)
> 90% application failures violate Lose-work


20
21
Chart example
0
10
20
30
40
50
60
70
80
90
100
1st Qtr 2nd Qtr 3rd Qtr 4th Qtr
East
West
North
South