exploring electoral data with enterprise miner using … · exploring electoral data with...
TRANSCRIPT

28 June 2002SeUGI 20
Exploring Electoral Data with Enterprise Exploring Electoral Data with Enterprise Miner Using SelfMiner Using Self--Organizing Maps and Organizing Maps and Measures of Spatial AutocorrelationMeasures of Spatial Autocorrelation
Fernando Lucas Baçã[email protected]
Sandra [email protected]
Anabela [email protected]

28 June 2002SeUGI 20
SummarySummary
! Introduction! Methodology! Data Sets! Discussion of Results

28 June 2002SeUGI 20
IntroductionIntroduction
! Exploratory Data Analysis (EDA) presents a data set easily understandable.
! Self-Organizing Maps (SOM) may be used to visualize Topological Maps of multivariate data sets.
! Spatial Autocorrelation measures can help interpret the results of Topological Maps.

28 June 2002SeUGI 20
MethodologyMethodology
! Portuguese electoral results of 1995, 1999 and 2002 by council were analysed.
! Variables were normalized.
! The size of theTopological Map:16-rows by16-columns.
! Enterprise Miner of SAS Institute software provides SOM algorithm.
28 June 2002SeUGI 20
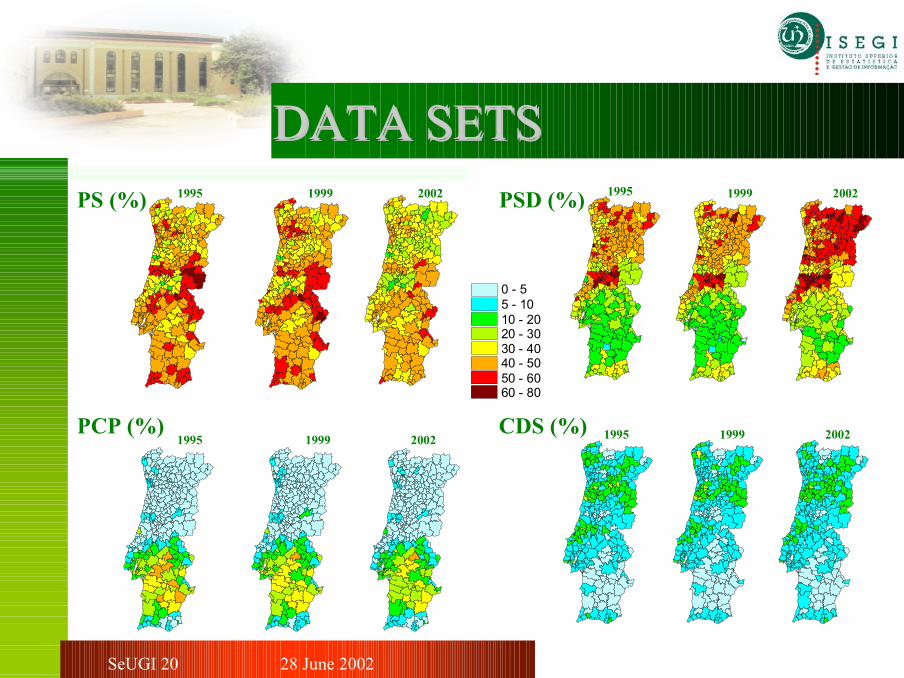
DATA SETSDATA SETS
0 - 55 - 1010 - 2020 - 3030 - 4040 - 5050 - 6060 - 80
1995 1999 2002PS (%) PSD (%) 1995 1999 2002
PCP (%)1995 1999 2002
CDS (%) 1995 1999 2002
28 June 2002SeUGI 20
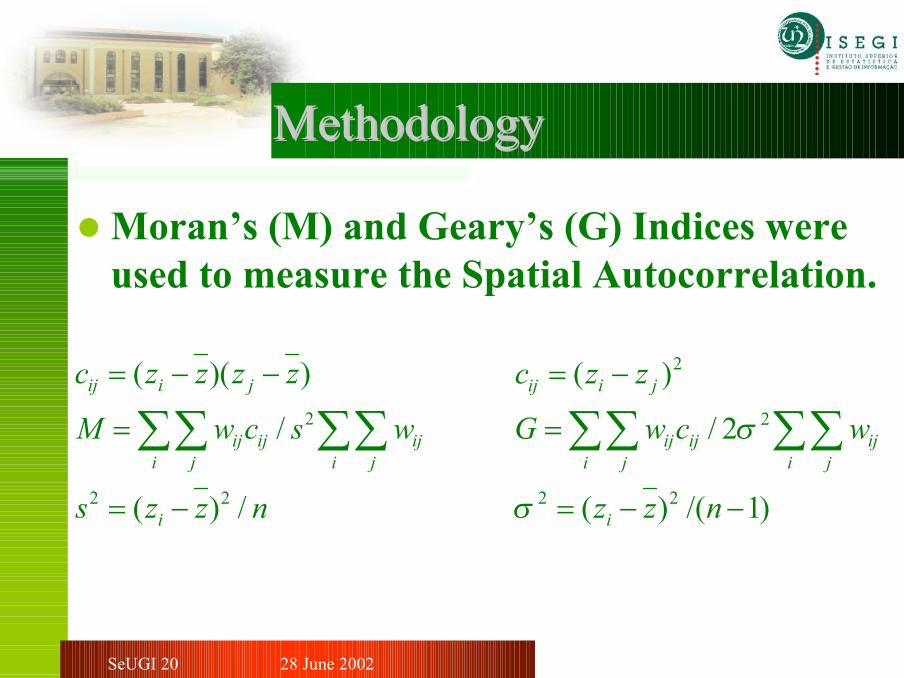
MethodologyMethodology
! Moran’s (M) and Geary’s (G) Indices wereused to measure the Spatial Autocorrelation.
2
2 2
( )( )
/
( ) /
ij i j
ij ij iji j i j
i
c z z z z
M w c s w
s z z n
= − −
=
= −
∑∑ ∑∑
2
2
2 2
( )
/ 2
( ) /( 1)
ij i j
ij ij iji j i j
i
c z z
G w c w
z z n
σ
σ
= −
=
= − −
∑∑ ∑∑
28 June 2002SeUGI 20
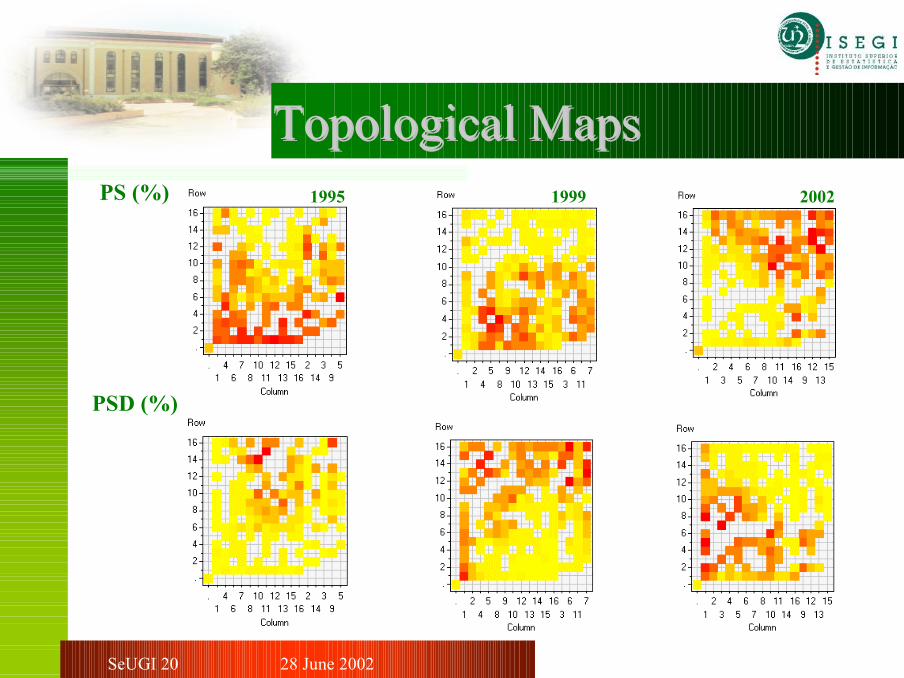
Topological MapsTopological MapsPS (%) 1995 1999 2002
PSD (%)

28 June 2002SeUGI 20
Topological MapsTopological Maps19991995 2002
Lisboa
Porto
Faro
Lisboa
Porto
Faro
Faro
Lisboa
Porto
It can be seen that the movement towards a much more similar voting pattern, between 1995 and 2002.
28 June 2002SeUGI 20
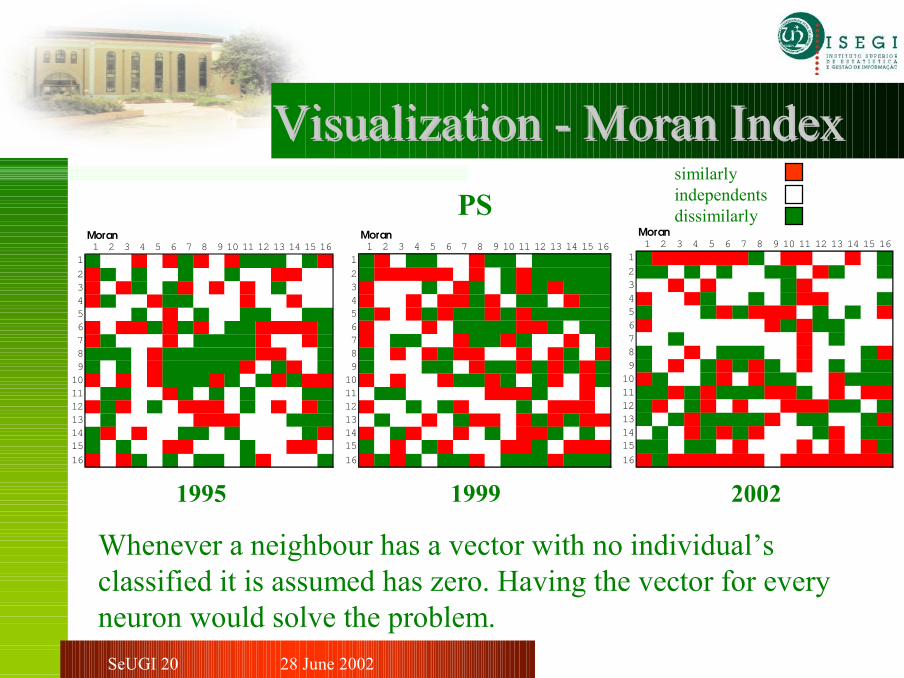
VisualizationVisualization -- MoranMoran IndexIndex
1999
Whenever a neighbour has a vector with no individual’s classified it is assumed has zero. Having the vector for every neuron would solve the problem.
Moran1 2 3 4 5 6 7 8 9 10 11 12 13 14 15 16
1 ## ## ## ## ## ## ## ## ## ## ## ## ## ## ## ##
2 ## ## ## ## ## ## ## ## ## ## ## ## ## ## ## ##3 ## ## ## ## ## ## ## ## ## ## ## ## ## ## ## ##4 ## ## ## ## ## ## ## ## ## ## ## ## ## ## ## ##5 ## ## ## ## ## ## ## ## ## ## ## ## ## ## ## ##6 ## ## ## ## ## ## ## ## ## ## ## ## ## ## ## ##7 ## ## ## ## ## ## ## ## ## ## ## ## ## ## ## ##8 ## ## ## ## ## ## ## ## ## ## ## ## ## ## ## ##9 ## ## ## ## ## ## ## ## ## ## ## ## ## ## ## ##10 ## ## ## ## ## ## ## ## ## ## ## ## ## ## ## ##11 ## ## ## ## ## ## ## ## ## ## ## ## ## ## ## ##12 ## ## ## ## ## ## ## ## ## ## ## ## ## ## ## ##13 ## ## ## ## ## ## ## ## ## ## ## ## ## ## ## ##14 ## ## ## ## ## ## ## ## ## ## ## ## ## ## ## ##15 ## ## ## ## ## ## ## ## ## ## ## ## ## ## ## ##
16 ## ## ## ## ## ## ## ## ## ## ## ## ## ## ## ##
1995
Moran1 2 3 4 5 6 7 8 9 10 11 12 13 14 15 16
1 ## ## ## ## ## ## ## ## ## ## ## ## ## ## ## ##
2 ## ## ## ## ## ## ## ## ## ## ## ## ## ## ## ##3 ## ## ## ## ## ## ## ## ## ## ## ## ## ## ## ##4 ## ## ## ## ## ## ## ## ## ## ## ## ## ## ## ##5 ## ## ## ## ## ## ## ## ## ## ## ## ## ## ## ##6 ## ## ## ## ## ## ## ## ## ## ## ## ## ## ## ##7 ## ## ## ## ## ## ## ## ## ## ## ## ## ## ## ##8 ## ## ## ## ## ## ## ## ## ## ## ## ## ## ## ##9 ## ## ## ## ## ## ## ## ## ## ## ## ## ## ## ##10 ## ## ## ## ## ## ## ## ## ## ## ## ## ## ## ##11 ## ## ## ## ## ## ## ## ## ## ## ## ## ## ## ##12 ## ## ## ## ## ## ## ## ## ## ## ## ## ## ## ##13 ## ## ## ## ## ## ## ## ## ## ## ## ## ## ## ##14 ## ## ## ## ## ## ## ## ## ## ## ## ## ## ## ##15 ## ## ## ## ## ## ## ## ## ## ## ## ## ## ## ##
16 ## ## ## ## ## ## ## ## ## ## ## ## ## ## ## ##
2002
PSsimilarlyindependentsdissimilarly
28 June 2002SeUGI 20
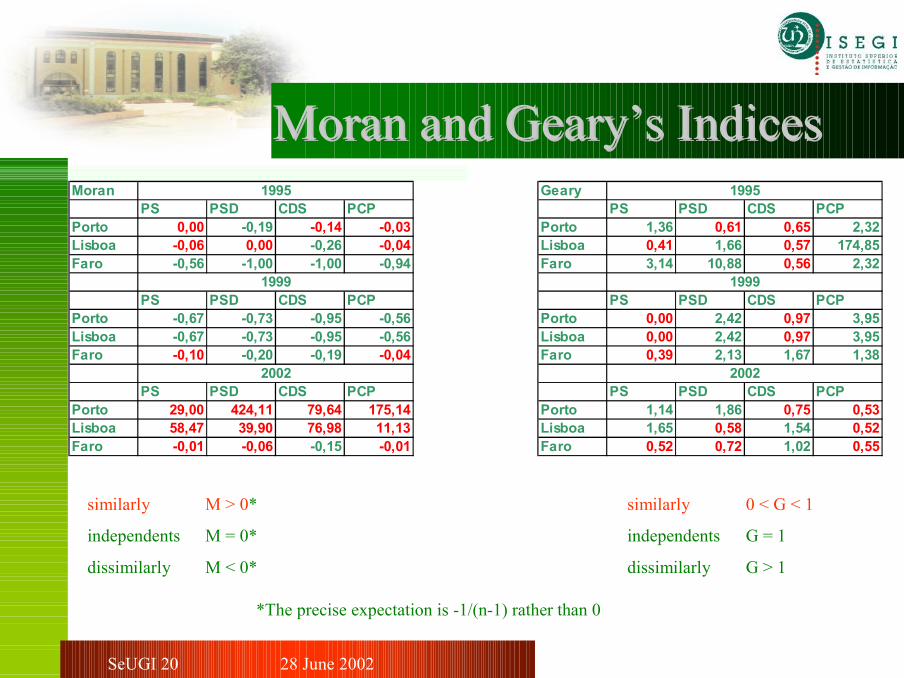
MoranMoran and and Geary’sGeary’s IndicesIndicesMoran
PS PSD CDS PCPPorto 0,00 -0,19 -0,14 -0,03Lisboa -0,06 0,00 -0,26 -0,04Faro -0,56 -1,00 -1,00 -0,94
PS PSD CDS PCPPorto -0,67 -0,73 -0,95 -0,56Lisboa -0,67 -0,73 -0,95 -0,56Faro -0,10 -0,20 -0,19 -0,04
PS PSD CDS PCPPorto 29,00 424,11 79,64 175,14Lisboa 58,47 39,90 76,98 11,13Faro -0,01 -0,06 -0,15 -0,01
1995
1999
2002
M > 0*
M = 0*
M < 0*
0 < G < 1
G = 1
G > 1
similarly
independents
dissimilarly
GearyPS PSD CDS PCP
Porto 1,36 0,61 0,65 2,32Lisboa 0,41 1,66 0,57 174,85Faro 3,14 10,88 0,56 2,32
PS PSD CDS PCPPorto 0,00 2,42 0,97 3,95Lisboa 0,00 2,42 0,97 3,95Faro 0,39 2,13 1,67 1,38
PS PSD CDS PCPPorto 1,14 1,86 0,75 0,53Lisboa 1,65 0,58 1,54 0,52Faro 0,52 0,72 1,02 0,55
1999
2002
1995
*The precise expectation is -1/(n-1) rather than 0
similarly
independents
dissimilarly
28 June 2002SeUGI 20
DiscussionDiscussion ofof ResultsResults
! Kohonen-SOM Networks are a useful method for Exploratory Data Analysis in order to:– Recognize clustering structures;– Establish connections between data items.
! Spatial Autocorrelation among attributes is useful to:
– Draw boundaries to the outlining of clusters.
– Measure the degree of similarity between one cluster and its neighbours;
28 June 2002SeUGI 20
Exploring Electoral Data with Enterprise Exploring Electoral Data with Enterprise Miner Using SelfMiner Using Self--Organizing Maps and Organizing Maps and Measures of Spatial AutocorrelationMeasures of Spatial Autocorrelation
Fernando Lucas Baçã[email protected]
Sandra [email protected]
Anabela [email protected]