exploring aspects of private, public and private-public ... exploring aspects of private, public and...
TRANSCRIPT

1
Exploring aspects of private, public and private-public
partnership (PPP) schooling in Pakistan.
Submitted for Publication DO NOT CITE OR QUOTE WITHOUT PERMISSION
Ravish Amjad and Gordon MacLeod
Idara-e-Taleem-o-Aagahi, Pakistan.
Paper to be presented at the Globalization, Regionalization and Privatization in
and of Education in Asia Conference, 28-29 September 2012, Kathmandu, Nepal.
Open Society Foundation/Privatisation in Education Research Initiative.
1. Introduction Low-cost or affordable private schools in developing countries including those of South Asia produce better academic outcomes than government schools. This generalisation seems true even after account is taken of background variables such as parental education and household wealth. A small number of these studies of private-public schooling have been in Pakistan, mostly in the Punjab, Pakistan’s richest and most populous province. This study uses parts of a large nationwide survey in Pakistan (Annual Status of Education Report, 2012) to assess whether students of private schools across Pakistan seem to outperform government school students. This is done by comparing test outcomes in Urdu, arithmetic, and English across the school sectors. In addition, the study sheds light on the distribution of fees and fee levels charged by Pakistan’s private schools, tests whether differential fee levels relate to differential academic outcomes, considers some evidence on the effectiveness of Public-Private-Partnership schools and offers some evidence on overall quality in the private sector. 2. Literature review.
2.1 Private Schooling in Pakistan. Pakistan has seen massive growth in low cost private schooling. The work of Andrabi and colleagues (2006) provides some comprehensive background on this. They note that as recently as 2006, Pakistan government policy viewed private schools as institutions that charged high fees, catered to an elite population and were typically located in urban areas. But the data presented by
2
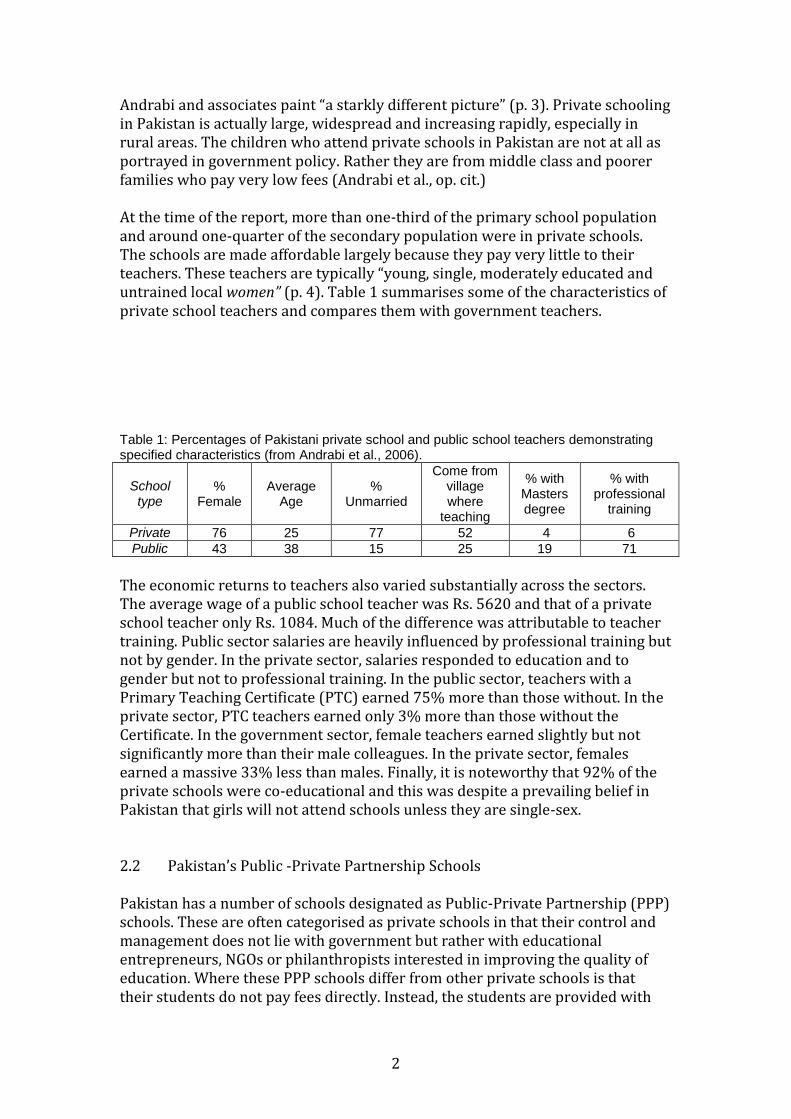
Andrabi and associates paint “a starkly different picture” (p. 3). Private schooling in Pakistan is actually large, widespread and increasing rapidly, especially in rural areas. The children who attend private schools in Pakistan are not at all as portrayed in government policy. Rather they are from middle class and poorer families who pay very low fees (Andrabi et al., op. cit.) At the time of the report, more than one-third of the primary school population and around one-quarter of the secondary population were in private schools. The schools are made affordable largely because they pay very little to their teachers. These teachers are typically “young, single, moderately educated and untrained local women” (p. 4). Table 1 summarises some of the characteristics of private school teachers and compares them with government teachers. Table 1: Percentages of Pakistani private school and public school teachers demonstrating specified characteristics (from Andrabi et al., 2006).
School type
% Female
Average Age
% Unmarried
Come from village where
teaching
% with Masters degree
% with professional
training
Private 76 25 77 52 4 6
Public 43 38 15 25 19 71
The economic returns to teachers also varied substantially across the sectors. The average wage of a public school teacher was Rs. 5620 and that of a private school teacher only Rs. 1084. Much of the difference was attributable to teacher training. Public sector salaries are heavily influenced by professional training but not by gender. In the private sector, salaries responded to education and to gender but not to professional training. In the public sector, teachers with a Primary Teaching Certificate (PTC) earned 75% more than those without. In the private sector, PTC teachers earned only 3% more than those without the Certificate. In the government sector, female teachers earned slightly but not significantly more than their male colleagues. In the private sector, females earned a massive 33% less than males. Finally, it is noteworthy that 92% of the private schools were co-educational and this was despite a prevailing belief in Pakistan that girls will not attend schools unless they are single-sex. 2.2 Pakistan’s Public -Private Partnership Schools Pakistan has a number of schools designated as Public-Private Partnership (PPP) schools. These are often categorised as private schools in that their control and management does not lie with government but rather with educational entrepreneurs, NGOs or philanthropists interested in improving the quality of education. Where these PPP schools differ from other private schools is that their students do not pay fees directly. Instead, the students are provided with
3
vouchers or the fees are paid directly to the schools on behalf of the students, most commonly by an educational foundation provided with recurrent funding through government. The advantage for government is that cost per student place is substantially lower than in the government sector. The best-known schemes in Pakistan are those run by the Balochistan, Punjab and Sindh Education Foundations. In Balochistan, a major PPP initiative was the Balochistan Education Support Project funded by the World Bank’s International Development Association (2012). It was seen to have increased not only enrolment but also both student and teacher attendance and gender equity. Effects on learning outcomes are less clear and perhaps unstudied. In Sindh, the Education Foundation has supported several kinds of partnerships including the Support to Private Education Institutes Program and the pioneering Adopt-a-School programme. The Foundation suggests that these schemes are intended to counter the marked decline in the standard of the public education system by making use of the technical expertise and extensive resources of the private sector. It is unclear what studies there may have been of the effectiveness of these PPP initiatives. The Punjab Education Foundation has also supported various PPP projects, perhaps most notably the Foundation Assisted Schools (FAS) and the Education Voucher Scheme. Malik’s (2010) evaluation of these on behalf of the Asian Development bank is very positive. He writes:
Through its FAS program, the PEF has demonstrated that: While it is the responsibility of the state to ensure free education for all
children, it does not necessarily have to provide the service… Through PPPs, better-quality education can be provided to a child at
significantly less cost than that in the public school system (Malik, 2010, p. 6, emphases added)
However, this unequivocal conclusion about better quality education is not totally persuasive given that the evidence of this is the Quality Assurance Tests (QATs) administered by the PEF to its supported schools and, as Malik himself notes, these QATs are not currently linked with other national or international assessment systems and therefore “real performance cannot be judged against larger student populations” (p. 13). Bano (2009) reviews a range of PPP initiatives in Pakistan including those of the PEF and SEF. She is much less sanguine about PPP schooling than Malik. She notes that at the time of writing, the idea of PPPs was one strongly promoted by international development institutions including the World and Asian Development Banks, UN and European Union agencies and aid organisations from Japan, Norway, the UK and USA. Unsurprisingly perhaps, Pakistan government(s) went along with this but perhaps more in search of funding than of genuine educational partnership. Beyond the confines of Pakistan, Wößmann (2005) analysed data from the OECD’s Programme for International Student Assessment in an attempt to

4
determine the effectiveness of public-private partnerships in providing cognitive skills to students. He concluded that
The main result is that across countries, public operation of schools is negatively associated with student performance in math, reading and science, while public funding of schools is positively associated with student performance in the three subjects…. the results favor the particular form of educational PPPs where the state does the funding and the private sector runs the schools (p. 20).
LaRocque (2008) provides a useful broad international review of PPPs in basic education. He concludes that we cannot yet arrive at firm conclusions about the effectiveness of PPPs. More, and more rigorous, independent research is needed to isolate the influences of PPP schools on student outcomes 2.3 Do private schools in developing countries produce better academic
results than public schools? In this brief review, we embed South Asian studies in a broader global context but focus primarily on work in India and Pakistan. Over many years there has been evidence accumulating that private schools generally outperform public schools in their students’ academic test performance. (Psacharopoulos, 1987; Jimenez et al., 1991; Kingdon, 1996; Tooley and Dixon, 2003; Tooley and Dixon, 2006; Tooley et al., 2007; Goyal and Pandey, 2009; French and Kingdon, 2010). The Psacharopoulos (1987) work showed that the level of academic achievement of students in private schools in Colombia and Tanzania was higher than those in public schools even after controlling for student ability and socioeconomic background. Similarly, Jimenez et al. (1987) obtained similar results on measures of literacy and numeracy when comparing private and public students in Colombia, the Dominican Republic, the Philippines, Tanzania and Thailand. A study in the Lucknow district of Uttar Pradesh in India (Kingdon, 1996) found strong differences in achievement between private unaided-by-government schools and both government schools and private, aided schools (nominally privately managed, but almost entirely funded by the state government and heavily regulated). However, much of the difference disappeared when “personal endowments and selectivity of pupils [were] controlled for.”(p. 24). Differences in reading achievement virtually disappeared; slight differences in mathematics achievement remained. Tooley’s work on low cost private schools has been reported in a variety of sources (e.g. Tooley and Dixon, 2003; Tooley and Dixon, 2006; Tooley et al., 2007, Tooley, 2009; Rangaraju et al., 2012) and often with some duplication of content. As example, Tooley and Dixon (2006) report work in Ghana, Nigeria and India (two locations) as part of a larger study that also included data collection in China, India (a third location) and Kenya. Their first (and necessary) step was to

5
search for private schools. This was because the number of private schools is almost always grossly underestimated in official statistics. They collected a variety of data that might be significant in ‘explaining’ student achievement. These included household income and wealth indicators, years of parental education, caste or tribe, religion and parental motivation as well as measures of student ‘intelligence’ using Raven’s Standard Progressive Matrices. They then used mathematics and English tests as measures of student learning in all countries and compared the performances of private and public school students. In every case, raw achievement scores were highest in the private recognised schools, followed by the private unrecognised schools and then by the government schools. When account was taken of the background variables, these “differences were reduced but still large in favour of both types of private school in each study.” (p. 454) In other works, (Tooley and Dixon, 2003; Tooley, 2009; Rangaraju et al., 2012) Tooley and his associates rehearse and repeat some of their arguments to support private schooling for the poor. Government schools are failing the poor; private schools consistently outperform government schools and they are far more numerous in developing countries than governments recognise; they cater to the poor and they are far more efficient and lower cost than government schools. The ‘missing ingredient’ in government schools is quality. Quality is attributed to greater accountability of teachers in private schools, lower teacher absenteeism, more teacher time-on-task, lower teacher-pupil ratios and greater efficiency of the private sector. Private schools in rural India were the focus of the work of Muralhidran and Kremer (2006). Their descriptive results were similar to those of Andrabi and his colleagues (op. cit.) in Pakistan; their comparative results were similar to those of Tooley and Dixon (2006).
Compared to public schools, private schools pay much lower teacher salaries; have lower pupil teacher ratios; and less multi grade teaching. Private school teachers are 2 to 8 percentage points less likely to be absent than teachers in public schools and 6 to 9 percentage points more likely to be engaged in teaching…. They are more likely to hold a college degree than public school teachers, but much less likely to have a formal teacher training certificate. Children in private school have higher attendance rates. They have higher test scores, even after controlling for observable family and school characteristics. (Abstract, p. 2)
Goyal and Pandey (2009) explored differences between private and public schools in the two Indian states of Uttar Pradesh and Madhya Pradesh. Again private school students did better on tests of literacy and numeracy. In Uttar Pradesh, these differences remained after controlling for student and school characteristics whilst, unusually, private unrecognised schools outperformed the private recognised schools. In Madhya Pradesh, after adjustment, there was “no robust private school advantage” in either of the tested grades. This is unlike the outcome of most comparisons of private and public schools.
French and Kingdon (2010) examined the relative effectiveness of public and

6
private schools using the very large data sets gathered in surveys for the Annual Status of Education Reports (ASER) in India from 2005-07. They estimated private school effects for mathematics and language making use of several approaches, both cross-sectional and longitudinal. Their best estimate of the private school effect on child achievement was a low +0.17 standard deviations.
Chudgar (2012) used the ASER, 2009 data from India to ask whether the village context that had been shown to affect private school location could also affect private school student achievement performance. Her answer was in the affirmative. She showed that the gap between private and public performance did vary across contexts and that the apparent positive private effect on achievement was reduced in villages with strong government presence and infrastructure. Perhaps the government schools were simply performing well in a setting of better infrastructures. Alternatively, given that private schools are more likely to be established where government infrastructure is strong, then perhaps the government schools were responding to the private competition.
There have been fewer studies of private/public schooling in Pakistan than In India. Aslam carried out some detailed work on a sample of 40 private and 25 public schools in rural and urban settings in Lahore in the province of Punjab (2003 a and 2006). The earlier paper addressed the determinants of achievement in both kinds of school with a particular focus on absenteeism. The second paper focussed on gender effects and on differences in pupil achievement across the private and government schools. She found substantial residual effects of the private-public dimension even after controlling for home, student and teacher variables. These effects were in the range of +0.36 to +0.40 standard deviations.
One substantial later work was the Learning and Educational Achievements in Punjab Schools (LEAPS) study (Andrabi et al., 2007). This surveyed learning outcomes in Urdu, English and Mathematics of 12,000 children in 112 villages in private and public schools in the Punjab province of Pakistan. The authors concluded that the private school children scored significantly higher than their public sector counterparts and that very little of this was “attributable to differences in household wealth, parental education, the child’s age or the child’s gender.” (p. 68). Further, the private-public dimension has significantly greater effects than other background variables. For example, children in government schools would be among the worst performing 20 percent in private schools in English and among the worst performing 30 percent in Urdu. The gap between private and public school children’s achievement in English is 12 times that between rich and poor children; the private/public gap in mathematics is 8 times that between children of literate and illiterate fathers; and the public/private gap in Urdu is 18 times that between children of illiterate and literate mothers. These results are from the Punjab, Pakistan’s largest, richest and most populous province and they suggest very strong private school effects.
The nation-wide Pakistan ASER project began in 2010. In 2011 it collected data from a very large national sample of households and school. In all 84 rural and 3 urban districts were surveyed, yielding close to 50,000 households, close to 150,000 children and more than 3,500 government and private schools. The Report (ASER, 2012) contains Notes (brief thematic papers) on eight topics and

7
two of these (Muzaffar, 2012; Amjad, 2012) are on the topic of private and public schooling.
Muzaffar (op. cit.) suggests that comparisons of private schools with government schools can be harmful for the private sector because they take the very low performance of the public schools as their benchmark. But the reality is that both sectors are doing poorly. For instance, 57% of 5th graders in private schools but only some 47% in public schools can read a 2nd grade story in Urdu. This comparison, he argues, serves to divert our attention away from the fact that “a whopping 43% of the private school students were unable to read a story in Urdu” (p. 26). He argues that the big policy question now is how to reform both private and public schools and notes that private school children are much more likely to attend private tuition (24% as against 7% in the public sector) (ASER, 2011).
Amjad (op. cit.) noted that some 26% of students in the large ASER sample were attending private schools. This overall figure conceals some marked regional differences within Pakistan. For example, private school attendance rates in Gilgit-Baltistan and Azad Jammu Kashmir were 44% and 33% whilst those in Sindh and Balochistan were 9% and 7% (although apparently increasing in every region).
In an initial foray into the private-public sector issue, Amjad noted that the relatively large raw differences in achievement between the private and public sector are substantially reduced when account is taken of differences among groups that attend private and public schools. Through regression analysis, she shows that children’s achievement in being able to read a story in Urdu is apparently affected by levels of parental education, household wealth, parental media exposure and paid private tuition. She claims that when account is taken of these factors an original raw difference of 16% reduces to one of only 4%. In other words, three-quarters of the differential between private and public students is explicable by factors other than type of school although there remains a small advantage in being a private school student. This finding contrasts markedly with the conclusions drawn in the LEAPS Punjab-only project (op. cit.) summarised above.
Debate about the relative merits of private and public schooling in South Asia seems to be as much ideological and political as it is empirical. In India for example, there has been vigorous debate between proponents of private schooling like Jain and Dholakia (2009, 2010) and proponents of public schooling like Jain and Saxena (2010) and Sarangapani (2009).
Tooley’s championing of private schooling for the poor is accompanied, and perhaps heavily driven, by a rhetoric of the free-market and neo-liberalism. Nambissan and Ball (2010) provide some of the less-than-obviously-visible detail of this in their analysis of the international advocacy networks that attempt to shape Indian private schooling. “A complex of funding, exchange, cross-referencing, dissemination and mutual sponsorship links the Indian choice and privatization advocacy network, and connects it to a global network for neoliberalism organizations in other countries” (p. 1). Tooley is shown to play a major and central role in this network.
Muzaffar (2010) too offers a critique of Tooley’s (2009) argument in The
8
Beautiful Tree that low fee private schools (LFPS) offer some kind of panacea in the achievement of universal primary education. He first argues that Tooley’s portrayal of his “myth-shattering discovery” of private schools for the poor is uninformed by any disclosures of ‘”his [prior] commitments to market-driven education reforms [and that these] are not apparent and remain undisclosed in The Beautiful Tree.” (p. 10). Muzaffar’s view is that in Pakistan neither public nor low cost private schools are able to deliver quality education. There is already unease “as clients realise that their qualification does not give them access to the labour markets they aspire to. This is further exacerbated by the ongoing privatization of higher education “ which excludes the graduate of LFPS from opportunities to benefit from a quality college education” (p. 12). In a country like Pakistan with its almost anarchical or non-existent regulation of schooling, “the LFPS are unlikely to mitigate the sense of social and economic deprivation in which the clientele they are presumed to serve is already caught up” (p. 12). As a result of this
education inequities and their impact on countries like Pakistan is increasingly manifest in stark disparities between a small and wealthy elite and sprawling, increasingly antagonized population surviving at the margins with little prospect of access to labour markets (p. 12)
Contrast this with Tooley:
the poor have found a silver bullet or at least the makings of one. The route to the holy grail of the development experts—quality education for all—is there for all to see, if only they’ll look. By themselves, the poor have found their own viable alternative. The solution is easy: send your children to a private school that is accountable to you because you’re paying fees. (Tooley, 2009, p. 245)
3. Methods
3.1. The ASER, Pakistan (2012) survey:
This study uses the 2011 round of Pakistan’s Annual Status of Education Report (ASER, 2012) survey as its data source. The ASER work had two major components:
a. A nationwide household survey carried out in 84 rural and three urban1 areas, focussed on the schooling of household children and the testing of their levels of attainment in literacy (Urdu and English) and numeracy. In all there were 49,793 households with assessment results for 126,224 children aged 5 to 16 years.
1 The total number of districts was 85. Lahore and Peshawar districts yielded both rural and urban data.

9
b. A survey of schools, both government and private, focussed primarily on school infrastructure in the villages and blocks where the household survey was carried out.
The ASER survey was coordinated by Idara-e-Taleem-o-Aagahi (ITA) a Pakistan-based non-government organization (NGO) under the auspices of the South Asian Forum for Education Development (SAFED). Various local NGOs and educational institutes conducted the survey. Its objective was to better understand the status of education access and quality in Pakistan. The target was to survey a representative 600 households in each district and this was close to being achieved with a total of 49,793 households being covered. The 600 consisted of 20 households in each of 30 villages in the district. Although a fully random sample would have been more desirable, this was neither cost effective nor practically feasible without updated household census information within the districts. The villages were selected from the national census data using a probability-proportional-to-size sampling technique for each district. For sampling households within each village, the enumerators adopted an approach of first dividing each village into four sections. Then, in each section a central household was selected by the enumerator as the first to be surveyed. After the first household, every fifth household in a circular pattern was selected for the survey until five households were chosen in that particular section. In the case of larger villages, a larger interval was used depending on the approximate population of the village. The same procedure was adopted in the remaining three sections of the village to yield a total of 20 households. Dividing up the villages into sections is beneficial in that it covers all parts of the village, even the peripheral. This process yielded a total ASER sample size of 126,224 children. Of these, 72,304 were attending government schools; 23,094 were attending private schools and the rest were out-of-school children or attending other institutions such as madrassahs. 3.2 Sample for this study For the sub-study reported in this paper, we needed to connect the two separate samples (household and school). This was because the information on levels of private school fee was included in the school sample data, while the individual assessment results along with other information on each child was recorded in the household sample data. We were able to link the two samples by focussing on only those children from the household sample who were attending the surveyed schools. The household data also recorded whether the children being tested were enrolled in the surveyed schools in the respective villages. Thus, only the children who were reported as also enrolled in the ASER-surveyed schools were included in this sub-study. This allowed us to identify a total of 30,210 children of whom 3,997 (13.2%) were attending private schools. This proportion is somewhat smaller than the 18.3% private students in the overall ASER sample. This was because of a procedural rule by ASER that the surveying of government schools was compulsory and, if there was no government school in a given village, surveyors were then to select a replacement government

10
school in the adjacent village. This ‘replacement rule’ did not apply to private schools. Overall, the students in the sub-sample came from 1820 government and 560 private schools (including 16 public-private partnership (PPP) schools).
3.3 Research questions
There were four general research questions in this study.
3.3.1 Do students of private schools in Pakistan outperform students of government schools? This is already a well-rehearsed question but had not previously been addressed through such a nation-wide, large sample study across most of Pakistan.
3.3.2 How well do public-private partnership (PPP) schools (a distinctive sub-set of private schools) perform in relation to other private schools and government schools? In the ASER study, PPP schools had been simply categorised as private schools. However, they differ from other private schools not only in that fees are not paid by the individual students but because of their substantial interest to aid agencies and also to governments unwilling to contemplate full school privatisation but ready to accommodate partnerships.
3.3.3 Does the level of private school fee correlate with the level of student achievement? (in other words, do students from low-fee private schools in Pakistan outperform students of government schools and do students from higher-fee private schools outperform students of low-fee private schools?), and
3.3.4 Are students of private schools in Pakistan receiving a high quality education?
Answering these questions required information on the learning attainments of students, on the types of school they attended, on other factors that might correlate with attainment (child, home, school) and on the expectations of student attainment stated in Pakistan’s national curriculum.
3.4 The learning attainment tasks
The household survey contained a section in which children’s learning levels were assessed in two literacy areas–Urdu and English–and one numeracy area, that of arithmetic. (Sindhi is used as the language of instruction in the province of Sindh and testing there was of learning levels in that language instead of Urdu). The survey collected data on the percentages of children aged from 5-16 years
who were able to succeed on a series of tasks in Arithmetic, English and Urdu
(Sindhi).
In Urdu and Sindhi, the reading tasks, in order of competency ranged from Beginner
level through Can Read Letters, Can Read Words, and Read Sentences, to Can Read a
Story.
In English, the tasks ranged from Can Identify Capital Letters, through Can Identify Small Letters, and Can Read Words, to Can Read Sentences.

11
In arithmetic, the competency tasks ranged from Beginner level, through Number
Recognition (1-9), Number Recognition (11-99), simple Subtraction to Division (3
digit by 1 digit).
Thus, in each of the three areas, each child was categorised as being ‘able to achieve’ or ‘not achieve’ at a certain level. This therefore produced categorical variables of performance (1s and 0s representing ‘can do’ and ‘cannot do’) rather than the more usual continuous variable represented by, say, scores of 25 or 30 out of 50 in a test of arithmetic. This is important for the type of statistical analysis later used.
3.5 Child, household and school variables
The household and school surveys collected information on a series of variables. They may loosely be categorized into three groups—those concerning the child (e.g. gender, age); those concerning the household (e.g. parental levels of schooling, number of siblings, toilet provision, electricity supply as well as such indicators of wealth as having a household car, television, tractor); and those concerning the school (e.g. toilets, drinking water, library, use of multigrade teaching). These variables were also correlated with children’s learning levels.
3.6 Analyses
In addressing the four research questions, we use two approaches. The first is a simple portrayal of the raw data using tables or simple graphs. The second approach, used to address the first three of our questions, is that of logistic regression analysis (Field, 2005; Pallant, 2007). This is a technique that allows us to look at relationships between a set of independent or predictor variables (e.g age of child, parental education levels) and categorical outcome variables (e.g. child can read a story in Urdu). It is important to emphasise that this technique does not address ‘causes’ of learning attainment but rather only relationships or correlations (which themselves might be ‘caused’ by other, perhaps even unmeasured, variables).
In our use of logistic regression we follow up our graphic portrayals by first asking whether we can ‘predict’ children’s attainment from knowledge of the type of schools they attend or from the levels of fee they pay to private schools. This allows us to determine whether any obtained differences or effects are statistically significant as well as to gain quantitative estimates of the size of these effects. We then carry out a second regression analysis in which we include all the other independent variables (child, home, schools) collected in the ASER study. The purpose of this is to tease out further any relationships between children’s attainment and type of school attended. For example, it could be the case that any differences in achievement between private and government schools might be due to entry-level differences between children who attend private and government schools rather than to any differences in the quality of instruction they receive. By including the child, home and school variables in the regression analysis we can ask whether school-type differences remain after we control for these other variables. Table 2 shows all the variables that were included in any of the regression analyses together with an identification of dummy variables and means and standard deviations for each variable. A

12
dummy variable is one that is coded 1 or 0 to indicate the presence or absence of some characteristic or category e.g. a child who succeeds in Reading the Story in Urdu is coded as 1; a child who does not succeed with the task is coded as 0.
Table 2: All variables that could be included in any of the regression analyses.
The criteria (Dependent variables) Mean S.D.
Reading Story (Urdu)
Whether or not the child is able to read a Grade 2 level story in Urdu (Dummy variable: equals 1 if child is able to independently read; 0 otherwise)
0.30 0.46
Solving Division Problems (Arith.)
Whether or not the child is able to solve Grade 2 level division problems (Dummy variable)
0.24 0.43
Reading Sentence (English)
Whether or not the child is able to read Grade 2 level sentences in English (Dummy variable)
0.26 0.44
The ‘predictors’ (Independent variables)
Child Level Variables Mean S.D.
Age Age of the child (in years) 9.27 2.98
Age Squareda Age squared. 94.87 60.07
Male Gender of the child is male (1); female (0). 0.65 0.48
Female Gender of the child is female (1); male (0). 0.35 0.49
Preschool Dummy variable equalling 1 if child has ever attended a preschool; 0 otherwise.
0.39 0.49
Tuition Dummy equalling 1 if the child reports taking paid private supplementary tuition; 0 otherwise.
0.16 0.37
Household Level Variables Mean S.D.
Father Schooling Dummy equalling 1 if child’s father ever attended school; 0 otherwise.
0.52 0.50
Mother Schooling Dummy equalling 1 if child’s mother ever attended school; 0 otherwise.
0.23 0.42
Siblings The number of siblings of the child. 3.47 1.95
Siblings Squareda Number of siblings squared. 15.89 17.05
Kutchab Dummy equalling 1 if the child lives in a kutcha
house; 0 otherwise. 0.44 0.50
Semi-Puccab Dummy equalling 1 if the child lives in a semi-pucca
house; 0 otherwise. 0.34 0.47
Puccab Dummy equalling 1 if the child lives in a pucca
house; 0 otherwise. 0.22 0.41
Electricity Dummy equalling 1 if the household that the child lived in had electricity; 0 otherwise.
0.95 0.22
Toilet Dummy equalling 1 if the household that the child lived in had a toilet; 0 otherwise.
0.79 0.41
Cellular Phone Dummy equalling 1 if the household that the child lived in had more than 1 cellular phone;, 0 otherwise.
0.23 0.42
Television Dummy equalling 1 if the household that the child lived in had at least 1 television set; 0 otherwise.
0.56 0.50
Cycle Dummy equalling 1 if the household that the child lived in had at least 1 cycle; 0 otherwise.
0.33 0.47
Motorcycle Dummy equalling 1 if the household that the child lived in had at least 1 motorcycle, 0 otherwise.
0.34 0.47
Car Dummy equalling 1 if the household that the child lived in had at least 1 car; 0 otherwise.
0.07 0.26

13
Tractor Dummy equalling 1 if the household that the child lived in had at least 1 tractor; 0 otherwise.
0.05 0.22
Miscellaneous Assets
Dummy equalling 1 if the household that the child owned at least 1 of the following assets--rickshaw, qinqi or horse/donkey cart; 0 otherwise.
0.04 0.21
School Level Variables Mean S.D.
Multi-Grade Teaching in Grade 2
c
Dummy equalling 1 if the school that the child goes to has multi-grade teaching in Grade 2; 0 otherwise. 0.50 0.50
Grade 2 in Classrooms
c
Dummy equalling 1 if Grade 2 sits in a classroom in school that the child goes to; 0 otherwise.
0.88 0.33
Grade 2 in Verandah
c Dummy equalling 1 if Grade 2 sits in the verandah in school that the child goes to; 0 otherwise.
0.06 0.23
Grade 2 outdoorc Dummy equalling 1 if grade 2 sits outdoors in school
that the child goes to; 0 otherwise. 0.07 0.25
Blackboard in Grade 2
c
Dummy equalling 1 if grade 2 has a blackboard available in school that the child goes; 0 otherwise.
0.90 0.30
Books in Grade 2c Dummy equalling 1 if 75% or more students in
Grade 2 had books with them in school; 0 otherwise. 0.83 0.37
Supplementary Material in Grade 2
c
Dummy equalling 1 if Grade 2 had supplementary material in class; 0 otherwise.
0.50 0.50
Drinking Water Facility
Dummy equalling 1 if the school that the child goes to has drinking water facility; 0 otherwise. 0.69 0.46
Boundary Walls Dummy equalling 1 if the school that the child goes to has a boundary wall; 0 otherwise.
0.71 0.45
Toilet Facility Dummy equalling 1 if the school that the child goes to has toilet facility for students; 0 otherwise.
0.68 0.47
Library Dummy equalling 1 if the school that the ch.ild goes to has a library; 0 otherwise.
0.26 0.44
Playground Dummy equalling 1 if the school that the child goes to has a playground; 0 otherwise. 0.42 0.49
Pupil Teacher Ratio The pupil teacher ratio in the child’s school 38.00 30.57
School Type Variables
Government Dummy variable equaling 1 if child attends government school; 0 otherwise.
0.86 0.34
Private Dummy equaling 1 if child attends private school; 0 otherwise.
0.14 0.34
Public Private Partnership Schools
Dummy equaling 1 if the child goes to a public private partnership school; 0 otherwise. 0.01 0.07
Fee 1 to 199 Dummy equaling 1 if the child going to a private school pays fee in the range Rs.1 to Rs.199; 0 otherwise.
0.02 0.15
Fee 200 to 399 Dummy equaling 1 if the child going to a private school pays fee in the range Rs.200 to Rs.399; 0 otherwise.
0.07 0.26
Fee 400 to 599 Dummy equaling 1 if the child going to a private school pays fee in the range Rs.400 to Rs.599; 0 otherwise.
0.03 0.17
Fee 600 and above Dummy equaling 1 if the child going to a private school pays fee in the range Rs.600 and above; 0 otherwise.
0.01 0.07
a The variables ‘Age squared’ and “Siblings squared’ were included in order to determine whether the relationship between the dependent variables and age, number of siblings remains constant for every value of age and sibling number, or whether it increases (or decreases)with change in age and number of siblings. b A pucca house is one which has wall and roof made of burnt bricks, stones (packed with lime or

14
4 Results
4.1 Research Questions 1 and 2:
1. Do students of private schools in Pakistan outperform students of government schools?
2. How well do public-private partnership (PPP) schools (a distinctive sub-set of private schools) perform in relation to other private schools and government schools?
Figure 1 compares the performances of Grade 5 children from government, private and Public-Private Partnership (PPP) schools in the three areas of Urdu, arithmetic and English.
Figure 1: Percentages of Grade 5 children from government, private and PPP schools who Can Read Story (Urdu), Do Division (arithmetic) and Read Sentence (English).
What Figure 1 clearly shows is that substantially more children from private schools than from government schools are able to complete the specified tasks in all three areas. All differences are large (12%, 14% and 23%) and, perhaps predictably, the performance differences are greatest for English and least for Urdu. The PPP school students do at least as well if not better than the private school students in all three areas.
It could be the case that the differences seen in Figure 1 are caused by chance alone or that they are due to factors such as differences in children’s prior ability, differences in parental education level or differences in school infrastructures between the private, government and PPP school sectors rather than to
48
36 36
61
51 59
63
50
63
Urdu Arithmetic English
Perc
en
tag
e
Government Private PPP
cement), cement concrete, timber, and roof made of tiles, galvanized corrugated iron sheets, asbestos cement sheet, reinforced brick concrete, reinforced cement concrete and timber etc. A semi-pucca house that has fixed walls made of pucca material but roof is made of material other than that used for pucca house. A kutcha house is made of materials other than pucca materials e.g. unburnt bricks, bamboos, mud, grass, reeds, thatch, loosely packed stones. c These Grade 2 measures are used as proxies for overall school and classroom facilities.

15
differences in the quality of instruction in the different school sectors. To better assess these possibilities, two logistical regression analyses were carried out. The first, reported in Table 3, simply asked whether the relationships observed in Figure 1 between type of school and attainment were statistically significant and what was the order of magnitude of the relationships .The second, presented in Table 4, asked whether relationships between school type were still visible after taking account of the other groups of variables (child, home, school) collected for each child. Results of a logistic regression analysis are many and complex. In Table 3, we present one small, highly selective part of the output of such an analysis. The presented data assess the statistical significance of the relationships shown in Figure 1 as well as the size of the relationship reflected in the ‘odds ratio’. At its simplest, the odds ratio indicates the likelihood (‘odds’) of one group (e.g. private school students) being more likely to succeed on the specified tasks than another group (e.g. government school students). In interpreting an odds ratio, it is helpful to look at how much it deviates from 1. For example, an odds ratio of 1.33 means that in one group the outcome is 33% more likely. An odds ratio of 0.75 means that in one group the outcome is 25% less likely. Table 3 shows these odds ratios for the government/private/PPP schools and the statistical significance of the obtained relationships. Table 3: Odds ratios from logistic regression analysis on performance of private and PPP school students, without controlling for other variables on specified tasks in Urdu, Arithmetic and English (comparator: government school students).
What Table 3 shows is that when no account is taken of any other variables or factors, then private school students outperform government school students (p< .01) on all three measures. For example, from the odds ratios, a private school student is 43% more likely to outperform a government school student on being able to read a story in Urdu, 38% more likely to succeed on the arithmetic task and 80% more likely than a government school student to be able to read a sentence in English. All three of these relationships are significant beyond the .01 level. Likewise, PPP students also seem to outperform government school students in all three areas although the statistical significance of these outcomes is lower than that for the private/government differences (the number of students in the PPP group is only 159 compared to the 26,054 in the government schools and the 3,997 in the private schools.
Criteria
Variables Urdu:
Can read story Arithmetic: Can
do division English: Can read
sentence
Private 1.43*** 1.38*** 1.80***
Public Private Partnership Schools
1.40** 1.34* 1.54***
Omitted category for dummy variables is: Government, i.e. the above results are in comparison to children from government schools. *** p < 0.01 , ** p < 0.05 , * p < 0.10

16
Table 4 shows the outcomes of the logistic regression analysis in which account is taken of other possible effects on, or determinants of, achievement (home, child and school infrastructure factors). Table 4 also shows the relationships between each of the control variables and the three criteria of attainment. Table 4: Odds ratios from logistic regression analysis on performance of private school students on specified tasks in Urdu, Arithmetic and English (comparator: government school students).
Criteria
Variables
Urdu: Can read
story
Arithmetic: Can do division
English: Can read sentence
Private 1.21* 1.50*** 1.86***
Public Private Partnership Schools 0.19* 0.41 1.00
Age 3.13*** 3.20*** 3.02***
Age Squared 0.97*** 0.97*** 0.97***
Male 1.09 0.98 0.98
Preschool 1.08 0.84*** 1.04
Tuition 1.68*** 1.44*** 2.45***
Father Schooling 0.93 0.74*** 0.90
Mother Schooling 1.36*** 1.13 1.30***
Siblings 0.96 1.12*** 1.03
Siblings Squared 1.00 0.98*** 0.99
Kutcha 1.19** 1.10 1.15*
Semi-Pucca 1.18** 1.01 1.06
Electricity 0.67*** 1.02 1.04
Toilet 1.43*** 1.69*** 2.15***
Cellular Phone 0.81*** 0.96 1.03
Television 1.21*** 1.25*** 1.15**
Cycle 0.95 0.92 1.01
Motorcycle 1.33*** 1.14** 1.37***
Car 1.48*** 1.27*** 1.57***
Tractor 0.86 1.11 1.03
Miscellaneous Assets 1.01 1.17 1.30***
Multi-Grade Teaching in Grade 2 1.01 0.76*** 0.81***
Grade 2 in Verandah 1.14 1.46*** 1.88***
Grade 2 outdoor 0.91 0.95 1.12
Blackboard in Grade 2 1.01 1.12 1.46***
Books in Grade 2 1.22*** 1.02 1.23***
Supplementary Material in Grade 2 1.21*** 1.63*** 1.39***

17
What Table 4 clearly shows is that there remain strong private /government school differences even after taking account of all other variables. Private school students are 21% more likely to succeed in the Urdu task; 50% more likely to succeed in the arithmetic task and a large 86% more likely to succeed in the English task. All of these are significant at least at the .05 level. In strong contrast to this, the PPP school outcomes are now very different from before. PPP school students are now equally as likely as government school students (or perhaps even less likely in the case of Urdu) to succeed in the specified tasks. These data, taken together with those in Table 3 strongly suggest that any initial differences between PPP and government school students are due to factors other than the type of school they attend. Some of the other relationships shown in Table 4 are also interesting. Age of children is of course a very good predictor of their academic attainment in all three areas. Mother’s schooling (but not father’s schooling) is related to better academic attainment in Urdu and English, and not in Arithmetic. Private tuition is the largest single apparent external effect on attainment with those undertaking it being on average 86% more likely to succeed on the academic tasks than those not undertaking it. It seems that household infrastructure/wealth is also related to the academic attainment of household children with variables such as household toilet facility, television, motorcycle and car in households all relating to the measures of achievement. Similarly, and somewhat reassuringly, there is a group of school infrastructure/instructional materials variables that seem to relate to attainment (library, books, supplementary materials). Having attended preschool is not significantly related to the measures of subsequent academic attainment.
Drinking Water Facility 1.02 0.99 1.07
Boundary Walls 1.16** 0.80*** 0.81***
Toilet Facility 1.21*** 0.84*** 0.87*
Library 1.62*** 1.40*** 1.53***
Playground 0.67*** 0.73*** 0.60***
Pupil Teacher Ratio 1.00*** 1.00*** 0.99***
Omitted categories for dummy variables are: Government, Female and Pucca, i.e. the results for private and public private partnership are compared to government; results for male are compared to female and results for kutcha and semi pucca are compared to pucca. *** p < 0.01 , ** p < 0.05 , * p < 0.10

18
4.2 Research Question 3: Does the level of private school fee correlate with the level of student achievement?
In Table 5 we first examine the distribution of fees paid by the students of the private schools in the study. Table 5: Frequencies of students paying private school fees at the specified levels. Fee levels per month (in rupees)
Number paying
% paying Cumulative % No. of unique values for fee
Rs. 0 – 199 736 18 18 19
Rs. 200 – 399 2147 54 72 23
Rs. 400 – 599 949 24 96 13
Rs. 600 and above 165 4 100 12
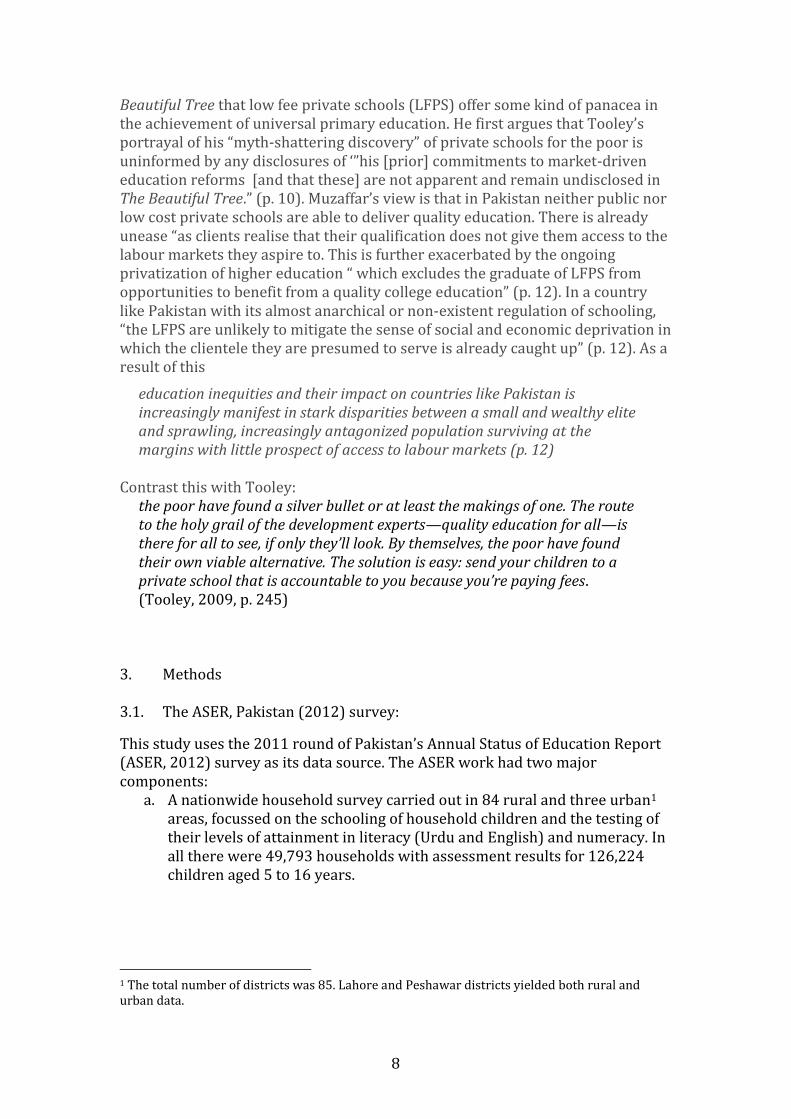
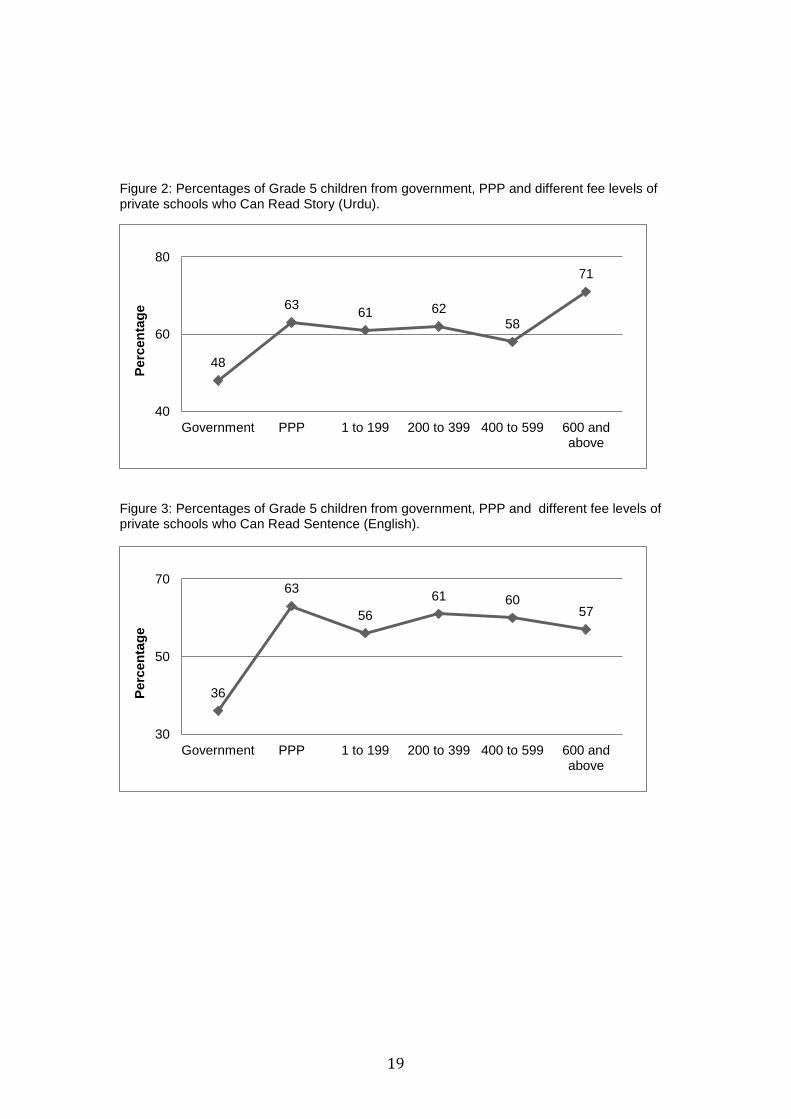
Table 5 shows a heavily skewed distribution of fees paid to private schools by children2 included in this study. Almost three-quarters of all children pay a monthly fee of less than 400 rupees whilst more than 95% of all children pay less than Rs. 600 per month. The overall range in fees in the sample was from Rs.10 to Rs. 6750 per month. We wanted to ask whether children paying higher fees were gaining greater academic achievements than those paying lesser fees. We were also particularly interested in whether children attending ‘low cost’ private schools would outperform their colleagues in government schools and how their performance would compare with that of children attending PPP schools. To address these questions we first grouped together all students paying more than 600 rupees per month (even when taken together these students represented only 4% of all fee-paying students). This procedure yielded four different fee-paying groups ranging from a) those paying less than 200 rupees per month, through b) 200 to 399 and c) 400 to 599 rupees per month to d) those paying 600 rupees each month. The academic results obtained by government school students, PPP school students and by the four different groupings of private school fee-payers are shown in Figures 2, 3 and 4.
2 This Table does not include the children attending Public Private Partnership schools. They do not pay fees to the schools they attend. For most, the provincial Education Foundations pay their fees or part-fees directly to the schools. Also, we are aware of private schools in Pakistan that charge much more than the highest fee recorded in these data.
19
Figure 2: Percentages of Grade 5 children from government, PPP and different fee levels of private schools who Can Read Story (Urdu).
Figure 3: Percentages of Grade 5 children from government, PPP and different fee levels of private schools who Can Read Sentence (English).
48
63 61 62
58
71
40
60
80
Government PPP 1 to 199 200 to 399 400 to 599 600 and above
Perc
en
tag
e
36
63
56
61 60 57
30
50
70
Government PPP 1 to 199 200 to 399 400 to 599 600 and above
Perc
en
tag
e
20
Figure 4: Percentages of Grade 5 children from government, PPP and different fee levels of private schools who Can Do Division (Arithmetic).
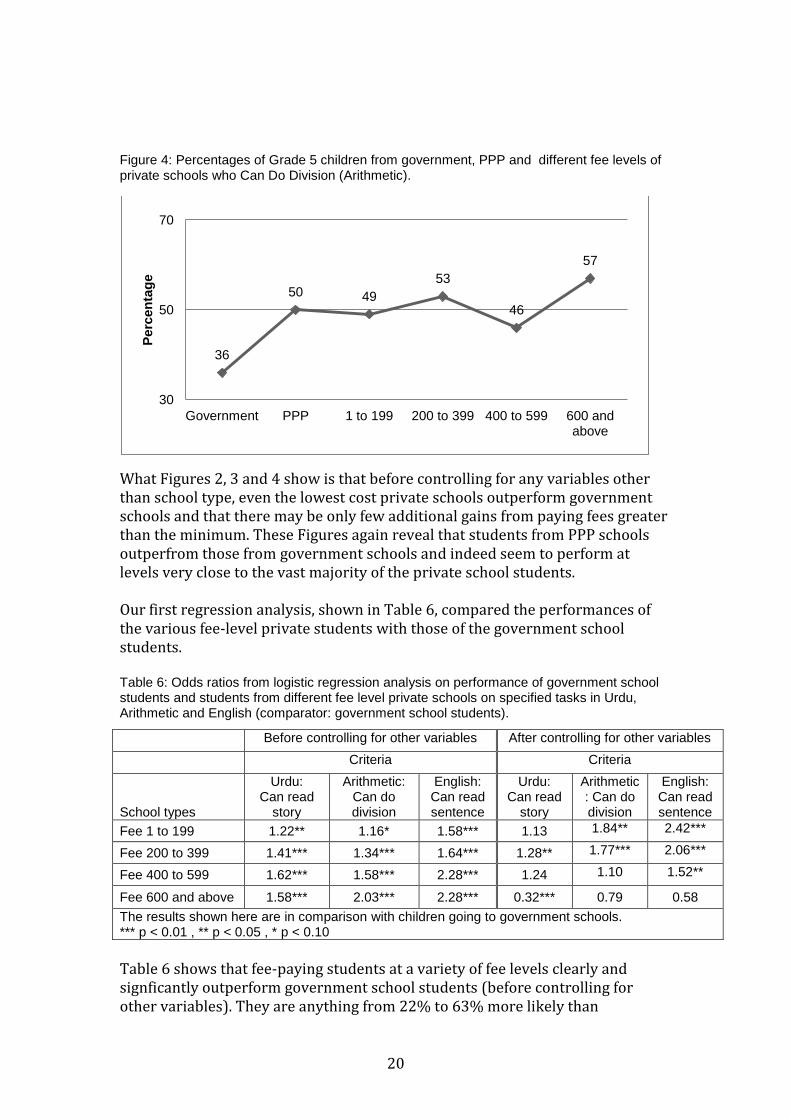
What Figures 2, 3 and 4 show is that before controlling for any variables other than school type, even the lowest cost private schools outperform government schools and that there may be only few additional gains from paying fees greater than the minimum. These Figures again reveal that students from PPP schools outperfrom those from government schools and indeed seem to perform at levels very close to the vast majority of the private school students. Our first regression analysis, shown in Table 6, compared the performances of the various fee-level private students with those of the government school students. Table 6: Odds ratios from logistic regression analysis on performance of government school students and students from different fee level private schools on specified tasks in Urdu, Arithmetic and English (comparator: government school students).
Table 6 shows that fee-paying students at a variety of fee levels clearly and signficantly outperform government school students (before controlling for other variables). They are anything from 22% to 63% more likely than
36
50 49
53
46
57
30
50
70
Government PPP 1 to 199 200 to 399 400 to 599 600 and above
Perc
en
tag
e
Before controlling for other variables After controlling for other variables
Criteria Criteria
School types
Urdu: Can read
story
Arithmetic: Can do division
English: Can read sentence
Urdu: Can read
story
Arithmetic: Can do division
English: Can read sentence
Fee 1 to 199 1.22** 1.16* 1.58*** 1.13 1.84** 2.42***
Fee 200 to 399 1.41*** 1.34*** 1.64*** 1.28** 1.77*** 2.06***
Fee 400 to 599 1.62*** 1.58*** 2.28*** 1.24 1.10 1.52**
Fee 600 and above 1.58*** 2.03*** 2.28*** 0.32*** 0.79 0.58
The results shown here are in comparison with children going to government schools. *** p < 0.01 , ** p < 0.05 , * p < 0.10

21
governement school students to be able to read a story in Urdu and are anything from 16% to 103% more likely to be able to succeed in the arithmetic task. The differences are strikingly largest in English, with private school students being from 58% to 128% more likely to be able to read sentences in English. There is also visible a clear trend for those who pay larger fees to be more likely to be more successful in English, and indeed, on average in all three academic areas. Once we control for other variables, the private school superiority over government schools is less but still visible. But what is striking from Table 6 is that at the two higher fee levels there is only one significant difference favouring the private students (51% more likely succeed at the English task) but also one significant difference showing that the highest fee-paying group is 68% less likely than the government school students to succeed at the Urdu task. What these data reveal is that there are factors other than school type that serve to differentiate private school from government school performance. It also suggests that higher fees do not necessarily lead to higher academic performance. Table 7 explores the performance of PPP students directly against those of government and private school students both before and after controlling for other variables. As Figures 2, 3 and 4 had shown and table 7 confirms, PPP students, before controlling for other variables, clearly outperform government school students and perform just as well as private school students. Table 7: Odds ratios from logistic regression analysis on performance of PPP school students, on specified tasks in Urdu, Arithmetic and English (comparator: PPP school students).
But what the second part of the data of Table 7 strikingly emphasises is the ‘reversal of fortunes’ of the PPP students (suggested earlier in Tables 3 and 4). Before controlling for other variables, government school students do significantly less well on all three academic criteria than do PPP students whilst the PPP students do not differ significantly from their private school counterparts. However, after controlling for other variables, both government and private school students are now seen very substantially to outperform their PPP
Before controlling for other variables After controlling for other variables
Criteria Criteria
School types
Urdu: Can read
story
Arithmetic: Can do division
English: Can read sentence
Urdu: Can read
story
Arithmetic: Can do division
English: Can read sentence
Government 0.72** 0.75* 0.65*** 5.15** 2.43 1.00
Private Schools 1.02 1.03 1.16 6.23** 3.65 1.85
The results shown here all are in comparison to children going to public private partnership schools. *** p < 0.01 , ** p < 0.05 , * p < 0.10
22
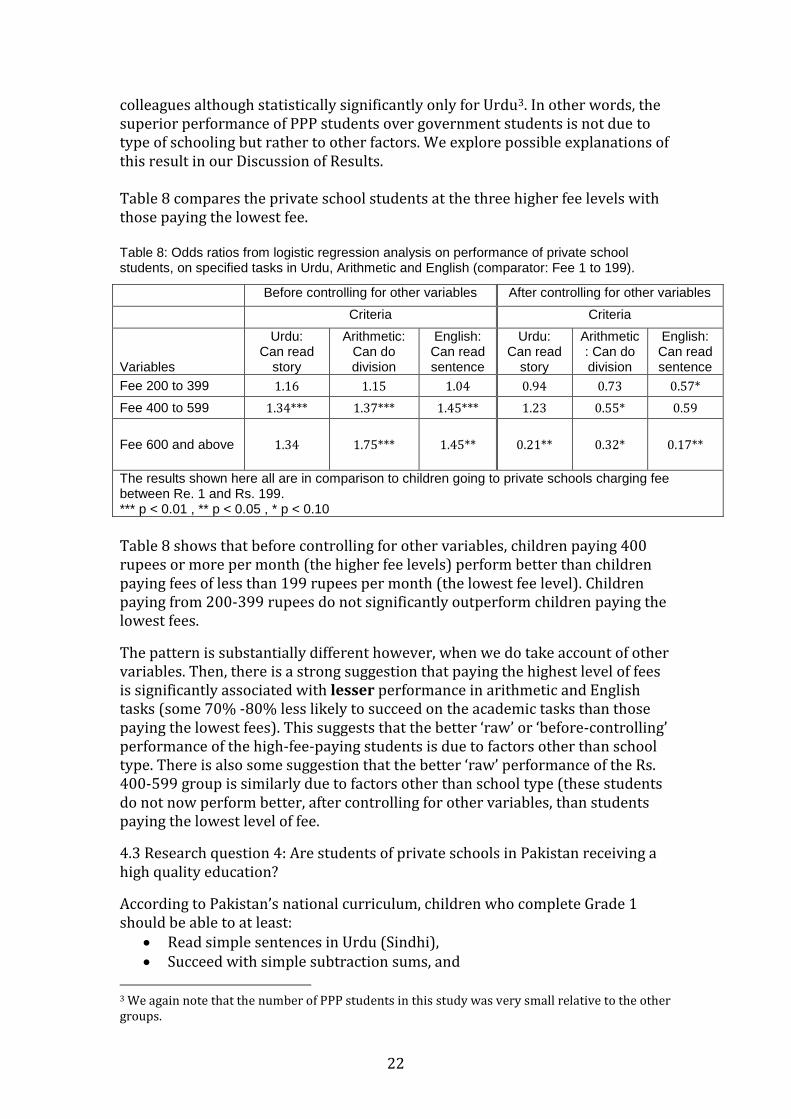
colleagues although statistically significantly only for Urdu3. In other words, the superior performance of PPP students over government students is not due to type of schooling but rather to other factors. We explore possible explanations of this result in our Discussion of Results. Table 8 compares the private school students at the three higher fee levels with those paying the lowest fee. Table 8: Odds ratios from logistic regression analysis on performance of private school students, on specified tasks in Urdu, Arithmetic and English (comparator: Fee 1 to 199).
Table 8 shows that before controlling for other variables, children paying 400 rupees or more per month (the higher fee levels) perform better than children paying fees of less than 199 rupees per month (the lowest fee level). Children paying from 200-399 rupees do not significantly outperform children paying the lowest fees.
The pattern is substantially different however, when we do take account of other variables. Then, there is a strong suggestion that paying the highest level of fees is significantly associated with lesser performance in arithmetic and English tasks (some 70% -80% less likely to succeed on the academic tasks than those paying the lowest fees). This suggests that the better ‘raw’ or ‘before-controlling’ performance of the high-fee-paying students is due to factors other than school type. There is also some suggestion that the better ‘raw’ performance of the Rs. 400-599 group is similarly due to factors other than school type (these students do not now perform better, after controlling for other variables, than students paying the lowest level of fee.
4.3 Research question 4: Are students of private schools in Pakistan receiving a high quality education?
According to Pakistan’s national curriculum, children who complete Grade 1 should be able to at least:
Read simple sentences in Urdu (Sindhi), Succeed with simple subtraction sums, and
3 We again note that the number of PPP students in this study was very small relative to the other groups.
Before controlling for other variables After controlling for other variables
Criteria Criteria
Variables
Urdu: Can read
story
Arithmetic: Can do division
English: Can read sentence
Urdu: Can read
story
Arithmetic: Can do division
English: Can read sentence
Fee 200 to 399 1.16 1.15 1.04 0.94 0.73 0.57*
Fee 400 to 599 1.34*** 1.37*** 1.45*** 1.23 0.55* 0.59
Fee 600 and above 1.34 1.75*** 1.45** 0.21** 0.32* 0.17**
The results shown here all are in comparison to children going to private schools charging fee between Re. 1 and Rs. 199. *** p < 0.01 , ** p < 0.05 , * p < 0.10

23
Read simple words in English. In this study, the percentages of Grade 3 children from private schools NOT able to undertake these tasks are shown in Figure 5. Figure 5: Percentages of Grade 3 private school students NOT able to undertake specified end-of-Grade-1 tasks.
According to Pakistan’s national curriculum, children who complete Grade 2 should be able to at least:
Read a simple story in the Urdu language (Sindhi), Succeed with division (3 digits by 1) in arithmetic, and Read simple sentences in English.
Figure 6 shows the percentages of Grade 5 children from private schools NOT able to undertake these tasks. Figure 6: Percentages of Grade 5 private school students NOT able to undertake specified end-of-Grade-2 tasks.
The ASER assessment tools were designed in accordance with the national curriculum standards of Pakistan. They test for the lowest order of skills that are required according to the Grade 1 and Grade 2 curriculum. Thus, what the results presented in Figures 5 and 6 show is a clearly unsatisfactory state of affairs. Among Grade 3 private school students, one-third to one-half of all students are unable to complete end-of-Grade-1 tasks in Urdu, Arithmetic and English. The results for Grade 5 private school children are worse. Forty or more percent of all Grade 5 private school children cannot complete end-of-Grade-2 tasks in Urdu, Arithmetic and English. Perhaps most surprising in these results from the private schools is that the performance levels are worst in English. Yet, it is the
45%
32%
49%
Urdu
Arithmetic
English
40%
41%
50%
Urdu
Arithmetic
English

24
learning of English that is supposedly one of the reasons why parents enrol their children in private schools. It is obvious that private sector schools are not serving the need of parents and children for education of a high quality. Further, given that these private school performances are generally better than those of government schools, it is manifestly clear that none of the private, government or PPP sectors is providing high quality education to their communities. 5. Discussion of results The results of this study show that:
private school students generally outperform students from the government sector and that some of these differences are probably due to differences in school type;
students from Public-Private Partnership schools generally outperform students from government schools and perform close to equally with students from private schools. However, their superior performance over government schools seems not to be due to school type but to other factors;
students from very low- and low-fee private schools outperform students from government schools;
higher fee schools (paying from Rs. 400 per month and upwards) generally outperform low fee schools but this difference seems attributable to factors other than the higher fee level itself;
all school types, whether government, private or public-private partnerships seem to be failing their communities in terms of the learning of their students when it is benchmarked against Pakistan’s national curriculum standards.
It is very clear from our data that private schools are by no means the ‘silver bullet’ for providing high quality education for the poor as was suggested by Tooley (2009). Rather, our entire set of data suggests that there remain continuing questions and issues that need to be resolved. A first example is that students who pay the lowest level of fees do outperform students from government schools but those who pay higher fees do not outperform those paying lower fees. This is clearly a topic of great interest and of some puzzlement to those who struggle and sacrifice in order to pay for their children’s schooling. A second example is that students who attend PPP schools outperform government school students and do as well as students from private schools. However, this does not seem to be due to type of school attended but rather to the effects of other extraneous variables. This is a topic that ought to be of substantial interest to those international aid agencies that have championed public-private partnership schooling as a mechanism for better-quality education at significantly less cost than that in the government school system. Only when some of the puzzles are solved will it become easier for policy-makers to address the complex issues arising from studies like this.

25
One interesting hypothesis about private schools and quality (Amjad, 2012) is that they benchmark themselves against the government schools in their localities and need offer only slightly superior facilities and somewhat better resources and teaching in order to attract students to them. This possibility, if true, serves to put an immediate cap on private schools’ pursuit of excellence. There is no incentive for them to continue to improve just beyond the low level set by the government schools. Thus, for example, the ASER survey showed that 26% of private primary schools lacked useable toilets but this was true of 57% of government primary schools. But it is by no means the case that all private schools are better than all government schools. An interesting indicative example of this is in Peshawar district. This district contains both urban and rural areas. Here, the data show that urban private schools outperform urban government schools. But it is also the case that these same urban government schools clearly outperform rural private schools. For example the percentages succeeding in the end-of-Grade 2 Urdu task are 58% (urban, private); 45% (urban, government) but only 27% in rural, private. Comparable figures for English are 70% (urban, private) 50% (urban, government) but only 24% in the rural private schools of Peshawar district. This topic of possible benchmarking is clearly worthy of further investigation in that the data are not inconsistent with benchmarking to the lowest common denominator. At a policy level, it could be the case that a small investment in rural, government schools might provide dividends well beyond the costs of such initiatives. As corollary, it could be that investing in quality through private schooling will be a totally insufficient way of addressing overall educational quality. The issue of differing fee levels in private schools is puzzling. Students from higher fee private schools do better than those from low fee-paying schools. However, once we control for other variables not only does this difference disappear but perhaps even reverses. We explored this issue further by running a series of regression analyses in an attempt to identify which variables, other than level of fees, seemed to be associated with greater student attainment. It emerged that the variables mainly accounting for this were those labelled as “Child Level ” (see Table 2), including age, gender, preschooling and tuition acting in combination. This suggests that one of the factors determining better performance of the higher-fee schools might be the entry characteristics of students compared with those entering lower-fee schools. However, this is but a tentative hypothesis. What is most clear to us is that this is an area of obviously great interest to parents and other fee-payers and that further enquiry is clearly warranted. The case of public-private partnership schools is also of great interest. Our regression analysis showed that their superiority over government schools was due to factors other than school type. In this case, our search for such factors was greatly assisted by the ASER (2012) data that showed the percentages of children from the various school types (private—high, medium, low and very low fee; PPP and government) taking private supplementary tuition. These data are shown in Figure 7.

26
Figure 7: Percentages of children taking private supplementary tuition according to school type.
Figure 7 reveals that children attending PPP schools are almost five times as likely as children attending government schools to be receiving private tuition. To examine this further, a regression analysis was carried out using private tuition as the single ‘other’ factor in addition to school type. When we first compared PPP and government schools, the PPP students were 40% more likely to succeed on the Urdu task. When we took account of tuition levels for the two sectors, the outcome was that children from PPP schools were 74% less likely to succeed on the Urdu task. The results for arithmetic and English were similar, strongly suggesting that it was the much greater incidence of private tuition that might explain the PPP students’ superior performance rather than any intrinsic difference in the schooling they received. Could it be that any parental or family savings by not having to pay fees for their children’s education were being applied to private tuition? Further, as the data of Figure 8 show that this was not because PPP families paid more on average for tuition – in fact they paid less on average (Rs. 207 per month) than families of children attending government schools (Rs. 261. per month).
11
52
75
64 61
73
0
50
100
Government PPPschool 1 to 199 200 to 399 400 to 599 600 and above
Perc
en
tag
e
Percentage of children

27
Figure 8: Average private tuition fees paid by families whose children attended different school types.
Interestingly, Figure 8 also shows that the level of payment for tuition rises sharply alongside the level of private school fees. It is clear to us that more work is required on private tuition and its role alongside private fee-paying schools (cf. Bray, 2009). This is especially important when Figure 7 reveals that the incidence of private tuition is not only five times greater in PPP schools than in government schools but that it is six to seven times greater in private schools than it is in government schools. What has become abundantly clear from this study is that there remain many questions about the efficacy and effectiveness of private education and of public-private partnership education as well as their interaction with an apparently effective private tuition industry. Of even more concern is that government school education remains mysteriously ineffective despite the now-massive investment that the Government of Pakistan has made in boosting teacher salaries. For policy-makers, there are no clear answers. Many ideologues saw answers to the development of educational quality in the privatisation of education or in the development of public-private partnerships in education. This study demonstrates that these are not simple solutions and that the quality of school education in Pakistan remains of deep concern across all three of the public, private and public-private partnership sectors. Further, there also remain many issues of value and ethics (e.g. levels of teacher salary in private schools) that cannot be resolved by evidence alone.
* * *
Acknowledgements: ASER Pakistan 2012 was funded by multiple organisations including Department for International Development (UK), Dubai Cares, Foundation Open Society Institute, Idara-e-Taleem-o-Aagahi, Oxfam Hong Kong, Oxfam Novib and Sindh Education Foundation. We acknowledge the contribution
261 207
239 249
427
591
0
350
700
Government PPPschools 1-199 200-399 400-599 600 and above
Ru
pp
ees
Types of Schools

28
of Baela Raza Jamil, Iffat Farah, Suwaibah Mehreen Mansoor and our colleagues at Idara-e-Taleem-o-Aagahi and ASER for their support of this work.
29
References Amjad, R. 2012. Are private schools better at imparting learning than government schools? In Annual Status of Education Report, 2012 Andrabi, T., Das, J., and Khwaja, A. 2006. A Dime a Day: The Possibilities and Limits of Private Schooling in Pakistan. World Bank Policy Research Working Paper, Washington, DC. (Also in Comparative Education Review, 52, 3, 329-55.) Andrabi, T., Das, J., Khwaja, A., Vishwanath, T., Zajonc , T. and The LEAPS Team. Learning and Educational Achievement in Punjab Schools (LEAPS). World Bank Working Paper, Washington DC. Annual Status of Education Report (ASER) 2012. Lahore, Pakistan. Facilitated by South Asian Foundation for Educational Development,. Available at http://www.aserpakistan.safedafed.org/document/aser/2011/ASERPakistan2011.pdf Aslam, M. 2003. The Determinants of Student Achievement in Government and Private Schools in Pakistan. The Pakistan Development Review 42, 4, 841–876 * Aslam, M. 2006. The Quality of School Provision in Pakistan: Are Girls Worse Off? Economic and Social Research Council Global Poverty Research Group Paper GPRG-WPS-066. Bano, M. 2008. Public-Private Partnerships (PPPs) as ‘anchor’ of educational reforms: lessons from Pakistan. Background paper prepared for the Education for All Global Monitoring Report 2009/ED/EFA/MRT/PI/12. Bray, M. 2009. Confronting the shadow education system. What government policies for what private tutoring?, Paris: UNESCO International Institute for Educational Planning, 2009, Chudgar, A. 2012. Variation in Private School Performance: The Importance of Village Context. Economic and Political Weekly, XLVII, 11, 53-59. Field, A. 2005. Discovering Statistics Using SPSS (2nd edition) SAGE Publications, London. French, R. and Kingdon, G. 2010. The relative effectiveness of private and government schools in Rural India: Evidence from ASER data. DoQSS Working Papers 10-03, Department of Quantitative Social Science - Institute of Education, University of London. Goyal, S. and Pandey, P., 2009. How do Government and Private Schools Differ? Finding from two large Indian States. South Asia Human Development Sector Report 30, World Bank, Washington DC.

30
International Development Association 2012. IDA at Work: Pakistan. Public-Private Partnerships Boost Education. Downloaded from http://go.worldbank.org/NYJ5900J81 , July 2012. Jain, P. and Dholakia, R. 2009. Feasibility of Implementation of Right to Education Act. Economic and Political Weekly, 45, 8, 78-80. Jain,. P and Dholakia, R. 2010. Right to Education Act and Public-Private Partnership. Economic and Political Weekly, XLV, 8, 78-80. Jain. M. and Saxena, S. 2010. Politics of Low Cost Schooling and Low Teacher Salaries. Economic and Political Weekly. 45, 18, 79-80. Jimenez, E, Lockheed, M. and Paqueo, V. 1991. The Relative Efficiency of Private and Public Schools in Developing Countries, The World Bank Research Observer, 6, 2, 205-18. Kingdon 1996 The Quality and Efficiency of private and Public Education: A Case Study in Urban India. Oxford Bulletin of Economics and Statistics, 58 (1), 57-81. LaRocque, N. 2008 Public-Private Partnerships in Basic Education: An International Review. CfBT Education Trust. Downloaded July 2012 from http://www.cfbt.com/evidenceforeducation/pdf/PPP.pdf Malik, A. B. 2010 Public-Private Partnerships in Education. Lessons learned form the Punjab Education Foundation. Mandaluyong City, Philippines: Asian Development Bank. Muralidharan, K. and Kremer, M. 2006 . Public and Private Schools in Rural India. Mime: Harvard University. Muzaffar, I. 2010. Education in Pakistan: the nickel and dime route to ruin? Campaign for Quality Education Working Paper Series, Available at http://www.cqe.net.pk/cqepublications.php Muzaffar, I. 2012. Public and Private Schooling: Taking the Current Debate Forward. ? In Annual Status of Education Report, 2012 Lahore, Pakistan: Facilitated by South Asian Foundation for Educational Development,. Available at http://www.aserpakistan.safedafed.org/document/aser/2011/ASERPakistan2011.pdf Nambissan, G. and Ball, S. 2010. Advocacy networks, choice and private schooling of the poor in India. Global Networks 10, 3, 1-20. Rangaraju, B., Tooley, J., and Dixon, P. The Private School Revolution in Bihar: Findings from a survey in Patna Urban. New Delhi, India Institute. Sarangapani, P. 2009. Quality, Feasibility and Desirability of Low Cost Private Schooling. Economic and Political Weekly, XLIV, 43, 67-69.

31
Tooley, J. 2009. The Beautiful Tree, Cato Institute, Washington DC. Tooley, J. , Dixon, P and Gomathi, S. 2007 Private Schools and the Millennium Development Goal of Universal Primary Education: A Census and Comparative Survey in Hyderabad, India. Oxford Review of Education 33, 5, 539-60. Tooley, J. and Dixon, P. 2003 Private Schools for the Poor: A Case Study from India. Reading, England: CfBT. Tooley, J. and Dixon, P. ‘De facto’ Privatisation of Education and the Poor: Implications of a Study from Sub-Saharan Africa and India, Compare 36, no. 4, 443-62. 2006 Pallant, J. 2007, SPSS Survival Manual, (3rd edition), Allen & Unwin, Crows Nest, Australia. Psacharopoulos, G. 1987. Public versus Private Schools in Developing Countries: Evidence from Colombia and Tanzania. International Journal of Educational Development, 7, 1, 59–67. Wößmann, L. 2005. Public-Private Partnerships in Schooling: Cross-Country Evidence on their Effectiveness in Providing Cognitive Skills, Research Report PEPG 05–09, Program on Education Policy and Governance, Harvard University.