exploring ai-based personalization of a mobile health
TRANSCRIPT

Exploring AI-based personalization of a mobile health
intervention and its effects on behavior change, motivation,
and adherence
JULIAN ANDRES RAMOS ROJAS
CMU-HCII-21-1041 September 2021
Human-Computer Interaction InstituteSchool of Computer ScienceCarnegie Mellon University
Pittsburgh, PA
Thesis committee:Anind K. Dey (Co-Chair), University of Washington
Mayank Goel (Co-chair), CMUCarissa Low, University of Pittsburgh
Tanzeem Choudhury, Cornell UniversityRobert Kraut, CMU
Submitted in partial fulfillment of the requirementsfor the degree of Doctor of Philosophy.
Copyright ©2021 Julian Ramos Rojas
This work was supported by the National Science Foundation under grant IIS-1407630, the National Key Research andDevelopment Plan under Grant No. 2016YFB1001200, and the Carnegie Mellon University Software Engineering Institute.The author was also supported by the Center for Machine Learning and Health (CMLH) Fellowship in Digital Health andthe 2019 Microsoft Research Dissertation Grant. The views and conclusions contained in this document are those of theauthor and should not be interpreted as representing the official policies, either expressed or implied, of any sponsoringinstitution, the U.S. government or any other entity.

Keyworkds: Mobile Health, Artificial Intelligence, Human-AI Interaction, Machine
Learning, Digital Health

To Johana, Ada and Oliver

Abstract
Medical treatments are traditionally personalized in a manual process by healthcare
practitioners. Personalization starts with a one-size-fits-all treatment adjusted for each patient
in a lengthy trial and error process. Unfortunately, this process can result in unnecessary
treatment, exposure to side effects, and patient loss of interest due to treatment ineffectiveness.
Mobile health (mHealth) researchers have investigated ways to decrease ineffective treatment
exposure by personalizing health interventions using Artificial Intelligence (AI). AI methods
like contextual-bandits are often used for personalizing content (i.e., which health advice
to provide) with promising results. However, content personalization approaches alone are
underpowered by lacking personalization of time of treatment: an active component that
delivers health advice in the form of alerts or reminders at appropriate times (e.g., time,
location, and activity). State of the art work has shown that reminders alone can increase
treatment adherence but have not resulted in behavior change yet.
In this thesis, I developed and tested a method for personalizing mobile health interven-
tions’ content and timing of treatment. I tested this approach in a real-world deployment
(n=30, spring 2019) of a behavioral sleep intervention. I found that this personalization ap-
proach improved sleep duration, motivation to improve sleep-related behaviors, and adherence
to sleep advice. In addition, I discovered that contextual factors and participant intrinsic
characteristics have a significant effect on adherence to treatment. Building on these results, I
implemented a machine learning classifier that predicts next-day adherence to treatment with
promising performance.
Following up on the results from the sleep intervention, I deployed a larger (n=80) to
investigate further the marginal effects of personalization of content and treatment timing.
The intervention was deployed sleep days before the beginning of the 2020 pandemic. This
intervention did not result in behavior change. In this part of my thesis, I investigate this 2020
deployment and the specific causes of the null intervention results. I compare the behaviors
v

vi ABSTRACT
of the participants in the 2020 and 2019 studies using behavioral logs, phone usage, and
sensor streams and surveys. I found that a lack of motivation caused by anxiety and stress
induced by the pandemic and a drastic change in phone use and daily routines were the most
likely reasons for the null intervention results. I close this thesis with recommendations on
preparing for abrupt changes in their daily behavior and how they interact with computing
devices used for intervention purposes.
In summary, this thesis contributes 1) A novel, effective, and sample efficient approach
for the simultaneous personalization of content and timing of treatment using AI, sensors,
and human feedback, 2) A deployment and test of a system using the personalization method
mentioned above, 3) Findings on contributing factors that change adherence to treatment in
the context of a behavioral intervention, 4) A machine learning classifier for the prediction of
intraday adherence and 5)The development of a framework for understanding contributing
factors that lead to null results during a pandemic and may generalize to pandemic-like events.
Acknowledgements
I dedicate this thesis to the love of my life Johana Rosas and my children Ada and Oliver:
You are the bright spot of my day and kept me grounded in the world outside my research. I
also dedicate this thesis to my parents Antonio and Maria, for teaching me the value of hard
work, honesty, and family. Last, I dedicate this thesis to my sister Leidy for taking care of me
when I needed it the most.
I want to thank, first and foremost, my advisor Anind Dey for believing in me from day
one. For teaching me by example work ethic, pushing me to achieve beyond what I thought
was possible, and leading me to work on research topics that are impactful and can improve
people’s lives. I also want to thank my second advisor Mayank Goel for adopting me as his
advisee after Anind’s departure from CMU. Mayank’s support was fundamental for my work,
and his impact-first approach led my research out of my comfort zone.
I also want to thank my thesis committee: Carissa Low, who greatly influenced my work
and help me shape studies and understanding better the intricacies of medical research in
mobile health. Bob Kraut supported me greatly in better defining the research questions to
pursue in my dissertation and guided my statistical analysis and hypothesis testing. Finally,
Tanzeem Choudhury helped me think beyond the immediate effects of health improvements
and think about the bigger picture and importance of my work in digital health.
I could not have possibly made it to the end of this journey without the friendship and
support of all the fantastic people I met at CMU and the HCII. I am incredibly thankful for
sharing this time with Steven Dang and Rushil Khurana: We spent uncountable times hanging
out, bouncing off ideas, and you both carried me over through some challenging patches.
I also would like to thank my peers Karan Ahuja, Abdelkareem Bedri, Julia Cambre, Cori
Faklaris, Kenneth Holstein, Vikram Kamath, MaryBeth Kery, Toby Li, Alexandra To, Judith
Uchidiuno, Stephanie Valencia, Françeska Xhakaj, and Siyan Zhao: I feel lucky to have
vii

viii ACKNOWLEDGEMENTS
shared with you the joys and the hurdles of this journey and you are without a doubt among
the most talented and intelligent people I have ever met.
To Queenie Kravitz and Rachel Burcin: Thank you both for supporting me, for being my
cheerleaders, for your thoughtful and kind advice over the years.
My journey at CMU started way before my Ph.D., and I had the fortune to collaborate
with exceptional researchers that profoundly shaped my research views and approaches. I
am in great debt with my undergrad thesis supervisor Watson L. Vargas who offered me
my first job as a researcher and pushed me to aim high and in Pittsburgh/CMU’s direction.
Before I started working in HCI, I worked in the robotics institute and had the opportunity to
collaborate with Sajid Siddiqi, Byron Boots, and Geoff Gordon: Thank you for believing in
me and supporting me during the beginning of my career as a researcher.
After my work at the robotics institute, I met Anind and joined his lab, where I worked
with Jin-Hyuk Hong, who introduced me to the world of applied machine learning. To
Jin-Hyuk Hong: Thank you for your patience, your positive attitude and for introducing me to
this black art that is artificial intelligence. I had my first foray into interruptibility work with
Tadashi Okoshi, who graciously allowed me to help in his projects. This collaboration turned
out very fruitful, and I ended up extending interruptibility into receptivity for my Ph.D. thesis.
To Tadashi: Thank you for inviting me to collaborate on your project, your strong work ethic
and HCI research insights had a strong influence on my work.
To former and current members of the Dey-UbicompLab Grace Bae, Nikola Banovic,
Afsaneh Doryab, Adrian A. de Freitas, Denzil Ferreira, SeungJun Kim, Jennifer Mankoff,
Stephanie Rosenthal, Dan Tasse, Hongyi Wen, Katarzyna Wac, Alaaeddine Yousfi, Orson Xu
and Sha Zhao: Thank you for your collaboration and support on my research.

ix
Contents
Abstract v
Acknowledgements vii
Contents x
List of Figures xiv
Chapter 1 Introduction 1
1.1 Aims . . . . . . . . . . . . . . . . . . . . . . . . . . . . . . . . . . . . . . . . . . . . . . . . . . . . . . . . . . . . . . . . . . . 3
1.2 Contribution . . . . . . . . . . . . . . . . . . . . . . . . . . . . . . . . . . . . . . . . . . . . . . . . . . . . . . . . . . . . 5
Chapter 2 Preliminaries 6
2.1 The elements of a mobile health intervention . . . . . . . . . . . . . . . . . . . . . . . . . . . . . . . 6
2.1.1 Distal outcomes . . . . . . . . . . . . . . . . . . . . . . . . . . . . . . . . . . . . . . . . . . . . . . . . . . . . 8
2.1.2 Proximal outcomes . . . . . . . . . . . . . . . . . . . . . . . . . . . . . . . . . . . . . . . . . . . . . . . . . 8
2.1.3 Decision points . . . . . . . . . . . . . . . . . . . . . . . . . . . . . . . . . . . . . . . . . . . . . . . . . . . . . 8
2.1.4 Intervention points . . . . . . . . . . . . . . . . . . . . . . . . . . . . . . . . . . . . . . . . . . . . . . . . . . 9
2.1.5 Available treatments . . . . . . . . . . . . . . . . . . . . . . . . . . . . . . . . . . . . . . . . . . . . . . . . 11
2.1.6 Tailoring variables . . . . . . . . . . . . . . . . . . . . . . . . . . . . . . . . . . . . . . . . . . . . . . . . . . 11
2.1.7 Treatment selection . . . . . . . . . . . . . . . . . . . . . . . . . . . . . . . . . . . . . . . . . . . . . . . . . 12
2.2 Dimensions of personalization in mhealth interventions . . . . . . . . . . . . . . . . . . . . . . 12
Chapter 3 Sleep health and interventions 15
3.1 Sleep Definition and Motivation . . . . . . . . . . . . . . . . . . . . . . . . . . . . . . . . . . . . . . . . . . . 15
3.2 Sleep in Human-computer interaction . . . . . . . . . . . . . . . . . . . . . . . . . . . . . . . . . . . . . . 16
Chapter 4 The SleepU app 19
4.1 App description and walk-through . . . . . . . . . . . . . . . . . . . . . . . . . . . . . . . . . . . . . . . . . 20x

CONTENTS xi
4.1.1 Design principles and connection to behavior change theories . . . . . . . . . . . 23
Chapter 5 Personalization of time of treatment: Mobile-receptivity detection 25
5.1 Related work . . . . . . . . . . . . . . . . . . . . . . . . . . . . . . . . . . . . . . . . . . . . . . . . . . . . . . . . . . . . 26
5.2 Mobile-receptivity and interruptibility . . . . . . . . . . . . . . . . . . . . . . . . . . . . . . . . . . . . . 27
5.2.1 Detecting interruptibility . . . . . . . . . . . . . . . . . . . . . . . . . . . . . . . . . . . . . . . . . . . . 28
5.2.2 Features . . . . . . . . . . . . . . . . . . . . . . . . . . . . . . . . . . . . . . . . . . . . . . . . . . . . . . . . . . . 28
5.3 Mobile-receptivity detection . . . . . . . . . . . . . . . . . . . . . . . . . . . . . . . . . . . . . . . . . . . . . . 31
5.3.1 Data collection and features . . . . . . . . . . . . . . . . . . . . . . . . . . . . . . . . . . . . . . . . . . 31
5.3.2 Machine Learning Pipeline . . . . . . . . . . . . . . . . . . . . . . . . . . . . . . . . . . . . . . . . . . 32
5.3.3 Classifier and Performance evaluation . . . . . . . . . . . . . . . . . . . . . . . . . . . . . . . . 32
5.3.4 Receptivity detection during intervention. . . . . . . . . . . . . . . . . . . . . . . . . . . . . . 33
Chapter 6 Personalization of time and content of treatment 34
6.1 Related work . . . . . . . . . . . . . . . . . . . . . . . . . . . . . . . . . . . . . . . . . . . . . . . . . . . . . . . . . . . . 34
6.2 Personalization of content . . . . . . . . . . . . . . . . . . . . . . . . . . . . . . . . . . . . . . . . . . . . . . . . 36
6.2.1 Contextual bandit . . . . . . . . . . . . . . . . . . . . . . . . . . . . . . . . . . . . . . . . . . . . . . . . . . . 36
Chapter 7 Study 1:Exploratory trial of the SleepU App 39
7.1 Method . . . . . . . . . . . . . . . . . . . . . . . . . . . . . . . . . . . . . . . . . . . . . . . . . . . . . . . . . . . . . . . . . 39
7.1.1 Study design considerations. . . . . . . . . . . . . . . . . . . . . . . . . . . . . . . . . . . . . . . . . . 41
7.1.2 Participants . . . . . . . . . . . . . . . . . . . . . . . . . . . . . . . . . . . . . . . . . . . . . . . . . . . . . . . . 41
7.1.3 Measures . . . . . . . . . . . . . . . . . . . . . . . . . . . . . . . . . . . . . . . . . . . . . . . . . . . . . . . . . . 42
7.1.4 Analysis plan . . . . . . . . . . . . . . . . . . . . . . . . . . . . . . . . . . . . . . . . . . . . . . . . . . . . . . 43
7.2 Results . . . . . . . . . . . . . . . . . . . . . . . . . . . . . . . . . . . . . . . . . . . . . . . . . . . . . . . . . . . . . . . . . 44
7.2.1 Behavior-RQ . . . . . . . . . . . . . . . . . . . . . . . . . . . . . . . . . . . . . . . . . . . . . . . . . . . . . . . 45
7.2.2 Adherence-RQ: . . . . . . . . . . . . . . . . . . . . . . . . . . . . . . . . . . . . . . . . . . . . . . . . . . . . 46
7.2.3 Context-RQ . . . . . . . . . . . . . . . . . . . . . . . . . . . . . . . . . . . . . . . . . . . . . . . . . . . . . . . . 46
7.3 Discussion . . . . . . . . . . . . . . . . . . . . . . . . . . . . . . . . . . . . . . . . . . . . . . . . . . . . . . . . . . . . . . 47
7.4 Limitations . . . . . . . . . . . . . . . . . . . . . . . . . . . . . . . . . . . . . . . . . . . . . . . . . . . . . . . . . . . . . . 51
7.5 Conclusion . . . . . . . . . . . . . . . . . . . . . . . . . . . . . . . . . . . . . . . . . . . . . . . . . . . . . . . . . . . . . . 52
7.5.1 Scalability . . . . . . . . . . . . . . . . . . . . . . . . . . . . . . . . . . . . . . . . . . . . . . . . . . . . . . . . . 52

xii CONTENTS
7.5.2 Broad access . . . . . . . . . . . . . . . . . . . . . . . . . . . . . . . . . . . . . . . . . . . . . . . . . . . . . . . 53
7.5.3 Privacy . . . . . . . . . . . . . . . . . . . . . . . . . . . . . . . . . . . . . . . . . . . . . . . . . . . . . . . . . . . . 54
Chapter 8 Adherence to treatment prediction 55
8.1 Related work . . . . . . . . . . . . . . . . . . . . . . . . . . . . . . . . . . . . . . . . . . . . . . . . . . . . . . . . . . . . 56
8.1.1 Time-length . . . . . . . . . . . . . . . . . . . . . . . . . . . . . . . . . . . . . . . . . . . . . . . . . . . . . . . . 56
8.1.2 Features . . . . . . . . . . . . . . . . . . . . . . . . . . . . . . . . . . . . . . . . . . . . . . . . . . . . . . . . . . . 58
8.2 Intraday adherence prediction . . . . . . . . . . . . . . . . . . . . . . . . . . . . . . . . . . . . . . . . . . . . . 60
8.2.1 Data collection . . . . . . . . . . . . . . . . . . . . . . . . . . . . . . . . . . . . . . . . . . . . . . . . . . . . . 60
8.2.2 Features . . . . . . . . . . . . . . . . . . . . . . . . . . . . . . . . . . . . . . . . . . . . . . . . . . . . . . . . . . . 61
8.2.3 Machine Learning Pipeline . . . . . . . . . . . . . . . . . . . . . . . . . . . . . . . . . . . . . . . . . . 61
8.2.4 Evaluation and results . . . . . . . . . . . . . . . . . . . . . . . . . . . . . . . . . . . . . . . . . . . . . . . 61
8.3 Discussion . . . . . . . . . . . . . . . . . . . . . . . . . . . . . . . . . . . . . . . . . . . . . . . . . . . . . . . . . . . . . . 62
8.4 Limitations . . . . . . . . . . . . . . . . . . . . . . . . . . . . . . . . . . . . . . . . . . . . . . . . . . . . . . . . . . . . . 63
Chapter 9 Study 2: Deploying an mHealth intervention during the 2020
pandemic 64
9.1 Method . . . . . . . . . . . . . . . . . . . . . . . . . . . . . . . . . . . . . . . . . . . . . . . . . . . . . . . . . . . . . . . . . 64
9.1.1 Participants . . . . . . . . . . . . . . . . . . . . . . . . . . . . . . . . . . . . . . . . . . . . . . . . . . . . . . . . 66
9.1.2 Measures . . . . . . . . . . . . . . . . . . . . . . . . . . . . . . . . . . . . . . . . . . . . . . . . . . . . . . . . . . 66
9.2 Analysis plan. . . . . . . . . . . . . . . . . . . . . . . . . . . . . . . . . . . . . . . . . . . . . . . . . . . . . . . . . . . . 68
9.3 Results . . . . . . . . . . . . . . . . . . . . . . . . . . . . . . . . . . . . . . . . . . . . . . . . . . . . . . . . . . . . . . . . . 69
9.3.1 Personalization of content . . . . . . . . . . . . . . . . . . . . . . . . . . . . . . . . . . . . . . . . . . . 69
9.3.2 Personalization of time of treatment: Adherence . . . . . . . . . . . . . . . . . . . . . . . 70
9.3.3 Personalization of time of treatment: Behavior change. . . . . . . . . . . . . . . . . . 72
9.4 Discussion . . . . . . . . . . . . . . . . . . . . . . . . . . . . . . . . . . . . . . . . . . . . . . . . . . . . . . . . . . . . . . 72
9.5 Conclusion . . . . . . . . . . . . . . . . . . . . . . . . . . . . . . . . . . . . . . . . . . . . . . . . . . . . . . . . . . . . . . 74
Chapter 10 Understanding the effect of the pandemic in study 2 75
10.1 Quantitative analysis: Comparison of study 1 (2019) and study (2) . . . . . . . . . . 75
10.1.1 Sleep and related behaviors . . . . . . . . . . . . . . . . . . . . . . . . . . . . . . . . . . . . . . . . 76
10.1.2 Phone use, location and activity . . . . . . . . . . . . . . . . . . . . . . . . . . . . . . . . . . . . 79
CONTENTS xiii
10.1.3 Conclusion . . . . . . . . . . . . . . . . . . . . . . . . . . . . . . . . . . . . . . . . . . . . . . . . . . . . . . . 80
10.2 Qualitative Analysis: Understanding participants thoughts and feelings during
study 2 . . . . . . . . . . . . . . . . . . . . . . . . . . . . . . . . . . . . . . . . . . . . . . . . . . . . . . . . . . . . . . . . 81
10.2.1 Method . . . . . . . . . . . . . . . . . . . . . . . . . . . . . . . . . . . . . . . . . . . . . . . . . . . . . . . . . . . 82
10.2.2 Results . . . . . . . . . . . . . . . . . . . . . . . . . . . . . . . . . . . . . . . . . . . . . . . . . . . . . . . . . . . 82
10.2.3 Conclusion . . . . . . . . . . . . . . . . . . . . . . . . . . . . . . . . . . . . . . . . . . . . . . . . . . . . . . . 84
10.3 The disruptive-events framework . . . . . . . . . . . . . . . . . . . . . . . . . . . . . . . . . . . . . . . . . 85
10.4 Implications for pandemic-like events . . . . . . . . . . . . . . . . . . . . . . . . . . . . . . . . . . . . 86
10.4.1 Personalizing during pandemic-like events . . . . . . . . . . . . . . . . . . . . . . . . . . . 86
10.5 Discussion: Three pandemic-like case scenarios . . . . . . . . . . . . . . . . . . . . . . . . . . . 88
10.6 Conclusion . . . . . . . . . . . . . . . . . . . . . . . . . . . . . . . . . . . . . . . . . . . . . . . . . . . . . . . . . . . . . 91
Chapter 11 Conclusion 92
11.1 Unresolved questions . . . . . . . . . . . . . . . . . . . . . . . . . . . . . . . . . . . . . . . . . . . . . . . . . . . 93
11.2 Future work . . . . . . . . . . . . . . . . . . . . . . . . . . . . . . . . . . . . . . . . . . . . . . . . . . . . . . . . . . . . 94
11.2.1 Personalization of time and content across different intervention domains 94
11.2.2 Beyond receptivity . . . . . . . . . . . . . . . . . . . . . . . . . . . . . . . . . . . . . . . . . . . . . . . . 95
11.2.3 Health interventions across devices . . . . . . . . . . . . . . . . . . . . . . . . . . . . . . . . . . 95
11.2.4 Language-style (a.k.a., Message Framing, tone) . . . . . . . . . . . . . . . . . . . . . . 96
11.2.5 Emotion-sensing . . . . . . . . . . . . . . . . . . . . . . . . . . . . . . . . . . . . . . . . . . . . . . . . . . 97
11.2.6 Self-tracking+sensing+receptivity . . . . . . . . . . . . . . . . . . . . . . . . . . . . . . . . . . . 97
Chapter 12 Appendix 99
12.1 Sleep Duration GMM . . . . . . . . . . . . . . . . . . . . . . . . . . . . . . . . . . . . . . . . . . . . . . . . . . . 99
12.2 Study 1: Effect of context and intrinsic characteristics . . . . . . . . . . . . . . . . . . . . . . 101
12.3 Study 2: Personalization of content comparisons . . . . . . . . . . . . . . . . . . . . . . . . . . . 102
12.4 Study 2: Personalization of time of treatment comparisons . . . . . . . . . . . . . . . . . . 103
References 104
List of Figures
2.1 Traditional vs mobile health intervention cycle. 7
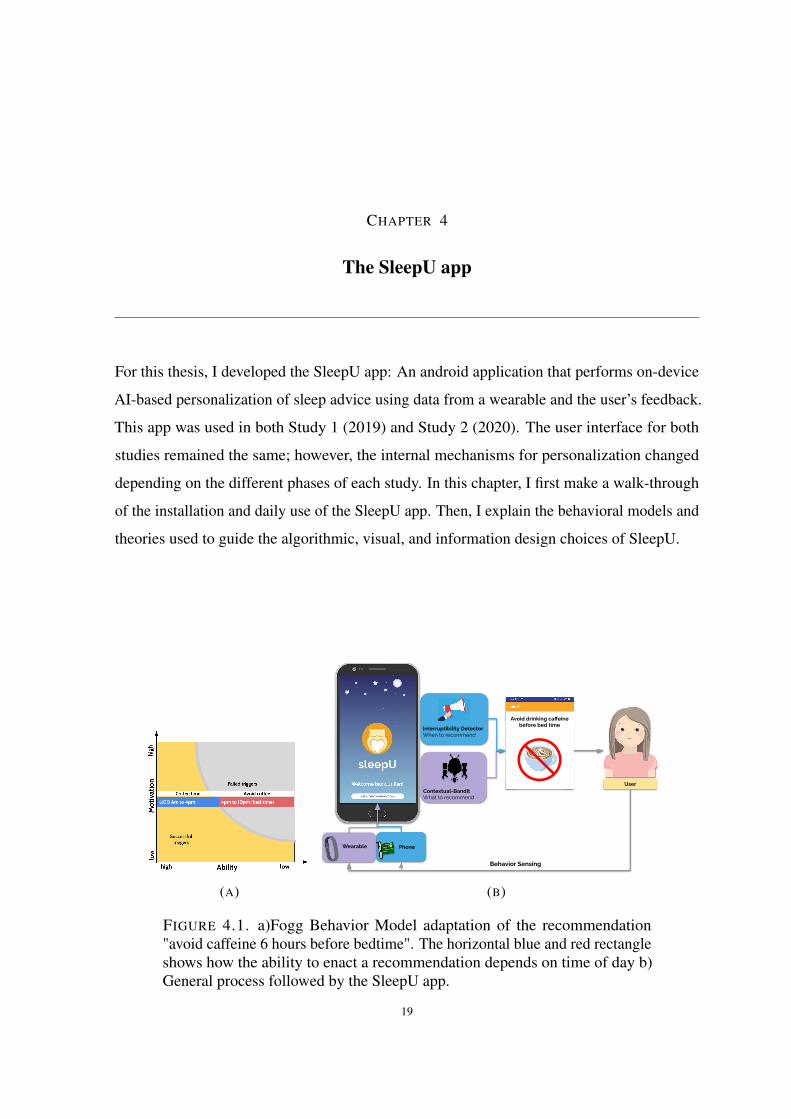
4.1 a)Fogg Behavior Model adaptation of the recommendation "avoid caffeine 6 hours
before bedtime". The horizontal blue and red rectangle shows how the ability to enact
a recommendation depends on time of day b) General process followed by the SleepU
app. 19
4.2 Different screenshots from the SleepU app. Left to right: a) SleepU diary entry, the
user gets a reminder at 9 am to fill out the diary. If they checked their phone earlier
than that, the receptivity classifier could trigger a notification to fill out the sleep diary.
b) The app pushing a notification to the user about a new sleep recommendation
available; note that the actual recommendation text is omitted in the notification. c) A
sleep recommendation viewable after the notification is clicked on. d) Main screen of
the app which gives the user access to the sleep recommendations selected for her for
the current day, with the other sleep recommendations hidden. 20
4.3 a) Process of checking a sleep recommendation in the SleepU App. b) Probability
over time to pick at random receptivity detection or a random time for triggering a
notification to read a sleep recommendation 22
5.1 Machine learning pipeline for training and deployment of the receptivity detector 32
7.1 Study design 40
7.2 a) The plot shows the adherence to the sleep recommendations provided by the
app over time during the app-intervention phase. b) The plot shows the odd ratios
intrinsic and contextual factors on adherence. c) Adherence rates for all the trigger
mechanisms ∗p<0.1; ∗∗p<0.05; ∗∗∗p<0.01 47
9.1 Study design 65
9.2 Adherence rates comparison between study 1 and 2. 70
xiv
LIST OF FIGURES xv
9.3 Odd ratios comparison for the BMMs in Study 1 and 2. Values in red represent a
decrease in odds OR < 1 and probability, while blue values represent an increase
in odds and probability. For motivation, the confidence interval of the odd ratios
includes 1 and for that reason it is not significant. ∗p < 0.1, ∗∗p < 0.05, ∗∗∗p < 0.01 71
9.4 Likelihood of adherence over the course of study 1 and 2. For study 2 (left) the
likelihood decreases over time while for study 1 (right) adherence increases over time. 71
10.1Smoothed standard deviation (rolling window, n=7 days) of sleep duration during the
2019 and 2020 studies. Higher values mean higher variance across individuals 77
10.2Smoothed cognitive activity and percentiles 78
10.3Smoothed cognitive activity before bed for different days of the week 78
10.4Comparisons between motivation of 2020 and 2019 84

CHAPTER 1
Introduction
Personalized medicine (i.e., precision medicine) [19] is an approach where health treatment
is adjusted to an individual’s genetic, environmental, and lifestyle factors. This national
initiative was introduced in 2015 by United States President Barack Obama [19] and later
renamed to the All of Us program [112], a project that is currently active in the United States.
The value of personalized health interventions comes from improved health care outcomes
from trying only treatments that are most likely to succeed by reducing time to achieve
improved outcomes, decreasing costs, and minimizing side effects improving quality of care
[58]. However, despite the advantages, genetic-based personalized medicine is at a basic
research stage, and it is not used yet in clinical practice [76].
Personalization has traditionally been a process in which both the patient and physician are
involved: A clinician first provides treatment based on experience, patient’s preferences, and
treatment goal; after acquiring evidence [2] of success or failure in achieving the desired
outcomes, the clinician proceeds to adjust treatment. The need for personalization comes
from two primary sources that are not necessarily exclusive: Gaps in medical and personal
knowledge. Medical knowledge may be insufficient to understand adherence or treatment
effect for an individual. Personal knowledge means an individual may not be aware of her
preferences, treatment adherence (compliance with treatment), or treatment side effects (
unaware of allergies). This gap in personal knowledge means that even when the science is
precise, the only way to personalize treatment is trial and error. In summary, this manual
personalization is not only inefficient, but it may also be unavoidable.
Another problem is that patients are on their own when it comes to self-monitoring and
self-managing their treatment, two crucial components of self-efficacy: an individual’s belief
1
2 1 INTRODUCTION
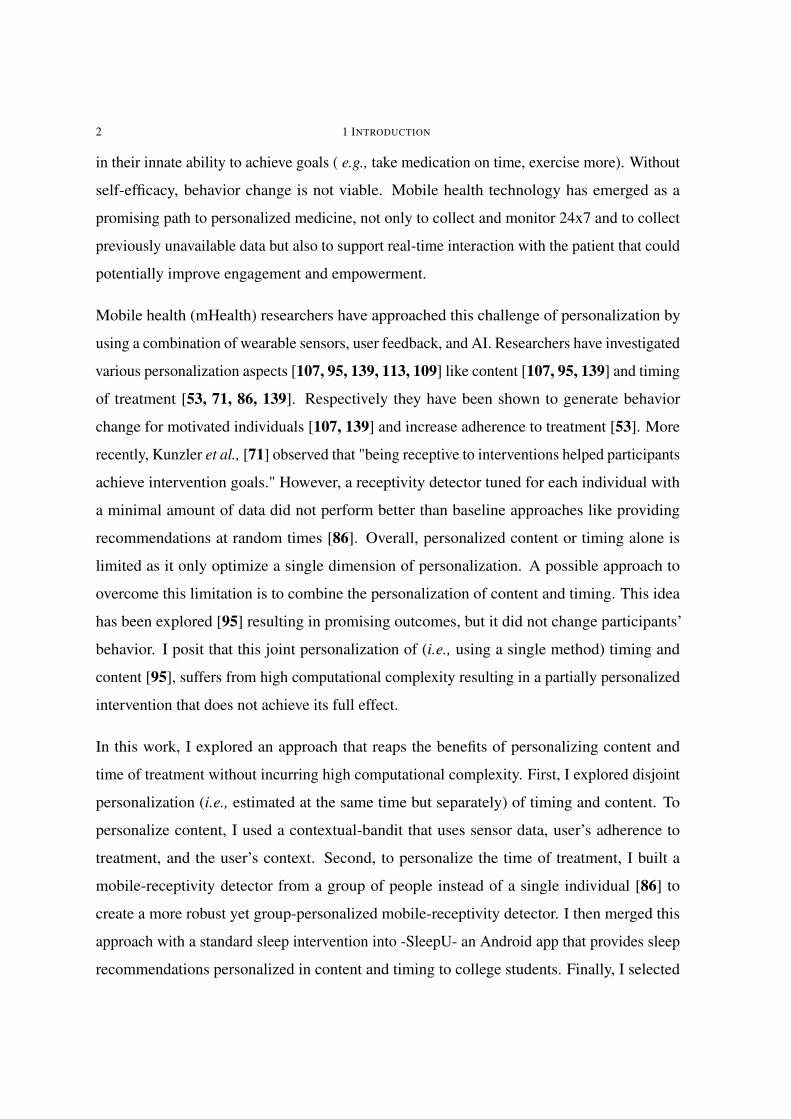
in their innate ability to achieve goals ( e.g., take medication on time, exercise more). Without
self-efficacy, behavior change is not viable. Mobile health technology has emerged as a
promising path to personalized medicine, not only to collect and monitor 24x7 and to collect
previously unavailable data but also to support real-time interaction with the patient that could
potentially improve engagement and empowerment.
Mobile health (mHealth) researchers have approached this challenge of personalization by
using a combination of wearable sensors, user feedback, and AI. Researchers have investigated
various personalization aspects [107, 95, 139, 113, 109] like content [107, 95, 139] and timing
of treatment [53, 71, 86, 139]. Respectively they have been shown to generate behavior
change for motivated individuals [107, 139] and increase adherence to treatment [53]. More
recently, Kunzler et al., [71] observed that "being receptive to interventions helped participants
achieve intervention goals." However, a receptivity detector tuned for each individual with
a minimal amount of data did not perform better than baseline approaches like providing
recommendations at random times [86]. Overall, personalized content or timing alone is
limited as it only optimize a single dimension of personalization. A possible approach to
overcome this limitation is to combine the personalization of content and timing. This idea
has been explored [95] resulting in promising outcomes, but it did not change participants’
behavior. I posit that this joint personalization of (i.e., using a single method) timing and
content [95], suffers from high computational complexity resulting in a partially personalized
intervention that does not achieve its full effect.
In this work, I explored an approach that reaps the benefits of personalizing content and
time of treatment without incurring high computational complexity. First, I explored disjoint
personalization (i.e., estimated at the same time but separately) of timing and content. To
personalize content, I used a contextual-bandit that uses sensor data, user’s adherence to
treatment, and the user’s context. Second, to personalize the time of treatment, I built a
mobile-receptivity detector from a group of people instead of a single individual [86] to
create a more robust yet group-personalized mobile-receptivity detector. I then merged this
approach with a standard sleep intervention into -SleepU- an Android app that provides sleep
recommendations personalized in content and timing to college students. Finally, I selected
1.1 AIMS 3
sleep as the domain for health intervention to validate this approach due to its essential
role in physical [42] and mental health [4, 42]. SleepU delivers sleep recommendations
after detecting receptivity in real-time from smartphone sensor streams. SleepU then uses
a contextual-bandit running on a smartphone to personalize content by selecting a sleep
recommendation, among a set of recommendations, that is best for the user according to
wearable data, user’s previous adherence to treatment, and the user’s context.
1.1 Aims
I explored the potential of SleepU for promoting behavior change through a pilot study
conducted as a real-world deployment (n = 30) in the spring of 2019 (Study 1). During
the first four weeks, the participants did not receive an intervention while a background app
passively collected sleep and smartphone use and sensor data. In the fifth week, participants
were randomized to interact with SleepU for four weeks (app-intervention) or receive standard
care (control-intervention). At the end of this first phase of the intervention, participants were
assigned to the other intervention (control or app) for the remaining four weeks. During the
app-intervention, participants could receive sleep recommendations when they were detected
as mobile-receptive or at random times, and also, they could check recommendations on
their own. In this exploration and as suggested by [66], I investigate proximal outcomes
(e.g., motivation and treatment adherence), distal outcomes (e.g., sleep duration, efficiency,
number of awakenings, and time in bed), and the effects of intrinsic characteristics of the
participant (e.g., baseline motivation and regular sleep duration) and context (e.g., period of
the day, number of days in intervention). I now present the guiding research questions of this
thesis:
• What is the effect of personalization of timing and content in behavior change and
motivation? I found that the participants’ sleep duration increased significantly
while interacting with SleepU compared to their sleep during the first four weeks
of the study (i.e., when there was no intervention) and compared to when they
were exposed to the control-intervention. This disjoint personalization of timing

4 1 INTRODUCTION
and content of treatment approach is the first to result in significant sleep behavior
change. I also found a marginally significant increase in motivation between baseline
and the app-intervention.
• What is the effect of personalization of timing and content on adherence to treat-
ment? I found that receptivity results in statistically higher adherence compared
to recommendations delivered at random times and those checked by the user on
its own. This mobile-receptivity detector is the first receptivity model used in an
mhealth intervention that results in increased adherence in a behavioral intervention.
• What is the effect of context and motivation of the participant in the likelihood of
adherence to recommendations? I found that participants, independent of time of the
day and in the absence of a reminder, are not likely to follow a sleep recommendation.
I also found that delivering recommendations in the morning resulted in the highest
likelihood of adherence and the evening the lowest, which corroborate recent findings
[71]. Further, I found that both the number of days in the app-intervention phase and
participant motivation to improve sleep increase the likelihood to adhere to treatment.
These results have important implications for the design and tailoring of mhealth
interventions.
• Can we predict future adherence to treatment using contextual factors and motiva-
tion of the patient? I found that using a machine learning model and the contextual
factors that affect adherence, it is possible to predict next-day adherence to treat-
ment. Furthermore, this machine learning model is 38% more accurate than a naive
classifier that only picks the majority class (69% vs 50% balanced accuracy).
The results, at large, show that there is a positive and significant effect of personalizing timing
and content concurrently. However, it is impossible to establish whether the intervention’s
primary driver for behavior change was the timing or the content component given the
experimental design. Understanding the difference in the contribution to the effect on behavior
change of each personalization dimension can help in real-world scenarios to decide where
research and development efforts should be focused. In addition, it may lead to the creation of
more straightforward but effective interventions. To explore the marginal contributions of the
dimensions of personalization, a second research study (Study 2) was designed and deployed

1.2 CONTRIBUTION 5
to 80 participants. Study 2 started a week before the 2020 COVID-19 pandemic became
official. This second intervention resulted in null results for behavior change, motivation,
and adherence. Given these null results, I used the data collected from this second study as
an opportunity to understand why it failed and specifically to understand how the pandemic
could have disrupted the AI-based personalization approach and the participants’ daily lives.
1.2 Contribution
This thesis advances mhealth interventions by developing and testing the effect of AI-based
personalization of content and time of treatment in a real-world deployment. This thesis also
explores contextual factors and an individual’s intrinsic characteristics (e.g., demographics,
motivation, daily behaviors) on adherence to treatment. From these results, I investigated
and evaluated a method for predicting next-day adherence using a combination of behavioral
measures, previous-day adherence, and context. Last, this thesis explores and discusses
pandemic-induced factors that resulted in behavioral changes that lead to null intervention
results of deployment during the 2020 pandemic.
CHAPTER 2
Preliminaries
In this chapter, I present basic definitions of the elements of a mobile health intervention.
These definitions, in most cases, follow previous work while others are defined in this thesis.
At the end of the chapter, I introduce the different dimensions of personalization.
In this thesis, mhealth interventions are defined as interventions delivered via a mobile device
and tailored dynamically, i.e., changes to the health intervention are based on sensor data
or user feedback and performed multiple times throughout the intervention. In comparison,
traditional computer-tailored interventions are not dynamic (static): usually, tailoring occurs
once at the beginning of treatment. Dynamic computer-tailored health interventions have an
increased efficacy [69] in comparison to static health interventions. Besides the value provided
by being more efficient than a static health intervention, mhealth interventions have the added
benefit that they can accompany the patient at all times: An mhealth intervention can both
reach (push) or be reached by (pull) the patient at any time and place [115]. Ultimately one of
the most promising roles of a mobile health intervention is to support the patient at the time
and place where treatment is put into practice, and this is a role that even the best medical
care cannot provide.
2.1 The elements of a mobile health intervention
Mobile health interventions are defined by components that are not present in traditional
health interventions due to the intrinsic capabilities of mobile computing devices that make
health interventions readily available anytime and anywhere. Some of these elements are
defined in the literature [90] while other elements are extended (e.g., available treatments,6

2.1 THE ELEMENTS OF A MOBILE HEALTH INTERVENTION 7
tailoring variables, treatment selection), or first defined (intervention points, initial treatment)
in this thesis to better match the nature of mobile health interventions.
To better illustrate some of the elements, figure 2.1 shows a general mobile health intervention
cycle compared to a traditional health intervention. In the next sections, I describe the
elements of a mobile health intervention considered throughout this thesis.
Diag
nosis
First tre
atment
Treatm
ent
adjustment
DemographicsGenomicsLifestyle......
How to pick First treatment?
When to deliver treatment?
C
ABC
ABC
ABC
ABC
AB
ABC
What treatment?
Treatm
ent
adjustment
Treatm
ent
adjustment
Week 1 Week 2 Weeks
Intervention points Available treatments
ABC
FIGURE 2.1. This diagram shows a basic health intervention cycle and eachstakeholder. The patient first gets a diagnosis; afterward, the initial treatmentfollows, and then there are treatment adjustments sometime after. In order toselect the initial treatment, the doctor needs to take into account the patient’sdemographics, genomics, lifestyle, and others. After the initial treatment,the patient goes back to the doctor, and depending on the health state; thetreatment may be adjusted. In a mobile health intervention, the process is thesame, but every decision is taken autonomously. Also, treatment adjustmentdoes not have to occur at a fixed point in time; it can be adjusted in days orhours depending on the disease. However, this new model of health has threemain challenges: 1) How to select the initial treatment?, 2) When to deliverthe treatment, and 3)How to select a treatment.

8 2 PRELIMINARIES
2.1.1 Distal outcomes
Distal outcomes are defined as the set of outcomes that are the ultimate goal of the intervention
[90]. This is also referred to as the primary clinical outcome. For example, in drug rehabil-
itation, the distal outcome is eliminating drug use; in sleep hygiene, it is the improvement
of sleep health factors. Distal outcomes are essential to health interventions; however, they
are usually tricky to use for day-to-day treatment adjustment: There is usually a long time
between treatment administration and the observation of change. Distal outcomes alone are
not sufficient to measure the intermediate success of a health intervention; however, they are
crucial for designing a health intervention. Distal outcomes are usually domain-specific.
2.1.2 Proximal outcomes
Proximal outcomes are outcomes that can potentially lead to the desired distal outcome as
mediating or direct factors affecting the distal outcome [90]. Typical examples of a proximal
outcome are mediators of behavior change like motivation [84, 37] and self-efficacy [5].
Proximal outcomes apply not only to behavioral interventions but also to pharmacological
treatments that rely on basic behaviors of the patient like taking pills at specified times; in
this case, treatment adherence is a crucial factor: Patients’ failure in adhering to medication
regimes causes 33 to 69% of hospitalizations and accounts for $100 billion in annual health
care costs [94]. Proximal outcomes are not domain-specific, but they are adapted to each
intervention. For example, adherence to pharmacological treatment is measured by counting
how many times a patient takes a pill on time, while in a sleep intervention, it is measured by
the number of times the participant fills out a sleep diary. In both cases, the construct is the
same, but the measure is specific to the intervention.
2.1.3 Decision points
Decision points are the points in time or, more generally, context (e.g., location, time of day,
mood), where a health intervention is adjusted [90]. Such adjustment could be based on a
combination of sensor input, patient feedback, computational feedback (i.e., estimates of
2.1 THE ELEMENTS OF A MOBILE HEALTH INTERVENTION 9
future outcomes from a model), or even physician’s feedback. These decision points may or
may not be of importance depending on the application. Decision points can be decoupled
from delivery when estimating the next decision does not rely on real-time data. For example,
in a sleep intervention using sleep-related outcomes, decision points could occur every day
after waking up, or they could be computed right before the moment of delivery. Assuming
the sleep treatment depends only on the previous night of sleep, there is no difference between
computing a decision right before treatment is delivered or as soon as the night of sleep data
is available (after waking up). In contrast, in an intervention for increasing physical activity
based on steps, right before delivering an intervention, an estimate of the current number of
steps is necessary to suggest the number of steps left to meet a predefined goal. In general,
interventions where the target of the intervention involves an ever-changing process (like a
step count), will require a decision point close to delivery.
2.1.4 Intervention points
Intervention points are the context of delivery of a health intervention. An important dif-
ferentiator of intervention points is whether they are vulnerable or opportunistic states [90].
Vulnerable states lead to undesirable or dangerous outcomes; as an example, a stressful situ-
ation could be a vulnerable state for a person going through drug rehabilitation since such an
event could lead to relapse. Opportunistic states are contexts used to improve health outcomes
without a necessary connection between the health outcome and treatment. For example,
the same individual going through rehabilitation may benefit from reminders to engage in
positive social interactions and exercise. A key construct to find the best intervention points
is receptivity: “an individual’s transient ability and/or willingness to receive, process and
utilize just-in-time support”. This construct, rooted in the dual-process model for supportive
communication, states that [12] supportive communication (e.g., a sleep recommendation)
can result in positive changes in behavior when the recipient is motivated to process and enact
the message. The identification of receptivity is crucial for finding opportunistic intervention
points. Although there has not been work looking at detecting receptive states from sensor

10 2 PRELIMINARIES
streams or data in general, researchers in human-computer interaction (HCI) have a well-
established body of work on a similar concept called interruptibility and engagement. There
are multiple definitions of interruptibility, but for this thesis, I refer to interruptibility as the
idea that people have moments during the day when they are available to be interrupted. At
such times, an interruption has a low enough cost, and an interruption is acceptable [49, 91].
Interruptibility has been studied around computer use and, more recently, mobile phone use,
and as such, all of this body of work is centered on finding interruptible states when an
individual is interacting with a computer or a mobile phone. More recently, HCI researchers
have looked at engagement detection [98], an extension of interruptibility detection, where the
goal is to detect not only when an individual can be interrupted but also when the individual
further engages with the content of the interruption. An easy way to differentiate the two
follows: When an individual receives an SMS and does not even look at it, the individual
is not interruptible; when the individual glances at the SMS, the individual is interruptible;
lastly, when the individual looks at the SMS, opens it and even replies to the sender or further
engages in a task related to it, the individual is engaged. In this work, I use engagement
detection (i.e., mobile-receptivity) as a proxy for detecting receptivity. Despite the importance
of receptivity and its related constructs of engagement and interruptibility, there is no work
using receptivity to trigger the delivery of a health intervention. However, some researchers
have already started including receptivity in their study protocols for future studies [68].
2.1.4.1 Initial treatment
In this thesis, I further refine the definition of intervention points to include the initial treatment.
The initial treatment refers to the state in which the intervention starts and is delivered to an
individual. There are two possible options to start an intervention: 1) Random: A treatment
is picked at random among the possibilities for treatment. Although not ideal, it is realistic
when there is not enough knowledge about the patient to perform any personalization. Also,
this could be an option for interventions that are trying to fulfill research and clinical goals
and as such, this initial treatment, if uniformly randomized, is a micro-randomized trial [65]
and the data generated from this stage could be used for causal inference. At later decision
points, the intervention could move away from a uniform probability distribution; however,
2.1 THE ELEMENTS OF A MOBILE HEALTH INTERVENTION 11
the data generated from that point forward cannot be used for causal inference because
treatment is not provided randomly and is biased towards the clinical goal. 2) Tailored:
The intervention starts with a treatment picked using variables that identify the subset of
treatments that have a higher chance of succeeding at achieving the target outcome of the
intervention. This treatment selection uses expert knowledge where a physician could look for
specific demographic variables or other factors. In addition, this treatment selection could use
computational models that can estimate, from clinical health records or biological databases,
possible outcomes based on demographics or genetic makeup. Another possibility is to use
a mixed approach where physicians rely on computational models and their knowledge to
determine the best course of treatment.
2.1.5 Available treatments
Available treatments are referred to as intervention options in the literature and are the different
types of treatment available for delivery at any given point. Here, I decided to add "Available"
to highlight the changing nature of the context of the patient and how that context ultimately
changes her ability to put into practice health treatments. Nahum-Shani [90], further defines
as part of the available treatments the media of delivery (e.g., SMS, email, phone call), the
type (advice, feedback), or even the quantity of the treatment (e.g., dosage of a medication or
how many times to provide a heath recommendation).
2.1.6 Tailoring variables
Traditionally, tailoring variables are about the patient receiving the interventions, and as such,
these variables revolve around the individual[90]. However, it is crucial to notice that, from
a mobile health intervention point of view, intervention options must be dependent on the
context of the individual receiving the intervention and the computational resources available
(e.g., battery levels, data available, internet connection). The context of the individual can
define the content of the intervention; as an example, reminding a person to exercise when

12 2 PRELIMINARIES
they are ready to go to bed is not only counter-intuitive, it is frustrating. Tailoring variables
are domain and system-specific.
2.1.7 Treatment selectionTreatment selection or decision rules (Nahum-Shani et al., 2018) are the underlying mech-
anisms to select intervention options. The decision rules pick the intervention treatment
(intervention options) based on the variables tracked during the intervention (tailoring vari-
ables). More broadly, these rules are not necessarily static and can adapt to evidence of
treatment or patient feedback to increase treatment efficacy, engagement, or any other prox-
imal or distal intervention outcomes. In mobile health interventions, treatment selection may
not be static and instead is updated using data. An example of this approach is MyBehavior
[106], a system that uses a stochastic method to determine the best intervention to provide
based on sensor data and personal preferences.
The elements of a mobile health intervention presented here are not too different from
traditional health interventions. However, the nature of a mobile health intervention provides
new challenges and opportunities for improved health care. The first such difference is in
the initial treatment selection. In traditional health interventions, the physician uses her
expertise and medical knowledge to decide. However, in a mobile health intervention, the
initial treatment could be selected based on previously collected data. Another difference is
that in a mobile health intervention, intervention points are not fixed and neither limited by
the availability of a physician, time of day, or even geographic location. Instead, a mobile
health intervention can provide treatment on a need basis. Last, a mobile health intervention
could select a treatment at any intervention point in an objective manner by using available
data. In the following section, I discuss all of these challenges and their possible solutions.
2.2 Dimensions of personalization in mhealth interventions
Although there is not an official taxonomy of the different dimensions of personalization at
the time of this writing, some recent literature reviews summarize [40, 124] the results of
2.2 DIMENSIONS OF PERSONALIZATION IN MHEALTH INTERVENTIONS 13
individual dimensions of personalization. In this section, summarize all those findings into a
single taxonomy in the context of this thesis:
• Content [40, 90]: The information delivered to the patient which may contain a
behavior (e.g., avoid carbs), activity(e.g., walking 15 minutes ) recommendation or
any other type of information related to the health intervention. Traditionally, content
personalization meant changing the pronouns, activities, illustrations, among others
of a health recommendation, to reflect the patient’s demographics. In the context of
this thesis, content personalization translates into delivering recommendations to the
patient that are most likely to result in the desired outcome [40].
• Timing [124, 90]: The time, location, current physical (e.g., running, static) or social
activity (e.g., in conversation, alone), or situations (e.g., opportunistic, vulnerable
[90]) selected for the delivery of treatment. All of the different variables can be used
in combination or separately. In this thesis, I refer to the personalization of timing as
the process of selecting a time for delivery of treatment using contextual variables
that include physical activity, transitions between activities, phone use, time of day,
day of the week, among many other variables. I describe the contextual variables in
chapter 5.
• Message Framing[102]: The language used to communicate with the patient
(e.g., supportive, authoritative, negative, positive). It can be found in previous
work as tone or language style.
• Delivery Channel[124]: The media through which information is delivered (e.g., text,
voice message, email)
• Goal [40]: A target quantity to reach in a specific amount of time.
• Dosage [124]: The amount of support and the frequency of intervention delivery
(e.g., send notifications 3 times per day).
The above list is not exhaustive, and the dimensions are not mutually exclusive. For example,
the content and message framing may be personalized at the same time by suggesting the
same behavior recommendations but phrased in supportive vs. negative language. In this
thesis, I decided to focus on only two of the most used dimensions of treatment: content and

14 2 PRELIMINARIES
timing. Content of treatment is an almost mandatory aspect of intervention in that it contains
the behavior to recommend. Timing of treatment, although explored by mhealth researchers,
has produced mainly mixed results [95, 86]. Overall, reminders have a positive effect on
adherence to treatment [53]. Other approaches based on receptivity are promising [71] but
have not yet resulted in behavior change [86]. This thesis demonstrates that personalization of
timing of treatment and content results in behavior change, improved adherence to treatment,
and increased motivation.

CHAPTER 3
Sleep health and interventions
The method and system presented in this thesis are applied to a common sleep intervention
called sleep hygiene. In this chapter, are introduced the motivation for working on sleep, basic
definitions and sleep related work in human-computer interaction.
3.1 Sleep Definition and Motivation
Sleep in humans is defined as a natural state of unconsciousness where responses to external
stimuli are reduced. Sleep is reversible and occurs at regular intervals that are independent of
many other physiological processes. Sleep has a fundamental role for many essential processes
in the human body that regulate learning [119, 138], memory [110, 119], weight [88], mood
[129] and cardiovascular health [136] among other processes. Despite its importance over
60% of college students in the United States report having poor sleep quality [79]. Having a
night of poor quality sleep, is equivalent to working or studying after drinking 7 beers [134],
causing a 50% slower response speed, poor accuracy in a psycho-motor vigilance test and an
increased risk of an accident while operating a vehicle[31, 26]. A common way to improve
sleep health [13] is through Sleep Hygiene [104], a set of general recommendations that
help improve habits that are conducive to healthy sleep. There are other sleep interventions
based on different behavior change models that have shown different measures of success
like Cognitive and Behavioral Therapy for Insomnia (CBT-I) [121], sleep restriction therapy
[118], etc. In this work, I focus on sleep hygiene-based interventions since it is one of the
most common treatments for college students [38] with sleep health problems that are not15

16 3 SLEEP HEALTH AND INTERVENTIONS
classified as sleep disorders (narcolepsy, chronic insomnia, apnea, etc.) requiring specialized
medical treatment.
In this thesis, sleep will be defined by multiple of its qualities since there is not an agreed
single measure of sleep quality. Sleep is defined using the following sleep health [13] factors:
Sleep duration, the total amount of sleep obtained in a 24-hour period; Sleep efficiency, the
ease of falling asleep and returning to sleep calculated as the percent of time asleep of the total
time spent in bed; Timing, the time of occurrence of sleep within a 24-hour day; Alertness,
the ability to maintain attentive wakefulness; Quality: the subjective assessment of sleep.
3.2 Sleep in Human-computer interaction
In this section I present sleep interventions developed in Human-computer interaction (HCI)
focusing on their intervention mechanisms and their connections to psychological or medical
treatments. Sleep interventions in Human-computer interaction are relatively new and for
this reason most of the results in this area are explorations and in all cases did not result in
behavior change.
One of the earliest work in HCI related to sleep intervention is ShutEye [8], a smartphone
application that shows Sleep Hygiene recommendations at appropriate times in the background
of the home-screen of a user’s smartphone. ShutEye modified the background of the home-
screen to display activities that were encouraged or discouraged depending only on the time
of the day and sleep hygiene recommendations, and did so without sensing sleep-related
parameters. Although the study was exploratory, there was a decrease in subjective sleepiness
score for 8 out of 12 participants.
Horsch et al. [54] demonstrate that the usage of reminders increased adherence to automated
parts of a Cognitive Behavioral Therapy for Insomnia (CBT-I) based intervention. This
intervention was delivered through a smartphone application that contained a sleep diary and
a relaxation exercise. The app also provided reminders to use the sleep diary and perform
the relaxation exercises. The reminders were either set by the participant or event based.
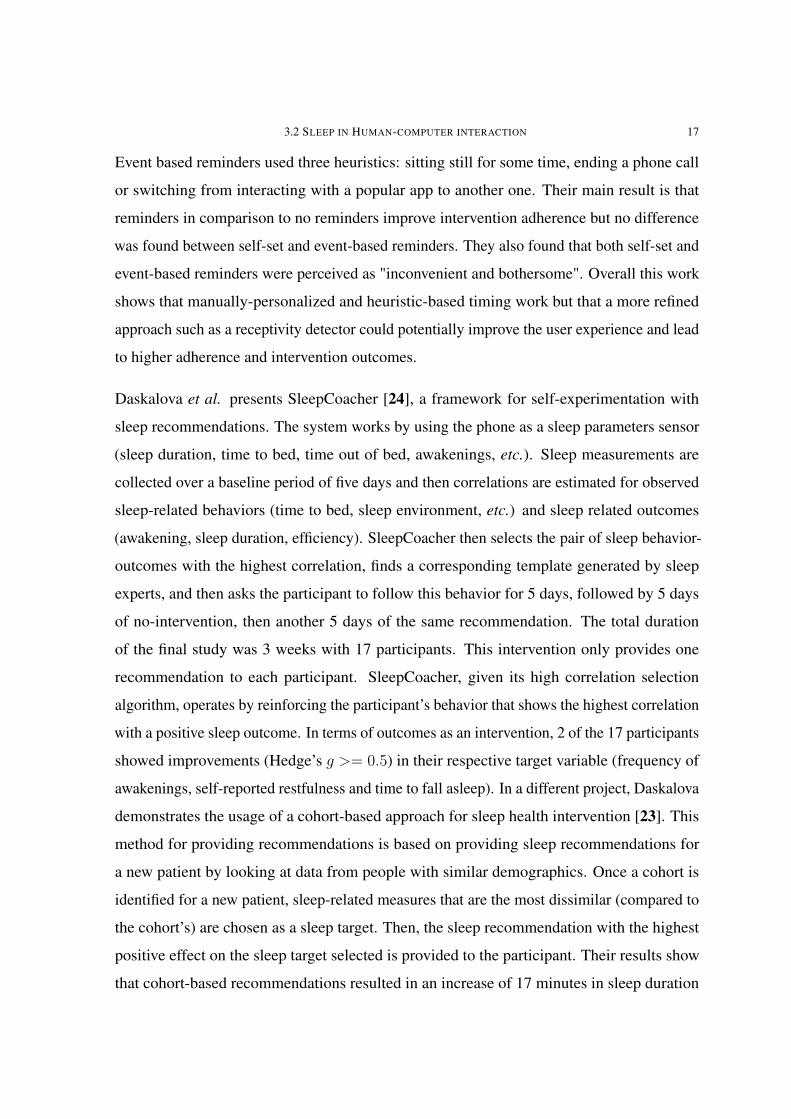
3.2 SLEEP IN HUMAN-COMPUTER INTERACTION 17
Event based reminders used three heuristics: sitting still for some time, ending a phone call
or switching from interacting with a popular app to another one. Their main result is that
reminders in comparison to no reminders improve intervention adherence but no difference
was found between self-set and event-based reminders. They also found that both self-set and
event-based reminders were perceived as "inconvenient and bothersome". Overall this work
shows that manually-personalized and heuristic-based timing work but that a more refined
approach such as a receptivity detector could potentially improve the user experience and lead
to higher adherence and intervention outcomes.
Daskalova et al. presents SleepCoacher [24], a framework for self-experimentation with
sleep recommendations. The system works by using the phone as a sleep parameters sensor
(sleep duration, time to bed, time out of bed, awakenings, etc.). Sleep measurements are
collected over a baseline period of five days and then correlations are estimated for observed
sleep-related behaviors (time to bed, sleep environment, etc.) and sleep related outcomes
(awakening, sleep duration, efficiency). SleepCoacher then selects the pair of sleep behavior-
outcomes with the highest correlation, finds a corresponding template generated by sleep
experts, and then asks the participant to follow this behavior for 5 days, followed by 5 days
of no-intervention, then another 5 days of the same recommendation. The total duration
of the final study was 3 weeks with 17 participants. This intervention only provides one
recommendation to each participant. SleepCoacher, given its high correlation selection
algorithm, operates by reinforcing the participant’s behavior that shows the highest correlation
with a positive sleep outcome. In terms of outcomes as an intervention, 2 of the 17 participants
showed improvements (Hedge’s g >= 0.5) in their respective target variable (frequency of
awakenings, self-reported restfulness and time to fall asleep). In a different project, Daskalova
demonstrates the usage of a cohort-based approach for sleep health intervention [23]. This
method for providing recommendations is based on providing sleep recommendations for
a new patient by looking at data from people with similar demographics. Once a cohort is
identified for a new patient, sleep-related measures that are the most dissimilar (compared to
the cohort’s) are chosen as a sleep target. Then, the sleep recommendation with the highest
positive effect on the sleep target selected is provided to the participant. Their results show
that cohort-based recommendations resulted in an increase of 17 minutes in sleep duration

18 3 SLEEP HEALTH AND INTERVENTIONS
but this result was not statistically significant. More recently, Daskalova et al. [25] presents a
series of design principles for self-experimentation systems. Although the results are in the
context of a sleep self-experimentation study, they are applicable to other domains.
In summary, prior work used sleep hygiene recommendations and evaluated some form of
personalization of content [24, 8, 23, 25, 8] or manual-personalization of timing [53] but not
both. In terms of intervention outcomes, prior work reports positive outcomes (e.g., increased
sleep duration, increased adherence) but none of them reported significant improvements over
baseline sleep measurements. These results may be explained by a common factor across
all prior work: The lack of a dynamic strategy for personalization of content and timing.
Although some level of personalization of content was part of all the interventions reviewed,
they were all personalized only once at the beginning of the intervention. Also, the lack of a
mechanism for triggering and delivering an intervention, or the use of a static method, may
have greatly limited the effect of the intervention as well. In this thesis, I went beyond the
static approach to personalization of sleep hygiene based recommendations. I personalize
timing by using users’ data to detect receptivity states and deliver sleep recommendations at
those times. I personalize content of our intervention by measuring changes in sleep duration
and efficiency.
CHAPTER 4
The SleepU app
For this thesis, I developed the SleepU app: An android application that performs on-device
AI-based personalization of sleep advice using data from a wearable and the user’s feedback.
This app was used in both Study 1 (2019) and Study 2 (2020). The user interface for both
studies remained the same; however, the internal mechanisms for personalization changed
depending on the different phases of each study. In this chapter, I first make a walk-through
of the installation and daily use of the SleepU app. Then, I explain the behavioral models and
theories used to guide the algorithmic, visual, and information design choices of SleepU.
(A)
User
Interruptibility DetectorWhen to recommend
Contextual-BanditWhat to recommend
PhoneWearable
Avoid drinking caffeine before bed time
Behavior Sensing
(B)
FIGURE 4.1. a)Fogg Behavior Model adaptation of the recommendation"avoid caffeine 6 hours before bedtime". The horizontal blue and red rectangleshows how the ability to enact a recommendation depends on time of day b)General process followed by the SleepU app.
19

20 4 THE SLEEPU APP
(A) (B) (C)
sleepU
(D)
FIGURE 4.2. Different screenshots from the SleepU app. Left to right: a)SleepU diary entry, the user gets a reminder at 9 am to fill out the diary. If theychecked their phone earlier than that, the receptivity classifier could triggera notification to fill out the sleep diary. b) The app pushing a notification tothe user about a new sleep recommendation available; note that the actualrecommendation text is omitted in the notification. c) A sleep recommendationviewable after the notification is clicked on. d) Main screen of the app whichgives the user access to the sleep recommendations selected for her for thecurrent day, with the other sleep recommendations hidden.
4.1 App description and walk-through
The general process followed by SleepU is shown in figure 4.1b: The app selects sleep
recommendations from among a set of 15 recommendations commonly used in sleep hygiene
interventions as shown in table 4.1 and delivers them at different times of the day. To select
the time of delivery the app uses a receptivity detector described in chapter 5. To select the
recommendation to show the app uses a contextual-bandit described in section 6.2.1. SleepU
tracks sleep changes caused by the recommendations through a wearable and by asking the
user if she has followed the recommendations.
At installation, SleepU asks the user to connect to her Fitbit account and asks for the necessary
permissions to access sleep-related data automatically. The next day at 9 am, SleepU pushes
a notification to the user asking her to fill out a standard sleep diary (Figure 4.2a) (i.e., time
to bed and wake up). After the user fills out the sleep diary, the app immediately uses the
Fitbit data and diary responses to estimate which of all the sleep recommendations available
should be shown at each period of the day: morning, evening, and afternoon; more details are
provided in 6.2.1. In cases where the Fitbit data is not available, the app uses the sleep diary

4.1 APP DESCRIPTION AND WALK-THROUGH 21
responses. Once the estimation procedure is completed, SleepU pushes the morning sleep
recommendation. SleepU provides at most one sleep recommendation at each time period.
The user can check the chosen recommendations for the day at any time by opening the app’s
home screen (Figure 4.2d)).
Notifications for each time period from SleepU stop once the user views a sleep recommenda-
tion. SleepU will push at least one notification per period (e.g., morning, afternoon, evening)
and a maximum of one notification per hour between 9 am and 12 am. To be able to detect
when the user reads a sleep recommendation, rather than providing the sleep recommendation
on the notification, all notifications always read "I have a new sleep recommendation for you!"
(Figure 4.2b). When the notification is clicked on, the SleepU app opens and displays the
suggested sleep recommendation. The next day after the first day of use, while filling out the
sleep diary, the user is asked whether she followed the previous day’s sleep recommendations.
Sleep recommendations followed then cause an update in the contextual-bandit, keeping track
of how good each recommendation is.
TABLE 4.1. Sleep Hygiene recommendations used in the SleepU app
MAB Sleep Recommendation
Morning Keep record of your sleep with a diary (this app’s diarycounts!)Avoid exercising 4 hours before bedtimeAlways keep the daytime routine
Afternoon Go to bed and wake up at the same time everydayAvoid caffeine 6 hours before bedtimeAvoid alcohol 6 hours before bedtimeAvoid napsAvoid heavy meals before bedtime
Evening Sleep only when sleepyGet out of bed when not asleep in 20 mins and calmdown until sleepyUse bed only for sleep and sexPerform a sleep routineTake a bath 1-2 hours before bedtimeAvoid watching the clockMake the bed environment conducive to sleep

22 4 THE SLEEPU APP
The recommendations in the SleepU app (Figure 4.2c) are a slight modification (for improved
readability) of the sleep hygiene recommendations offered by sleep clinicians [15] and include
an illustration related to the recommendation.
The SleepU app, as shown in Figure 4.3a has four different mechanisms for triggering the
delivery of a recommendation: Diary, User, Random, and Receptivity. Diary-triggered
recommendations are those checked right after filling out the sleep diary; in this case, the
participant could check any morning, afternoon, or evening recommendations available.
User-triggered recommendations are those the user checks independently without receiving a
notification from the app and not read after filling out the sleep diary. In this scenario, the
participant goes to the phone without receiving a notification and looks at any of the three
sleep recommendations available for the day. Random-triggered recommendations are those
delivered at a random time by the SleepU app. Finally, receptivity-triggered recommendations
are pushed as a notification to the user after the receptivity detector identifies a receptive state.
Although the primary goal of SleepU is to push health recommendations to the user during
receptive states, those states are limited to times when the user is interacting with the phone.
Because SleepU cannot detect receptive states when the user is away from the phone, every
hour SleepU decides randomly to use the receptivity classifier or a random time during the
next hour to interrupt the user. In addition, the probability of picking the receptivity classifier
decreases over each time period, as shown in figure 4.3b. This approach guarantees that a
recommendation is pushed in the last hour if the user has not seen a recommendation for that
time period. In the chapter 5, I explain the implementation of the receptivity detector.
A notification is pushed
A notification is pushed
A sleep recommendation
is ready in the SleepU App
Random time pickedThe user checks
the recommendation
User fills out the diary
Receptivity detection
User checks SleepU
(A)
Prob
abili
ty
Time 6am Noon
InterruptibilityRandom1.0
0.0
0.5
Every hour the app flips a coin
(B)
FIGURE 4.3. a) Process of checking a sleep recommendation in the SleepUApp. b) Probability over time to pick at random receptivity detection or arandom time for triggering a notification to read a sleep recommendation
4.1 APP DESCRIPTION AND WALK-THROUGH 23
4.1.1 Design principles and connection to behavior change theories
The choices of an algorithm, information displayed to the user, and aesthetics behind SleepU
are based on theories, and models like self-efficacy [5] theory, the Fogg Behavior Model [37],
the COM-B framework [84] and closely follows the design guidelines for Just in time adaptive
interventions [90]. Self-efficacy theory posits that behavior change occurs once the individual
perceives success towards the execution of a task. For mobile health interventions, I posit
that achieving high self-efficacy is context-dependent: Even if an individual has high efficacy
for a given task, this task can only be executed under specific circumstances, so ultimately,
success is dictated by the individual’s ability and context. As an example, an individual may
be able and willing to stop drinking coffee to improve sleep outcomes; however, due to habit,
this individual may only remember to avoid coffee once inside a coffee shop, at which point
surrendering to habit is easier than restraint. Under this scenario, a reminder that arrives with
enough time to allow the individual to avoid this particular habit could succeed at avoiding
this behavior.
Reminders driven by context and receptivity are also motivated by the Fogg Behavior Model
(FBM). This model posits that behavior is composed of three different factors: motivation,
ability, and triggers. Under the FBM, for any individual to succeed at behavior change, she
needs to be motivated, needs a trigger to perform this behavior, and can actually perform the
behavior. Take as an example, the recommendation to "avoid drinking coffee 6 hours before
bedtime"; an individual’s ability level to perform this recommendation varies during the day
as shown in Figure 4.1a, where the morning and afternoon are among the best times to provide
this recommendation, while an evening reminder cannot result in behavior change since the
window of opportunity for succeeding has already passed, and it is too far away from the next
occurrence of caffeine intake for planning. In the SleepU app, the FBM trigger is a notification
delivered to the user’s phone. COM-B [84], a behavior change framework, relates several
causal factors (e.g., capability, opportunity, and motivation) for the performance of volitional
behavior, including the influence of extrinsic factors. The COM-B model is the result of an
exhaustive literature review and the summarization of nineteen different behavior change
frameworks. Compared to FBM, COM-B considers the role of motivation at a broader level

24 4 THE SLEEPU APP
in the performance of behavior mediated by ability and opportunity (triggers under the FBM).
However, COM-B goes further and suggests that motivation, capability and opportunity are
also influenced by the performance of the behavior. This implies that motivation can increase
as the patient engages more with behaviors resulting in a positive health outcome. In the
context of SleepU, when the user follows a recommendation that results in better sleep, this
outcome helps future executions of that sleep recommendation and may help the user explore
the execution of other sleep recommendations. For this reason, SleepU, through a contextual
bandit as explained in section 6.2, estimates which recommendations among the followed
ones result in better sleep and shows them more frequently than those that are less likely to
improve sleep. Last, SleepU does not have sleep tracking or other functionality standard in
wellness and health apps to avoid any factors that could affect the intervention outcomes.

CHAPTER 5
Personalization of time of treatment: Mobile-receptivity detection
Receptivity identification is crucial for the success of mobile health interventions [90], but
it may be impossible to measure since it requires the sensing of constructs like willingness1
which can change with context and are is not directly measurable 2. Although there has
not been any work looking at detecting receptive states from sensor streams, researchers in
human-computer interaction (HCI) have a well-established body of work on a very close
concept: interruptibility. This section summarizes the most prominent and recent work in
interruptibility detection from mobile phone sensors. This body of work inspires the definition
of mobile-receptivity as shown in section 5.2, a construct very close to receptivity adapted for
mobile health interventions and constrained to be measurable through mobile phone sensors or
similar technologies. Following this definition, I implemented and tested a mobile-receptivity
detector. The detector is a machine learning model trained using mobile-phone data from
37 participants collected during four weeks. The performance of the receptivity detector
is reported at the end of this section. This mobile-receptivity detector was used in a pilot
randomized clinical trial as a trigger for the delivery of a sleep health intervention presented
in chapter 7. Details about the mobile-receptivity detector implementation are provided in
section 5.3.
1Willingness refers to the desire or volition towards treatment.2Willingness could be measured through proxies like surveys however there are not any methods that could
measure brain activity to determine willingness towards treatment
25

26 5 PERSONALIZATION OF TIME OF TREATMENT: MOBILE-RECEPTIVITY DETECTION
5.1 Related work
Intervention points are contexts (time, location, etc.) where treatment should be delivered.
Following the definition of intervention points provided by Nahum-Shani et al. [90], this work
is focused on the identification of opportunistic states defined as contexts where the patient is
not in a vulnerable state but is in a state where she has the "ability or willingness to receive,
process and utilize just-in-time support". There is not any prior work demonstrating the
sensing of receptivity states as defined [90]. Instead, researchers working in receptivity [86,
71] have re-purposed interruptibility detection methods for detecting receptive states. The
resulting receptivity detectors have shown promising results; however they either were not
tested in a live deployment[71] or did not result in changes to intervention outcomes like
treatment adherence or changes to the main intervention outcome[86].
Morrison et al. [86] explored the use of interruptibility to trigger the delivery of a stress-
management intervention at receptive times on a mobile phone. Their interruptibility detector
was trained using each participant’s interactions with the stress intervention itself and using
an Android interruptibility library [97]. Due to sample size, this exploratory study did not
provide sufficient power to test group differences definitively and instead provides effect
size results. These results were mixed but promising: "frequent notifications may encourage
greater exposure to intervention content without deterring engagement, but adaptive tailoring
of notification timing does not always enhance their use" [86]. They also found that the group
of participants assigned to receive interruptibility-based recommendations appeared to take
action at a higher rate than random timing (d = 0.23). More recently, Kunzler et al. [71]
explored and found significant effects of contextual factors like time of day, phone battery
level, physical activity, etc., on receptivity. They performed an offline-only evaluation of a
receptivity classifier on Android and iOS data using 10-fold cross-validation, resulting in
a lower but similar performance reported for interruptibility detectors also evaluated with
cross-validation. It is important to mention that cross-validation results from time-series data
are over-optimistic since the independence assumption is broken. In comparison, work that
splits the data according to users has lower but close to real-world performance results. For
this reason, I use as a reference for my receptivity work the performance of the interruptibility

5.2 MOBILE-RECEPTIVITY AND INTERRUPTIBILITY 27
detector introduced by Pielot et al. [98]. For this thesis, I built a receptivity detector, tested it
offline, and finally used it in a sleep health intervention to evaluate its effects on the primary
intervention outcome and adherence to treatment.
5.2 Mobile-receptivity and interruptibility
Interruptibility is closely related to receptivity [89], however, there is not a single definition
of interruptibility, and instead, it has been studied under different terms:
• Interruptibility [91, 49]: the idea that people have moments during the day when
they are available to be interrupted. At such times, an interruption has a low enough
cost such that an interruption is acceptable.
• Attention [99, 100]: The idea that people are busy and have moments of attention
that they can direct towards something other than their current task.
• Boredom [100]: the idea that people intentionally seek information and ways to
entertain themselves.
• Engagement [98] with the information presented: Users not only attend to a notifica-
tion but click on it to find out more about it. Engagement detection is a step forward
in the direction of receptivity detection, and it is well-differentiated with interruptib-
ility work, which main focus is on finding a moment where the user is reachable by
a notification or another type of alert [98]. Instead, engagement detection aims to
estimate the user’s states where she is likely to engage with the content provided.
All of the above concepts are related in the following way: interruptibility preludes en-
gagement, and engagement preludes receptivity. Thus, Interruptibility is necessary but not
sufficient for engagement. Likewise, engagement is necessary but not sufficient for receptivity,
and receptivity implies an individual is interruptible and engaged. Unfortunately, despite the
importance of receptivity, there is no work looking at the detection of receptivity to trigger
the delivery of a health intervention. However, some researchers have considered including
receptivity in future studies [68] as a fundamental part of mobile health interventions. In
this thesis, I bridge interruptibility and receptivity under a new term, mobile-receptivity: A

28 5 PERSONALIZATION OF TIME OF TREATMENT: MOBILE-RECEPTIVITY DETECTION
state in which an individual has the cognitive ability to stop their current task to read and
make sense of a notification related to health treatment in the context of a mobile health
intervention. In practice, this can be measured by observing when the user clicks and reads
through a push notification from a mobile phone application. Although mobile-receptivity
is more constrained than interruptibility, many of the related work and lessons learned in
building models of interruptibility can be used for building models of mobile-receptivity.
5.2.1 Detecting interruptibility
Although interruptibility itself is not sufficient for identifying mobile-receptivity states, many
of the methods and features used are useful for detecting mobile-receptivity. The preferred
method for building models of interruptibility is by using machine learning classifiers. Re-
searchers have used different classifiers to build successful interruptibility detectors; however,
the preferred classifiers are decision trees and random forests [99, 49, 98, 60, 91, 29] . The
performance of models of interruptibility has been measured mainly in two different ways:
leave a subset of users out at random or cross-validation in which data is randomized without
taking into account time or user independence. The latter evaluation is the most prevalent
in the literature and accounts for the best results. This is expected due to cross-validation’s
over-optimistic results in time series data where the independence assumption is broken,
and as a result, work that splits the data according to users has a lower but more realistic
performance estimate to those expected in a real-world deployment. Engagement work [98]
shows the lowest performance; however, this is expected since engagement is only a tiny
subset of interruptible situations and a much more challenging event for detection.
5.2.2 Features
In terms of the data used to build the classifiers, an ever-increasing number of features is being
used by researchers to detect interruptibility. The number of features used has varied from 4
to more than 300, and there is no agreement on what features should be used. However, [98]
presents an all-encompassing categorization of the different features used that is informative

5.2 MOBILE-RECEPTIVITY AND INTERRUPTIBILITY 29
Paper Method Evaluation A P R F1 Featuresselection
Didn’t You See MyMessage? (Pielot etal. 2014 )
Random Forests Random cross-validation 0.68 – – – WrapperAccuracy
Using Context-Aware Computing(Ho et al. 2005 )
Decision Tree Data split into train andtest
0.91 – – – –
Beyond interrupt-ibility(Pielot et al.2017-09-11 )
XGBoost Cross validation randomiz-ing over random groups ofpeople
0.89 0.218 0.540 0.31 Featuresselection
People’s inter-ruptibility in-the-wild(Tsubouchi etal. 2017 )
Linear regression Live evaluation of themodel, the performancemetrics were reduced userresponse time 49%(54 to27 minutes)
– – – – –
Continual Predic-tion of Notifica-tion(Katevas et al.2017)
RNNs XGBost Cross-validation includinggrid search for XGBoost
AUC 0.7 0.8 0.5 0.61 Featuresselection
Towards attention-aware (Okoshi et al.2016-02 )
Random forests — 0.82 0.82 0.82 0.82 —
I’ll be there foryou(Dingler et al.2013)
Random forests – 0.79 0.77 0.82 0.79 —
When attention isnot scarce (Pielot etal. 2015 )
– Random cross-validation 0.83 – – – —
InterruptMe(Pejovicet al. 2014 )
Adaboost Random cross-validation 0.73 0.36 0.48 0.41 —
Using decision-theoretic(Rosenthal etal. 2011 )
Logistic regression — 0.9 – – – —
Exploring the stateof receptivity iOS(Kunzler et al.2019)
Random Forests 10 fold cross-validation – 0.3 0.27 0.29 —
Exploring the stateof receptivity an-droid (Kunzler etal. 2019)
Random Forests 10 fold cross-validation – 0.35 0.65 0.45 —
TABLE 5.1. All the articles including method, evaluation and performanceresults. A (Accuracy), P (Precision), R(Recall), F1(F1_score)
.
and allows for flexibility in implementation. Furthermore, all of the features used in other
works fall into one of the categories described by [98], and so it is recommended to use them
in any interruptibility:
• Communication activity: Computer-mediated communication. This group includes
features that show how often a user uses the phone to communicate with others
by, e.g., sending or receiving messages or making or replying to phone calls. For

30 5 PERSONALIZATION OF TIME OF TREATMENT: MOBILE-RECEPTIVITY DETECTION
instance, a user that just got distracted by an incoming phone call might not be open
to further interruptions. Examples of Communication Activity features are number
of SMS messages received in the past hour, time since the last incoming phone call,
or category of the app that created the last notification.
• Context: Features related to the situation of the mobile phone user i.e., his or her
environmental context. The context of use often determines whether it is appropriate
or safe to interact with the mobile phone. For instance, being at home during the
weekend may indicate opportune moments for interruption, whereas being at work
during the morning may indicate the opposite. Examples of contextual features
are the time of day, estimated current distance from home, current levels of motion
activity, or average ambient noise level during the last five minutes.
• Phone status: These features measure the status of the mobile phone. For instance,
a device with screen status ‘unlocked’ indicates that the user is currently using the
phone; thus, a notification might be interrupting a concurrent task. Examples of
Phone Status features are the current ringer mode, the charging state of the battery,
or current screen status (off, on, unlocked).
• Usage patterns: These features estimate the type and intensity of usage of the phone.
For instance, a user engaged in playing a game or watching a video may be less open
to an interruption, whereas surfing on the Internet might provide a better moment.
Examples of Phone Usage features are the number of apps launched in the 10 minutes
before the notification, average data usage of the current day, battery drain levels in
the last hour, number of device unlocks, screen orientation changes, or photos taken
during the day.
Demographics is another category used in the literature; however, it has mainly covered age
and gender, and no other variables have been investigated. The importance of the features
by category was studied by (Pielot et al., 2017)[98]; in that work, the ranking from best to
worst features to predict interruptibility: Context (1), Communication (2), Usage Patterns (2),
Demographics (3), Usage Patterns (3). A feature analysis was performed by (Pielot, et al.,
2014)[99], using the same categorization as in (Pielot et al., 2017)[98] the ranking becomes

5.3 MOBILE-RECEPTIVITY DETECTION 31
Communication (1), Context(2), Demographics(3), Usage Patterns(4). These results show
that consistently both Communication and Context are the most important categories.
5.3 Mobile-receptivity detection
In this thesis, the mobile-receptivity detector is not claimed as a contribution since it is an
extension of previous work [99, 49, 98, 91, 60, 100]. Instead, the contribution is in demon-
strating how using a receptivity detector in a behavioral intervention improves adherence. The
receptivity detector is a machine learning classifier that detects receptivity states from phone
sensor data, statistics from user interface events, and the Google Activity Recognition API. In
the next section, I explain how data was collected to build the detector, the machine learning
pipeline used for training, performance evaluation, and integration to the sleep intervention.
5.3.1 Data collection and features
Data for building the receptivity detector was collected during the baseline phase (i.e., first
four weeks without any intervention) of our sleep intervention as described in section 7.1.3
chapter 7. A background app passively collected smartphone sensor data in the background
and logged how the user interacted with all notifications received. SleepU’s receptivity
detector uses all of the features identified in [98], a total of 88 different features summarized
as: Communication activity (e.g., number of SMS received, time since last phone call);
Context (e.g., light, proximity, activity from Google’s activity recognition API); Phone status
((e.g., battery level, time since unlocked, number of times locked in the day); Usage patterns
(e.g., number of apps interacted with, number of UI events). The app computed and stored
the features every second as long as the phone was not in sleep mode. For ground truth labels,
I followed the methodology in [98]: if the user clicks on a notification within 10 minutes of
arrival, the data collected between the arrival time and click are labeled as receptive. To detect
when the participant clicks on a notification, I used Android’s notification listener service and
the accessibility service events log.

32 5 PERSONALIZATION OF TIME OF TREATMENT: MOBILE-RECEPTIVITY DETECTION
f(x)-min(f(x))max(f(x))-min(f(x))
FIGURE 5.1. Machine learning pipeline for training and deployment of thereceptivity detector
5.3.2 Machine Learning Pipeline
The steps to train the receptivity detector were kept simple to ease implementation and avoid
computing overhead during our deployment. The first step was to compute statistical features
(e.g., mean, max, min, and standard deviation over each window) over a sliding window of 5
minutes. After that, values were normalized using a min-max scaler. The pipeline is shown in
Figure 5.1.
5.3.3 Classifier and Performance evaluation
The classifier is a Multi-Layer Perceptron (MLP) from the scikit-learn library [96] for our
receptivity detector. The classifier was trained from batches of data (online learning), allowing
me to build a classifier as soon as data arrived from each participant instead of waiting for
all participants to finish their baseline phase. This functionality is available for MLP but
not for Random Forests or Decision Trees in scikit-learn. The MLP layers size are 88
(input), 50 (hidden), and 2(output) with an L2 penalty of 0.1, and trained using the ADAM
solver. The hidden layer size and alpha values were optimized using grid search. To balance
the number of observations per class was used SMOTE [16]. The MLP was trained using
participant’s data collected during the 4-week baseline period. The performance of the
MLP was evaluated using leave-one-out-validation stratified by participant: Accuracy =
0.88, P recision = 0.44, Recall = 0.74, F1_score = 0.54 . Our receptivity classifier has

5.3 MOBILE-RECEPTIVITY DETECTION 33
a better performance than the state-of-the-art engagement classifier ([98]: Precision =
0.2, Recall = 0.5, F1_score = 0.3).
5.3.4 Receptivity detection during intervention
After training the receptivity detector, it was ported to Android-Java using sklearn-porter [85].
This detector was instantiated as an object inside an android service that checks for receptivity
every second. The receptivity detector stops working once a recommendation for the current
period is seen by the user as explained in section 4.1.
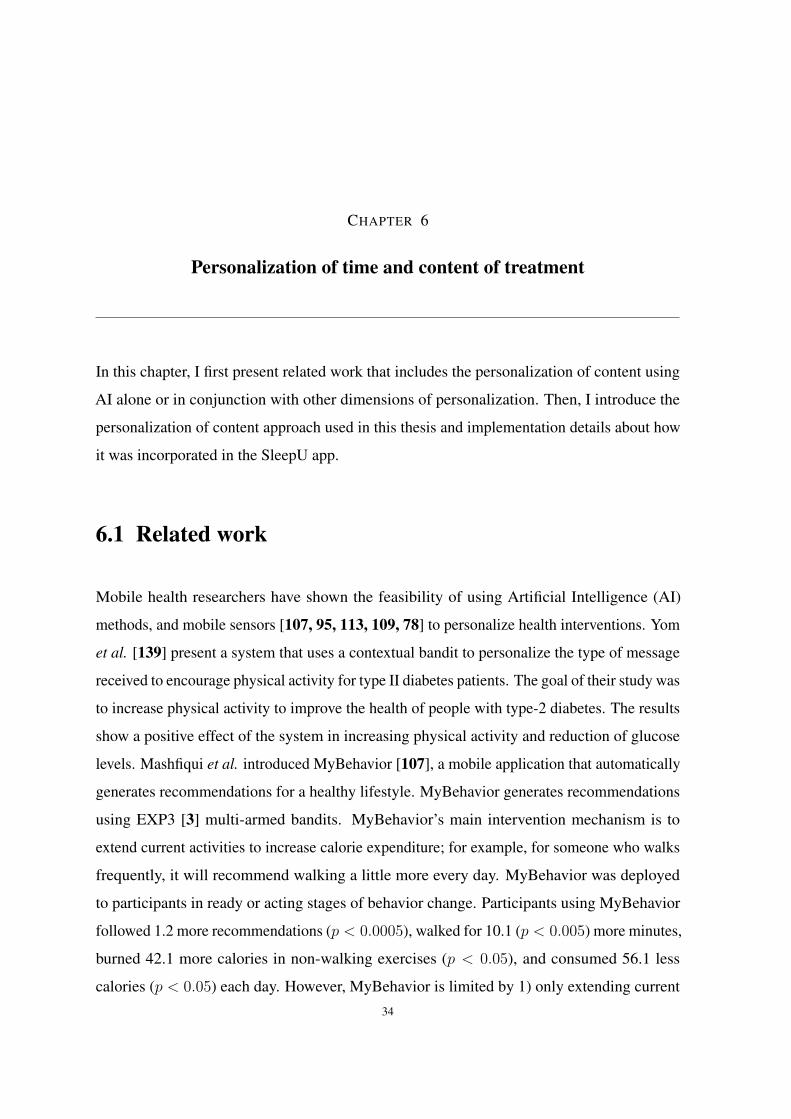
CHAPTER 6
Personalization of time and content of treatment
In this chapter, I first present related work that includes the personalization of content using
AI alone or in conjunction with other dimensions of personalization. Then, I introduce the
personalization of content approach used in this thesis and implementation details about how
it was incorporated in the SleepU app.
6.1 Related work
Mobile health researchers have shown the feasibility of using Artificial Intelligence (AI)
methods, and mobile sensors [107, 95, 113, 109, 78] to personalize health interventions. Yom
et al. [139] present a system that uses a contextual bandit to personalize the type of message
received to encourage physical activity for type II diabetes patients. The goal of their study was
to increase physical activity to improve the health of people with type-2 diabetes. The results
show a positive effect of the system in increasing physical activity and reduction of glucose
levels. Mashfiqui et al. introduced MyBehavior [107], a mobile application that automatically
generates recommendations for a healthy lifestyle. MyBehavior generates recommendations
using EXP3 [3] multi-armed bandits. MyBehavior’s main intervention mechanism is to
extend current activities to increase calorie expenditure; for example, for someone who walks
frequently, it will recommend walking a little more every day. MyBehavior was deployed
to participants in ready or acting stages of behavior change. Participants using MyBehavior
followed 1.2 more recommendations (p < 0.0005), walked for 10.1 (p < 0.005) more minutes,
burned 42.1 more calories in non-walking exercises (p < 0.05), and consumed 56.1 less
calories (p < 0.05) each day. However, MyBehavior is limited by 1) only extending current34

6.1 RELATED WORK 35
activities without suggesting new ones that could result in higher calorie expenditure, and
2) MyBehavior does not push recommendations and instead relies on the user motivation
and readiness to change look for recommendations on the phone. Mashfiqi et al., followed
MyBehavior with MyBehaviorCBP [108], which uses a very similar method for providing
suggestions for pain management. Paredes [95] presents a stress intervention that uses a
contextual bandit to provide stress recommendations through a mobile phone. Their results
show a marginally significant decrease of perceived stress for participants in one of their
experimental conditions, but there was no overall intervention effect.
Overall, all of the systems and methods[107, 139, 95], produce very encouraging results
that show that personalization of content generates behavior change for participants with
a high readiness to act [107, 139], and positive outcomes for participants at any readiness
level [95]. Except for [95], prior work lacks a mechanism for proactively delivering health
recommendations and instead relies entirely on the user’s willingness or a predefined time
to receive recommendations. This strategy potentially limits the effect of the intervention
to highly motivated people, leaving out unmotivated participants. In Paredes et al., work,
although personalization of timing and content of treatment was pursued did not result in
behavior change. I attribute this result to high computational complexity by solving two
aspects of personalization with a single method.
Consequently, in this thesis, health recommendations are pushed to participants more pro-
actively by displaying sleep recommendations relevant for the time of the day and when
I detect that the patient is receptive. Also, treatment is personalized through contextual
bandits that identify the best content (i.e., sleep recommendations) for each person in their
current context, including the time of the day. Also, to make this problem computationally
tractable, I intentionally personalized timing and content separately. This thesis is the first
work evaluating the disjoint personalization of timing and content of treatment in the context
of a mobile health intervention.

36 6 PERSONALIZATION OF TIME AND CONTENT OF TREATMENT
6.2 Personalization of content
Personalization of content in this work is defined as a reinforcement learning problem [120]
(i.e., sequential decision making problem) in which an agent is interacting in an environment
by taking actions, and the goal of the agent is to maximize some reward over a period of
time. In this work, the agent is the SleepU app, the available actions for the app are the
different sleep recommendations pushed to the user, and the reward is defined as the harmonic
mean of sleep duration and sleep efficiency. In addition, treatment adherence is used to
control updates to the estimates of possible rewards for each action; when a user reports
that a recommendation was followed, an update occurs. Otherwise, there is no update since
there is no new information. In summary, the SleepU app is selecting and displaying sleep
recommendations to a participant while maximizing the following day’s sleep duration and
efficiency. Specifically, SleepU uses a contextual bandit as the reinforcement learning method
for personalization of context.
6.2.1 Contextual bandit
This contextual bandit method [73] extends the bandit algorithm by adding the capability
to deal with context. Contextual bandits are typically used in web advertising where the
goal is to maximize click-through rates by deciding, for example, the on-screen location and
topic of a web ad given a particular set of contextual features like user age, time of day, and
season. For the implementation of SleepU, I chose contextual bandits instead of methods like
Q-Learning or SARSA because of its ability to learn from a small amount of data.
To make the personalization of content computationally tractable, I divided the day into
three different non-overlapping periods: morning (6:01am to 12pm), afternoon (12:01pm
to 6pm), and evening (6:01pm to 6am). To decide in which period each recommendation
should appear, I worked together with a sleep clinician. In addition, I took into account that
some activities need planning. For example, for the recommendation "Avoid exercising 4
hours before bedtime", the goal is to remind the student to plan to exercise at a different time.
Therefore, the best time to remind them about it is in the morning. More details on how these

6.2 PERSONALIZATION OF CONTENT 37
recommendations were selected and displayed are provided in the study design section (7.1.3)
chapter 7.
For each period, I use a different EXP3[3] multi-armed bandit (MAB). As defined in [73],
this particular usage of multiple multi-armed bandits for different contexts corresponds to a
contextual bandit. A similar approach could be taken for other health interventions where the
contextual factor with the most weight in the intervention could be used to separate different
contexts, and then a different MAB can be used for each context.
EXP3 works by selecting a recommendation at random from a multinomial distribution. The
EXP3 algorithm is described in algorithm 1. There are many different multi-armed bandit
methods such as the Upper Bound Confidence Interval, Thompson sampling, etc., however,
EXP3 has been used in real-world deployments (e.g., [107]) with successful results.
Initialization;w(0) = {w(0)
n = 1}, n = 1, ...., N ;for t=1,...,T do
β =√( log(k)/(k · t));
Select recommendation i;φ(t) =
∑Nn=1 w
(t)n ;
p(t)n = w
(t)n /φ(t);
i ∼Multinomial(w(t−1)/φ(t−1));Compute sleep score;s(t) = 1(i ∈ r(t−1)) ·H(sleepD(t−1), sleepE(t−1));Update;w
(t)n = w
(t−1)n · e(−β·`(s(t))/p(t)n )
endAlgorithm 1: EXP3 algorithm adapted for the sleep recommendations problem. Wherew
(t)n is the weight for recommendation n at time t, pn is the probability of selecting a
recommendation, sleepD is the sleep duration in hours capped at 7 and divided by 7.Capping by 7 forces EXP3 to focus on increasing sleep to healthy levels without forcingthe user to achieve a hard-coded sleep duration that may not be preferred. sleepE is thesleep efficiency estimated as the sleep duration divided by the time in bed. H(x) is theharmonic mean and 1(i ∈ r(t−1)) is one if the recommendation i pushed by the app to theparticipant is reported as being followed.
EXP3 in the context of SleepU starts with a uniform probability for the sleep recommendations
for each period. When a recommendation has a positive sleep outcome (high efficiency and/or
high sleep duration), the probability of that recommendation is increased slightly while

38 6 PERSONALIZATION OF TIME AND CONTENT OF TREATMENT
all the other recommendations’ probabilities are decreased. A short version of the sleep
recommendations handled by each of the MABs is shown in Table 4.1. Our approach using a
MAB naturally avoids learning the user habits. For example, a user could, even before using
the app, already follow a sleep recommendation like "avoid exercising before bedtime." The
participant then will answer at any time during the intervention that she followed the sleep
recommendation. However, because "avoiding exercising before bedtime" is a habit (i.e., it
happens every day), following this recommendation will not have any effect on sleep, and so
the bandit will decrease the probability of this recommendation.

CHAPTER 7
Study 1:Exploratory trial of the SleepU App
In this chapter, I introduce the first exploratory trial of the SleepU app. The goal of this study
was to evaluate the feasibility of the personalization of content and time of treatment approach
presented in chapter 6 and 5 as well as preliminary answers to some of the research questions
posed in chapter 1 of this thesis.
7.1 Method
The SleepU app was deployed in a 12-weeks long, within-subjects research study with college
students from Carnegie Mellon University (CMU) that followed the study design shown in
figure 7.1. After screening, participants in the study were randomly assigned, while balancing
gender across groups, to two different groups: app-first or control-first. The two different
groups were created to counterbalance any possible order effects.
The eligibility requirements for participation were: 1) Participants had to be 18 to 25 years old
and with an active undergraduate student status at CMU. 2) Participants could not have any
on-going problematic substance use (i.e., drugs, alcohol or nicotine) or sleep disorders (i.e.,
apnea, narcolepsy, chronic insomnia). This latter exclusion criterion was necessary because
participants with these issues need specialized sleep treatment.
All participants were exposed to three different study phases, each approximately 4 weeks
long and phase order dependent on their group assignment. The different phases were:
• Baseline: This is the first phase of the study for all participants. Participants were
given a Fitbit Flex2 activity tracker. During this phase, there is no intervention, and39

40 7 STUDY 1:EXPLORATORY TRIAL OF THE SLEEPU APP
only phone and Fitbit data are collected. I collected phone sensor data passively in
the background using our logging app. This app was uninstalled after the baseline
phase.
• App-intervention: In this phase, students were asked to install the SleepU app
on their phones. Participants were sent a link from the research coordinator with
instructions on how to install the app. During the study intake, participants were told
that it was not mandatory to follow sleep recommendations provided by the app and
that the only mandatory part of the study was to fill out the daily sleep diaries. After
four weeks of this phase, participants uninstalled the SleepU app.
• Control-intervention: In this phase, students attended a sleep health consultation
with a sleep clinician. This sleep consultation is part of the standard care provided
by CMU at no cost. During the consultation, a sleep clinician covers the basics
about sleep following recommendations from the Australian Centre for Clinical
Interventions [15]. In addition, the clinician performs a sleep assessment using the
Pittsburgh Sleep Quality Index (PSQI) [14], and creates a personalized plan for the
student to put in practice sleep hygiene recommendations. The sleep clinicians
The sleep consultations were scheduled with the university health center after
a participant joined the study. The consultations occurred at the beginning of the
control-intervention phase of the study. If the student was in the app-first group, they
were asked to uninstall the SleepU app before the consultation.
App-first group
Control-first group
Baseline App Control
Baseline Control App
Screening Q
Q Q Q
Q Q Q
FIGURE 7.1. Study design. All study phases lasted four weeks except forscreening. The Qs indicate times in the study when the participants filled out abattery of questionnaires as explained in section 7.1.3.

7.1 METHOD 41
Due to the limited availability of sleep consultations, the study duration varied slightly among
participants.
7.1.1 Study design considerations
Given the exploratory nature of this work, the purpose of this thesis is to identify components
of a mobile health intervention to optimize for in future iterations as stated in the multi-phase
optimization strategy (MOST) [20]. This study falls under the preparation stage of MOST,
and as such, this study does not have separate groups evaluating each component of the
intervention; instead, I exposed all participants to all components. Our study design follows
recommendations by Onghena et al.[92] and Dallery et al.,[22] that argue for the use of
single-case experiments: small scale, within-subject experiments. Single case experiments,
despite using a small n can achieve statistical power through many repeated measures from
each participant in the experiment. In our study, participants generate at least one behavioral
observation per day from sleep measurements captured through the Fitbit and sleep diary,
which amount to up to 84 days. In addition, the app captured up to 3 daily observations
from adherence to sleep recommendations which amount to up to 252 adherence observations
per participant. As suggested by Onghena et al., [92], I used Hierarchical Linear Models
in analyses that involved participants repeated measures. The sample size was determined
following the guidelines for single-case experimental designs[22] which argues that n ≥ 4 is
sufficient for statistical power if enough repeated samples are collected per participant.
7.1.2 Participants
Participants were recruited using flyers and Facebook posts at university groups at the
beginning of January 2019. After screening, 37 participants were invited to join the study.
Of those, 30 participants (22 Female, 7 Male, 1 Undisclosed) finished the study. Seventeen
participants were in the control-first group (3 Male) and 13 in the app-first group (4 male).
Participants were compensated with 10 dollars (US) for each week of data logged in the study,
and, as an extra incentive, those filling out 80% or more of the sleep diaries were allowed to

42 7 STUDY 1:EXPLORATORY TRIAL OF THE SLEEPU APP
keep the Fitbit Flex2. The participants were explicitly not compensated for using the SleepU
app’s sleep intervention functionality (e.g., checking or following sleep recommendations).
7.1.3 Measures
After screening, participants were asked to fill out a set of questionnaires related to sleep health
and other related and proximal outcomes after each phase of the study. The questionnaires
included measures of psycho-social or physiological processes that mediate health behavior
change as suggested by Klasnja et al. [66]. The questionnaires used were: the Pittsburgh
Sleep Quality Index (PSQI) [14], Sleep Practices and Attitudes [43], Sleep beliefs scale [1],
Perceived stress scale [18], Morningness - Eveningness questionnaire [52], Readiness to
change towards healthy sleep-related behaviors questionnaire(i.e., motivation questionnaire
[10]) .
I created the readiness questionnaire from a readiness ruler, a questionnaire that measures
the patient’s health stage as defined in the transtheoretical model of behavior change [105].
The readiness ruler has been used for smoking cessation [10] and alcohol rehabilitation
interventions [48]. Our modification consisted of adjusting the text content for sleep hygiene
recommendations and decreasing the number of options from 10 to 8 options for improved
readability on a mobile phone, on which participants were filling out the questionnaire.
In our motivation questionnaire, I asked participants to rate their readiness for each of the 14
different sleep recommendations listed in table 4.1, excluding the sleep diary recommendation
since I directly compensated participants for the diary entries. The readiness levels used
a scale from 1 to 7: 1) Not ready at all, 3) Thinking about it, 5) Planning and making a
commitment, 7) Actively/Already doing it, and a Does not apply to me option (e.g., the coffee
recommendation for participants that do not drink coffee). Additionally, participants were
asked to fill out a standard sleep diary every day during the 12 weeks duration of the study.
Participants received an email with a link to the sleep diary website form every morning
during the baseline and control-intervention phases. In the app-intervention phase, participants
received the sleep diary prompt on the SleepU app (via a notification) with three additional
7.1 METHOD 43
questions asking whether the participant followed any of the three sleep recommendations
generated by SleepU the previous day. All participants were provided with a Fitbit Flex2,
a wrist-worn wearable with sensors that measure steps and sleep (awake vs. asleep). Sleep
duration and efficiency were collected during the 12 weeks of the study except when the Fitbit
was being charged. Participants in the study were instructed to wear the tracker at all times,
including while taking a shower and sleeping. The device does not collect any data while
recharging or at any time when the user does not wear it.
7.1.4 Analysis plan
In the next paragraphs, I describe the statistical analysis steps followed to answer the research
questions (RQ) defined in the introduction. Moving further, to refer to each of these questions,
I instead use the short name provided for each.
• Behavior-RQ: What are the effect of personalization of timing and content
in behavior change and motivation? To explore this question, I estimated the
effect of intervention by fitting a Generalized Linear Mixed Model (GMM) with
fixed effects for phase, group, and phase-group interactions and a random effect
for the participant. The data was not aggregated, given that GMMs can handle
raw data directly. I controlled for factors like baseline amount of sleep (Type-
of-sleeper[75]), and the number of days in the intervention [95] following data
analyses and conclusions from previous work. A thorough explanation of why
controlling for these factors is necessary is provided in the appendix section 12.1. I
added the covariates sequentially [35] and compared them as shown in table 12.2
in the appendix. I also explored whether SleepU impacted participants’ motivation
to improve their sleep. I compared the effect of app-intervention in motivation
against baseline values and the control-intervention. To measure this effect, I used
the Aligned Rank Transform for Nonparametric Factorial ANOVAs (ART) [135]
followed by pairwise comparisons using a Wilcoxon signed-rank test.
• Adherence-RQ: What is the effect of personalization of timing and content on
adherence to treatment? To explore the effect of personalization on adherence,
44 7 STUDY 1:EXPLORATORY TRIAL OF THE SLEEPU APP
I first looked at the adherence rate of each participant and compared it across the
different notification mechanisms. I define adherence rate as the number of recom-
mendations followed divided by the number of recommendations seen, aggregated
over each period, and participant. Next, I compared adherence rates using a one-sided
Wilcoxon-Pratt Signed-Rank Test.
• Context-RQ: What is the effect of context and motivation of the participant
in the likelihood of adherence to recommendations? To explore the effect of
context and motivation, I first aggregate the data into the different periods for each
participant during the app-intervention phase. Then I used a Binomial Generalized
Linear Mixed Model (BMM) with a random effect for the participant and fixed
effects for day-of-intervention and period of delivery, and baseline motivation of the
participant. Adding baseline motivation as a covariate is justified by the COM-B
[84] health model that states how motivation directly influences behavior. COM-B
has been used in many interventions ranging from hearing aid use [6], coaching
for Latina moms with gestational diabetes [47], and sleep hygiene [117]. I added
the covariates sequentially [35] and compared them as shown in table 12.3 in the
appendix.
All p-values are adjusted within hypotheses using Benjamini-Hochberg to correct for type
I error as recommended in [9] and following [83]. I used R 3.6.3, and the lme4 [7] and
ggeffects [80] packages. Exploratory data analysis and hypothesis testing were conducted in
Jupyter notebooks.
7.2 Results
Overall I found that our pilot study evaluating SleepU resulted in improved sleep duration,
time-in-bed, treatment adherence for recommendations delivered when the user was receptive,
and increased motivation. The next is a breakdown of these results, as guided by the research
questions I posed earlier:

7.2 RESULTS 45
Delivery mechanism Average adherence rate ( 95% CI ) p-value Cohen’s dReceptivity (Reference) 0.71 0.62 0.80Random 0.49 0.39 0.60 0.0029 0.40User 0.39 0.31 0.48 1.39e-5 0.56Diary 0.57 0.47 0.66 0.01 0.30
TABLE 7.1. Table of comparisons of adherence rates for all the differentmechanisms. All p-values adjusted using Benjamini-Hochberg.
7.2.1 Behavior-RQ
I found that participants in our study improved sleep duration and time in bed. I
also found that, on average, all our participants moved from a preparation stage to an
action stage i.e., they moved from thinking about improving their sleep to actively trying
sleep recommendations. Out of the 30 participants that finished the study, I used the data
from those that logged at least a week of Fitbit data during the app-intervention and the
control-intervention leaving a total of 23 participants data for analysis.
I found an overall effect of phase on sleep duration (χ2(4) = 28.8,p < 0.00001). I then found
a significant difference between the baseline and app-intervention phases (app− baseline =
23 minutes,CI(38, 10),p < 0.005, d = 0.26) and a significant difference between app and
control-intervention (app− control = 15 minutes, CI(24, 7),p < 0.005, d = 0.16). I used
the same model structure for different independent variables like time-in-bed, efficiency,
minutes awake after sleep onset, minutes to fall asleep and minutes after wake up. I found
a significant difference for time-in-bed of 15 minutes with baseline (p < 0.005, d = 0.15)
and 25 minutes with the control-intervention (p < 0.005, d = 0.25). I did not find any other
significant differences for other independent variables.
I found a change in average motivation as measured through our readiness scale for all
participants from 4.6 in baseline to 5.17 during app-intervention (p = 0.059, r = 0.55).
There was also a change for all participants from 4.6 in baseline to 5.11 during the control-
intervention (p = 0.086, r = 0.45). There was no difference in motivation between the app
and the control interventions (p = 1.0,r = 0.07). I looked at motivation before (4.5) and after
(4.6) the baseline phase and found no difference (p = 0.65,r = 0.13). I found that motivation
46 7 STUDY 1:EXPLORATORY TRIAL OF THE SLEEPU APP
during the screening phase and by the end of the baseline phase did not change by a large
amount. This result suggests that just filling out a sleep diary daily and being involved in a
sleep study (without receiving any intervention) does not have a visible effect on participant
motivation, and hence I would not expect to see a behavioral change as a consequence of the
baseline phase alone.
7.2.2 Adherence-RQ:
I found that sleep recommendations delivered at detected receptive states result in
higher adherence compared to delivered at random, after the sleep diary or those read
independently by the user. Out of the 30 participants that finished the study, I used the data
from those that logged at least a week of SleepU logs data during the app-intervention, leaving
a total of 24 participants’ data for analysis. On average, our participants logged 20 days
during app-intervention (sd = 7.0). I found that the delivery mechanism (e.g., receptivity,
random, user and diary) had an effect on adherence (χ2(4) = 67.7,p < 0.00001). Planned
comparisons revealed that receptivity had the highest adherence rate (75%) as shown in table
7.1 and figure 7.2b.
7.2.3 Context-RQ
I found that contextual factors and motivation have wide ranging and significant effects
on adherence. I found that the period of delivery of recommendations has an overall negative
impact on adherence, as shown in figure 7.2a . The odd ratios for the different periods
are all less than one. This result indicates that any period causes a decrease in the odds of
adherence of at least 50%. In terms of probabilities, assuming day 1 of the intervention and
no recommendations the probability of adherence to a sleep recommendation is 0.58 in the
morning, 0.53 in the afternoon and 0.32 in the evening. Under the same scenario, and with a
recommendation delivered through the receptivity classifier, the probabilities become 0.86
in the morning, 0.83 in the afternoon, and 0.67 in the evening. Day in the intervention has a

7.3 DISCUSSION 47
(A) (B)
FIGURE 7.2. a) The plot shows the adherence to the sleep recommendationsprovided by the app over time during the app-intervention phase. b) Theplot shows the odd ratios intrinsic and contextual factors on adherence. c)Adherence rates for all the trigger mechanisms ∗p<0.1; ∗∗p<0.05; ∗∗∗p<0.01
significant and positive impact. While not significant, motivation has a mostly positive (higher
than one odds ratio) impact and a wide confidence interval.
7.3 Discussion
In this section, I first discuss general results and their limitations. Then, I also discuss more
specific aspects of the results about their significance outside the study and future research
directions.
• General results: Overall, my exploration of the disjoint personalization of content
and time of treatment through the deployment of SleepU is very promising. Parti-
cipants in the study changed their behavior by significantly improving their sleep
duration and time in bed compared to standard-care and baseline levels. They also
moved from thinking about making a change to taking action towards improving
their sleep. The results also show that receptivity generates the highest adherence to
treatment. Similarly, contextual factors, motivation, and days in the intervention had
an essential effect on adherence to treatment. I speculate that by considering motiva-
tion and contextual factors, it could be possible to maximize adherence to overcome

48 7 STUDY 1:EXPLORATORY TRIAL OF THE SLEEPU APP
barriers typical of health interventions like low levels of motivation through simple
strategies like delivering health recommendations in the morning.
• Adherence and receptivity: When receiving a sleep recommendation through the
receptivity classifier, treatment adherence was 48% higher than at random times
and 114% higher than user-initiated attempts at following a recommendation. It is,
however, important to notice that real-world deployments of mHealth interventions
outside research evaluations would most likely require the use of multiple delivery
mechanisms. Although the receptivity detector produced the highest adherence, it
can only detect receptivity accurately when the participant is interacting with or
near the phone. Another important factor to consider when using receptivity is the
way people use their phone. Our participants were all tech-savy college students. I
expected this strategy to work well for them; however, populations like the elderly
may not benefit as much from this approach to receptivity detection.
In comparison to previous work on receptivity, [86] SleepU achieved a higher ad-
herence rate despite using similar approaches in terms of classifier and sensor streams
used. The key difference is that for SleepU, I used all mobile-phone interactions
from all participants to build a single population-personalized receptivity classifier
while Morrison et al.[86] built a detector separately for each participant. I believe
the data I collected and combined resulted in more significant variance, increasing
the generalization power of the classifier drastically. While in Morrison et al.work,
relying exclusively on individual data may not provide good enough performance
for short-term deployments. This counter-intuitive result where a population-based
classifier is more effective than participant-based detectors was also observed in work
by Hong et al.[51] for activity recognition. It is important to notice that increased
adherence has important and well-documented downstream effects like increased
patient autonomy, self-efficacy, and health outcomes [55], which further highlight
delivering health recommendations during receptive times.
• Context: Our exploratory work highlights the critical role of context and motivation
on adherence. All periods harmed adherence: Participants were most likely not to
follow a sleep recommendation without a reminder for it. However, in comparison

7.3 DISCUSSION 49
to the evening, mornings and afternoons are the best times of the day to remind
participants about putting a recommendation into practice. Although some of the
recommendations chosen for the morning and afternoon may have been easier to
execute for some of our participants, a morning recommendation like "Always keep
the daytime routine" according to experts, is among the hardest recommendations to
follow. Also, a similar result was found by Kunzler et al.[71] in a physical activity
intervention: receptivity was highest between 10 am to 6 pm, and receptivity-related
metrics do translate into adherence to treatment. This dependence on delivery time
has several implications, e.g., participants who are getting started with a sleep inter-
vention (and when motivation may be low), should rely primarily on interventions in
the morning and afternoon. Over time and as motivation and days of intervention
increase, the probability of adherence will increase, making adherence to treatment
in the evening more likely.
• Motivation and days of intervention: Although baseline motivation in the likeli-
hood of adherence to treatment was marginally significant (p < 0.1), it has a positive
and wide effect on adherence, increasing the odds from 1 to up to 10, I expect
significance to increase with a larger population sample, and the general effect on
adherence to narrow only slightly in range. The number of days in the intervention
had a positive and significant effect and shows that the cumulative effect of the
intervention is on par with receiving a recommendation at a random time every day.
This effect shows that participants are making some of the sleep recommendations
parts of their daily habits.
• Self-motivation is not enough for adherence: A striking result from this study
is that even despite our participants’ best intentions, their attempts at following
sleep recommendations (self-initiated) were only successful 34% of the time. In
comparison, through receptivity-triggered recommendations, our participants were
successful 73% of the time, a 114% increase over the self-initiated adherence
rate. I speculate that even when participants pursue behavior change, finding the
right context and state of mind to enact or plan for putting in practice a health
recommendation is difficult. This same result was observed in an intervention to

50 7 STUDY 1:EXPLORATORY TRIAL OF THE SLEEPU APP
increase glaucoma medication adherence[21]. Participants were either reminded
over the phone about taking medication or exposed to a motivational interview aimed
at increasing their motivation. In that study, reminders resulted in a statistically
significant increase in adherence while the motivational interview did not. Moreover,
in a recent review [64] of strategies to increase adherence to medication, it was found
that reminders are clinically practical and the best option with absolute improvements
of 33% .
• Comparison to medical sleep interventions: HCI work in sleep interventions
has not translated into significant sleep health changes. Our work is the first HCI
intervention work to achieve significant behavior change. For this reason, I compared
our results against standard care (control-intervention), and here I review our results
against expected outcomes of sleep hygiene interventions according to medical
research literature. The effect of SleepU on sleep duration and time in bed are well
within expected values [38] for traditional Sleep Hygiene interventions (i.e., not a
mobile health intervention). For comparison, in a sleep intervention personalized
content manually (i.e., without sensing, mobile, machine learning or AI components)
[75] with a comparable population, there was no difference between baseline and
intervention for all participants (n=77). Although in Levenson et al. [75] content
was personalized, and despite having several educational sessions, they had no
component reminding participants to put the sleep recommendations into practice.
Our results comparing standard-care with SleepU show a similar result and hints
towards the same conclusion: personalization of content alone is not enough for
behavior change.
• Clinical significance: The increase in sleep duration from using SleepU, may be
clinically meaningful for a hypertensive population: In a 2013 study [45] with pre-
hypertension patients, it was shown that an increase of 36 minutes in sleep duration
resulted in a significant decrease in blood-pressure over a 6-week period. Further
evaluations of sleep interventions could benefit from measuring other outcomes that
may be affected by improved sleep like learning [119, 138], memory [110, 119],
weight [88], mood [129] and cardiovascular health [136]. Although this clinical

7.4 LIMITATIONS 51
significance result comes from a single study, it would be reasonable to expect that,
given the profound connection of sleep to vital biological processes, changes in sleep
could result in other clinically significant results.
• Independent effects of content and time of treatment: In this study, I followed
the MOST framework to explore promising intervention components. The results
suggest that this disjoint personalization of content and timing work; however, it is
unclear which component has the most effect on the results observed. Evaluating
these marginal effects has important implications for the deployment of mHealth
interventions. In practice, and depending on financial and technological constraints,
some of these components may be unfeasible. For example, to develop a contextual
bandit that runs on the phone, hiring developers that know AI is necessary, and such
talent is in short demand. In addition, deployment of this personalization technology
in devices with low computing power may limit personalization to a single compon-
ent but not both due to computing constraints. Under these scenarios knowing the
marginal effects of different components can help decide which components to use
given their cost-effectiveness. These marginal effects can be estimated by delivering
each intervention component to different groups following a between-subjects design.
Based on the MOST framework, this next step would encompass the optimization
stage of the mHealth intervention.
• Results connection to behavior change models: According to the COM-B model,
the changes observed in behavior and motivation in our pilot-study most likely also
increased over time the capability of our participants and hence their self-efficacy
towards improving their sleep. The changes in motivation and the positive effect of
days-in-intervention point to capability and self-efficacy improvements.
7.4 Limitations
In this work, I explored the personalization of timing and content, intending to find the most
promising ways forward in this domain. Although I only observed significant differences
across phases in the study for sleep duration and total time in bed, it is possible that .our

52 7 STUDY 1:EXPLORATORY TRIAL OF THE SLEEPU APP
choice of sleep tracker may have underestimated measures like sleep efficiency and sleep
onset. In the study I used, the Fitbit Flex2, which has been found to report sleep duration and
time in bed at accuracy levels comparable to actigraphs i.e., Sensewear or Actiwatch) [32]
however, sleep onset, time to wake up, and other measures may be less reliable [32, 46]. In
general, moving forward with this line of work, it is recommended to use wearables capable
of tracking different sleep stages and have shown promising performance [46] in accurately
detecting most sleep measures.
Another limitation of this work is the homogeneity of the sample. All of our participants
were young, healthy, attend the same university and have access to healthcare as mandated by
the university. Although I would expect the results to carry over to similar populations, it is
unclear whether the results will hold against samples with higher variance in age, location,
and socioeconomic status. This is an important limitation of the results because mHealth
interventions are very promising to populations under-served by the health care system. It is
highly encouraged to further investigate this work with those populations.
7.5 Conclusion
AI based personalization of content and time of treatment is still a nascent research direction
in mobile health. In this chapter, I have shown promising results for AI-based personalization.
I demonstrated how this approach results in behavior change with better outcomes than
standard-care provided by a sleep clinician.
There are several advantages of using AI-based personalization in comparison to traditional
computer tailored approaches like scalability, broad access, and privacy.
7.5.1 Scalability
AI based personalization as described in this chapter (e.g., the SleepU app) is scalable since it
does not rely on a central server for AI, data storage or processing. Data is processed upon
arrival locally in the user’s device and AI based estimates and training is also executed locally

7.5 CONCLUSION 53
using a minimum amount of computing resources. Even the wearable’s data although provided
through the cloud is handled by the wearable’s maker for free which allows for seamless
scalability. Another important factor of scalability is its cost-effectiveness. The approach
presented in this thesis does not rely on any external human supervision which means that the
cost of use of the intervention app goes up linearly with the amount of users. In comparison,
health treatments personalized by clinicians usually rely on different levels of supervision
and management that adds up quickly when trying to scale up health treatments. Ideally
however, AI-based personalization is supervised by human health care practitioners. AI, like
any man made system can fail and in some time unpredictable ways. for this reason ideally
AI-based personalization should be combined with a clinician’s supervision and guidance.
Such supervision could be done on a need basis and based on statistics of performance and
hopefully this supervision is minimal and does not increase costs substantially so that AI-
based personalization can still be cost-effective and scalable. Last, one of the only elements
that could make this AI approach cost prohibitive is using a wearable device to track sleep.
However, personalization is still possible without using a wearable for example by asking the
patient to input sleep data by hand which is currently a common practice in sleep therapy.
7.5.2 Broad access
The AI models in SleepU run entirely on the phone and do not require internet access,
making them suitable for broader adoption by users of different socioeconomic statuses.
This personalization approach is accessible: with median mobile phone ownership varying
from 45% for developing economies and 75% for developed economies [122]), mobile
phone interventions like SleepU have the potential to reach most populations in the world
independent of culture, socioeconomic status or constant internet access. Although our
deployment was limited to sleep hygiene, I foresee it producing similar results in other health
interventions where personalization can significantly affect behavior change, motivation, and
adherence.
54 7 STUDY 1:EXPLORATORY TRIAL OF THE SLEEPU APP
7.5.3 Privacy
All the computing necessary to achieve AI-based personalization takes place in the user’s
phone. Due to this, the user is in complete control of her data and inferences resulting from
the AI models never leave the phone making the approach and system presented in this thesis
completely self contained and private. Additional measures like encryption of files stored,
password protected access to the app among others can easily be added to the system without
incurring in drastic or costly changes.
CHAPTER 8
Adherence to treatment prediction
Adherence to treatment is defined as a patient’s compliance with health professionals’ recom-
mendations [28]. Despite its importance, non-adherence is widespread, averaging 25% across
different medical treatments. Non-adherence results in negative outcomes like therapeutic
non-response [50], decreased long and short-term benefits [141], and in substance use rehabil-
itation, it can result in relapse [141]. An approach to decrease non-adherence is to predict
overall adherence to identify high-risk non-adherent patients and then modify the intervention.
Intervention modifications vary: incentives, reminders, simplified regimes, among others
[127].
In other words, adherence prediction can be used to personalize an mHealth intervention.
Most work in adherence prediction has focused on overall or weekly adherence, with only a
few works looking at daily adherence, and no work in the literature has reported results on
intraday adherence prediction. Intraday adherence prediction is important because it could
help interventions that have multiple treatments a day (e.g., one health condition with multiple
treatments or multiple health conditions with multiple treatments). In such cases, intraday
adherence could help boost times of day when following treatment may be difficult for the
patient. Such boosts could be in the form of incentives (e.g., monetary), changes in the
intervention mechanism (i.e., call to the patient, visit from a nurse), among others. In this
chapter, I present multiple intraday adherence prediction classifiers that build on the findings
from chapter 7. The adherence classifiers have promising performance with up to 0.7026
balanced accuracy and 0.7548 f1_score. The results from this exploration warrant real-world
deployments; also pave a way forward to use adherence to treatment prediction as another
dimension for personalization of treatment.
55

56 8 ADHERENCE TO TREATMENT PREDICTION
8.1 Related work
Adherence prediction mostly consists of estimating a classification model that uses different
sets of features and looks at different time lengths for the prediction. There are three different
time lengths reported for adherence prediction: Overall, weekly, and daily. Also, researchers
have used a wide range of features which are summarized and described in this thesis. In
this section, I first review the results of the different time spans used for adherence prediction
(e.g., overall, weekly and monthly). Then, I present a feature categorization created in this
thesis to understand better the different features used for adherence to treatment prediction.
The intervention domain (sleep, physical activity, cardiovascular health, among others) is
ignored, and instead, the focus is on generalizable aspects of each work.
8.1.1 Time-length
Different time lengths have been used in related work with results within the same range
in classifier performance. The most prevalent time-length is overall adherence prediction,
followed by weekly and only a few works explored daily adherence prediction.
8.1.1.1 Overall adherence prediction
The main goal of overall adherence prediction [116, 67, 130, 70, 74, 61] is to predict whether
the patient is going to comply with treatment, and usually, this prediction is made before
starting the intervention. A way to predict adherence is by making it into a regression problem
where the goal is to estimate the average compliance rate. A second approach is to treat
adherence prediction as a classification problem where adherence is defined as compliance
of at least some defined threshold. As an example, the threshold could be set to 80%, and a
patient adhering to 75% of treatment is then labeled as overall non-adherent.
Overall adherence prediction classifiers and regressors rely on data that is available before
the beginning of the intervention, like demographics, socioeconomic status, health state and

8.1 RELATED WORK 57
Paper Type Method Evaluation Accuracy Precision Recall AUC Featureselection
Son 2010 [116] Overall SVM LOOCV 0.77 Bruteforce
Koesmahargyo 2020 [67] Overall remainingadherence basedon first week
XGBoost 5 folds leaveone group outvalidation
0.722 0.76 0.74 0.8 None
Koesmahargyo 2020 [67] Overall remainingadherence basedon first two week
XGBoost 5 folds leaveone group outvalidation
0.7666 0.78 0.78 0.83 None
Lee 2013 [74] Overall SVM, LR Testing wasdone ontraining set
SVM=0.973,LR=0.711
None
Wallert 2018 [130] Overall randomforest
Random cross-validation
0.64 None
Kumamaru 2018 [70] Overall adherenceto statins
LR andPoissonmodel
c-statistic=0.695
Lasso
Killian 2019 [61] Interventionoutcome: cured-complete vs died,lost, failure
RF, LSTM,linearregression
Random crossvalidation
DL =0.743,RF =0.722
TABLE 8.1. Articles on overall adherence prediction. SVM = Support vectormachine, LR = Logistic regression, RF = Random forest, LSTM = Long shortterm memory
knowledge, health condition and knowledge, the initial frequency of treatment, and possible
side effects. A summary of the articles found is shown in table 8.1.
Accuracy varies from 0.64 to 0.77, and although Lee et al. [74] reports 0.97 accuracy this
value is likely from an overfitting model since it was trained and tested on the same dataset.
AUC scores, equivalent to c-statistic values, vary from 0.695 to 0.83. Many different machine
learning methods were used with very similar performance.
8.1.1.2 Weekly and daily adherence
Although overall adherence prediction is helpful, it relies on many population-based assump-
tions and ignores all of the day-to-day variability in patients’ lives. In addition, adherence
can change drastically during treatment due to factors like unexpected side effects, change in
preferences, changes in routine [101] among others. To overcome these challenges, research-
ers have investigated methods for the prediction of daily and weekly adherence to treatment
[141, 27, 101, 67, 11, 61]. The most typical pipeline uses similar features to those used in
the overall adherence prediction approach plus features that aggregate previous adherence,

58 8 ADHERENCE TO TREATMENT PREDICTION
Paper Type Method Evaluation Accuracy Precision Recall AUC Featureselection
Zhou 2019 [141] Weekly SVM, LR First weekstraining, lastweeks testing
0.85 0.52 0.86 0.9 (LR),0.88(SVM)
None
Dermody 2018 [27] Daily Multilevelstructuralequationmodeling
Model fit None
Platt 2010 [101] Daily LR withgeneralizedestimatingequations
Model fit:R2 = 0.319
0.66c-stat
None
Koesmahargyo 2020 [67] Weekly XGBoost 5 folds leaveone group outvalidation
0.813 0.82 0.82 0.87 None
Koesmahargyo 2020 [67] Daily XGBoost 5 folds leaveone group outvalidation
0.81 0.82 0.84 0.87 None
Blumenthal 2015 [11] Daily LR Separate train-ing and valida-tion sets
0.702 None
Killian 2019 [61] Weekly RF, LSTM,linearregression
Random crossvalidation
LSTM= 0.775,RF =0.724
None
TABLE 8.2. Summary of daily and weekly adherence prediction related work.SVM = Support vector machine, LR = Logistic regression, RF = Randomforest, LSTM = Long short term memory
previous activity, previous side effects, and other related data for a period of time (e.g., a
week, a month, baseline), and then predict for the next time period (e.g., day, week, month).
A summary of the articles performing weekly or daily adherence prediction is shown in table
8.2.
Accuracy values range from 0.81 to 0.85, and AUC scores from 0.66 to 0.9, which is an
improvement of over 10% for the best accuracy and 8% for the best AUC compared to the
overall adherence prediction approach.
8.1.2 Features
Previous work uses different measures captured through health questionnaires, self-reports,
sensor measurements, and app interactions. The only common feature is a measure of previous
adherence. In this section, I created a categorization of the different features used in related

8.1 RELATED WORK 59
work to understand which aspects of the patient’s health and the problem are being covered. I
also created new categories that cover other aspects of the participants’ everyday lives and
hopefully can increase the predictive power of the adherence prediction model. Following are
the different feature categories created:
(1) Adherence [141, 27, 101, 116, 67, 74, 130, 11, 70, 61]: This set of features usually
capture whether the participant has complied with treatment in the past. This
measure assumes that the participant has experienced the intervention during some
baseline period and, in some cases, uses adherence from similar interventions as a
proxy. These features also may be an average of previous days, an average from
the previous week, or baseline values. These features can also be combined with
time features, such as previous adherence, previous month adherence, and previous
morning adherence.
(2) Participant intrinsic characteristics [27, 101, 116, 67, 130, 11, 70, 61]: These features
include demographics (age, gender, among others) and socioeconomic-status (spouse,
healthcare insurance type, salary, education level). The main motivation for including
these features is to capture risk factors for different segments of the population
[33, 82, 133, 132].
(3) Intervention [141, 101, 67, 74, 11, 70, 61]: These features capture specifics of the
intervention like the amount of time a participant or patient had to wait to get the
intervention, experience with the intervention, self-efficacy, types of treatments,
knowledge about the health intervention, and rewards received, among others.
(4) Health [27, 101, 116, 67, 74, 130, 11, 70]: This set of features capture several
aspects of the participants’ health like cognitive function, side effects related to the
intervention, cravings during substance use interventions, perceived health status,
general health assessments, and comorbidities. These features help to identify
both intentional and unintentional non-adherence. Unintentional non-adherence,
for example, could be due to forgetfulness, and it is captured through cognitive
function tests. Intentional non-adherence could be due to strong side effects or not
recognizing a health issue, and it is captured through perceived health questionnaires.

60 8 ADHERENCE TO TREATMENT PREDICTION
(5) Activity Types and amounts of activity [51, 81, 77, 72, 36, 17]: These features
are critical as they capture the overall health of the elderly and other populations.
Examples of these features are amount of steps in a single day, type of activity
(e.g., walking, running, on-vehicle), physical intensity level (e.g., low, moderate or
vigorous), among many others.
(6) Phone use [41, 34, 39, 126, 140, 125]: The way a user interacts with her phone has
been found to correlate with many different health aspects like cognitive ability [41],
stress [34], anxiety [39], mental fatigue [126], depression [140] and schizophrenia
symptoms [125]. Including features that capture participant’s phone use may then
be helpful to passively sense health rhythms and mental state, which could affect
treatment adherence.
8.2 Intraday adherence prediction
In this section, I introduce the data, preprocessing, and classifier used for predicting intraday
adherence to treatment (IAT). Following the findings from chapter 7 the IAT classifier uses
some of the features found. It was also explored other features that characterize different
aspects of the participant’s interaction with the phone and daily activity routines.
8.2.1 Data collection
The data used to train the IAT classifier was collected during study 1 presented in chapter 7.
Demographics were collected during the four weeks of the baseline phase. Adherence-related
data was collected during the four weeks app-intervention phase explained in chapter 7.
Adherence data comes from the answers to the question: Did you follow the recommendation
... that I gave you yesterday?. Out of the 30 participants who finished the study, I only had 19
participants who completed at least a week of sleep diary questionnaires and at least a week
of Fitbit data. The final data set has an average of 20 days of data per participant and 1158
observations.
8.2 INTRADAY ADHERENCE PREDICTION 61
8.2.2 Features
A total of 40 different features spanning all of the categories presented above was available to
build the classifier. The complete list of features is presented in table ??. Although it is not a
high number of features, noisy and less informative features can affect the accuracy and other
metrics, making it necessary to use feature selection. Feature selection was performed using
L1 regularization, which makes zero the coefficients of features with low predictive power.
Table 8.3 shows the different classifiers with their respective performance. The final set of
features used in this work are:
(1) number of recommendations followed two days ago
(2) evening
(3) baseline time to fall asleep
(4) short
(5) baseline time after wake-up
(6) previous day activities-steps
(7) long
(8) number of recommendation followed the previous day
(9) previous day heavy cognitive activity before bedtime
8.2.3 Machine Learning Pipeline
Several classifiers were tested out; however, the best results were achieved using a multi-layer
perceptron as shown in table 8.3. Besides the preprocessing involved for some of the features,
the only other preprocessing done was to scale the data using a min-max scaler and using
SMOTE to oversample and make the training data set balanced.
8.2.4 Evaluation and results
To evaluate the generalization performance of the classifier, I used group k-fold validation,
which splits the data into k groups, each containing data from different participants. Training

62 8 ADHERENCE TO TREATMENT PREDICTION
Details Avg f1 Avg acc Avg balc
DummyUniform0.5629(0.029)
0.5124(0.0867)
∼0.5000
DummyMajority0.7675(0.086)
0.6301(0.1050)
0.5000
MultiLayer Perceptron 0.7548(0.0743)
0.7026(0.0785)
Adaboost without SMOTEParameters: ’n_estimators’: 7,
’max_depth’: 3, ’learning_rate’: 0.01
0.7659(0.0769)
0.7156(0.0374)
0.6595(0.0429)
Adaboost without SMOTEParameters: ’n_estimators’: 20,
’max_leaf’: 9, ’learning_rate’: 0.01
0.7932(0.0537)
0.7195(0.0313)
0.6447(0.0393)
Elastic Net with SMOTEParameters: ’l1_ratio’: 0.0001, ’C’: 0.01
0.7207(0.0981)
0.6914(0.0792)
0.6755(0.0790)
TABLE 8.3. Summary of performance of different adherence classifiers in-cluding dummy majority and dummy uniform used as a reference for baselineclassification values. The values reported are the average across the differentfolds, and the () values are the standard deviation across folds.
is done on k-1 groups while testing on group k for k=5. For comparison with previous work, I
present accuracy; however, this is not a good metric for this type of problem since the data
set is imbalanced. Instead, as suggested in recent work [44] I report balanced accuracy and
f1_score. The final set of results and models is shown in table 8.3.
8.3 Discussion
In this preliminary exploration of intra-day adherence to treatment prediction, I found that
it is feasible and produces results within range for state of the art work. The final set of
features found through L1 regularization does not contain any features that capture phone use;
however, all other categories are represented. The absence of phone use features is surprising
given their use in digital phenotyping work; however the granularity (only 20 days of data per
participant) of the data may not be high enough to capture important patterns in the data.
The feature evening follows the pattern of findings from study 1 where knowing that it is the
evening means the likelihood of adherence is low. In comparison, the likelihood of adherence
in the morning and afternoon are similar and higher than in the evening. The features, short
and long, which capture whether the participant is a short or long sleeper, made it to the final

8.4 LIMITATIONS 63
features. This is an interesting finding because these features were also important for the
analysis of participants’ sleep duration, as shown in chapter 7. Due to time constraints, many
other possible machine learning pipelines, features, and feature selection strategies were not
tested, possibly increasing the prediction accuracy of IAT.
8.4 Limitations
The adherence prediction technique presented in this work is likely to generalize to other
domains; however, this method relies heavily on patient’s feedback. For health conditions
where the treatment consists of taking pills, there are solutions available that track that the
patient is following treatment. For other health conditions, and especially for behavioral
health interventions, like the behavioral sleep intervention presented in chapter 7 it is more
challenging to get this automated treatment adherence tracking because the treatment consists
of difficult to track behaviors. For this type of intervention, it is fundamental that patients are
willing to track their behaviors.

CHAPTER 9
Study 2: Deploying an mHealth intervention during the 2020 pandemic
The promising results from the deployment of the SleepU app in study 1 presented in
chapter 7 show that personalization of content and time of treatment results in behavior
change, increased adherence, and higher motivation in comparison to baseline measures and
standard clinical care. However, the study design did not include a comparison against a
non-personalized approach like random selection and timing that does not leverage AI or
receptivity. In other words, it is unclear whether the personalization of time and content
approach used in study 1 produces better outcomes (e.g., behavior change, adherence, motiva-
tion) than a simpler approach. For this second study, the main aim was to compare a simple
approach like random selection and timing of recommendations against personalization of
content and treatment. This study was started a week before lockdowns, and other measures
(e.g., social distancing, minimized social gatherings, avoidance of indoor gatherings) related
to the COVID-19 pandemic in Pennsylvania U.S. in 2020.
9.1 Method
The SleepU app was deployed in a 7-weeks long study with undergraduate and graduate
students from multiple colleges in Pittsburgh, PA. In this study, the SleepU app was deployed
under a different experimental design compared to the one used in 2019. This second study
aimed to obtain marginal effects of personalization of time and content of treatment and its
comparison against random content and timing. In order to compute these marginal effects,
the experimental design shown in figure 9.1 was used. After screening, participants were
randomized to the random-recommendations group or the AI-recommendations group. The64

9.1 METHOD 65
Random recommendations
AI recommendations
Screening Q
Random-time Q Receptivity QRandom-time QReceptivity Q
Random-time Q Receptivity QRandom-time QReceptivity Q
Baseline Q
FIGURE 9.1. Study 2 experimental design. The baseline phase lasted 1 weekand all other phases lasted 3 weeks. The Qs indicate times in the study whenthe participants filled out a battery of questionnaires as explained in section7.1.3.
random group received recommendations selected randomly throughout the entire study.
Participants in the AI-recommendations group received recommendations selected for them
through the same contextual-bandit introduced in chapter 6. After the randomization for
group, the participants were randomized to either start with recommendations delivered at
random or receptive times to counterbalance any possible order effects. For receptivity, the
same approach used in chapter 5 was used. In summary, all participants were exposed to time
personalization and recommendations delivered at random times. Only half of the participants
were exposed to AI-personalization of content, and the other half to recommendations selected
at random. The eligibility requirements for participation were: 1) Participants had to be 18
to 30 years old and with an active undergraduate or graduate student status (only master’s
programs) at any Pittsburgh college. 2) Participants could not have any on-going problematic
substance use (i.e., drugs, alcohol or nicotine) or sleep disorders (i.e., apnea, narcolepsy,
chronic insomnia). This latter exclusion criterion was necessary because participants with
these issues need specialized sleep treatment.
At the end of the study, a COVID-19 questionnaire was filled out by participants. This
questionnaire was aimed to collect data related to how the pandemic affected sleep and several
other aspects of the participants’ everyday life with respect to the use of the SleepU app.
Also, all participants were invited to participate in a final interview where particular themes
identified through the surveys were further explored.

66 9 STUDY 2: DEPLOYING AN MHEALTH INTERVENTION DURING THE 2020 PANDEMIC
9.1.1 Participants
Participants were recruited using flyers, study recruitment websites, and Facebook posts at
university groups at the beginning of January 2020. After screening, 78 participants were
invited to join the study. Of those, 72 participants (32 Female, 39 Male, 1 Undisclosed)
finished the study. The breakdown of participants for each group and condition is shown in
table 9.1. Participants were compensated with 10 dollars (US) for each week of data logged
in the study, and, as an extra incentive, those filling out 80% or more of the sleep diaries
were allowed to keep the Fitbit inspire HR given to them at the beginning of the study. The
participants were not compensated for using the SleepU app’s sleep intervention functionality
(e.g., checking or following sleep recommendations).
9.1.2 Measures
In study 2 were used the same questionnaires used in study 1. After screening, participants
were asked to fill out a set of questionnaires related to sleep health and other related and
proximal outcomes after each phase of the study. The questionnaires included measures of
psycho-social or physiological processes that are thought to mediate health behavior change as
suggested by Klasnja et al. [66]. The questionnaires used were: the Pittsburgh Sleep Quality
Index (PSQI) [14], Sleep Practices and Attitudes [43], Sleep beliefs scale [1], Perceived
stress scale [18], Morningness - Eveningness questionnaire [52], Readiness to change towards
healthy sleep-related behaviors questionnaire(i.e., motivation questionnaire [10]).
Group Condition Number of participantsRandom-recommendations Random-times first 17Random-recommendations Receptivity-first 18
AI-recommendations Random-times first 17AI-recommendations Receptivity-first 20
TABLE 9.1. Summary of participants that finished the study per group andcondition

9.1 METHOD 67
Additionally, participants were asked to fill out a sleep diary every day during the seven-week
duration of the study and answer a yes/no question for each sleep recommendation available
in the intervention. The complete list of questions used was:
(1) At what time did you go to bed last night?,
(2) At what time did you fall asleep?,
(3) At what time did you wake up this morning?,
(4) At what time did you get out of bed this morning?,
(5) How well did you sleep? (1-10=best),
(6) After falling asleep, How many minutes were you awake last night?,
(7) How many naps did you take yesterday?,
(8) How many caffeinated drinks (i.e., coffee, soda, energy drinks) did you have yesterday 6 hours before bedtime?,
(9) Did anything like noise/bed-partner/child/roommate disrupted your sleep?,
(10) Did you engage in cognitively moderate or intense activity (i.e., playing video games, studying, worrying about
school) one hour before going to bed?,
(11) Did you avoid exercising 4 hours before bedtime,
(12) Did you maintain your usual daily activities?,
(13) Did you go to bed at your usual time?,
(14) Did you wake up at your usual time?,
(15) Did you avoid caffeine, nicotine or alcohol 6 hours before bedtime?",
(16) Did you avoid taking naps during the day?,
(17) Did you avoid heavy meals before bedtime?,
(18) Did you go to bed only when you felt sleepy?,
(19) Did you get out of bed after you could not sleep for 20 mins or more?,
(20) Did you use bed for sleep and sex only?,
(21) Did you perform any of these before going to bed: breathing exercise, meditation, mind-fullness?,
(22) Did you take a bath 1-2 hours before bedtime?,
(23) Did you avoid watching the clock before going to bed?,
(24) Did you make the bed environment conducive to sleep (e.g., cold, dark, noise-free)?,
(25) Did you avoid using an electronic device one hour before going to bed?
During the baseline week, participants answered the sleep diary questions directly on the
SleepU app; however, no intervention was provided. After baseline, the app activated or
deactivate the AI or receptivity detection depending on the group and condition assigned to
the participant.
68 9 STUDY 2: DEPLOYING AN MHEALTH INTERVENTION DURING THE 2020 PANDEMIC
All participants were provided with a Fitbit Inspire HR, a wrist-worn wearable with sensors
that measure steps and sleep phases. Sleep duration and efficiency were collected continuously
during the seven weeks of the study. Participants in the study were instructed to wear the
tracker at all times, including while taking a shower and while sleeping, with the exception of
recharging. The device does not collect any data while recharging or at any time when the
user does not wear it.
9.2 Analysis plan
In the following paragraphs are described the research questions and respective statistical
analyses.
• Personalization of content: Is there a difference between providing sleep re-
commendations at random or using AI? To answer this question, a Generalized
Linear Mixed Model (GMM) was estimated with minutes asleep as the dependent
variable, fixed effects for day-of-intervention, and sleeper type (e.g., short/long
sleeper), and a random effect for the participant. The data was not aggregated,
given that GMMs can handle raw data directly. Instead, I controlled for factors
like baseline amount of sleep (Type-of-sleeper[75]), and the number of days in the
intervention [95] following data analyses and conclusions from previous work. A
thorough explanation of why controlling for these factors is necessary is provided in
the appendix section 12.1. Covariates were added sequentially, making sure each
increased the fit of the model to the data.
• Personalization of time of treatment: Is there a difference in adherence to treat-
ment between delivering sleep recommendations at random or receptivity de-
tected times? To answer this question, the data was aggregated into different periods
(i.e., morning, afternoon, evening) for each participant. Then, a Binomial General-
ized Linear Mixed Model (BMM) was used with a random effect for the participant
and fixed effects for day-of-intervention, delivery period, baseline motivation of
the participant, and the type of time of treatment random vs. receptivity. Adding

9.3 RESULTS 69
baseline motivation as a covariate is justified by the COM-B [84] health model
that states how motivation directly influences behavior. COM-B has been used in
many interventions ranging from hearing aid use [6], coaching for Latina moms with
gestational diabetes [47], and sleep hygiene [117]. Finally, covariates were added
sequentially, making sure that each covariate increased the fit of the model.
• Personalization of time of treatment: Was there a change in behavior between
delivering sleep recommendations at random or receptivity detected times? To
answer this question, it was estimated a Generalized Linear Mixed Model (GMM)
with minutes asleep as the dependent variable, fixed effects for day-of-intervention
and sleeper type (e.g., short/long sleeper), treatment (e.g., random/receptivity), and a
random effect for participant.
All p-values are adjusted within hypotheses using Benjamini-Hochberg to correct for type
I error as recommended in [9] and following [83]. I used R 3.6.3, and the lme4 [7] and
ggeffects [80] packages. Exploratory data analysis and hypothesis testing were conducted in
Jupyter notebooks.
9.3 Results
9.3.1 Personalization of content
The AI-based personalization of content effect on behavior change (i.e., minutes awake) was
not statistically different from providing recommendations selected uniformly at random as
shown in table 9.2. Evaluating other sleep-related measures was not warranted due to no
change in minutes asleep. It is worth noticing that the AI group slept 5.5 minutes more on
average than the random group. Similarly, the AI-based personalization of content effect
on adherence to treatment was not statistically different from providing recommendations
selected uniformly at random as shown in table 9.2. Although AI-based personalization
did not result in a significantly higher adherence, it was 15% higher than recommendations
selected at random.
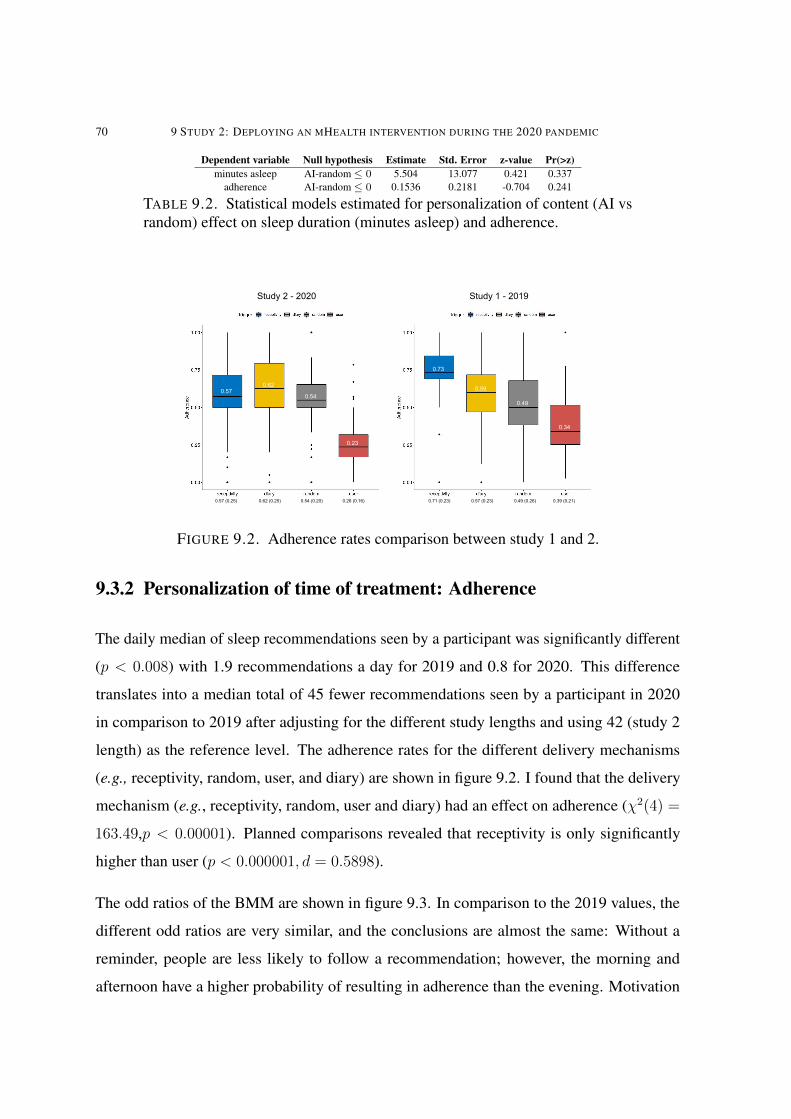
70 9 STUDY 2: DEPLOYING AN MHEALTH INTERVENTION DURING THE 2020 PANDEMIC
Dependent variable Null hypothesis Estimate Std. Error z-value Pr(>z)minutes asleep AI-random ≤ 0 5.504 13.077 0.421 0.337
adherence AI-random ≤ 0 0.1536 0.2181 -0.704 0.241
TABLE 9.2. Statistical models estimated for personalization of content (AI vsrandom) effect on sleep duration (minutes asleep) and adherence.
Study 2 - 2020 Study 1 - 2019
0.570.54
0.23
0.62
0.73
0.59
0.49
0.34
0.57 (0.25) 0.62 (0.25) 0.54 (0.20) 0.26 (0.16) 0.71 (0.23) 0.57 (0.23) 0.49 (0.26) 0.39 (0.21)
FIGURE 9.2. Adherence rates comparison between study 1 and 2.
9.3.2 Personalization of time of treatment: Adherence
The daily median of sleep recommendations seen by a participant was significantly different
(p < 0.008) with 1.9 recommendations a day for 2019 and 0.8 for 2020. This difference
translates into a median total of 45 fewer recommendations seen by a participant in 2020
in comparison to 2019 after adjusting for the different study lengths and using 42 (study 2
length) as the reference level. The adherence rates for the different delivery mechanisms
(e.g., receptivity, random, user, and diary) are shown in figure 9.2. I found that the delivery
mechanism (e.g., receptivity, random, user and diary) had an effect on adherence (χ2(4) =
163.49,p < 0.00001). Planned comparisons revealed that receptivity is only significantly
higher than user (p < 0.000001, d = 0.5898).
The odd ratios of the BMM are shown in figure 9.3. In comparison to the 2019 values, the
different odd ratios are very similar, and the conclusions are almost the same: Without a
reminder, people are less likely to follow a recommendation; however, the morning and
afternoon have a higher probability of resulting in adherence than the evening. Motivation
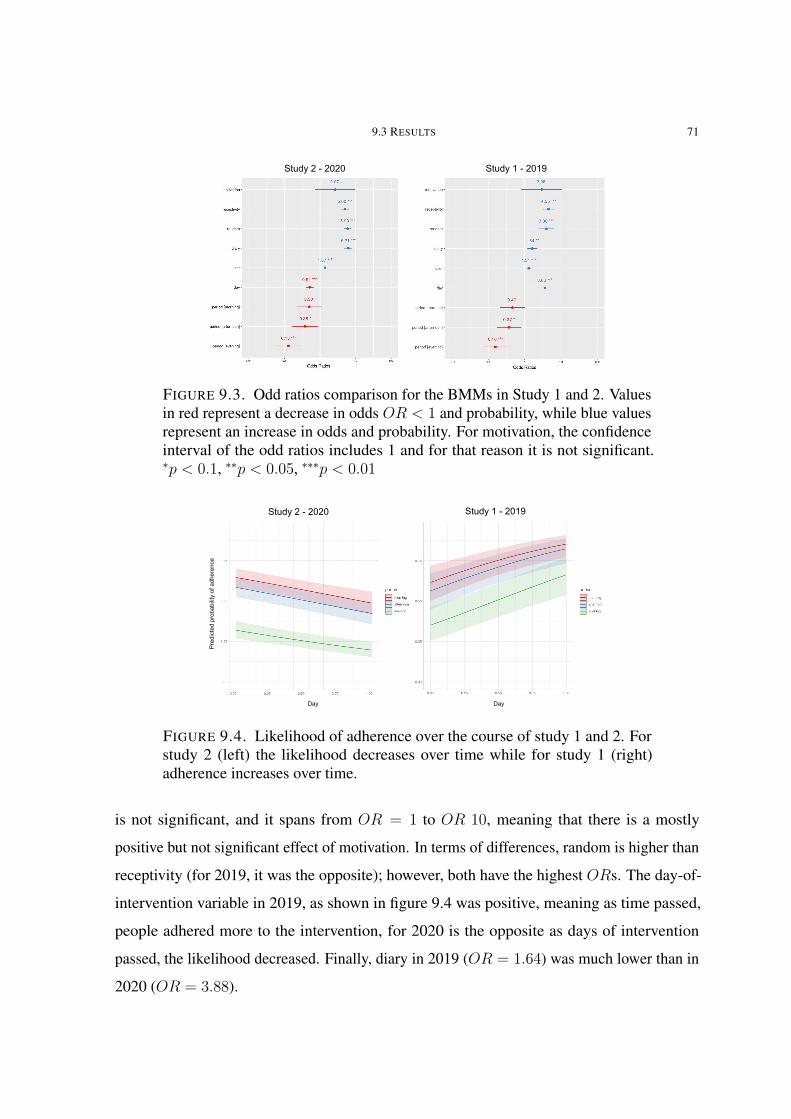
9.3 RESULTS 71
Study 2 - 2020 Study 1 - 2019
FIGURE 9.3. Odd ratios comparison for the BMMs in Study 1 and 2. Valuesin red represent a decrease in odds OR < 1 and probability, while blue valuesrepresent an increase in odds and probability. For motivation, the confidenceinterval of the odd ratios includes 1 and for that reason it is not significant.∗p < 0.1, ∗∗p < 0.05, ∗∗∗p < 0.01
Study 1 - 2019Study 2 - 2020
Pre
dict
ed p
roba
bilit
y of
adh
eren
ce
Day
Study 2 - 2020
Day
FIGURE 9.4. Likelihood of adherence over the course of study 1 and 2. Forstudy 2 (left) the likelihood decreases over time while for study 1 (right)adherence increases over time.
is not significant, and it spans from OR = 1 to OR 10, meaning that there is a mostly
positive but not significant effect of motivation. In terms of differences, random is higher than
receptivity (for 2019, it was the opposite); however, both have the highest ORs. The day-of-
intervention variable in 2019, as shown in figure 9.4 was positive, meaning as time passed,
people adhered more to the intervention, for 2020 is the opposite as days of intervention
passed, the likelihood decreased. Finally, diary in 2019 (OR = 1.64) was much lower than in
2020 (OR = 3.88).

72 9 STUDY 2: DEPLOYING AN MHEALTH INTERVENTION DURING THE 2020 PANDEMIC
Dependent variable Null hypothesis Estimate Std. Error Z value Pr (<z)minutes asleep random-receptivity>=0 -4.539 4.281 -1.06 0.145
baseline-receptivity>=0 -15.328 7.648 -2.004 0.045∗
time in bed random-receptivity>=0 -5.717 4.931 1.160 0.1231baseline-receptivity>=0 -16.8 8.807 -1.909 0.0563
minutes awake random-receptivity>=0 -1.41 0.80 -1.71 0.039∗
baseline-receptivity>=0 -5.4788 1.4327 -3.824 0.000131∗∗∗
efficiency random-receptivity>=0 0.07 0.1596 0.496 0.6899baseline-receptivity>=0 -0.88 0.28522 3.089 0.00201∗∗
minutes to fall asleep random-receptivity>=0 -0.04 0.05 -0.791 0.927baseline-receptivity>=0 -0.13 0.09 -1.452 0.927
minutes after wakeup random-receptivity>=0 0.04 0.07 0.552 0.45baseline-receptivity>=0 0.01594 0.12958 0.123 0.45
TABLE 9.3. Statistical models estimated for personalization of time of treat-ment (receptivity) vs random. All models used the same fixed effects(e.g., treatment (receptivity/random), day-of-intervention, sleeper-type andparticipant as random effect). All p-values adjusted using Benjamini-Hochbergmethod. P-values: p < 0.0001(∗∗∗), p < 0.001(∗∗), p < 0.01(∗), p < 0.05(.)
9.3.3 Personalization of time of treatment: Behavior change
Several GMMs were computed using different dependent variables related to sleep (e.g., minutes
asleep, time in bed, minutes awake, efficiency, minutes to fall asleep, and minutes after wake
up) but with the same fixed and random effects. Dunnett’s tests were then used to measure
the statistical difference between the different groups (e.g., baseline, random, receptivity)
and sleep measures as shown in table 9.3. Minutes asleep for receptivity were higher than
random (4.5 minutes) and significantly higher for receptivity (15.3 more minutes) compared
to baseline. Minutes awake were significantly higher for receptivity (1.41 more minutes) than
random and (5.47 minutes more) compared to baseline. Efficiency was higher for receptivity
(0.88 higher) in comparison to baseline. All other results were not statistically different across
groups and treatments.
9.4 Discussion
The results, in general, show that there was a null effect on sleep measures when comparing AI-
based personalization and random. Similarly, there was no difference between personalization
of time of treatment using receptivity vs. random. Despite the null results, there are a couple
of good and interesting outcomes:
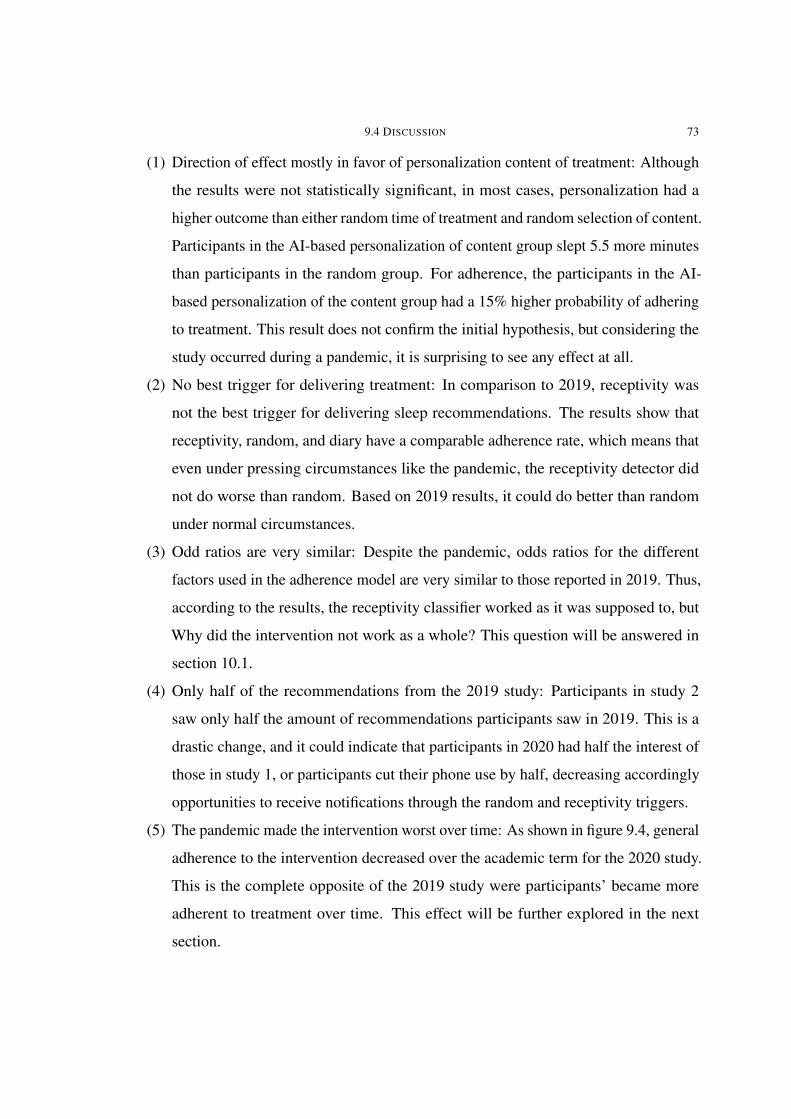
9.4 DISCUSSION 73
(1) Direction of effect mostly in favor of personalization content of treatment: Although
the results were not statistically significant, in most cases, personalization had a
higher outcome than either random time of treatment and random selection of content.
Participants in the AI-based personalization of content group slept 5.5 more minutes
than participants in the random group. For adherence, the participants in the AI-
based personalization of the content group had a 15% higher probability of adhering
to treatment. This result does not confirm the initial hypothesis, but considering the
study occurred during a pandemic, it is surprising to see any effect at all.
(2) No best trigger for delivering treatment: In comparison to 2019, receptivity was
not the best trigger for delivering sleep recommendations. The results show that
receptivity, random, and diary have a comparable adherence rate, which means that
even under pressing circumstances like the pandemic, the receptivity detector did
not do worse than random. Based on 2019 results, it could do better than random
under normal circumstances.
(3) Odd ratios are very similar: Despite the pandemic, odds ratios for the different
factors used in the adherence model are very similar to those reported in 2019. Thus,
according to the results, the receptivity classifier worked as it was supposed to, but
Why did the intervention not work as a whole? This question will be answered in
section 10.1.
(4) Only half of the recommendations from the 2019 study: Participants in study 2
saw only half the amount of recommendations participants saw in 2019. This is a
drastic change, and it could indicate that participants in 2020 had half the interest of
those in study 1, or participants cut their phone use by half, decreasing accordingly
opportunities to receive notifications through the random and receptivity triggers.
(5) The pandemic made the intervention worst over time: As shown in figure 9.4, general
adherence to the intervention decreased over the academic term for the 2020 study.
This is the complete opposite of the 2019 study were participants’ became more
adherent to treatment over time. This effect will be further explored in the next
section.

74 9 STUDY 2: DEPLOYING AN MHEALTH INTERVENTION DURING THE 2020 PANDEMIC
9.5 Conclusion
The pandemic decreased the intervention effects and may be the main reason behind the
null results of the intervention. Particularly, the factor day-of-intervention in the adherence
to treatment BMM models reveals a profound change in the way participants went through
the study: In 2019, participants’ adherence to treatment increased over time for 2020, the
adherence decreased over time. However, all other factors of the adherence BMM model
remained within the range of those of the 2019 study. These results show that when the
receptivity and random mechanisms succeeded at delivering a sleep recommendation, their
effect remained almost the same; however, they were triggered less than half the time
compared to study 1, which would explain the lack of behavior change. In the next chapter, I
explore the differences between the 2019 and 2020 studies with the goal of broadening the
understanding of pandemic like events effect on mHealth interventions.

CHAPTER 10
Understanding the effect of the pandemic in study 2
The findings from chapter 9 show that the pandemic had a profound effect on the intervention.
However, the underlying system, user and user-system interaction effects of the pandemic
are unclear. In this chapter, through comparisons between study 1 (2019) and study (2020),
quantitative and qualitative analyses I created the disruptive-event framework to further
understand and generalize the factors and downstream effects of the pandemic in an mHealth
intervention. For the quantitative analysis I investigated the behavioral (e.g., sleep habits,
before bed habits, time in bed and variance) and system level differences (i.e., sensor streams,
phone use and activities detected) between study 1 and 2. In the qualitative analysis I use
surveys and interviews to understand the participants thoughts and feelings related to the
sleep intervention during the pandemic. After these two analyses, I summarize all the findings
into the disruptive-events framework to generalize these conclusions to other pandemic-like
events. I close this chapter by exploring the application of the disruptive-events framework
across pandemic-like events that occur much more often across the general population.
10.1 Quantitative analysis: Comparison of study 1 (2019)
and study (2)
The results from section 9.3 show that there was no behavior change, and the receptivity
and random triggering mechanisms in 2019 and 2020 worked very similarly. However, in
2020, participants saw half the amount of recommendations seen in 2019. This decrease in
recommendation checking could explain the reason for no behavior change; however, it still
hides the underlying reasons and conditions that forced that decrease. There are two possible75
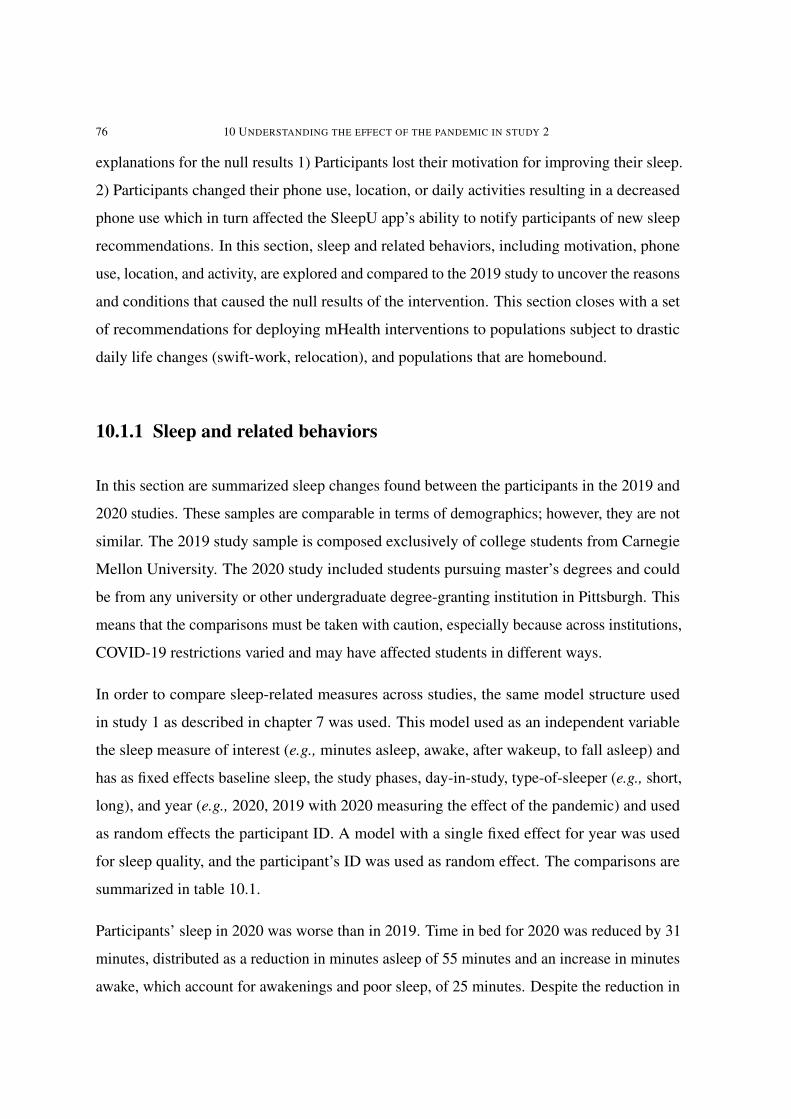
76 10 UNDERSTANDING THE EFFECT OF THE PANDEMIC IN STUDY 2
explanations for the null results 1) Participants lost their motivation for improving their sleep.
2) Participants changed their phone use, location, or daily activities resulting in a decreased
phone use which in turn affected the SleepU app’s ability to notify participants of new sleep
recommendations. In this section, sleep and related behaviors, including motivation, phone
use, location, and activity, are explored and compared to the 2019 study to uncover the reasons
and conditions that caused the null results of the intervention. This section closes with a set
of recommendations for deploying mHealth interventions to populations subject to drastic
daily life changes (swift-work, relocation), and populations that are homebound.
10.1.1 Sleep and related behaviors
In this section are summarized sleep changes found between the participants in the 2019 and
2020 studies. These samples are comparable in terms of demographics; however, they are not
similar. The 2019 study sample is composed exclusively of college students from Carnegie
Mellon University. The 2020 study included students pursuing master’s degrees and could
be from any university or other undergraduate degree-granting institution in Pittsburgh. This
means that the comparisons must be taken with caution, especially because across institutions,
COVID-19 restrictions varied and may have affected students in different ways.
In order to compare sleep-related measures across studies, the same model structure used
in study 1 as described in chapter 7 was used. This model used as an independent variable
the sleep measure of interest (e.g., minutes asleep, awake, after wakeup, to fall asleep) and
has as fixed effects baseline sleep, the study phases, day-in-study, type-of-sleeper (e.g., short,
long), and year (e.g., 2020, 2019 with 2020 measuring the effect of the pandemic) and used
as random effects the participant ID. A model with a single fixed effect for year was used
for sleep quality, and the participant’s ID was used as random effect. The comparisons are
summarized in table 10.1.
Participants’ sleep in 2020 was worse than in 2019. Time in bed for 2020 was reduced by 31
minutes, distributed as a reduction in minutes asleep of 55 minutes and an increase in minutes
awake, which account for awakenings and poor sleep, of 25 minutes. Despite the reduction in

10.1 QUANTITATIVE ANALYSIS: COMPARISON OF STUDY 1 (2019) AND STUDY (2) 77
Measure Estimate (2020-2019) CI (2.5%) CI (97.5%)Time in bed -31.11 * -58 -3.9
Minutes asleep -55.62 *** -80.4 -30.7Minutes awake 25.0 *** 20.17 29.9
Minutes after wakeup 0.2 -0.04 0.4Minutes to fall asleep -0.13 -0.34 0.06
Efficiency -0.3% -1.3% 0.7%Sleep quality (subjective) 0.63 *** 029 0.97
TABLE 10.1. Difference in sleep measures of the 2020 and 2019 studies.p ≤ 0.00005(***), p ≤ 0.01(*)
2020 study 2019 study
Smoothed (n=7 days) sleep duration standard deviationSmoothed (n=7 days) sleep duration standard deviation
FIGURE 10.1. Smoothed standard deviation (rolling window, n=7 days) ofsleep duration during the 2019 and 2020 studies. Higher values mean highervariance across individuals
sleep, participants in 2020 reported a sleep quality of 6.86, which is higher in comparison to
2019 (6.23). The change in sleep quality, although significant it not very meaningful given
that sleep quality was measured on a 1-10 scale. Participants sleep in 2020 became more
stable in comparison to 2019 as shown in figure 10.1. The standard deviation figure 10.1
shows an almost periodic signal that cycles between maximum and minimum values about
every seven days for 2019. This periodicity was not visible in 2020.
Overall, the average standard deviation of minutes asleep in 2020 (108.6) was 19.1 higher
(p < 0.05) than in 2019 (89.271). This pattern of higher weekly cognitive activity during
the weekend is seen when comparing cognitive activity before bedtime both at a daily level
10.2 and at a weekly level 10.3. At the daily level, the percent of people per day of year
responding that they were performing some cognitive activity before bedtime fluctuates in a
weekly pattern for 2019, as shown in figure 10.2. This same pattern is much difficult to see
for 2020.
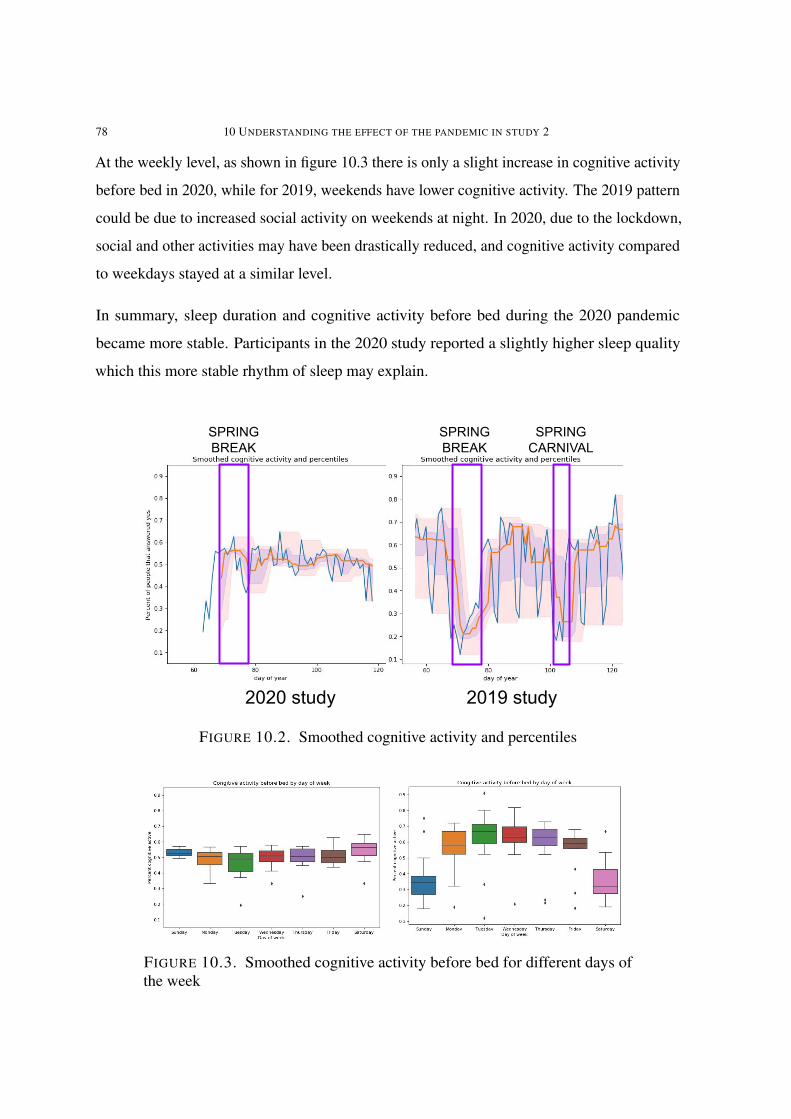
78 10 UNDERSTANDING THE EFFECT OF THE PANDEMIC IN STUDY 2
At the weekly level, as shown in figure 10.3 there is only a slight increase in cognitive activity
before bed in 2020, while for 2019, weekends have lower cognitive activity. The 2019 pattern
could be due to increased social activity on weekends at night. In 2020, due to the lockdown,
social and other activities may have been drastically reduced, and cognitive activity compared
to weekdays stayed at a similar level.
In summary, sleep duration and cognitive activity before bed during the 2020 pandemic
became more stable. Participants in the 2020 study reported a slightly higher sleep quality
which this more stable rhythm of sleep may explain.
2019 study
SPRING BREAK
2020 study
SPRING BREAK
SPRING CARNIVAL
FIGURE 10.2. Smoothed cognitive activity and percentiles
2020 study 2019 studyFIGURE 10.3. Smoothed cognitive activity before bed for different days ofthe week

10.1 QUANTITATIVE ANALYSIS: COMPARISON OF STUDY 1 (2019) AND STUDY (2) 79
Sensor-stream / event daily average counts median 2020 median 2019 difference (2020-2019) p_valuescreen_off (.) 6.60 10.33 -3.74 p=0.02666screen_on (.) 6.84 9.07 -2.23 p=0.04441
clicked_different 1.80 1.12 0.69 p=0.06141interacting_false 10718.41 11729.52 -1011.11 p=0.18871interacting_true 695.21 589.15 106.06 p=0.08822
event_notification_event 288.06 248.18 39.88 p=0.15063event_foreground_event (.) 239.66 128.20 111.46 p=0.01438
foreground_different 16.44 16.33 0.11 p=0.42432ringer_normal (.) 960.46 660.70 299.77 p=0.04586
ringer_vibrate 2049.79 5140.56 -3090.76 p=0.24698ringer_silent (∗) 456.58 6871.41 -6414.82 p=0.00373
lock_true (.) 16.92 21.59 -4.67 p=0.02050connection_mobile (.) 1.87 3.67 -1.80 p=0.01467connection_wifi (∗ ∗ ∗) 1.59 5.93 -4.34 p=0.00000connection_none (∗ ∗ ∗) 0.94 3.67 -2.72 p=0.00002orientation_landscape (∗) 256.00 87.86 168.14 p=0.00991
vehicle 0.040 0.040 0.000 p=0.41844bicycle 0.015 0.017 -0.002 p=0.08040
on-foot (∗ ∗ ∗) 0.050 0.121 -0.070 p=0.00000still (∗ ∗ ∗) 0.720 0.585 0.136 p=0.00000
walking (∗ ∗ ∗) 0.050 0.120 -0.070 p=0.00000running 0.012 0.011 0.000 p=0.21746
locations (∗ ∗ ∗) 3.022 7.212 -4.190 p=0.00000entropy (∗ ∗ ∗) 0.480 0.619 -0.138 p=0.00000
TABLE 10.2. Different sensor streams and events comparing several aspectsof smartphone usage in 2020 and 2019. p < 0.0001(∗∗∗), p < 0.001(∗∗), p <0.01(∗), p < 0.05(.)
10.1.2 Phone use, location and activity
After comparing several sensors and event streams collected from participants’ phones in
the 2020 and 2019 studies, I found that the participants in 2020 interacted with their phones
in a significantly different way. A summary of all the different events and sensor streams
evaluated and their comparisons are shown in table??
The number of screen_on , off, and lock_true logs, which are measures of how many times
participants logged in and interacted with their phones, shows that there were fewer ses-
sions in 2020. The number of notifications participants clicked on (i.e., clicked_different,
event_notification_event) was higher for 2020 but only marginally different. While parti-
cipants’ phone screen was on, the number of interactions for 2020 was higher (i.e., inter-
acting_true, screen touches). The phone ringer setting (e.g., lower, normal, silent) shows
that participants, in general, used the normal mode more than silent or vibration. Network

80 10 UNDERSTANDING THE EFFECT OF THE PANDEMIC IN STUDY 2
connection which indicates when the phone connects to a new network (e.g., mobile, none
and wifi), were significantly lower. Phone orientation logs (e.g., orientation_landscape) for
2020 show participants were significantly more often in landscape mode.
There were also some differences in the activity-related events detected by the google activity
recognition API. These values are also reported in table 10.2 as the average of probabilities.
For example, for still, the 0.72 value reported means that, on average, participants were
detected to be still with a 72% probability. Participants vehicle rides detected were not
different in 2020, although bicycle riding was marginally lower for 2019. Participants (or
their phones) were detected still more often, walking less and running about the same in
2020. Last, the number of locations visited in 2020 was significantly lower in 2020. The
variety of locations visited, computed as the entropy of the locations visited per day, was also
significantly lower.
10.1.3 Conclusion
Overall there were significant differences between the 2020 and 2019 studies. In terms
of user behavior, participants in 2020 had worse sleep for most measures evaluated, with
the exception of sleep quality and sleep duration stability. A markedly different pattern of
behavior was found for cognitive activity before bedtime and sleep duration: during 2019,
there is a clear difference between weekends and weekdays. For 2020, cognitive activity
before bed and sleep duration difference between weekends and weekdays is much lower,
making any day of the week similar to any other. For system and user-system interaction I
found that participants opened their phones less, click on the screen more, and responded
to notifications slightly more. Portrait orientation was logged more in 2020, which could
indicate using the phone more often for full-screen apps to watch movies, tv, or playing video
games. Also, it seems like participants may not have carried their phones on them given that
they used less often the silent and vibration ringer mode: If they are away from their phones,
they need the phone to produce sounds to be aware of notifications and others. Activity data
logged also favor some of the above hypotheses. The probability of the activity still is much
higher in 2020, which may not indicate that the participant was still but rather that the phone

10.2 QUALITATIVE ANALYSIS: UNDERSTANDING PARTICIPANTS THOUGHTS AND FEELINGS DURING STUDY 2 81
was. Walking was also lower, and again it could be indicating simply participants not carrying
their phone around. In terms of locations, participants visited much fewer places in 2020. In
summary, all evidence points at changes with the the user, system and user-system interaction.
Sleep and related behaviors, phone use, and activity, which affected the receptivity detector’s
firing rate, which in turn could have resulted in the null intervention results. All these results
are well aligned with lockdown-related mandates that suggested people to remain indoors
(i.e., increased still, decreased walking, decreased network connections) and avoid social
gatherings (decrease in locations visited and walking).
10.2 Qualitative Analysis: Understanding participants
thoughts and feelings during study 2
Participants in the 2020 study answered a short survey where they were asked about their
experience related to their sleep behavior and SleepU app usage during the 2020 lockdown.
Some of the questions used a "strongly agree" to "strongly disagree" scale, while others were
open text. The survey questions were the next:
• Did you experience any of the next symptoms during the study: Dry cough, shortness
of breath, fever, loss of smell, loss of taste?
• How much do you agree with the next statements:
– During the study, my sleep was positively affected by the lockdown
– During the study, my sleep was negatively affected by the lockdown
– During the study, my sleep was about the same as it was before the lockdown
• How do you think the COVID-19 lockdown affected your sleep (e.g., sleep duration,
quality, awakenings) during the weeks you participated in our study?
• How do you think the COVID-19 lockdown affected the way you interacted with the
SleepU app?

82 10 UNDERSTANDING THE EFFECT OF THE PANDEMIC IN STUDY 2
10.2.1 Method
The survey data collected was analyzed in two main ways: Likert-scale questions were
analyzed by estimating counts. Open ended questions were coded, and affinity diagramming
was used to find common themes across the responses.
10.2.2 Results
53 of the 72 participants responded to the survey. Only 3.7% (n=2) of the survey respondents
reported experiencing any COVID-19 symptoms. 54.7% (n=29) of the participants disagreed
(e.g., disagree, strongly disagree) that the lockdown affected their sleep positively, and 13%
(n=7) stated that it did not have any effect (e.g., neutral). 56% (n=30) of the participants stated
that the lockdown affected negatively (e.g., strongly agree, agree) their sleep, and 17% (n=9)
of the participants stated that it did not have any effect. 77.3% (n=41) of the participants stated
that their sleep was not the same (e.g., strongly disagree, disagree) as before the lockdown. In
summary, most of the participants (54% to 56%) stated that the lockdown measures had a
negative or did not have a positive impact on their sleep, and a majority of the participants
(77%) perceived a change in their sleep.
For the question How do you think the COVID-19 lockdown affected your sleep I found four
general themes:
(1) The majority of the participants reported going to bed and waking up later
than before the pandemic: Participants attributed this to a less strict daily schedule
allowed by measures like online classes, quoting one of the responses: “ I didn’t
have to stay with a strict bedtime and wake up time anymore so I didn’t go to bed
and wake up at the same time everyday like I normally would.”.
(2) The majority of the participants reported more irregular sleep schedules com-
pared to before the lockdown: Participants shared that their “sleep became im-
mensely irregular resulting in a perception of lower productivity.

10.2 QUALITATIVE ANALYSIS: UNDERSTANDING PARTICIPANTS THOUGHTS AND FEELINGS DURING STUDY 2 83
(3) Participants reported sleeping more each day: Participants indicated that they
were “getting a lot more sleep than [they] normally would. Usually [they] would get
3-5 hours of sleep, but since the lockdown [they got] 6-8 hours every day.”
(4) Many participants reported their sleep was affected by their anxiety or stress
by the COVID-19 pandemic: Several participants indicated that they were emo-
tionally affected and had a negative effect on their sleep: “being in lockdown has
been an emotional toll, as I literally did not go out for more than a month now ... I
don’t feel as tired as before lockdown, but everything is feeling sluggish” or that
“COVID-19 did make me feel more anxious about my health, study and future, so
during the lockdown I didn’t sleep well, and I woke up early.”
In general, participants reported both positive and negative impact on their sleep, daily
schedules and routines, anxiety and stress among others.
For the question How do you think the COVID-19 lockdown affected interaction with the
SleepU app the next were the patterns found:
(1) My interaction with the SleepU app was not affected by the pandemic: 37%
(n=20) of the participants thought their use of the SleepU app was not affected by
the pandemic. These participants did not elaborate further in their response.
(2) I didn’t follow advice because I was not motivated, found it difficult or ignored
the app: 41%(n=22) of the participants reported not following the recommendations
a majority of the time due to changes mostly in motivation. These changes were
brought out by pandemic related changes like lack of a normal schedule, messy
sleep, higher work, attention devoted to pandemic developments. This may have
resulted in a lower prioritization of sleep and hence a decrease in motivation. As part
of the responses many of these participants stated that they would have followed or
at least tried harder to follow the sleep advice under normal conditions.
(3) The lockdown helped with my sleep: 7.5%(n=3) of the participants stated that
their new found lack of schedule as an opportunity to organize better their day.
Recommendations that in normal times they found difficult to follow like "keep your

84 10 UNDERSTANDING THE EFFECT OF THE PANDEMIC IN STUDY 2
FIGURE 10.4. Motivation levels for the 2020 and 2019 studies. For 2020 theorganization of the phases reflects the chronological order. For 2019 app andsleep phases happened at the same time
daily routine even after bad sleep" or "take a bath before bedtime" were easier to
follow. This was however was a very small set of the participants
10.2.3 Conclusion
Most participants reported that their sleep was affected negatively by the 2020 pandemic.
Participants were exposed to a lack of a regular schedule, flexibility to watch videos instead
of attending lectures and a lack of a commute to class. In addition, a large subset (41%)of the
students found that the pandemic caused stress, anxiety, and an increase in workload, which
in turn decreased their motivation and prioritization of sleep. Another relatively large subset
of the students (37 %) thought their interaction with the SleepU app was not affected by the
pandemic; however, they did not elaborate on the details. This last subset of participants
suggests that they may not have been interested at all in improving their sleep even before the
pandemic. To investigate further, I explored the average total motivation towards improving
sleep at different phases of the study as shown in figure 10.4. The plot shows that the initial
median motivation is 4.4 for 2020, and although it is slightly lower than the 4.6 for 2019, it is
not a meaningful difference. Thus, participants’ initial motivation does not explain the null
results of the intervention.
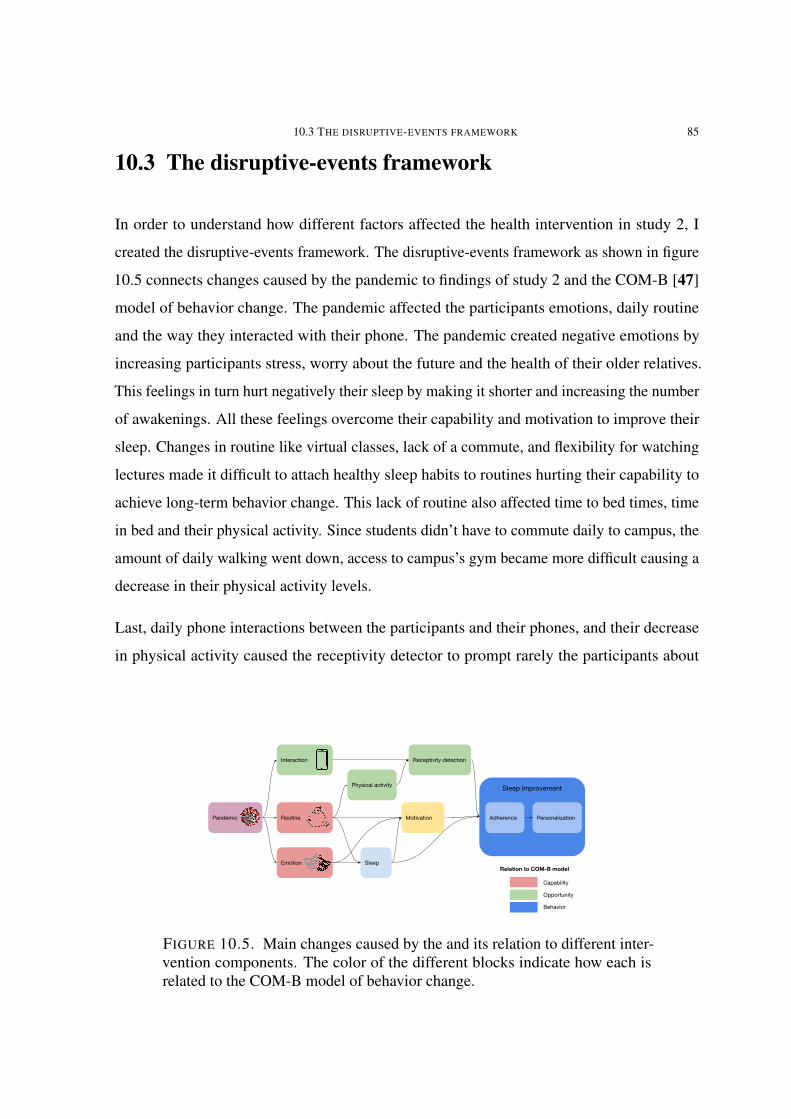
10.3 THE DISRUPTIVE-EVENTS FRAMEWORK 85
10.3 The disruptive-events framework
In order to understand how different factors affected the health intervention in study 2, I
created the disruptive-events framework. The disruptive-events framework as shown in figure
10.5 connects changes caused by the pandemic to findings of study 2 and the COM-B [47]
model of behavior change. The pandemic affected the participants emotions, daily routine
and the way they interacted with their phone. The pandemic created negative emotions by
increasing participants stress, worry about the future and the health of their older relatives.
This feelings in turn hurt negatively their sleep by making it shorter and increasing the number
of awakenings. All these feelings overcome their capability and motivation to improve their
sleep. Changes in routine like virtual classes, lack of a commute, and flexibility for watching
lectures made it difficult to attach healthy sleep habits to routines hurting their capability to
achieve long-term behavior change. This lack of routine also affected time to bed times, time
in bed and their physical activity. Since students didn’t have to commute daily to campus, the
amount of daily walking went down, access to campus’s gym became more difficult causing a
decrease in their physical activity levels.
Last, daily phone interactions between the participants and their phones, and their decrease
in physical activity caused the receptivity detector to prompt rarely the participants about
FIGURE 10.5. Main changes caused by the and its relation to different inter-vention components. The color of the different blocks indicate how each isrelated to the COM-B model of behavior change.

86 10 UNDERSTANDING THE EFFECT OF THE PANDEMIC IN STUDY 2
sleep recommendations. This decrease in prompts in turn reduced the opportunity window to
achieve behavior change.
The pandemic affected the participants capability, motivation and opportunity to improve
their sleep resulting in low adherence to the intervention. Low adherence as a result produced
very few data points for the AI-based personalization approach to modify the intervention
which ultimately led to the null interventions results.
10.4 Implications for pandemic-like events
The 2019 pandemic is an unprecedented event in its global reach, however at the individual
level some aspects of it can be similar to typical life events like relocating to a new city, being
or becoming homebound or doing shift-work. This implies that some of the results obtained
during the 2020 study are likely to generalize. In this section, I first explore possible solutions
that are centered around the three main issues caused by the pandemic and then I explore
three case scenarios and derive ways to achieve personalization on each scenario based on the
findings of this chapter.
10.4.1 Personalizing during pandemic-like events
In figure 10.5 it is shown how three main issues were found to disrupt personalization and
behavior change during study 2. In general, most of the issues caused people to not adhere to
sleep recommendations and this lack of adherence did not allow personalization to occur since
the AI approach relies on people adhering to the sleep recommendations. In the next para-
graphs I summarize the challenges that participants had at following recommendations during
study 2, then I describe possible solutions that could allow to overcome those challenges:
• Interaction: When participants in study 2 changed the way the interacted with their
phones, it rendered useless AI-based mechanisms that reminded them of following
sleep recommendations. To overcome this issue, the health intervention should rely
on more than one device and in more than one communication channel to reach

10.4 IMPLICATIONS FOR PANDEMIC-LIKE EVENTS 87
the participant. For example, in study 2 the intervention depended on interactions
with the participant’s phone and only used notifications as the main communication
channel. To solve this challenge, the intervention by itself could have explored
delivering the sleep recommendation to different devices (laptop, desktop computer,
landline among others) and different communication channels like emails, voice
messages, SMS or even calls. Both device and communication channel could also
become additional personalization dimensions that may be included in an AI-based
health interventions but that are only explored after failure of the main device and
communication channel. This strategy is likely to work well across different case
scenarios.
• Routine:Participants loss of routine during the pandemic led them to not follow a
predetermined schedule since they didn’t need to wake up at an specific time, or
be in a specific place to full fill their academic goals (e.g., delivering homework,
attend lecture, attend labs). Participants mentioned that they could not turn the sleep
recommendations into habit because they could not attach them to a daily routine.
This finding is supported by habit formation theory[137] that states that to form
a habit its needed a time, location, previous behavior or something (i.e., context
cue) that will trigger the habit. During the study participant’s location was mostly
the same, time was no longer a cue for starting or stopping activities and even
lectures could be watched online anytime. Then, it follows that adhering to sleep
recommendations and making them into a habit would be difficult. To overcome this
challenge, namely to be able to personalize in the absence of a routine, the reliance
on any contextual cue should be minimal or none, instead relying on participant-
specified reminders could be the best possible solution and personalization could
be used to fine-tune the time of the reminders. As an example, the participant could
provide time ranges during the day to be reminded about the sleep recommendations.
Then, using a Multi-armed bandit, those time ranges are split into smaller intervals
that the bandit could pick at random initially but as the participant responds positively
to them, the bandit could over time estimate which are the best to provide advice to
the participant. This solution could generalize well not only across pandemic-like

88 10 UNDERSTANDING THE EFFECT OF THE PANDEMIC IN STUDY 2
scenarios but it may be used as an alternative to receptivity detection for non-
pandemic scenarios. Another solution could be to provide reminders when activities
that do not depend on routine occur like waking up, eating or cooking meals, and
taking a shower. With the exception of detecting wake-up, most of these solutions
depend on instrumenting the environment and may be unfeasible.
• Emotion: During the pandemic participants emotion went into different directions
anxiety, stress, depression among others made sleep worse and also decreased the
priority given to the sleep intervention. More generally, an emotion component
separate from the intervention and related to being homebound decreased the priority
of the health intervention. A possible solution to this challenge could be to adapt
the health recommendations to highlight their value as a way to get good health
and as a way to feel better while homebound. For example, for in the SleepU app
the message and illustrations used in the sleep recommendations were designed to
highlight how to perform the recommendations however they do not appeal to the
emotions of the user to make a case for sleep and general well being. As a general
rule, health recommendations should be adapted to the specific homebound event by
connecting the value of the intervention with the participant’s current environment
and state of affairs. In summary, the health intervention should move from disease-
directed to patient-value based care [123]. In the common disease-directed paradigm,
health interventions are evaluated based on health measures of improvement like
decrease blood pressure for people with hypertension or steps in a physical activity
intervention. Under patient-value based care the goal is to improve something the
patient cares about, in the case of a patient with hypertension she could have as a
goal to be able to decrease fatigue levels to be able to participate in physical activities
with family members.
10.5 Discussion: Three pandemic-like case scenarios
Although the covid-19 pandemic is a rare event, there are common life events that share
characteristics with the pandemic. Using the findings in this chapter I now describe how the

10.5 DISCUSSION: THREE PANDEMIC-LIKE CASE SCENARIOS 89
personalization strategies described in the previous subsection can be used during common
life events.
• Being or becoming homebound: 1.9 million adults age 65 or older in the U.S.
are completely or mostly homebound, and another 5.3 million have limitations
that makes it difficult to go out [93]. This does not take into account people who
are temporarily homebound due to health problems or after treatments like major
surgeries. This population is affected by all of the factors identified in section 10.2.3.
The way this population interacts with their phones is different in contrast to younger
populations for example their smartphone use is decreased in stable locations [111].
This finding together with results from study 2 related to smartphone use while
homebound imply that receptivity and context based personalization of time of
treatment may be difficult to achieve. A possible approach to be able to personalize
time of treatment is by relying on other devices like wearables and smart speakers
like amazon’s Alexa who are increasing in popularity among the elderly [59, 62]
and could help increase adherence. Similarly, using more traditional channels of
communication (e.g., SMS, phone calls) could work well with this population.
Although this population is at home, they likely follow a routine unlike the
participants of study 2. However, detecting routines at home without significant
contextual changes is difficult to achieve without instrumenting the home. In this case
the solution to overcome this challenge would be to rely on the patient’s provided
times for reminding them of treatment plus further time personalization using bandits.
Finally for the challenge of emotion, the transition to patient value-based care should
make the health intervention more important to the patient resulting in an increased
adherence to treatment despite being homebound. As an example, among the elderly
homebound population some of them are cancer survivors. This population is in great
need of physical activity to decrease their sedentary behaviors and improve their
cardiovascular health which is usually treated with physical activity interventions.
While homebound, these population may experience frustration and depresion and
this could greatly interfere with physical interventions. Using a patient value-based
approach, the physical activity intervention could for example highlight to the patient

90 10 UNDERSTANDING THE EFFECT OF THE PANDEMIC IN STUDY 2
how her fatigue levels have been improving and how she could now engage in leisure
activities and sustaining family relationships by joining on activities like being able
to play and lift their grandchildren [87].
• Relocating to a new city: Relocating to a new city or country usually involves a
complete re-evaluation and adjustment of activities and routines. Relocation then,
at least for some amount of time, shares the lack of routine with the framework
presented in figure 10.5. Unlike becoming homebound, relocation’s lack of routine
is only temporal and routines are established quickly overtime as the participants
adjust to their new lives. Under such circumstances, AI-based personalization
needs to adapt accordingly to the new situation. To do that, an anomaly detection
module should be added to the personalization process. This module will then
be in charge of making the probability distribution over the likelihood of showing
health recommendations more uniform (i.e., increasing entropy). In other words, the
resetting mechanism should decrease the probability of recommendations with very
high probability while increasing the probability of less likely recommendations.
Through this approach, the system will be exploring more often among less likely
recommendations and will be able to adapt to the relocation. Phone interactions
under this scenario could change but not drastically and for this reason the receptivity
detector is still likely to work.
• Shift-work: Among the 144 million wage and salary workers in the U.S in 2017,
16% worked a non-daytime schedule, (e.g., evenings, nights, rotating shift, split
shift, irregular schedule or some other schedule). Shift-work is challenging since
it disrupts natural biological rhythms and leads to disease and chronic conditions
like obesity, diabetes, compromised immune function, cardiovascular disease, and
increased cancer risk [57]. Given the negative consequences of shift-work it is
very important that any efforts at personalizing a health intervention succeed at
their goal of maximizing adherence to treatment. Following the disruptive-events
framework, shift-work is affected by the routine of this population. Although this
population has a routine, their routine changes depending on the shift they are
working. This means that when a participant is in her routine for the evening

10.6 CONCLUSION 91
shift, the health recommendations that she can follow and the contexts where she
can execute them could be very different from her night shift. As a consequence,
AI-based personalization may not rely on the divide and conquer approach used
to achieve personalization were time of day was used to create three different
bandits that handle recommendations separately for the morning, afternoon and
evening. Instead, the shift occurring should be incorporated directly as a factor
in the contextual bandit. Unfortunately, this approach increases computational
complexity and requires of a higher amount of data for personalization or the use
of other alternative strategies like leveraging data from multiple people to speed up
personalization. An alternative could be to use separate bandits for each shift. This
approach will retain the computational efficiency achieved in the approach presented
in this thesis. However, whether using a single contextual bandits or multiple, in
both cases is necessary that either the user inputs the shift occurring or a way to
detect the shift automatically.
10.6 Conclusion
Despite the rarity of pandemic-like events, the findings of how an mHealth intervention could
fail during a pandemic are likely generalizable to other more common events. These findings
were used in this section to create the disruptive-events framework which can be used to
understand how pandemic-like events could affect an mHealth interventions and as a template
to draft a solution to the challenges posed by these type of events. Some of the solutions
to these challenges are changes at the system level like modifying the contextual bandits,
identifying changes in routine or using multiple devices in the interventions. Other changes
like switching from disease-directed to patient-value based goals are a design guideline at
the user level that requires understanding the user needs and wants to connect them to the
mHealth intervention.

CHAPTER 11
Conclusion
In this dissertation, I have described the development and testing of an AI-based personaliza-
tion approach for mobile health interventions. By creating this novel, effective and sample
efficient personalization approach that combines artificial intelligence, wearables sensors
and human-feedback, my work transforms behavioral data, and human-AI interactions into
a decision making platform that facilitates behavior change and habit creation. This AI-
personalization approach automatically adapts to context, patient outcomes and preferences,
demonstrating the potential of contextual and AI-based digital health interventions.
Outside of the sleep intervention results I presented in this thesis, personalizing health
interventions for content and time of treatment has real-world impact in specific domains
like diet, physical activity for cardiovascular health and stress-management, and also in
broad spectrum interventions like weight management, substance abuse and even as a way to
enhance common behavioral intervention approaches like cognitive behavioral therapy.
More generally this thesis has made contributions in the domain of digital health interventions,
context aware decision making, human-AI interaction and more broadly in human-computer
interaction. My work on personalization of time of treatment contributes to the understanding
of how contextual and patient’s intrinsic characteristics can enhance or decrease adherence
to treatment. My work on personalization of content contributes to the understanding of
how context (i.e., time of day), environment (i.e., days of the semester) and health specific
factors (i.e., short vs long sleeper) affect behavior change. My work on intraday adherence
prediction demonstrates the feasibility of fine grained adherence prediction which could be
used as a further dimension of personalization. Last, my deployment during the pandemic
resulted in the creation of the disruptive-events framework that can be used to understand
92

11.1 UNRESOLVED QUESTIONS 93
and formulate solutions to the challenges posed by pandemic-like events in the context of
mHealth interventions.
In summary my thesis contributes to the understanding of the interplay of device use, context,
environmental and health factors role in behavior change and adherence to treatment and
how through digital sensing technologies and artificial intelligence these factors can be used
to make health interventions more effective. These findings warrant further exploration as
new dimensions of personalization to improve proximal and main intervention outcomes.
Likewise, some of the findings from the disruptive-events framework can be tested both
during a pandemic or in pandemic-like scenarios as those introduced in chapter 10.
11.1 Unresolved questions
From my investigation, it is still unclear whether the personalization methods and system
used in the 2019 study can produce better or similar outcomes than simpler methods like
showing everyday sleep recommendations selected at random and delivered at random times.
Nonetheless the results presented evaluating the effectivity of this type of AI-based interven-
tion across several intervention dimensions ( behavior change, adherence and motivation) are
very promising and warrant further exploration of this approach.
Another unresolved question is related to the effect of specific sleep recommendations and
their (most likely conditional on demographic and contextual factors) effect on participants’
sleep. Although, sleep recommendations affect people in different ways there could be
sub-population or demographic based health outcomes to the recommendations that could be
used as priors for AI-based personalization methods. For example, this priors can give broad
estimates of how a demographic factor like age affects adherence and sleep related behaviors.
With this information, the AI then does not need to explore all possible treatments and instead
could narrow down its health treatment personalization to a few health recommendations
possibly resulting in faster personalization. This reduction in time of personalization in
turn can result in higher user satisfaction with the intervention, improved self-efficacy and
adherence to treatment.

94 11 CONCLUSION
11.2 Future work
In this thesis, I demonstrated the value of personalization of content and time of treatment and
its positive effect on health (e.g., behavior change, adherence to treatment and motivation) in
the context of a sleep intervention. These results are very likely to generalize across different
domains and dimensions of personalization. The next is a breakdown of those promising
paths:
11.2.1 Personalization of time and content across different intervention
domains
The approach introduced in this thesis is most likely to generalize well for behavioral inter-
ventions that rely on providing health recommendations. Examples of such interventions
are weight loss interventions where advise on which activities to perform or which foods
to eat are provided. For both interventions, personalization of content (i.e., selecting which
recommendations to deliver) can be done using the methods described in this thesis. However,
the selection of the reward signal to use as a measure of personalization should be selected
carefully. For example, in this thesis I selected a score that captures both sleep duration and
efficiency as both measures are equally important to achieve high sleep quality. However,
data points from sleep duration and efficiency are scarce: one data point per day, limiting the
quantity of data available for personalization. A possibility, to overcome this data scarcity is
to instead of using the intervention main health outcome to rely on a proximal measure like
adherence to treatment. An advantage of using adherence is that at least in the case of the
sleep intervention presented in this thesis, it increases three fold the quantity of data available
for personalization. Likewise, in a weight loss intervention, adherence to physical activity
and eating recommendations will increase the amount of data linearly with the amount of
recommendations available. Adherence has as a further advantage that it can be found in all
health interventions independent of domain.
One possible challenge in this domain does emerge when the patient may be adherent to
unproductive recommendations that are not going to significantly improve the patient’s health.

11.2 FUTURE WORK 95
Over a short time span this may not be bad as can be used as a warm period to get the
patient comfortable with treatment (e.g., increase self-efficacy). However, over time the
personalization system should explore more effective recommendations and somehow re-
evaluate the effectivity of recommendations based on the intervention end goal measure and
not simply adherence to treatment.
11.2.2 Beyond receptivity
Unusual events (e.g., the pandemic, cancer diagnosis and treatment, mobility loss) affects the
way people interact with their electronic devices, rendering useless pre-trained models that
rely on user-device interactions to trigger, manage or adapt interventions.
Training new or updating receptivity detectors although possible does not work very well[86]
and requires at best weeks of data [71]. In the pandemic scenario, even the receptivity concept
that hinges around discovering opportunistic states may be unfeasible. To overcome this
challenge, the AI personalizing timing of treatment may need to try different communication
channels (e.g., chatbots, SMS, phone call, social networks, email). In this research avenue, it
would be very valuable to explore multi-device (e.g., phone, wearable, desktop) receptivity
detection and multi-channel health interventions. The main goal would be to discover which
device and channel work best for each patient using minimal data or feedback. Based on this
thesis findings, it is expected that the device type and communication channel has an effect
on adherence to treatment. For example, a user commuting home who is listening to music,
may be open to hear about personal health advice and feedback through her earphones, but
not through SMS, chat or text communications. A user browsing through a social network
website may be willing to trade-off ads for health recommendations that may include text and
video.
11.2.3 Health interventions across devices
Mobile health interventions have opened up a way to deliver health interventions in most
places at almost any time of the day. However, people split their time across different devices

96 11 CONCLUSION
depending on contextual (e.g., time of day, physical activity, current task), intrinsic (e.g., age,
gender, mobility) and other factors. The device-context dependence creates new affordances
for health interventions. For example reading and watching videos may be easier on a desktop
while listening to audio or impromptu short health recommendations is more convenient on a
mobile phone. Overall the guiding research question in this area is How can be leveraged the
affordances and contexts of use of different computing devices to deliver different types
of content of a health intervention?. Another important aspect to investigate in this area is
the embodiment of the health intervention: What are the implications of perceiving a health
intervention as a single entity moving across devices or as multiple entities across different
devices?. The perception of the health intervention as a single agency may be conflicting
for the patient since she could expect then to receive the same information and treatment
across different devices even though by design it would not be possible. The perception of
the health intervention as separate agents may help with patient expectations of treatment but
could create conflict by giving the illusion that the information across agents is not shared.
Then, if agents do share information for some patients this could be a great feature that will
help them have a more seamless interaction will all the health intervention devices. However,
for patients with higher privacy expectations this could be problematic. For example the
patient could provide sensitive information to an AI over chat that is password protected, if
this information is available to a virtual assistant with voice interaction, the patient may be
worried that anybody could get its hands on her private health information.
11.2.4 Language-style (a.k.a., Message Framing, tone)
The particular language-style used for communicating, has improved intervention outcomes in
personalized health interventions [103, 139]. There are many different language-styles (e.g.,
empathetic, authoritative, supportive); however, figuring out the one that works best for each
individual is time-consuming and current approaches rely on the response to questionnaires,
which limits adaptation. In this research area, I envision the development of methods for
the automatic adaptation of tone, based on health outcomes and context. Mhealth systems
could learn over time which language-style works better and how context (e.g., time-of-day,

11.2 FUTURE WORK 97
weekend vs. weekday) or intervention specific measures (e.g., motivation) affect health
outcomes. For example, for participants with low motivation, empathetic messages could
work better, while authoritative messages may be more effective at high motivation levels.
Adherence could also be factor for personalization of language-style, for example participants
that missed on treatment require an authoritative message right after to go back in track with
the intervention while at any other time supportive messages work best.
11.2.5 Emotion-sensing
Emotion sensing is very challenging, despite many advances it is still difficult to find ap-
proaches that are robust enough to integrate in live deployments. Nonetheless, recent advances
in deep learning specifically in self-supervised learning allow estimating from unlabeled data,
features that can then be used to create classifiers with a small amount of data. This ability to
create better and "cheaper" emotion sensing models then could allow for their usage in just
in time intervention. Detecting high anxiety levels could for example trigger more intrusive
interventions (phone call, visits). Stressful events detected after providing a treatment could
be used as proxies for self efficacy and the ability to cope with the intervention which in
turn can help with personalization of content. Overall adding real time emotion sensing
as a proximal signal for personalization could greatly reduce the time necessary to achieve
personalization of treatment.
11.2.6 Self-tracking+sensing+receptivity
Self tracking is an important part of health interventions that can increase patients self-
efficacy[5] and enhance motivation towards behavior change. Despite this, current tracking
technologies are at a very basic stage and may even hurt health interventions [56]. Recent
advances in self-tracking technologies like Omni-Track [63], a tracking system that allows
patients to create personalized tracking experiences, could be a further boost for mobile health
interventions. In this area, it could be explored a way to enhance systems like Omni-track
by incorporating sensing of stress, depression or even receptivity to trigger manual entries in
98 11 CONCLUSION
self-tracking systems. The goal would be to increase patient’s self awareness of symptoms
with the final goal to increase self-efficacy and adherence to treatment. Another important
area to explore could be automated tracking customization through a recommender system
approach, where from a large pool of people doing customized self-tracking, a system could
then suggest elements for the customized tracking including triggers and measures reducing
the effort and increasing time to optimal tracking. For example, from a pool of 20 to 25
years old patients, it could be that self-tracking is best when using reminder in the morning,
receptivity triggers in the afternoon, and email entry in the evening. For a new user, falling
in the above patient pool, it would be suggested to use this combination of reminders and
triggers to self-track health.

CHAPTER 12
Appendix
12.1 Sleep Duration GMM
In our GMM for sleep duration I control the effect of type-of-sleeper and day-of-year by
incorporating their respective covariates following observations observations from prior work
[75, 95]. Type-of-sleeper refers to whether a participant in unconstrained conditions would
sleep less than 7 hours (Short-sleeper) or more than 7 hours (Long-sleeper). A study by
Levenson et al. [75] found differences in sleep intervention outcomes depending on whether a
participant was a short or long sleeper. Type-of-sleeper in our data set was estimated from the
baseline data. Day-of-year was also included as a covariate because I observed in the results
from the StudentLife project [131] that day-of-year seemed to have a negative effect in sleep
duration of college students. Intuitively this would not be surprising given the structure of
academic terms were final example, projects, among others all are presented in the last weeks
of the term, causing higher constraints in time to sleep for students. To further corroborate
this hypothesis, I contacted the authors of several recent research projects were Fitbit data was
collected. I gained access to sleep data sets from observational studies that occurred at the
University of Washington [114], Carnegie Mellon University [30] and the University of Notre
Dame [128]. In addition, I recruited 19 college students from Carnegie Mellon University and
asked for access to their previously logged Fitbit data which included the Spring of 2019, Fall
2019 and Spring 2020. I fit a GMM for each data set with participant as a random intercept
and day-of-year as a fixed effect with the goal of measuring the effect of day of the semester
on college students’ daily sleep duration. I only used data from the first day of classes to the
last day of classes of the academic terms as stated in each school’s official calendars, explicitly99
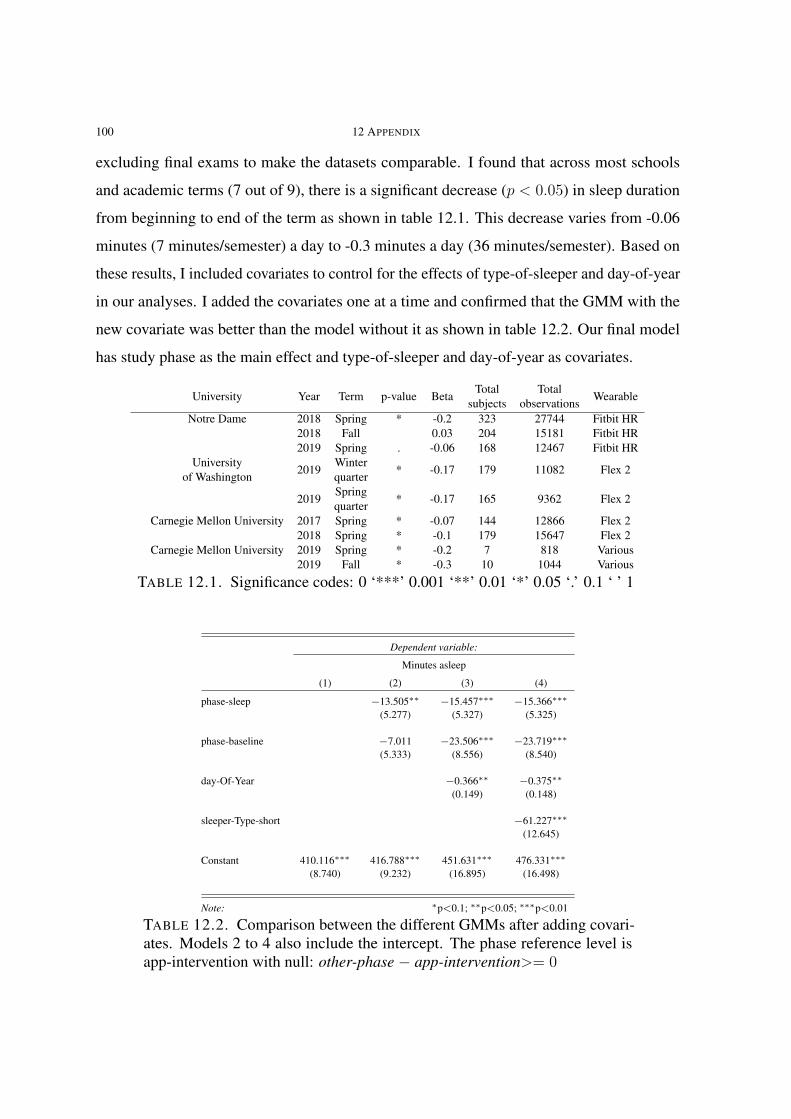
100 12 APPENDIX
excluding final exams to make the datasets comparable. I found that across most schools
and academic terms (7 out of 9), there is a significant decrease (p < 0.05) in sleep duration
from beginning to end of the term as shown in table 12.1. This decrease varies from -0.06
minutes (7 minutes/semester) a day to -0.3 minutes a day (36 minutes/semester). Based on
these results, I included covariates to control for the effects of type-of-sleeper and day-of-year
in our analyses. I added the covariates one at a time and confirmed that the GMM with the
new covariate was better than the model without it as shown in table 12.2. Our final model
has study phase as the main effect and type-of-sleeper and day-of-year as covariates.
University Year Term p-value BetaTotal
subjectsTotal
observationsWearable
Notre Dame 2018 Spring * -0.2 323 27744 Fitbit HR2018 Fall 0.03 204 15181 Fitbit HR2019 Spring . -0.06 168 12467 Fitbit HR
Universityof Washington
2019Winterquarter
* -0.17 179 11082 Flex 2
2019Springquarter
* -0.17 165 9362 Flex 2
Carnegie Mellon University 2017 Spring * -0.07 144 12866 Flex 22018 Spring * -0.1 179 15647 Flex 2
Carnegie Mellon University 2019 Spring * -0.2 7 818 Various2019 Fall * -0.3 10 1044 Various
TABLE 12.1. Significance codes: 0 ‘***’ 0.001 ‘**’ 0.01 ‘*’ 0.05 ‘.’ 0.1 ‘ ’ 1
Dependent variable:
Minutes asleep
(1) (2) (3) (4)
phase-sleep −13.505∗∗ −15.457∗∗∗ −15.366∗∗∗
(5.277) (5.327) (5.325)
phase-baseline −7.011 −23.506∗∗∗ −23.719∗∗∗
(5.333) (8.556) (8.540)
day-Of-Year −0.366∗∗ −0.375∗∗
(0.149) (0.148)
sleeper-Type-short −61.227∗∗∗
(12.645)
Constant 410.116∗∗∗ 416.788∗∗∗ 451.631∗∗∗ 476.331∗∗∗
(8.740) (9.232) (16.895) (16.498)
Note: ∗p<0.1; ∗∗p<0.05; ∗∗∗p<0.01
TABLE 12.2. Comparison between the different GMMs after adding covari-ates. Models 2 to 4 also include the intercept. The phase reference level isapp-intervention with null: other-phase − app-intervention>= 0

12.2 STUDY 1: EFFECT OF CONTEXT AND INTRINSIC CHARACTERISTICS 101
12.2 Study 1: Effect of context and intrinsic characteristics
Dependent variable:
Adherence
(1) (2) (3) (4) (5)
random 0.987∗∗∗ 1.006∗∗∗ 1.376∗∗∗ 1.377∗∗∗
(0.235) (0.238) (0.250) (0.250)
receptivity 1.234∗∗∗ 1.244∗∗∗ 1.508∗∗∗ 1.515∗∗∗
(0.191) (0.192) (0.203) (0.202)
diary 0.529∗∗∗ 0.572∗∗∗ 0.489∗∗∗ 0.492∗∗∗
(0.169) (0.167) (0.164) (0.164)
user 0.316∗∗∗ 0.336∗∗∗ 0.267∗∗∗ 0.267∗∗∗
(0.071) (0.072) (0.073) (0.073)
day 1.282∗∗∗ 1.297∗∗∗ 1.289∗∗∗
(0.254) (0.259) (0.259)
morning −0.249 −0.771∗
(0.255) (0.400)
afternoon −0.466∗ −0.987∗∗
(0.259) (0.403)
evening −1.332∗∗∗ −1.853∗∗∗
(0.263) (0.408)
motivation 1.084∗
(0.656)
Constant 0.417∗ −0.130 −0.632∗∗∗
(0.214) (0.205) (0.233)
Note: ∗p<0.1; ∗∗p<0.05; ∗∗∗p<0.01
TABLE 12.3. BMMs for adherence showing the null model (Constant only)and comparisons.

102 12 APPENDIX
12.3 Study 2: Personalization of content comparisons
Dependent variable:
minutesAsleep
groupbandit 5.504(13.077)
dayOfYear −0.276(0.171)
sleeperTypeshort −34.093∗∗
(13.364)
Constant 404.188∗∗∗
(18.586)
Note: ∗p<0.1; ∗∗p<0.05; ∗∗∗p<0.01TABLE 12.4. GMM for personalization of content comparisons using asreference level content selected randomly.

12.4 STUDY 2: PERSONALIZATION OF TIME OF TREATMENT COMPARISONS 103
12.4 Study 2: Personalization of time of treatment
comparisons
Dependent variable:
minutesAsleep
phaserandom −4.539(4.281)
phasebaseline −15.328∗∗
(7.648)
dayOfYear −0.258(0.172)
sleeperTypeshort −31.968∗∗
(12.522)
Constant 406.367∗∗∗
(17.681)
Note: ∗p<0.1; ∗∗p<0.05; ∗∗∗p<0.01TABLE 12.5. GMM for personalization of time of treatment comparisonsusing as reference level sleep recommendations delivered at receptive times.

References
[1] ADAN, A., FABBRI, M., NATALE, V., AND PRAT, G. Sleep beliefs scale (sbs) andcircadian typology. Journal of Sleep Research 15, 2 (2006), 125–132.
[2] ASHLEY, E. A. The precision medicine initiative: a new national effort. Jama 313, 21(2015), 2119–2120.
[3] AUER, P., CESA-BIANCHI, N., FREUND, Y., AND SCHAPIRE, R. E. The non-stochastic multiarmed bandit problem. SIAM journal on computing 32, 1 (2002),48–77.
[4] BAGLIONI, C., NANOVSKA, S., REGEN, W., SPIEGELHALDER, K., FEIGE, B.,NISSEN, C., REYNOLDS III, C. F., AND RIEMANN, D. Sleep and mental disorders:A meta-analysis of polysomnographic research. Psychological bulletin 142, 9 (2016),969.
[5] BANDURA, A. Self-efficacy: toward a unifying theory of behavioral change. Psycho-logical review 84, 2 (1977), 191.
[6] BARKER, F., ATKINS, L., AND DE LUSIGNAN, S. Applying the com-b behaviourmodel and behaviour change wheel to develop an intervention to improve hearing-aiduse in adult auditory rehabilitation. International journal of audiology 55, sup3 (2016),S90–S98.
[7] BATES, D., MÄCHLER, M., BOLKER, B., AND WALKER, S. Fitting linear mixed-effects models using lme4. Journal of Statistical Software 67, 1 (2015), 1–48.
[8] BAUER, J., CONSOLVO, S., GREENSTEIN, B., SCHOOLER, J., WU, E., WATSON,N. F., AND KIENTZ, J. ShutEye: Encouraging Awareness of Healthy Sleep Recom-mendations with a Mobile, Peripheral Display. In Proceedings of the 2012 ACM annualconference on Human Factors in Computing Systems - CHI ’12 (New York, New York,USA, 2012), ACM Press, p. 1401.
[9] BENJAMINI, Y., AND HOCHBERG, Y. Controlling the false discovery rate: a practicaland powerful approach to multiple testing. Journal of the Royal statistical society:series B (Methodological) 57, 1 (1995), 289–300.
[10] BIENER, L., AND ABRAMS, D. B. The contemplation ladder: validation of a measureof readiness to consider smoking cessation. Health Psychology 10, 5 (1991), 360.
104
REFERENCES 105
[11] BLUMENTHAL, D. M., SINGAL, G., MANGLA, S. S., MACKLIN, E. A., ANDCHUNG, D. C. Predicting non-adherence with outpatient colonoscopy using a novelelectronic tool that measures prior non-adherence. Journal of general internal medicine30, 6 (2015), 724–731.
[12] BURLESON, B. R. Understanding the outcomes of supportive communication: Adual-process approach. Journal of Social and Personal Relationships 26, 1 (2009),21–38.
[13] BUYSSE, D. J. Sleep health: can we define it? does it matter? Sleep 37, 1 (2014),9–17.
[14] BUYSSE, D. J., REYNOLDS III, C. F., MONK, T. H., BERMAN, S. R., AND KUPFER,D. J. The pittsburgh sleep quality index: a new instrument for psychiatric practice andresearch. Psychiatry research 28, 2 (1989), 193–213.
[15] CENTRE FOR CLINICAL INTERVENTIONS, A. Sleep hygiene.
[16] CHAWLA, N. V., BOWYER, K. W., HALL, L. O., AND KEGELMEYER, W. P. Smote:synthetic minority over-sampling technique. Journal of artificial intelligence research16 (2002), 321–357.
[17] CHERNBUMROONG, S., CANG, S., ATKINS, A., AND YU, H. Elderly activitiesrecognition and classification for applications in assisted living. Expert Systems withApplications 40, 5 (2013), 1662–1674.
[18] COHEN, S., KAMARCK, T., MERMELSTEIN, R., ET AL. Perceived stress scale.Measuring stress: A guide for health and social scientists 10 (1994).
[19] COLLINS, F. S., AND VARMUS, H. A new initiative on precision medicine. NewEngland journal of medicine 372, 9 (2015), 793–795.
[20] COLLINS, L. M. Optimization of behavioral, biobehavioral, and biomedical interven-tions. Springer, 2018.
[21] COOK, P. F., SCHMIEGE, S. J., MANSBERGER, S. L., SHEPPLER, C., KAMMER, J.,FITZGERALD, T., AND KAHOOK, M. Y. Motivational interviewing or reminders forglaucoma medication adherence: Results of a multi-site randomised controlled trial.Psychology & health 32, 2 (2017), 145–165.
[22] DALLERY, J., CASSIDY, R. N., AND RAIFF, B. R. Single-case experimental designsto evaluate novel technology-based health interventions. Journal of medical Internetresearch 15, 2 (2013), e22.
[23] DASKALOVA, N., LEE, B., HUANG, J., NI, C., AND LUNDIN, J. Investigating theeffectiveness of cohort-based sleep recommendations. Proceedings of the ACM onInteractive, Mobile, Wearable and Ubiquitous Technologies 2, 3 (2018), 1–19.

106 REFERENCES
[24] DASKALOVA, N., METAXA-KAKAVOULI, D., TRAN, A., NUGENT, N., BOERGERS,J., MCGEARY, J., AND HUANG, J. Sleepcoacher: A personalized automated self-experimentation system for sleep recommendations. In Proceedings of the 29th AnnualSymposium on User Interface Software and Technology (2016), ACM, pp. 347–358.
[25] DASKALOVA, N., YOON, J., WANG, Y., ARAUJO, C., BELTRAN JR, G., NUGENT,N., MCGEARY, J., WILLIAMS, J. J., AND HUANG, J. Sleepbandits: Guided flexibleself-experiments for sleep. In Proceedings of the 2020 CHI Conference on HumanFactors in Computing Systems (2020), pp. 1–13.
[26] DEAN, D. A., FLETCHER, A., HURSH, S. R., AND KLERMAN, E. B. Developingmathematical models of neurobehavioral performance for the "real world". Journal ofBiological Rhythms 22, 3 (2007), 246–258.
[27] DERMODY, S. S., WARDELL, J. D., STONER, S. A., AND HENDERSHOT, C. S.Predictors of daily adherence to naltrexone for alcohol use disorder treatment during amobile health intervention. Annals of Behavioral Medicine 52, 9 (2018), 787–797.
[28] DIMATTEO, M. R. Variations in patients’ adherence to medical recommendations: aquantitative review of 50 years of research. Medical care (2004), 200–209.
[29] DINGLER, T., AND PIELOT, M. I’ll be there for you: Quantifying attentivenesstowards mobile messaging. In Proceedings of the 17th International Conference onHuman-Computer Interaction with Mobile Devices and Services (2015), ACM, pp. 1–5.
[30] DORYAB, A., VILLALBA, D. K., CHIKERSAL, P., DUTCHER, J. M., TUMMINIA,M., LIU, X., COHEN, S., CRESWELL, K., MANKOFF, J., CRESWELL, J. D., ANDDEY, A. K. Identifying behavioral phenotypes of loneliness and social isolation withpassive sensing: Statistical analysis, data mining and machine learning of smartphoneand fitbit data. JMIR Mhealth Uhealth 7, 7 (Jul 2019), e13209.
[31] DURMER, J. S. J., DINGES, D. D. F., GOEL, N., AND RAO, H. Neurocognitiveconsequences of sleep deprivation. Seminars in neurology 29, 4 (2009), 320–39.
[32] FEEHAN, L. M., GELDMAN, J., SAYRE, E. C., PARK, C., EZZAT, A. M., YOO,J. Y., HAMILTON, C. B., AND LI, L. C. Accuracy of fitbit devices: systematic reviewand narrative syntheses of quantitative data. JMIR mHealth and uHealth 6, 8 (2018),e10527.
[33] FEINSTEIN, J. S. The relationship between socioeconomic status and health: a reviewof the literature. The Milbank Quarterly (1993), 279–322.
[34] FERDOUS, R., OSMANI, V., AND MAYORA, O. Smartphone app usage as a predictorof perceived stress levels at workplace. In 2015 9th International Conference onPervasive Computing Technologies for Healthcare (PervasiveHealth) (2015), IEEE,pp. 225–228.

REFERENCES 107
[35] FIELD, A., MILES, J., AND FIELD, Z. Discovering statistics using R. Sage publica-tions, 2012.
[36] FLEURY, A., VACHER, M., AND NOURY, N. Svm-based multimodal classificationof activities of daily living in health smart homes: sensors, algorithms, and firstexperimental results. IEEE transactions on information technology in biomedicine 14,2 (2009), 274–283.
[37] FOGG, B. A behavior model for persuasive design. Proceedings of the 4th InternationalConference on Persuasive Technology - Persuasive ’09 (2009), 1.
[38] FRIEDRICH, A., AND SCHLARB, A. A. Let’s talk about sleep: a systematic reviewof psychological interventions to improve sleep in college students. Journal of sleepresearch 27, 1 (2018), 4–22.
[39] FUKAZAWA, Y., ITO, T., OKIMURA, T., YAMASHITA, Y., MAEDA, T., AND OTA, J.Predicting anxiety state using smartphone-based passive sensing. Journal of biomedicalinformatics 93 (2019), 103151.
[40] GHANVATKAR, S., KANKANHALLI, A., AND RAJAN, V. User models for personal-ized physical activity interventions: scoping review. JMIR mHealth and uHealth 7, 1(2019), e11098.
[41] GORDON, M. L., GATYS, L., GUESTRIN, C., BIGHAM, J. P., TRISTER, A., ANDPATEL, K. App usage predicts cognitive ability in older adults. In Proceedings of the2019 CHI Conference on Human Factors in Computing Systems (2019), ACM, p. 168.
[42] GRANDNER, M. A. Sleep, health, and society. Sleep medicine clinics 12, 1 (2017),1–22.
[43] GRANDNER, M. A., JACKSON, N., GOONERATNE, N. S., AND PATEL, N. P. Thedevelopment of a questionnaire to assess sleep-related practices, beliefs, and attitudes.Behavioral sleep medicine 12, 2 (2014), 123–142.
[44] GUYON, I., BENNETT, K., CAWLEY, G., ESCALANTE, H. J., ESCALERA, S., HO,T. K., MACIA, N., RAY, B., SAEED, M., STATNIKOV, A., ET AL. Design of the2015 chalearn automl challenge. In 2015 International Joint Conference on NeuralNetworks (IJCNN) (2015), IEEE, pp. 1–8.
[45] HAACK, M., SERRADOR, J., COHEN, D., SIMPSON, N., MEIER-EWERT, H., ANDMULLINGTON, J. M. Increasing sleep duration to lower beat-to-beat blood pressure: apilot study. Journal of sleep research 22, 3 (2013), 295–304.
[46] HAGHAYEGH, S., KHOSHNEVIS, S., SMOLENSKY, M. H., DILLER, K. R., ANDCASTRIOTTA, R. J. Accuracy of wristband fitbit models in assessing sleep: Systematicreview and meta-analysis. J Med Internet Res 21, 11 (Nov 2019), e16273.
[47] HANDLEY, M. A., HARLEMAN, E., GONZALEZ-MENDEZ, E., STOTLAND, N. L. N.

108 REFERENCES
C. M. E., ALTHAVALE, P., FISHER, L., MARTINEZ, D., KO, J., SAUSJORD, I., ANDRIOS, C. Applying the com-b model to creation of an it-enabled health coaching andresource linkage program for low-income latina moms with recent gestational diabetes:the star mama program. Implementation Science 11, 1 (2015), 73.
[48] HEATHER, N., SMAILES, D., AND CASSIDY, P. Development of a readiness rulerfor use with alcohol brief interventions. Drug and alcohol dependence 98, 3 (2008),235–240.
[49] HO, J., AND INTILLE, S. S. Using context-aware computing to reduce the perceivedburden of interruptions from mobile devices. In Proceedings of the SIGCHI conferenceon Human factors in computing systems (2005), pp. 909–918.
[50] HOLMES, E. A., HUGHES, D. A., AND MORRISON, V. L. Predicting adherenceto medications using health psychology theories: a systematic review of 20 years ofempirical research. Value in Health 17, 8 (2014), 863–876.
[51] HONG, J.-H., RAMOS, J., AND DEY, A. K. Toward personalized activity recognitionsystems with a semipopulation approach. IEEE Transactions on Human-MachineSystems 46, 1 (2015), 101–112.
[52] HORNE, J. A., AND ÖSTBERG, O. A self-assessment questionnaire to determinemorningness-eveningness in human circadian rhythms. International journal of chron-obiology (1976).
[53] HORSCH, C., SPRUIT, S., LANCEE, J., VAN EIJK, R., BEUN, R. J., NEERINCX, M.,AND BRINKMAN, W.-P. Reminders make people adhere better to a self-help sleepintervention. Health and Technology 7, 2-3 (nov 2017), 173–188.
[54] HORSCH, C., SPRUIT, S., LANCEE, J., VAN EIJK, R., BEUN, R. J., NEERINCX, M.,AND BRINKMAN, W.-P. Reminders make people adhere better to a self-help sleepintervention. Health and technology 7, 2-3 (2017), 173–188.
[55] HORWITZ, R. I., AND HORWITZ, S. M. Adherence to treatment and health outcomes.Archives of internal medicine 153, 16 (1993), 1863–1868.
[56] JAKICIC, J. M., DAVIS, K. K., ROGERS, R. J., KING, W. C., MARCUS, M. D.,HELSEL, D., RICKMAN, A. D., WAHED, A. S., AND BELLE, S. H. Effect ofwearable technology combined with a lifestyle intervention on long-term weight loss:the idea randomized clinical trial. Jama 316, 11 (2016), 1161–1171.
[57] JAMES, S. M., HONN, K. A., GADDAMEEDHI, S., AND VAN DONGEN, H. P. Shiftwork: disrupted circadian rhythms and sleep—implications for health and well-being.Current sleep medicine reports 3, 2 (2017), 104–112.
[58] JAMESON, J. L., AND LONGO, D. L. Precision medicine—personalized, problematic,and promising. Obstetrical & gynecological survey 70, 10 (2015), 612–614.
REFERENCES 109
[59] KAKULLA, B. Older adults keep pace on tech usage. AARP Research (2020).
[60] KATEVAS, K., LEONTIADIS, I., PIELOT, M., AND SERRÀ, J. Continual predictionof notification attendance with classical and deep network approaches. arXiv preprintarXiv:1712.07120 (2017).
[61] KILLIAN, J. A., WILDER, B., SHARMA, A., CHOUDHARY, V., DILKINA, B., ANDTAMBE, M. Learning to prescribe interventions for tuberculosis patients using digitaladherence data. In Proceedings of the 25th ACM SIGKDD International Conferenceon Knowledge Discovery & Data Mining (2019), pp. 2430–2438.
[62] KIM, S., AND CHOUDHURY, A. Exploring older adults’ perception and use of smartspeaker-based voice assistants: A longitudinal study. Computers in Human Behavior(2021), 106914.
[63] KIM, Y.-H., JEON, J. H., LEE, B., CHOE, E. K., AND SEO, J. Omnitrack: A flexibleself-tracking approach leveraging semi-automated tracking. Proceedings of the ACMon Interactive, Mobile, Wearable and Ubiquitous Technologies 1, 3 (2017), 1–28.
[64] KINI, V., AND HO, P. M. Interventions to improve medication adherence: a review.Jama 320, 23 (2018), 2461–2473.
[65] KLASNJA, P., HEKLER, E. B., SHIFFMAN, S., BORUVKA, A., ALMIRALL, D.,TEWARI, A., AND MURPHY, S. A. Microrandomized trials: An experimental designfor developing just-in-time adaptive interventions. Health Psychology 34, S (2015),1220.
[66] KLASNJA, P., AND VEERARAGHAVAN, E. B. Rethinking evaluations of mhealthsystems for behavior change. GetMobile: Mobile Computing and Communications 22,2 (2018), 11–14.
[67] KOESMAHARGYO, V., ABBAS, A., ZHANG, L., GUAN, L., FENG, S., YADAV, V.,AND GALATZER-LEVY, I. R. Accuracy of machine learning-based prediction ofmedication adherence in clinical research. Psychiatry Research 294 (2020), 113558.
[68] KRAMER, J.-N., KÜNZLER, F., MISHRA, V., PRESSET, B., KOTZ, D., SMITH,S., SCHOLZ, U., AND KOWATSCH, T. Investigating intervention components andexploring states of receptivity for a smartphone app to promote physical activity:protocol of a microrandomized trial. JMIR research protocols 8, 1 (2019), e11540.
[69] KREBS, P., PROCHASKA, J. O., AND ROSSI, J. S. A meta-analysis of computer-tailored interventions for health behavior change. Preventive medicine 51, 3-4 (2010),214–221.
[70] KUMAMARU, H., LEE, M. P., CHOUDHRY, N. K., DONG, Y.-H., KRUMME, A. A.,KHAN, N., BRILL, G., KOHSAKA, S., MIYATA, H., SCHNEEWEISS, S., ET AL.Using previous medication adherence to predict future adherence. Journal of managed

110 REFERENCES
care & specialty pharmacy 24, 11 (2018), 1146–1155.
[71] KÜNZLER, F., MISHRA, V., KRAMER, J.-N., KOTZ, D., FLEISCH, E., ANDKOWATSCH, T. Exploring the state-of-receptivity for mhealth interventions. Proc.ACM Interact. Mob. Wearable Ubiquitous Technol. 3, 4 (Dec. 2019).
[72] LARA, O. D., AND LABRADOR, M. A. A survey on human activity recognition usingwearable sensors. IEEE communications surveys & tutorials 15, 3 (2012), 1192–1209.
[73] LATTIMORE, T., AND SZEPESVÁRI, C. Bandit algorithms.
[74] LEE, S. K., KANG, B.-Y., KIM, H.-G., AND SON, Y.-J. Predictors of medicationadherence in elderly patients with chronic diseases using support vector machinemodels. Healthcare informatics research 19, 1 (2013), 33.
[75] LEVENSON, J. C., MILLER, E., HAFER, B. L., REIDELL, M. F., BUYSSE, D. J.,AND FRANZEN, P. L. Pilot study of a sleep health promotion program for collegestudents. Sleep health 2, 2 (2016), 167–174.
[76] LEWIS, C. M., AND VASSOS, E. Polygenic risk scores: from research tools to clinicalinstruments. Genome Medicine 12 (2020), 1–11.
[77] LI, M., ROZGIC, V., THATTE, G., LEE, S., EMKEN, A., ANNAVARAM, M., MITRA,U., SPRUIJT-METZ, D., AND NARAYANAN, S. Multimodal physical activity recog-nition by fusing temporal and cepstral information. IEEE Transactions on NeuralSystems and Rehabilitation Engineering 18, 4 (2010), 369–380.
[78] LIAO, P., DEMPSEY, W., SARKER, H., HOSSAIN, S. M., AL’ABSI, M., KLASNJA,P., AND MURPHY, S. Just-in-time but not too much: Determining treatment timing inmobile health. Proceedings of the ACM on interactive, mobile, wearable and ubiquitoustechnologies 2, 4 (2018), 1–21.
[79] LUND, H. G., REIDER, B. D., WHITING, A. B., AND PRICHARD, J. R. Sleeppatterns and predictors of disturbed sleep in a large population of college students.Journal of adolescent health 46, 2 (2010), 124–132.
[80] LÜDECKE, D. ggeffects: Tidy data frames of marginal effects from regression models.Journal of Open Source Software 3, 26 (2018), 772.
[81] MAGHERINI, T., FANTECHI, A., NUGENT, C. D., AND VICARIO, E. Using temporallogic and model checking in automated recognition of human activities for ambient-assisted living. IEEE Transactions on Human-Machine Systems 43, 6 (2013), 509–521.
[82] MARMOT, M. G., KOGEVINAS, M., AND ELSTON, M. A. Social/economic statusand disease. Annual review of public health 8, 1 (1987), 111–135.
[83] MEHROTRA, A., MUSOLESI, M., HENDLEY, R., AND PEJOVIC, V. Designing
REFERENCES 111
content-driven intelligent notification mechanisms for mobile applications. In Proceed-ings of the 2015 ACM International Joint Conference on Pervasive and UbiquitousComputing (2015), pp. 813–824.
[84] MICHIE, S., VAN STRALEN, M. M., AND WEST, R. The behaviour change wheel: anew method for characterising and designing behaviour change interventions. Imple-mentation science 6, 1 (2011), 42.
[85] MORAWIEC, D. sklearn-porter. Transpile trained scikit-learn estimators to C, Java,JavaScript and others, 2019.
[86] MORRISON, L. G., HARGOOD, C., PEJOVIC, V., GERAGHTY, A. W., LLOYD,S., GOODMAN, N., MICHAELIDES, D. T., WESTON, A., MUSOLESI, M., WEAL,M. J., ET AL. The effect of timing and frequency of push notifications on usage of asmartphone-based stress management intervention: an exploratory trial. PloS one 12, 1(2017), e0169162.
[87] MORROW, G. R. Cancer-related fatigue: Causes, consequences, and management. Theoncologist 12 (2007), 1–3.
[88] NAGAI, M., TOMATA, Y., WATANABE, T., KAKIZAKI, M., AND TSUJI, I. Associ-ation between sleep duration, weight gain, and obesity for long period. Sleep Medicine14, 2 (2013), 206–210.
[89] NAHUM-SHANI, I., HEKLER, E. B., AND SPRUIJT-METZ, D. Building healthbehavior models to guide the development of just-in-time adaptive interventions: Apragmatic framework. Health Psychology 34, S (2015), 1209.
[90] NAHUM-SHANI, I., SMITH, S. N., SPRING, B. J., COLLINS, L. M., WITKIEWITZ,K., TEWARI, A., AND MURPHY, S. A. Just-in-time adaptive interventions (jitais)in mobile health: key components and design principles for ongoing health behaviorsupport. Annals of Behavioral Medicine 52, 6 (2017), 446–462.
[91] OKOSHI, T., NOZAKI, H., NAKAZAWA, J., TOKUDA, H., RAMOS, J., AND DEY,A. K. Towards attention-aware adaptive notification on smart phones. Pervasive andMobile Computing 26 (2016), 17–34.
[92] ONGHENA, P., AND EDGINGTON, E. S. Customization of pain treatments: Single-casedesign and analysis. The Clinical journal of pain 21, 1 (2005), 56–68.
[93] ORNSTEIN, K. A., LEFF, B., COVINSKY, K. E., RITCHIE, C. S., FEDERMAN, A. D.,ROBERTS, L., KELLEY, A. S., SIU, A. L., AND SZANTON, S. L. Epidemiology ofthe homebound population in the united states. JAMA internal medicine 175, 7 (2015),1180–1186.
[94] OSTERBERG, L., AND BLASCHKE, T. Adherence to medication. New England journalof medicine 353, 5 (2005), 487–497.

112 REFERENCES
[95] PAREDES, P., GILAD-BACHRACH, R., CZERWINSKI, M., ROSEWAY, A., ROWAN,K., AND HERNANDEZ, J. Poptherapy: Coping with stress through pop-culture. InProceedings of the 8th International Conference on Pervasive Computing Technologiesfor Healthcare (2014), ICST (Institute for Computer Sciences, Social-Informaticsand . . . , pp. 109–117.
[96] PEDREGOSA, F., VAROQUAUX, G., GRAMFORT, A., MICHEL, V., THIRION, B.,GRISEL, O., BLONDEL, M., PRETTENHOFER, P., WEISS, R., DUBOURG, V.,VANDERPLAS, J., PASSOS, A., COURNAPEAU, D., BRUCHER, M., PERROT, M.,AND DUCHESNAY, E. Scikit-learn: Machine learning in Python. Journal of MachineLearning Research 12 (2011), 2825–2830.
[97] PEJOVIC, V., AND MUSOLESI, M. Interruptme: designing intelligent promptingmechanisms for pervasive applications. In Proceedings of the 2014 ACM InternationalJoint Conference on Pervasive and Ubiquitous Computing (2014), pp. 897–908.
[98] PIELOT, M., CARDOSO, B., KATEVAS, K., SERRÀ, J., MATIC, A., AND OLIVER, N.Beyond interruptibility: Predicting opportune moments to engage mobile phone users.Proceedings of the ACM on Interactive, Mobile, Wearable and Ubiquitous Technologies1, 3 (2017), 91.
[99] PIELOT, M., DE OLIVEIRA, R., KWAK, H., AND OLIVER, N. Didn’t you seemy message?: predicting attentiveness to mobile instant messages. In Proceedingsof the SIGCHI Conference on Human Factors in Computing Systems (2014), ACM,pp. 3319–3328.
[100] PIELOT, M., DINGLER, T., PEDRO, J. S., AND OLIVER, N. When attention is notscarce-detecting boredom from mobile phone usage. In Proceedings of the 2015 ACMinternational joint conference on pervasive and ubiquitous computing (2015), ACM,pp. 825–836.
[101] PLATT, A. B., LOCALIO, A. R., BRENSINGER, C. M., CRUESS, D. G., CHRISTIE,J. D., GROSS, R., PARKER, C. S., PRICE, M., METLAY, J. P., COHEN, A., ET AL.Can we predict daily adherence to warfarin?: Results from the international normalizedratio adherence and genetics (in-range) study. Chest 137, 4 (2010), 883–889.
[102] POLLARD, C. M., HOWAT, P. A., PRATT, I. S., BOUSHEY, C. J., DELP, E. J., ANDKERR, D. A. Preferred tone of nutrition text messages for young adults: focus grouptesting. JMIR mHealth and uHealth 4, 1 (2016), e1.
[103] POLLARD, C. M., HOWAT, P. A., PRATT, I. S., BOUSHEY, C. J., DELP, E. J., ANDKERR, D. A. Preferred tone of nutrition text messages for young adults: Focus grouptesting. JMIR mHealth uHealth 4, 1 (Jan 2016), e1.
[104] POSNER, D., AND GEHRMAN, P. R. Sleep Hygiene. Academic Press, jan 2011.
[105] PROCHASKA, J. O., AND VELICER, W. F. The transtheoretical model of health

REFERENCES 113
behavior change. American Journal of Health Promotion 12, 1 (1997), 38–48.
[106] RABBI, M., AUNG, M. H., ZHANG, M., AND CHOUDHURY, T. Mybehavior: auto-matic personalized health feedback from user behaviors and preferences using smart-phones. In Proceedings of the 2015 ACM International Joint Conference on Pervasiveand Ubiquitous Computing (2015), pp. 707–718.
[107] RABBI, M., AUNG, M. H., ZHANG, M., AND CHOUDHURY, T. MyBehavior:Automatic Personalized Health Feedback from User Behaviors and Preferences usingSmartphones. In Proceedings of the 2015 ACM International Joint Conference onPervasive and Ubiquitous Computing - UbiComp ’15 (New York, New York, USA,2016), ACM Press, pp. 707–718.
[108] RABBI, M., AUNG, M. S., GAY, G., REID, M. C., AND CHOUDHURY, T. Feas-ibility and acceptability of mobile phone–based auto-personalized physical activityrecommendations for chronic pain self-management: Pilot study on adults. Journal ofmedical Internet research 20, 10 (2018), e10147.
[109] RAHMAN, T., CZERWINSKI, M., GILAD-BACHRACH, R., AND JOHNS, P. Predictingabout-to-eat moments for just-in-time eating intervention. In Proceedings of the 6thInternational Conference on Digital Health Conference (2016), ACM, pp. 141–150.
[110] RASCH, B., AND BORN, J. About Sleep’s Role in Memory. Physiological Reviews93, 2 (2013), 681–766.
[111] ROSALES, A., AND FERNÁNDEZ-ARDÈVOL, M. Beyond whatsapp: Older peopleand smartphones. Romanian Journal of Communication and Public Relations 18, 1(2016), 27–47.
[112] SANKAR, P. L., AND PARKER, L. S. The precision medicine initiative’s all ofus research program: an agenda for research on its ethical, legal, and social issues.Genetics in Medicine 19, 7 (2017), 743.
[113] SANO, A., JOHNS, P., AND CZERWINSKI, M. Designing opportune stress interventiondelivery timing using multi-modal data. In 2017 Seventh International Conference onAffective Computing and Intelligent Interaction (ACII) (2017), IEEE, pp. 346–353.
[114] SEFIDGAR, Y. S., SEO, W., KUEHN, K. S., ALTHOFF, T., BROWNING, A., RISKIN,E., NURIUS, P. S., DEY, A. K., AND MANKOFF, J. Passively-sensed behavioralcorrelates of discrimination events in college students. Proc. ACM Hum.-Comput.Interact. 3, CSCW (Nov. 2019).
[115] SMITH, S. N., LEE, A. J., HALL, K., SEEWALD, N. J., BORUVKA, A., MURPHY,S. A., AND KLASNJA, P. Design lessons from a micro-randomized pilot study inmobile health. In Mobile Health. Springer, 2017, pp. 59–82.
[116] SON, Y.-J., KIM, H.-G., KIM, E.-H., CHOI, S., AND LEE, S.-K. Application of
114 REFERENCES
support vector machine for prediction of medication adherence in heart failure patients.Healthcare informatics research 16, 4 (2010), 253–259.
[117] SPADOLA, C. E., ROTTAPEL, R. E., ZHOU, E. S., CHEN, J. T., GUO, N., KHALSA,S. B. S., REDLINE, S., AND BERTISCH, S. M. A sleep hygiene and yoga interventionconducted in affordable housing communities: Pilot study results and lessons for afuture trial. Complementary Therapies in Clinical Practice 39 (2020), 101121.
[118] SPIELMAN, A. J., SASKIN, P., AND THORPY, M. J. Treatment of chronic insomniaby restriction of time in bed. Sleep 10, 1 (1987), 45–56.
[119] STICKGOLD, R., HOBSON, J. A., FOSSE, R., AND FOSSE, M. Sleep, learning, anddreams: Off-line memory reprocessing. Science 294, 5544 (2001), 1052–1057.
[120] SUTTON, R. S., AND BARTO, A. G. Reinforcement learning: An introduction. MITpress, 2018.
[121] TAYLOR, D. J., AND PRUIKSMA, K. E. Cognitive and behavioural therapy forinsomnia (cbt-i) in psychiatric populations: a systematic review. International reviewof psychiatry 26, 2 (2014), 205–213.
[122] TAYLOR KYLE, S. L. Smartphone ownership is growing rapidly around the world, butnot always equally, 2019.
[123] TINETTI, M. E., NAIK, A. D., AND DODSON, J. A. Moving from disease-centeredto patient goals–directed care for patients with multiple chronic conditions: patientvalue-based care. JAMA cardiology 1, 1 (2016), 9–10.
[124] TONG, H. L., QUIROZ, J. C., KOCABALLI, A. B., FAT, S. C. M., DAO, K. P.,GEHRINGER, H., CHOW, C. K., AND LARANJO, L. Personalized mobile technologiesfor lifestyle behavior change: A systematic review, meta-analysis, and meta-regression.Preventive Medicine (2021), 106532.
[125] TSENG, V. W.-S., SANO, A., BEN-ZEEV, D., BRIAN, R., CAMPBELL, A. T.,HAUSER, M., KANE, J. M., SCHERER, E. A., WANG, R., WANG, W., ET AL.Using behavioral rhythms and multi-task learning to predict fine-grained symptoms ofschizophrenia. Scientific reports 10, 1 (2020), 1–17.
[126] TSENG, V. W.-S., VALLIAPPAN, N., RAMACHANDRAN, V., CHOUDHURY, T., ANDNAVALPAKKAM, V. Digital biomarker of mental fatigue. NPJ digital medicine 4, 1(2021), 1–5.
[127] VAN DULMEN, S., SLUIJS, E., VAN DIJK, L., DE RIDDER, D., HEERDINK, R., ANDBENSING, J. Patient adherence to medical treatment: a review of reviews. BMC healthservices research 7, 1 (2007), 1–13.
[128] VHADURI, S., AND POELLABAUER, C. Impact of different pre-sleep phone usepatterns on sleep quality. In 2018 IEEE 15th International Conference on Wearable

REFERENCES 115
and Implantable Body Sensor Networks (BSN) (2018), pp. 94–97.
[129] WALKER, M. P. The role of sleep in cognition and emotion. Annals of the New YorkAcademy of Sciences 1156 (2009), 168–197.
[130] WALLERT, J., GUSTAFSON, E., HELD, C., MADISON, G., NORLUND, F., VONESSEN, L., AND OLSSON, E. M. G. Predicting adherence to internet-deliveredpsychotherapy for symptoms of depression and anxiety after myocardial infarction:machine learning insights from the u-care heart randomized controlled trial. Journal ofmedical Internet research 20, 10 (2018), e10754.
[131] WANG, R., CHEN, F., CHEN, Z., LI, T., HARARI, G., TIGNOR, S., ZHOU, X., BEN-ZEEV, D., AND CAMPBELL, A. T. Studentlife: assessing mental health, academicperformance and behavioral trends of college students using smartphones. In Pro-ceedings of the 2014 ACM international joint conference on pervasive and ubiquitouscomputing (2014), ACM, pp. 3–14.
[132] WILLIAMS, D. R., MOHAMMED, S. A., LEAVELL, J., AND COLLINS, C. Race,socioeconomic status and health: Complexities, ongoing challenges and researchopportunities. Annals of the New York Academy of Sciences 1186 (2010), 69.
[133] WILLIAMS, D. R., PRIEST, N., AND ANDERSON, N. Understanding associationsbetween race, socioeconomic status, and health: patterns and prospects. In The SocialMedicine Reader, Volume II, Third Edition. Duke University Press, 2019, pp. 258–267.
[134] WILLIAMSON, A. M., AND FEYER, A.-M. Moderate sleep deprivation producesimpairments in cognitive and motor performance equivalent to legally prescribed levelsof alcohol intoxication. Occupational and environmental medicine 57, 10 (2000),649–655.
[135] WOBBROCK, J. O., FINDLATER, L., GERGLE, D., AND HIGGINS, J. J. The alignedrank transform for nonparametric factorial analyses using only anova procedures. InProceedings of the SIGCHI conference on human factors in computing systems (2011),ACM, pp. 143–146.
[136] WOLK, R., GAMI, A. S., GARCIA-TOUCHARD, A., SOMERS, V. K., ANDRAHIMTOOLA, S. H. Sleep and cardiovascular disease. Current Problems in Cardi-ology 30, 12 (2005), 625–662.
[137] WOOD, W., AND NEAL, D. T. Healthy through habit: Interventions for initiating &maintaining health behavior change. Behavioral Science & Policy 2, 1 (2016), 71–83.
[138] YANG, G., LAI, C. S. W., CICHON, J., MA, L., LI, W., AND GAN, W.-B. Sleeppromotes branch-specific formation of dendritic spines after learning. Science 344,6188 (2014), 1173–1178.
[139] YOM-TOV, E., FERARU, G., KOZDOBA, M., MANNOR, S., TENNENHOLTZ, M.,

116 REFERENCES
AND HOCHBERG, I. Encouraging physical activity in patients with diabetes: interven-tion using a reinforcement learning system. Journal of medical Internet research 19,10 (2017), e338.
[140] ZAKARIA, C., BALAN, R., AND LEE, Y. Stressmon: Scalable detection of perceivedstress and depression using passive sensing of changes in work routines and groupinteractions. Proceedings of the ACM on Human-Computer Interaction 3, CSCW(2019), 1–29.
[141] ZHOU, M., FUKUOKA, Y., GOLDBERG, K., VITTINGHOFF, E., AND ASWANI, A.Applying machine learning to predict future adherence to physical activity programs.BMC medical informatics and decision making 19, 1 (2019), 1–11.