explore process big data michael brown analytics … · how can big data and analytics help close...
TRANSCRIPT

EXPLORE PROCESS BIG DATA
ANALYTICS WITH THE
UNIFORMANCE SUITE
Michael Brown
25 Oct 2016

Honeywell Proprietary - © 2016 by Honeywell International Inc. All rights reserved.
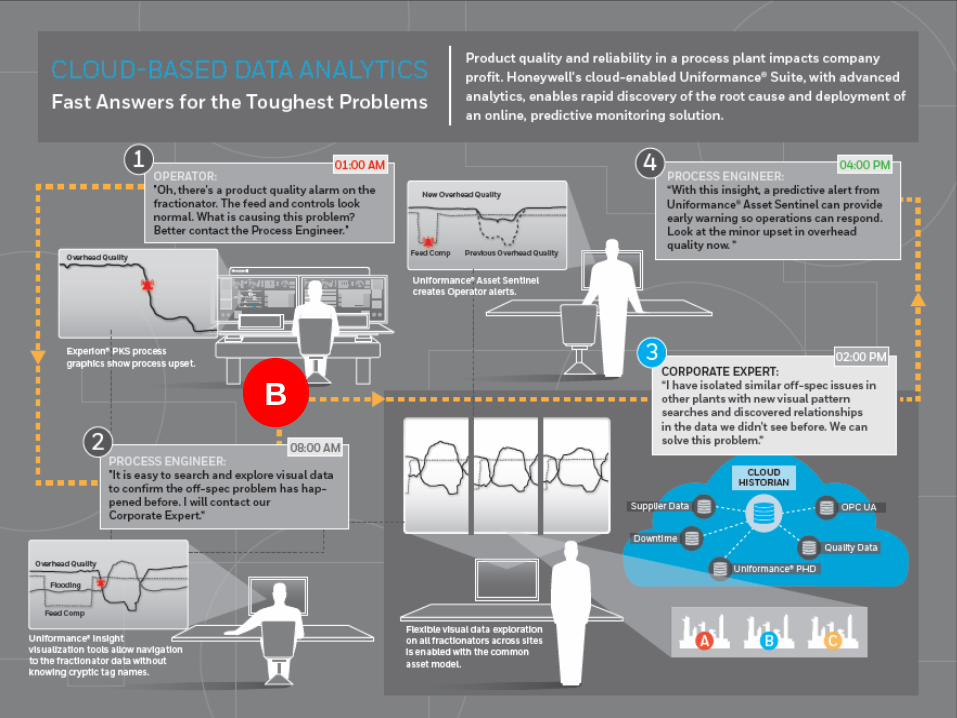
Uniformance® Suite Delivers Digital Intelligence
1
Organize and visualize
data in asset context
Apply powerful analytics
to detect and predict issues
Connect process intelligence
to business KPIs
Capture real-time process
and event data
CollaborationAcross Functions
Management
Maintenance & Reliability
OperationsEngineering
Visualization
Ad-hoc Analysis KPI Dashboard
Notifications

Honeywell Proprietary - © 2016 by Honeywell International Inc. All rights reserved.
The Industrial Analytics Challenge
2
How can big data and analytics help close this GAP
and deliver real value in the process industries?
40 exabytes (4.0 x 10¹⁹) of
unique new information
will be generated worldwide
this year
A major O&G producer has
over 40 Pbyte (1015 or
quadrillion) of data today
and will increase 10X in
coming years
Today
Taking data
to action
Data from sensors
& applications
Analytics GAP

Honeywell Proprietary - © 2016 by Honeywell International Inc. All rights reserved.
Data in context of the
problem
Closing the Industrial Analytics Gap
3
Open data analytics
platform for people to
collaborate
Simple tools usable by
plant Engineers with
domain knowledge
Fuse sensor data and
application data for
complete understanding

Honeywell Proprietary - © 2016 by Honeywell International Inc. All rights reserved.
A Pragmatic Definition of Data Analytics
4
Graphic from “Big Data Industry Insights”, Lisa Kart, Gartner webinar, 2015.
• The goal of analytics is to provide information for improved
decisions and actions for economic benefit.
• Note that maximizing automation and minimizing human input are
not always the goals analytics should be suited to the use case.

Honeywell Proprietary - © 2016 by Honeywell International Inc. All rights reserved.
© 2015 by Honeywell International Inc. All rights reserved.
Uniformance Suite - Run-time Predictive
Analytics Approaches
No Silver Bullet – Hybrid Approaches Needed
Approach Application Technology ComplexityApplic-
ability
1. Physics Model
(1st Principles)
Basic perf mon for broad set of assets
& detection deviation from predicted vs
actual
Embedded in AM & External
via UniSim based on heatLow Many
2. Univariate Prediction
Predicting single variable time to reach
a value – e.g. predict heat exchanger
fouling
Regression w error correction
(H_TimeFit)
3. Adaptive Filtering/
Thresholding
Anomaly detection for Equipment
(temp, press, vib)
Data cleansing & compare
current to historical averages
4. Multivariate Pattern
Detect behavior of group of sensors
according to learned/historical
expectations
Detected patterns (equations)
with rules detecting abnormal
relationships
5. Multivariate Early
Event Detection
Broad set of process and equipment
monitoring scenarios
Statistical pattern detection
and recognition including OLS,
PLS, PCA, Neural Nets, etc.
(Honeywell & 3rd Party)
6. Machine Learning
Capture insights from Big Data to build
better algorithms (e.g. Aero APU
example)
Big Data using variety of data
sources including maintenance
and reliability data
High Few

Honeywell Proprietary - © 2016 by Honeywell International Inc. All rights reserved.
6

Honeywell Proprietary - © 2016 by Honeywell International Inc. All rights reserved.
7
A

Consolidated and contextualized data
Capture | Uniformance® PHD
8
• Scalable - from site to enterprise to cloud
• Data Fusion: More than a process
historian – includes event and
application data
• Built-in engineering knowledge
• Built-in calculation and engineering unit
conversion capability
• Use with asset model for enterprise
integration
• Visual process analytics search tools
Capture
Consolidate
Contextualize
$
fx
A
Honeywell Proprietary - © 2016 by Honeywell International Inc. All rights reserved.
9
B

Flexible web-enabled AGILE collaboration
Visualize | Uniformance® Insight
10
• Powerful ad-hoc trends and
workspaces
• True thin-client application
• Available on a wide variety of devices
• Collaborative interaction & sharing
• Powerful visual analytics search engine
• Connect to process historians,
application data & 3rd party data
B

Honeywell Proprietary - © 2016 by Honeywell International Inc. All rights reserved.
11
C
Honeywell Proprietary - © 2016 by Honeywell International Inc. All rights reserved.
12
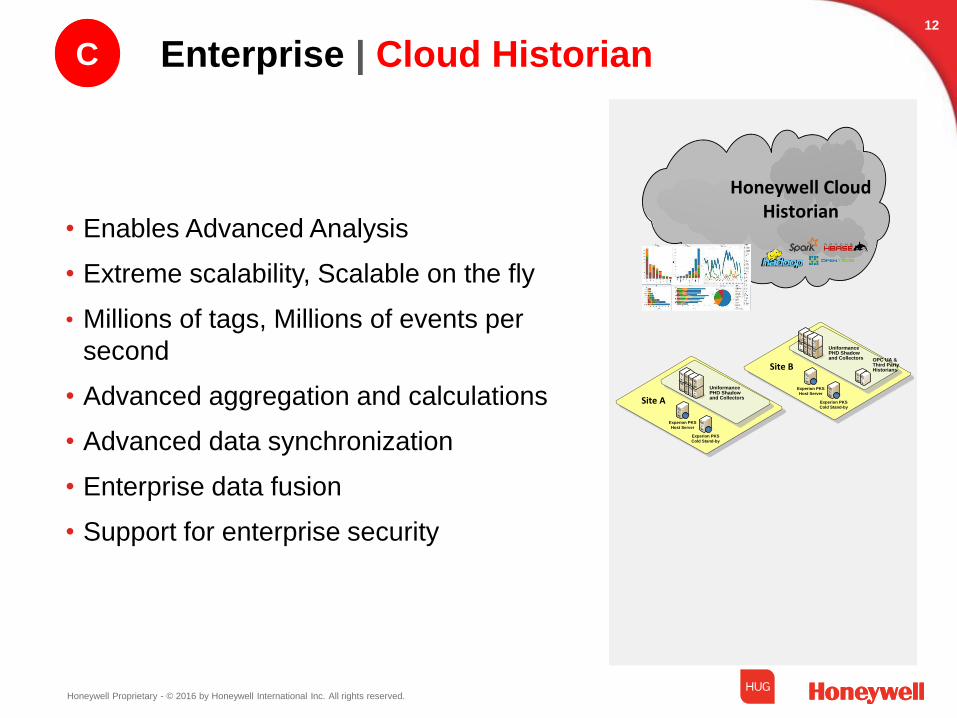
• Enables Advanced Analysis
• Extreme scalability, Scalable on the fly
• Millions of tags, Millions of events per
second
• Advanced aggregation and calculations
• Advanced data synchronization
• Enterprise data fusion
• Support for enterprise security
Experion PKS
Host Server
Experion PKS
Cold Stand-by
UniformancePHD Shadow and CollectorsSite A
Experion PKS
Host Server
Experion PKS
Cold Stand-by
UniformancePHD Shadow and Collectors
Site B
Honeywell Cloud Historian
OPC UA & Third Party Historians
Enterprise | Cloud HistorianC

Honeywell Proprietary - © 2016 by Honeywell International Inc. All rights reserved.
13
D

Honeywell Proprietary - © 2016 by Honeywell International Inc. All rights reserved.
Visual Analytics for Equipment Monitoring
• Designing monitoring rules can be time consuming as it is an
iterative approach of exploring anomaly behavior and testing rule
designs against historical data with subsequent iterations
• Honeywell is pursuing a Visual Data Analytics approach that
provides visual data exploration and visualization techniques to
augment the current workflow and enable SMEs to develop
analytics in an agile and iterative manner
(Forensics) Has this timeseries
combination happened before? Where
and when? What else happened before
and after it?
(Design) I am designing a new
monitoring rule. I want to find all
examples in my data where temperature
was rising while load was staying roughly
constant.
(Exploration) I want to find all examples
where something interesting happened
on compressor 7 between July and
October 2012.
?
(Rule discovery) I want to search for all
examples where a outage and workorder
were not preceded by an Alert. Then
decide if I need a new rule.
outage
workorder
Example Queries
14

Honeywell Proprietary - © 2016 by Honeywell International Inc. All rights reserved.
• Data Fusion
- Historians, Maintenance, LIMS,
Financial, …
- All meta data is indexed
- On-line, no data lake
• Capsule Series
- “Time periods of interest”
- Simultaneously time series and
transactional
• Scalability
- Users’ formulas automatically
scale
• Searching
- Patterns
- Limits / Boundaries
- Logical
• Interactive
- On-the-fly calcs
- Collaborative UI
• Historical Benchmarking *
- Mode or conditioned based calcs
Seeq Corporation Proprietary - Limited Distribution 15
* Patent Pending
Saves 95% of the effort required by engineers to
explore their ideas for surveillance, troubleshooting,
and improvements => data driven decisions
Seeq | ”Workbench” Innovations D15

Honeywell Proprietary - © 2016 by Honeywell International Inc. All rights reserved.
See the Invisible
Supply Chain & Trading Data
Lab/Quality Data Inventory DataMaintenance Data HSE Data
Planning & Scheduling Data
Reliability Data
Operations & Personnel Data
Financial and Business Data
Process and Control Alarm &
Event data
Time-in-State “Capsules” add context to time series data for exploratory visual analysis:
Shift B
Sensor Data
Pressure above 300 psi for 30 min
Shutdown for Maintenance
Historian
16

Honeywell Proprietary - © 2016 by Honeywell International Inc. All rights reserved.
Visual Analytics Demonstration17

Honeywell Proprietary - © 2016 by Honeywell International Inc. All rights reserved.
18
E

Moving to Early Event Detection
Predict | Uniformance® Asset Sentinel
19
• Powerful analytics with asset-based calculations and fault models
• Integrated workflow from alert notification, troubleshooting, to problem resolution
• Embedded process content (pump,
compressors, turbines, etc.)
• Email & mobile notifications for faster
response
• Integrated visual analytics workflow
Embedded & User Defined
Models
Calculations & Fault
Models
Make Problems Visible
Dashboard
s
Notifications
Continuous
Monitoring
Heat Exchanger
Gas / SteamTurbine
Compressor
Furnace
Asset Model
Trends /
Displays
C

Honeywell Proprietary - © 2016 by Honeywell International Inc. All rights reserved.
© 2015 by Honeywell International Inc. All rights reserved.
Visual Analytics: Workflow with Domain Expertise
Scalable workflow delivering analytics environment with 90% time savings
20
Anomaly
Definition
Failure
Examples
8 candidate post lube failures found in data
Signal
Selection
Use domain expertise to select
shortlist of tags relevant for fault
detection
Review
FailuresRapidly query system behavior
for selected failure events
Design RuleDesign rule based from observed
failure events & implement in
Sentinel
Test Rule Test rule against historical data
Deploy Rule
Desig
n I
tera
tion
Ite
rate
on
ru
le d
esig
n/t
un
ing
to
ach
ieve
de
sir
ed
ba
lan
ce
of tr
ue
po
sitiv
e v
s.
fals
e p
ositiv
es
Alert indication of
anomaly/exception from process
Rapidly determine failure
occurrences in historical data
Real-time analytics deployed to
online runtime monitoring system
Post Lube Alert After compressor shutdown lube oil pressure must remain higher than 10 psi for 20-30 minutes or until oil temperature is low.
Out of 8 candidates, 4 were true post lube failures
True Failure Not a failure
Positive detection of all 4 post
lube failures with no false
positives. Rule validated on
other platforms.
Rule deployed in Asset
Sentinel for real-time
detection
Maintain RuleDeploy rule to online runtime
monitoring system
Insig
ht
Vis
ua
l A
naly
tic
s
Vis
ua
l
An
aly
tic
s As
se
t S
en
tin
el

Honeywell Proprietary - © 2016 by Honeywell International Inc. All rights reserved.
Uniformance Analytics Suite Overview
Run-time Analytics
Unit / Site
Process Data
Real-time & Historical
(Small Data)
Normal & Abnormal
• First Principals
• Statistical
• State estimation
Model
Event
Detection Deviation Detection
• Heuristic
• Trained
Off-Line Analytics
Unit / Site / Multi-Site
Visual Data Analytics
• Pattern search
• Value Search
• Combinations
• Cleanse / Filter
Process
Engineer
Data
Scientist
Skillsets Required
Statistical Analytics
• Multivariate
statistical (PCA,
PLS…)
Machine Learning
Big Data
• Data Vol. & variety
(unstructured / text)
• Volume of data
• Feature Extraction
• ML (Random Forest,
SVM, Naïve Bays…)
Additional
Models / Rules
Where is sweet spot
for value generation
and scalability?
21
Honeywell Proprietary - © 2016 by Honeywell International Inc. All rights reserved.
22

Honeywell Proprietary - © 2016 by Honeywell International Inc. All rights reserved.
23