exploratory study of the impact of information and
TRANSCRIPT

Exploratory study of the impact of Information and Communication Technology (ICT)-based
features in conference center selection/recommendation by meeting planners
Seungwon Lee
Dissertation submitted to the faculty of the Virginia Polytechnic Institute and State University in
partial fulfillment of the requirement for degree of
Doctor of Philosophy in
Hospitality and Tourism Management
Dr. Mahmood A. Khan, Chair Dr. Ken W. McCleary
Dr. Candice E. Clemenz Dr. Kusum Singh
Dr. Thomas W. Wilkinson
May 4, 2009 Blacksburg, Virginia
Keywords: Meeting facility selection, Information and Communication Technology, Technology Acceptance Model (TAM), Meeting planner, Conference center
Exploratory study of the impact of Information and Communication Technology (ICT) -based
features in conference center selection/recommendation by meeting planners
Seungwon Lee
(ABSTRACT)
This study examined the perceived importance of availability of ICT-based features and
technical support on meeting planners’ recommendation/selection of a conference center. In
addition, this study attempted to explain relationships between meeting planners’ beliefs
(perceived usefulness and perceived ease of use) toward ICT-based features and other factors:
personal innovativeness of ICT (PIICT); perceived importance of the availability of technical
support; self efficacy; and result demonstrability.
A conceptually integrated and expanded model of the Technology Acceptance Model
(TAM) developed by Davis (1986, 1989) was used as a theoretical frame. The subjects of the
study were meeting planners who used the selected two conference centers for their meetings or
were considering them for their future meetings. A total of 167 usable responses were gathered
and the proposed model was empirically examined using the data collected.
The results of the model test revealed that the expanded TAM with the integration of key factors
provided a systematic view of the meeting planners’ beliefs in selection/recommendation of a
conference center with ICT-based features. In addition, factor analysis of the fifteen ICT-based
features revealed three underlying dimensions based on meeting planners’ perceived importance
of the availability of each feature for a conference center selection: 1) high-speed wireless
Internet; 2) network backbone; and 3) ICT-based service outlet. Specifically, high-speed

iii
wireless Internet was the most important ICT-based determinant of a conference center
selection/recommendation to all types of meeting planners.
Due to the exploratory nature of this study, the results provided limited facets of the
impact of ICT-based feature and technical support on meeting facility selection/recommendation.
Nevertheless, this study is the first research effort of its kind to investigate what type of ICT-
based feature and technical support impact conference center selection/recommendation by
different types of meeting planners the most. The results revealed that corporate meeting
planners consider wireless Internet and a fast network more important in selection than other
types of meeting planners do. The availability of ICT-based features was less important to
association meeting planners when they make a conference center selection. This study also
identified that there is a serious lack of knowledge in terms related to network backbones across
all types of meeting planners. Technical support, especially on-site technical support, was
perceived as very important to all types of meeting planners.
This study also identified that meeting planners with high PIICT possess stronger
confidence in using and visualizing the advantages of ICT-based features. Thus conference
centers should make efforts to measure meeting planners’ PIICT and use the score effectively for
their marketing of ICT-based features. The study also identified result demonstrability—the
visualizing of positive outcomes of using ICT-based features—as very important to meeting
planners. PIICT and result demonstrability were positively related to perceived ease of use and
perceived usefulness which were identified as key antecedents of actual acceptance/usage of
technology in previous studies. The results of the current study present an important step toward
providing practical as well as theoretical implications for future technology impact studies in the
context of meeting facility selection.

iv
DEDICATIONS
I would like to dedicate this work to my whole family. This outcome was only possible with their
support, patience and sacrifice. Thank you for all your love and support during my study in
U.S.A.
v
AUTHOR’S ACKNOWLEDGEMENT
My foremost appreciation goes to Dr. Mahmood A. Khan for all his advice, teaching, and
encouragement in up and down times in my journey of Ph.D. study. I also thank to other
members of my advisory committee: Dr. Ken W. McCleary, Dr. Tom Wilkinson, Dr. Kusum
Singh, and Dr. Candice E. Clemenz for their advice, support, and encouragement to complete my
degree. I also would like to express my appreciation to Dr. Suzanne Murrmann and my
colleagues at George Mason University.

vi
Table of Contents Page
List of Figures .......................................................................................................... ix List of Tables ........................................................................................................... x Chapter I INTRODUCTION ............................................................................... 1
1.1 Introduction .................................................................................... 1 1.2 Statement of the Problem ............................................................... 2 1.3 Research Questions ........................................................................ 4 1.4 Theoretical Model and Background ............................................... 5 1.4.1 Technology Acceptance Theory: Technology Acceptance Model (TAM) ................................................ 5 1.4.2 Self-efficacy ...................................................................... 6 1.5 Boundaries of the Study ................................................................. 8 1.6 Definitions of Key Constructs ....................................................... 9 1.6.1 ICT-Based Features/Technical Support ............................ 9 1.6.2 Personal Innovativeness of ICT (PIICT) .......................... 9 1.6.3 Result Demonstrability ..................................................... 10 1.6.4 Self-efficacy ...................................................................... 10 1.6.5 Perceived Usefulness ........................................................ 10 1.6.6 Perceived Ease of Use ....................................................... 10 1.7 Organization of the Study .............................................................. 11
Chapter II REVIEW OF THE LITERATURE ..................................................... 12
2.1 Introduction ................................................................................... 12 2.2 Theories of Technology Acceptance ............................................. 12 2.2.1 Technology Acceptance Model (TAM) and Comparisons to Other Theories ..................................... 12 2.2.2 Extended Models of TAM: TAM2 and Others ................. 17 2.2.3 Technology Studies in the Meeting Industry .................... 20 2.2.4 Self-efficacy ...................................................................... 24 2.3 Convention Site Selection vs. Facility Selection .......................... 26 2.4 Technology as a New Emerging Determinant of Facility Selection ......................................................................................... 31 2.5 ICT in the Tourism, Hospitality, and Conference Center Industry .......................................................................................... 32 2.6 The Conference Center Industry .................................................... 35 2.7 Meeting Site/Facility Selection Process ......................................... 41 2.8 Meeting Planner: Expert Power as a Member of the Buying Center 45 2.9 Types of Meeting Planners and Their Technology Readiness ....... 46 2.10 Personal Innovativeness ............................................................... 48 2.11 Proposed Research Model............................................................ 51

vii
Table of Contents (continued) Page
Chapter II REVIEW OF THE LITERATURE (continued)
2.12 Constructs and Hypotheses .......................................................... 55 2.12.1 Personal Innovativeness in ICT (PIICT) ......................... 55 2.12.2 Result Demonstrability ................................................... 57 2.12.3 Perceived Importance of the Availability of Technical Support ............................................................ 58 2.12.4 Self-efficacy………………………… ............................ 59 2.12.5 Type of Meeting planner …………………………… 60 2.12.6 Perceived Usefulness and Perceived Ease of Use ........... 61
Chapter III METHODOLOGY .............................................................................. 63
3.1 Introduction .................................................................................... 63 3.2 Research Design............................................................................. 63 3.3 Population and Sample .................................................................. 66 3.4 Instrument and Measure of Constructs .......................................... 68 3.4.1 Personal Innovativeness in ICT (PIICT)………………. 70 3.4.2 Result Demonstrability………………………………… 70 3.4.3 Importance of Information and Communication Technology (ICT)-Based Features ................................... 71 3.4.4 Perceived Importance of the Availability of Technical Support…….. .. ................................................ 73 3.4.5 Self-efficacy ...................................................................... 74 3.4.6 Perceived Usefulness ........................................................ 74 3.4.7 Perceived Ease of Use ....................................................... 75 3.4.8 Demographic Information…………………………..…… 76 3.5 Reliability and Validity of Measures ............................................. 76 3.6 Pre-test ........................................................................................... 77 3.7 Data Collection .............................................................................. 77 3.8 Data Analysis/Testing Procedures ................................................. 78 3.9 Summary ........................................................................................ 79
Chapter IV ANALYSIS AND RESULTS .............................................................. 80 4.1 Introduction .................................................................................... 80 4.2 Data Collected ................................................................................ 80 4.3 Profile of Respondents ................................................................... 81 4.4 Analysis of Importance of ICT-based Feature on
Conference Center Selection/recommendation……………………. 82 4.4 Descriptive Statistics ...................................................................... 93 4.4.1 Personal Innovativeness in ICT (PIICT)………………. 93 4.4.2 Result Demonstrability………………………………… 94

viii
Table of Contents (continued)
Page Chapter IV ANALYSIS AND RESULTS (CONTINUED)
4.4.3 Perceived Importance of the Availability of Technical Support…….. .. ................................................ 95
4.4.4 Self-efficacy ...................................................................... 96 4.4.5 Perceived Usefulness ........................................................ 96 4.4.6 Perceived Ease of Use ....................................................... 97 4.5 Reliability and Validity Estimates ................................................. 98
4.5.1 Reliability Estimates of Study .......................................... 99 4.5.2 Validity Estimates of Study .............................................. 100 4.6 Non-response Bias Testing ............................................................ 103 4.7 Factor Analysis of Perceived Importance of Fifteen ICT-based Features at Conference Centers ..................................................... 105 4.8 Hypotheses Testing ........................................................................ 107 4.9 Summary ........................................................................................ 127
Chapter V DISCUSSION AND CONCLUSION.................................................. 129
5.1 Introduction .................................................................................... 129 5.2 Conclusion ..................................................................................... 129 5.3 Implications.................................................................................... 134 5.4 Recommendation for Future Studies ............................................. 135
5.5 Limitation of Study ........................................................................ 136 REFERENCES ........................................................................................................ 138 APPENDIX ………………………..………………………………………….… 152
Appendix 1 Questionnaire ................................................................... 153 Appendix 2 Technology Glossary ....................................................... 159

ix
LIST OF FIGURES
Figure Page
1.1 Proposed Research Model……..…………………………….………………. 7 2.1 Diagram of TAM ........................................................................................... 14 2.2 Innovation Diffusion Theory model .............................................................. 15 2.3 Model of the Theory of Planned Behavior (TPB) ......................................... 17 2.4 TAM and Three Popular Extensions .............................................................. 19 2.5 Decomposed Theory of Planned Behaviors ................................................... 20 2.6 Integrated Theoretical Framework ................................................................. 53 2.7 Proposed Research Model.............................................................................. 54 4.1 Diagram of Variance of Each Group ............................................................. 87 4.2 Scatterplot of PIICT by Result Demonstrability ............................................ 108 4.3 Histogram of Dependent Variable: Result Demonstrability .......................... 109 4.4 Normal P-P Plot ............................................................................................. 109 4.5 Plot of Residuals by PIICT ............................................................................ 110 4.6 Regression Analysis of Research Model ....................................................... 126

x
LIST OF TABLES
Table Page
2.1 Matching Concept of TAM and IDT ............................................................. 16 2.2 Non Theory-based Technology Studies in the Meeting Industry .................. 22 2.3 Review of Theory-based Studies on Technology Acceptance in the Meeting Industry: Key Variables. ........................................................…….. 23 2.4 Terms Used in Titles in Site Selection Studies .............................................. 27 2.5 Meeting Facility/Venue Selection Determinants ........................................... 30 2.6 Definition of Convention and Conference ..................................................... 37 2.7 Demands by Type of Organizations for North American Conference Centers ........................................................................................ 39 2.8 Underlying Nature of Technology Readiness ................................................ 50 3.1 Research Questions and Hypotheses ............................................................. 64 3.2 Instrument and Its Measurement Development……………………….. ....... 69 4.1 Profile of Respondents ................................................................................... 81 4.2 Mean of importance of ICT-based Features by Order ................................... 83 4.3 Frequency of “No Knowledge” by Order ............................................…….. 84 4.4 Mean of each ICT-based item by type of meeting planner ............................ 86 4.5 Test of Homogeneity of Variances ................................................................ 88 4.6 Results of One-way ANOVA ........................................................................ 89 4.7 Results of Games Howell post hoc test .......................................................... 91

xi
LIST OF TABLES (continued)
Page 4.8 Mean of importance of ICT-based service ..................................................... 93 4.9 Result of Paired-samples T-test on Perceived Importance of the Availability of Technical Support ............................................................ 93 4.10 Descriptive Statistics of PIICT ...................................................................... 94 4.11 Descriptive Statistics of Result Demonstrability .................................…….. 95 4.12 Descriptive Statistics of Perceived Importance of the Availability of Technical Support ........................................................................................... 96 4.13 Descriptive Statistics of Self-efficacy ............................................................ 96 4.14 Descriptive Statistics of Perceived Usefulness .............................................. 97 4.15 Descriptive Statistics of Perceived Ease of Use ............................................ 98 4.16 Results of Scale Reliability ............................................................................ 99 4.17 Result of Extracted Components ................................................................... 101 4.18 Factor Structure Matrix of Loadings and Cross-loadings .............................. 102 4 19 Results of Non-Response Bias by Independent Sample T-tests Scales ......... 104 4.20 Rotated Component Matrix ............................................................................ 106 4.21 Summary of H1a Test .................................................................................... 111 4.22 Summary of H1b Test .................................................................................... 112 4.23 Summary of H1c Test .................................................................................... 112 4.24 Summary of H1d Test .................................................................................... 113 4.25 Summary of H2a Test ..........................................................................…….. 114 4.26 Summary of H2b Test .................................................................................... 115 4.27 Summary of H2c Test .................................................................................... 116

xii
LIST OF TABLES (continued)
Page 4.28 Summary of H3a Test .................................................................................... 116 4.29 Summary of H3b Test .................................................................................... 117 4.30 Summary of H4 Test ...................................................................................... 118 4.31 Summary of H5a Test .................................................................................... 119 4.32 Summary of Regression Comparison by Type of Meeting Planners……… 120 4.33 Summary of H5b Test .................................................................................... 123 4.34 Summary of Regression Comparison by Type of Meeting Planners……… 123 4.35 Summary of H6 Test ...................................................................................... 125 4.36 Summary of Hypotheses Tests .............................................................…….. 127

1
Chapter 1
INTRODUCTION
1.1 Introduction
Meetings, conventions, exhibitions, and the incentive travel industry produced US
$122.31 billion in total direct spending in 2004 (Convention Industry Council, 2005). The
Hospitality Sales and Marketing Association International (HSMAI) Foundation and Connolly,
Carroll, and Steinbrink (2007) revealed that the group meetings market had grown to US $164.1
billion in 2006. Given the economic impact of meetings and their positive effects on destinations,
the growing market competition has driven the meeting industry to provide all requirements and
to differentiate a convention destination/facility from its competitors (Crouch & Louviere,
2004b). Technology is considered the greatest change that will influence the meeting industry
(MPI, 2002) and will be the most important competitive weapon for any hospitality company to
be successful (Connolly & Olsen, 2000). Technology is also considered one of the most
important service factors among meeting attendance as well as to meeting planners, who expect
meeting facilities to provide efficient technical and communicational services (Lee & Park,
2002).
This dissertation explores the impact of technology, specifically Information and
Communication Technology (ICT) -based features, at meeting facilities by investigating critical
factors which could impact their selection or recommendation by meeting planners. There has
been growth recently in the research dealing with a variety of aspects of the technology
acceptance model in IT areas; however, studies dealing with meeting facility and meeting
planners are very limited, and overall meeting technology research remains far behind other
2
meeting industry practices. This study attempts to provide a better understanding of the factors
that impact meeting planners’ acceptances, beliefs and attitudes toward ICT-based features and
service in the meeting facility selection context.
1.2 Statement of the Problem
The “where to host a meeting” question focuses on two primary categories: one is a
meeting destination, addressing a city’s capacity as a meeting host; the other is a meeting facility
(Go & Zang, 1997). Most research has focused on selection of a destination for associations’
annual conventions (Chen, 2006; Comas & Mocardo, 2005; Crouch & Louviere, 2004a; Crouch
& Richie, 1998; Fortin & Richie, 1977; Go & Zang, 1997; Kim, Kim, & Leong, 2005;
Oppermann, 1996a; Renaghan & Kay, 1987) and its focus has been limited to physical size as
the main attribute in selecting a meeting facility (Breiter & Milman, 2006). Meeting site
selection is not made by only one individual in associations’ site selection as there are other
factors that influence that process (Clark, Price, & Murrmann, 1996; Meetings and Conventions,
2006). The best way for meeting facilities to determine which feature to invest in and market
should be based on intimate knowledge of the factors that its clients value most in their choice
decision (Hinkin & Tracey, 1998; Crouch & Louviere, 2004b). While there is a need for
research to investigate site selection from an organizational buyer-behavior perspective (Crouch
& Louviere, 2004b; Fawzy & Samra, 2008), in practice, meeting planners’ final
recommendations highly influence a facility selection authority, often formed with a group of
people in an organization.
The majority of meeting professionals believe that the most significant change in the
meeting industry is in technology (ASAE, 2001). Both meeting planners and conference
3
attendees expect more technology to be installed in meeting venues (Lee & Park, 2002; Weber &
Ledkin, 2004) and technology is appearing as one criterion for choosing a meeting facility in
recent studies (Baloglu & Love, 2001; Comas & Moscardo, 2005; Weber & Ladkin, 2004).
Thus, many meeting facilities, from major convention centers to small conference venues, have
improved their technological infrastructure and features. Due to the high cost of installing and
updating new ICT-based features, such improvements should be based on accurate market needs
assessments to meet the demands of their customers. Some investment decisions and
development projects seem to be based on overly optimistic forecasts or simply “jumping-on-the
technology-band wagons,” not to be left behind by their competitors. Because technology
infrastructure development requires a massive investment, it should be based on research with
empirical evidence of the effects of such developments (Lee & Lee, 2006). Webber and Ladkin
(2004) added that meeting venues installing new technologies often do not provide efficient
technical support to their customers, the meeting planners. For example, only 41 percent of the
conference centers in the U.S. have a dedicated Information Technology (IT) manager to help
and provide services to their clients (IACC, 2004).
Despite the importance of understanding the impact of the availability of technology-
based features on selection/recommendation of a meeting facility, there is very limited research
on the impact of the ICT-based features on facility selection by its target market and the major
direct buyer, meeting planners. Furthermore, no study has systematically tested what other
factors—personal innovativeness in ICT, self-efficacy, result demonstrability, etc.—influence
meeting planners’ beliefs toward ICT-based features and service as a determinant of meeting
facility selection/recommendation.
.
4
1.3 Research Questions
This study aims to evaluate meeting planners’ perceived importance of ICT-based features
and service in meeting facility selection and to identify what factors influence meeting planners’
beliefs (perceived usefulness and perceived ease of use) and confidence in adopting ICT-based
features. The purpose of this study is three-fold: 1) to measure the magnitude of importance of
each ICT feature and service on a recommendation/selection of a facility; 2) to test relationships
among meeting planners’ beliefs toward ICT-based features and service in the context of a
conference center selection/recommendation; and 3) to investigate influences of the types of
meeting planners in the relationships between meeting planners’ perceived importance of the
availability of technical support, confidence, and beliefs toward ICT-based features and service.
This research will achieve these purposes by answering the following four research questions.
1. What types of ICT-based features are perceived as important in meeting planners’
selection/recommendation of a meeting facility, specifically a conference center?
2. How does the perceived importance of availability of technical support influence
meeting planners’ confidence in using/accepting the ICT-based features at conference
centers?
3. Do relationships exist among meeting planners’ beliefs toward ICT-based features,
including: perceived ease of use; perceived usefulness and other factors; personal
innovativeness of ICT (PIICT); result demonstrability; and self-efficacy in
recommendation/selection of a conference center?

5
4. Does the type of meeting planner influence the relationships of PIICT, self-efficacy,
and perceived ease of using ICT-based features in the context of
recommendation/selection of a conference center?
1.4 Theoretical Model and Background
Figure 1.1 presents the proposed research model explaining relationships among key
concepts reviewed through a literature search. The proposed model examines the research
questions which test the relationships between the concepts discussed in the preceding sections.
1.4.1 Technology Acceptance Theory: Technology Acceptance Model (TAM)
Understanding why people accept or reject technology has been one of the most critical
issues in many industries to provide better service and overcome challenges (Swanson, 1988).
One of the most widely recognized research efforts on factors determining the adoption of
technology-based service is the technology acceptance model (TAM) developed by Davis (1986,
1989). Davis developed TAM based on Ajzen and Fishbein’s (1980) applied theory about
reasoned action (TRA) to explain how beliefs influence attitudes, which leads to intentions and,
therefore, behaviors. Substantial theoretical and empirical studies have found that TAM belief-
attitude-intention-behavior relationships predict user acceptance of information technology (IT).
Davis (1989) further asserted that perceived usefulness and ease of use represent the beliefs that
lead to acceptance of IT systems. TAM has become well established as robust and powerful, and
especially parsimonious, which is an important element in the development of theory (Straub et
al., 1997; Venkatesh & Davis, 2000; Thomson et al., 2006). TAM is the base theory for this
research on meeting planners’ beliefs and their influence on acceptance of ICT-based features at
conference centers.

6
1.4.2 Self-Efficacy
The concept of self-efficacy was first presented by Bandura (1986) in human agency
studies. Self-efficacy is defined as people’s beliefs about their capabilities to produce
performances that influence events affecting their lives and confidence in using systems and
achieving desired results (Bandura, 1986, 1995). It is also defined as one’s ability to carry out a
behavior (Armitage & Conner, 1999). Bandura argued that self-perceptions of efficacy influence
thought patterns, actions, and emotional arousal. He also stated that people with a strong sense of
self-efficacy approach difficult tasks as challenges to be mastered, rather than as personal threats
to be avoided. In other words, the greater one’s self-efficacy, the more likely it is that one will
actually carry out an intended behavior of interest. Self-efficacy is concerned with internal
control factors that come from within the individual (such as ability and motivation) (Terry, 1993;
Terry & O’Leary, 1995). Their study has identified that self-efficacy positively influences
perceived ease of use.
Ajzen (1988) developed the theory of planned behaviors (TPB) that has explained
behavior intention by different factors: attitude to behavior; subjective norm; and perceived
behavioral control. However, Manstead et al. (2000) argued that self-efficacy predicts behavior
better than intentions and is more closely related to intentions than attitudes, subjective norms, or
perceived control (Manstead et al., 2000; Armitage & Conner, 1999). Terry and her colleagues
(Terry, 1993; Terry & O’Leary, 1995; White et al., 1994) also found that self-efficacy was
predictive of intentions.

7
Figure 1.1 Proposed Research Model
Result demonstrability
Self –efficacy
Perceived Importance of the availability of
technical support
Types of meeting planner
Perceived usefulness
Perceived ease of usePersonal
innovativeness of ICT

8
1.5 Boundaries of the Study
Clearly defined boundaries can validate the results of a study and they are necessary to
enhance the validity and reliability of a study (Bacharach, 1989). First, this study tests ICT-
based features that are provided by conference centers. The results of this study may not be
extended to other types of meeting facilities such as convention centers or convention hotels.
Second, selection of a meeting facilities addressed in this study is confined to the association,
corporate, and government meeting sectors. Fortin, Ritchie, and Arsenault (1976) found that
corporations and associations have significant differences in their motivations and processes for
selecting a host convention site. However, there is no such published study for the government
meeting sector. For this reason, the proposed model will be used and tested for these three
meeting markets.
Third, the results of this study are limited to the meeting planners who hosted or plan to
host their meetings at a conference center in North America. A number of studies (Chen, 2006)
focused on cross-cultural research support that meeting planners’ perceptions toward the
determinants of site selection differ according to their culture or environments. Yi, Jackson, Park
& Probst (2006) also supported that cultural and technological differences exist in different
countries in the context of technology. Therefore, the proposed model might not be valid for
international markets that operate within different cultures and technological infrastructures.
9
1.6 Definitions of Key Constructs
The definitions of the major constructs in this study are explained as follows:
1.6.1 Information and Communication Technology (ICT) -based Features and Technical Support
The Internet is exploited as a mechanism for information distribution and gathering. One
of its applications, e-mail, has become an effective tool for meeting and conference organizers in
marketing (Davison, Alford, & Seaton, 2002). Information and Communication Technology
(ICT) has been adopted to operate businesses more effectively, efficiently, and faster by adding
communication onto an existing term, IT (Davison et al., 2002). Therefore, the author defines
ICT-based features at meeting facilities as computing and communications equipment and
features that variously support a range of activities in meeting management.
However, there is no published list of standard ICT-based features in the context of the
meeting technology and conference center industry. Thus, the author has conducted a content
analysis of meeting facility marketing materials over a seven year period, including OMFG
(Official Meeting Facility Guide) and GAVEL (semi-annual meeting facility guide published by
Meetings and Conventions) to develop the list. The new list is finalized by adding several ICT-
based features offered by members of the International Association of Conference Centers
(IACC, 2007b).
1.6.2 Personal Innovativeness of Information and Communication Technology (PIICT)
The definition of PIICT is the willingness of an individual to try any new ICT and it is
adopted from the term Personal Innovativeness of Information Technology (PIIT) by modifying
IT to ICT for this study. PIIT was first defined and tested by Agarwal and Prasad (1997) as the

10
willingness of an individual to try any new IT and it is important to determine the outcomes of
user acceptance of technology.
1.6.3 Result Demonstrability
Rogers (1995) defined result demonstrability as the extent to which the tangible results of
using an innovation can be observable and communicable. Matthing, Kristensson, Gustafsson,
and Parasuraman (2006) argued that most customers would find it difficult to envision jargon
used to describe new technology and relate new technologies with applications. Users can
understand the advantages of using a new technology and its implication for their job when
tangible results of the technology are directly apparent (Yi et al., 2006).
1.6.4 Self-efficacy
Self-efficacy is defined as people’s beliefs about their capabilities to produce
performances that influence events affecting their lives (Bandura, 1986).
1.6.5 Perceived Usefulness
Davis (1986, 1989) defined perceived usefulness as the prospective user’s subjective
probability that using a specific application system will increase his or her job performance
within an organizational context.
1.6.6 Perceived Ease of Use
Perceived ease of use is defined as the degree to which the prospective user expects the
target system (technology) to be free from effort (Davis, 1986, 1989).
11
1.7 Organization of the Study
Chapter I presents an overview of the study, which includes the statement of the problem,
objective of the study, research questions, and boundaries of the study, theoretical background to
be used in the study, the definitions of major constructs, and the organization of the study.
Chapter II presents the summary of literature related to technology acceptance, meeting site
selection, and the organizational buying center. In addition, the review of related literature in
conference center industry and meeting planners’ profiles are provided and integrated in a way
that supports the hypotheses of this study.

12
Chapter II
REVIEW OF THE LITERATURE
2.1 Introduction
This chapter provides an overview of the Technology Acceptance Model (TAM)
developed by Davis (1986, 1989) and other extended, integrated theoretical models of
technology acceptance. This chapter also presents previous findings from studies of buying
decisions in the meeting/hospitality/tourism industries. In addition, meeting site/facility selection,
advances of technologies in the meeting industry, and characteristics of meeting planners are
provided. Lastly, the proposed research model and hypotheses are also presented in this chapter.
2.2 Theories of Technology Acceptance
Substantial theoretical progress and empirical support have accumulated and been
produced over the past years in explaining and predicting user acceptance of information
technology. In the following sections the key concepts and theories concerning technology
acceptance will be discussed.
2.2.1 Technology Acceptance Model (TAM) and Comparisons to Other Theories
The Technology Acceptance Model (TAM), one of the most widely recognized research
efforts on factors determining the acceptance of technology was developed by Davis (1986) and
is conceived to explain and predict an individual’s acceptance of information technology (IT).
TAM was derived from the Theory of Reasoned Action (TRA) model (Ajzen & Fishbein, 1980).
TRA is based on the assumption that human beings are rational and make systematic use of
information available to them before they decide to engage, or not to engage, in a given behavior;

13
it is designed to predict and understand what causes people to behave in particular ways (Ajzen
& Fishbein, 1980).
Two other constructs in TAM are (1) attitude towards use and (2) behavioral intentions,
which originated from TRA. Attitude towards use is the user’s evaluation of the desirability of
employing a particular information systems application. Behavioral intention to use is a measure
of the likelihood a person will employ the application and it leads to actual system use (Ajzen &
Fishbein, 1980). . Davis (1989) further asserted that perceived usefulness and ease of use
represent the beliefs that lead to such acceptance. Perceived usefulness is the degree to which a
person believes a particular information system would enhance his or her job performance.
Perceived ease of use is the degree to which a person believes that using a particular system
would be effortless (Davis, 1986). User’s beliefs—perceived usefulness and perceived ease of
use—determine their attitudes toward using the system. Behavioral intention to use is determined
by these attitudes toward using the system.
TAM studies have been made in various technology fields: electronic and voice mail
(Adams et al., 1992), transactional web sites (Aladwani, 2002), groupware (Plouffe,
Vandenbosch & Hulland, 2000), electronic payment systems (Plouffe et al., 2001), Internet
(Vanucci & Kertestte, 2001; Breiter & Gregory, 2004), and marketing decision-making support
systems (MDSS) (Wöber & Gretzel, 2000). Figure 2.1 presents the basic conceptual model of
TAM by Davis (1986, 1989).

14
Figure 2.1 Diagram of TAM
Both TAM and TRA models were found to predict intentions and usage satisfactorily.
However, TAM has become well established as a robust, powerful, and parsimonious model for
predicting user acceptance (Venkatesh & Davis, 2000). TAM attitudinal determinants
outperformed TRAs with a much larger set of measures (Igbaria et al., 1997). Davis (1989) and
Davis, Bagozzi, and Warshaw (1989) used regression analysis to determine the relationships in
TAM. Hendrickson and Collins (1996) tested alternative structural models of the TAM
instrument and provided support for a full causal model. Substantial theoretical and empirical
research has proved that the TAM is a significant parsimonious model for extensive study and
allows for exploration of the influences on adoption and usage decisions in extensive levels
(Venkatesh & Davis, 2000). As the relationship between perceived usefulness and actual usage
has been empirically examined, a better understanding of these determinants resulted in more
efficient efforts to increase user acceptance and actual use of technology.
Other widely used theoretical paradigms in understanding user acceptance of technology
include the innovation diffusion theory (IDT) (Rogers, 1995) and theory of planned behavior
(TPB) (Ajzen, 1985). IDT views innovation diffusion as a particular type of communication
Perceived ease of use
Perceived usefulness of use
Attitude to use
UsageIntention to use

15
process in which the message about a new idea is passed from one member to another in a social
system (see Figure 2.2). This theory has been used to study various innovations ranging from
medicine, engineering, and airline reservation information systems (Sonnenwald, Maglaughlin &
Whitton, 2001).
Figure 2.2 Innovation of Diffusion Theory Model
Source: Rogers (1995)
Yi et al. (2006) argued that TAM and IDT have similarity and compared them by
matching categories (Table 2.1). If technology can be thought of as a specific innovation, both
IDT and TAM share the view that the perceived positive attitude that is a direct determinant of
intention of behavior in interest is determined by internal knowledge and external support and
training. They reported that TAM and IDT partially reconfirm each other’s findings.
Knowledge Persuasion
Adoption
Implementation Decision
Rejection
Confirmation
16
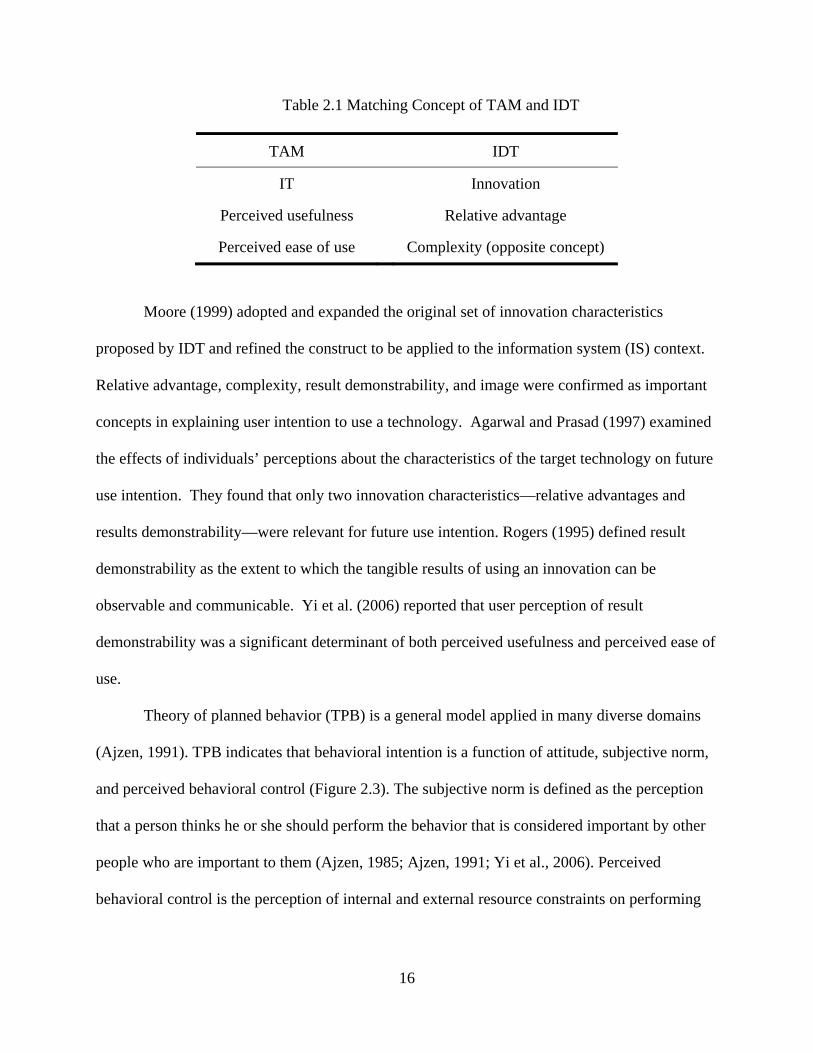
Table 2.1 Matching Concept of TAM and IDT
TAM IDT
IT Innovation
Perceived usefulness Relative advantage
Perceived ease of use Complexity (opposite concept)
Moore (1999) adopted and expanded the original set of innovation characteristics
proposed by IDT and refined the construct to be applied to the information system (IS) context.
Relative advantage, complexity, result demonstrability, and image were confirmed as important
concepts in explaining user intention to use a technology. Agarwal and Prasad (1997) examined
the effects of individuals’ perceptions about the characteristics of the target technology on future
use intention. They found that only two innovation characteristics—relative advantages and
results demonstrability—were relevant for future use intention. Rogers (1995) defined result
demonstrability as the extent to which the tangible results of using an innovation can be
observable and communicable. Yi et al. (2006) reported that user perception of result
demonstrability was a significant determinant of both perceived usefulness and perceived ease of
use.
Theory of planned behavior (TPB) is a general model applied in many diverse domains
(Ajzen, 1991). TPB indicates that behavioral intention is a function of attitude, subjective norm,
and perceived behavioral control (Figure 2.3). The subjective norm is defined as the perception
that a person thinks he or she should perform the behavior that is considered important by other
people who are important to them (Ajzen, 1985; Ajzen, 1991; Yi et al., 2006). Perceived
behavioral control is the perception of internal and external resource constraints on performing

17
the behavior. This theory has been widely applied to a diverse set of technologies in the IS
context (Leonard, 2004; Taylor & Todd, 1995a).
Figure 2.3 Model of the Theory of Planned Behavior (TPB)
2.2.2 Extended Models of TAM: TAM2 and Others
Researchers argued that a more holistic assessment of technology adoption is necessary,
to avoid a narrower understanding of the acceptance and not recognizing the other factors
involved (Agarwal & Karahanna, 2000; Plouffe et al., 2001). Legris et al. (2003) concluded that
TAM was a useful model, but included human and social change process variables such as
subjective norm. Subjective norm is defined as an individual's perception of whether people
important to the individual think a behavior should or should not be performed (Fishbein &
Ajzen, 1975). They asserted that the subjective norm has an impact on behavioral intention along
with the attitude towards the action in theory of reasoned action (TRA). In the original TAM by
Davis (1989), the subjective norm was not included due to its unclear relationship. External
Subjective Norm
Perceived Behavioral control
Attitude toward the behavior
Intension Behavior

18
variables that affected intention to use in previous TAM research are social influence or social
presence (Straub et al., 1995; Venkatesh & Davis, 2000). Venkatesh and Davis (2000)
hypothesized that subjective norm influenced both perceived usefulness and intention in TAM2.
Schepers and Wetzels (2007) argued that people often choose to perform an action when one or
more important referents say they should, though they do not like or believe in it. As humans
often interpret information from important others as evidence about reality, the subjective norm
also influences technology acceptance through perceived usefulness, and the internalization
effect. However, it is very important to note that subjective norm has significant influence on
perceived usefulness and intention only when the usage is mandatory, while its influence is
insignificant when use of technology is optional (Vekatesh & Davis, 2000).
TAM2 dropped “attitude” from TAM because it was found to only partially mediate the
effects of perceived usefulness and perceived ease of use on behavioral intention. TAM2 also
included “experience” by using longitudinal data; however, this definition of experience was
limited to previous usage of the same specific information system. The TAM2 has been applied
and tested in several other investigations and was strongly supported by longitudinal data
collected from four different systems in four organizations (Saade, Bahli, & Vekatesh, 2005;
Venkatesh & Davis, 2000).
Prior research on technology acceptance and information system implementation
demonstrated that various external variables influenced technology acceptance. Examples of
external variables included in previous TAM research that affected ease of use and perceived
usefulness are computer self-efficacy (Fenech, 1998), computer self-efficacy and computer
experience (Igbaria & Iivari, 1995), intrinsic involvement and prior use (Jackson, Chow, &
Leitch, 1997), and perceived utilities and perceived ease of adoption (Phillips, Calantone, & Lee,
19
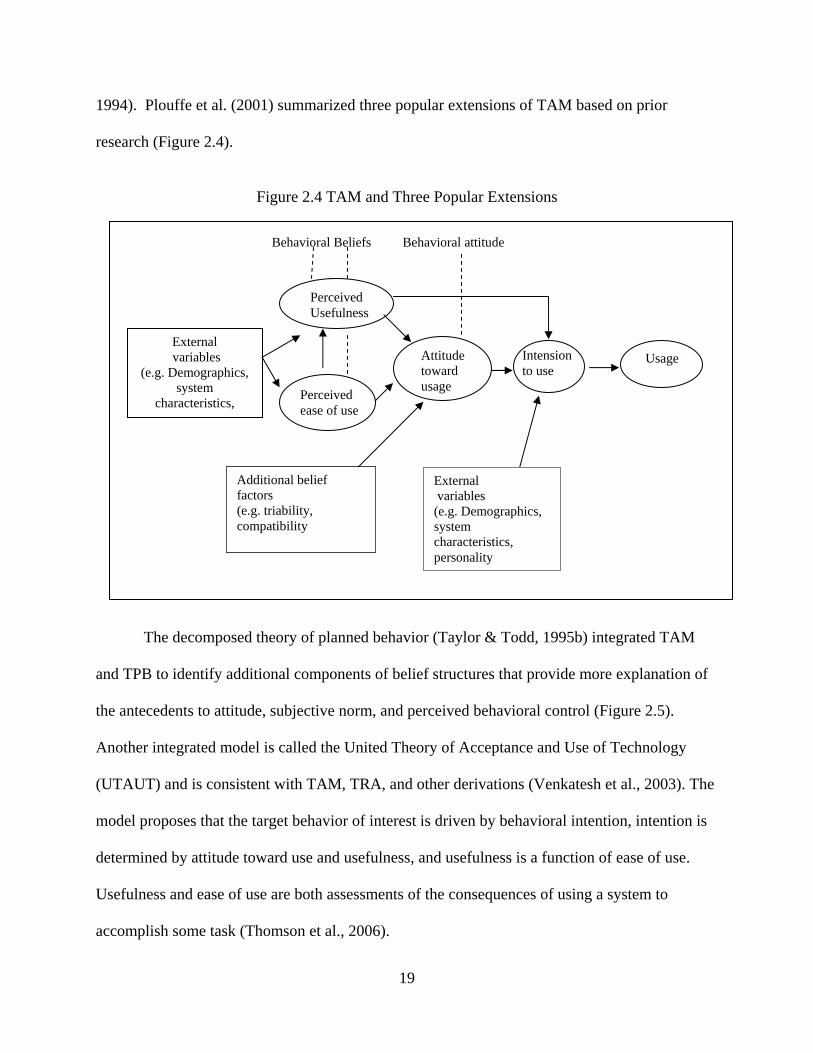
1994). Plouffe et al. (2001) summarized three popular extensions of TAM based on prior
research (Figure 2.4).
Figure 2.4 TAM and Three Popular Extensions
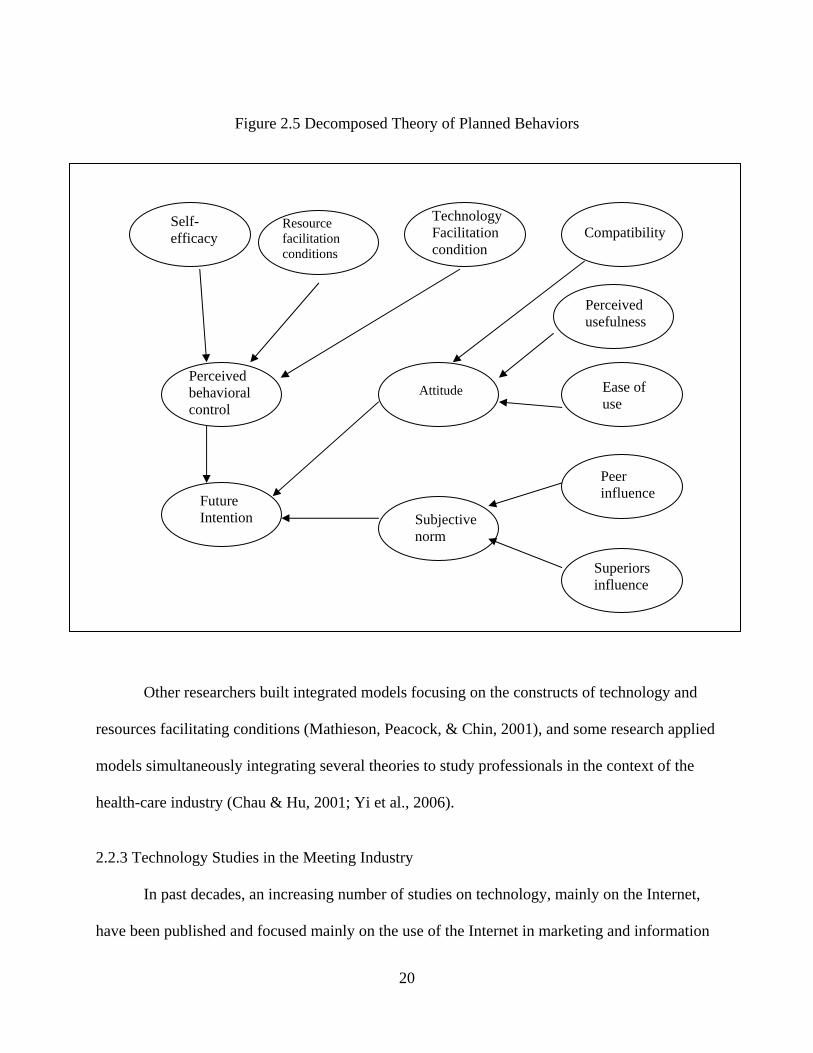
The decomposed theory of planned behavior (Taylor & Todd, 1995b) integrated TAM
and TPB to identify additional components of belief structures that provide more explanation of
the antecedents to attitude, subjective norm, and perceived behavioral control (Figure 2.5).
Another integrated model is called the United Theory of Acceptance and Use of Technology
(UTAUT) and is consistent with TAM, TRA, and other derivations (Venkatesh et al., 2003). The
model proposes that the target behavior of interest is driven by behavioral intention, intention is
determined by attitude toward use and usefulness, and usefulness is a function of ease of use.
Usefulness and ease of use are both assessments of the consequences of using a system to
accomplish some task (Thomson et al., 2006).
Additional belief factors (e.g. triability, compatibility
Intension to use
Perceived ease of use
Behavioral Beliefs Behavioral attitude
External variables
(e.g. Demographics, system
characteristics,
Attitude toward usage
Usage
External variables (e.g. Demographics, system characteristics, personality
Perceived Usefulness
20
Figure 2.5 Decomposed Theory of Planned Behaviors
Other researchers built integrated models focusing on the constructs of technology and
resources facilitating conditions (Mathieson, Peacock, & Chin, 2001), and some research applied
models simultaneously integrating several theories to study professionals in the context of the
health-care industry (Chau & Hu, 2001; Yi et al., 2006).
2.2.3 Technology Studies in the Meeting Industry
In past decades, an increasing number of studies on technology, mainly on the Internet,
have been published and focused mainly on the use of the Internet in marketing and information
Superiors influence
Future Intention
Perceived behavioral control
Self- efficacy
Resource facilitation conditions
Technology Facilitation condition
Compatibility
Perceived usefulness
Ease of use
Peer influence
Subjective norm
Attitude
21
searches in the meeting industry (Cheung & Law, 2002; Davison et al., 2002; Digance, 2002;
Fein 1983; Jones & Brewer, 2001; Marie et al., 2000; Mistilis & Dwyer, 1999; West & Upchurch,
2001; Yuan et al., 2003). As seen in Table 2.2, almost half of the technology studies are
conceptual-qualitative studies and the empirical studies are non theory-based studies simply
using descriptive statistics (frequency, mean, and standard deviation). Even though conceptual
studies using qualitative methods can contribute to the advancement of knowledge and theory if
they are effectively designed and analyzed (Baloglu & Assante, 1999), there are concerns
pertaining to reliability and external validity in qualitative studies. As Bacharach (1989) stated,
significant dedication to the body of knowledge can be built based on a sound theory.

22
Table 2.2 Non Theory-Based Technology Studies in the Meeting Industry
Author(s) Title Nature of
research
Yuan, Gretzel, & Fesenmaier (2003) Internet technology use by American Convention and Visitors
Bureaus
Empirical
Cheung & Law (2002) Virtual MICE promotion: A comparison of the official Web sites in Hong Kong and Singapore
Empirical
West & Upchurch (2001)
Conference participants’ acceptance of the Internet as an information and registration tool
Empirical
Davison, Alford, & Seaton (2002) The use of information and communication technology by European meetings, incentives, conferences, and exhibitions (MICE) sectors
Empirical
Jones & Brewer (2001)
The future of the meeting, incentive, convention, and exhibition (MICE) industry buyer-seller relationship: High tech or high touch?
Conceptual
Marie, Kasavana, & Knutson (2000)
Smart card: Meet smart meeting planner Conceptual
Mistilis & Dwyer (1999)
Information technology and service standard in MICE tourism Conceptual
Wolf & Boger (2001).
Investigating rate integrity in convention cities: Comparing central reservation and Internet rates.
Empirical
Digance (2002) Use of the World Wide Web in marketing Australian dedicated-convention centers
Conceptual
Fein (1983) Teleconferencing and its effects on business travel Conceptual
23
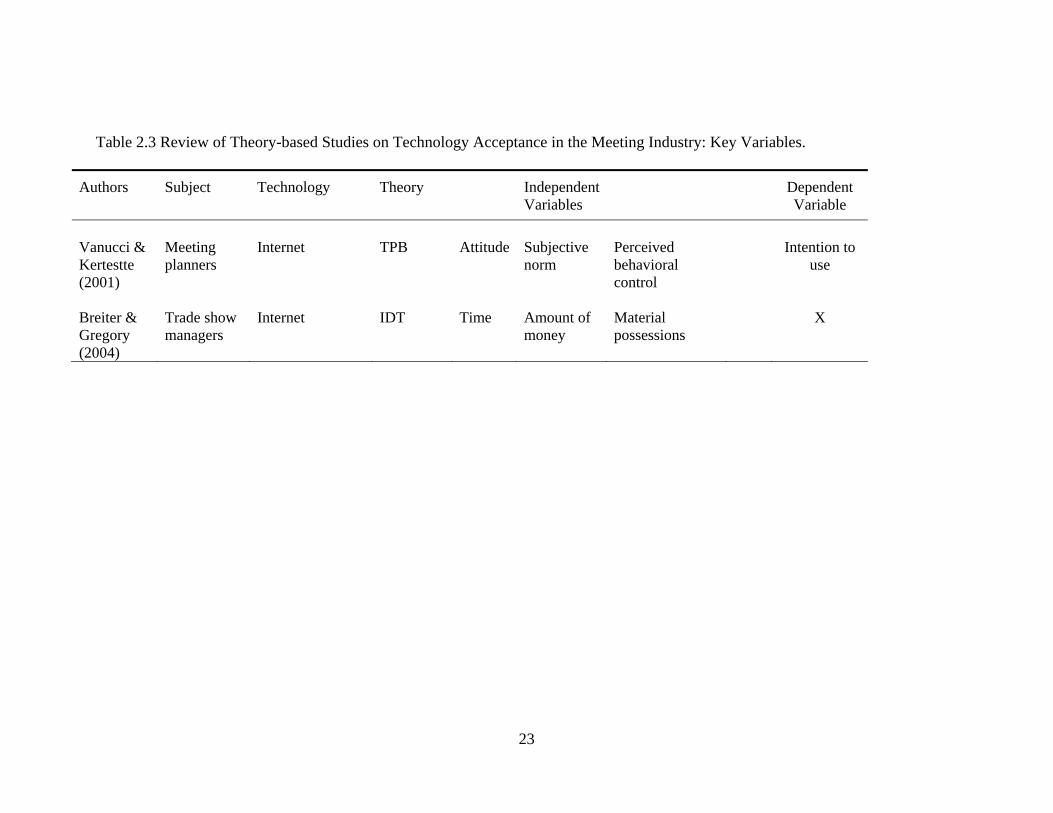
Table 2.3 Review of Theory-based Studies on Technology Acceptance in the Meeting Industry: Key Variables.
Authors Subject Technology Theory Independent Variables
Dependent Variable
Vanucci & Kertestte (2001)
Meeting planners
Internet
TPB
Attitude
Subjective norm
Perceived behavioral control
Intention to
use
Breiter & Gregory (2004)
Trade show managers
Internet
IDT
Time
Amount of money
Material possessions
X

24
Quantitative research in the meeting industry may also be more rigorously conducted
based on theories, identifying generalized patterns, and thus can make more accurate predictions
(Lee & Back, 2005). A few theory-based studies on the ICT in the meeting industry can be found
to date (see Table 2.3). In a study of meeting planners’ use of the Internet to plan group meetings,
Vanucci and Kerstetter (2001) found that the theory of planned behavior is effective to predict
the intention of using the Internet and concluded that planners’ attitude, belief about norms, and
perceived behavioral control were found to be significantly related to their intention. They
adopted Hoffman and Novak’s (1996) modified TPB, which was expanded by including thirteen
categories in the original three dimensions. Perceived behavioral control is believed to have the
strongest influence on intention to use and this dimension includes ease of use, ease of access,
price, knowledge, skill, and past experience (Hoffmann & Novak, 1996). Frew (2000) presented
perspective and direction of ICT research in the travel and tourism domain. Those results gained
from studies in the tourism and travel research can be applied to this study, but only to a certain
extent, because the meeting facility selection involves a special buying system—the multi-person
involved buying center.
2.2.4 Self-efficac
The concept of self-efficacy was first proposed by Bandura (1977) in the study of human
agency. Self-efficacy is defined as peoples’ beliefs about their capabilities to produce
performances that influence events affecting their lives and confidence in using a system in
achieving desired goals (Bandura, 1986, 1995; Marakas, Yi, & Johnson, 1998). It is also defined
as one’s ability to carry out a behavior (Armitage and Conner, 1999). Taylor and Todd (1995a)
reported self-efficacy as a determinant of perceived behavioral control that is defined as an

25
individual’s belief about the presence or absence of required sources and opportunities necessary
to perform certain behaviors (Ajzen & Madden 1986). However, there is a reasonably consistent
body of evidence suggesting that self efficacy is more important as a predictor of behavioral
intentions than are measures of other control-related constructs (Baundra, 1985; Terry, 1993;
Terry & O’Leary, 1995; White et al., 1994; Manstead & Van Eekelen, 1998). Baundura (1977)
argued that self-percepts of efficacy influence thought patterns, actions, and emotional arousal. A
causal test revealed that the higher the level of self-efficacy, the higher the performance
accomplishments and the lower the emotional arousal. He also stated that people with a strong
sense of self-efficacy approach difficult tasks as challenges to be mastered, rather than as
personal threats to be avoided. In other words, the greater one’s self-efficacy, the more likely it is
that one will actually carry out an intended behavior. Self-efficacy predicts behavior better than
intentions (Armitage & Conner, 1999).
Agarwal, Sambamurthy, and Stair (2000) theorized that self-perceptions of efficacy in the
task domain of computing were strongly influenced by the extent to which individuals believe
they were personally innovative with respect to IT (PIIT). The authors also proposed a broad
framework and examined the simultaneous effects of those influences on perceptions of
usefulness and ease of use and found out that self-efficacy positively influences only ease of use
in the context of IT. It is consistent with the findings by Manstead and Van Eekelen (1998). They
argued that perceptions of how easy or difficult it is to achieve the target behavior is the
definition of ease of use highly related to self-efficacy.

26
2.3 Convention Site Selection vs. Facility Selection
Comas and Moscardo (2005) argued that a critical question for businesses involved in
destination marketing and the provision of services for conferences and meetings is how
organizations decide where to hold their conferences and meetings. The “where” question poses
two primary concerns: (1) a convention site’s environment addressing a city’s capacity to host
the meeting, and (2) the meeting facilities where most of meeting functions are held (Go & Zang,
1997). The term “site” has been interchangeably used with several other terms in studies of the
determinants of selection. They are: convention site, meeting destination, meeting site,
associations’ site, convention destination, and convention location (see Table 2.4).

27
Table 2.4 Terms Used in Titles in Site Selection Studies
Authors Terms Used In Title Determinant of Selection
Fortin et al .(1976) Convention site Hotel service, air access, hotel rooms, conference rooms, price levels, hospitality, restaurant facilities, personal safety, local interest, geographic location, hotel info/assistance, local availability, tourism features, transport facilities, previous experiences
ASAE (1987)
Meeting location Quality of service, meeting room facilities, overall affordability, sleeping room facilities, location image, dining/entertainment, air transportation, exhibit facilities, highway accessibility, only one, recreational facilities, climate
Bonn et al. (1994) Site Numbers of meetings planned in the same site, facilities, services, and recreational factor
Oppermann (1994) Convention location
Oppermann (1996a) Convention destination
Empirical
Oppermann (1996b) Convention cities N/A
Clark & McCleary (1995)
Associations’ Site N/A
Clark et al. (1996) Association Convention Site
Power in committee
Crouch & Richie (1998)
Crouch & Louviere ( 2004a)
Convention site Accessibility, local support, extra-conference activities, accommodation facilities, meeting facilities, information, site environment, other criteria
Chacko & Fenich (2000) Convention destination
N/A
Baloglu & Love (2001) Convention cities N/A
28
Association-sponsored events accounted for two-thirds of the direct spending in the
meeting industry. The income from an association’s annual convention comprise one-third of
non-membership revenue (excluding association membership fee income) of an association
(ASAE, 2003). Due to the importance and impact of associations’ convention, understanding an
association’s site decision-making process becomes very important to destinations and meeting
facilities that want to promote themselves best. Consequently, a number of studies on
determinants of convention site selection (Crouch & Richie, 1998) and the decision-making
process (Bonn & Boyd, 1992; Oppermann, 1996a, 1996b; Fawzy & Samra, 2008) were
conducted. As Crouch and Richie (1998) summarized, sixty four previous studies on convention
site selection involved many determinants, and a destination is selected as a sum of its perception
by the associations as being interesting, exotic, safe, accessible, and accepting of all types of
delegates (Jago & Deery, 2003). Crouch and Louvier (2004a) argued that, although
characteristics of a meeting facility including physical site attributes are particularly important, a
broad range of other factors should be offered for a host site of annual conventions to be
attractive.
Although destination selection criteria have been intensively studied, the majority of
studies lack conceptual and empirical support (Baloglu & Love, 2001). It should also be noted
that a majority of studies in site selection focused exclusively on the North American market and
associations’ annual conventions. In addition, most studies were undertaken in large cities and
with international associations (Jago & Deery, 2003; Oppermann & Chon, 1997).
There were some attempts to find differences in selection factors between associations of
various sizes, diverse backgrounds, or over different scopes (i.e. regional, state, national, and
international) (Opperman, 1996a). Choi and Boger, Jr. (2002) found that site selection factors
29
for U.S. state associations varied by association size, age, and budget. Comas and Mocardo
(2005) argued that a meeting venue is a very important attribute regarding the decision of a host
destination and the most important attribute particularly for those conferences based around
business functions. While most studies of convention site selection did not specify which type of
meeting facilities were considered, some researchers focused on the determinants of specific
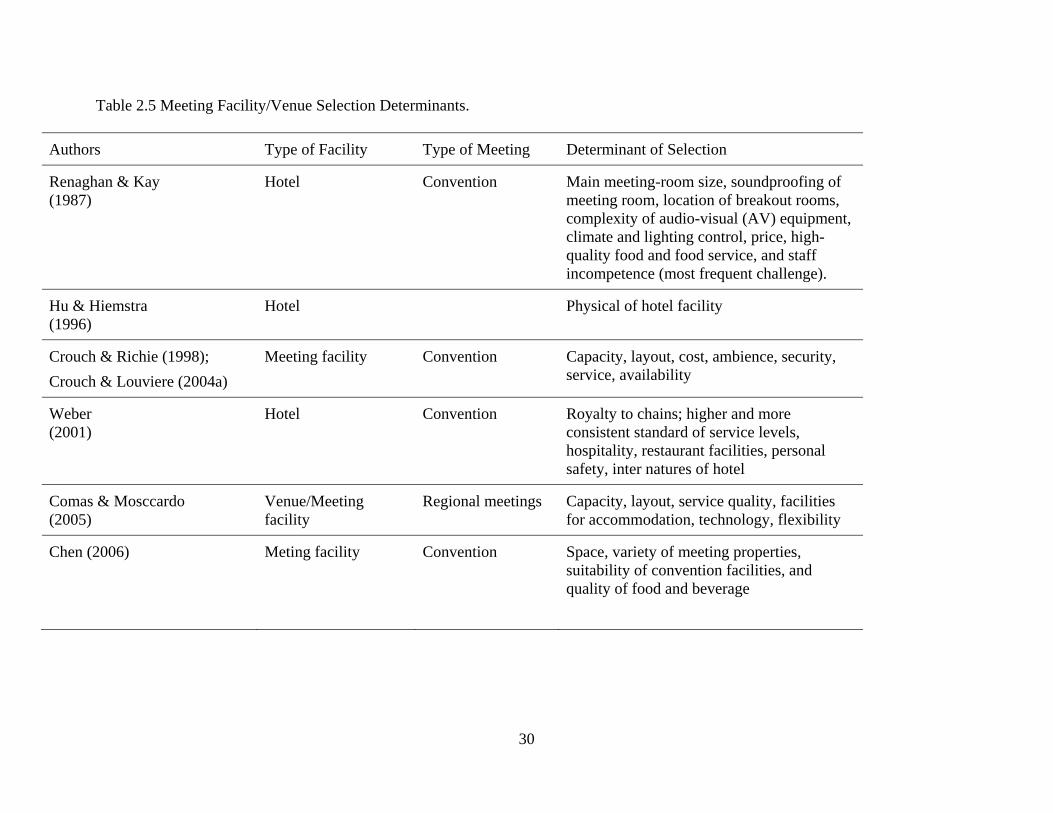
types of meeting facilities. Table 2.5 presents the list of studies that identify meeting planners’
facility selection determinants for different types of meeting facilities. Most studies listed two
major areas: physical features and food and beverage. The former includes size, layout, lighting
and temperature control, and the latter includes quality of food and beverage. Not surprisingly,
the cost of a meeting facility is one major factor, same as in many other business buying
decisions (Jago & Deery, 2003).
30
Table 2.5 Meeting Facility/Venue Selection Determinants.
Authors Type of Facility Type of Meeting Determinant of Selection
Renaghan & Kay (1987)
Hotel Convention Main meeting-room size, soundproofing of meeting room, location of breakout rooms, complexity of audio-visual (AV) equipment, climate and lighting control, price, high-quality food and food service, and staff incompetence (most frequent challenge).
Hu & Hiemstra (1996)
Hotel Physical of hotel facility
Crouch & Richie (1998);
Crouch & Louviere (2004a)
Meeting facility Convention Capacity, layout, cost, ambience, security, service, availability
Weber (2001)
Hotel Convention Royalty to chains; higher and more consistent standard of service levels, hospitality, restaurant facilities, personal safety, inter natures of hotel
Comas & Mosccardo (2005)
Venue/Meeting facility
Regional meetings Capacity, layout, service quality, facilities for accommodation, technology, flexibility
Chen (2006) Meting facility Convention Space, variety of meeting properties, suitability of convention facilities, and quality of food and beverage

31
Attendees’ expectations of a large convention center are overall cleanliness, a well-
maintained facility, helpfulness of guest services personnel, directional signage within the
convention center, availability of high-quality lodging near the convention center, sufficient
restrooms throughout the facility, and ability to get a cell phone signal (Breiter & Milman, 2006).
The meeting attendees expect quality of service, physical appeal, availability of facilities, and
standard food and beverage from a resort conference hotel (Lawrence & McaCabe, 2001).
2.4 Technology as a New Emerging Determinant of Facility Selection
Most of the earlier studies did not include technology as a determinant of site selection
(Crouch & Richie, 1998; Hu & Hiemstra, 1996; Renaghan & Kay, 1987). Only basic audio and
video equipment were listed as selection attributes of a meeting facility (Crouch & Louviere,
2004a; Jago & Deery, 2003). The Official Meeting Planners Facility Guide (OMFG), a semi-
annual publication of meeting facilities’ specifications in the U.S. and Canada, included the
following categories of specifications: number of sleeping rooms; number of meeting rooms;
capacity of the largest room; total exhibit space (sq. ft.); location/ transportation;
accommodations; dining/entertainment; services/facilities/shops; recreational/amusement
facilities; rates; size of meeting rooms; meeting facilities; and audio visual equipment and
services. However, it is not known whether this is due to their insignificance in selection or lack
of available information and knowledge of technology.
Recent studies started including technology as a determinant of meeting facility selection
(Baloglu & Love, 2001; Jago & Derry, 2003). Internet and personal telecommunication
equipment, the two main functions of ICT-based applications, have gained more attention and
importance in the meeting industry from both attendees and planners. The OMFG added a new

32
category in 2003: “Information Technology equipment and services,” which was separated from
the previously existing traditional category, “Audio/visual equipment and services.”
Comas and Moscardo (2005) argued that technology is a key determinant of facility
selection, particularly for those conferences which are based on business functions. Jago and
Deery (2003) argued that there is a rapid growth in the need for Internet access for both attendees
and planners. They want to be linked to their businesses, family, and friends while they are away
from the office and home. Bartlett (2007) reported that wireless fidelity (Wi-Fi) was perceived as
a necessity for attendees, and their technological service expectation was demanding. While this
additional feature may increase the price paid for the meeting facility, all meeting planners
agreed that lower budget venues without the service invariably presented too many problems and
should be avoided (ASAE, 2005). Meeting planners increasingly demand value for their budget
spending on a facility and want to offer their attendees the best possible features, including
technology (Bartlett, 2007). However, there is little research on how much and what specific
type of technology impacts the meeting planners’ selection of a meeting facility.
2.5 ICT in the Tourism, Hospitality, and Conference Center Industry
The increasing intensity of competition has led organizations to search for more efficient
and effective ways of managing their businesses. Zeithaml, Parasuramann, and Berry (1991)
reported that technology is a tool to improve service and a means of adding value to the
user/customer. A combination of computer, telecommunications, and Internet technology, which
comprises ICT, is now being widely used for a variety of service delivery purposes (Walker &
Johnson, 2006). Many organizations in the tourism and hospitality industry, such as Marriott,
Hilton, Southwest Airlines, and online travel distributors, have turned to ICT to improve various
33
areas of their business, including marketing, employee training, and sales. Investments in ICT
have substantially increased over the last decade.
Connolly et al. (2007) argued that IT adoption in the groups and meetings area are behind
other travel industry sectors, but this is expected to be change. They listed hosting of competitive
activities, new market entrants, advances in technology, and technology standards within the
industry as the driving factors for such transformation. Davison et al. (2002) predicted that
progress in ICT would continue to evolve at a rapid pace, offering considerable potential and
actual benefits to suppliers, buyers, and intermediaries. They presented the use of ICT by the
Meetings, Incentives, Conferences, and Exhibitions (MICE) industry. However, their study
focused exclusively on the European market and was limited to several applications of ICT
(Internet, Web site, and teleconferencing), using simple descriptive (frequency) analysis. A
number of conference centers have installed satellite-linked video conferencing equipment for
the purpose of presenting keynote speakers who are unable to attend in person (Davison et al.,
2002). However, their study focused exclusively on the European market, mainly the United
Kingdom; hence it has limited application to the U.S market.
Much of the research into Internet usage in the hospitality and tourism industry has been
from the perspective of hospitality and tourism marketing aspects (Gregory, Kline, & Breiter,
2005). The level of Internet usage for marketing of meetings varies considerably between
corporate and association meeting sectors. While only 19% of corporate meeting planners market
their events through the Internet, nearly 60 % of association planners do (Meetings &
Conventions, 2006). With associations’ members spread across the country, more use of the
Internet for marketing in the association sector is expected (Davison et al., 2002). Contrary to the
use of Internet for marketing, easy use of the web was of increasing importance to corporate
34
meeting planners (58%) when choosing a meeting facility. Only 36% (for conventions) and 30%
(for other than conventions) of association meeting planners indicated it is important (Meetings
& Conventions, 2006). Having meeting rooms with multiple high-speed phone lines and
computer outlets was very important for 52% of the respondents in this study, while 30% (for
conventions) and 25% (for other than conventions) of association planners considered it
important when choosing a meeting facility. Most notable the percentage of meeting planners
who stated the availabilities of those technologies as important in facility selection are
consistently up from the results of a 2004 report on both corporate and association meeting
planners.
Gregory and Breiter (2001) studied a different segment—trade show managers and their
use of technology—and reported that they relied on the Internet and increased their usage of the
web in trade show management. Hotels have installed video conferencing technology to enhance
their overall product by observing the potential of the technology. Siguaw, Enz, and
Namasivayam (2000) examined the utilization of information technology-based applications in
all hotel sectors that include convention centers, conference centers, and convention hotels. Their
study identified a list of technology features adopted by U.S. hotels and categorized them into
the following three groups based on their main usage priorities:
Employee productivity: voice mail, interactive television guides, and management e-
mail systems.
Revenue enhancement: teleconferencing services, cell phone rentals, ATMs, and
Internet reservations.
Guest services: in-room Internet access, in-room fax machines, and in-room modems.
35
The findings suggest that the U.S. lodging industry has employed more technologies that
improve employee productivity and enhance revenue. The hotel sector, lodging type,
size/complexity of the property, and independent versus chain affiliation also influenced the
number and type of technologies adopted. This finding is consistent with Kelner et al. (1999)
who suggested the differences in focus of these strategic priorities were found in technological
adoptions across types of properties. Among convention hotels, casino properties, and
conference centers, convention hotels utilize most technologies in all three categories followed
by casino properties and conference center (Siguaw et al., 2000).
Casanova et al. (2005) presented that challenges in using a technology can be caused by
interpersonal and structural constraints. In terms of structural constraints, organizations may not
be able to provide the resources that planners need to utilize technologies (Casanova et al., 2005).
Attwel (1992) and Buharis (1997) found that small- and medium-sized organizations are often
limited in terms of in-house technology expertise which influences the use of information
technology.
However, there are few studies on acceptance and usage of other types of technologies
and their influence on meeting planners’ facility selection. Most of the earlier facility selection
studies did not include technology services, specifically ICT-based features, in their lists of
selection criteria, but it is not known whether that was due to its insignificance or lack of
information.
2.6 The Conference Center Industry
As this study focused on the determinants of conference center selection related to ICT-
based features, it is important to understand the nature of conference centers. While there is some

36
confusion and interchangeable use of the terms “conference center” and “convention center,”
they are different entities (Eisenstodt, 1999). Based on literature reviews, Table 2.6 presents
definitions of each term developed by scholars and meeting industry professionals. The most
distinct differences between them are that (1) a convention center is required to have a
designated large exhibition space along with a meeting space; (2) many conference centers are
located in suburban areas with resort-like settings, while convention centers are located in
downtown areas with public transportation access; and (3) most convention centers are under a
city’s authority, which makes them public infrastructure (Fenich, 2000), while conference
centers are owned by an individual or corporation.
The International Association of Conference Centers’ (IACC) has over 200 North
American sites as members, ranging from upscale resort conference centers, university
conference facilities, to day centers without accommodations.
PKF Consulting and the IACC forecasted growth for North American conference centers
through 2003 and into 2004 in their 2004 report (PKT Consulting & IACC, 2004). Apparently,
meeting planners in high-demand regions experience relative lack of conference centers and less
flexibility on meeting dates; overall demand has continued to grow and booking lead times
continued to be shortened to as short as 30 days. Repeat customers, followed by referrals and
personal sales calls, were ranked as the most productive sources for qualified leads.

37
Table 2.6 Definition of Convention and Conference
Author Conference center Convention center
Lane & Dupre, 1997
Close proximity to a city or to a resort area
N/A
Eisenstodt, 1999 Chon & Sparrowe, 2000
Facility designed especially to accommodate meeting and conference business Typically located in suburban areas and designed to provide a setting with free of distraction
N/A
Goldblatt & Nelson, 2001
N/A
A facility for events and expositions, without sleeping room. (p.47)
Convention Industry Council, 2004
A facility that provides a dedicated environment for events, especially small events. May be certified by the International Association of Conference Centers (IACC)
Facility that combines an exhibition space with a substantial number of smaller event spaces. The purpose of these buildings is to host trade shows, public shows, conventions, large food functions and other functions related to the convention industry. They may be purpose built or converted and municipally or privately owned.
International Association of Conference Centers, 2007
Universal criteria requires all certified properties to include a professional staff, a business center, and rules covering acoustics, lighting, furnishings and equipment, extending to ergonomic chairs, non-glare tables, hard writing surfaces and tractable wall surfaces. A minimum of 60 percent of event space must be dedicated purely to meetings.
N/A

38
The four major types of conference centers are: executive; hotel; resort; and university
conference centers (IACC, 2004). An executive conference center is compared to full-service
hotels when comparing a resort conference center to a resort hotel. Although structurally
different, they are all certified by IACC and adhere to its standards. Its member properties must
offer the complete meeting package (CMP), which includes three meals and lodging (except for
day centers), meeting space, conference services, continuous refreshment breaks, 24-hour
meeting room access, and basic A/V equipment (IACC, 2007b). Therefore, it is important to
analyze total revenue on a per-occupied-room basis (RevPOR), as opposed to just room revenue
(RevPAR) which is conventionally the primary measure at traditional transient hotels. In 2007,
the average RevPOR for the conference centers in the PFK/IACC survey was $354.27, a 3.1%
increase over the RevPOR achieved in 2006. Resort conference centers achieved the highest
RevPOR in 2007 at $432.87. For reference purposes, all the resort hotels in PKF’s Trends in the
Hotel Industry averaged a RevPOR of $413.32 in 2007 (PKF Consulting & IACC, 2007). The
executive conference centers led all conference center types with an average annual occupancy
of 73.7%.
Conference business comprises the largest demand segment for conference centers. In
2007, conferences accounted for 70.2% of all occupancy room nights, followed by leisure
travelers (13.7%), individual business travelers (12.5%), and other transient guests (3.6%).
Business organizations comprise the largest source of demand for conference centers (54.4 % of
rooms occupied), followed by academic institutions (12.7%), and trade associations (8.4%).
Table 2.7 presents the sources of demand for conference centers in North America.

39
Table 2.7 Demands by Type of Organizations for North American Conference Centers
Demand Source Percentage of Meetings
Business Organizations 54.4%
Academic Institutions 12.7%
Trade Associations 8.4%
Professional Organizations 3.2%
Government Organizations 2.5%
In-house 16.6%
Other 2.2%
Total 100.0%
Source: PKF Consulting/IACC 2004
Business meetings generally have two purposes: training; and management development.
The training meetings require a meeting space that offers a highly productive environment,
which is found in a conference center. “Training/continuing education” is the number one
demand (51.9%), followed by “management planning” (25.6%), and “professional/technical
meetings” (9.2%). These three types of meetings comprise total 86.7% of all types of meetings
that were held in 2007 at IACC certified conference centers in North America (Arnold, 2008).
The local market continues to be the greatest source of meetings for executive, resort, and
college/university conference centers. Only business meetings being held at conference centers
among all types of meetings tend to be national in scope. In general, proximity (distance to a
meeting facility) and quality and size of accommodations are considered as two of the most
important meeting facility selection criteria. However, due to the nature of conference center
40
business, local market and one-day programs are less important variables in conference center
selection. The trends of upgrading properties’ features continues, with major hospitality industry
brands such as Starwood, Hilton, and Wyndham joining the dedicated conference center market,
while the core of the conference center industry remains in the small- to midsize-meetings
market.
Conference centers list and market various types of ICT-based features on their Web sites
and marketing materials. Those features include both wireless and wired Internet throughout the
facility, cyber cafes with Wi-Fi Internet access, advanced videoconferencing, virtual
conferencing (Webcasting and Web conferences), radio frequency identification (RFID), and on-
site IT teams to fulfill customers’ needs (Ball, 2006). Davison et al. (2002) added online
registration, search engines for venues and suppliers, and online requests for proposals (RFP),
and reported that those features specifically help to reduce lead time in the planning stage of
meeting management. To meet the various demands of customers, many conference centers are
offering unbundled CMP or day meeting packages (DMP) since some items/services are not
included or vice versa (Meeting News, 2005). For example, the National Conference Center in
Lansdowne, Virginia offers “a la carte” technology equipment/services as well as the basic A/V
equipment included in the CMP. Those services include broadband Internet access, Local Area
Network (LAN), equipment rental, audio/video conferencing, and technical support (“The
National Conference Center,” 2007). Based on a literature review from OMFG, some examples
of additional conference technology at conference centers are walk-up Internet stations (Babson
Executive Conference Center) and multi-media enhanced sessions via the Web or burning a
DVD (Charles F. Knight Executive Conference Center).

41
Contrary to the type of ICT-based features and services, the technology standard of the
conference center industry is not reflecting recent trends in ICT features and the demands of
customers and conference centers have large variability (Eisenstodt, 1999). According to the
universal technology criteria for ICAA accredited members, technological requirements are
simply flip charts, microphones, and image and video display equipment in the main meeting
room, with technicians available for immediate response. The PKF/IACC report (2004) listed
making return on investments in technology and providing technological support to increasingly
sophisticated customers as anticipated challenges for conference centers. According to the study
by IACC (2004), only 41% of the conference centers surveyed have a dedicated IT manager. At
other conference centers, the controller or general manager frequently has the primary
responsibility of information technology/systems support, even though he/she is not a specialist
in IT operation. Tony Pastor of McKinsey & Company quoted by Carey (2008) has emphasized
the importance of a technician on site to help the older generations to use various technologies,
which would add options to what a planner could use in their meetings. However, there is no
study investigating the impact of various technology features on meeting planners’ conference
center selection.
2.7 Meeting Site/Facility Selection Process
Associations’ meeting site selection is made through the organizational buying by
committees or groups of people who represent different departments and have different interests
and motivations (Ronbinson et al., 1967). Such a group of individuals is called a buying center,
and its members typically represent different departments/positions, different interests and
motivation (Clark & McCleary, 1995; Robinson et al., 1967; Webster, 1984; Webster & Wind,
1972), and politics (Crouch & Louviere, 2004a.). Consequently, a purchase decision in an

42
organization involves considerable complexity (Clark & McCleary,1995; Webster, 1978). The
organizational buying process also consists of multi-decision stages and decision-making units
(buying centers), changes in structure and make-up in each stage (Doyle et al., 1979). Some
researchers found that buying center involvement was dynamic (Ghingold & Wilson, 1998), with
individuals participating in some sub-decisions but not others, and authority often shifting from
one buying activity to the next. In general, earlier stages of the buying process (i.e. need
recognition, description, and specification of the purchase) tend to have wider involvement than
later stages (vendor qualification and contact, vendor proposals, and analysis) (Lynn, 1987).
Knowledge of how buying centers form and how these variables affect the purchase decision is
therefore of great importance to meeting facility marketers (Thomas, 1984).
Although most business buying decisions are dynamic in nature, theorists and researchers
have endeavored to effectively capture the multi-person involved multi-phase buying process
(Robinson et al., 1967; Webster & Wind, 1972). Previous investigations of the organizational
buying process progressed in two main streams of research. First, researchers have specifically
attempted to profile buying centers, describe and measure interpersonal communications, and
identify the organizational and environmental factors that affect buying center behavior and
buying decisions in general (Johnston & Bonoma, 1981; Spekman & Stern, 1979). Consequently,
the make-up, structure, functioning, and outputs of the buying centers have received substantial
attention in the business marketing literature (Ghingold & Wilson, 1998). Effective business
marketing relies on identifying key buying center members, determining their concerns and
needs, and then creating solutions for individual buying center members that meet their needs,
fulfill buying requirements, and minimize perceived risk.
43
Clark et al. (1996) identified that all buying centers in association meeting decisions
belong to one of three types based on its decision pattern: (1) executive board choose location, (2)
meeting planner or executive choose location, or (3) site-selection or program committee choose
location. Each buying center makes a final selection with different groups of members in an
organization. No dominant pattern was found in the buying center make-up.
The second stream of buying center studies pertains to the buying authority, the locus of
power and decision making authority, and changes in influence and control over different buying
activities over time. Differences in buying center size and composition were repeatedly observed
in various stages of the buying process to determine their effect on decision making (Jackson et
al., 1984; Lynn, 1987; McQuiston, 1989; Silk & Kalwani, 1982). The studies in this stream
provide important insights into the effects of internal and external factors in determining the
locus of authority within the buying center (Jackson et al., 1984; Johnston & Bonoma, 1981;
Webster, 1984). The magnitude of influence on the buying decision also varies based on
situational variables: positions or department, type of product being purchased, the stage of the
decision process, the decision type, and organizational structure.
Thomas (1984) defined “expert power” as being based on the receiver’s perception that
source has some special knowledge or expertise and tends to be part of the informal (internal)
processes within the organization. He also added that it is an expertise primarily informal in
nature and relevant to organizational buying processes. The expert power is selected because
technical knowledge, special skills, or experience can mediate interpersonal relationships in the
buying/selection process (Clark et al, 1997; Thomas, 1984). Considerable informal expertise is
provided as a basis for influencing other participants in the purchase decision process. Kohli
(1989) analyzed the determinants of influence in organizational buying using a contingency
44
approach and suggested that expert power is the most important influence determinant. Its
effectiveness varies with buying center size, viscidity, and time pressure.
Clark and McCleary (1996) reported that risk can be a powerful situational influence on
members of the buying center, especially when they are purchasing services that have high
intangible components. Perceived risk comprised of two dimensions and the magnitude of it is
related to those two dimensions: uncertainty about the outcome of the decision and the
importance of the decision (Bettmann, 1973; Kohli, 1989). The uncertainty is a psychological
state that results primarily from a lack of adequate information or knowledge (Kohli, 1989).
Uncertainty may prevail for two reasons. First, buyers may experience uncertainty because of a
lack of relevant experience with the product category (von Hippel, 1986). Second, uncertainty
may exist because of particular market conditions that impose demands on a buyer’s information
processing capacity (Achrol & Stern, 1988). High-technology markets represent considerable
uncertainty for buyers because their past experience is frequently inapplicable to the buying
decision at hand for future selections. Von Hippel (1990) argued that high-technology markets
tend to be competence destroying.
Purchase importance is defined as the “impact of a purchase on organizational
profitability and productivity” (McQuiston, 1989). Because a purchased product may not
perform as expected, there is an uncertainty that may carry possible consequences, both good and
bad. He reported that the more important the purchase decision, the more perceived risk. The
selection, an often equal term of purchase in the meeting facility selection of a site and meeting
facility is one of the most important purchases to an association due to its contribution to non-
due revenue.

45
However, these studies do not explain directly the underlying behavioral reasons for the
variation in influence of a position as many studies were limited to providing only a static view
of the buying situation (Wind, 1967). These simplifications or shortcuts were probably used
because the capturing process effect is exceptionally difficult for both researchers and
respondents. In addition, general conclusions regarding the dynamic nature of buying center
structures and their implications for business marketing practice remain unclear in the absence of
comprehensive research.
2.8 Meeting Planners: Expert Power as a Member of the Buying Center
Webster and Wind (1972) defined the roles of people in a buying center as buyers,
deciders, gatekeepers, and influencers. Clark et al. (1996) reported that a meeting planner
performs the roles of buyer and gatekeeper; one powerful role of a meeting planner is that of
gatekeeper by having professional preference on certain sites from past experiences, reference
groups, or personal preference. The meeting planners may influence the flow and quality of
information to the benefit or detriment of any particular selection. Personal knowledge can be a
powerful tool when it comes to one member of the buying center exerting influence over the
group’s site selection decision (Clark et al., 1997). In small associations, the planning of such
events may be done by an executive director or administrative staff, while specialized meeting
planners utilize them in larger associations. Other members in organizations’ site/facility
selection group conformed to the meeting planner’s choice or recommendation because they
believe it lead to the best decision for the organization’s meeting. Meeting planners often
determine the consideration set of convention sites as well as the selection of a final site because
of their expert and information power (Clark, Evans, & Knutson, 1997; Baloglu & Love, 2004).
46
Crouch and Louviere (2004a) argued that associations’ site selection should be
investigated from an organizational buyer-behavior perspective. However, most meeting site
selection studies have focused on association meeting planners as they are actively involved in
the site selection process and influence the selection of a meeting facility as well as a meeting
destination (Clark et al., 1997; Evans & Lord, 1997; Clark et al., 1996).
Very limited studies have focused on other types of meeting planners’ roles and
perceived expert power in the site/facility selection process. Bonn and Boyd’s (1992) study
found that corporate meeting planners have different perceptions in terms of facilities and
services, recreational attractiveness, and entertainment of destinations, and suggested that
understanding the differences would help the destinations to identify their strengths and
weaknesses to better target U.S. corporate meeting planners.
2.9 Types of Meeting Planners and Their Technology Readiness
Beaulieu and Love (2004) listed four types of meeting planners: association planners;
corporate planners; medical planners; and independent planners. Association meeting planners
are usually full-time, paid employees of professional, trade, industrial, scientific, and other types
of associations (Rutherford, 1990) and are responsible for planning the meetings, conventions,
and expositions for their organization (Montgomery, 1995). A corporate meeting planner is
defined as one who works in a corporation (such as Microsoft or General Motors) (Beaulieu and
Love, 2004; Toh et al., 2005). A government meeting planner is defined as one who plans
various levels of government meetings: federal; state; and local while working as a government
employee. An independent meeting planner is often referred to as a third-party meeting planner
and defined as one who contracts services on an individual basis and is responsible for a wide
47
variety of meetings (Beaulieu & Love, 2004; Toh et al., 2005). Toh et al. (2005) conducted an
exploratory study of independent meeting planners’ roles, compensation, and potential conflicts
with corporation and association meeting planners. The 2006 Meeting Market Report, published
biannually by Meetings and Conventions, reported 136.5 million attended meetings that year
(79.7 million at corporate meetings, 37.9 million at association meetings, and 18.9 millions at
conventions). According to the 2003 State of the Industry Report, published by Successful
Meetings, the proportion of each type of meeting planners are: corporate planners (34%);
association meeting planners (27%); independent meeting planners (13%); and others, including
government planners (26%).
The rapid growth of technology-based products and services and the increased demand
for those features by attendees ask for a thorough assessment of meeting planners’ technology
readiness technology (Davison et al., 2002). They argued that one major factor limiting is the
extent to which meeting planners have the skills and equipment required to give them access to
information and communication technology. Many studies of meeting planners, mainly on
association planners, show that they acknowledged a need to use technology, along with its
positive qualities and benefits. However, these feelings do not translate to actual use of
technology by meeting planners. Vanucci and Kerstetter (2001) argued that, although
technology is a vital part of meeting planners’ daily lives, they have not followed the pace of
other hospitality professionals and still rely on traditional technology (e.g. fax, modem, and text
e-mail). Vanucci and Kerstetter (2001) identified that association meeting planners in particular
have larger gaps to fill in their technological knowledge than corporate meeting planners.
Casanova et al. (2005) studied the relationships of meeting planners’ profiles with
attitudes towards technology and actual usage. They reported that higher education is closely
48
related to a positive attitude toward technology; however, the study was limited to examining
only the Internet and personal computers as tools of communication channels or administrative
tasks. Clark et al. (1996) argued that meeting planners can have expertise by gaining experience
through identifying the hardware and software needs of their organization. It is important to
measure whether meeting planners are sufficiently ICT-oriented to be able to benefit from such
technology applications (Davison et al., 2002). Webster and Wind (1972) explained that
technological constraints can be overcome through training and support by organization or
colleagues and emphasized the importance of individual training or technical support to
encourage comfort with new technology.
Compared to the extensive research on association meeting planners, corporate and
government meeting planners have received very little attention in academic studies. Varying
levels of ICT literacy of meeting planners leave their level of expertise regarding ICT in facility
selection uncertain. While most studies agree that a meeting planner has expertise in site/facility
selection, there is no evidence that the meeting planner has the same level of expertise and
influence on the selection or recommendation of ICT-based features/services, which includes
high-tech items at conference centers.
2.10 Personal Innovativeness
Personality makes a difference in the adoption process of IT. Dabholkar (1996) found
that consumers varied in terms of their beliefs/feelings about the various options and those
beliefs/feelings were positively correlated with intended use; this finding is consistent with TAM
by Davis (1996). Extensive studies focusing on the perceptions, emotions and usage of new
technology demonstrated that people harbor both favorable and unfavorable views about

49
technology-based products (Mick & Fournier, 1998). Based on qualitative research, they
identified eight technology paradoxes: control/chaos; freedom/enslavement; new/obsolete;
competence/incompetence; efficiency/inefficiency; fulfills/creates needs; assimilation/ isolation;
and engaging/disengaging. These positive and negative feelings referred to as “paradoxes”
coexist within an individual and therefore must be considered in order to understand more
completely how and why people adopt new technology (Mick and Fournier, 1998).
Parasuraman (2000) proposed technology readiness (TR) which specifically addresses
and incorporates the underlying paradoxical attitudes that individuals experience when exposed
to new technology. The TR construct refers to peoples’ propensity to embrace and use new
technologies for accomplishing goals in home life and at work. He operationalized TR with
Technology Readiness Index (TRI) and tested 36 statements, grouped into two enabler
dimensions (optimism and innovative) and two inhibitor dimensions (discomfort and insecurity).
Parasuramann argued that the TRI can be used to provide insights pertaining to which
technology-based features and type is likely to be the most appropriate type of support to assist
consumers who are experiencing problems with technology-based systems. Table 2.8
summarizes the underlying dimensions of TRI and their implications for the measurement of
meeting planners’ attitude toward technology.

50
Table 2.8 Underlying Nature of Technology Readiness
Direction Dimension Description
Enabler Dimensions
Optimism A positive view of technology. Belief in increased control, flexibility, and efficiency in life due to technology. Tendency to believe that one will generally experience good versus bad outcomes in life.
Innovativeness
A tendency to be the first using a new technology.
Inhibitor Dimensions
Discomfort.
Having a need for control and a sense of being overwhelmed.
Insecurity Distrusting technology for security and privacy
reasons.
Walczuh et al. (2006) examined the relationship of personality and technology
acceptance by combining TR and TAM into one model. The study supported that the informants’
optimism has the strongest impact on perceived ease of use and perceived usefulness. Those
who have strong positivism seem to use IT most frequently and positively, and are less likely to
focus on its negative aspects.
Recent innovation studies showed that another variable derived from innovation diffusion
theory (IDT)—personal innovativeness of IT (PIIT), the willingness of an individual to try out
any new IT—plays a significant role in determining the user’s acceptance of technology
(Walczuh et al., 2006). The items employed to measure PIIT are fundamentally a subset of TR;
specifically, the enablers of TR are conceptually similar to PIIT. PIIT encapsulates the degree to
51
which a user feels confident in using or including technology-based services while TR is not an
indicator of a person’s competence in using technology (Walczch et al., 2006).
2.11 Proposed Research Model
The technology acceptance model (TAM) offers a theoretical basis for examining the
factors contributing to the intention to act on the acceptance of technology (Davis, 1986, 1989).
While TAM was much simpler and parsimonious, researchers argued that a more holistic
assessment of technology adoption is necessary in order to improve the understanding of the
phenomenon of technology acceptance (Agarwal & Karahanna, 2000; Plouffe et al., 2001).
Davis (1989) and Venkatesch and Davis (2000) argued that in-depth research should be done to
model the determinants of perceived ease of use and perceived usefulness. In this study, the
author adopted and extended the TAM (Davis, 1989) by integrating key factors from IDT
(Rogers, 1995) and Bandura’s (1986) self-efficacy.
The purpose of this study is to model the determinants of perceived ease of use and
perceived usefulness in the context of selection of a conference center with ICT-based features.
Thus, the perceived self-confidence and beliefs (self-efficacy, perceived usefulness, and
perceived ease of use) of ICT-based features on a meeting facility selection will be examined.
Result demonstrability and personal innovativeness in IT were previously studied as external
factors that affect usage through perceived usefulness and perceived ease of use (Rogers, 1995;
Yi et al., 2006) and they are included in the proposed model. This study also investigates
interrelations among other internal and external constructs identified through the literature
review. The theoretical framework that integrated TAM and buying center concepts from
literature reviews appears in Figure 2.6. Due to the restriction of difficulty in testing all identified
52
constructs with available resources, the author has presented the proposed research model in
Figure 2.7. The author also described the rationale in more detail for the hypothesized
relationships in the following section.
Self-efficacy is influenced by personal innovativeness in ICT (PIICT), result
demonstrability, and perceived importance of the availability of technical support. The model
will test the influence of self-efficacy on perceived usefulness and perceived ease of use.
Perceived usefulness is hypothesized to be influenced by perceived ease of use, self-efficacy, and
PIICT, while perceived ease of use is hypothesized to be influenced by perceived importance of
the availability of technical support, self-efficacy, and PIICT. The type of meeting planner is
expected to have influence on the relationships between perceived importance of the availability
of technical support and self-efficacy as well as self-efficacy on perceived ease of use.

53
Figure 2.6 Integrated Theoretical Framework
TAM
Self-efficacy
Type of ICT-based features
PIICT
Result Demonstrability
Perceived importance of the Availability of
Technical Support
Situational Variables
Perceived ease of Use
Perceived Usefulness
Intention to Recommend/Select
Subjective Norm
Buying CenterCharacteristics of
Buying center

54
Figure 2.7 Proposed Research Model
H1a(+) H2c(+)
PIICT
H3a(+)/b(+)
Result demonstrability
Self –efficacy
Perceived importance of the availability of
technical support
Type of meeting planner
H1d(+)
Perceived Usefulness of ICT-based features
H2b(+)
H4 (+)
H1c(+)
H5b
H5a
Perceived ease of useH1b(+)
H2a(+) H6(+)

55
2.12 Constructs and Hypotheses
The definitions of the constructs and hypotheses in this study are explained as follows:
2.12.1 Personal Innovativeness in ICT (PIICT)
PIICT is defined as the willingness of an individual to try any new ICT and it takes an
important role in determining the outcomes of user acceptance of technology (Agarwal & Prasad,
1997). Innovators and early adopters find it easier to imagine, understand, and appreciate the
benefits of an innovation in its early stage of diffusion (Moore, 1999). Thus, the innovators
should feel more confident about the intangible results of using the innovative technology and in
communicating these results to others. Yi et al. (2006) indicated there is positive relationship
between PIIT and result demonstrability. So the author hypothesizes that:
H1a: A meeting planner’s Personal Innovativeness in ICT (PIICT) is positively
correlated with result demonstrability.
Earlier adopters are more technically competent than others and are respected by their
colleagues or by members of buying centers for their knowledge of innovation. With the given
technical competencies, the earlier adopters feel fewer barriers to the complexity of new
technology, suggesting influence on the perception of ease of use.
Arguing that individuals’ beliefs about IT use is influenced by the individual, institutional,
and social contexts in which individuals interact with IT, the authors proposed a broad
framework and examined the simultaneous effects of those influences on perceptions of
usefulness and ease of use (Terry, 1993; Terry & O’Leary, 1995). Results suggest that personal
innovativeness positively influences usefulness and ease of use beliefs, while Agarwal et al.
(2000) theorized that self-perceptions of efficacy in the task domain of computing were strongly

56
influenced by the extent to which individuals believe they were personally innovative with
respect to IT.
Lewis, Agarwal, and Sambamnrthy (2003) also argued that PIIT is a significant
determinant of perceived ease of use. The early adopters and innovators have the ability to
envision the potential benefits and advantages associated with the innovation. PIIT is
conceptualized as direct determinants of perceived usefulness and perceived ease of use.
Therefore, the following hypotheses have been proposed for this study:
H1b: A meeting planners’ Personal Innovativeness in ICT (PIICT) has a positive
relationship with higher perceived ease of use of ICT-based features at a
conference center.
H1c: A meeting planner’s Personal Innovativeness in ICT (PIICT) has a positive
relationship with perceived usefulness of an ICT-based feature at a conference
center.
The effect of PIIT on self-perceived expert power on the purchase of IT-based services is
unknown. However, Agarwal et al. (2000) theorized that self-perceptions of efficacy in the task
were strongly influenced by the extent to which individuals believe they were personally
innovative with respect to IT. So the early adopters were more confident about the application
and the tangible result of using it and communicated the result with others. The self-perception
of efficacy/confidence closely confirms the self-perceived expertise/confidence; therefore, the
following hypothesis is proposed:
H1d: A meeting planner’s Personal Innovativeness in ICT (PIICT) will have a positive
effect on self-efficacy.

57
2.12.2 Result Demonstrability
Agarwal and Prasad (1997) examined the effects of individuals’ perceptions about the
characteristics of target technology on intention of future use and found that relative advantage
and results demonstrability are highly related to the intention of future use. Rapid technological
change makes it difficult for buyers to evaluate acquired information in terms of the significance
of new product offerings (Sutton et al., 1986). Most customers find it difficult to envision new
technologies and jargons used to describe them and match those with applications without
assistance. For example, availability of a private virtual network (PVN) at a meeting facility can
allow a meeting planner to provide access to meeting attendees’ headquarter database and share
the information in their presentations from a remote meeting facility.
Result demonstrability is defined as the extent to which the tangible results of using an
innovation can be observable and communicable (Rogers, 1995). As the relative advantage is
highly related to the perceived usefulness in the proposed model (Yi et al., 2006), only the result
demonstrability is added to the proposed model. Yi et al. (2006) argued that potential users of
technology-based features or services can better understand the advantages of using a new
technology and its implication for their job when tangible results of the technology are directly
apparent. They also claimed that the result demonstrability positively influences the perceived
ease of use. Therefore, the following hypotheses are proposed for this study:
H2a: A meeting planner’s result demonstrability will have a positive effect on the
perceived ease of use of specific ICT-based feature(s).
H2b: A meeting planner’s result demonstrability will have a positive effect on the
perceived usefulness of specific ICT-based feature(s).

58
Yi et al. (2006) reported that the extent to which a user was able to envision the result of
using an innovation partially reflects confidence in using the system and achieving desired
results. This is also consistent with the view of the attribution theory, which proves that people
are more likely to make internal attributions when the projected outcome of usage is positive
(Heider, 1958). Therefore, the following hypothesis is proposed for this study:
H2c: A meeting planner’s result demonstrability will have a positive effect on self-
efficacy in the use of specific ICT-based feature(s).
2.12.3 Perceived Importance of the Availability of Technical Support
Montealegre (1999) argued that adoption of new or unfamiliar technology requires
different managerial, technical, and financial resources than those needed to adopt already
developed technology. In general, IT department staffs in an organization serve to analyze
options to determine technical feasibility and make recommendations. Technical support on
meeting management technologies to meeting planners is usually provided through (1) in-house
technical support offered by an IT department or experienced peer, or (2) on-site technical
support offered by a meeting facility. Because some type of meeting planners, such as
association meeting planners, are considerably behind in terms of technology usage and
knowledge (Casanova et al., 2005), technical support becomes more important to them. Some
meeting planners may not feel that they have the necessary skills to utilize a specific technology,
but such constrains or perceived lack of behavioral control, which is compatible with concept of
perceived self-efficacy (Bandura, 1977, 1982, 1986), can be overcome through support and
training offered by experienced peers or technicians (Matthing et al., 2006). Furthermore, to
those who use new or unfamiliar technology with lack of confidence, the importance of technical
support and training is expected to be high to gain knowledge of and confidence in using such
59
technology-based feature. Therefore, the author hypothesizes that perceived importance of the
availability of technical support has a negative relationship with the self-efficacy:
H3a: The perceived importance of availability of in-house technical support is negatively
associated with self-efficacy
H3b: The perceived importance of availability of on-site technical support is negatively
associated with self-efficacy
2.12.4 Self-efficacy
Self-efficacy was first defined as people’s belief about their capabilities to produce
performances that influence events affecting their lives (Bandura, 1995) and one’s ability to
achieve the behavioral outcome (Manstead & Van Eekelen, 1998). Personal capacity (capability)
and self-efficacy have been employed to reflect the extent to which prospective users believe
they are sufficiently able or equipped to engage and use technology-enabled service successfully.
In other words, self-efficacy related directly to perceptions of ability to execute a behavior
needed to produce a given outcome (Manstead & Van Eekelen, 1998). This approach is quite
similar to the definition of perceived behavioral control, in that it refers to people’s perceptions
of the ease or difficulty of performing the behavior of interest (Ajzen, 1991; Davis et al., 1998;
Walker & Johnson, 2006; Walker et al., 2002). The present view of perceived behavioral control
is also compatible with Bandura’s (1977, 1982, 1986) concept of perceived self-efficacy. It is
concerned with a judgment of how well one can execute courses of action required to deal with
prospective situations. Ajzen (1991) argued that much knowledge of perceived behavioral
control comes from Bandura and his associates’ research proving peoples’ behavior is strongly
influenced by their confidence in their ability to perform. Ajzen used the term “perceived

60
behavioral control” in his TPB model; however, he also stated that “perceived self-efficacy belief”
can replace it. Clearly, there is great degree of overlap among self-efficacy and perceived
behavioral control as both concepts are concerned with control: the perceived ease or difficulty
of performing a behavior, and the belief that one is capable of performing a behavior. Both actual
self-confidence and the belief of self-confidence are implied with a willingness to use and a
preparedness to engage with technology-enabled services (Hill et al., 1987; Hoffman & Novak,
1996).
Bandura (1977) notes that the less efficacious people judge themselves to be, the more
difficult the tasks appear to them. In the present research, self-efficacy loaded highly on
perceptions of how easy or difficult it was to achieve the target behavior, which is the definition
of perceived ease of use. It is consistent with prior research that found that perceived self-
efficacy is a significant determinant of perceived ease of use (Venkatesh & Davis, 1996).
Therefore, it is reasonable to expect the construct “self-efficacy” is a strong determinant of
perceived ease of use. Therefore, the author hypothesizes the following statement:
H4: Self-efficacy will have a significant positive relationship with perceived ease of use.
2.12.5 Type of Meeting Planner
While many studies of meeting planners, mainly on association planners, show that they
acknowledged the positive qualities, benefits, and needs to adopt technology, these feelings are
not often implemented to actual use of technology. Vanucci and Kerstetter (2001) argued that,
although technology is a vital part of their daily lives, meeting planners have not followed the
pace of other hospitality industries that use the revolution of technology and still rely on many
traditional technologies (e.g. fax, modem, and text e-mail). One major factor limiting as well as

61
determining the adoption of technology is the extent to which the users have the skills and
equipment required to give them access to the technology (Davison et al., 2002). They reported
that association meeting planners have an especially larger gaps to fill in their technological
knowledge than those of corporate meeting planners. Meeting Market Report (2005) identified
that the level of Internet usage for marketing of meetings varies considerably between corporate
and association meeting sectors. The type of meeting planner is defined as the category of
meeting planners based on the organization that meeting planners conduct meetings for and three
types of meeting planners: association meeting planner; corporate meeting planner; and
government meeting planner were selected for the hypothesis test.
To test the influence of the type of meeting planner (association, corporate, and
government) on the relationships between perceived importance of availability of technical
support, self efficacy, and perceived ease of use, the following hypotheses were proposed:
H5a: The type of meeting planner will influence the effect of perceived importance of
availability of technical support on self-efficacy.
H5b: The type of meeting planner will influence the effect of self-efficacy on perceived
ease of using ICT-based features.
2.12.6 Perceived Usefulness and Perceived Ease of Use
TAM theorized that behavioral intention to use a new system would be determined by
perceived usefulness and perceived ease of use (Davis et al., 1989). Davis (1986) defined
perceived usefulness as the prospective user’s subjective probability that using a specific
application system will increase his or her job performance within an organizational context.

62
Perceived ease of use is the degree to which the prospective user expects the target system to be
free of effort. Behavioral intention is a measure of the strength of one’s intention to perform a
specified behavior (Davis et al., 1989; Fishbein & Ajzen, 1975). Both TRA and TAM reported
that usage behavior is predictable from a measure of behavioral intention, and any other factors
may influence user behavior indirectly by influencing intention (Davis et al., 1989). Some
studies with individual professionals reported that no significant relationship existed between
perceived ease of use and behavioral intention to use (Chau & Hu, 2001; Yi et al., 2006).
Therefore, the following hypothesis was proposed for this study:
H6: Perceived ease of use will have a positive effect on the perceived usefulness of use.

63
Chapter III
METHODOLOGY
3.1 Introduction
This chapter refines the framework of the research study and is followed by a
methodology and measurement of the variables in detail. The author describes the development
of measurement items, scales for the constructs in the suggested research model. In this chapter,
the research design and the data analysis procedures used to achieve the research objectives are
discussed. Also, the survey method used in this study is explained, along with the data analysis
procedures.
3.2 Research Design
This study used a theoretical model to examine the perceived importance of ICT-based
features and services and factors influencing meeting planners’ beliefs and attitudes toward ICT-
based features and services in their conference center selection/recommendation. Table 3.1
comprises a list of the research questions and the hypotheses developed in an effort to answer the
research questions. The administered questionnaire via mail was chosen as a research method for
data collection as it has been widely used and justified in information technology literature since
surveys via the Internet can result in direct bias (Pinsonneault & Kraemer, 1993). Zikmund (2003)
defined the mail survey as a self-administered questionnaire sent through the mail to respondents
and listed the advantages of mail surveys: geographic flexibility, relatively inexpensive cost,
standardized questions, absence of an interviewer, and highly structured and standardized
questions. As still not all meeting planners in the meeting industry can access the Internet nor
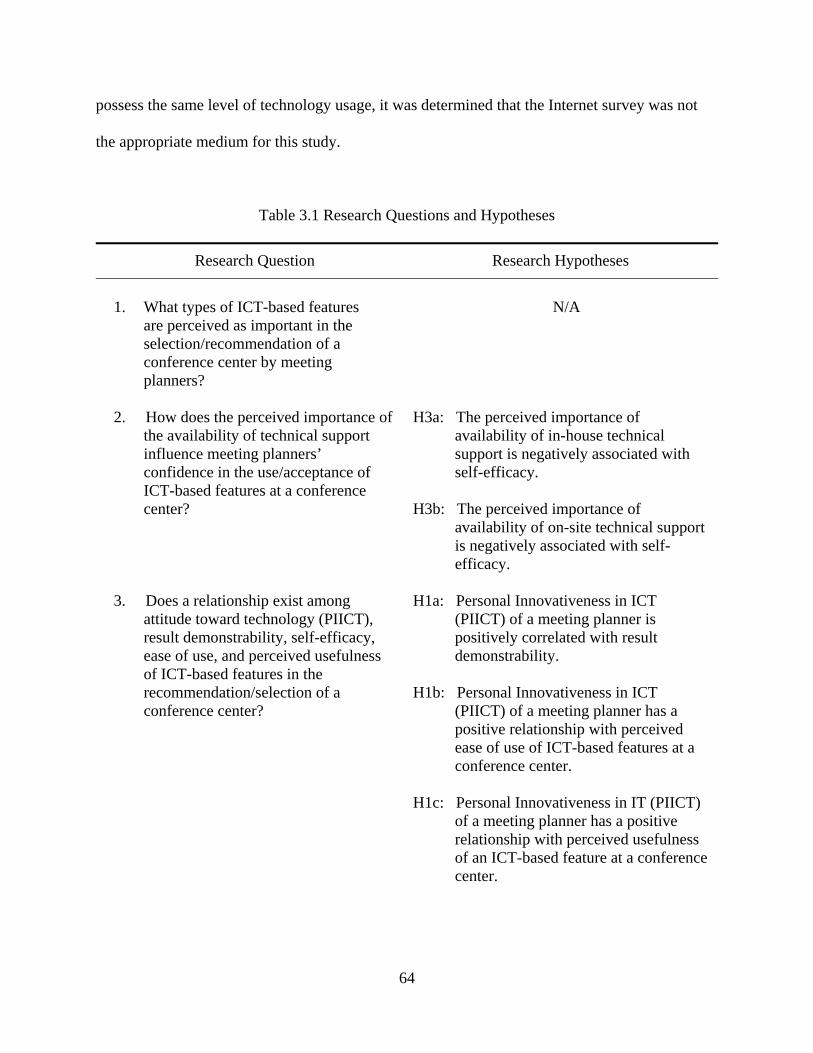
64
possess the same level of technology usage, it was determined that the Internet survey was not
the appropriate medium for this study.
Table 3.1 Research Questions and Hypotheses
Research Question Research Hypotheses
1. What types of ICT-based features
are perceived as important in the selection/recommendation of a conference center by meeting planners?
N/A
2. How does the perceived importance of the availability of technical support influence meeting planners’ confidence in the use/acceptance of ICT-based features at a conference center?
H3a: The perceived importance of availability of in-house technical support is negatively associated with self-efficacy.
H3b: The perceived importance of availability of on-site technical support is negatively associated with self-efficacy.
3. Does a relationship exist among
attitude toward technology (PIICT), result demonstrability, self-efficacy, ease of use, and perceived usefulness of ICT-based features in the recommendation/selection of a conference center?
H1a: Personal Innovativeness in ICT
(PIICT) of a meeting planner is positively correlated with result demonstrability.
H1b: Personal Innovativeness in ICT
(PIICT) of a meeting planner has a positive relationship with perceived ease of use of ICT-based features at a conference center.
H1c: Personal Innovativeness in IT (PIICT) of a meeting planner has a positive relationship with perceived usefulness of an ICT-based feature at a conference center.

65
Table 3.1 Research Questions and Hypotheses (Continued)
Research Question Research Hypotheses 3. Does a relationship exist
among attitude toward technology (PIICT), result demonstrability, self-efficacy, ease of use, and perceived usefulness of ICT-based features in the recommendation/selection of a conference center?
H1d: A meeting planner’s Personal
innovativeness (PIICT) will have a positive effect on self-efficacy.
H2a: A meeting planner’s result demonstrability will have a positive effect on the perceived ease of use of specific ICT-based features.
H2b: A meeting planner’s result demonstrability will have a positive effect on the perceived usefulness of specific ICT-based features.
H2c: A meeting planners’ result
demonstrability will have a positive effect on self-efficacy in the use of specific ICT-based feature(s).
H4: Self-efficacy will have a positive
relationship with perceived ease of use.
H6: Perceived ease of use will have a positive effect on perceived usefulness.
4. Does the type of meeting
planner influence the relationships of perceived importance of the availability of technical support, self-efficacy, and perceived ease of use of ICT-based features in recommendation/selection of a conference center?
H5a: The type of meeting planner will influence the effect of perceived importance of the availability of technical support on self-efficacy.
H5b: The type of meeting planner will
influence the effect of self-efficacy on perceived ease of use of ICT-based features.
66
This study used survey instruments adopted from Davis et al. (1989) and Yi et al. (2006).
The instruments are widely regarded and have received considerable attention by researchers
(Adams et al., 1992; Hendrickson & Collins, 1996; Igbaria et al., 1995; Mathieson et al., 2001;
Segars & Grover, 1993; Straub et al., 1995; Subramanian, 1994).
3.3 Population and Sample
A target population is defined as a complete group of the specific population elements
relevant to a research project (Zikmund, 2000). The target population of this study was the
meeting planners who used or planned to use a conference center for their meetings. A sample
frame, often called a working population, is defined as the list of elements from which a sample
may be drawn. The sample frame, which was the same as the research sample in this study, was
obtained from the meeting planner client lists of the following three conference centers: the
National Conference Center, Hotel Roanoke and Conference Center, and the Inn at Virginia
Tech and Skelton Conference Center. The samples consisted of the meeting planners and those
who possessed equal positions from the given set of conference centers.
This study used a judgment (purposive) sampling technique and the data collected
through this technique are convenience samples. The purposive sampling is a non-probability
sampling technique in which an experienced individual selects the sample based on his or her
judgment about some appropriate characteristics required of the sample to serve a specific
purpose. The major reason that this research used those meeting planners as subjects was
because the clients of the selected conference centers comprise a relatively homogeneous group
in terms of their travel related characteristics, such as travel distance (proximity), lodging
requirements, and type of meetings. Specifically, it is critical for subjects to be exposed to
67
similar availability of ICT-based features. Another reason for using these subjects was to reduce
the risk of the researcher not being able to control the experience of conference center
selection/recommendation. By using the probability sampling methods, such as simple random
sampling or systematic sampling in studies of an experimental nature, the researcher may lower
the reliability and validity of the study. For instance, subjects selected through random sampling
from the often used sample frame (such as the list of Meeting Professional International meeting
planner members) might include many samples that have not experienced the
selection/recommendation of a conference center with ICT-based features. Consequently, they
may not provide a meaningful response pertaining to the importance of ICT-based feature(s) at a
conference center. While the result of the study from convenience and purposive sampling
methods cannot project beyond the specific sample, convenience samples are best used for
exploratory research when additional research will subsequently be conducted with a probability
sample (Zikmund, 2000).
The unit of this study was an individual meeting planner. The determination of sample
size is a critical part of this research. When a sample size is much smaller than the minimum
requirement, the results of the study may not be sufficient to be used in generalizing the findings
and therefore limit the reliability of the study. If the size is too large, it has the tendency of
making even non-significant outcomes statistically significant (Hayduck, 1987). According to
Hoyle (1995), the minimum requirement of a sample size for the regression analysis is not fixed
but a general, large sample size will increase the reliability of results. For factor analysis, five per
each item or ten per each item is considered as a minimum required sample size conservatively
(Hair, Black, Babin, Anderson, & Tatham, 2006).

68
3.4 Instrument and Measures of Constructs
Measures for the variables were either adapted from prior literature or developed
specifically for this study. The measurement items, tested in past research, have demonstrated
acceptable levels of reliability and validity and were modified for this study. Most items used in
this study were tested in the empirical work conducted by Yi et al. (2006). Since they found
these measures were similar to others supporting the same constructs, the author has confidence
that the measures selected for this study are reasonable measures of the constructs in fact.
Although most individual items used in this study were employed in previously published
studies, the measurement items for two new variables: perceived importance of the availability of
technical support and importance of ICT-based features at conference centers were developed
especially for this study. The measuring items of each variable were explained in Table 3.2. The
variables were defined and the measurement items used in the questionnaire were discussed in
the preceding sections.

69
Table 3.2 Instrument and Its Measurement Development
Variable Items Scale Sources for measurement
*Importance of ICT-based features at conference centers
15 items 7-point Likert Scale (1=strongly disagree, 7=strongly agree)
OMFG (2000, 2001, 2003, 2004, 2006); IACC (2007b); GAVEL (2001,2005,2006, 2007)
Personal Innovativeness of ICT (PIICT)
4 items 7-point Likert Scale (1=strongly disagree, 7=strongly agree)
Agarwal & Prasad (1997); Yi et al. (2006)
Result demonstrability
3 items 7-point Likert Scale (1=strongly disagree, 7=strongly agree)
Yi et al.(2006); Agarwal & Prasad (1997); Venkatesh &Davis (2000)
*Perceived Importance of the availability of technical support
2 items 7-point Likert Scale (1=strongly disagree, 7=strongly agree)
IACC (2004, 2007a); M&C (2006)
Type of meeting planners 3 item Categorical scale (association meeting planner, corporate meeting planner, government planner)
Casanova et al. (2005); Meeting Market Report (2006)
Self-efficacy 2 items 7-point Likert Scale (1=strongly disagree, 7=strongly agree)
Bandura (1982,1986); Armitage & Conner (1999); Manstead et al. (1998)
Perceived ease of use 5 items 7-point Likert Scale (1=strongly disagree, 7=strongly agree)
Davis (1986); Venkatesh & Davis (2000)
Perceived usefulness 5 items 7-point Likert Scale (1=strongly disagree, 7=strongly agree)
Davis (1986); Venkatesh & Davis (2000)
* New variables developed for this research

70
3.4.1 Personal Innovativeness of ICT (PIICT)
Personal innovativeness of information technology was first defined as the willingness of
an individual to try out any new IT, and is seen as having an important role in determining the
outcomes of user acceptance of technology (Agarwal & Prasad, 1997). It describes the extent to
which an individual has an innate propensity toward adopting a new IT. This study modified IT
to ICT to make them specifically relevant to ICT-based features and defined it as perceived
innovativeness of ICT (PIICT). The four items were adapted from Agarwal and Prasad (1997),
with appropriate modifications. Respondents were asked to indicate the extent of agreement or
disagreement with the four statements concerning PIICT on a 7-point Likert-type scale ranging
from (1) strongly disagree to (7) strongly agree. The following are the items used to measure the
current construct:
1. I attempt to experiment with any new information and communication technology I
hear about.
2. Among my peers, I am usually the first to try out new information and
communication technology.
3. In general, I am hesitant to try out new information and communication technology
based features/services.
4. I like to experiment with new information and communication technology.
3.4.2 Result Demonstrability
Result demonstrability is defined as the extent to which the tangible results of using an
innovation can be observable and communicable (Rogers, 1995). The following three items were
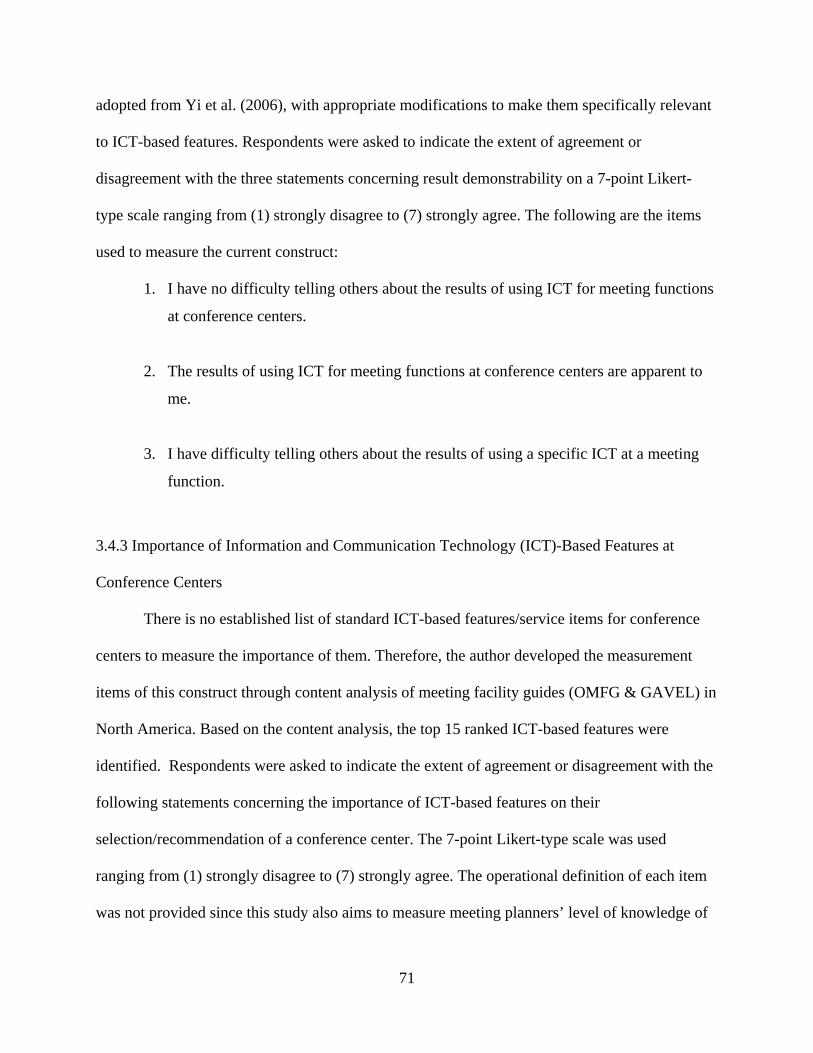
71
adopted from Yi et al. (2006), with appropriate modifications to make them specifically relevant
to ICT-based features. Respondents were asked to indicate the extent of agreement or
disagreement with the three statements concerning result demonstrability on a 7-point Likert-
type scale ranging from (1) strongly disagree to (7) strongly agree. The following are the items
used to measure the current construct:
1. I have no difficulty telling others about the results of using ICT for meeting functions
at conference centers.
2. The results of using ICT for meeting functions at conference centers are apparent to
me.
3. I have difficulty telling others about the results of using a specific ICT at a meeting
function.
3.4.3 Importance of Information and Communication Technology (ICT)-Based Features at
Conference Centers
There is no established list of standard ICT-based features/service items for conference
centers to measure the importance of them. Therefore, the author developed the measurement
items of this construct through content analysis of meeting facility guides (OMFG & GAVEL) in
North America. Based on the content analysis, the top 15 ranked ICT-based features were
identified. Respondents were asked to indicate the extent of agreement or disagreement with the
following statements concerning the importance of ICT-based features on their
selection/recommendation of a conference center. The 7-point Likert-type scale was used
ranging from (1) strongly disagree to (7) strongly agree. The operational definition of each item
was not provided since this study also aims to measure meeting planners’ level of knowledge of

72
the ICT-based items, which is often used in the form of technology jargon in many meeting
facility guides and marketing materials. Therefore, the questionnaire included an answer option
of “no knowledge” in each statement. The following are the items measuring the current
construct:
1. “High speed Internet” is an important attribute when I recommend/select a
conference center to the buying center.
2. “Network” is an important attribute when I recommend/select a conference center to
the buying center.
3. “Wireless network” is an important attribute when I recommend/select a conference
center to the buying center.
4. “Fiber optic” is an important attribute when I recommend/select a conference center
to the buying center.
5. “Videoconferencing system” is an important attribute when I recommend/select a
conference center to the buying center.
6. “Ethernet” is an important attribute when I recommend/select a conference center to
the buying center.
7. “ISDN” is an important attribute when I recommend/select a conference center to the
buying center.
8. “Local area network (LAN)” is an important attribute when I recommend/select a
conference center to the buying center.
9. “Satellite uplink and downlink” are important attributes when I recommend/select a
conference center to the buying center.

73
10. “T1 line” is an important attribute when I recommend/select a conference center to the
buying center.
11. “Virtual Private Network (VPN)” is an important attribute when I recommend/select
a conference center to the buying center.
12. “Category 5 copper line” is an important attribute when I recommend/select a
conference center to the buying center.
13. “Web broadcasting capability” is an important attribute when I recommend/select a
conference center to the buying center.
14. “Computer lab” is an important attribute when I recommend/select a conference
center to the buying center.
15. “E-mail station (kiosk)” is an important attribute when I recommend/select a
conference center to the buying center.
3.4.4 Perceived Importance of the Availability of Technical Support
Technical support is the service provided by technicians to solve technology related
problems or to consult for adoption of technology. It can be provided through (a) in-house
technical support (e.g. IT department) or (b) on-site technical support offered by a meeting
facility (IACC, 2004, 2007a; M&C, 2006). Respondents were asked to indicate the extent of
agreement or disagreement with four statements concerning perceived importance of the
availability of technical support on a 7-point Likert-type scale ranging from (1) strongly disagree
to (7) strongly agree. The following are the items used to measure this construct:
74
1. Availability of in-house technical support (e.g. IT department) is important when I
recommend/select a conference center with ICT-based features.
2. Availability of on-site technical support (at a conference center) is important when I
recommend/select a conference center with ICT-based features.
3.4.5 Self-Efficacy
Self-efficacy is defined as people’s beliefs about their capabilities to produce
performances that influence events affecting their lives (Bandura, 1995). The following items
were adapted from the measuring items of self-efficacy, with appropriate modifications to make
them specifically relevant to ICT-based features. Respondents were asked to indicate the extent
of agreement or disagreement with two statements concerning self-efficacy on a 7-point Likert-
type scale ranging from (1) strongly disagree to (7) strongly agree. The following are the items
used to measure the current construct:
1. I am certain that I can apply ICT based-features at a conference center for my next
meeting.
2. There is a lot that I can do to be sure of applying ICT based-features at a conference
center for my next meeting.
3.4.6 Perceived Usefulness
Davis (1986) defined perceived usefulness as the prospective user’s subjective
probability that using a specific application system will increase his or her job performance
within an organizational context. The five items were adapted from Davis et al. (1989), with
appropriate modifications to make them specifically relevant to ICT-based features. Respondents
were asked to indicate the extent of agreement or disagreement with the five statements
75
concerning perceived usefulness on a 7-point Likert-type scale ranging from (1) strongly
disagree to (7) strongly agree. The following are the items used to measure the current construct.
1. Using the ICT-based features enables me to accomplish tasks more quickly. 2. Using the ICT-based features improves my job performance. 3. Using the ICT-based features increases my productivity. 4. Using the ICT-based features enhances my effectiveness on the job. 5. Overall, I find the ICT-based features useful in my job.
3.4.7 Perceived Ease of Use
Perceived ease of use is the degree to which the prospective user expects the target
system to be free of effort (Davis, 1986). The five items were adapted from Davis et al. (1989),
with appropriate modifications to make them specifically relevant to ICT-based features.
Respondents were asked to indicate the extent of agreement or disagreement with the five
statements concerning perceived ease of use on a 7-point Likert-type scale ranging from (1)
strongly disagree to (7) strongly agree. The following are the items used to measure the current
construct:
1. Learning to operate the ICT-based features at conference centers for a meeting
function is easy for me.
2. I find it easy to get the ICT-based features at conference centers to do what I want
them to do.
3. Usage of the ICT-based features at conference centers is clear and understandable.
4. It is easy for me to remember how to perform tasks using the ICT-based features at
conference centers.

76
5. Overall, I find the ICT-based features at conference centers easy to use.
3.4.8 Demographic Information
In addition to the scales discussed above, gender, year of birth, education, type of
organization, job title, and years in the meeting industry were asked to gather the demographic
information.
3.5 Reliability and Validity of Measures
Reliability focuses on the extent to which measurements are consistent (Nunally &
Durham, 1975). High component of true score and low component of random error also indicate
reliability of measurement items (Carmine & Zeller, 1979). Internal consistency reliability
measures correlations with its item-to-total variance. Cronbach’s alpha is often used as an
estimation of the reliability of a multi-item measure. When its value is higher than 0.60, it is
considered to have reliability in exploratory research (Nunnally & Durham, 1975).
Although reliability is a necessary condition of the construct, the construct itself must
also be valid (Zikmund, 2000). Construct validity ensures that the instruments used are
accurately measuring the intended construct in a study (Churchill, 1979). If the measure behaves
in a pattern of inter-correlation with a variety of other variables, there is evidence for construct
validity as entirely adequate to define the quality to be measured. Construct validity is often
achieved by verifying convergent validity and discriminant validity (Zikmund, 2000).
Convergent validity is the degree to which multiple attempts to measure the same concepts are in
agreement. Convergent validity is established by the correlation of different methods of
measuring the similar construct. When it is highly correlated with different measures of similar
77
constructs, the measure of a theoretical concept has convergent validity. Discriminant validity is
the degree to which measures of different concepts are distinct. If two or more constructs are
unique, then measuring items of each should not highly correlate. Therefore, the primary
criterion for suggesting discriminant validity is that each item must load more highly on its
associated construct than on any other (Davis & Cosenza, 1993; Straub et al., 1997). Factor
analysis is the most often used method to examine construct validity (Kerlinger, 1986; Davis et
al., 1989; Straub et al., 1997).
3.6 Pre-Test
The first draft of the questionnaire was circulated to the members of Meeting
Professionals International (MPI) student/faculty committee members who have experience and
knowledge of meeting facility selection/recommendation, for feedback regarding wording,
format, content, and comprehension of the questionnaire items. Minor changes were made based
on their suggestions. The pre-test allowed the refinement of the measures, resulting in the final
set to be used in the study. Based on the feedback received, the questionnaire was further
modified for its final format for pilot study. The resulting survey was pilot tested using meeting
planner members from a Potomac Chapter of MPI to identify internal consistency.
3.7 Data Collection
The final draft of the questionnaire was mailed to the selected meeting planners which
were asked to complete the survey instrument with respect to their organization’s current and
future conference center selection. Before conducting the survey, the researcher had obtained

78
the official approval from the VT Institutional Review Board for conducting a study involving
human subjects. The final questionnaire was mailed out in June 2008.
3.8 Data Analysis/Testing Procedures
All analyses were conducted by the Statistical Package for the Social Sciences (SPSS)
software. The following data analysis and hypotheses tests were performed. As factor analysis
provides empirical basis for assessing the structure of variables and the potential for creating
these composite measures or selecting a subset of representative variables for further analysis,
factor analysis was performed. Factor analysis is also often used for data reduction and
summarization with variables created by new research (Hair et al., 2006). When factor analysis is
used in new research, it also can determine structure and create new composite scores from the
original values. Thus defining the set of variables to be examined is critical as the researcher
implicitly specifies the potential dimensions that can be identified through the character or nature
of the variables submitted to factor analysis (Hair et al., 2006). Exploratory and R factor
analysis were performed to search for underlying structures among the defined set of 15 ICT-
based features at conference centers based on its importance on selection/recommendation of a
conference center.
The hypothesized relationships were tested using the regression analysis among
constructs. A number of researchers have implemented the regression analysis in technology
acceptance studies (Davis et al., 1989; Moon & Kim, 2001; Straub et al., 1997; Szjana, 1994)
and this study used the same technique to maintain consistency with earlier studies. Regression
analysis is by far the most widely used and versatile dependence technique (Hair et. al., 2006).
A frequency distribution was performed for the demographic characteristics of respondents.
Descriptive statistics (means and standard deviations) were used for all scales. The Cronbach’s

79
alpha coefficient was used to test the internal consistency of items and principal component
factor analysis with Varimax rotation was conducted to assess the validity of the constructs. The
Independent sample t-tests were utilized to address non-response bias.
3.9 Summary
In this chapter, the research constructs were defined along with measurement items of
each construct. The research hypotheses were developed and explained. In addition, research
design, sampling and sample size, data collection methods, and statistical analysis methods were
discussed.
80
CHAPTER IV
ANALYSIS AND RESULTS
4.1 Introduction
This chapter introduces the results of respondent demographics, the data analysis, as well
as the tests of the research hypotheses.
4.2 Data Collected
A total of 1,463 individuals were selected from the client lists of three conference centers.
Questionnaires were mailed out with a cover letter that explained the nature of the study with a
pre-paid return envelope. After four weeks of mailing out surveys, a reminder post card was sent
out to encourage response. A second mailing of the questionnaire was sent out eight weeks later
to ask for further participation in the study. The overall response rate was 13.1% (191 responses).
Seven responses were eliminated before data coding because they were partially completed. A
filter question, “Are you responsible for selection or recommendation of a meeting facility for
your organization’s meeting?” was used to screen out respondents who were not qualified for
this study. As the purpose of this study is to understand the behaviors of meeting planners or
people who have an equivalent responsibility to select/recommend a meeting facility to their
organization, 18 returned surveys that selected “no” to the filter question were dropped. After
eliminating the unusable responses, a total of 167 responses were coded for data analysis. Ideal
sample size for factor analysis is more than 100 or the minimum is to have at least five times as
many observations per each variable. As there were fifteen variables to be analyzed, the collected
167 respondents have exceeded the minimum sample size of 150, required by the conservative
ten to one ratio.

81
4.3 Profiles of Respondents
The characteristics of the subjects’ demographics were summarized and described in Table 4.1.
Table 4.1 Profiles of Respondents
Characteristics N Percent (%)
Gender (n = 167) Male 32 19.2 Female 135 80.8 Education (n = 167) High school 9 5.4 Associate degree 10 6.0 2 year college 13 7.8 4 year college 95 56.9 Master 37 22.2 Doctor 3 1.8 Years in the industry (n = 165) Less than 2 years 9 5.5 2-5 years 31 18.8 6-9 years 33 20.0
10-15 years 42 25.5 More than 15 years 50 30.3
Age (n=152) 20~29 24 15.8 30-39 46 30.3 40-49 46 30.3 50-59 34 22.4 60 and over 2 1.3 Type of meeting planner (n=167) Association 70 41.9 Corporate 54 32.3 Government 30 18.0 Other 13 7.8 Job Title (n = 167) Vice P. of Meetings 7 4.2 Director of Meetings 35 21.0 Manager of Meetings 50 29.9 Coordinator of Meetings 27 16.2 Other 48 28.7

82
As shown in Table 4.1, the respondents were heavily female centered as it is in the profile
of meeting planners in the meeting industry. Approximately 80.8% of the subjects were female
whereas about 19.2% of the respondents were male. The level of education shows the majority of
the subjects (80.9%) stated that they had a 4-year college eductation or higher. Almost 55.2% of
respondents had a job title of meeting manager or higher rank and 76% of them had more than 6
years of experience in the meeting industry. Respondents were asked to provide the year of their
birth to obtain accurate age information. Ages ranged from 24 to 68 years old. On average,
respondents were 42 years old. Respondents were well-balanced in terms of their age, with
respect to the age distribution of the subjects: between 30 and 49 years old (30.3%); between 40
and 49 years old (30.3%); and 50 and 59 (22.4%). The average profile of the respondent was a
42 year old female with a 4 years college education. In addition, all respondents were responsible
for meeting facility selection/recommendation (Table 4.1).
4.4 Analysis of Importance of ICT-based feature on conference center selection/recommendation
The statement, "the given ICT-based feature is an important determinant when I
recommend or select a conference center," was developed to test if there was any significant
difference in the perceived importance on conference center selection/recommendation among
the fifteen ICT-based features. The subjects were asked to select the number that most closely
describes their opinion. (1= strongly disagree, 2= moderately disagree, 3= somewhat disagree, 4
= neutral, 5= somewhat agree, 6= moderately agree, 7= strongly agree). Table 4.2 presents
perceived importance of ICT-based features on conference center selection/recommendation by
the order of mean. “High-speed Internet” lead the group with the highest mean (5.87), followed
by “wireless” (5.41), “e-mail station” (4.53), “T1 line” (4.40), and “network” (4.28).

83
Table 4.2 Mean of importance of ICT-based features by order
Rank Items Mean S.D.
1 High-speed Internet 5.87 1.68
2 Wireless 5.41 1.63
3 E-mail station (kiosk) 4.53 2.15
4 T1 Line 4.40 2.12
5 Network 4.28 1.79
6 Local Area Network (LAN) 3.79 1.91
7 Ethernet 3.77 1.88
8 Virtual Private Network (VPN) 3.65 1.98
9 Fiber optic 3.57 1.72
10 Integrated Services Digital Network
(ISDN) 3.57 1.82
11 Computer lab 3.46 2.06
12 Videoconferencing 3.26 1.82
13 Web broadcasting 3.21 1.93
14 Satellite uplink and downlink 2.79 1.59
15 Category 5 copper cable 2.77 1.68
The respondents could select “no knowledge” as an answer for each item asking the level
of agreement with the statement of perceived importance of each given ICT-based feature. This
has two purposes. First, it avoids respondents making a choice without a clear understanding of
the given item, which is often the main source of random choice error (Zigmund, 2002). Second,
it is to directly measure the respondents’ level of knowledge of the technology terms used in the
questionnaire, which were identified from meeting facility guides and marketing materials. It is
not surprising that no one selected “no knowledge” of the term “high speed Internet” and only
one for “wireless” with the popular usage of high-speed wireless Internet in today’s daily
business and personal life. However, 56 out of the total 167 respondents indicated “no

84
knowledge” for the term “category 5 copper cable” followed by “ISDN” (29), “Fiber optic” (24),
“VPN” (23), “satellite uplink/downlink” (21), “Ethernet” (21), and “LAN” (21). It is notable that
the terms that are technology jargon and related to a network backbone (see appendix 2) are
usually behind-the-wall technology infrastructure and meeting planners have shown that they
have very little knowledge in such terms (see Table 4.3).
Table 4.3 Frequency of “No Knowledge” by Order
Rank Items Frequency Percent
1 Category 5 copper cable 56 35.5%
2 ISDN 29 17.4%
3 Fiber optic 24 14.4%
4 VPN 23 13.8%
5 Satellite uplink and downlink 21 12.6%
6 Ethernet 21 12.6%
7 LAN 18 10.8%
8 T1 Line 17 10.2%
9 Network 12 7.2%
10 Web broadcasting 8 4.8%
11 Videoconferencing 6 3.6%
12 Computer lab 6 3.6%
13 E-mail station (kiosk) 3 1.8%
14 Wireless 1 0.6%
15 High-speed Internet 0 0.0%

85
One of main purposes of this study was to test whether there is any difference in the
perceived importance of ICT-based features on a conference center selection/recommendation
among the various types of meeting planners. Table 4.4 presents the means of each item by the
type of meeting planners. As shown in Table 4.4, corporate meeting planners had the highest
mean on 7 items: “high speed internet,” “network,” “wireless,” “Fiber optic,” “LAN,” “Web
broadcasting,” and “computer lab.” Government planners show the highest mean in following
items: “videoconferencing,” “Ethernet,” “ISDN,” “satellite uplink/downlink,” “T1 line,” “VPN,”
and “category 5 copper cable.” Government meeting planners had the highest mean on 6 items
while association meeting planners had only 2 items with the highest mean among the three type
of meeting planners.

86
Table 4.4 Mean of each ICT-based item by type of meeting planner
Items
Type of meeting planners
Association, n=70
(standard deviation)
Corporate, n=54 Government, n=30
High speed internet 5.54 (1.86) 6.11 (1.34) 5.867 (1.87)
Network 4.05 (1.82) 4.65 (1.79) 4.30 (1.90)
Wireless 5.28 (1.71) 5.98 (1.80) 4.87 (2.01)
Fiber Optic 3.02 (1.52) 4.04 (1.81) 3.81 (1.71)
Videoconferencing 2.94 (1.66) 3.40 (1.81) 3.57 (1.96)
Ethernet 3.25 (1.60) 3.92 (1.95) 4.48 (2.14)
ISDN 3.40 (1.70) 3.66 (1.96) 3.74 (2.05)
LAN 3.76 (1.82) 3.90 (2.03) 3.76 (2.07)
Satellite
uplink/downlink
2.75 (1.54) 2.63 (1.51) 3.16 (1.95)
T1 line 4.29 (2.20) 4.45 (4.63) 4.63 (2.32)
VPN 3.60 (1.97) 3.71(1.95) 3.88 (2.35)
Category 5 copper
cable
2.56 (1.36) 2.78 (1.93) 2.95 (1.96)
Web broadcasting 3.27 (1.93) 3.24 (1.95) 2.89 (1.87)
Computer lab 3.26 (1.96) 3.75 (2.02) 3.66 (2.44)
E-mail station 4.86 (2.00) 4.28 (2.18) 4.07 (2.36)
A one-way ANOVA test was conducted to test whether the mean difference among the
meeting planners was statistically significant. An important first step in ANOVA is establishing
the validity of assumptions. One assumption of ANOVA is that the variances of the groups are
equivalent. The variance in the government meeting planners group was much larger than both
association and corporate meeting planners (see Figure 4.1). It was expected to be due to the
much smaller sample number of government meeting planners groups than association and

87
corporate meeting planners (30 vs. 74, 50). Another way of testing the equal variance is by the
Levene’s test. When the significant level is higher than 0.05, the Levene statistic cannot reject
the null hypothesis that the group variances are equal (Hair et al., 2006). Equal variance
assumption was met for all ICT-based features but high-speed internet, wireless, and category 5
copper cable (Table 4.5). ANOVA is very robust to the violation of equal variance when the
groups are of equal or near equal size. However, as the three groups were not of equal size, the
rejection of the null hypothesis on high-speed internet, wireless, and category 5 copper cable was
not a serious violation of the assumption
Figure 4.1 Diagram of Variance of Each Group

88
Table 4.5 Test of Homogeneity of Variances
Item Levene Statistic df1 df2 Sig.
High speed internet 3.501 2 151 .033
network .058 2 141 .944
Wireless 7.489 2 150 .001
Fiber Optic .530 2 129 .590
Videoconferencing 1.392 2 145 .252
Ethernet 2.223 2 131 .112
ISDN 1.332 2 124 .268
LAN .610 2 135 .545
Satellite uplink/downlink 2.259 2 132 .108
T1 line .473 2 135 .624
VPN .919 2 130 .402
Category 5 copper cable 4.148 2 98 .019
Web broadcasting .151 2 143 .860
Computer lab 2.949 2 145 .056
E-mail station 2.360 2 149 .098
As presented in Table 4.6, the mean difference among the three types of planners in
“wireless,” “fiber optic,” and “Ethernet” are statistically significant at the level of 0.05.

89
Table 4.6 Results of One-way ANOVA
Item Sum of
Squares df Mean Square F Sig.
High speed internet Between Groups 9.984 2 4.992 1.728 .181
Within Groups 436.171 151 2.889
Total 446.156 153
network Between Groups 10.677 2 5.339 1.608 .204
Within Groups 468.260 141 3.321
Total 478.938 143
Wireless Between Groups 27.562 2 13.781 5.408 .005
Within Groups 382.216 150 2.548
Total 409.778 152
Fiber Optic Between Groups 29.756 2 14.878 5.376 .006
Within Groups 356.972 129 2.767
Total 386.727 131
Videoconferencing Between Groups 10.546 2 5.273 1.671 .192
Within Groups 457.643 145 3.156
Total 468.189 147
Ethernet Between Groups 29.222 2 14.611 4.320 .015
Within Groups 443.106 131 3.382
Total 472.328 133
ISDN Between Groups 2.600 2 1.300 .374 .689
Within Groups 430.707 124 3.473
Total 433.307 126
LAN Between Groups .613 2 .306 .081 .922
Within Groups 510.489 135 3.781
Total 511.101 137
Satellite
uplink/downlink Between Groups 4.865 2 2.433 .938 .394
Within Groups 342.468 132 2.594
Total 347.333 134

90
Table 4.6 Results of One-way ANOVA (Continued.)
Item Sum of Squares df Mean Square F Sig.
T1 line Between Groups 2.166 2 1.083 .232 .794
Within Groups 631.110 135 4.675
Total 633.275 137
VPN Between Groups 1.336 2 .668 .162 .851
Within Groups 537.025 130 4.131
Total 538.361 132
Category 5
copper cable Between Groups 2.345 2 1.172 .404 .669
Within Groups 284.329 98 2.901
Total 286.673 100
Web
broadcasting Between Groups 2.988 2 1.494 .404 .669
Within Groups 529.019 143 3.699
Total 532.007 145
Computer lab Between Groups 7.989 2 3.994 .921 .401
Within Groups 628.984 145 4.338
Total 636.973 147
E-mail station Between Groups 16.764 2 8.382 1.839 .163
Within Groups 679.229 149 4.559
Total 695.993 151
However, ANOVA only tests that means are not equal. In an effort to further identify
which type of meeting planners differ from another, a post hoc test was conducted. Because the
homogeneity of variances of high-speed internet, wireless, and category 5 copper cable were
violated, the researcher undertook a Games Howell post hoc test instead of a Tukey’s HSD test
to see which type of meeting planners differs from another (Hair et al., 2006).
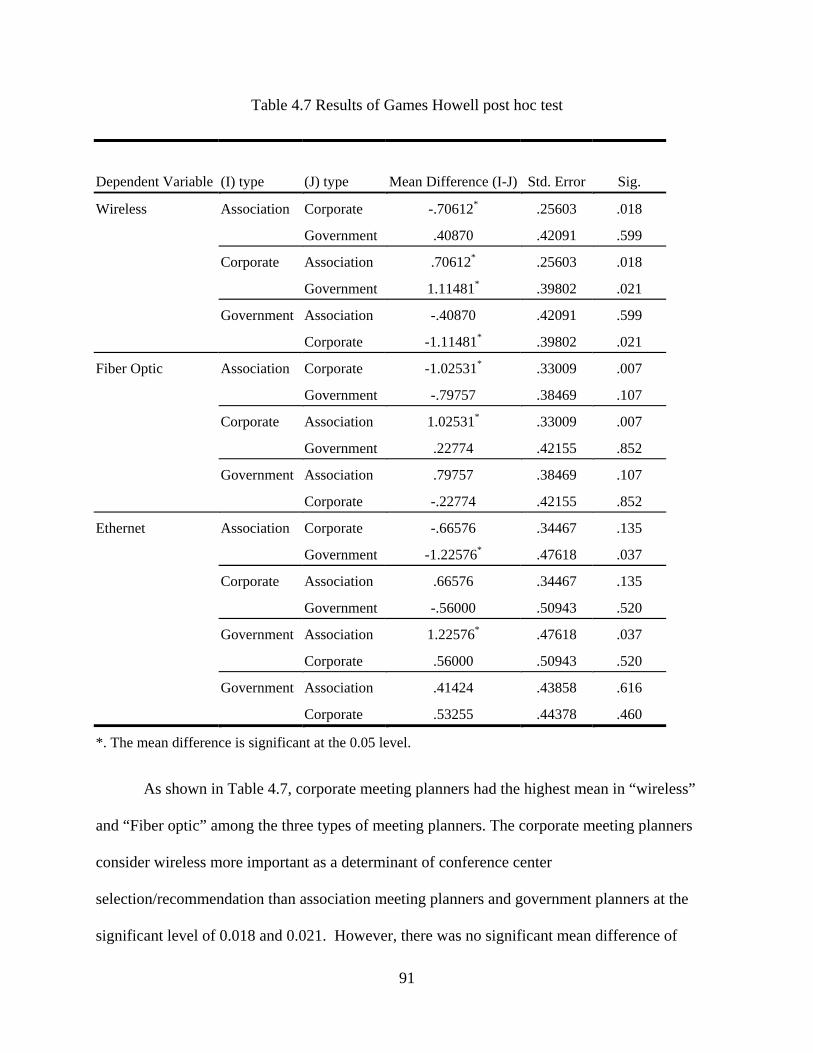
91
Table 4.7 Results of Games Howell post hoc test
Dependent Variable (I) type (J) type Mean Difference (I-J) Std. Error Sig.
Wireless Association Corporate -.70612* .25603 .018
Government .40870 .42091 .599
Corporate Association .70612* .25603 .018
Government 1.11481* .39802 .021
Government Association -.40870 .42091 .599
Corporate -1.11481* .39802 .021
Fiber Optic Association Corporate -1.02531* .33009 .007
Government -.79757 .38469 .107
Corporate Association 1.02531* .33009 .007
Government .22774 .42155 .852
Government Association .79757 .38469 .107
Corporate -.22774 .42155 .852
Ethernet Association Corporate -.66576 .34467 .135
Government -1.22576* .47618 .037
Corporate Association .66576 .34467 .135
Government -.56000 .50943 .520
Government Association 1.22576* .47618 .037
Corporate .56000 .50943 .520
Government Association .41424 .43858 .616
Corporate .53255 .44378 .460
*. The mean difference is significant at the 0.05 level.
As shown in Table 4.7, corporate meeting planners had the highest mean in “wireless”
and “Fiber optic” among the three types of meeting planners. The corporate meeting planners
consider wireless more important as a determinant of conference center
selection/recommendation than association meeting planners and government planners at the
significant level of 0.018 and 0.021. However, there was no significant mean difference of

92
wireless between the association meeting planners and the government meeting planners. There
was also significant mean difference of “fiber optic” between the corporate meeting planners and
the association meeting planners at the significance level of 0.029. This finding indicated that the
corporate meeting planners considered the fiber optic more important as a determinant of site
selection/recommendation than association meeting planners. However, neither the mean
difference between corporate meeting planners and government planners nor between association
meeting planners and government planners was statistically significant. Government meeting
planners had a higher mean in “Ethernet” than association meeting planners at the significant
level of 0.037. However, there was no significant mean difference between association meeting
planners and corporate planners nor between corporate planners and government planners.
Overall, the corporate meeting planners put more importance on wireless network and fiber optic,
which allow fast Internet connection, than the association meeting planners and government
planners did. The association planners put the least importance on the identified ICT-based
features—wireless, Fiber-optic, and Ethernet—among the three types of meeting planners.
Mean scores of the perceived importance of the availability of on-site and in-house
technical support is presented in Table 4.8. The result indicated that all types of meeting planners
considered both forms of technical support were important for their conference center
selection/recommendation with a mean of 5.46 (on-site technical support) and 4.48 (in-house
technical support). A one-way ANOVA test was conducted to test if the mean difference is
statistically significant among the three types of meeting planners. The result showed that there
was no significant difference in the perceived importance of availability of technical support
among the three types of meeting planners.

93
Table 4.8 Mean of Importance of ICT-based service
Items Mean Std. Deviation
On-site technical staff/support 5.46 1.608
In-house technical staff/support 4.48 1.876
A paired-samples T-test was conducted to see whether the mean difference between the
perceived importance of on-site and in-house technical support for conference center
selection/recommendation is significant. The result showed that meeting planners consider
technical support from a conference center as more important than in-house technical support
when they make a selection/recommendation of a conference center (5.46 vs. 4.48). Table 4.9
summarizes the results of the paired-samples T-test.
Table 4.9 Result of Paired-samples T-test on Perceived Importance of Availability of Technical Support
Mean Std.
Deviation Std. Error
Mean t df Sig. (2-tailed)
Pair 1 q3_8 -
q3_9 .988 1.821 .143 6.903 161 .000
4.4 Descriptive Statistics
Descriptive statistics (means and standard deviations) for PIICT, self-efficacy, result
demonstrability, perceived importance of the availability of technical support, perceived
usefulness, and perceived ease of use are discussed in this section.
4.4.1 Personal Innovativeness of ICT (PIICT)
PIICT is defined as the willingness of an individual to try out any new ICT and it
describes the extent to which an individual has an innate propensity toward adopting a new ICT.
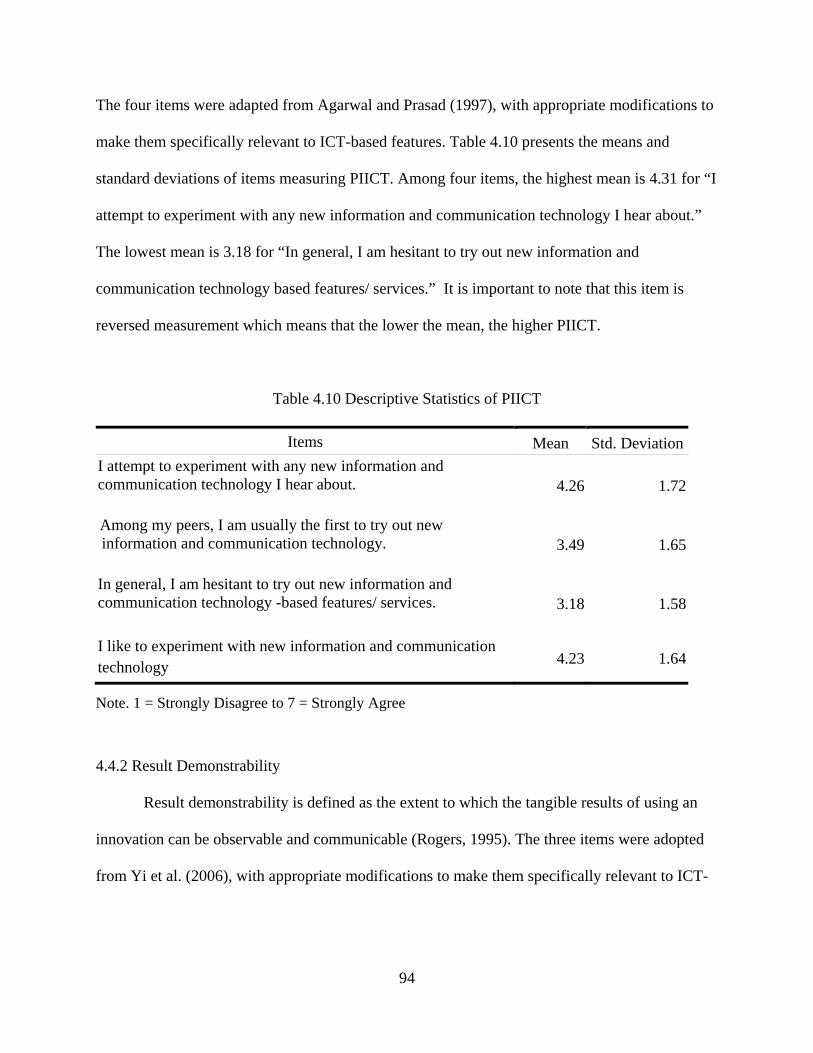
94
The four items were adapted from Agarwal and Prasad (1997), with appropriate modifications to
make them specifically relevant to ICT-based features. Table 4.10 presents the means and
standard deviations of items measuring PIICT. Among four items, the highest mean is 4.31 for “I
attempt to experiment with any new information and communication technology I hear about.”
The lowest mean is 3.18 for “In general, I am hesitant to try out new information and
communication technology based features/ services.” It is important to note that this item is
reversed measurement which means that the lower the mean, the higher PIICT.
Table 4.10 Descriptive Statistics of PIICT
Items Mean Std. Deviation
I attempt to experiment with any new information and communication technology I hear about.
4.26 1.72
Among my peers, I am usually the first to try out new information and communication technology.
3.49 1.65
In general, I am hesitant to try out new information and communication technology -based features/ services.
3.18 1.58
I like to experiment with new information and communication technology 4.23 1.64
Note. 1 = Strongly Disagree to 7 = Strongly Agree
4.4.2 Result Demonstrability
Result demonstrability is defined as the extent to which the tangible results of using an
innovation can be observable and communicable (Rogers, 1995). The three items were adopted
from Yi et al. (2006), with appropriate modifications to make them specifically relevant to ICT-

95
based features. Table 4.11 depicts the means and standard deviations of items measuring result
demonstrability. The means for result demonstrability ranged from 4.41 to 4.68.
Table 4.11 Descriptive Statistics of Result Demonstrability
Items Mean Std. Deviation
I have no difficulty telling others about the results of using the
ICT-abase feature(s) for meeting function at conference centers.
4.68 1.83
I believe I can communicate to others the consequences of using the ICT-abase feature(s) for meeting function at conference centers.
4.41 1.80
The results of using the ICT-abase feature(s) for meeting function at conference centers are apparent to me. 4.66 1.78
Note. 1 = Strongly Disagree to 7 = Strongly Agree
4.4.3 Perceived Importance of the Availability of Technical Support
Technical support is the service provided by technicians to solve problems or to consult
for adoption of technology. It can be provided through (a) in-house technical support (e.g. IT
department) or (b) on-site technical support offered by conference centers (2003 State of the
Industry). Table 4.12 depicts the means and standard deviations of items measuring perceived
importance of the availability of technical support. The means of items for perceived importance
of the availability of technical support ranged from 4.50 to 5.50. It was notable that mean score
of the importance of on-site technical availability was almost 1 point higher than that of in-house
technical support and the difference was statistically significant as tested earlier in this chapter.

96
Table 4.12 Descriptive Statistics of Perceived Importance of the Availability of Technical Support
Items Mean Std. Deviation
Availability of on-site technical support (at a conference center) is important when I recommend a conference center with ICT-based features.
5.50 1.62
Availability of in-house technical support (e.g. IT department) is important when I recommend a conference center with ICT-based features
4.50 1.87
Note. 1 = Strongly Disagree to 7 = Strongly Agree
4.4.4 Self-efficacy
Self-efficacy is defined as people’s belief about their capabilities to produce
performances that influence events affecting their lives (Bandura, 1995). The following items
were adapted from the items measuring self-efficacy, with appropriate modifications to make
them specifically relevant to ICT-based features. Table 4.13 depicts the means and standard
deviations of items measuring self-efficacy. The means for self-efficacy ranged from 4.61 to 4.87.
Table 4.13 Descriptive Statistics of Self-efficacy
Items Mean Std. Deviation
I am confident that I am able to apply ICT based-features at a conference center for my next meeting.
4.87 1.67
There is a lot that I can do to be sure of applying ICT based-features at a conference center for my next meeting.
4.61 1.65
Note. 1 = Strongly Disagree to 7 = Strongly Agree
4.4.5 Perceived Usefulness
Perceived usefulness of ICT-based features is defined as the strength of a user’s belief
that using ICT-based features at a conference center would enhance his or her work performance

97
in this study. The six items were adapted from Davis et al. (1989), with appropriate
modifications to make them specifically relevant to ICT-based features. Respondents were asked
to indicate the extent of agreement or disagreement with the six statements concerning ICT-
based feature on a 7-point Likert-type scale ranging from (1) strongly disagree to (7) strongly
agree. Following are the items used to measure the current construct. Table 4.14 depicts the
means and standard deviations of items measuring perceived usefulness. The means for
perceived usefulness ranged from 5.07 to 5.31. All five items’ measuring perceived usefulness
mean are higher than 5, which show that the respondents somewhat or moderately agree on the
perceived usefulness of ICT-based features at a conference center.
Table 4.14 Descriptive Statistics of Perceived Usefulness
ItemsMean
Std. Deviation
Using the ICT-based features enables me to accomplish tasks more quickly. 5.07 1.83
Using the ICT-based features improves my job performance. 5.18 1.82
Using the ICT-based features increases my productivity. 5.25 1.77
Using the ICT-based features enhances my effectiveness on the job. 5.25 1.74
Overall, I find the ICT-based features useful in my job. 5.31 1.76
Note. 1 = Strongly Disagree to 7 = Strongly Agree
4.4.6 Perceived Ease of Use
Perceived ease of use is the degree to which the prospective user expects the target
system to be free of effort (Davis, 1986). The six items were adapted from Davis et al. (1989),
with appropriate modifications to make them specifically relevant to ICT-based features.
Respondents were asked to indicate the extent of agreement or disagreement with the six
statements concerning ICT-based features on a 5-point Likert-type scale ranging from (1)
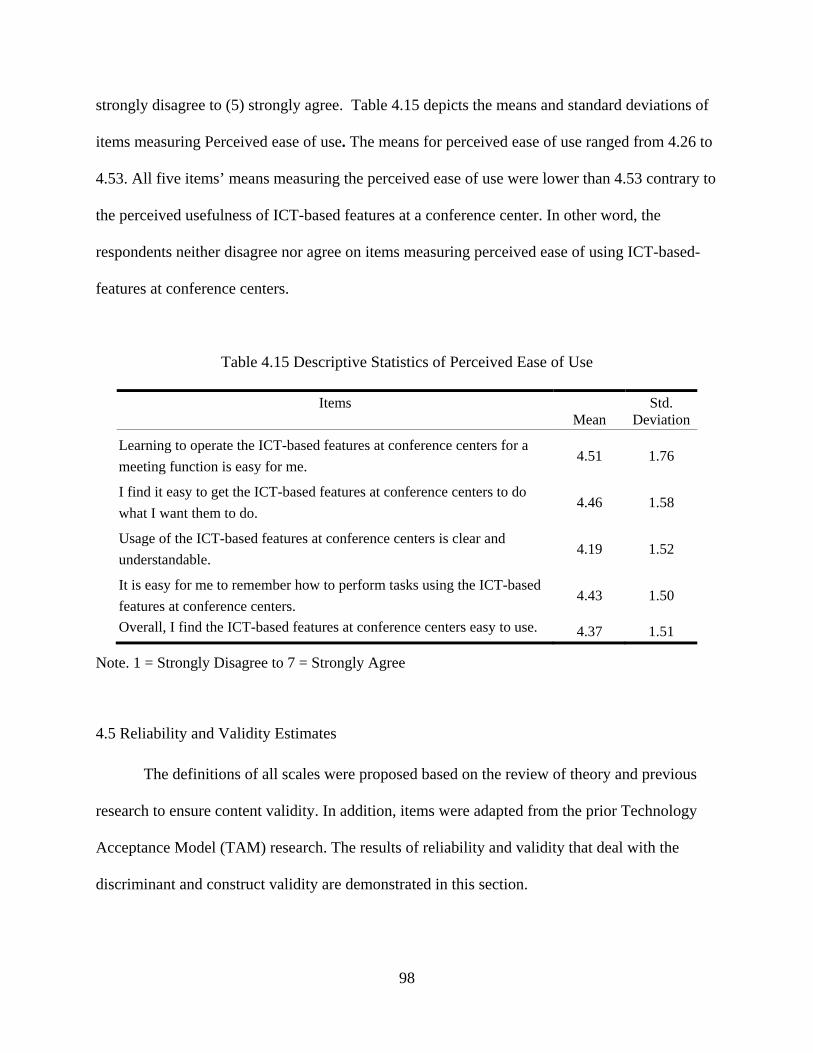
98
strongly disagree to (5) strongly agree. Table 4.15 depicts the means and standard deviations of
items measuring Perceived ease of use. The means for perceived ease of use ranged from 4.26 to
4.53. All five items’ means measuring the perceived ease of use were lower than 4.53 contrary to
the perceived usefulness of ICT-based features at a conference center. In other word, the
respondents neither disagree nor agree on items measuring perceived ease of using ICT-based-
features at conference centers.
Table 4.15 Descriptive Statistics of Perceived Ease of Use
ItemsMean
Std. Deviation
Learning to operate the ICT-based features at conference centers for a
meeting function is easy for me. 4.51 1.76
I find it easy to get the ICT-based features at conference centers to do
what I want them to do. 4.46 1.58
Usage of the ICT-based features at conference centers is clear and
understandable. 4.19 1.52
It is easy for me to remember how to perform tasks using the ICT-based
features at conference centers. 4.43 1.50
Overall, I find the ICT-based features at conference centers easy to use. 4.37 1.51
Note. 1 = Strongly Disagree to 7 = Strongly Agree
4.5 Reliability and Validity Estimates
The definitions of all scales were proposed based on the review of theory and previous
research to ensure content validity. In addition, items were adapted from the prior Technology
Acceptance Model (TAM) research. The results of reliability and validity that deal with the
discriminant and construct validity are demonstrated in this section.

99
4.5.1 Reliability Estimates of Study
Reliability was assessed using the Cronbach’s alpha coefficient. The use of coefficient
alpha is to test the internal consistency of items relating to a single trait within a questionnaire
(Nunally, 1978). Therefore, the test was performed on the scale items within different
dimensions which were designed to measure a single common trait.
Table 4.16 summarizes the reliability estimates obtained in this study for all scales. An
acceptable coefficient is regarded as 0.70 (Nunnally & Durham, 1975), although it may decrease
to 0.60 for basic research. Of the seven dimensions of the questionnaire which were tested for
internal consistency, the coefficient alpha was higher than 0.85 above the acceptable level on all
dimensions.
Table 4.16 Results of Scale Reliability
Scale Reliability Scales Alpha Value Alpha Value after
Importance of ICT-based features (15 items) 0.92 0.92
PIICT (4 items) 0.50 0.87 (with 3 items)
Self-efficacy (2 items) 0.87 0.87
Result demonstrability (3 items) 0.93 0.93
Perceived importance of the availability of
technical support (2 items)
0.67 0.67
Perceived usefulness (5 items) 0.98 0.98
Perceived ease of use ( 5 items) 0.95 0.95
In the initial test of internal consistency reliability, one construct, PIICT was found to be
unreliable with Cronbach’s alpha coefficient at 0.50. One of the 4 items measuring PIICT was
reverse-scored on the survey instrument, suggesting that the direction of the wording may have
caused the problem. Dropping that item resulted in Cronbach’s alpha values of 0.87 for PIICT,

100
respectively. Cronbach’s alpha values for all but perceived importance of the availability of
technical support surpassed the 0.70 criteria recommended for applied research. The one
exception was the perceived importance of availability of technical support item, whose loading
was 0.67. Given that some basic studies use a 0.60 threshold instead of the 0.70 criteria, it was
retained (Table 4.16).
4.5.2 Validity Estimates of Study
The appropriateness of factor analysis was determined by the Kaiser-Meyer-Olkin (KMO
= 0.934) measure of sampling adequacy. High values (close to 1.0) generally indicate that a
factor analysis is useful with the given data. Bartlett's test of sphericity (3726.1, significance
level= 0.000) tested the hypothesis that the correlation matrix is an identity matrix, which would
indicate that variables are unrelated and therefore unsuitable for structure detection. Both results
indicated the suitability of data for structure detection.
Extraction communalities are estimates of the variance in each variable accounted for by
the components. All variables that have communalities more than .50 are acceptable, which
indicates that the extracted components represent the variables well. Table 4.17 presents the
results of the extracted components. They explained nearly 85% of the variability in the original
20 variables, so the complexity of the data set was considerably reduced by using these
components, with only a 15% loss of information.
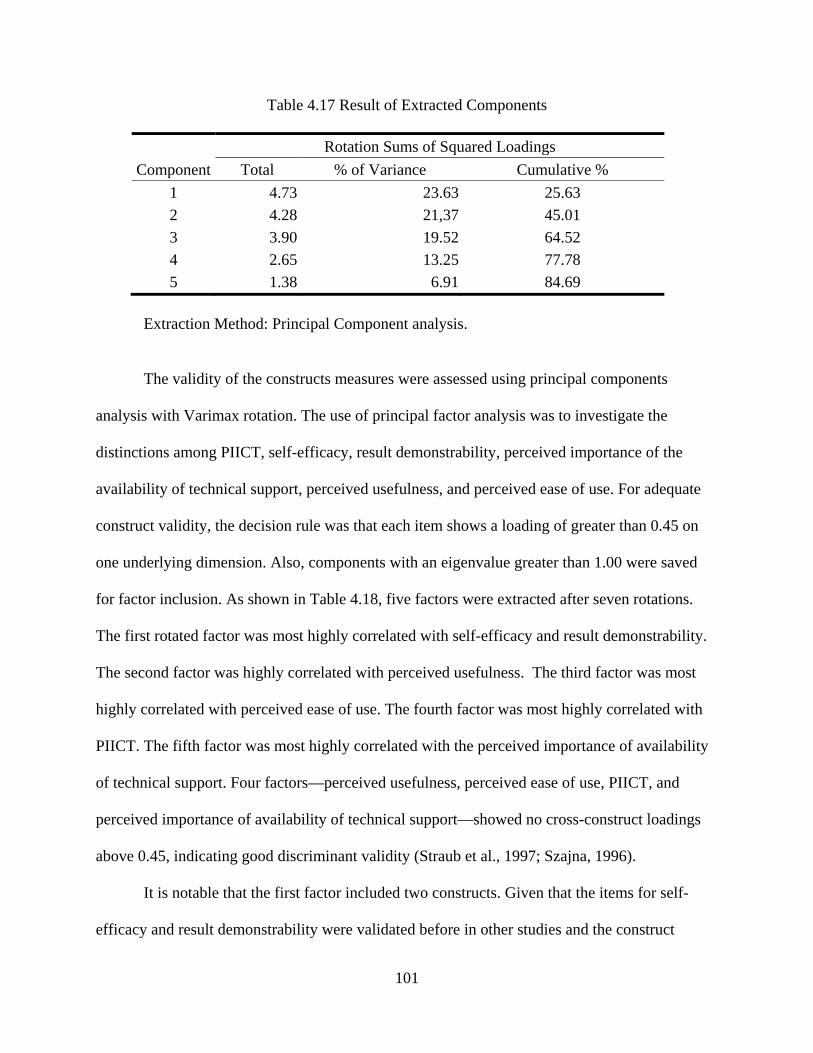
101
Table 4.17 Result of Extracted Components
Component
Rotation Sums of Squared Loadings
Total % of Variance Cumulative %
1 4.73 23.63 25.63
2 4.28 21,37 45.01
3 3.90 19.52 64.52
4 2.65 13.25 77.78
5 1.38 6.91 84.69
Extraction Method: Principal Component analysis.
The validity of the constructs measures were assessed using principal components
analysis with Varimax rotation. The use of principal factor analysis was to investigate the
distinctions among PIICT, self-efficacy, result demonstrability, perceived importance of the
availability of technical support, perceived usefulness, and perceived ease of use. For adequate
construct validity, the decision rule was that each item shows a loading of greater than 0.45 on
one underlying dimension. Also, components with an eigenvalue greater than 1.00 were saved
for factor inclusion. As shown in Table 4.18, five factors were extracted after seven rotations.
The first rotated factor was most highly correlated with self-efficacy and result demonstrability.
The second factor was highly correlated with perceived usefulness. The third factor was most
highly correlated with perceived ease of use. The fourth factor was most highly correlated with
PIICT. The fifth factor was most highly correlated with the perceived importance of availability
of technical support. Four factors—perceived usefulness, perceived ease of use, PIICT, and
perceived importance of availability of technical support—showed no cross-construct loadings
above 0.45, indicating good discriminant validity (Straub et al., 1997; Szajna, 1996).
It is notable that the first factor included two constructs. Given that the items for self-
efficacy and result demonstrability were validated before in other studies and the construct

102
reliability was high, the deduction of the two constructs into one component was assumed due to
order bias, which is caused by the influence of earlier questions in a questionnaire or by an
answer’s position in a set of answers (Zikmund, 2003). In the questionnaire, the items asking
those constructs (2 items, 3 items) were positioned one after another, which should be corrected
by randomizing of items for future study. However, given that the items for self-efficacy and
result demonstrability were validated before and the construct reliability was high, those
variables were retained and the model was tested.
Table 4.18 Factor Structure Matrix of Loadings and Cross-loadings
Variables Item Component
1 2 3 4 5
Self- efficacy Item 1 .336 .329 .709 .102 .107
Item 2 .370 .188 .752 .103 .074
Result demonstrability Item 1 .277 .265 .800 .164 .118
Item 2 .369 .284 .742 .248 .061
Item 3 .395 .279 .729 .151 .180
Perceived usefulness Item 1 .734 .189 .482 .154 .183
Item 2 .850 .281 .327 .162 .084
Item 3 .864 .221 .344 .147 .083
Item 4 .879 .208 .337 .153 .060
Item 5 .846 .189 .380 .185 .101
Item 6 .301 .653 .233 .355 .086
Perceived ease of use Item 1 .223 .864 .229 .160 .077
Item 2 .144 .887 .252 .199 .042
Item 3 .214 .840 .239 .258 .143
Item 4 .203 .866 .246 .197 .128
PIICT Item 1 .179 .253 .117 .810 .174
Item 2 .074 .217 .146 .875 .007
Item 3 .200 .232 .166 .809 .029
Importance of tech Item 1 .531 .262 .076 .084 .581
support Item 2 .077 .104 .198 .100 .912

103
4.6 Non-response Bias Testing
In order to address possible non-response bias, the responses of the earlier respondents
were compared with the later responses because late respondents are similar to non-respondents
(Armstrong & Overton, 1977). Considering the fact that later responses were collected with a
two months’ time gap, this method was even more effective to test non-response bias. Ninety-
four usable responses were returned from the initial mailing. The number of usable responses
received from the second mailing was 72.
Tthe responses of the two groups were compared for a non-response test by utilizing the
independent sample t-tests. The Levene statistic tests showed the values of the statistics for all 15
ICT-based features items except Web broadcasting (0.91), were greater than 0.10 and can
assume that the groups have equal variances. The results of the independent sample t-test also
showed that there was no difference between the two groups for all of the scales used in this study.
Since the significance value of the independent sample T-test for all 15 items, except computer
lab (0.04), were higher than 0.05, it can be concluded that the mean difference between early
respondents and later respondents was due to chance alone.
The Levene statistic test showed the values of the statistics for all 20 items measuring 7
constructs were greater than 0.10 and can assume that the groups had equal variances. Since the
significance value of the independent sample T-test for all items, except one item for “Result
demonstrability” (0.05), were higher than 0.05, it can be concluded that the mean difference
between early respondents and later respondents was due to chance alone (Table 4.19).

104
Table 4.19 Results of Non-Response Bias by Independent Sample T-tests Scales
Construct Item Early
Respondents Late
Respondents t-value Sig.
Importance of ICT-based features
Internet 5.87 5.78 0.36 0.72 Network 4.34 4.20 0.46 0.65 Wireless 5.42 5.39 0.10 0.92 Fiber optic 3.64 3.48 0.56 0.57 videoconferencing 3.48 2.99 1.71 0.89 Ethernet 3.72 3.78 -0.17 0.86 ISDN 3.63 3.48 0.46 0.65 LAN 3.98 3.57 1.30 0.20 Satellite up/down link 2.92 2.62 1.12 0.27 T1 line 4.39 4.42 -0.78 0.94 VPN 3.72 3.57 -0.25 0.67 Category 5 copper cable
2.73 2.80 0.76 0.81
Web broadcasting 3.38 2.99 1.29 0.20 Computer lab 3.76 3.07 2.12 0.04 E-mail station 4.60 4.45 0.42 0.68
PIICT Item1 4.21 4.31 -0.37 0.71 Item 2 3.45 3.56 -0.42 0.67 Item 3 4.14 4.34 -0.79 0.43
Self-efficacy Item 1 5.05 4.62 1.66 0.10 Item 2 4.83 4.32 1.99 0.05
Result demonstrability Item1 4.78 4.56 0.77 0.44 Item 2 4.49 4.31 0.67 0.51 Item 3 4.78 4.50 0.99 0.32
Perceived importance of the availability of technical support
Item 1 5.43 5.60 -0.68 0.50 Item 2 4.67 4.27 1.35 0.18
Perceived ease of use Item1 4.52 4.49 0.13 0.90 Item 2 4.44 4.50 -0.26 0.80 Item 3 4.21 4.17 0.18 0.86 Item 4 4.48 4.38 0.44 0.66 Item 5 4.46 4.26 0.82 0.42
Perceived usefulness Item1 5.07 5.06 0.67 0.95 Item 2 5.28 5.06 0.76 0.44 Item 3 5.36 5.10 0.96 0.34 Item 4 5.35 5.12 0.84 0.40 Item 5 5.45 5.12 0.38 0.24

105
4.7 Factor analysis of perceived importance of fifteen ICT-based features at conference centers
Factor Analysis attempts to identify underlying variables that explain the pattern of
correlations within a set of observed variables. This procedure is often used to reduce the number
of variables in a data set but can also be used to explore the latent structure of the variables in
data. As mentioned in an earlier chapter, the fifteen variables measuring the perceived
importance of ICT-based features were created by new research using content analysis of
meeting facility marketing and sales materials. The author can reduce the size of the data file
from fifteen variables to smaller number of components by using factor analysis with a principal
components extraction. Note that the interpretation of further analyses is dependent upon the
relationships defined in the rotated component matrix.
The appropriateness of factor analysis was determined by the Kaiser-Meyer-Olkin
(KMO = 0.875) measure of sampling adequacy and the Bartlett’s test of sphericity (p < 0.000).
The result of the two tests indicated the suitability of the data for structure detection. Extraction
communalities are estimates of the variance in each variable accounted for by the factors in the
factor solution. Small values indicate variables that do not fit well with the factor solution, and
should possibly be dropped from the analysis. The extraction communalities for this solution
were all acceptable. Only three factors in the initial solution have eigenvalues greater than 1. The
rotation maintains the cumulative percentage of variation explained by the extracted components,
but that variation is spread more evenly over the components. Together, they account for 67% of
the variability in the original variables. The rotated factor model made some adjustments to
factors 1, 2, and 3.The scree plot also confirmed the choice of these three components.
As presented in Table 4.20, three factors were extracted after ten rotations. The first
rotated factor was most highly correlated with fiber optic, Ethernet, satellite uplink/downlink,

106
ISDN, LAN, and videoconferencing. However, these variables were particularly correlated with
the third factor. The second rotated factor was most highly correlated with high speed Internet
and wireless. These variables were not particularly correlated with the other two factors. The
third rotated factor was most highly correlated with computer lab, E-mail station, and Web
broadcasting. Computer lab and E-mail station were not particularly correlated with the other
factors. Thus, there were three major groupings of ICT-based features, as defined by the ICT-
based features that are most highly correlated with three factors: 1) network back bone (ISDN,
Ethernet, LAN, network, fiber optic, VPN); 2) High speed wireless Internet; and 3) ICT service
outlet (e-mail kiosk, Web broadcasting and computer lab).
Table 4.20 Rotated Component Matrix
ICT-based features Component
1 2 3
High speed internet .096 .882 .039
network .524 .615 .073
Wireless .208 .814 .169
Fiber Optic .710 .388 .122
Videoconferencing .706 .200 .168
Ethernet .802 .369 .042
ISDN .615 .453 .318
LAN .623 .303 .239
Satellite uplink/downlink .694 -.025 .392
T1 line .245 .573 .389
VPN .507 .218 .535
Category 5 copper cable .642 -.035 .494
Web broadcasting .496 .002 .640
Computer lab .256 .113 .784
E-mail station .000 .297 .780

107
There were still several ICT-based features (network, ISDN, VPN, category 5 copper
cable, Web broadcasting) that had correlations greater than 0.45 with multiple factors. Network
and ISDN bridged the "network backbone” and “high speed wireless Internet" groups. VPN,
category 5 copper cable, and Web broadcasting were moderately correlated with the second and
third factors, thus it bridged the “network backbone” and “ICT service outlet” groups. As a fast
network is essential to the effective exchange of video and audio for two-end or multiple
locations virtual meetings, the cross-loading between the first factor “network backbone” and the
second factor “high-speed wireless Internet” can be explained. Consistently, computer lab, e-
mail station, and Web-conferencing are ICT-based service outlets that perform best on the
platform of a fast network backbone and it explains the cross-loading of the first factor-network
backbone and third factor “ICT-based service outlets.”
4.8 Hypotheses Testing
The principal purpose of this study was to examine the relationship between six
constructs: PIICT, self-efficacy, result demonstrability, perceived importance of availability of
technical support, perceived usefulness, and perceived ease of use. A summated scale is a
composite value for a set of variables calculated by such simple procedures as taking the average
of the variables in the scale (Hair et al. 2006). The summated scale for PIICT, self-efficacy,
result demonstrability, perceived importance of the availability of technical support, perceived
usefulness, and perceived ease of use was created by computing an average score of all items
measuring one construct. These single variables representing each construct were used in the
testing of hypotheses.

108
Linear regression was used to model the value of a dependent scale variable based on its
linear relationship to one or more predictors. The linear regression model assumes the following:
1) The error term has a normal distribution with a mean of zero; 2) The variance of the error term
is constant across cases and independent of the variables in the model. An error term with non-
constant variance is said to be heteroscedastic; and 3) The value of the error term for a given case
is independent of the values of the variables in the model and of the values of the error term for
other cases. Independent observation was tested by the Durbin-Watson coefficient and its value
should be between 1.5 and 2.5 for independent observations.
The assumption test for hypothesis 1a is presented below. The Durbin Watson for the
independent variable was 1.99. The histogram showed normal distribution (Figure 4.3) and the
P-P plotted residuals follow the 45-degree line (Figure 4.4). The residuals had constant variance
from the visual inspection of the plot of residuals showed homoscedasticity (Figure 4.2 and
Figure 4.5). These results suggested that assumptions were not violated.
Figure 4.2 Scatterplot of PIICT by Result Demonstrability

109
Figure 4.3 Histogram of Dependent Variable: Result Demonstrability
Figure 4.4 Normal P-P Plot
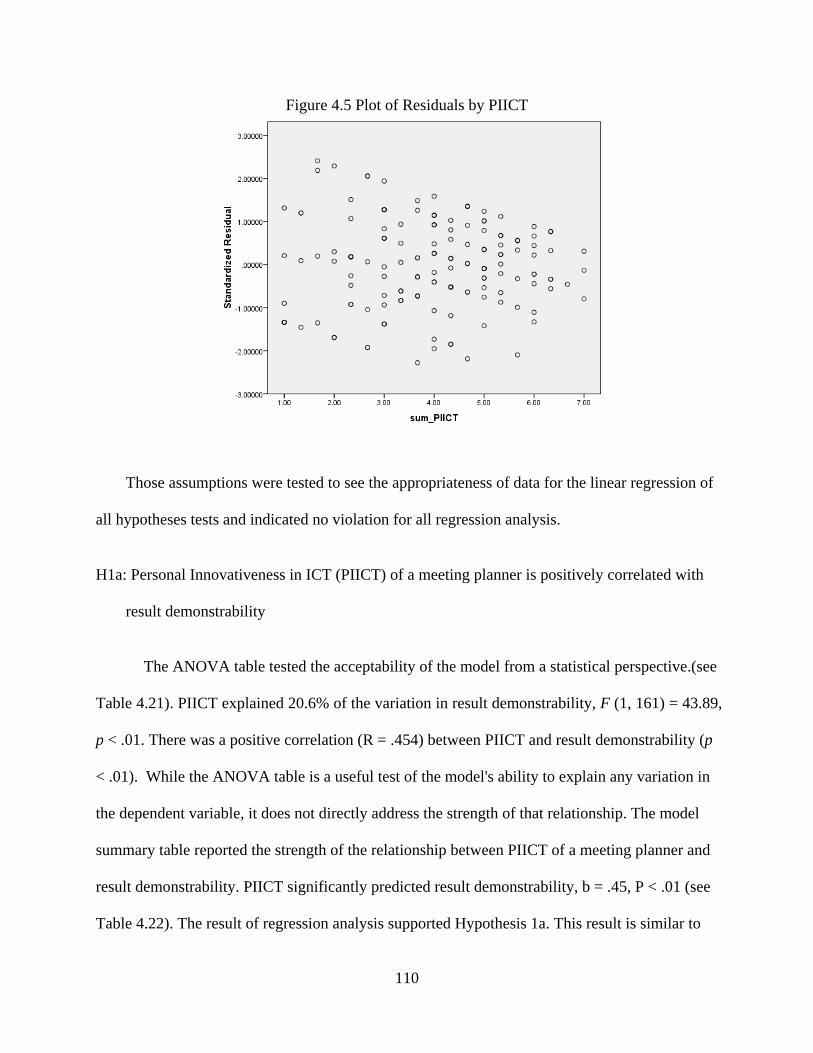
110
Figure 4.5 Plot of Residuals by PIICT
Those assumptions were tested to see the appropriateness of data for the linear regression of
all hypotheses tests and indicated no violation for all regression analysis.
H1a: Personal Innovativeness in ICT (PIICT) of a meeting planner is positively correlated with
result demonstrability
The ANOVA table tested the acceptability of the model from a statistical perspective.(see
Table 4.21). PIICT explained 20.6% of the variation in result demonstrability, F (1, 161) = 43.89,
p < .01. There was a positive correlation (R = .454) between PIICT and result demonstrability (p
< .01). While the ANOVA table is a useful test of the model's ability to explain any variation in
the dependent variable, it does not directly address the strength of that relationship. The model
summary table reported the strength of the relationship between PIICT of a meeting planner and
result demonstrability. PIICT significantly predicted result demonstrability, b = .45, P < .01 (see
Table 4.22). The result of regression analysis supported Hypothesis 1a. This result is similar to

111
that of Agarwal & Prasad (1997) and Yi et. al. (2006) that the PIIT of a customer has a positive
relationship with result demonstrability of the given technology.
Table 4.21 Summary of H1a Test
Model R R Square F Sig. StandardizedCoefficients
t Sig. Durbin-Watson
.454a .206 43.887 .000 1.990
(Constant)
PIICT .454 6.635 .000
H1b: Personal Innovativeness in ICT (PIICT) of a meeting planner has a positive relationship
with perceived ease of use of ICT-based features at a conference center.
PIICT explained 31.7% of the variation in perceived ease of use, F (1, 161) = 74.59, p
< .01. There is a positive correlation (R = .563) between PIICT and perceived ease of use (p
< .01). The model summary table presents the PIICT significantly predicted perceived ease of
use, b = .45, P < .01 (see Table 4.22). The result of regression analysis supported Hypothesis 1b.
This result is similar to that of Agarwal & Prasad (1997) and Yi et. al. (2006) that the PIIT of a
customer has a positive relationship with perceived ease of use of the given technology.

112
Table 4.22 Summary of H1b Test
Model R R Square F Sig. StandardizedCoefficients
t Sig. Durbin-Watson
1 .563 .317 74.592 .000 2.062
(Constant)
PIICT .563 8.637 .000
H1c: Personal Innovativeness in IT (PIICT) of a meeting planner has a positive relationship with
perceived usefulness of an ICT-based feature at a conference center.
PIICT explained 18.0% of the variation in perceived usefulness, F (1, 161) = 35.354, p
< .01. There is a positive correlation (R = .424) between PIICT and perceived usefulness (p
< .01). The model summary table presents the PIICT significantly predicted perceived
usefulness, b = .424, p < .01 (see Table 4.23). The result of regression analysis supported
Hypothesis 1c. This result is similar to that of Agarwal & Prasad (1997) and Yi et. al. (2006) that
the PIIT of a customer has a positive relationship with perceived usefulness of the given
technology.
Table 4.23 Summary of H1c Test
Model R R Square F Sig. StandardizedCoefficients
t Sig.Durbin- Watson
1 .424 .180 35.354 .000 2.062
(Constant)
PIICT .424 5.946 .000

113
H1d: A meeting planner’s Personal innovativeness in ICT (PIICT) will have a positive effect on
the self-efficacy
PIICT explained 18.0% of the variation in self-efficacy, F (1, 161) = 25.564, p < .01,
which means that the variation explained by the model is not due to chance. There is a positive
correlation (R = .375) between PIICT and self-efficacy (p < .01). The model summary table
presents the PIICT significantly predicted self-efficacy, b = .375, p < .01 (see Table 4.24). The
result of regression analysis supported Hypothesis 1c. This result is similar to that of Agarwal &
Prasad (1997) and Yi et. al. (2006) that the PIIT of a customer has a positive relationship with
self-efficacy of the given technology.
Table 4.24 Summary of H1d Test
Model R R Square F Sig. StandardizedCoefficients
t Sig.Durbin- Watson
1 .375 .141 26.564 .000 1.952
(Constant)
PIICT .375 5.154 .000
H2a: A meeting planner’s result demonstrability will have a positive effect on the perceived ease
of use specific ICT-based features.
Result demonstrability explained 39.2% of the variation in perceived ease of use, F (1,
162) = 106.156, p < .01, which means that the variation explained by the model is not due to
chance. There is a positive correlation (R = .629) between result demonstrability and perceived

114
ease of use (p < .01). The model summary table presents the result demonstrability significantly
predicted perceived ease of use, b = .629, p < .01 (see Table 4.25). The result of regression
analysis supported Hypothesis 2a. This result is similar to that of Agarwal and Prasad (1997),
Venkatesh and Davis (2000) and Yi et. al. (2006) that result demonstrability of a customer has a
positive relationship with perceived ease of use of the given technology.
Table 4.25 Summary of H2a Test
Model R R Square F Sig. StandardizedCoefficients
t Sig. Durbin-Watson
1 .629 .396 106.156 .000 2.305
(Constant)
result demonstrability .629 10.303 .000
H2b: A meeting planner’s result demonstrability will have a positive effect on the perceived
usefulness of specific ICT-based features.
Result demonstrability explained 56.2% of the variation in perceived usefulness, F (1, 162)
= 208.28, p < .01, which means that the variation explained by the model is not due to chance.
There is a positive correlation (R = .750) between result demonstrability and perceived
usefulness (p < .01). The model summary table presents the result demonstrability significantly
predicted perceived usefulness, b = .750, p < .01 (see Table 4.26). The result of regression
analysis supported Hypothesis 2a. This result is similar to that of Agarwal and Prasad (1997),
Venkatesh and Davis (2000) and Yi et. al. (2006) that result demonstrability of a customer has a
positive relationship with perceived usefulness of the given technology.

115
Table 4.26 Summary of H2b Test
Model R R Square F Sig. StandardizedCoefficients
t Sig. Durbin-Watson
1 .750 .562 208.282 .000 1.970
(Constant)
result demonstrability .750 14.432
.000
H2c: A meeting planners’ result demonstrability will have a positive effect on the self-efficacy in
the use of specific ICT-based feature(s).
Result demonstrability explained 63.3% of the variation in self-efficacy, F (1, 162) =
279.18, p < .01, which means that the variation explained by the model is not due to chance.
There is a positive correlation (R = .795) between result demonstrability and self-efficacy (p
< .01). The model summary table presents the result demonstrability significantly predicted self-
efficacy, b = .750, p < .01 (see Table 4.27). The result of regression analysis supported
Hypothesis 2a. This result is similar to that of Agarwal and Prasad (1997), Venkatesh and Davis
(2000) and Yi et. al. (2006) that result demonstrability of a customer has a positive relationship
with self-efficacy of the given technology.

116
Table 4.27 Summary of H2c Test
Model R R Square F Sig. StandardizedCoefficients
t Sig. Durbin-Watson
1 .795 .633 279.18 .000 1.651
(Constant)
result demonstrability .795 16.709
.000
H3a: The perceived importance of availability of technical support by an organization is
negatively associated with self- efficacy
Perceived importance of availability of technical support by an organization explained
only 8.4% of the variation in self-efficacy, F (1, 162) = 14.805, p < .01; however it still showed
that the variation explained by the model was not due to chance. There was a positive correlation
(R = .289), not a negative relation as expected, between the perceived importance of availability
of in-house technical support and self-efficacy (p < .01). The model summary table presents the
perceived importance of availability of technical support by an organization predicted self-
efficacy, b = .289, p < .01 (see Table 4.28). The result of regression analysis did not support
hypothesis 3a.
Table 4.28 Summary of H3a Test
Model R R Square F Sig. StandardizedCoefficients
t sig. Durbin-Watson
1 .289 .084 14.805 .000 1.733
(Constant)
Importance of technical suppor:in-
house .289 3.848 .000

117
H3b: The perceived importance of availability of on-site technical support is negatively
associated with the self- efficacy
Perceived importance of the availability of technical support by a conference center
explained 19.6% of the variation in self-efficacy, F (1, 162) = 39.407, p < .01, which means that
the variation explained by the model is not due to chance. There was a positive correlation (R
= .442), not a negative relation as expected, between perceived importance of the availability of
technical support by a conference center and self-efficacy (p < .01). The model summary table
presents the perceived importance of availability of technical support by a conference center
predicted self-efficacy, b = .442, p < .01 (see Table 4.29). The result of regression analysis did
not support hypothesis 3b.
Table 4.29 Summary of H3b Test
Model R R Square F sig. StandardizedCoefficients
t sig. Durbin-Watson
1 .442 .196 39.407 .000 1.848
(Constant)
Importance of availability of on-site technical support
.442 6.278 .000
H4: Self-efficacy will have a positive relationship with perceived ease of use.
Self-efficacy explained 32.2% of the variation in self-efficacy, F (1, 162) = 77.102, p < .01,
which means that the variation explained by the model is not due to chance. There is a positive
correlation (R = .568) between self-efficacy and perceived ease of use (p < .01). The model

118
summary table presents self-efficacy predicted perceived ease of use, b = .568, p < .01 (see Table
4.31). The result of regression analysis supported hypothesis 4.
Table 4.30 Summary of H4 Test
Model R R Square F sig. StandardizedCoefficients
t sig. Durbin-Watson
1 .568 .322 77.102 .000 2.124
(Constant)
Perceived importance of availability of on –site technical support
.568 8.781 .000
H5a: The type of meeting planner will influence the relation of perceived importance of
availability of technical support on self-efficacy.
Regression analysis requires metric variables must be used as independent variables. So
the author used dichotomous variables also known as dummy variables, which act as
replacement variables. Any non-metric variable with k categories can be represented as k-1
dummy variables. Indicator coding is what is often used, and the category is represented by
either 0 or 1. In this hypothesis test, the three-category non-metric variable, “type of meeting
planner” is represented by two dummy variables. The government meeting planners group was
defined as a reference category with both dummy variables equaling zero. The government
meeting planners who were not coded was the category to which all other categories were
compared.
In the study of regression analysis with dummy variables, the regression equation is Y=
a+b1 Importance of tech support + b2D1 +b3D2. This model describes three parallel regression
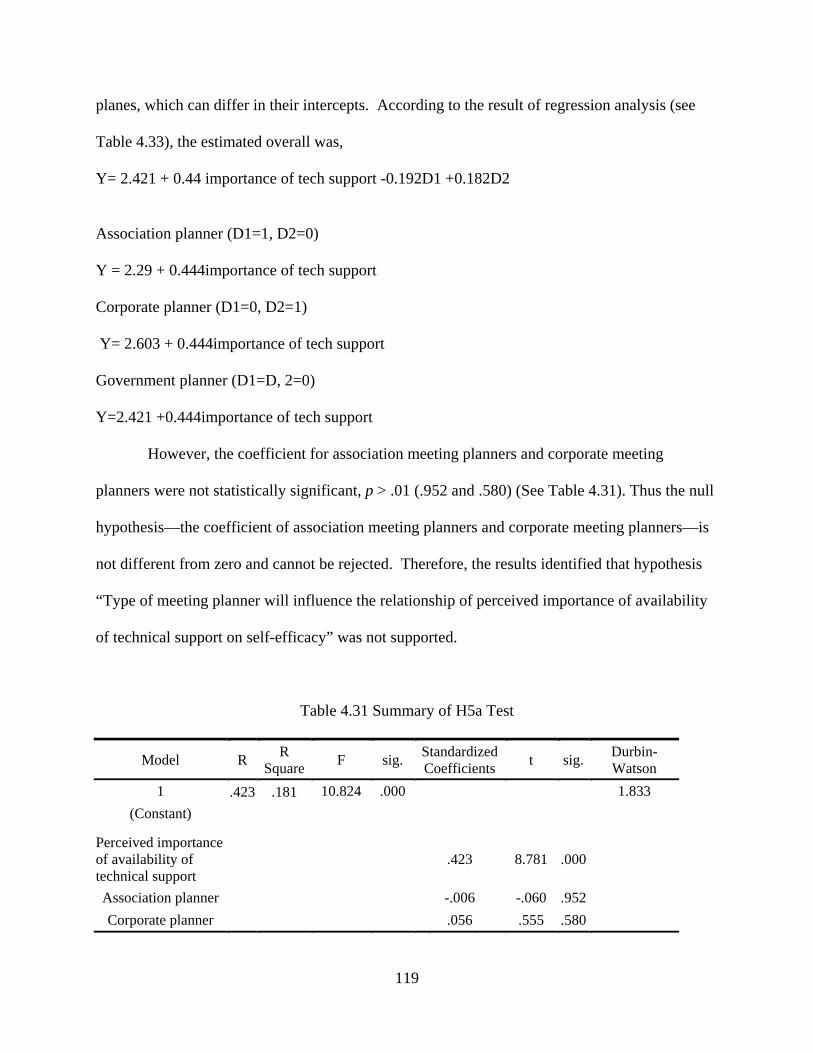
119
planes, which can differ in their intercepts. According to the result of regression analysis (see
Table 4.33), the estimated overall was,
Y= 2.421 + 0.44 importance of tech support -0.192D1 +0.182D2
Association planner (D1=1, D2=0)
Y = 2.29 + 0.444importance of tech support
Corporate planner (D1=0, D2=1)
Y= 2.603 + 0.444importance of tech support
Government planner (D1=D, 2=0)
Y=2.421 +0.444importance of tech support
However, the coefficient for association meeting planners and corporate meeting
planners were not statistically significant, p > .01 (.952 and .580) (See Table 4.31). Thus the null
hypothesis—the coefficient of association meeting planners and corporate meeting planners—is
not different from zero and cannot be rejected. Therefore, the results identified that hypothesis
“Type of meeting planner will influence the relationship of perceived importance of availability
of technical support on self-efficacy” was not supported.
Table 4.31 Summary of H5a Test
Model R R Square F sig. Standardized
Coefficientst sig. Durbin-
Watson
1 .423 .181 10.824 .000 1.833
(Constant)
Perceived importance of availability of technical support
.423 8.781 .000
Association planner -.006 -.060 .952 Corporate planner .056 .555 .580

120
The author further tested the hypothesis with the type of meeting planners as a moderator
variable. Moderator is defined as a variable that affects the direction and/or strength of
relationship between a predictor and criterion variable. When predictor and criterion are
continuous variables and moderator is dichotomous, regression is used separately to test
predictor on criterion for each level of moderator (Cohen & Cohen, 1983). Then the result is
tested for differences between the regression coefficients by using unstandardized regression
coefficients, which are not affected by differences in variance of the predictor and difference in
measurement error in the criterion.
Table 4.32 Summary of Regression Comparison by Type of Meeting Planners
Key statistics Type of meeting planner
Association Corporate Government
coefficient 0.60* 0.27 0.25 R Square 0.34 0.07 0.05
*p < .01
As presented in Table 4.33, the regression coefficients for the corporate and government
meeting planners in the relationship of perceived importance of the availability of technical
support on self-efficacy were not significant (p=.051, p=-246). It means that the regression
coefficient for corporate and government meeting planners was not different from zero. There is
no regression relationship between the predictor, perceived importance of the availability of
technical support and the criterion, self-efficacy.
However, the regression coefficient (0.60) of association meeting planners was
significant. In addition, the regression model practically explained no variance of self-efficacy by

121
perceived importance of the availability of technical support (R Square = 0.07, 0.05) for the
corporate and government meeting planners group while 34% of the variance was explained in
association meeting planners group. The result shows that there is difference in the strength of
the relationship of perceived importance of the availability of technical support and self-efficacy
and amount of variance explained among types of meeting planners. Thus it can be concluded
that the moderator variable—“type of meeting planner”—affected the strength of the relationship
between the predictor, perceived importance of the availability of technical support, and the
criterion, self-efficacy. As the earlier test of hypothesis with regression with two dummy
variables for each type of meeting planner did not support the hypothesis 5a, the moderating
effect of the type of meeting planner on the strength of relation between perceived importance of
the availability of technical support and self efficacy needs to be further discussed. Baron and
Kenny (1986) discussed the moderator might act as a threshold variable and there would be no
effect on the causal variable when the moderator is low or at a certain categorical level, but
rather at a certain value or category of the moderator the effect emerges. In this case, the
moderator is a categorical variable with 3 categories and the point of the threshold is when the
type of meeting planner is an association meeting planner.
H5b: The type of meeting planner will influence the relation of self-efficacy on perceived ease of
use of ICT-based features.
In this hypothesis test, the three-category non-metric variable “type of meeting planner”
was represented by two dummy variables. The government meeting planners group was defined
as a reference category with both dummy variables equaling zero. The government meeting
planners who were not coded was the category to which all other categories were compared. In

122
the study of regression analysis with dummy variables, the regression equation is Y= a+b1 self-
efficacy + b2D1 +b3D2. This model describes three parallel regression planes, which can differ
in their intercepts. Based on the result of the regression analysis, the estimated overall was,
Y= 2.51 + 0.42 self-efficacy -0.48D1 +0.36D2
Association planner (D1=1, D2=0)
Y = 2.03 + 0.42 self-efficacy
Corporate planner (D1=0, D2=1)
Y= 2.87 + 0.42 self-efficacy
Government planner (D1=0, D2=0)
Y=2.51 + 0.42 self-efficacy
However, the coefficients for association meeting planners and corporate meeting
planners were not statistically significant, p > .01 (.077 and .798) (See Table 4.33). Thus the null
hypothesis, the coefficient of association meeting planners and corporate meeting planners, was
not different from zero, could not be rejected, and there was no influence of the type of meeting
planner on the relationship of self-efficacy to perceived ease of using ICT-based features.
Therefore, the results identified that hypothesis “The type of meeting planners will influence the
relation of self-efficacy on perceived ease of use of ICT-based features” was not supported

123
Table 4.33 Summary of H5b Test
Model R R Square F sig. StandardizedCoefficients
t sig. Durbin-Watson
1 .461 .212 10.824 .000 2.082
(Constant)
Self efficacy .552 8.169 .000 Association
planner -.161 -1.781 .077
Corporate planner -.023 -.257 .798
Moderation effect technique was used to test the hypothesis further as used for the test of
H5a. There was no significant difference in the coefficient of the three groups in the regression
model of self-efficacy on perceived ease of use of ICT-based features. The regression
coefficients, strength of relationship between self-efficacy on perceived ease of use, were all
significant and ranged between 0.43 and 0.63. As presented in Table 4.34, there was no
significant difference in the strength of the relationship of self-efficacy on perceived ease of use
of ICT-based features while there was a difference in the amount of variance explained among
the types of meeting planners. Thus the hypothesis “The type of meeting planners will influence
the relation of self-efficacy on perceived ease of use of ICT-based features” was not supported
according to the two separate tests.
Table 4.34 Summary of Regression Comparison by Type of meeting planners
Types of Meeting planner Association Corporate Government coefficient 0.43* 0.57* 0.63* R Square 0.25 0.27 0.58
*p < .001
124
There was no significant difference in coefficient of three groups in the regression model
of self-efficacy on perceived ease of use of ICT-based features. The regression coefficients, the
strength of relationship between self-efficacy on perceived ease of use, were all significant and
ranged between 0.43 and 0.63. As presented in Table 4.35, there was no significant difference in
the strength of the relationship of self-efficacy on perceived ease of use of ICT-based features
while there was difference in the amount of variance explained among types of meeting planners.
Thus the hypothesis “Type of meeting planners will influence the relation of self-efficacy on
perceived ease of use of ICT-based features” is not supported according to two separate tests.
H6: Perceived ease of use will have a positive effect on the perceived usefulness of ICT-based
features.
The ANOVA tests the acceptability of the model from a statistical perspective. Perceived
ease of use explained 31.9% of the variation in perceived usefulness of ICT-based features, F (1,
162) = 75.763, p < .01, which means that the variation explained by the model is not due to
chance. There is a positive correlation (R = .564) between the perceived ease of use and
perceived usefulness of ICT-based features (p < .01). The model summary table presented
perceived ease of use predicted perceived usefulness of ICT-based features, b = .568, p < .01
(see Table 4.35). This is consistent with the results reported by previous research (Agarwal and
Karahanna (2000), Agarwal and Prasad (1997), Venkatesh and Davis (1996), Venkatesh and
Davis (2000), and Venkatesh (2000) that perceived ease of use of the system is positively related
to perceive usefulness of the system. The result of regression analysis supported hypothesis 6.
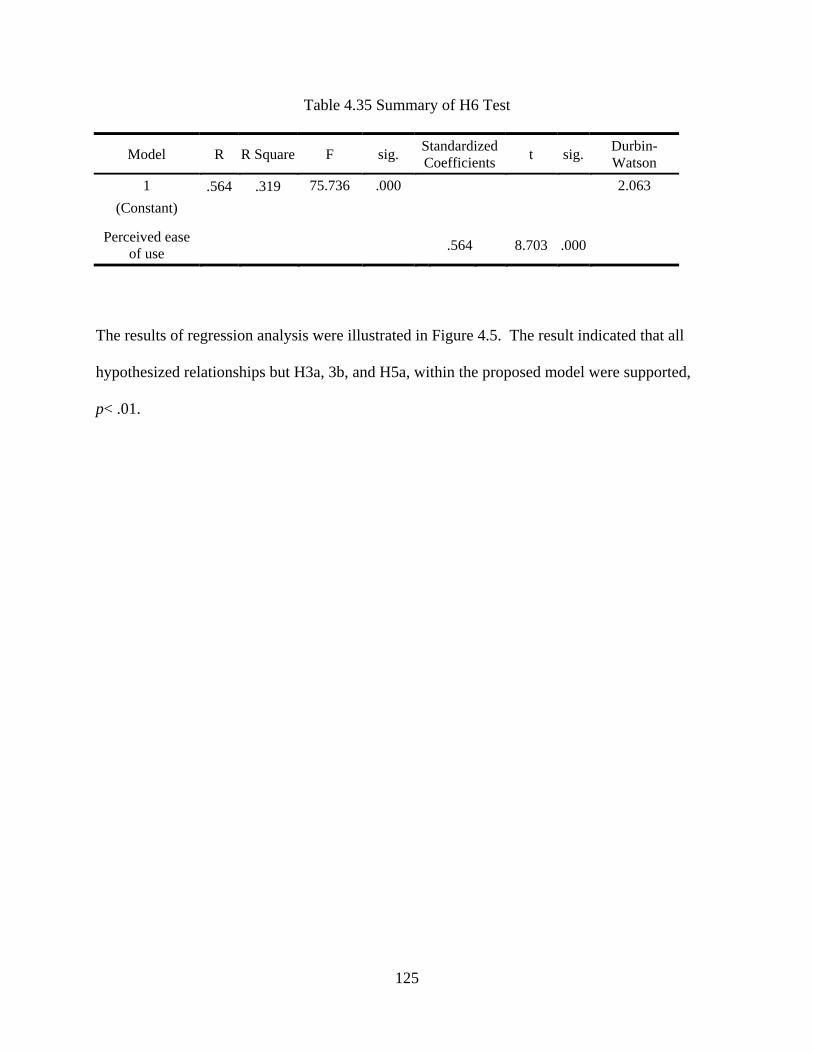
125
Table 4.35 Summary of H6 Test
Model R R Square F sig. StandardizedCoefficients
t sig. Durbin-Watson
1 .564 .319 75.736 .000 2.063
(Constant)
Perceived ease of use .564 8.703 .000
The results of regression analysis were illustrated in Figure 4.5. The result indicated that all
hypothesized relationships but H3a, 3b, and H5a, within the proposed model were supported,
p< .01.

126
Figure 4.6 Regression Analysis of Research Model
*p < .01
0.454 *H1a 0.795* H2c
PIICT
0.289*H3a/ 0.442*H3b
Result demonstrability
Self –efficacy
Type of meeting planner
0.375* H1d
0.750* H2b
0.568* H4
0.424* H1c
Not supported H5b Supported H5a
Perceived ease of use0.563* H1b
0.629* H2a 0.564* H6
Perceived usefulness
of ICT-based features
Perceived importance of the availability of technical support

127
4.9 Summary
In this chapter IV, the summary, factor analysis, descriptive statistics, reliability and
validity estimates, and the test of research hypotheses were presented using SPSS software. A
profile of the respondents and statistical tests to examine the relationship among the variables
being studied were presented. Factor analysis of fifteen ICT-based features identified three
underlying dimensions. Table 4.36 summarizes the results of testing the hypotheses. The next
chapter will present a discussion on the findings and implications for the industry with respect to
the factor analysis and hypothesis testing.
Table 4.36 Summary of Hypotheses Tests
Research Question Research Hypotheses R Sig. direction Support for
Hypothesis
2. How does the perceived importance of availability of technical support influence meeting planners’ confidence in use/acceptance of ICT-based features at a conference center?
H3a: The perceived importance
of availability of in-house technical support is negatively associated with the self- efficacy
0.289 0.000 + No
H3b: The perceived importance
of availability of on-site technical support is negatively associated with the self- efficacy
0.442 0.000 + No
3. Does a relationship exist among
attitude toward technology (PIICT), result demonstrability, self-efficacy, ease of use, and perceived usefulness of ICT-based features in recommendation/selection of a conference center?
H1a: Personal Innovativeness in
ICT (PIICT) of a meeting planner is positively correlated with result demonstrability
0.454 0.000 + Yes
H1b: Personal Innovativeness in ICT (PIICT) of a meeting planner has a positive relationship with perceived ease of use of ICT-based features at a conference center.
0.563 0.000 + Yes

128
3. Does a relationship exist among attitude toward technology (PIICT), result demonstrability, self-efficacy, ease of use, and perceived usefulness of ICT-based features in recommendation/selection of a conference center?
Research Hypotheses R Sig. direction Support for
Hypothesis
H1c: Personal Innovativeness in IT (PIICT) of a meeting planner has a positive relationship with perceived usefulness of an ICT-based feature at a conference center.
0.424 0.000 + Yes
H1d: A meeting planner’s Personal innovativeness (PIICT) will have a positive effect on the self-efficacy
0.375 0.000 + Yes
H2a: A meeting planner’s result demonstrability will have a positive effect on the perceived ease of use of use -specific ICT-based features.
0.629 0.000 + Yes
H2b: A meeting planner’s result demonstrability will have a positive effect on the perceived usefulness of specific ICT-based features.
0.750 0.000 + Yes
H2c: A meeting planners’ result demonstrability will have a positive effect on the self-efficacy in the use of specific ICT-based feature(s).
0.795 0.000 + Yes
H4: Self-efficacy will have a significant positive relationship with perceived ease of use.
0.568 0.000 + Yes
H6: Perceived ease of use will have a positive effect on the perceived usefulness of use.
0.564 0.000 + Yes
4. Does a type of meeting planner influence the relationships of perceived importance of the availability of technical support, self-efficacy and perceived ease of use of ICT-based features in recommendation/selection of a conference center?
H5a: The type of meeting planner will influence the effect of perceived importance of the availability of technical support on self-efficacy.
Yes
H5b: The type of meeting planner will influence the effect of self-efficacy on perceived ease of use of ICT-based features.
No

129
CHAPTER V
DISCUSSION AND CONCLUSION
5.1 Introduction
This chapter presents the conclusion and implications of the study’s findings. The limitations of
the study and the recommendations for the future study are discussed.
5.2 Conclusion
The objective of this study was two-fold: 1) measure the perceived importance of each
ICT-based feature and service when selecting/recommending a conference center and identify
underlying dimensions of ICT-based features, and 2) to define the relationships between the key
constructs in explaining and predicting technology acceptance by meeting planners.
Research question 1: What types of ICT-based features are perceived as important in
selection/recommendation of a conference center by meeting planners?
Conference centers want to better understand their target meeting planners’ perceived
importance of ICT-based features on meeting facility selection. If ICT-based features can be
clustered by their importance, the conference center can market better by packaging those items
that matter to its customers. This study identified that “high-speed Internet,” ”wireless,” and “E-
mail station (kiosk)” are the important ICT-based features considered by its order when meeting
planners select/recommend a conference center. This study also found that there are differences
in the perceived importance of several ICT-based features (wireless, fiber optic, Ethernet)
depending on the type of meeting planners. The corporate meeting planners perceived “wireless”
and “fiber optic” as more important than association meeting planners and government planners
130
did when they select/recommend a conference center. Interestingly, the government meeting
planners considered “Ethernet” more important than other types of meeting planners did. Overall,
the corporate meeting planners put more importance on ICT-based features as a determinant of
facility selection/recommendation among the three types of meeting planners, while the
association meeting planners put least importance on selected ICT-based features. Thus
conference centers should wisely invest in and market ICT-based features based on their main
target type of meeting planners.
This study also identified meeting planners’ lack of knowledge of technology jargon
related to network backbones. While no meeting planner had a problem understanding the
meanings of “high speed Internet” and “wireless,” many have no knowledge of the following
terms: category 5 copper cable (34%), ISDN (17%), Fiber Optic (14%), VPN (14%), satellite
uplink/downlink (13%), Ethernet (13%), and LAN (13%). Thus conference centers should be
careful in using such technology jargon directly in their marketing and communication with
meeting planners; they should consider using easier terms or adding in-depth explanations that
meeting planners can conceptually link to their meeting planning terms. All types of meeting
planners consider the availability of technical support as an important determinant when they
select/recommend a conference center with ICT-based features. Notably, the availability of on-
site technicians provided by a conference center is more important than the in-house technical
support provided by the meeting planners’ organization.
The results of the factor analysis of the fifteen items provided three underlying
dimensions: 1) high-speed wireless Internet, 2) ICT-based service outlet (computer lab, E-mail
kiosk, Web-conferencing), and 3) network backbone. High-speed wireless Internet is the most

131
obvious dimension while the other two dimensions show some cross-loadings on multiple
dimensions. Those cross-loadings can be explained as the items in the “network backbone”
factor that are the essential technology for many features related to virtual meeting (video
conferencing, Web broadcasting, and satellite uplink/downlink), computer lab, and E-mail kiosk.
Conference centers can increase their competitive value by packaging the most important feature,
high speed wireless Internet, with additional ICT-based features identified as important
according to its target meeting planners. For example, to corporate meeting planners who value
the availability of high speed wireless Internet, conference centers should market and explain the
tangible advantages of a fast network backbone, including fiber optic and Ethernet, which can
boost the performance of high-speed Internet. And conference centers should emphasize the
built-in fast network backbone that will ensure reliable and effective virtual meetings to
customers who consider utilizing video conferencing and other types of virtual meetings.
Research hypotheses were developed to answer suggested research questions. As
discussed in chapter IV, all of the hypotheses were accepted except the hypothesis H3a, H3b, and
H5b. A detailed discussion of the results of each hypothesis test is presented below.
Research question 2: How does the perceived importance of availability of technical
support influence meeting planners’ confidence in the use/acceptance of ICT-based features at a
conference center?
Inconsistent with the proposed hypothesis 3a and 3b, perceived importance of the
availability of technical support did not have a negative effect on self-efficacy, but a significant
positive effect. The result suggested that technical support is an important determinant for a

132
conference center selection/recommendation no matter what level of self-efficacy meeting
planners have.
Research question 3: Do relationships exist among attitudes toward ICT, PIICT, result
demonstrability, self-efficacy, ease of use, and perceived usefulness of ICT-based features in
recommendation/selection of a conference center?
According to the results of hypotheses tests, PIICT is positively related to perceived ease
of use, perceived ease of usefulness, self-efficacy, and result demonstrability. PIICT influences
perceived ease of use indirectly through self-efficacy and result demonstrability. PIICT also
influenced perceived usefulness directly and indirectly via result demonstrability. This result
suggests that if a meeting planner has high PIICT, he/she also possesses high confidence in
adopting ICT-based features. They also perceive such ICT-based features as useful in their
conference center selection/recommendation. The results of the study further indicate that if
conference centers can identify the PIICT of meeting planners, they can effectively use the test
scores to market ICT-based features. In other words, those who have high PIICT score represent
stronger confidence in using and visualizing the advantages of ICT-based features compared to
those with low PIICT. This result is consistent with other research findings, which argue that
PIICT is a good indicator of perceived ease of use, perceived usefulness, and result
demonstrability with professionals in other industries.
This study also tested the relationships between result demonstrability and self-efficacy,
perceived ease of use, and perceived usefulness. Respondents’ perceptions of result
demonstrability was a significant determinant of both perceived usefulness and perceived ease of
use, indicating that when an ICT-based features generates job relevant results that are readily

133
visible, perceptions of usefulness and ease of use are positively affected. The path coefficients to
perceived usefulness and self-efficacy were both high (0.77, 0.73), indicating a strong magnitude
of effects by result demonstrability. While respondents’ perception of result demonstrability was
also a strong determinant of self-efficacy, its regression analysis is questionable due to the high
correlation between the two constructs. The relationship should be further re-tested due to the
high correlation of measuring items for these two constructs, which assumed a result of order
bias. Self-efficacy is positively related to perceived ease of use. As many technology acceptance
studies revealed, perceived ease of use was positively related to the perceived usefulness of ICT-
based features.
Research question 4: Does the type of meeting planner influence the relationship of
perceived importance of the availability of technical support, self-efficacy, and perceived ease of
using ICT-based features in recommendation/selection of a conference center?
This study included the new variable “perceived importance of the availability of
technical support” and tested its relationship with self-efficacy in the model. From the
hypothesis test, the association meeting planners showed that there was a positive relationship
between perceived importance of the availability of technical support and self-efficacy. The
result represented that association meeting planners who perceive the availability of technical
support important have higher confidence in using ICT-based features. Thus, the type of meeting
planner influences the relationship of perceived importance of the availability of technical
support on self-efficacy of ICT-based features. However, the type of meeting planners did not
influence the relationship of self-efficacy on perceived ease of use.

134
In conclusion, this study confirmed all hypotheses except H3a, H3b, and H5b. The author
expanded prior TAM research findings by adding the new variable “perceived importance of the
availability of technical support” and testing the influence of the type of meeting planner on
relationships between self-efficacy and perceived ease of use, as well as perceived importance of
each ICT-based feature and service. This study proposed and confirmed a significant role of
PIICT and result demonstrability as the antecedents of positive belief toward ICT-based features
in a selection/recommendation of a conference center.
5.3 Implications
As ICT continues to be an important tool in today’s meeting business for both meeting
planners and meeting attendees, understanding their needs and providing key features and
service can be valuable in securing a competitive advantage. The research findings can provide
useful managerial implication to conference centers that are interested in marketing their existing
ICT-based features. Also these are useful to conference centers that are considering investing in
or upgrading ICT-based features and service in the future.
This study identified that high-speed wireless Internet is the most desirable ICT-based
feature that impacts the selection/recommendation of a conference center for all types of meeting
planners. Therefore, meeting facilities must consider providing high-speed wireless Internet and
marketing the service extensively. The corporate meeting planners valued the availability of
ICT-based features more than association and government planners do. Thus, marketing and
making sales efforts with the identified list of ICT-based features will be an effective way to
attract those in the corporate meeting sector.
As the study identified, the long list of technology jargon does not make an impact on
meeting planners’ selection/recommendation of a conference center. Particularly, considering
135
the result of the high percentage of meeting planners who do not have any knowledge of
technology jargon related to network backbones, improving result demonstrability of those
features is very important. Conference centers should be careful using technology jargon directly
in their marketing and communication with meeting planners and consider using more easily
understandable terms or adding explanation of complex terms in their sales and marketing
materials.
Given that PIICT emerged as an important individual difference variable to predict
meeting planners’ perceived ease of use and perceived usefulness that lead to actual use or
adoption (Davis, 1998), it is crucial to identify those individuals who possess high/low PIICT
and develop marketing strategies accordingly. This study also suggested that it is important to
visualize the outcomes of ICT-based features so the benefits of using such features are tangible
to meeting planners. This study highlights that on-site technical support is the most important
ICT-based service needed to attract all types of meeting planners. Thus, conference centers must
not simply offer planners a list of technology, but they must also help each client choose and use
the right technology for their meetings through on-site technical support. Therefore, conference
centers should provide both technology and technical support and thrive to be a total solutions
provider to be more attractive to meeting planners who consider using ICT-based features.
5.4 Recommendation for Future Studies
Due to the exploratory nature of this study and the selected two conference centers
specifically studied, the results may not provide complete facets of the impact of ICT-based
features/service on the various types of meeting facility selection/recommendation. Future
studies might be undertaken using more samples from a larger pool of conference centers and
136
with different types of conference centers (resort conference center and university-based
conference center) in order to see if there is a significant difference in comparison to this study.
Different segments of meeting facilities (e.g., conference hotel or convention center) or
geographic regions (other than North America) may also yield new results.
As mentioned earlier in Chapter II, the tested fifteen items were new and had never been
tested previously. With the identified three dimensions of the ICT-based features at conference
centers, the proposed model can be tested in the future study per each dimension.
Corporations started downsizing and outsourcing their meeting functions and the
independent meeting planners group has grown fast as an important segment of the meeting
industry. Therefore, future studies can include the independent meeting planners and compare
their findings with the results of this study. Given that two constructs: self-efficacy and result
demonstrability were highly correlated, future study can be performed with a summated
construct by transforming the two constructs into one summated construct and testing the revised
parsimonious model.
5.5 Limitations of this Study
There are some limitations to this study. First, this study was conducted with meeting
planners who used or planned to use two conference centers in North America. The convenience
and purposive sampling used in this study might make the sample less than fully representative
while it is often used for exploratory study. Second, an ANOVA test assumes an equality of
variance across groups; however, the variation in the government meeting planners group was
larger. It was due to the smaller number of collected government meeting planners responses (30
137
vs. 74, 50). Thus the generalizability of findings from government meeting planners and
comparison to other types of meeting planners (association and corporate) was weak. This
limitation can be overcome by collecting more data from government meeting planners and it
will enhance the comparative study among the different types of meeting planners in general.
Lastly, this study proposed two measurement items for the newly developed construct “perceived
importance of the availability of technical support.” To measure complete facets of the construct,
additional measurement items can be developed and tested. Even with such challenges, the
results contributed to the identification of the underlying three dimensions of ICT-based features
at meeting facilities, reduce the items to manageable size to be tested in future study, and
provided meeting planners’ beliefs and attitudes toward ICT-based features/service and their
relationships.

138
REFERENCES
Arnold, D. (2008). Trends in the Conference Center Industry. December Achrol , R., & Stern, L. (1988). Environmental determinants of decision-making uncertainty in
marketing channels. Journal of Marketing, 25(Feb), 36-50. Adams, D., Nelson, R., & Todd, P. (1992). Perceived usefulness, ease of use, and usage of
information technology: a replication. MIS Quarterly, 16(2), 227-250. Agarwal, R., & Karahanna, E. (2000). Time flies when you’re having fun: Cognitive absorption
and beliefs about information technology usage. MIS Quarterly, 24(4), 665–694. Agarwal, R., & Prasad, J. (1997). A conceptual and operational definition of personal
innovativeness in the domain of information technology. Information Systems Research, 9(2), 204–215.
Agarwal, R., Sambamurthy, R., & Stair, A. (2000). Research report: the evolving relationship
between general and specific computer self-efficacy- an empirical assessment. Information Systems Research, 11(4), 418-430.
Aladwani, A. (2002). The development of two tools for measuring the easiness and usefulness of
transactional web sites. European Journal of Information Systems 11(3), 223–234. Armitage, C., & Conner, M. (1999). Distinguishing perceptions of control from self-efficacy:
Predicting consumption of a low-fat diet using the theory of planned behavior. Journal of Applied Social Psychology, 29, 72-90.
ASAE (1987, 1997, 2000, 2001, 2003, 2005, 2006). Association Meeting Trends, Washington,
DC. Attewell, P. (1992). Technology diffusion and organizational learning: The case of Business
computing. Organizational Science, 3(1), 1-19. Ajzen, I. (1998). Predicting behavior from actions in the past. Journal of Applied Social
Psychology, 28(15), 1355-1374. Ajzen, I. (1985). From intentions to actions: a theory of planned behavior, in: J.A.J.K. Beckmann
(Ed.), Action Control: From Cognition to Behavior. Springer, Verlag, New York, 11–39. Ajzen, I. (1991) The theory of planned behavior. Organizational Behavior and Human Decision
Processes, 50(2), 179–211. Ajzen, I., & Madden, T. J. (1986). Prediction of goal-directed behavior: attitudes, intentions, and
perceived behavioral control. Journal of Social Psychology, 22(5), 453-474.

139
Ajzen, I., & Fishbein, M. (1980). Understanding attitudes and predicting social behavior.
Englewood Cliffs, NJ: Prentice-Hall. . Bacharach, S. B. (1989). Organizational theories: Some criteria for evaluation. Academy of
Management Review, 14(4), 496-515. Ball, C. (2006). Technology crystal ball. IACC Magazine Baloglu, S., & Assante, L. M. (1999). A content analysis of subject areas and research methods used in five hospitality management journals. Journal of Hospitality & Tourism
Research, 23(1), 53-70.
Baloglu, S., & Love, C. (2001). Association meeting planners’ perceptions of five major convention cities: Results of the pre-test. Journal of Convention and Exhibition Management, 3(1), 21-30.
Baloglu, S., & Love, C. (2004). Association meeting planners’ perceptions and intentions for five major US convention cities: the structured and unstructured images. Tourism Management, 26, 743-752.
Bandura, A. (1977). Self-efficacy: Toward a unifying theory of behavioral change.
Psychological Review, 84, 191-215. Bandura, A. (1982). Self-efficacy mechanism in human agency. American Psychologist, 37, 122-
147 Bandura, A.(1986). Social Foundations of Thought and Action: A Social Cognitive Theory,
Prentice-Hall, Englewood Cliffs, NJ, Bandura, A. (1995). Perceived self-efficacy. In Manstead, A. & Hewstone, M. (Eds.), Blackwell
encyclopedia of social psychology. 434-436. Oxford, UK:Blackwell Baron, R. M., & Kenny, D. A. (1986). The moderator-mediator variable distinction in social
psychological research: Conceptual, strategic and statistical considerations. Journal of Personality and Social Psychology, 51, 1173-1182.
Bartlett, T. (2007). Quality Means Quantity Conference centers prove that if you build it well,
they will come. Meetings East, February/March Beaulieu, A., & Love, C. (2004). Characteristics of a meeting planner: attributes of a emerging
profession. Journal of Convention and Event Tourism, 6(4), 95-124. Bettman, J.R. (1973) Perceived risk and its components. Journal of Marketing Research 10(May)
184-190.

140
Bonn, M. A., & Boyd, J. N. (1992). A multivariate analysis of corporate meeting planner
perceptions of Caribbean destinations. Journal of Travel and Tourism Marketing, 1(3), 1–23.
Bonn, M. A., Brand, R. R., & Ohlin, J. B. (1994). Site selection for professional meetings: A
comparison of heavy-half versus light-half association and corporation meeting planners. Journal of Travel and Tourism Marketing, 3(2), 59–84.
Breiter, D. & Gregory, S. (2004). Trade show manager: A study of technology innovation and
time poverty. Journal of Convention and Exhibition Management, 5(2), 51-67. Breiter, D. & Milman, A. (2006). Attendees’ needs and service priorities in a large convention
center: Application of the importance–performance theory. Tourism Management, 27, 1364–1370.
Buhalis, D. (1997). Catalysts in introducing information technology in small and medium sized
hospitality organizations. Presentation at the ENTER ’96 Conference, Edinburgh, Scotland.
Carey, R. (2008). IACC thought leader summit, December Carmine, E. G. and Zeller, R. A. (1979) Reliability and validity assessment, Thousand Oaks, CA:
Sage Publication. Cassanova, M., Kim D., & Morrison, A. (2005). The relationships of meeting planners; profiles
with usage and attitude toward the use of technology. Journal of Convention & Event Tourism, 7(3/4), 19-42.
Chacko, H., & Fenich, G. (2000). Determining the importance of US convention destination
attributes. Journal of Vacation Marketing, 6(3), 211-220. Chau, P., & Hu, P. (2001). Information technology acceptance by individual professionals: A
model comparison approach. Decision Sciences, 32(4), 699–719. Chen, C. (2006). Applying the analytical hierarchy process (AHP) approach to convention site
selection. Journal of Tourism Research, 45(1), 167-174. Cheung, C.,& Law, R. (2002).Virtual MICE promotion:Acomparison of the official Web
sites in HongKong and Singapore. Journal of Convention and Exhibition Management, 4(2), 37-51 Choi, J. & Boger Jr. (2002). State association market; Relationship between association
characteristics and site selection criteria. Journal of Convention and Event Tourism, 4(1). 55-73.
141
Chon, K., Sparrowe, R.T., (2000). Welcome to hospitality, 2nd ed. Delmar Thomson Learning, USA, 378–417.
Churchill, G.A. (1979). A paradigm for developing better measures of marketing constructs.
Journal of Marketing Research, 16(1), 64-73. Clark, D., Evans, M., & Knutson, B. (1997). Selecting a site for an association convention: An
exploratory look at the types of power used by committee members to influence decisions. Journal of Hospitality & Leisure Marketing, 5(1), 123-136.
Clark, D., & McCleary, K. (1995). Influencing associations’ site selection process. Cornell Hotel
and Restaurant Administration Quarterly, April, 61-68. Clark, D., Price, C., & Murrmann, S. (1996). Buying centers: who chooses convention sites?
Cornell Hotel and Restaurant Administration Quarterly, August, 34-36. Cohen, P. & Cohen, J. (1983)Applied multiple regression/correlation analysis for the behavioral
sciences. L. Erlbaum Associates, Hillsdale, N.J. Comas, M., & Moscardo, G. (2005). Understanding and their conference decision-making
progresses. Journal of Convention and Event Tourism, 7(3/4), 117-138. Connolly, D., & Olsen, M. (2000) An environmental assessment of how technology is reshaping
the hospitality industry. Tourism and Hospitality Research, 3(1), 73-93. Connolly, D., Carroll, W., & Steinbrink, S. (2007). Groups and Meetings: Market opportunity
redefined. PhoCus Wright Inc. Sherman, CT. Convention Industry Council (2004). Econimic Impact of MICE Industry. Retrieved January 11,
2007 from http://www.conventionindustry.org/resources/resources.htm#econimpt Convention Industry Council (2004). APEX industry glossary. Retrieved December 1, 2008 from
http://www.conventionindustry.org/glossary/ Crouch, G., & Louviere, J. (2004a). The determinants of convention site selection: A logistic
choice model from experimental data. Journal of Travel Research, 43(2), 118-130. Crouch, G., & Louviere, J. (2004b). The consumption of association convention sites:
preliminary results from a stubdy of site choice. In Consumer Psychology of Tourism, Hospitality and Leisure, Volume 3, edited by Crouch, G., Perdue, R., Timmermans, H., & Uysal, M.,Wallingford, UK: CABI, 135-47.
Crouch, G., & Ritchie, J. (1998). Convention site selection research: a review, conceptual model,
and propositional framework. Journal of Convention and Exhibition Management, 1(1), 49-69.
142
Dabholkar, P. (1996).Consumer evaluation of new technology-based self-service options: An investigation of alternative models of service quality. International Journal of Research in Marketing, 13(1), 29-51.
Davis, F.D. (1986). A technology acceptance model for empirically testing new end-user
information systems: Theory and results. Unpublished Doctoral Dissertation, Sloan School of Management, Massachusetts Institute of Technology, Cambridge, MA.
Davis, F.D. (1989). Perceived usefulness, perceived ease of use, and user acceptance of
information technology. MIS Quarterly, 13(3), 319-340. Davis, F.D., Bagozzi, R.P., & Warshaw, P.R. (1989). User acceptance of computer technology:
A comparison of two theoretical models. Management Science, 35(8), 982-1003. Davison, R., Alford, P. & Seaton, T. (2002). The use of Information and Communication
Technology by the European Meetings, Incentives, Conferences, and Exhibitions (MICE) Sectors. Journal of Convention and Exhibition Management, 4(2), 119-136.
Digance, J. (2002). Use of the World Wide Web in marketing Australian dedicatedconvention
centers. Journal of Convention and Exhibition Management, 4(2), 53-67. Doyle, P., Woodside, A., & Michell, P. (1979). Organizations buying in new task and rebuy
situations. Industrial Marketing Management, 8(February). 7-11. Eisenstodt, J. (1999). Defining conference centers. Meeting News, October, 32. Fawzy, A. & Samra, Y.A.. (2008). A conceptual model for understanding associations' site
selection processes: an organizational buyer behavior perspective, Journal of Convention & Event Tourism, 9 (2), 119-136
Fein, C. S. (1983). Teleconferencing and its effects on business travel. Tourism Management,
14(4), 279-289. Fenech, T. (1998). Using perceived ease of use and perceived usefulness to predict acceptance of
the World Wide Web. Computer Networks & ISDN Systems, 30(1-7), 629-630. Fenich, G. (2002). Convention center ownership and management: The case of the United States.
New York: The Haworth Hospitality Press Fishbein, M., & Ajzen, I. (1975). Belief, attitude, intention and behavior: An introduction to
theory and research. Reading, MA: Addison-Wesley Publishing Company. Fortin, P. A., & Ritchie, J. R. (1977). An empirical study of association decision process in
convention site selection. Journal of Travel Research, 15(4), 13-20.

143
Fortin, P., Ritchie, J., & Arsenault, J. (1976). A study of the decision process of North American associations concerning the choice of a convention site. Quebec, Canada: Quebec Planning and Development Council.
Frew, A. (2000). Information and communications technology research in the travel and tourism
domain: perspective and direction. Journal of Travel Research, 39(2), 136-153. GAVEL (2001, 2005, 2006, 2007). GAVEL: The most comprehensive guide to North American
meeting facilities. Meetings & Conventions, Northstar Ghingold, M., & Wilson, D. (1998). Buying center research and business marketing practice:
Meeting the challenge of dynamic marketing. Journal of Business and Industrial Marketing 13(2) 96-119
Go, F., & Zang, W. (1997). Applying importance-performance analysis to Beijing as an
international meeting destination. Journal of Travel Research, 35(4), 42-49.
Goldblatt, J. J., Nelson, K.S. (2001). International Dictionary of Event Management (2nd Ed.), New York, Wiley.
Gregory, S., & Breiter, D. (2001). Trade show manager: Profile in technology usage. Journal of Convention and Tourism Management (3), 63-76.
Gregory, S., Kline, S., & Breiter, D. (2005). Group sales and marketing in convention hotels:
Internet and web usage. Journal of Travel & Tourism Marketing, 18(1) 67-77. Hair, J., Black, W., Babin, B., Anderson, R. & Tatham, R. (2006). Multivariate Data Analysis,
6th ed. Prentice Hall, Upper Saddle River, NJ Hayduck, L. A. (1987). Structural equation modeling with LISREL. Baltimore: Johns
Hopkins University Press Heider, F. (1958). The psychology of interpersonal relations. New York: Wiley. Hendrickson, A.R. & Collins, M.R. (1996). An assessment of structure and causation of IS usage.
The Data Base for Advances in Information Systems, 27(2), 61-67. Hill, T., Smith, N., & Mann, M. (1987). Role of efficacy expectations in predicting the decision
to use advanced technologies: the case of computers. Journal of Applied Psychology, 72(2), 307-313.
Hinkin, T., & Tracey, J. (1998). The service imperative: factor driving meeting effectiveness.
Cornell Hotel and Restaurant Administration Quarterly, 39(5), 59-67. Hoffman, D., & Novak, T. (1996). Marketing in hypermedia computer-mediated environments:
conceptual foundations. Journal of Marketing, 60, 50-68.

144
Hoyle, R. (1995). Structural equation modeling: Concepts, issues, and applications. Thousand
Oaks, CA: Sage. Hu, C., & Hiemstra, S. (1996). Hybrid conjoint analysis as a research technique to measure
meeting planners’ preferences in hotel selection. Journal of Travel Research, 35, 62-69. International Association of Conference Centers (2005, 2007a). Trends in the Conference Center
Industry,: A statistical and financial profile. St. Louis, USA
International Association of Conference Centers (2007b), IACC membership criteria, Retrieved January 7, 2008 from http://www.iaccglobal.org/about/index.cfm?fuseaction=MemCritDetail&DetailID=27
Igbaria, M., Guimaraes, T., & Davis, G.B. (1995). Testing the determinants of microcomputers usage via a structural equation model. Journal of Management Information Systems, 11(4), 87-114.
Igbaria, M.& Iivari, J. (1995). The effects of self-efficacy on computer usage. Omega, 23(6),
587-605. Igbaria, M., Zinatelli, N., Cragg, P., & Cavaye, A. (1997). Personal computing acceptance
factors in small firms: A structural equation model. MIS Quarterly, 21(3), 279-305. Jackson, D., Keith, J., & Burdick, R. (1984). Purchasing agents' perceptions of industrial buying
center influence: a situational approach. Journal of Marketing, 48(Fall), 75-83. Jackson, C.M., Chow, S., & Leitch, R.A. (1997). Toward an understanding of the behavioral
intention to use information systems. Decision Science, 28(2), 357-389. Jago, L. & Deery, M. (2003). Relationships and factors influencing convention decision-making .
In Proceeding of the Convention & Expo Summit 2003. Hong Kong: The Hong Kong Polytechnic University, 87-100.
Jago, L. & Deery, M.(2005). Relationships and factors influencing convention decision-making.
Journal of Convention and Event Tourism, 7(1), 23-41. Johnston, W. & Bonoma, T. (1981). The buying center: structure and interaction patterns.
Journal of Marketing, 45(Summer), 43-56. Jones, D. L. & Brewer, K. P. (2001). The future of the meeting, incentive, convention, and
exhibition (MICE) industry buyer- seller relationship: High tech or high touch? Journalof Convention and Exhibition Management, 3(2), 53-67.
Kerlinger, F.N. (1986). Foundation of behavioral research. New York: Holt, Reinhart
and Winston Inc.

145
Keltner, B., Finegold, G., Mason, G., & Wagner, K. (1999). Market segmentation strategies and service sector productivity. California Management Review, 41(summer), 84-102.
Kim, L. H., Kim, D.J., & Leong, J.K. (2005). The effect of perceived risk on purchase intention
in purchasing airline tickets online. Journal of Hospitality & Leisure Marketing, 13(2), 33-52.
Kim, D. & Morrison, A. (2004). Tiers or tears?: An evaluation of the Web-based marketing
efforts of major city convention centers. In The U.S. Journal. Kohli, A. (1989). Determinants of influence in organizational buying: a contingency approach.
Journal of Marketing, 53(July), 50-65. Lane, H.E., Dupre, D. (1997) Hospitality World. New York: Van Nostrand Reinhold. Lawrence, M., & McCabe, V. (2001). Managing conferences in regional areas: a practical
evaluation in conference management. Journal of Convention and Exhibition Management, 13(4/5), 204-207.
Lee, T., & Park, J. (2002). Study on the degree of importance of convention service factors:
Focusing on the differences in perception between convention planners and participants. Journal of Convention and Exhibition Management, 3(4), 69- 79.
Lee, M., & Back, K. (2005). A review of convention and meeting management research 1990-
2003: Identification of statistical methods and subject asreas. Journal of Convention and Event Tourism. 7(2), 1-20.
Lee, M. & Lee K. (2006). Convention and Exhibition Center development in Korea. Developing
a Successful Infrastructure for Convention & Event Tourism. Haworth Press, Inc. Legris, P., Ingham, A., & Collerette, P. (2003). Why do people use information technology? A
critical review of the technology acceptance model Information and Management 40(3), 191–205.
Leonard, L., Cronan, T., & Kreie, J. (2004). What influences IT ethical behavior intentions-
planned behavior, reasoned action, perceived importance, or individual characteristics? Information and Management, 42(1), 143–159.
Lewis, W., Agarwal, R., & Sambamnrthy, V. (2003). Sources of influence on beliefs about
information technology use: An empirical study of knowledge workers. MIS Quarterly, 27(4), 657-678.
Lynn, S.A. (1987). Identifying buying influences for a professional service: Implications for
marketing efforts. Industrial Marketing Management, 16, 119-130.

146
Manstead, A., & Van Eekelen, S. (1998). Distinguishing between perceived behavioral control and self-efficacy in the domain of academic achievement intentions and behaviors Journal of Applied Social Psychology, 28(15), 1375-1 392.
Mathieson, K., Peacock, E., & Chin, W. W. (2001). Extending the technology acceptance model:
The influence of perceived user resources. The Data Base for Advances in Information Systems, 32(3), 86–112.
Marakas, G.M., Yi, M., & Johnson, R. (1998).The multilevel and multifaceted character of
computer self-efficacy: toward clarification of the construct and an integrative framework for research, Information Systems Research 9(2), 129–163.
Marie, K. S., Kasavan a, M. L., & Knutson, B. J. (2000). Smart card: Meet smart meeting
planner. Journal of Hospitality and Leisure Marketing, 7(2), 77-85. Mathieson, K. (1991). Predicting user intentions: Comparing the technology acceptance model
with the theory of planned behavior. Information Systems Research, 2(3), 173–191. Mathieson, K., Peacock, E., & Chin, W.W. (2001). Extending the technology acceptance model:
The influence of perceived user resources. The DATABASE for Advances in Information Systems, 32(3), 86–112.
Matthing, J., Kristensson, P., & Gustafsson, A. & Parasuraman, A. (2006). Developing
successful technology-based services: The issues of identifying and involving innovative users. Journal of Service Marketing, 20(5), 288-297.
McQuiston, D. (1989). Novelty, complexity and importance as causal determinants of industrial
buyer behavior. Journal of Marketing, 53(April), 66-79. Meetings and Conventions (2002, 2006). Meetings Market Report. Meetings and Conventions,
August Meeting News (2005). Bundle or not to bundle?, retrieved October 12, 2007 from
http://www.meetingnews.com/news/id=223084232 Meeting Professional International (2002). The 2002 Meeting Outlook Survey. Washington, DC. Mick, D., & Fournier, S. (1998). Paradoxes of technology: Consumer cognizance, emotions, and
coping strategies. Journal of Consumer Research. 25(Sep.) 123-147 Mistilis, N., & Dwyer, L., (1999). Information technology and service standard in MICE
tourism. Journal of Convention and Exhibition Management, 2(1), 55-65. Montealegre, R. (1999). A temporal model of institutional interventions for information
technology adoption in less-developed countries. Journal of Management Information Systems, 16(summer), 207-232.

147
Montgomery, R., & Rutherfold, D. (1994). A profile of convention-service professionals, Cornell
HRA Quarterly, December, 47-57. Moon, J. & Kim, Y. (2001). Extending the TAM for a World-Wide-Web context. Information &
Management, 38(4), 217-230. Moore, G. (1999). Crossing the chasm. New York: Harper Collins. National Conference Center (2007). Audio-Visual price list. Retrieved October 3, 2007 from
http://www.conferencecenter.com/resources.cfm Nunnally, J.C., & Durham, R.L. (1975). Validity, reliability, and special problems of
measurement in evaluation research. In E.L. Struening & M. Guttentag (Eds.), Handbook of evaluation research. Beverly Hills, CA: Sage Publications.
OMFG (2000, 2001, 2003. 2004.2006). Official Meeting Facilities Guide .Ziff-Davis Publishing
Co. Oppermann, M. (1994). Modelling convention location choice and participation decision making
process: a review with emphasis on professional associations. Les Cahiers du Tourisme, Serie C (188). Marseille, France: Centre des Hautes Etudes Touristiques, Universite de Droit, d’Economie et des Sciences, Aix-en-Provence.
Oppermann, M. (1996a). Convention cities: Images and changing fortunes. Journal of Tourism
Studies, 7(1), 10-19. Oppermann, M. (1996b). Convention destination images: Analysis of association meeting
planners’ perceptions. Tourism Management, 17(3), 175-182. Oppermann, M.,& Chon, K. S. (1997). Convention participation decision-making process.
Annals of Tourism Research, 24(1), 178-191. Parasuraman, A. (2000). Technology readiness index (TRI): A multiple–item scale to measure
readiness to embrace new technologies, Journal of Service Research, 2 (4), 307-320. Pinsonneault, A., & Kraemer, K.L. (1993). Survey research methodology in management
information systems: An assessment. Journal of Management Information Systems, 10(2), 75-105.
PhoCus Wright Inc. (2006) Groups and Meetings: Market opportunity redefined. Phillips, L.A., Calantone, R., & Lee, M.T. (1994). International technology adoption: Behavior,
structure, and demand. The Journal of Business & Industrial Marketing, 9(2), 16-28. PKF Consulting & IACC (2004, 2007). Trends report: trends in the conference center industry,
a statistical and financial profile.St. Louis, MO
148
Plouffe, C., Vandenbosch, M., & Hulland, J. (2000) Research report:Richness versus parsimony
in modeling technology adoption decisions: Understanding merchart adoption of a smart-card based payment system. Inform. System Res. 12(2), 208-222.
Plouffe, C., Vandenbosch, M., & Hulland, J. (2001). Intermediating technologies and multi-
group adoption: A comparison of consumer and merchant adoption intentions toward a new electronic payment system. The Journal of Product Innovation Management, 18(2), 65–81.
Renaghan, L., & Kay, M. (1987). What meeting planners want: The conjoint-analysis approach.
Cornel Hotel and Restaurant Administration Quarterly, 28(1), 66-76. Robinson, P., Faris, C., & Wind, Y. (1967). Industrial Buying and Creative Marketing, Allyn
and Bacon, Boston, MA.
Rogers, M. (1995). Diffusion of innovations. New York: The Free Press. Rutherfold, D., & Umbeit, W. (1993). Improving interactions between meeting planners and
hotel employees. Cornell HRA Quarterly, February, 68-80.
Spekman, R., & Stern, L. (1979). Environmental uncertainty and buying group structure. Journal of Marketing, 43(Spring), 54-64.
Siguaw, J., Enz, C., & Namasivayam, K. (2000). Adoption of information technology in U.S. hotels: Strategically driven objectives. Journal of Travel Research, 39(November), 192-201.
Saade, R., & Bahli, R. (2005). The impact of cognitive absorption on perceived usefulness and
perceived ease of use in on-line learning: An extension of the technology acceptance model. Information and Management, 42(2), 317–328.
Schepers, J., & Wetzels, M. (2007). A meta-analysis of the technology acceptance model:
Investigating subjective norm and moderation effects. Information & Management, 44, 90–103.
Siguaw, J., Enz, C., & Namasivayam, K. (2000). Adoption of information technology in U.S.
hotels: strategically driven objectives. Journal of Travel Research, 39(November), 192-201.
Silk, A.J., & Kalwani, M. (1982),Measuring influence in organizational purchase decisions.
Journal of Marketing Research, 19(May), 165-81.
Spekman, R., & Stern, W. (1979). Environmental uncertainty and buying group structure: An empirical investigation. Journal of Marketing, 43, 54-64.

149
Straub, D.W. (1989). Validating instruments in MIS research. MIS Quarterly, 13(2), 147-170. Straub, D., Keil, M., & Brenner, W. (1997). Testing the technology acceptance model across
cultures: A three country study. Information & Management, 33(1), 1-11. Straub, D., Limayem, M., & Karahanna, E. (1995). Measuring system usage: Implications for IS
theory testing. Management Science, 41(8), 1328-1342. Sonnenwald, D., Maglaughlin, K., & Whitton, M. (2001). using innovation diffusion theory to
guide collaboration technology evaluation: Work in progress. In Proceedings IEEE International Workshop on Enabling Technologies, 114-119.
Sutton, R., Eisenhardt, K., & Jucker, J. (1986). Managing organizational decline: Lessons from
Atar. Organizational Dynamics, 14(Spring). 17-29. Szajna, B. (1994). Softw. evaluation and choice: Predictive validation of the technology
acceptance instrument. MIS Quarterly, 18(3), 319-324. Swanson, E.B. (1988). Information systems implementation: Bridging the gap between design
and utilization. Homewood, IL: Irwin. Taylor, B. (1974). The role of risk in consumer behavior. Journal of Marketing, 38 (April) 54-60. Taylor, S., & Todd, P. A. (1995a). Understanding information technology usage: A test of
competing models. Information Systems Research, 6(2), 144–176. Taylor, S., & Todd, P A. (1995b) Assessing IT usage: The role of prior experience. MIS
Quarterly, 19(4), 561-570 Terry, D. J. (1993). Self-efficacy expectancies and the theory of reasoned action. In Terry,
D.,Gallois, C., & McCamish, M. (Eds.), The theory of reasoned action: Its application of AIDS-preventive behavior, 135-15 1. Oxford, UK: Pergamon.
Terry, D., & O’Leary, J. (1995). The theory of planned behavior: The effects of perceived
behavioral control and self-efficacy. British Journal of Social Psychology, 34, 199-220. Thomas, R. (1984). Bases of power in organizational buying decisions. Industrial Marketing
Management, 13, 209-217 Thomson, R., Compeau, D. & Higgins, C. (2006). Intention to use Information Technology: An
integrative model. Information & Management, 212(44), 206–215. Toh, R., Frederick, D., & Yates, B. (2005). Independent Meeting Plannerts: roles, compensation,
and potential conflicts. Cornell Hotel and Restaurant Adminisrration Quarterly, November, 431-443.
150
Vanucci, C., & Kerstetter, D. (2001). Meeting planners’ use of the Internet to plan group
meetings. Journal of Convention & Exhibition Management, 2(4), 23-36 Venkatesh, V. (2000). Determinants of perceived ease of use: Integrating control, intrinsic
motivation, and emotion into the technology acceptance model. Information Systems Research, 11(4), 342-365
Venkatesh, V., & Davis, F. (2000). A theoretical extension of the technology acceptance model:
Four longitudinal field studies. Management Science, 46, 186-204. Venkatesh, V., & Davis, F. (1996). A model of the antecedents of perceived ease of use:
Development and test. Decision Sciences, 27(3), 451–481. Venkatesh, V., Morris, M., & Davis, F. (2003). User acceptance of information technology:
Toward a unified view. MIS Quarterly, 27(3), 425–478. von Hippell, E. (1986). Lead users: A source of novel product concepts. Management Science,
32(July), 791-805. Walczuh, R., Lemmink, J., & Streukens, S. (2006). The effect of service employees; Technology
readiness on technology acceptance. Information & Management, 44, 206-215. Walker, R., & Johnson, L. (2006). Why consumers use and do not use technology-enabled
services. Journal of Service Marketing, 20(2) 125-135
Weber, K. (2001) Association meeting planners’ loyalty to hotel chains. Hospitality Management, 20, 259-275.
Weber, K. & Ladkin, A. (2004) Trends affecting the convention Industry in the 21st century. Journal of Convention and Event Tourism, 6(4), 47-63.
Webster, F., Jr. (1984). Industrial marketing strategy. New York: John Wiley. Webster, F., Jr. & Wind, Y. (1972). A general model for understanding organizational buying
behavior. Journal of Marketing, 36(2), 12-19.
Webster, F., Jr. & Wind, Y. (1972). Organizational buying behavior, Englewood Cliffs, NJ: Prentice-Hall.
Weitz, B. A. (1981). Effectiveness in sales interactions: A contingency framework. Journal of Marketing, 45(Winter), 85-103.
West, L. A.,& Upchurch, R. S. (2001). Conference participants’acceptance of the Internet
as an information and registration tool. Journal of Convention and Exhibition Management, 3(2), 41-52.

151
White, K., Terry, D., & Hogg, M. (1994). Safe sex behavior: The role of attitudes, norms, and
control factors. Journal ofAppliedSocia1 Psychology .24(2), 164-2 192. Wind, Y. (1967). The determinants of industrial buyers’ behavior, in industrial buying and
creative marketing. Robinson, P. & Faris, C. (Eds.), Boston, MA: Allyn and Bacon Wöber, K. & Gretzel, U. (2001). Tourism managers’ adoption of Marketing Decision Support
Systems. Journal of Travel Research,39 (November), 172-181. Wolf, K.,&Boger, C. A. (2001). Investigating rate integrity in convention cities: Comparing
central reservation and Internet rates. Journal of Convention and Exhibition Management, 3(2), 16-31.
Yi, M., Jackson, J., Park, J., & Probst, J. (2006). Understanding information technology
acceptance by individual professionals: Toward an integrative view. Information & Management, 43, 350-363.
Yuan, Y., Gretzel, U., & Fesenmaier, D. R. (2003). Internet technology use by American
Convention and Visitors Bureaus. Journal of Travel Research, 41(3), 240-255. Zeithaml, V., Parasuramann, A., & Berry, L (1991). Delivering quality service: Balancing
customers perceptions and expectations. New York: The Free Press Zigmund, W. (2002). Business research methods, 7th ed. Thomson South-Western.

152
APPENDIX
153
Appendix 1 Questionnaire
April 15, 2008 Dear meeting planners: I am a doctoral candidate in the Department of Hospitality and Tourism Management at Virginia Tech and am currently working on my dissertation. For my Ph.D. dissertation, I am conducting a study that examines the importance of Information Communication and Technology (ICT)-based features on the selection of a conference center and meeting planners’ acceptance of technology. This survey will provide valuable information for my research and will help the meeting and conference center industry to understand the needs of meeting planners. The enclosed questionnaire should take approximately 5-10 minutes to complete. Your participation is strictly voluntary and all responses will be kept confidential and anonymous. Data are being collected for academic purposes only. When you have completed the survey, please return it via the enclosed pre-paid return envelope by May 15, 2008. Completion and return of this survey indicates your voluntary consent to participate in this study. To thank you for your participation, I would like to offer you the chance to enter your name to win an Outback Steakhouse Restaurant Gift Card. Three winners will be randomly selected, each receiving a $30 gift card as a token of appreciation for your help. If you have any questions please do not hesitate to contact me via phone at (540) 231-1276 or via email at [email protected]. Thank you in advance for your cooperation. Sincerely,
Seungwon “Shawn” Lee Doctoral Candidate Hospitality and Tourism Management Virginia Tech Mahmood Khan, Ph.D., Dissertation co-chair Professor Hospitality and Tourism Management Virginia Tech

154
Survey Background: Meeting planners consider a number of factors when making their recommendation or selection of a meeting facility. One of those may be the availability of technology at meeting facilities. Q1. I am responsible for selection or recommendation of meeting facilities for my organization’s
meetings (Please mark one that applies to you). Yes No
Q1. Please read each statement carefully and indicate your level of agreement or disagreement with each statement by circling the number that most closely describes your opinion. If you have no knowledge on the given terminology, please check in the “no knowledge”. (1= strongly disagree, 2= moderately disagree, 3= somewhat disagree, 4 = neutral (neither disagree nor agree, 5= somewhat agree, 6= moderately agree, 7= strongly agree)
Type of ICT-based features at conference centers Strongly StronglyDisagree Agree
No Knowledge
High-speed Internet is an important determinant when I recommend or select a conference center.
1 2 3 4 5 6 7
Network is an important determinant when I recommend or select a conference center.
1 2 3 4 5 6 7
Wireless is an important determinant when I recommend or select a conference center.
1 2 3 4 5 6 7
Fiber optic is an important determinant when I ecommend or select a conference center.
1 2 3 4 5 6 7
Videoconferencing is an important determinant when I recommend or select a conference center.
1 2 3 4 5 6 7
Ethernet is an important determinant when I recommend or select a conference center.
1 2 3 4 5 6 7
PART I. This section asks questions regarding your perception of technology and Information and Communication Technology (ICT)-based features that are available at conference centers when you recommend or select a conference center for your meeting.

155
Type of ICT-based features at conference centers Strongly StronglyDisagree Agree
No Knowledge
Integrated Services Digital Network (ISDN) is an important determinant when I recommend or select a conference center.
1 2 3 4 5 6 7
Local Area Network (LAN) is an important determinant when I recommend or select a conference center.
1 2 3 4 5 6 7
Satellite uplink and downlink is an important determinant when I recommend or select a conference center.
1 2 3 4 5 6 7
T1 Line is an important determinant when I recommend or select a conference center.
1 2 3 4 5 6 7
Virtual Private Network (VPN) is an important terminant when I recommend or select a conference center.
1 2 3 4 5 6 7
Category 5 copper cable is an important determinant when I recommend or select a conference center.
1 2 3 4 5 6 7
Web broadcasting is an important determinant when I recommend or select a conference center.
1 2 3 4 5 6 7
Computer lab is an important determinant when I recommend or select a conference center.
1 2 3 4 5 6 7
E-mail station (kiosk) is an important determinant when I recommend or select a conference center.
1 2 3 4 5 6 7
Q2. Based on the ICT-based feature(s) that you indicated as important in Q1, please
indicate your level of agreement or disagreement with the following statement by circling the number. (1= strongly disagree, 2= moderately disagree, 3= somewhat disagree, 4 = neutral (neither disagree nor agree, 5= somewhat agree, 6= moderately agree, 7= strongly agree)
Strongly Strongly Disagree Agree
I am confident that I am able to apply ICT based-features at a conference center for my next meeting.
1 2 3 4 5 6 7
There is a lot that I can do to be sure of applying ICT based-features at a conference center for your next meeting
1 2 3 4 5 6 7
I have no difficulty telling others about the results of using ICT-based feature(s) at conference centers for meeting functions.
1 2 3 4 5 6 7
I believe I can communicate to others the consequences of using the ICT-based feature(s) for meeting functions at conference centers.
1 2 3 4 5 6 7
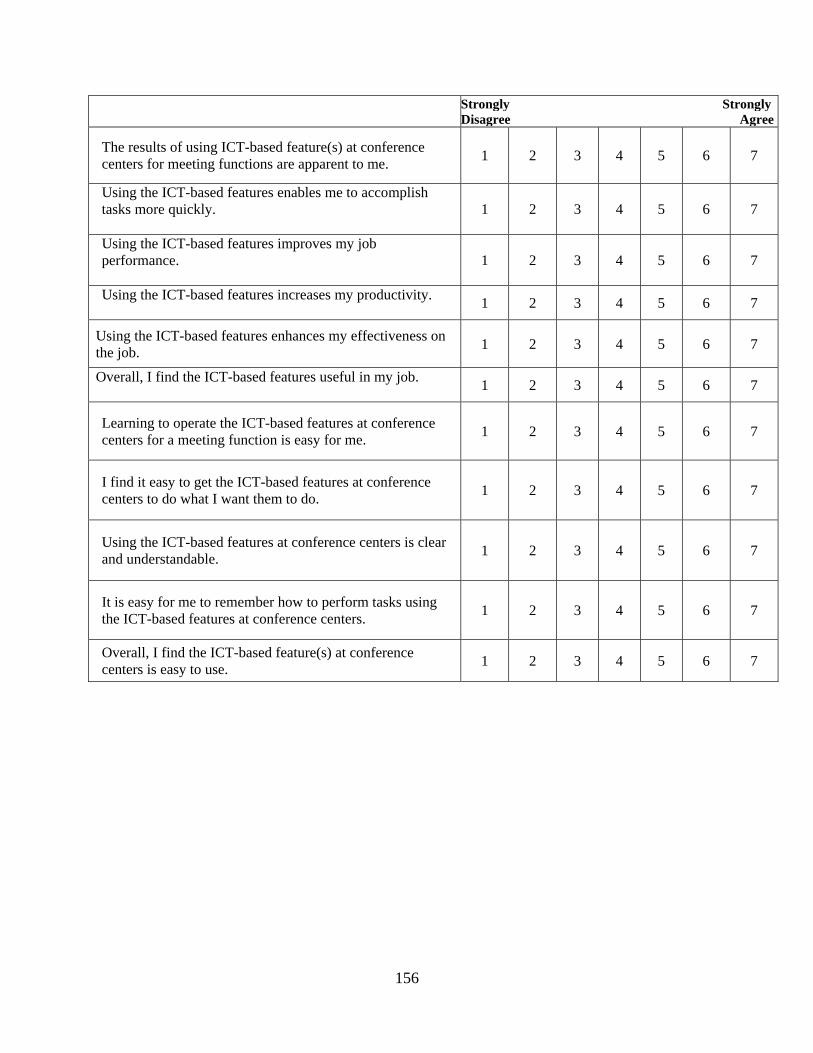
156
Strongly Strongly Disagree Agree
The results of using ICT-based feature(s) at conference centers for meeting functions are apparent to me.
1 2 3 4 5 6 7
Using the ICT-based features enables me to accomplish tasks more quickly.
1 2 3 4 5 6 7
Using the ICT-based features improves my job performance.
1 2 3 4 5 6 7
Using the ICT-based features increases my productivity.
1 2 3 4 5 6 7
Using the ICT-based features enhances my effectiveness on the job.
1 2 3 4 5 6 7
Overall, I find the ICT-based features useful in my job.
1 2 3 4 5 6 7
Learning to operate the ICT-based features at conference centers for a meeting function is easy for me.
1 2 3 4 5 6 7
I find it easy to get the ICT-based features at conference centers to do what I want them to do.
1 2 3 4 5 6 7
Using the ICT-based features at conference centers is clear and understandable.
1 2 3 4 5 6 7
It is easy for me to remember how to perform tasks using the ICT-based features at conference centers.
1 2 3 4 5 6 7
Overall, I find the ICT-based feature(s) at conference centers is easy to use.
1 2 3 4 5 6 7

157
Q3. Please read each statement carefully and indicate your level of agreement or disagreement with each statement by circling the number that most closely describes your opinion.
(1= strongly disagree, 2= moderately disagree, 3= somewhat disagree, 4 = neutral (neither disagree nor agree, 5= somewhat agree, 6= moderately agree, 7= strongly agree) Strongly Strongly
Disagree Agree
I attempt to experiment with any new information and communication technology (ICT) I hear about.
1 2 3 4 5 6 7
Among my peers, I am usually the first to try new ICT. 1 2 3 4 5 6 7
In general, I am hesitant to try new ICT.
1 2 3 4 5 6 7
I like to experiment with new ICT.
1 2 3 4 5 6 7
Available technical staff/support from a conference center is important to apply ICT-based features at a conference center for my next meeting.
1 2 3 4 5 6 7
Available technical staff/support from my organization (e.g. IT department) is important to apply ICT-based features at a conference center for my next meeting.
1 2 3 4 5 6 7
PART II. DEMOGRAPHIC INFORMATION
Survey Instruction: Please complete the following demographic information, giving your best estimate where exact answers are not known. 1. Please indicate your gender. Male Female 2. Please indicate your year of birth: 19_____
3. From the choices below, please indicate your highest level of education.
High school Associate degree 2-year college degree
4-year college degree Master’s degree Doctorate degree

158
4. How many years have you been working as a meeting planner?
Less than 2 years 2-5 years 6-9 years
10-15 years More than 15 years
5. What is your job title?
Vice president of meetings Director of meeting Manager of meeting
Coordinator of meeting Other (please provide your exact title)
_____________________________
6. Please describe your organization according to the following criteria (Please select only ONE form the type of business then answer questions belong to the type of business)
Type of organization
Association Corporate Government
Type of Business
a. Type of membership
Professional
Trade
b. Geographic scope
International
National
State
Regional
a. Type of business
General
Pharmaceutical
Technology
Financial
Medical
Insurance
a. Geographic scope
Local
County
State
Federal
7. What types of meeting do you hold at a conference center? (Please check all that apply)
Business meeting Seminars Board/committee meeting Training Management development
Annual convention Regional conference State conference Other(please specify) ____________________________________
Thank you VERY MUCH for your time!
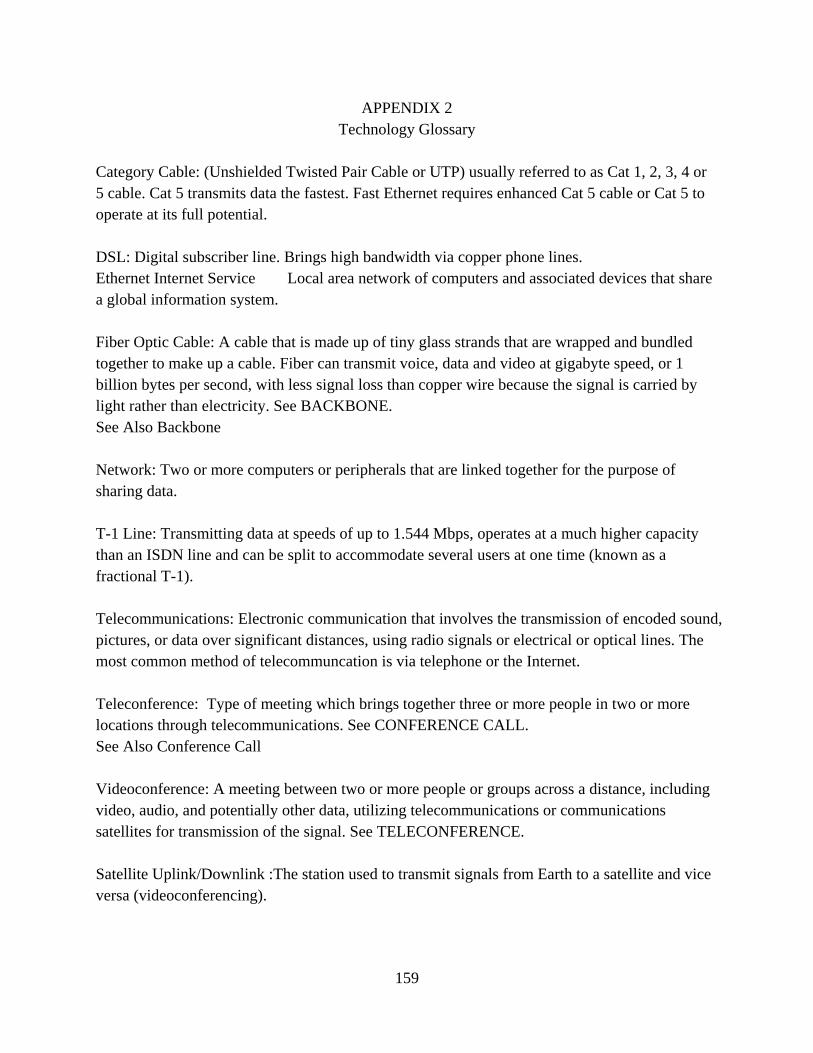
159
APPENDIX 2 Technology Glossary
Category Cable: (Unshielded Twisted Pair Cable or UTP) usually referred to as Cat 1, 2, 3, 4 or 5 cable. Cat 5 transmits data the fastest. Fast Ethernet requires enhanced Cat 5 cable or Cat 5 to operate at its full potential. DSL: Digital subscriber line. Brings high bandwidth via copper phone lines. Ethernet Internet Service Local area network of computers and associated devices that share a global information system. Fiber Optic Cable: A cable that is made up of tiny glass strands that are wrapped and bundled together to make up a cable. Fiber can transmit voice, data and video at gigabyte speed, or 1 billion bytes per second, with less signal loss than copper wire because the signal is carried by light rather than electricity. See BACKBONE. See Also Backbone Network: Two or more computers or peripherals that are linked together for the purpose of sharing data. T-1 Line: Transmitting data at speeds of up to 1.544 Mbps, operates at a much higher capacity than an ISDN line and can be split to accommodate several users at one time (known as a fractional T-1). Telecommunications: Electronic communication that involves the transmission of encoded sound, pictures, or data over significant distances, using radio signals or electrical or optical lines. The most common method of telecommuncation is via telephone or the Internet. Teleconference: Type of meeting which brings together three or more people in two or more locations through telecommunications. See CONFERENCE CALL. See Also Conference Call Videoconference: A meeting between two or more people or groups across a distance, including video, audio, and potentially other data, utilizing telecommunications or communications satellites for transmission of the signal. See TELECONFERENCE. Satellite Uplink/Downlink :The station used to transmit signals from Earth to a satellite and vice versa (videoconferencing).

160
Webcast: An event that broadcasts the audio and/or video portion of a keynote presentation or other educational sessions over the Web in real-time or on-demand. Web broadcasting: Web browser-based broadcasting.