exploratory design and development of compact naval condensers
TRANSCRIPT
NAVAL POSTGRADUATE SCHOOL
Monterey, California
EXPLORATORY DESIGN AND DEVELOPMENTOF COMPACT NAVAL CONDENSERS
Interim Report #1Period: 8 Jan - 1 Apr 1979
Investigators
:
P. J. Marto, Professor and ChairmanDepartment of Mechanical Engineering
R. H. Nunn, Associate ProfessorDepartment of Mechanical Engineering
Prepared for: Naval Sea Systems Command, Code 0331
Contract N000247WR9G078


EXPLORATORY DESIGN AND DEVELOPMENT
OF COMPACT NAVAL CONDENSERS
Interim Report #1, 8 Jan - 1 Apr 1979
Investigators: P. J. Marto, Professor and Chairman,Department of Mechancial EngineeringR. H. Nunn , Associate Professor,Department of Mechanical Engineering
I . BACKGROUND
The objective of the program is to develop a computer-
based model for the design and analysis of compact Naval
condensers. Both experimental and analytical studies are
underway in support of this objective. The experimental
program concentrates upon the evaluation of single-tube
performance using prototype tubes that have been designed
to enhance their performance as heat extraction devices in a
condensing medium. The analytical studies have taken two
main directions, each dependent upon the other: (1) The
development of a comprehensive coding scheme for the calcula-
tion of condenser performance in conjunction with modern
- 1 -

design optimization techniques and, (2) the identification
and evaluation of reliable (or the best available) theoreti-
cal and/or empirical models for the analysis of the thermo-
fluid processes that govern the performance of large steam
surface condensers.
This report discusses the progress of the analytical
portion of the program. The experimental work to date on
enhanced tubing is summarized in a forthcoming ASME paper
titled "An Experimental Comparison of Enhanced Heat Transfer
Condenser Tubing." This paper will be presented at the 18th
National Heat Transfer Conference, San Diego, August, 1979.
A copy of this paper is enclosed as Appendix A. The experi-
mental work on dropwise condensation has centered around the
thesis research of LT. J. Manvel who has tested a variety of*
tubes designed for the promotion of condensation in the drop-
wise mode. The results of LT. Manvel ' s tests will be pub-
lished in May."
II. OPTIMIZATION
A. CONMIN
The general scheme of optimization to be employed in
the investigation is that of CONMIN (Constrained Minimization)
National Aeronautics and Space Administration, "CONMIN-A Fortran Program for Constrained Function Minimization," byG.N. Vanderplaats, NASA TM X-62, 2B2 , NASA/ Ames ResearchCenter, August 1973.
- 2 -

This code has been extensively tested and is well established
as a modern and efficient means for the optimization of
designs involving several variables and subject to a virtual-
ly unlimited number of constraints.
The general optimization problem addressed by CONMIN
is as follows:
Find the vector of 'design variables
X, to minimize the function F(X) subject to
the design constraints
G.(X) £ 0.0 (j = 1, NCON)•J
VLBj^ <_ X±
<_ VUB. (i = 1, NDV)
If a maximum is sought for the objective function, F(X), one
need only minimize its negative. The functions G.(X),
called "design constraints," are calculable functions of the
design variables that are to be held within limits specified
by the designer. Examples, in the case of the condenser,
include shell-side pressure drop, vapor/gas mixture velocity,
shell dimensions, shell-side and tube-side Reynolds numbers,
and cooling water pumping power. The second set of con-
straints are called "side constraints" and limit the
feasible range within which the design variables may be
adjusted in the search for the optimum. Design variables
for the Naval condenser may include such things as tube
length, number and pitch of tubes, tube bundle geometry,
- 3

cooling water velocity, heat load (steam flow rate), and
inside and outside enhancement factors. CONMIN will handle
as many as 200 design variables but a more-realistic upper
limit is 20. (If a designer is so uncertain about his
system that he must allow 20 variables to "float," he should
probably put his money into further research.
)
The objective function, F(JO, is that property of
the system for which an optimum is sought. For the Naval
condenser this may be shell volume, for instance. Only one
objective function can be specified for a given optimization
and its selection is a matter of fundamental importance to
the design. A number of tradeoffs arise, not the least of
which are those involving uncertainties. Dollar cost, for
instance, is a popular objective function but one whose
dependency upon the design variables is usually extremely
tenuous. Several difficulties of this nature can be
addressed by utilizing the optimum sensitivity option of the
code. In this mode, the computer can be made to create
several optimum designs that differ from each other because
of the uncertainty of the values of one or more design
variables. In the end, of course, engineering judgement will
dictate the choice of designs. The capability to be genera-
ted by this study, however, will allow the program manager
to compare designs that are each "best" designs subject to
each set of known constraints and uncertainties.
- 4 -

CONMIN employs essentially three methods in
searching for an optimum. From the initial design furnished
by the user, the gradient of the objective function is com-
puted and the first design improvement is in the direction of
the negative of this gradient ("steepest descent"). Subse-
quent iterations in the feasible region (the region that is
contained within the constraints) are carried out in accor-
dance with the method of "conjugate directions" which is
similar to steepest descent but takes into account the
lessons learned in previous iterations. When a constraint
is encountered, the determination of the next move towards
an optimum must be such that the constraint is not violated.
This is accomplished through one of the several schemes
known as "methods of feasible directions." The code is
extremely versatile and incorporates several innovations for
the enhancement of speed and stability.
B. COPES" and ANALIZ .
COPES (Control Program for Engineering Synthesis) is
a companion calling program for CONMIN. COPES is under deve-
lopment by NASA-Ames (Dr. G. N. Vanderplaats ) and the current
version has been installed and tested at NPS for use in the
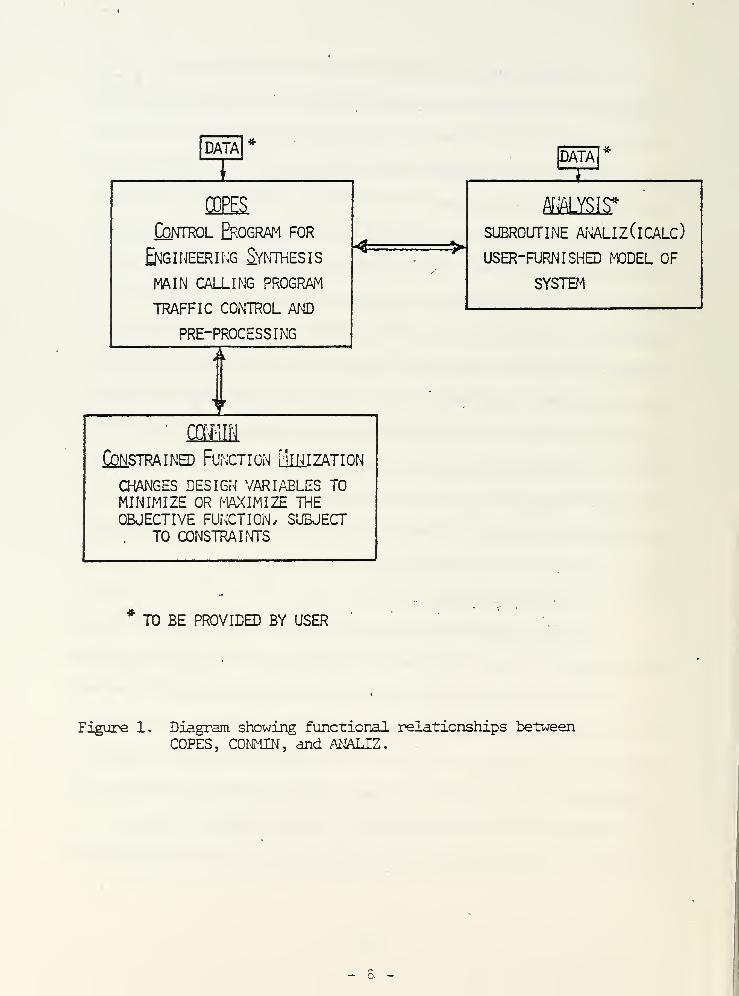
present investigation. As shown in Figure 1, COPES directs
the computational traffic between the optimizer (CONMIN) and
the analysis subroutine (ANALIZ). With COPES, it is
possible to treat CONMIN as a "black box." All computational
- 5 -
DATAI *
p
Control Erogr^i for
Engineering Synthesis
main calling program
traffic control and
pre-processing
1
<=
MAINConstrained Function lIihjzation
changes design variables toMINIMIZE OR MAXIMIZE theOBJECTIVE FUNCTION/ SUBJECT
TO CONSTRAINTS
^
DATA
ZX-ANALYSIS*
subroutine analiz(icalc)
user-furnished model of
SYSTEM
TO BE PROVIDED BY USER
Figure 1. Diagram showing functional relationships betweenCOPES, CONMIN, and ANALIZ.
- 6 -

parameters (step size, convergence bands, etc.) are specified
as input data to COPES and when an optimization problem is
formulated according to the "rules," the central problem
reduces to one of providing the test possible model of the
system to be designed. This model is subroutine ANALIZ and
its construction constitutes the main goal of the analytical
portion of the present study.
During the reporting period, the latest version of
the COPES/CONMIN code has been obtained from NASA and
installed in the NPS computer system (IBM 360/67). The code
is stored in a compiled and linked status on a disk space
that is dedicated to the present investigation. Optimization
runs have been successfully conducted using an embryonic form
of the baseline analysis described in subsequent paragraphs.
III. CODING PHILOSOPHY
During the reporting period a preliminary rationale
has been developed for use in formulating an analysis sub-
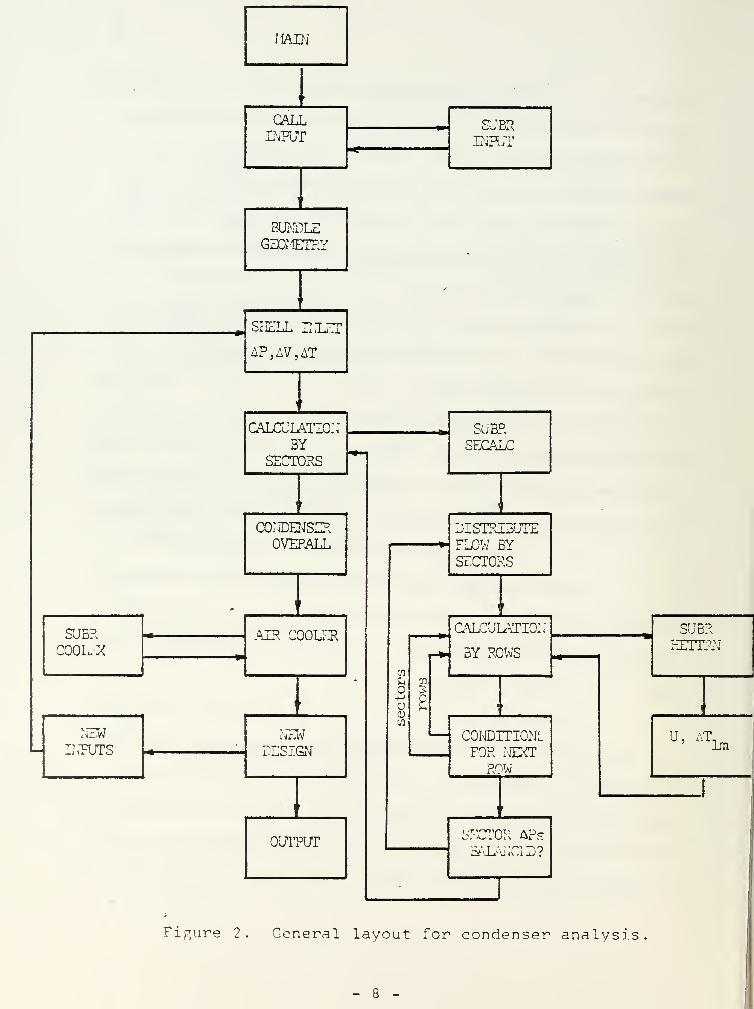
routine for naval condensers. A result of this work is the
logic flow diagram shown in Figure 2.
In recent years, almost all designers have adopted
the use of arrays of heat transfer tubes which are described
as bundles. Essentially, each bundle is an operating con-
denser and in a general computer code it will be necessary to
provide means for coupling several bundles together to form
a complete main condenser. Each bundle may, in turn, be
- 7 -
MAIN
>
CALLINPUT
C* Tp"n
INPUT
i
1
BUNDLEGEOMhTRY
-
i '
y
Sr ir,T J. IELET
AP,AV,AT
<
'
CALCULATION3Y
SECTORS
SUB?.
SECALC
1
r 1
CONDENSEROVERALL
DISTRIBUTEFLOW BYSECTORS
ii
'
i
SU3RCOOLEX
AIR COOLERCALCULATIO:;
BY ROWS
SUBRhLTl'RN
en
+>
<DCO
CO
21
» ' '
i>
NEWL\TUTS
NEWDESIGN
CONDITION;.
FOR NEXTROW
U, AT,' 1m
i1
'
OUTPUTSECTOR APsBALANC .1 jj?
Figure 2. General layout for condenser analysis

divided into sectors whose coupling will require the matching
of the pressure drops through each sector by means of adjust-
ing the fraction of the inlet steam that is apportioned to
each. The segmenting of the condenser will improve accuracy
when it is necessary to use average properties to calculate
bundle performance. In addition, it will be possible to
account for condensate take-off between sectors where this
is necessary to limit the effects of condensate inundation.
The calculation of the performance sector by sector is
accomplished in subroutine SECALC in Figure 2.
It is theoretically possible to calculate the
performance of each tube, in each row, in each sector, in
each bundle. Whether or not this is in fact practical, or
even sensible, remains to be seen. In all cases that have
been reviewed to date, the performance of large condensers
(with 5-10 thousand tubes) is calculated using some sort of
"average tube'*' technique. In any case, the thermal perfor-
mance of a single (discrete or average) tube is calculated in
HETTRN of Figure 2. The heart of the condenser analysis
code lies in HETTRN, and it is here that an intensive search
is underway to find the best available methods of prediction.
The present status of HETTRN is described in section V below.
The hierarchy of calculation in Figure 2 is HETTRN
(single tube performance), SECALC (performance of groups of
tubes), and MAIN (performance of groups of sectors).
- 9 -

Following the calculations of conditions leaving the main
condensing section, the performance of an air cooler section
may be calculated, if desired. The simplification in Figure
2 is necessary in order to furnish an overview of the analysis
scheme. In HETTRN and in SECALC and perhaps even in MAIN it
will be necessary to include iterative loops. In HETTRN, this
is mainly because of the dependence of the properties of the
vapor, gas, and cooling water upon temperature and pressure,
both of which are functions of condensation rate. In SECALC,
iteration will be required because of the aforementioned
pressure balance requirement. It is easy to imagine further
complications, as outlined in Section V of this report.
IV. REVIEW OF EXISTING CODES
Several codes for condenser design are known to
exist. The availability of many of these is limited because
of proprietary reasons. In any case, however, a comprehen-
sive review is underway to either procure and test existing
codes or to learn as much as possible about their ingredients.
Although the main effort in this regard is yet to come, some
progress has been made during the reporting period. A brief
discussion of each area of inquiry is given below:
A. Proprietary Codes
1. Westinghouse . The authors visited the
Sunnyvale plant of Westinghouse Electric Corporation and were
hosted there by Mr. John Ward. It was learned that there is
- 10 -

an in-house computer-based condenser design capability at
Westinghouse but, to-date, only general information is
available in the open literature. The code is apparently
quite comprehensive, taking into account tube arrangement and
density, steam lane design, noncondensible gases, and turbine
exhaust nonuniformities . Condensate rain effects are treated
but there is no apparent accounting for the effects of vapor
shear either separately or in conjunction with condensate rain
(the condensate is assumed to drain vertically, regardless of
vapor speed or direction). Three-dimensional effects are
included by means of "strip-theory" in which tube support
plates are taken to be divisions between local two-dimensional
flow regions. The Westinghouse code appears to be heavily
coupled to data obtained from field tests and should be quite
accurate for application to specific existing designs. The
general applicability of the code is an area of uncertainty
as is the extent to which modern optimization techniques are
applied. The authors intend to inquire further into these
areas
.
2. Heat Transfer and Fluid Flow Service (HTFS).
Descriptive material and price quotes have been obtained from
E. J. Barsness, "Calculation of the Performance of Sur-face Condensers by Digital Computer," ASME Paper 63-PNR-2
,
ASME, New York, 1963.
11 -

HTFS. From the available information it is difficult to dis-
cern the extent to which the HTFS condenser codes (SC0N4 and
TASC2 ) are applicable to the present study. Though aimed
primarily at small process condensers, the codes appear to be
quite comprehensive. In the input data, for instance, there
is an opportunity to call for the accounting of vapor shear
effects (but there is also warning regarding the reliability
of the results). HTFS has offerred to sell NPS a copy of
SC0N4 (for h 1,000) to be used "solely by the Naval Postgradu-
ate School for use by its students." The question of dissemi-
nation of knowledge gained from the use of HTFS codes is still
an uncertain matter. This issue, as well as the applicability
of the HTFS experitse, will be discussed during a visit to the
facility planned for late June.
3. Heat Transfer Research Institute (HTRI). The
authors accepted the kind invitation of the HTRI management
to attend their meeting of the Technical Advisory Committee
on February 14-15. Although many useful contacts were made
and it was possible to gain a general impression of HTRI
capabilities, the meeting did not reveal a great deal
concerning the details of the HTRI approach to problems
relevant to the present study. The HTRI operation is very
much like that of HTFS and there is again the problem of
accomodating the proprietary restrictions that may attach to
information originating with HTRI. There is, however, a
- 12 -

strong desire in HTRI to cooperate inasmuch as is possible
with the NPS study, and a good deal of information has been
informally exchanged without difficulty.
The HTRI codes appear to be axtremely comprehensive.
As is the case with HTFS , however, it is unlikely that an HTRI
program exists for direct use in the present study. It is the
internal process modelling schemes that are of most interest
to the authors and discussions are continuing along these
lines. The HTRI development of flow region maps is especially
pertinent to the present study. These maps give criteria for
estimating the relative importance of gravity and vapor shear
in determining local shell-side film coefficients and (it is
believed) the path of condensate rain through the tube bundle.
The authors have received some information concerning this
area of analysis and a small amount of additional information
is available in the open literature. A companion problem is,
of course, the modelling of the heat transfer processes when
vapor shear effects cannot be neglected.
The services of HTRI have been offered for the
validation of codes developed in the NPS study. This would
be accomplished by means of case studies in which HTRI would
rate condenser designs stemming from the present study.
Such a service, if feasible, would be most beneficial and
the authors will continue this line of discussion with HTRI.
M-. General Atomic Company . Dr. D. Vrable has con-
ducted preliminary condenser design studies in connection
- 13 -

with nuclear plants that use ammonia systems for secondary
heat rejection. The computer code developed in conjunction
with these studies takes into account enhancement due to
treated surfaces and extended surfaces . The heat transfer
subroutine of the code uses the correlations of Fujii, et al.,
which include a Reynolds number (and therefore vapor shear)
dependency. (The work of Fujii and' his coworkers is especially
pertinent to the present study and is under continuing analysis.)
Because of the high pressures associated with condensation of
ammonia, non-condensible gases are not considered. Vrable
includes some cost analysis in his calculations in order to
seek an "optimal" design based upon economy of investment.
It has been learned, however, that the optimization conducted
by Vrable is an informal one rather than the systematic
approach to be used in the present study.
B. Codes_ in the Public Domain
1. HECDOR. The authors have obtained and compiled
the HECDOR (Heat Exhanger Cost and Design Optimization Routine)
Fujii, T., H. Vehara, K. Kirata, and K. Ota, "Heat Trans-fer and Flow Resistance in Condensation of Lew Pressure SteamFlowing Through Tube Banks," J. Heat and Mass Transfer, 15 ,
247-260, 1972.
- 14 -

code developed under DoE auspices at EG&G Idaho, Inc. The
usefullness of the HECDOR code in the present study is ex-
tremely limited because of the rather oversimplified approach
to the thermal performance of a condenser (constant properties
and minimal tube-tube interaction, among other things). The
virtue of HECDOR appears to lie in the optimization method
in which a Lagrange multiplier technique is used to obtain
implicit analytical expressions for optimum conditions. In
addition, since the objective function is cost, there is a
considerable amount of information provided that may prove
useful in developing an approach to the cost analysis of
naval condensers.
2. Heat Exchange Institute (HEI). The HEI design
methods are noteworthy for their simplicity. In the present
study, simplicity, though virtuous, is no longer a necessity.
The problems associated with the HEI method (insensitive to
shell-side processes, not amenable to the inclusion of en-
hancement effects, etc.) have been described by Johnson and
are such as to preclude its use in the present study, except,
perhaps, as a rough-cut backup. The authors do plan to
consult further with HEI researchers in order to determine
their views as to the most reliable means for more-detailed
calculations
.
Johnson, C. M. , "Marine Steam Condenser Design UsingNumerical Optimization," MS. Thesis, NPS , Monterey, CA. , Dec1977.
- 15 -

3. ORCON . This code, developed at the Oak Ridge
National Laboratory, is by far the most comprehensive code
for condenser performance that has been found to be available
to the public. The circular-bundle version of ORCON forms
the analysis subroutine used by Johnson in his studies. In
the present study, the version of ORCON for use with rectangu-
lar tube bundles has been compiled and debugged and has served
as the main source of computer-derived results during the
reporting period. Use of the rectangular bundle version of
ORCON, rather than the circular bundle version, eliminates a
few of the uncertainties associated with the calculation of
the effects of condensate rain and the simpler tube-tube
geometry allows an easier interpretation of computed results.
As a result of the extensive use of ORCON during the reporting
period, the internal workings and overall philosophy of codes
of this nature (which is largely that of Fig. 1) are now well-
understood. Some of the features and limitations of ORCON are
summarized below:
a. ORCON allows the calculation of either
vertical or horizontal flow of steam/
gas mixture across horizontal cooling
tubes. There is no provision for flow
Johnson, C. M. , "Marine Steam Condenser Design UsingNumerical Optimization," MS. Thesis, ZIPS, Monterey, CA., Dec.1377.
- 16 -

at intermediate angles except for the
calculation of radial flow in the
circular bundle version.
b. There is a means for correcting the
condensate film coefficient for the
effects of rain. The method is based
upon Eissenberg 's , adaptations to the
classical method of Nusselt . The
correction only accounts for the
distribution of condensate rain upon
lower tubes in a gravity-dominated
flow and does nothing else to modify
the classic Nusselt model for laminar
film condensation on an isolated tube.
c. Non-condensible gases (up to four species)
are taken into account by the use of the
Reynolds flux model, as elaborated by
Spalding, and an empirical correlation
suggested by Eissenberg. The method
appears to be similar to that employed
by HTFS and represents the state-of-the-
art in this rather uncertain area.
Eissenberg, D. M. , "An Investigation of the VariablesAffecting Steam Condensation on the Outside of a HorizontalTube Bundle," Ph.D. Thesis, V. Tennessee, Dec. 1972.
- 17 -

d. ORCON is easily modified to include
enhancement of the inner and/or outer
film coefficients. If necessary, the
enhancement may be calculated as a
function of local conditions within
the condenser.
e. ORCON, as in all" o/ther known cases,
includes fouling effects only as a
constant resistance term.
f. All fluid properties are continuously
variable and change with pressure and
temperature throughout the condenser. The
latter quantities are allowed to vary
due to inlet, outlet, and tube-tube
flow variations, as well as viscous
losses, and the effects of condensation.
g~ Bundles can be segmented into as many
as four sectors in the case of horizon-
tal flow (one sector only for vertical
flow.). Condensate removal is not
provided for but could be easily incor-
porated between sectors.
h. The overall heat transfer coefficient
is calculated on the basis of an "average"
tube in each row of tubes. This is a
basic limitation of the code that is
- 18 -
somewhat relieved by the ability to calculate
performance by sectors,
i. Vapor shear effects are not included. There
is some capability to simulate these effects
by weighting the distribution of condensate
rain in the direction of flow, but this me-
thod is not founded upon any quantitative
physical model.
j . ORCON calculations are based upon two-dimen-
sional flow assumptions. However, the pro-
gram organization appears to be ameanable to
the expansions and revisions that would be
necessary if a three-dimensional analysis
were to be developed.
Some minor alterations to ORCON have been instituted in
order to adapt the code to suit the needs of the present study.
These alterations consist, in the main, of the creation of se-
veral subroutines within the heat transfer subroutine (HETTRN)
in accordance with the thermal resistance method of analysis.
At the present time, there are four special subroutines for the
calculation of internal convective resistance, the condensate
film resistance, the effective film resistance due to non-con-
densible gases, and corrective functions for the effects of
condensate rain. In this form, it will be possible to use the
code to measure the differences in condenser performance due to
variations in the analysis models. Other subroutines may be
added as it becomes necessary to take additional effects
into account. Extensions of this nature might include
corrections for vapor shear and the calculation of variable
- 19 -
enhancement and/or fouling factors.
The ORCON methodology, in its present form, appears
to be conservative. That is, the condenser performance pre-
dicted by the code is consistently less than that expected
from experience. This conservative nature is illustrated in
Fig. 3 in which the results of several condenser performance
calculations are summarized. The test case is the full
power load for the main condenser of the USS Kennedy (CVA-67).
Input specifications include 400,000 Ib/hr of saturated steam
and 45 lb/hr of entrained air flowing horizontally across
6,612 tubes arranged in two main bundles that are symmetrical
about a central steam lane. The measure of performance used
in Fig. 3 is the exit fraction (EXITFR) of steam vapor leaving
the condenser as a percentage of that which enters.
In Fig. 3a the effects of variation in the conden-
sate rain model are shown. The abcissa here is the number of
sectors into which each bundle is divided for calculation
purposes. It is seen that for the condenser aspect ratio
(height/width) of 0.6 used in Fig. 3a, the complete removal
of rain effects results in a "best" condition of about 24%
exit fraction. (This no-rain result is, incidentally, inde-
pendent of the numbers of sectors used in the calculation.
)
Figure 3b shows the effects of increasing aspect ratio with
and without condensate rain (the various models for rain
effects are discussed in the following section). Large
-20

CN
CD
O
O
+J
•H3
•H
s•Mo0)
co
CD
a) 3
0) <+H
33 o,3 <d
a
oCO
oCM
o
1
)
I
•
i
-
H rH *1
-
oii
II qII
I <u T3 03CO
J c Ph Pi
CmX
fCD
5
«* IT3 3~* n CN
II
H*
H
_
IICO CO
CO
1,
XJ
—j
H
- CN
CO
&
oCDCO
0-5
co
oII
8oCDCO
o+Ja0)cmCMUJ
ifl
on
a oJ-
om oCN
orH
- 21 -
values of the aspect ratio correspond to large numbers of
tubes in relatively few vertical rows exposed to the horizon-
tal flow of the vapor/gas mixture. The improvement in per-
formance with increasing aspect ratio is apparent, but an
aspect ratio of 1.0 is near the upper limit of realism for
simulation of the CVA-67.
Figure 3 is presented here to illustrate the con-
servative nature of the predictive model as it now stands.
The problems associated with those and other calculations are
discussed in the following section.
V. SPECIAL PROBLEMS
The issues discussed in this section are termed "special"
in that they are deemed to be pertinent to the prediction of
condenser performance while, at the same time, they are
encumbered by relatively large uncertainties in the present
state-of-the-art. In large Naval surface condensers the two-
phase processes occur on the shell side of the tube arrays.
Thus, it is not surprising to find that the central area of
concern is with this side of the condenser heat-exchange
system and all of the special problems discussed below are
related to this region. Inside the cooling tubes, the sea-
water flow is assumed to be turbulent and fully-developed; a
situation which has received ample theoretical and experimental
treatment in the heat-transfer literature. In other words,
the prediction of the thermo-fluid effects on the tube side
of Naval condensers is a relatively precise art, with the
exception of fouling resistance.
- 22 "

The problems discussed below represent those that have
assumed a status of significance during the reporting period.
They are coupled processes and their listing in this fashion
should not imply otherwise.
A. Condensate Rain . In Appendix B, it is shown that
the classical Nusselt theory, which assumes that all conden-
sate drains directly to the tube directly below, leads to an
expectation that the condensate film coefficient, h , for
the nth tube in a vertical row of tubes, should be related to
the film coefficient for a single tube, h„, by the form
hn (1-s) , , . ( 1 - s
)
tt- = n J - (n - \yaN
where s may vary from 0.07 to 0.20 according to experimental
results and s = 0.25 according to. the theory due to Nusselt.
The extent to which this ratio is less than one is a measure
of the degree of degredation of the performance of the n-th
tube due to the (n - 1) tubes above it. If one asks the
question, "How many tubes must drain from above to reduce the
value of the condensate film coefficient on the local tube to
50% of its single-tube value?", one finds that with h /h„ =
0.5 the resulting value of n may range from about 5 to more
than 1000 within the range given above for s. Clearly the
Nusselt theory is too conservative and the extent of the
discrepancy can be several orders of magnitude. The simple
theory shown above and developed in Appendix B cannot be
sufficient
.
- 23 -

Eissenberg (see Appendix B) has improved the situation
by providing an alteration to the theory to account for the
spacing and orientation of the tubes relative to each other.
Tubes vertically aligned and close together are more affected
by rain from above than is the case for tubes that are
staggered arrays and far apart. The Eissenberg model does
not, however, depart from the basic .Nusselt assumptions of
gravity-dominated laminar condensate films, and cannot be
expected to give valid results for the high shell-side
Reynolds numbers and heat fluxes present in large Naval con-
densers.
It has become apparent to the authors that an improved
model for the shell-side condensate film coefficient must be
obtained in order to account for the effect of high vapor
velocities upon condensate rain and to provide a rationale
for incorporation of these effects into models of the local
and overall performance of condensing tubes in bundles.
B. Noncondensible Gases . Appendix C outlines the
method used in ORCON to determine h „-. the conductance of theef f
hypothetical film of gas superimposed upon the condensate film,
Tnitial runs with ORCON indicate that when noncondensible
gases are held to concentration levels of less tha.n about 10
ppm by weight it is unlikely that their effective film
resistance will affect overall condenser performance by more
than 1%. A more subtle effect of the presence of non-con-
densible gases on the shell side is the modification of
- 24:

mixture properties and the subsequent alteration of an already-
complex two-phase flow problem. The transport and heating of
condensate droplets as they progress, through a condenser bun-
dle may depend upon the presence of noncondensibles in a way
that is as-yet undetermined.
C. Vapor Shear . The velocity (Reynolds number) of the
condensing medium has been found to 'be an important factor in
the performance of condensers. In low-speed flows the tra-
jectory of condensate droplets is governed by the influence
of gravity. At higher speeds the trajectories are significant-
ly modified and, in fact, the droplets themselves can be ?
shattered to the point that the condensate flow is in the form
of a mist rather than discrete droplets. In addition, the
speed and direction of the vapor/gas mixture can influence the
condensing performance of a single tube by shear effects at
the vapor/condensate interface and, ultimately, the stimula-
tion of turbulent flow in the condensate film and stripping of
the film from the tube surface.
Many of these problems have been addressed in the open
literature but several of the most advanced techniques appear
to be of a proprietary nature. Appendix D presents a simple
model that allows the estimation of the conditions governing
the relative dominance of gravity and shear from the point of
view of droplet trajectory. Analyses such as these will be
expanded to incorporate information gained from the continuing
search for the best available modelling methods. Vapor
- 25 -

velocity effects and their coupling with condensate rain
processes are thought to be the chief source of conservation
in ORCON and this area of investigation has been assigned as
the research topic for the Engineer's thesis of Lt . H. M.
Holland.
D. Bundle Pressure Drop . Pressure changes occur on the
shell side of the condenser bundles "for three main reasons:
1. Reversible losses or gains in kinetic heads due
to change in flow cross-sections.
2. Dissipative processes due to viscous effects.
3. Condensate removal which lowers the steam
partial pressure which, in turn, reduces the
equilibrium temperature of the mixture as it
flows through the bundle.
The overall pressure drop together with the air extraction
system, determines the back-pressure against which the turbine
must exhaust. In addition, the local pressure at each point
in the condenser will influence the mixture properties at that
point and, directly and indirectly, the local heat removal
rate. Finally, the existence of pressure gradients in the
condenser influences the nature and direction of the flow in
both a local and a global way.
All of the problems previously mentioned are dependent
upon and influence the condenser pressure distribution. The
problem is one of two-phase multi-component flow with highly
coupled variables. As such, it is a matter of current
- 26 -

research and one which will require careful consideration in
the formulation of the optimal design code.
E. Validation of the Models . At present, the CVA-67
full-power operating point is being used as a baseline for
comparison. Even this point is poorly documented (what is
the actual exit fraction for CVA-67 at full power?) and as
refinements to the code continue, it will become increasingly
important to have a reliable set of operating condenser data.
VI. SUMMARY AND FUTURE PLANS
During the reporting period, two main computer codes have
been developed. The baseline code is to serve as the founda-
tion for the construction of the final code. In its present
form, this program consists simply of a single row of tubes
in horizontal steam flow, and only inside convection and shell
side condensate film resistances are incorporated. The base-
line code has been coupled to the optimization code (COPES/
CONMIN) and has been successfully tested in the optimization
mode. The second code is the modified ORCON program which is
serving as a test platform for various candidate models of
the complex processes occurring in large condenser tube
bundles.
Tests with the existing codes have indicated several
areas where improved semi-empirical predictive methods must
be developed. These indications are supported by the
information gained from discussions with researches who are
active in the relevant fields. The main immediate goal in
- 27 -
the present study will be to continue these discussions with
a view towards further defining the best methods presently
available.
Within the following reporting period, the authors will
make several trips to US industrial and government facilities.
In addition, an itinerary has been developed for personal
contact with appropriate individuals, and agencies overseas.
The consultation activities of the authors, past, present, and
future, are documented in Appendix E.
- 28 -

APPENDIX A
AN EXPERIMENTAL COMPARISON OF ENHANCED HEATTRANSFER CONDENSER TUBING
P. J. MartoProfessorMember ASME
LT. D. J. Reilly, USNGraduate Student
Department of Mechancial EngineeringNaval Postgraduate School
Monterey, California 93940
LT. J. H. Fenner, USNGraduate Student
ABSTRACT
Eleven corrugated tubes were tested to comparetheir heat transfer and pressure drop characteristicsto a smooth tube. Steam was condensed on the outsidesurface of each, test tube, which was mounted horizon-tally in the center of a dummy tube bundle, and cooledby distilled water. A corrected overall heat transfercoefficient was determined by subtracting the wallresistance from the measured overall resistance. Theinside and outside heat transfer coefficients weredetermined using the Wilson plot technique.
Corrected overall heat transfer coefficients wereas much as twice those of the smooth tube, whilecooling water pressure drop was as much as ten timesthe smooth tube. Most of the heat transfer improvementoccurred on the water-side, with little increase, or in
some cases a decrease, on the steam- side. The datashow that pitch or helix angle, as well as groove depth,are important variables in enhancing heat transfer.
l
fg
NOMENCLATURE
k
L
m
Nu
P
API
Pr
»wRe
Tc
Tv
U_C
u.
v
P
Ci
CP
Di
Do
e
f
G
g
Nominal surface area of test tube (m )
Sieder-Tate coefficient
Specific heat (kJ/kg C)
Inside diameter (m)
Outside diameter (m)
Tube groove depth (mm)
Fanning friction factor2
Flow rate per unit area (kg/m sec)->
Acceleration of gravity (m/sec")
2Gravitational constant (kg m/N sec")
Heat transfer coefficient (W/m" C)
n
Latent heat of vaporization (W sec/kg)
Thermal conductivity (W/mC)
Length of test tube (m)
Mass flow rate of cooling water (kg/sec)
Nusselt number = hD/k
Tube spiral pitch (mm)
Corrected Pressure drop across test section (kPa)
Prandtl number uc /kP 7
Thermal resistance of tube wall (nTC/W)
Reynolds number = DG/u
Temperature of cooling water (C)
Temperature of vapor sp . ce (C)
2Corrected overall heat transfer coefficient (W/m"C)
Overall heat transfer coefficient (W/m"C)
Dynamic viscosity (kg/m hr)
Fluid density (kg/m )
Subscripts
a Augmentedb Fluid at the bulk temperature in C
f Filmi Inside, or inletn Nominalo Outside, or outlets Smooth, or saturationv Vaporw Wall
A-l

INTRODUCTION EXPERIMENTAL APPARATUS
In recent years, there has been an increasedawareness regarding the use of enhanced heat transfer-surfaces in the design of heat exchangers. Bergles
[1-4] has summarized extensive works in both singlephase and two phase heat transfer enhancement andhas compared the results of different experimentersusing several performance criteria [5, 6].
A variety of studies has been conducted per-
taining to condenser applications. Palen, Cham andTaborek [7, 3] condensed steam on enhanced tubes in a
horizontal tube bundle configuration containing 196
tubes, and compared results to similar smooth tube
tests. The outside diameter of the tubes was 25.4 mm,
and shell -side steam pressure was maintained at either480 kPa or 825 kPa absolute. Young, Withers andLampert [9] conducted bundle comparison tests ofsmooth and enhanced tubes with outside diameters of15.9 mm and 25.4 mm. Steam pressure was kept at 6.9kPa or 101.4 kPa absolute and cooling water velocitythrough each tube was varied from about 0.91 m/sec to
1.98 m/sec. Catchpole and' Drew [10 J conducted testson five different 15.9 mm OD, grooved tubes in both asingle- tube and bundle configuration. Steam wassupplied at 13.79 kPa and the cooling water velocitythrough the tubes was maintained at 5.05 m/sec.Cunningham and Milne [11] studied the effect of helixangle on the performance of horizontal roped tubes.Steam was supplied at atmospheric pressure, andcooling water velocity was varied up to 4 m/sec. Thetubes were approximately 12.5 mm in outside diameter,and were tested in a single- tube configuration.Newson and Hodgson [12] condensed steam at atmosphericpressure on a variety of enhanced tubes in a verticalorientation. Similar tests were conducted by Combs
[13] for ammonia, and by Combs, Mailen and Murphy [14]for different refrigerants.
The above-mentioned investigations have beenconducted under widely varying test procedures andphysical environments, leading to difficulty in
attempting to compare results. The purpose of thiswork is therefore to obtain heat transfer and pressuredrop data of a variety of spirally fluted condensertubes, and to compare their performance to smooth tubeoperation using a single apparatus under identicaloperating conditions.
STEAM FROM DESUPER HEATER
.1.
SAFFLE SEPARATORS
VAPOR THERMOCOUPLES
ISO MESH SCREEN(3 LAYERS)
VIEWING WINDOW
COOLNG WATERINLET
WALLTHERMOCOUPLE
VAPOR OUTLET
.FLOWS STRAJGHTENER
COOLING WATEROUTLET
TUBE SHEET
CONDENSATETO HOT WELL
The condenser apparatus used during these testsis shown schematically in Figures 1 and 2, and is
described in more detail by Beck [15], Pence [16] andFenner [17] . The test condenser is made of stainlesssteel. Steam from an electrically fired boiler entersfrom the top at 20.7 kPa, after passing through a
desuperheater to keep the superheat less than IOC. It
then expands into the test section, and is uniformlydistributed by baffle separators, three layers of 150mesh screen, and a flow straightener. The steam is
guided through a horizontal tube bundle with a spacingto diameter ratio of 1.5. As shown in Figure 2, glasswindows exist on each side of the condenser to view
cLOW 9AFFLE5
Fig 1. Schematic Front View of Test Condenser
Fig. 2. Schematic Side View of Test Condenser
the condensation process. Only the center tube withinthe bundle is active, with cooling water flowing throughit. The other dummy tubes are provided to simulateactual steam flow conditions in a large tube bundle.The steam which is not condensed on the test tube flowsthrough the outlet manifold to a secondary condenser.The condensate is collected at the bottom of thecondenser and flows to a hotwell where it is pumpedback to a feed-water heater prior to re-entering theboiler. All test section components are insulated withfoam rubber insulation.
A-
2
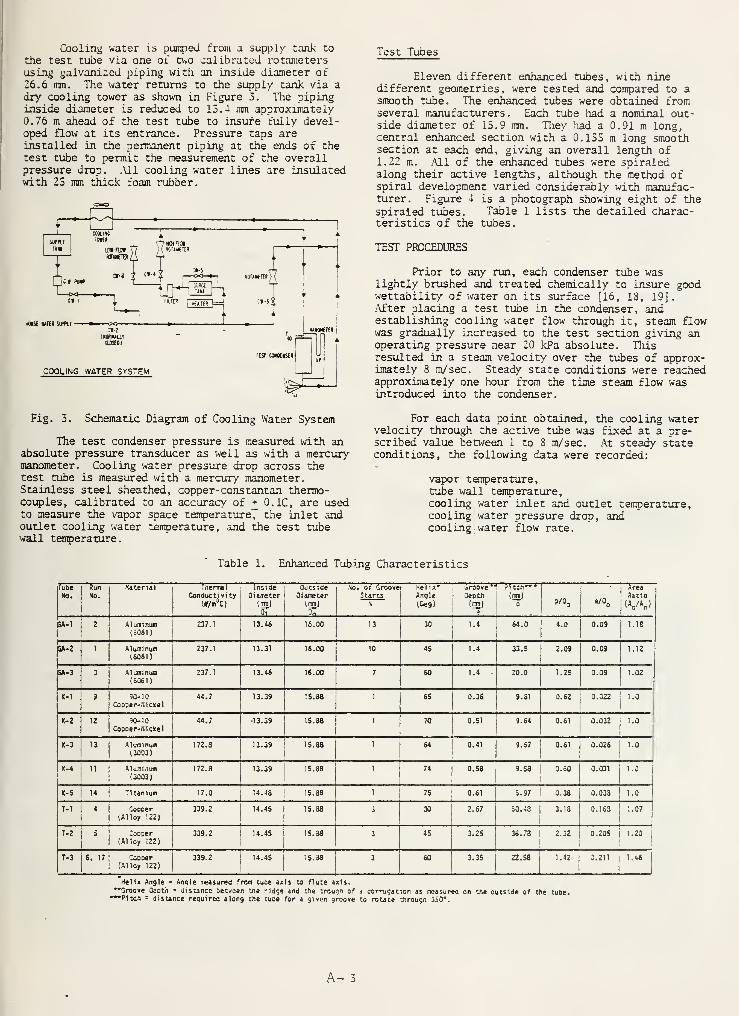
Cooling water is pumped from a supply tank to
the test tube via one of two calibrated rotametersusing galvanized piping with an inside diameter of26.6 mm. The water returns to the supply tank via adry cooling tower as shown in Figure 3. The pipinginside diameter is reduced to 15.4 mm approximately0.76 m ahead of the test tube to insure fully devel-oped flow at its entrance. Pressure taps areinstalled in the permanent piping at the ends of thetest tube to permit the measurement of the overallpressure drop. All cooling water lines are insulatedwith 25 mm thick foam rubber.
oust urn ami—» &o
Test Tubes
Eleven different enhanced tubes, with ninedifferent geometries, were tested and compared to asmooth tube. The enhanced tubes were obtained fromseveral manufacturers. Each tube had a nominal out-side diameter of 15.9 mm. They had a 0.91 m long,central enhanced section with a 0.1S5 m long smoothsection at each end, giving an overall length of1.22 m. Ml of the enhanced tubes were spiraledalong their active lengths, although the method ofspiral development varied considerably with manufac-turer. Figure 4 is a photograph showing eight of thespiraied tubes. Table 1 lists the detailed charac-teristics of the tubes.
TEST PROCEDURES
Prior to any run, each condenser tube waslightly brushed and treated chemically to insure goodwettability of water on its surface [16, 13, 19]..After placing a test tube in the condenser, andestablishing cooling water flow through it, steam flowwas gradually increased to the test section giving anoperating pressure near 20 kPa absolute. Thisresulted in a steam velocity over the tubes of approx-imately 8 m/sec. Steady state conditions were reachedapproximately one hour from the time steam flow wasintroduced into the condenser.
fig. 3. Schematic Diagram of Cooling Water System
The test condenser pressure is measured with anabsolute pressure transducer as well as with a mercurymanometer. Cooling water pressure drop across thetest tube is measured with a mercury manometer.Stainless steel sheathed, copper- constantan thermo-couples, calibrated to an accuracy of + 0.1C, are usedto measure the vapor space temperature, the inlet andoutlet cooling water temperature , and the test tubewall temoerature.
For each data point obtained, the cooling watervelocity through the active tube was fixed at a pre-scribed value between 1 to 8 m/sec. At steady stateconditions, the following data were recorded:
vapor temperature,tube wall temperature,cooling water inlet and outlet temperature,cooling water pressure drop, andcooling water flow rate.
Table 1. Enhanced Tubing Characteristics
TubeNO.
Run
No.
VaterUl Tnermal
Conductivity
Wm°C)
InsideJUKter(m)0,
OutsideOiameter
(mm)
No. of Croovei Melix*Starts Anqle
N lOea)
Sroove ""
Oeptn
{ml
Pi ten—
*
(mm)
P?/o
!
—
e/DQ
AreaRatio
3A-1 2 Aluminum
(6061)
237.1 13.46 16.00 13 30 1.4 64.0 4.0 0.09 1.18
SA-2 1 Aluminum(6061)
237.1 13.31 16.00 10 45 1.4 33.5 2.09 0.09 1.12
SA-3 3 Aluminum(6061)
237.1 13.46 16.00 7 60 1.4 20.0 1.25 0.09 1.02
K-l 9 30-10
Copper-:iickel
44.7 13.39 15.88 65 0.36 9.31 0.62 0.022 1.0
K-2 12 90-10
Copper-Nickel44.7 13.39 15.88 70 0.51 9.64 0.61 0.032 1.0
K-3 13 Aluminum
(3003)
172.3 13.39 15.88 64 0.41 9.67 0.61 0.026 1.0
X-4 11 Alu.ni.tum
(3003)
172.8 13.39 15.38
'
74 0.58 9.58 3.60 0.031 1.0
K-S 14 Titanium 17.0 14.48 15.38 1 75 0.61 5.97 0.38 0.033 1.0
T-! 4 Copper(Alloy 122)
339.2 14.45 15.88 3 30 2.67 50.43 3.18 0.163 :.07
T-2 5 Copper(Alloy 122)
339.2 14.45 15.38 3 45 3.25 36.73 2.32 0.205 1.20
T-3 6. 17 Cooper(Alloy 122)
339.2 14.45 15.38 3 60 3.35 22.58 1.42 0.211 l.«
Helix Angle Anqle measured from tube axis to flute axis.
"Groove Oeptn » distance between tne ridge and the trough of a corrugation as measured on Oi« outside of the tube.••Pitch - distance required along the tube for a given groove to rotate tnrougn 350°.
A- 3

r r FT"I'
L^J k*-~2
p,
GA-1 GA-2 GA-3 K-4 -K-5
&
T-1 T-2
1
\
T-3
Pig. 4. Photographs Showing the Geometries of the Enhanced Tubes
From this data, the overall heat transfer coeffi-cient was calculated using a nominal surface area of a
16 ma OD smooth tube:
Un
=m c. Tc.
In Gi Tci)
(1)
A corrected overall coefficient was then obtained by-
subtracting a calculated wall resistance from theoverall measured thermal resistance:
Uc
= -\
C2)
The rotameters used in this experiment werecalibrated using a stopwatch and a scale. All thermo-couples were calibrated against a platinum resistancethermometer in a silicone oil bath. Uncertainties in
these measured values led to uncertainties in thecalculated quantities mentioned above. The details ofthese uncertainty calculations are presented by
Fenner [17] and Reilly [18]. Some typical uncertain-ties are listed below:
Un : ± 6%
h,: * 10%
h : + IS*o —
Values of the calculated wall resistances were esti-mated for each of the enhanced tubes by using the
thermal conductivity values listed in Table 1 alongwith approximate wall thickness values. The exactwall resistance of fluted tubes is very difficult to
calculate due to the complicated geometry and the non-uniform heat transfer rates which occur between thebottom and the top of the grooves. Fortunately, duringthese tests, the wall resistance was not significant,and it was estimated that, in general, a 50 percentuncertainty in wall resistance would cause less than a10 percent uncertainty in U . The inside and outsideheat transfer coefficients were calculated followingthe well-known Wilson plot technique [17, 18, 20, 21].
In order to find the friction factor for each ofthe enhanced tubes, the overall cooling water pressuredrop was corrected for the smooth ends as well as forthe expansion and contraction effects which occur atthe exit from and entrance to the enhanced portion ofthe tubes [17, 13]. This corrected pressure drop iPwas then used to define a Fanning friction factor:
f =p AP
20/D^G-(3)
RESULTS .AND DISCUSSION
Heat Transfer Coefficients
Figures 5, 6, and 7 show the corrected overallheat transfer coefficient versus cooling water massflow rate for each of the corrugated tubes. As
IOOOO
-1
—
- - T r 1 1
S
1 1 1
i -
8000
<7*
?i
sooo ¥
* RUN 1, GA-24000 RUN 2,
HON 3,
GA- 1
GA-3
2000
I
1
. SMOOTH TUBE RESULTS_
i I , ,i. 1 i
UNCERTAINTY UMTS
1 1 1 1
04 5 06 07 08MASS FLOW RATE (kg/sec)
Fig. 5. Corrected Overall Heat TransferCoefficient for the Type GA Tubes
A-4

Fig. 6. Corrected Overall Heat TransferCoefficient for the Type K Tubes
12000
?j
<7
o7o • • • •
i•
10000
9000 S
8
A A
oO
o o* * ooo
6000 ao O o
o Run 4. T-l
4000 - o Run 5.
Run 6.
r-2
T-3o
2000 - NoH SoM DOfflts indicate
'lOroiiafi offered
i i i .
7
f
Run 17. T-3DSmoom TuM RmuMJncarratnfy Limin
i i i i l
Fig.
Dl 02 03 04 OS 6 07 08 09 10
Mom Him Rott (kq/MC>
7. Corrected Overall Heat TransferCoefficient for the Type T Tubes
expected, the heat transfer performance of these tubesis clearly superior to the smooth tube. For example,at a cooling water mass flow rate of 0.5 kg/sec,corresponding to a velocity of 3.6 m/sec, and aReynolds number of 35,000 inside the tube, the cor-rugated tubes show an increase in the corrected over-all coefficient of from 16% to 100% over the smoothtube value. The tubes K-l thrdugh K-5 show thesmallest increase over the smooth tube (from 16 to
42 percent) due to their rather shallow groove depth,
as seen in Figure 4, and as listed in Table 1. TubesGA-1 through GA-5 perform better, showing an increaseof 51 percent for GA-2, 56 percent for GA-1 and 62
percent for GA-3 at the same cooling water mass flowrate of O.j kg/sec. This improved performance is dueto the numerous, deep grooves in this tube as shownin Table 1. The best overall performance is exhibitedby tube T-3 which shows an increase of 104 percent.When comparing this tube to the others tested, it isseen in Table 1 that it possesses the most severegroove depth of any of the tubes, reaching 20 percentof the tube outer diameter. This gives the largestsurface area ratio of 1.46 as well.
Effect of Tube Vibration
Of interest in Figure 7 is the effect of vibra-tion on tube performance, as indicated by the soliddata points. Tube T-2 was observed to vibrate visuallyand audibly at its maximum cooling water flow rates,and tube T-3 was observed to vibrate at much lowercooling water flow rates. These tubes, especially T-3,had low lateral strength. Movies were therefore madewith varying cooling water flow rates through tubeT-3 to observe the initiation of tube vibration. Thiswas done both with and without steam condensing on the
tube. Copies of the lb mm movie film showing the vi-
bration phenomena, both with and without condensationtaking place, are available on request.
Vibration was observed to begin visually at a
cooling water velocity of about 1 m/sec when steam wasnot supplied to the condenser. This indicated thatthis phenomena was not caused by vortex shedding on theoutside, but by cooling water turbulence on the inside.With steam supplied, however, vibration was not visuallydectectable until velocities of about 3 m/sec werereached. This was felt to be due to the damping effectof the added mass of the condensate flooding the tubegrooves. Audible evidence of the vibration was heardboth with and without steam supplied to the condenserat cooling water velocities of about 1.8 m/sec andabove.
It was decided to run tube T-3 with additionalsupports to see if the vibration could be controlled,and to observe the effect on tube performance. There-fore, for Run 17, the active length of the tube wassupported against the adjacent tubes using two circularring braces equally spaced along the tube axis suchthat the active length was reduced to three equallengths of approximately 1/3 meter each. During thisRun no vibration was observed either visually oraudibly.
Figure 8 illustrates this vibration phenomena.As a note of clarification, the reader may wish torefer to Figure 2 while -studying Figure 8. The
(a) Cooling Water Velocity is 3 m/sec
(b) Cooling Water Velocity is 4 m/sec
Fig. 8. Photographs Showing Effect of TubeVibration on Condensate Ripples
,
Tube T-3
pictures are views upward between the smooth dummy half-tube and the smooth dummy whole- tube below it. suchthat the bottom of the enhanced tube can be seen justbelow the smooth dummy half- tube. Figure 8(a) showscondensation on tube T-5a which was unsupported. Thecooling water velocity is 3 m/sec, and no vibration is
evident. Figure 8(b) shows a view of the same tube
A-
5

with a higher cooling water velocity of 4 m/sec while
vibration is occurring. The light reflections off the
surface of the condensate in the figure are due to
surface ripples on the condensate from the vibration.
The effect of this vibration on heat transfer is
clearly seen in Figure 7. By comparing tubes T-5a,
Run 6 (unsupported) and T-3b, Run 17 (supported), it
is clear that there is a significant improvement in
the corrected overall heat transfer coefficient whenthe vibrations do not occur. .As indicated earlier in
the photographs, these tube vibrations cause the con-
densate to have surface waves which may hold up the
condensate drainage off the exterior of the tube,
thickening the condensate film. 3y adding the addi-
tional tube supports, and preventing vibration, the
drainage was improved, leading to higher outside heattransfer coefficients.
Inside and Outside Coefficients
Using the Wilson plot technique, the inside andoutside heat transfer coefficients were calculated.The inside heat transfer coefficient was assumed to
follow the Sieder-Tate relationship [22]
:
Nil =hiDi
CiRe°- 8
Pr1/ 3
Cu/uJ' 14
, (4)
and Cj_ for the smooth tube was measured as 0.025.This compares favorably with the normally quoted valueof 0.027 [22]. The outside heat transfer coefficientwas assumed to follow the Mussel t expression [23]:
h = 0.725os
Cp<w7;
0.2S
(5)
All of these effects may contribute to the large in-
creases as measured.
On the other hand, on the outside, the flutesgenerate surface tension driven forces which tend tothin the condensate film on the convex surfaces(ridges) and to thicken the film in the concave channels(valleys), as originally postulated by Gregorig [24]
and recently described by Combs [13]. The thinner filmon the ridges provides a lower thermal resistance to
heat flow whereas the thicker film in the valleysprovides a higher resistance. The overall heat trans-fer improvement depends upon a tradeoff betweenimprovement on the ridges and degradation in the
valleys. The greater amount of condensate in thevalleys should provide for better drainage, but duringthese tests the condensate appeared to be held up onthe flutes, presumably due to the high surface tensionof water. Lower surface tension fluids, such as
refrigerants, may therefore behave differently. Inactual shell- side condensation, at high vapor velocities,shear forces at the liquid- vapor interface may rip thecondensate off the tubes, effectively thinning the filmand providing a heat transfer improvement on the outside.
Further study of Tables 1 and 2 shows that the in-
side and outside heat transfer coefficients are relatedto change in pitch for approximately constant groove
depth. This is reflected in Fig._9 which shows values
of the ratios of Cia/Cls and hoa/ho s plotted versus vary-
ing pitch for constant groove depth. The trends of the
data in the Cia/Cis curve reveal that there is perhapsan optimum pitch, at a constant groove depth, which maxi-
mizes the inside heat transfer coefficient. This
Table 2. Summary of Internal and External HeatTransfer Coefficients of Enhanced Tubing
The validity of the Reynolds number exponent 0.8in equation (4) may be questionable for corrugatedtubes due to the severity of the "roughness" in theseenhanced tubes. .An error in this exoonent will influ-ence the calculated values of C\ and h
OS'However,
this exponent has been used by earlier investigations
[7, 9, 10] with good success, arid it was thereforeassumed to be valid for the tubes tested during thisstudy.
Table 2 gives ratios of the average Sieder-Tatecoefficients for the enhanced tubes (Ci a) to that ofthe smooth tube (Ci s ) , and average outside heat trans-fer coefficients for the enhanced tubes (hoa) to thatof the smooth tube (hos ) for each of the tube types.The ratios represent the mean values over the entireflow range of the cooling water. Maximum deviationsaround the mean are also listed.
It is evident that for all of the tubes, most ofthe enhancement occurs on the inside, with little
increase or in some cases a decrease on the outside.This result agrees with the earlier findings of Young,Withers and Lampert [9] , Catchpole and Drew [10] andCunningham and Milne [11] who showed that, in general,most of the heat transfer improvement occurs on thecooling water side. Apparently, the flutes on the
inside, in addition to increasing the heat transfersurface area, act as roughness elements to createadditional turbulence. A swirl component of velocityis also generated which can give rise to secondaryflows in the flute channels, effectively thinning thelaminar sublayer, and increasing the heat transfer.
TubeNo.
cycis
hoa/ho
s
K-l 1.60 + .18 • .97 + .11
K-2 2.12 + .21 .93 + .09
K-3 2.60 + .47 .85 + .09
K-4 2.60 + .29 .85 + .09
K-5 2.20 + .27 1.15 + .12
T-l 1.76 + .24 1.03 + .13
T-2 2.92 + .33 1.10 + .10
T-3a 4.88 + .82 1.32 + .12
T-3b 5.12 + .90 1 . 34 + . 1
3
GA-1 3.28 + .51 .94 + .06
GA-2 3.24 + .50 .94 + .06
GA-3 3.28 + .51 .99 + .09
A-
6

3.0
40
3.0
2
1
Average GrooveTube Type Depm/Qiometer
0-K " 03X-GA 09A-T 0.19
K-5T-l
J L -\v\\- J I I L0.3 4 0.5 0.6
*' M 1.5 2.0 2.5 3.0PITCH /DIAMETER
1.3
1.2 -
Tube Type
0-KX-GAA-T
Average Groove
'
Qepfh/Qiomeler
030.09
19
J1.1
1.0
0.9
0.3 0.4 0.5 0.6 41.5 2.0 2.5 30
PITCH/ 01AMETER
0.10
008
T-3
GA-3
2 3 4 56789 10"
Reynolds Number, D G/fj.
Fig. 10. Fanning Friction Factor forthe Enhanced Tubes
Fig. 9. Effect of Groove Depth andPitch on Inside and OutsideHeat Transfer Coefficients
could be due to the fact that as pitch changes frombeing very large to very small, the nature of the
internal flow changes from predominately swirlingmotion to predominately turbulent mixing. The optimumpitch could therefore be the one that produces a com-
bination of both these mechanisms. Figure 9 also showsoutside heat transfer improves with decreased pitch.
With reduced pitch, condensate drainage improves andmore channels are provided, presenting more tubesurface area to the steam flow. Notice that the
relative position of the data for the three tube typesis related to their respective groove depths. Adeeper groove provides better heat transfer on bothsides of the tube. These results correlate with thework of Catchpole and Drew [10]. In their results, fore/D = 0.04, ^decreasing p/D from about 0.8 to 0.4 in-creased the Ci /Cis ratio from 2.1 to 2.6. This samedecrease in pitch followed the trend of Figure 9 forthe outside heat transfer coefficient, with a maximumhoa/hos ratio reached of about 1.7.
Friction Factor
Figure 10 shows the Fanning friction factors ofthe corrugated tubes. .As expected, they are signifi-cantly higher than the smooth tube value. Tube T-3shows the largest friction factor overall, and tubesK-5 and GA-3 show the largest friction factors forthe other tube types. In examining the tube charac-teristics given in Table 1, it is apparent that as tubepitch decreases, or helix angle increases, the frictionfactor increases. As helix angle approaches 90°, the
grooves appear as repeated rib- type roughness elementswhich have been studied by Webb, Eckert and Goldstein[25].- They show that as the height of the rib-
roughness element [i.e., groove depth j increases , andas the distance between ribs decreases, (i.e., higherhelix angle), the friction factors increase. Thesetrends are clearly evident in Figure 10. Furthermore,it appears that the friction factors for tubes T-3,
GA-3 and K-5 remain approximately independent ofReynolds number, indicating that the flow in thesetubes is "fully rough."
Overall Tube Performance
Bergles [2] and Bergles, Blumenkrantz and Taborek
[5] outline several performance criteria of enhancedtubes based on the inside heat transfer coefficientsby solving for the ratio of augmented to smooth tubeheat exchanger surface areas while holding variousparameters constant. These criteria were later ex-
tended by Bergles, 3unn and Junkhan [o] to includeexternal thermal resistances as well. A particularcriterion of interest for condenser design is the
ratio of augmented to smooth tube surface area for a
given heat load, tube size, log mean temperaturedifference and pumping power. A smaller area ratiowould require a shorter tube for the same performance.This criterion was therefore chosen to compare the
overall performance of the corrugated tubes to oneanother. Details of this technique mav be found in
Fenner [17] and Reilly [18]
.
Figure 11 shows this area ratio for the corru-
gated tubes versus the Reynolds number in the smooth
A- 7

Reynolds Numter, ^0, Vs /p.
Fig. 11. Surface Area Ratio of AugmentedTube to Smooth Tube Condenserat Constant Heat Load andPumping Power
tube. The figure is entered by picking a smooth tubevelocity, and calculating a Reynolds number. Forexample, naval condensers are designed for a coolingwater velocity of 2.74 m/s. Using this representativevalue in a 16 mm diameter smooth tube gives a smoothtube Reynolds number of about 40,000. The velocity andReynolds number in the augmented tube would, of course,be less to preserve the same pumping power. EnteringFigure 11 with this Reynolds number, it is seen thattube T-5 would allow for approximately a 53 percentreduction in the required surface area, whereas tubeK-l would allow for approximately a 17 percent reduc-tion.
All of the tubes are more effective in reducingsurface are.* at low rather than high smooth tubeReynolds numbers. This is because, in smooth tubesat low cooling water velocities (less than approximate-ly 2.7 m/s), the tube-side thermal resistance is
controlling. Since the corrugated tubes enhance heattransfer primarily on the inside, as shown earlier,then a significant reduction in surface area is possi-ble for the same heat load and pumping power. At highReynolds numbers, on the other hand, the steam- sidethermal resistance is controlling and the corrugatedtubes will not perform as well.
The results in Figure 11 should be interpretedwith caution. The area ratios were calculated assum-ing the log mean temperature difference to be constant.In reality, during these tests the log mean temperaturedifference ranged between 55 and 46 C. This variationwill shift the curves approximately 5 percent withrespect to one another. More importantly, the resultsobtained don't take into account variations in tubediameter, or spacing, as well as steam flow andcondensate inundation effects. Such parameters are
extremely important in condenser design considerations,allowing the designer to adjust the frontal area aswell as the length of the heat exchanger. Finally,the effects of fouling, tube vibration and cost mayinfluence final tube choice.
CONCLUSIONS
As a result of the above-mentioned tests, thefollowing conclusions are reached:
1. All of the corrugated tubes showed animprovement in the corrected overallheat transfer coefficient when comparedto the smooth tube. This improvementranged from 17 to 104 percent.
2. Most of this improvement occurred on
the cooling water side of the tubespresumably due to a combination ofincreased surface area, as well asincreased turbulence and induced swirlin the flow.
3. This increase in heat transfer occurredat the expense of a substantial increasein cooling water pressure drop. Measuredfriction factors were as much as tentimes the smooth tube value.
4. Corrugated tubes manufactured with verydeep grooves exhibited the best heattransfer performance. However, whenthese tubes were not properly supported,vibration occurred due to cooling waterturbulence, which caused a deteriorationin their performance.
5. At a constant groove depth, heat transferperformance was dependent upon groovepitch, or helix angle.
6. The use of these corrugated tubes in a
surface condenser may reduce the requiredsurface area by as much as 50 percent fora constant heat load and pumping power.The above result, however, doesn't includeeffects such as high steam velocity,condensate inundation in a tube bundle,and fouling, all of which may play animportant role in condenser design.
REFERENCES
1. Bergles, A. E., "Enchancement of Heat Transfer,"Proceedings of the Sixth International HeatTransfer Conference , Vol. 6, Toronto, 197S, pp.89-108.
2. Bergles, A. E. and Jensen, M. K. , "Enhanced Single-Phase Heat Transfer for Ocean Thermal EnergyConversion Systems". Research Report HTL-15,April 1977, Iowa State University, Ames, Iowa.
5. Bergles, A. E., "Bibliography on Augmentation ofConvective Heat and Mass Transfer", Part 1,
Previews of Heat and Mass Transfer , Vol. 4, No. 2,
January 1978.
4. Bergles, A. E., "Bibliography on Augmentation ofConvective Heat and Mass Transfer," Part 2,
Previews of Heat and .Mass Transfer, Vol. 4, No. 4,
July 1978.
5. Bergles, A. E. , Blumenkrantz, A. R. , and Taborek,J. , "Performance Evaluation Criteria for EnhancedHeat Transfer Surfaces," Proceedings of the FifthInternational Heat Transfer Conierence , Tokyo,197T
A- 8

6. Bergles, A. E., Bunn, R. L. , and Junkhan, G. H.,
''Extended Performance Evaluation Criteria for
Enhanced Heat Transfer Surfaces," Letters in Heatand Mass Transfer , Vol. 1, 1974, pp. 115-120.
7. Palen, J., Cham, B. and Taborek, J., "Comparisonof Condensation of Steam on Plain and TurbotecSpirally Grooved Tubes in a Baffled Shell- and-TubeCondenser", Report 2459-300/6, January 1971,
Heat Transfer Research, Incorporated, Alhambra,California
.
8. Palen, J., Cham, B. and Taborek, J., "Comparisonof Condensation of Steam on Plain and PhelpsDodge Spirally Grooved Tubes in a Baffled Shell-and-Tube Condenser," Report 2430-500/5,December 1970, Heat Transfer Research, Incorporated,Alhambra. California.
9. Young, E. H. , Withers, J. G. and Lampert, W. B.
,
"Heat Transfer Characteristics of Corrugated Tubesin Steam Condensing Applications," AIChE Paper No.
3, ISth National Heat Transfer Conference, SanFrancisco, August 1975.
10. Catchpole, J. P. and Drew, B. C. H., "Evaluationof Some Shaped Tubes for Steam Condensers," ReportNo. 619, National Engineering Laboratory, EastKilbride, Glasgow, August 1976.
11. Cunningham, J. and Milne, H. K. , "The Effect ofHelix Angle on the Performance of Roped Tubes,"Proceedings of the Sixth International HeatTransfer Conference, Vol. 2, Toronto, 1973, pp.601-605.
19.
20.
22.
24.
25.
Metals Handbook , 8th ed. , Vol 2, American Societyfor Metals, 1964, p. 60S.
Wilson, E. E. , A Basis for Rational Design ofHeat Transfer Apparatus , paper presented at the
Spring Meeting of the Society of MechanicalEngineers, Buffalo, N.Y., June 1935.
Briggs, D. E., and Young, E. H. , "Modified WilsonPlot Techniques for Obtaining Heat TransferCorrelations for Shell and Tube Heat Exchangers,"Heat Trans fer- Philadelphia, Vol. 65, No. 92, 1969,
pp. 35-45,
Sieder, E. N., and Tate, C. E., "Heat Transfer andPressure Drop of Liquids in Tubes," Ind. Eng.
Chemistry , Vol. 28, 1936, p. 1429.
Holman, J. P., Heat Transfer , 4th Ed., McGraw-Hill Book Co., New York, 1976, p. 358.
Gregorig, R. , "Film Condensation on Finely WavedSurfaces with Consideration of Surface Tension,"Zeit. Fur Ang. Math. U. Physik , Vol. 5, 1954,
p. 36.
Webb, R. L., Eckert, E. R. G., and Goldstein,R. J. , "Heat Transfer and Friction in Tubes withRepeated-Rib Roughness," Int. J. of Heat MassTransfer , Vol. 14, 1971, pp. 601-617.
12. Newson, I. H. and Hodgson, T. K. , "The Developmentof Enhanced Heat Transfer Condenser Tubing,"Proceedings of the Fourth International Symposiumon Fresh Water From the Sea, Vol. 1, 1973, pp.ww.
13. Combs, S. K. , "An Experimental Study of HeatTransfer Enhancement for .Ammonia Condensing onVertical Fluted Tubes," Report ORNL-5556, January1978, Oak Ridge National Laboratory, Oak Ridge,Tennessee
.
14. Combs, S. K. , Mailen, G. S. and Murphy, R. W.
,
"Condensation of Refrigerants on Vertical FlutedTubes," ORNL/TM-S848, August 1978, Oak RidgeNational Laboratory, Oak Ridge, Tennessee.
15. Beck, A. C, A Test Facility to Measure HeatTransfer Performance of Advanced Condenser Tubes ,
MSME, Naval Postgraduate School, Monterey, Califor-nia, January 1977.
16. Pence, D. T. , .An Experimental Study of SteamCondensation on a Single Horizontal Tube , MS^E,Naval Postgraduate School, Monterey, California
,
March 1978.
17. Fenner, J. H. , .An Experimental Comparison ofEnhanced Heat Transfer Condenser Tubing , .MSME,
Naval Postgraduate School, Monterey, California,September 1978.
18. Reilly, D. J., .An Experimental Investigation ofEnhanced Heat Transfer on Horizontal ConuenserTubes , ^E, Naval Postgraduate School, Monterey,California, March 1978.
A- 9


APPENDIX B: Some Comments on Rain Effects
Nomenclature :
g acceleration of gravity
h average heat transfer coefficient for n tubesen e
h heat transfer coefficient for the n-th tuben
h, T heat transfer coefficient for a single tube
n number of tubes
kf
condensate film thermal conductivity
ATf
temperature drop across condensate film
p density of condensate film
p density of vapor
u~ viscosity of condensate film
Nusselt Model :
If each tube in a column of n tubes condenses at the same
rate and if the condensate from each tube is added to the film
of the tube below in such a way that the assumptions of the
single-tube analysis remain valid, then the average film co-
efficient for a row of n tubes is
h = 0.728en
gp(p - P v )kf-hfg'13
nu AT-v f
If h„ is the film coefficient for a single tube (n = 1 in the
above expression) then
en -0.25— = n (1)nN
B-l

From an expression such, as (1), we may find simple
formulas for the individual tubes in the column. Thus, from
the definition of the mean,
1n - 1
a_1h = - Z h., and h , , . = -=*- £ h.en n
i=1i* c(n-l) n-1
i=1l
so that
n n-1nh - (n-l)h , , N
= Z . Z . ,en v J c(n-l) . , h. - , h. = hv' i=l l i=l l n
and applying (1) separately for n and (n-1) tubes
h = nh.T
(n) ' ° - (n-1) hw (n-1)n N N
t— = n - (n - 1) (2)N
Equation (2) is plotted below for a range of values of n.
Note that the Nusselt result indicates that any tubes over
about 5 give less than 50% performance. In fact, experimental
results of various investigators show that Eq. (1) is more
appropriately written
en -s= n
where s may vary in the range of 0.07 to 0.20. Results using
the extreme value (s = 0.07) are also plotted below. Note
that in this case over 1000 tubes are required before tube
performance is degraded below 50%. Clearly there are large
B-2
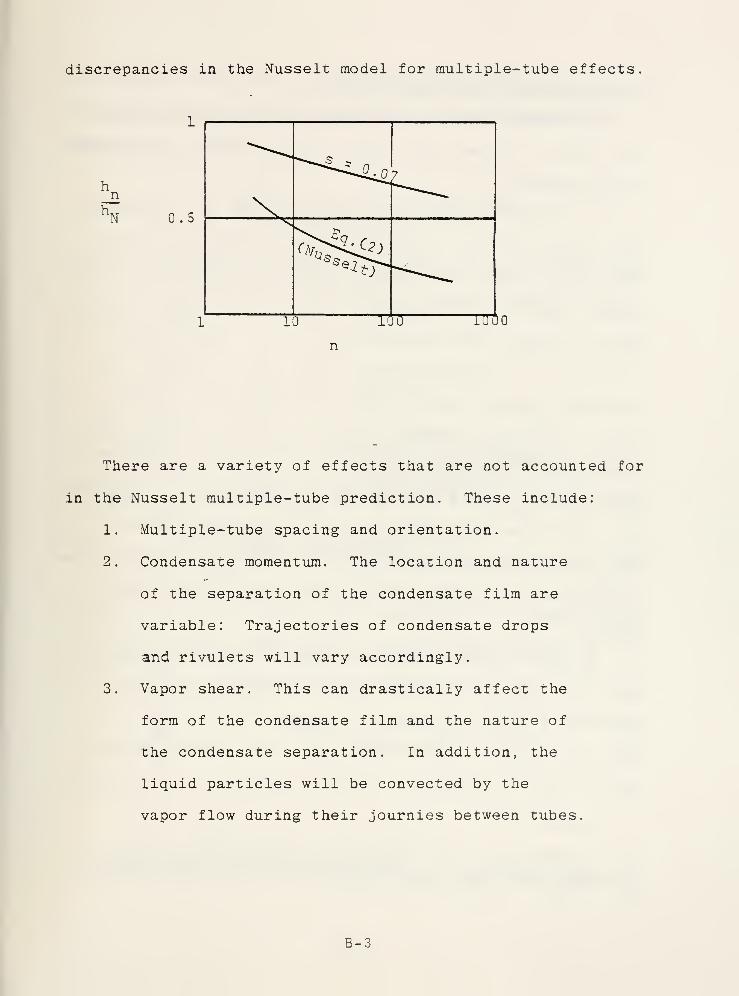
discrepancies in the Nusselt model for multiple-tube effects
N 0.5
There are a variety of effects that are not accounted for
in the Nusselt multiple-tube prediction. These include:
1. Multiple-tube spacing and orientation.
2. Condensate momentum. The location and nature
of the separation of the condensate film are
variable: Trajectories of condensate drops
and rivulets will vary accordingly.
3. Vapor shear. This can drastically affect the
form of the condensate film and the nature of
the condensate separation. In addition, the
liquid particles will be convected by the
vapor flow during their journies between tubes.
B-3
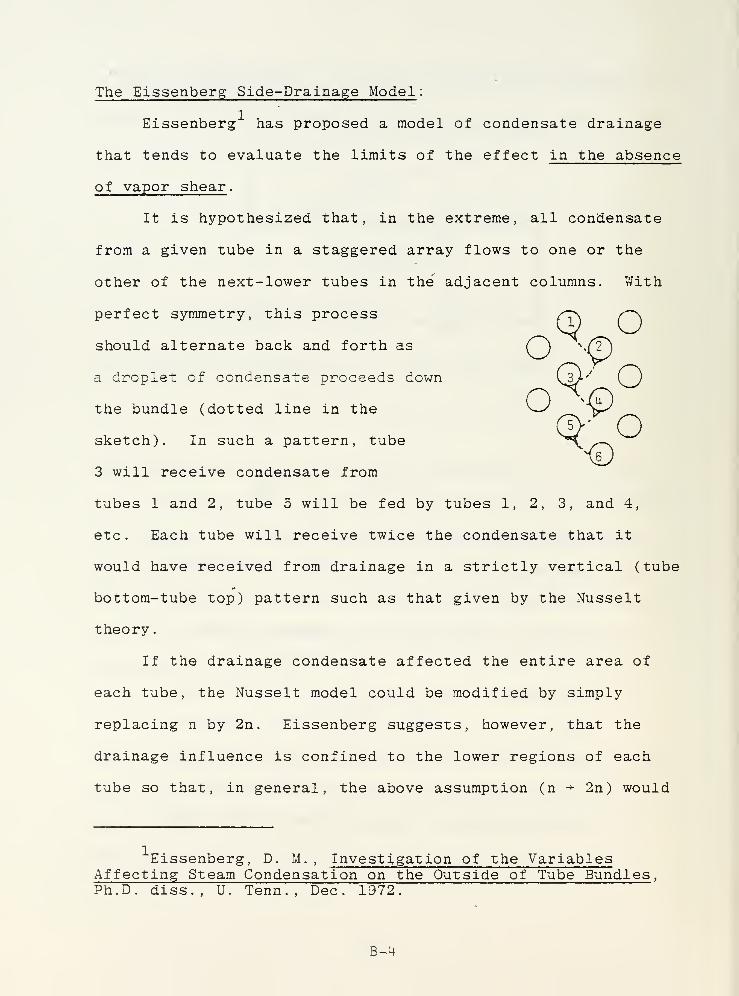
The Eissenberg Side-Drainage Model :
Eissenberg has proposed a model of condensate drainage
that tends to evaluate the limits of the effect in the absence
of vapor shear .
It is hypothesized that, in the extreme, all condensate
from a given tube in a staggered array flows to one or the
other of the next-lower tubes in the adjacent columns. With
perfect symmetry, this process
should alternate back and forth asQ O
a droplet of condensate proceeds down \A)-'' L)
the bundle (dotted line in the ^-s v^©• Osketch). In such a pattern, tube ^"\ ^-.
3 will receive condensate from
tubes 1 and 2, tube 5 will be fed by tubes 1, 2, 3, and 4,
etc. Each tube will receive twice the condensate that it
would have received from drainage in a strictly vertical (tube
bottom-tube top) pattern such as that given by the Nusselt
theory.
If the drainage condensate affected the entire area of
each tube, the Nusselt model could be modified by simply
replacing n by 2n . Eissenberg suggests, however, that the
drainage influence is confined to the lower regions of each
tube so that, in general, the above assumption (n > 2n) would
Eissenberg, D. IA. , Investigation of the VariablesAffecting Steam Condensation on the Outside of Tube Bundles
,
Ph.D. diss., U. Tenn., Dec. 1972.
B-4

over-predict the effect. The assumption is made that only
the lower half of each tube receives drainage liquid from
tubes above. Thus
en
N (tube bottoms)
_ 1 .-.25- 2(2n)
With no condensate drainage, the Nusselt model indicates that
the top halves of tubes carry 60% of the condensing load so
that
\en ,. . , .= 0.6
(tube tops)
Eissenberg postulates that with total side-drainage, the
reduction in h„ is given by the sum of these expressions
en _ _ a 1, .-.25t-— = 0.6 + Q-(2n)nN *
(1)
If there is a flow pattern that lies between the Nusselt and
the total side-drainage cases, a linear weighting may be used
without further restricting the analysis:
or
N
1 - 250.6 + £(2n)
en 1-0.58 P.
hf - °' 6 Fd
+ -lN n
.25
(2)
B-5

Here F , is the "drainage factor" and varies from 1 for total
side drainage to for Nusselt drainage (tubes in line and/or
widely spaced).
Figure Bl is offered by Eissenberg in support of his
theory. Since the value of s = 0.25 is somewhat disproven,
calculations have also been made with a value of s based upon
the data of Ferguson and Oakden (as -presented by Eissenberg)
for the column case (where Nusselt' s approximations might be
expected to have some validity). This lead to s ~ 0.20 so
that
bcn
= (1 - F,)n-°-2
+ F.hN
^ *d'- *d1 -0 2
0.6 + i(2n) • (2a)
The points ( X ) on the figure mark results using this equation
with F, = 1 and with F, = 0. The agreement of Eq. (2a) with
the data in Fig. Al is remarkable. This indicates promise for
future work to relate the value of s to condenser design
variables.
It is reemphasized that the theory given above does not
take vapor shear effects into account. It may, however, be a
valid basis upon which we can develop a theory that can be
extended to apply to tube bundles under a shear-dominated
flow condition.
B-6

1.0
0.9
0.8
c
0.6
0.5
2 4 6 8 10 12 14 16 18 20
NUMBER OF TUBES (n)
Figure Bl. Comparison of data of Ferguson and Oakden with
analytical expressions.
B-7


APPENDIX C: Noncondensible Gas Effects
Nomenclature
:
A heat transfer surface area
bgff effective heat transfer coefficient for non-condensible fas film
h film heat transfer coefficient for sensible* heat transfer
k mass transfer coefficientg
m condensate mass flow rate for a single tube
P . steam partial pressure at bulk conditionsSb
(T .)v sat '
P steam partial pressure at condensate filmsurface (T )v
c
'
T saturation temperature at steam partialpressure at condensate film surface
T . saturation temperature at external steamsat . . ,partial pressure
U overall heat transfer coefficient excludingnoncondensible gas effects
U .overall heat transfer coefficient includingg noncondensible gas
AT T .- T
g sat c
AT log-mean temperature difference associated withm
y
Because of the condensation of steam at the tube surface
the proportion of steam in a steam-gas mixture decreases near
the tube surface: thQ steam partial pressure decreases across
the gas film. This gradient of partial pressure results in
mass transfer of steam across the gas film at a rate equal to
C-l

the rate of condensation. The mass transfer coefficient is
defined as
k = m/AS (P., - p_)sb sc
An energy balance across the gas film gives:
h _-(T ,- T ) = h„ k (P , - P '
), + h (T .- T )eff v sat o,' fg gv sb sc ; g v sat c
The sensible heat transfer term is usually neglected (about
0.1% or less) so that
h -h ,-
(Psb I
Pse )
heff" b
fg g(Tsat
- Tc )
C1)
In 0RC0N, the value of h „„ is calculated as follows:ef f
h „» AT = Ue AT (2)eff g & m
where U is the overall film coefficient with the n.c. film
such that
Ug
U b eff (3)
U is the overall film coefficient without the n.c. film and
is known from the previous calculations.
Eliminating hf
- from (2) and (3)
UAT = U AT (4)m g g
C-2
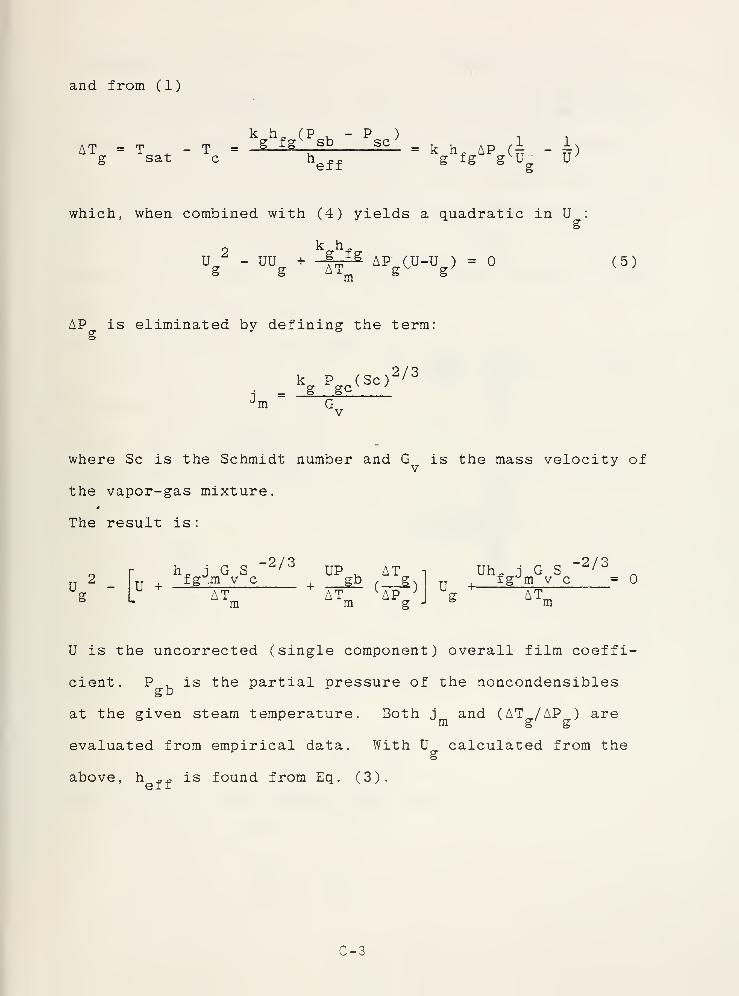
and from (1)
k h (P - P )
AT = T .- T = g tg
.
SD — = k h- AP (£ - i)g sat c hQff g fg g
v U~ IT
which, when combined with (4) yields a quadratic in U :
„ k hU * - UU + °
TIg
AP" (U-U ) = (5)g ATm g
v- g
AP is eliminated by defining the term
k P (Sc)2/3
i = g ScJm G
v
where Sc is the Schmidt number and G is the mass velocity ofv J
the vapor-gas mixture.
The result is
:
g L AT„ AT„ ^AP ;
2/3 TT-n A m _ TTV,-• /-. jq 2/3
h. j G S ' UP . AT Uh„ j G S
U +_fg m v c =
g ATm m g J & m
U is the uncorrected (single component) overall film coeffi-
cient. P , is the partial pressure of the noncondensiblesgb
at the given steam temperature. Both j and (AT /AP ) are
evaluated from empirical data. With U calculated from theg
above, h ff is found from Eq. (3).
C-3


APPENDIX D: Initial Trajectory of a Condensate Droplet
We seek to estimate the initial trajectory of a spherical
droplet of diameter d that is imagined to have its origin in
the condensate film prior to falling into a vapor stream. The
following analysis is approximate and only those simplifica-
tions that are not obvious will receive comment. In the
sketches, the droplet is shown in the fixed coordinate system
with its initial position of (0,0).
The steam velocity U is in the
x - direction and is initially
the velocity relative to the
droplet . The statement of
dynamic equilibrium of the
droplet is
r-o dUx dt
-T, dvy dt
and in the x and y directions, respectively we consider the
forces of gravity and aerodynamic drag:
ZF = Dx x
ZFy
= mg - Dy
Solution in the direction of steam flow :
For the x - direction we have
:
"dt= C
Dx2 ps(U
s " U) A (1)
D-l

where (Us - u) is the velocity of steam relative to the drop-
let in the x-direction and C_ is an average drag coefficient
taken to be constant over the range of velocities occuring in
the time increment of calculation (more on this later).
If we define non-dimensional quantities u, C^ , and x
such that
tU „ p
T -T' u " § CDX ! 5Dx (iT> (2)
(p = steam density, p = condensate density) then
# = c^d - »>2
the solution of which, with u(0) = 0, is
u =i * en t
(4)Dx
x dxDefining x = -r," then u = -r--, and Eq . (4) is again integrated
(x(0) = 0)
x = x - x— and + cDxx)
(5)Dx
Solution in the direction of gravity
For the y - direction we have
m|f = mg - CDy (|p sv2)A (6)
D-2
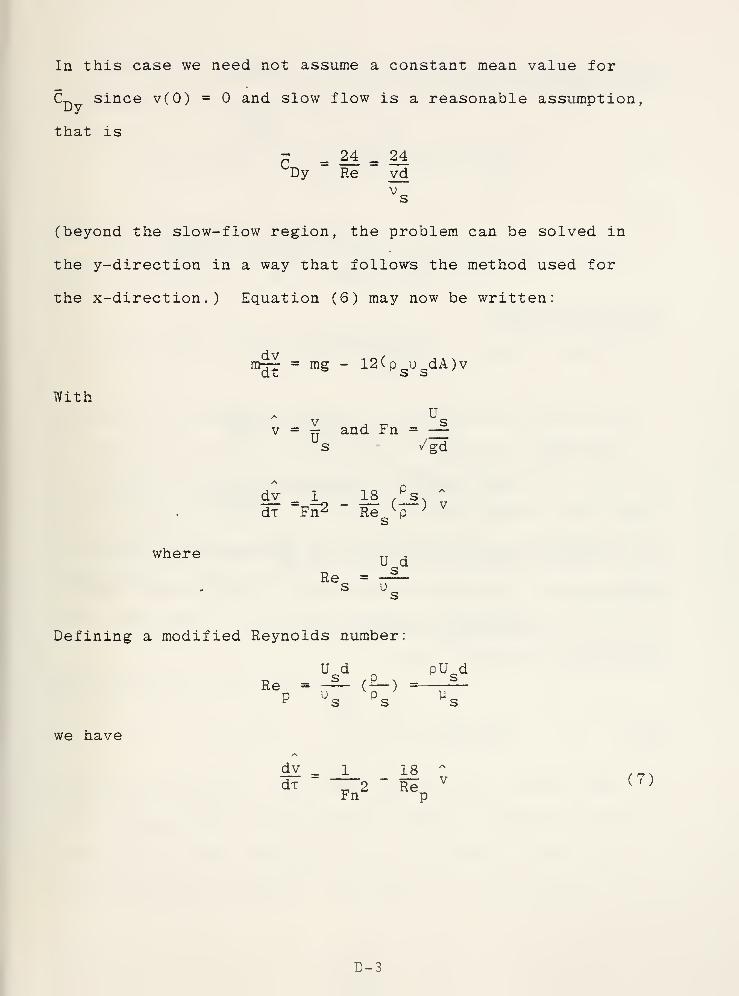
In this case we need not assume a constant mean value for
C~ since v(0) = and slow flow is a reasonable assumption,
that is
r 24 s MLDy Re " vdvs
(beyond the slow-flow region, the problem can be solved in
the y-direction in a way that follows the method used for
the x-direction. ) Equation (6) may now be written:
m^ = mg - 12(psusdA)v
With
where
v , „Us
Us /id
dv 1 18 ,^s.A
dx Fn2 Re {p
} vs
U dRe = -^-
s us
Defining a modified Reynolds number:
U d n pU dRe = -§_
(P_
}=_ s
we have
P u« o s ^
dv - 1 18 ~,_,
dx " —"2
- Hev (7)
Fn p
D-3
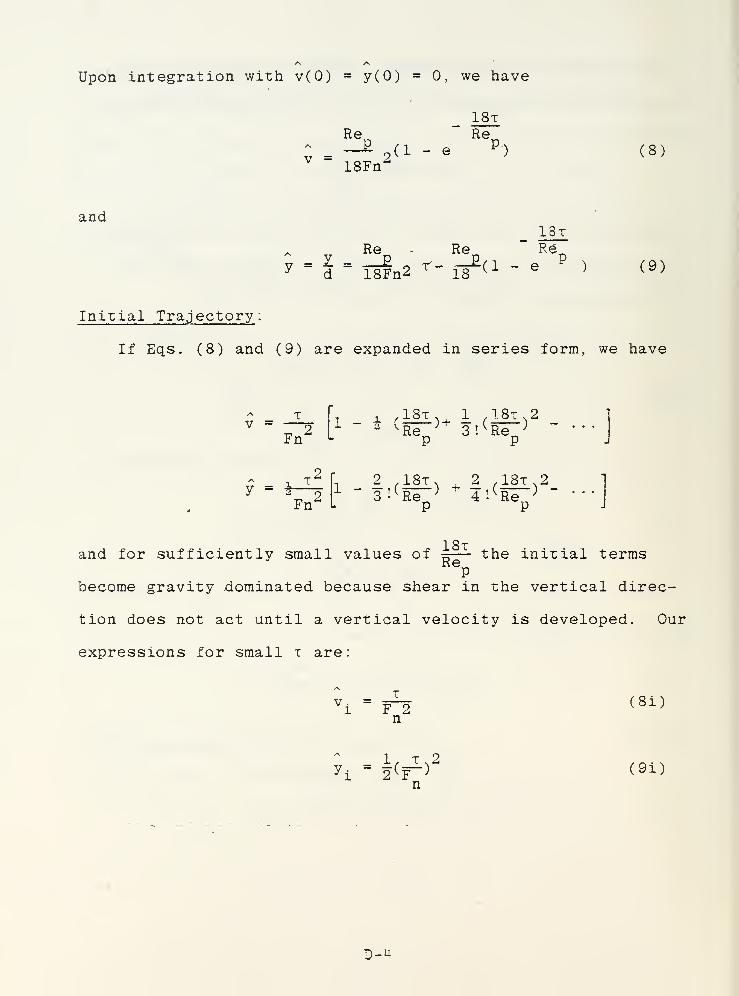
Upon integration with v(0) = y(0) = 0, we have
ReP
v =18Fn
2
18tRe_
(1 - e (8)
and
Rel = y = p_y d 18Fn2
Re18tRe.
r-18£(1 - e P
) (9)
Initial Trajectory :
If Eqs. (8) and (9) are expanded in series form, we have
vFn^ L
2 v Re ;3
P
(181)2! ^ Re„ ;
2
Fn'
12 18r 2
r18x 2
and for sufficiently small values of18tRe
the initial termsP
become gravity dominated because shear in the vertical direc-
tion does not act until a vertical velocity is developed. Our
expressions for small t are:
v
.
i F 2n
(8i)
1/ t,2y i
" 2 ( F->n
(9i)
D-4

The initial trajectory may be estimated by eliminating
x from Eqs. (5) and (9i) with the result:
x. = /2 Fn y."2 - x^- £n(l + 2 Fn C_ y .
2) (10)
'Dx
Criterion for gravity dominance :
If we define 8. = tan i , we .have from Eqs. (4) and1
u(8i)
M -1 1= tan(11)
subject to the condition C^ t « 1. From a trajectory point
of view the flow may be considered to be gravity dominated
for cases in which 9 . is greater than some specified value.
The value specified should depend upon the layout of the tube
bundle but for generality here we select 45 as a point of
demarcation. That is
. > 45 -* gravity dominance
which gives, from Eq. (11)
2Cn Fn < 1 -* gravity dominance (12)
Sample calculations : The foregoing analysis requires that the
value of CL remain approximately constant during the calcula-
tion period. This condition can be achieved if the drag in
the x-direction is mainly form drag or, in other words, if
D-5

103
< Re < 105
s
in which case C_. -0.4 for a spherical particle. For our
sample calculations we shall select the following rough
values
:
droplet diameter: d = J inch
— 3 2steam properties: u ~ 1.2 x 10 ft /sec
p o : 1.75 x 10"4 lb sec2/ft
4
U s~ 2.1 x 10~ 7
lb sec/ft2
The criterion for constant C~ then becomes, approximately,
60 < U < 6000 ft/secs '
which is a reasonable range of calculation for condenser
-4conditions. For water droplets, p /p ~ 10 and therefore
Sx ! cdx <r>= 3 x 10
~ 5
Recall that a criterion for validity of this approach is
4CD t << 1 or now, x << 3 x 10 . In dimensional terms
4tU /d << 3 x 10 , a criterion that is easily satisfied except
for unrealistically high steam speeds. The criterion (12) may
be written in terms of a critical steam speed below which the
droplet trajectory will be gravity dominated:
(C. F *) . =1v Dx n crit
q P2
^ c^ (—)(-§-)or Dx " p
x gdJcrit
D-6

With the above constant values for C_. and the density ratio
we have
»s2
(— )= 1.073 x 10
-6
d crit
With U in ft/sec and d in ft. This expression is plotted
below. Steam @ 125°F
3o 200
o. enw ^_ +j
C/3
100
SHEAR
DOMINATED
CDx=
- 5 ',-•0.6
,*1.0,•2.0
GRAVITY
DOMINATED
0.1 0.2 0.3 0.4
;Droplet diameter, d, inches
These are sample calculations only and serve to illustrate the
kinds of logic that can be developed from the analysis. The
most important result is that the parameter
N - aDxFn2= ! ^(r"^
is a measure of the relative influence of shear and gravity
upon the initial droplet trajectory. Semi-empirical values
of C^ in this expression will further specify the region of
dominance.
Droplet residence times . A number of other interesting
results can be obtained from the analysis outlined above. An
example is the estimation of transport times applicable to
D-7

condenser bundles. From Eq. (4) the time required for a drop-
let to reach one-half of the speed of the steam is given by u = 7
and
tiU1 _ g s
-^ - —1 C
HDx
Using the previously estimated vlaue, of CD we have, for a
i-inch droplet
694
which gives values in the range of 5 - 15 seconds for steam
speeds of 150-50 ft /sec, respectively. Naval condensers
have steam paths that are, typically, on the order of 5 ft.
long. The time for a i-inch particle to traverse such a
distance (in the absence of other tubes or obstructions) may
be estimated from Eq. (5) by finding the value r corresponding
x = 5(48) = 240. The result is, approximately, t = 87.5/U .
For U in the range of 50 - 150 ft/sec this gives droplet
traverse times in the order of 1.75 - .6 seconds. The cor-
responding droplet speeds at the condenser exit are 5.6 - 16.8
ft/sec. Thus the inertia of the droplets causes them to lag
well behind the vapor. A significant implication of this
result is that condensate droplets tend to "see" a relative
velocity equal to that of the surrounding vapor and that
acceleration of the droplets by the drag of the vapor does not
D-8

lead to large changes in relative velocity - the droplets do
not come anywhere near terminal velocity in the shear direc-
tion while they are inside of the condenser bundle. This
conclusion lends support to the approximation of constant drag
coefficient. In addition, the constraint of Cn x << 1 is
largely met for droplet motion within all but the largest
tube bundles. From the results, the' following approximate
forms should be valid in most cases:
and
u Dx
X:
cdx 2
2T
VT
~Fn 2
"
y " 2 v Fn ;
/\
V •* _ 4- ~ — <3
7T ^ 2 - tan j
X C Fn
D-9